King’s Research Portal
DOI:10.1111/jcpp.12552
Document VersionPeer reviewed version
Link to publication record in King's Research Portal
Citation for published version (APA):Burt, K. B., Whelan, R., Conrod, P. J., Banaschewski, T., Barker, G. J., Bokde, A. L. W., ... Garavan, H. (2016).Structural brain correlates of adolescent resilience. Journal of Child Psychology and Psychiatry, 57(11), 1287-1296. DOI: 10.1111/jcpp.12552
Citing this paperPlease note that where the full-text provided on King's Research Portal is the Author Accepted Manuscript or Post-Print version this maydiffer from the final Published version. If citing, it is advised that you check and use the publisher's definitive version for pagination,volume/issue, and date of publication details. And where the final published version is provided on the Research Portal, if citing you areagain advised to check the publisher's website for any subsequent corrections.
General rightsCopyright and moral rights for the publications made accessible in the Research Portal are retained by the authors and/or other copyrightowners and it is a condition of accessing publications that users recognize and abide by the legal requirements associated with these rights.
•Users may download and print one copy of any publication from the Research Portal for the purpose of private study or research.•You may not further distribute the material or use it for any profit-making activity or commercial gain•You may freely distribute the URL identifying the publication in the Research Portal
Take down policyIf you believe that this document breaches copyright please contact [email protected] providing details, and we will remove access tothe work immediately and investigate your claim.
Download date: 01. Jul. 2018

Running head: ADOLESCENT RESILIENCE 1
This is the peer reviewed version of the following article:
Burt, K. B., Whelan, R., Conrod, P. J., Banaschewski, T., Barker, G. J., Bokde, A. L.W.,
Bromberg, U., Büchel, C., Fauth-Bühler, M., Flor, H., Galinowski, A., Gallinat, J., Gowland, P.,
Heinz, A., Ittermann, B., Mann, K., Nees, F., Papadopoulos-Orfanos, D., Paus, T., Pausova, Z.,
Poustka, L., Rietschel, M., Robbins, T. W., Smolka, M. N., Ströhle, A., Schumann, G., Garavan,
H. and the IMAGEN Consortium (2016), Structural brain correlates of adolescent resilience.
Journal of Child Psychology and Psychiatry. doi: 10.1111/jcpp.12552
which has been published in final form at
http://onlinelibrary.wiley.com/doi/10.1111/jcpp.12552/abstract
[DOI: 10.1111/jcpp.12552].
This article may be used for non-commercial purposes in accordance with Wiley Terms and
Conditions for Self-Archiving.
ADOLESCENT RESILIENCE 2
Total manuscript word count: 7,544
Abstract word count: 175
Structural Brain Correlates of Adolescent Resilience
Keith B. Burt1, PhD, Robert Whelan
2, PhD, Patricia J. Conrod
3, 4, PhD, Tobias Banaschewski
5,
MD, PhD, Gareth J. Barker3, PhD, Arun L. W. Bokde
6, PhD, Uli Bromberg
7, PhD, Christian
Büchel7, PhD, Mira Fauth-Bühler
8, PhD, Herta Flor
5, PhD, André Galinowski
9, MD, Juergen
Gallinat10
, MD, Penny Gowland11
, PhD, Andreas Heinz10
, PhD, Bernd Ittermann12
, PhD, Karl
Mann8
, MD, Frauke Nees5, PhD, Dimitri Papadopoulos-Orfanos
13, PhD, Tomas Paus
14, 15, 16,
MD, PhD, Zdenka Pausova17
, MD, Luise Poustka18
, PhD, Marcella Rietschel5, MD, Trevor W.
Robbins19
, PhD, Michael N. Smolka20
, MD, Andreas Ströhle10
, MD, Gunter Schumann3,21
, MD,
PhD, Hugh Garavan1, 2, 22
, PhD and the IMAGEN consortium (www.imagen-europe.com)
1Department of Psychology, University of Vermont, USA;
2Department of Psychology, University College Dublin,
Ireland; 3Institute of Psychiatry, King’s College London, United Kingdom;
4Department of Psychiatry, Université
de Montréal, CHU Ste Justine Hospital, Canada; 5Department of Cognitive and Clinical Neuroscience, Medical
Faculty Mannheim, Heidelberg University, Mannheim, Germany; 6Institute of Neuroscience and Discipline of
Psychiatry, School of Medicine, Trinity College Dublin, Dublin, Ireland; 7Universitaetsklinikum Hamburg
Eppendorf, Hamburg, Germany; 8Department of Addictive Behaviour and Addiction Medicine, Central Institute of
Mental Health, Medical Faculty Mannheim, Heidelberg University, Mannheim, Germany; 9Institut National de la
Santé et de la Recherche Médicale, INSERM CEA Unit 1000 “Imaging & Psychiatry”, University Paris Sud, Orsay,
and AP-HP Department of Adolescent Psychopathology and Medicine, Maison de Solenn, University Paris
Descartes, Paris, France; 10
Department of Psychiatry and Psychotherapy, Campus Charité Mitte, Charité –
Universitätsmedizin Berlin, Germany; 11
School of Physics and Astronomy, University of Nottingham, United
Kingdom; 12
Physikalisch-Technische Bundesanstalt (PTB), Braunschweig und Berlin, Germany; 13
Neurospin,
Commissariat à l'Energie Atomique et aux Energies Alternatives, Paris, France; 14
Rotman Research Institute,
University of Toronto, Toronto, Canada; 15
School of Psychology, University of Nottingham, United Kingdom; 16
Montreal Neurological Institute, McGill University, Canada; 17
The Hospital for Sick Children, University of
Toronto, Toronto, Canada; 18
Department of Child and Adolescent Psychiatry and Psychiatry, Central Institute of
Mental Health, Medical Faculty Mannheim, Heidelberg University, Mannheim, Germany; 19
Behavioural and
Clinical Neurosciences Institute, Department of Experimental Psychology, University of Cambridge, United
Kingdom; 20
Department of Psychiatry and Neuroimaging Center, Technische Universität Dresden, Germany; 21
MRC Social, Genetic and Developmental Psychiatry (SGDP) Centre, London, United Kingdom; 22
Department of
Psychiatry, University of Vermont, USA.
MANUSCRIPT ACCEPTED FOR PUBLICATION – PLEASE DO NOT CITE OR
DISTRIBUTE WITHOUT PERMISSION

ADOLESCENT RESILIENCE 3
Abstract
Background. Despite calls for integration of neurobiological methods into research on
youth resilience (high competence despite high adversity), we know little about structural brain
correlates of resilient functioning. The aim of the current study was to test for brain regions
uniquely associated with positive functioning in the context of adversity, using detailed
phenotypic classification. Methods. 1,870 European adolescents (Mage 14.56 years, SDage = 0.44
years, 51.5% female) underwent MRI scanning and completed behavioral and psychological
measures of stressful life events, academic competence, social competence, rule-abiding conduct,
personality, and alcohol use. Results. The interaction of competence and adversity identified two
regions centered on the right middle and superior frontal gyri; grey matter volumes in these
regions were larger in adolescents experiencing adversity who showed positive adaptation.
Differences in these regions among competence/adversity subgroups were maintained after
controlling for several covariates and were robust to alternative operationalization decisions for
key constructs. Conclusions. We demonstrate structural brain correlates of adolescent resilience,
and suggest that right prefrontal structures are implicated in adaptive functioning for youth who
have experienced adversity.
Keywords: imaging; resilience; adolescence; competence; adversity; IMAGEN study
Abbreviations: DAWBA = Development and Well-Being Assessment Interview; ESPAD =
European School Survey Project on Alcohol and Drugs; LEQ = Life Events Questionnaire; SDQ
= Strengths and Difficulties Questionnaire.
ADOLESCENT RESILIENCE 4
Structural Brain Correlates of Adolescent Resilience
The construct of resilience—high competence despite a history of high adversity—has
captured the attention of clinical and developmental researchers for decades (Luthar, 2006); both
developmental psychopathology (Cicchetti, 1984; Sroufe & Rutter, 1984) and positive
psychology (Seligman & Csikszentmihalyi, 2000) perspectives have emphasized the scientific
advantages of studying adaptive functioning in individuals as a complement to the study of
disease and disorder (Kim-Cohen, 2007). Although complicated by challenges of definition,
measurement, and data analysis (Luthar, Cicchetti, & Becker, 2000), research on resilience in
youth has converged on a number of important findings (Luthar, 2006). First, resilience
following significant adversity can be widespread, and is often associated with what has been
termed the "ordinary magic" (Masten, 2001) of strong fundamental adaptive systems such as
receiving positive parenting, high cognitive ability, socioeconomic resources, and broad social
support. Second, in-depth research on resilience depends on assessment of major domains of
competence, often conceptualized as developmental tasks that vary in salience by age (Roisman,
Masten, Coatsworth, & Tellegen, 2004). Finally, resilience research has benefited from both
variable-centered methodological approaches in which continuous variation of constructs is
analyzed, as well as person-centered approaches—the approach taken in the current study—in
which participants are classified into a number of categories based on their experienced adversity
and demonstrated competence status (Masten, 2007).
More recent reviews of the resilience literature have called for attention to the
neurobiological and brain-based correlates of resilience (Charney, 2004; Curtis & Cicchetti,
2003). Following these calls, several investigations have documented both neurobiological (e.g.,
stress hormone changes; EEG asymmetry) correlates of resilient adaptation in youth (Cicchetti &

ADOLESCENT RESILIENCE 5
Rogosch, 2007; Curtis & Cicchetti, 2007) as well as interactions between
genetic/neurobiological variables and environmental context in predicting resilience (Cicchetti,
& Rogosch, 2012). This research demonstrates both the multilevel and thus partly biological
embeddedness of the phenomenon of resilience, as well as the complexities of
biological/environmental interaction (e.g. variations in effects of specific genetic loci depending
on environmental context).
In terms of brain imaging work on resilience, theorists have focused on the prefrontal
cortex (among other brain regions) given its crucial role in planning and coordination of complex
behaviors and mediation of emotional responses (Curtis & Cicchetti, 2003), including adaptive
responses to fearful stimuli (Haglund, Nestadt, Cooper, Southwick, & Charney, 2007). However,
empirical work in this area remains sparse, and the direct examination of differences in brain
structure or function among high-adversity youth who are classified as "doing well" in major
age-salient developmental task domains is absent.
In adults, structural and functional imaging work in this area has often focused on studies
of individuals who do or do not meet criteria for Post-Traumatic Stress Disorder (PTSD)
following a traumatic event, although more sophisticated sampling and design procedures are
beginning to appear (see van der Weff, Pannekoek, Stein, & van der Wee, 2013, for related
discussion). It is important to stress that these studies differ from youth resilience research in
multiple ways, notably in the focus on a single traumatic event rather than broad measures of
adversity as well as a focus on PTSD symptoms as an outcome rather than broad measures of
competence (Bonanno & Diminich, 2013). However, such adult-based studies remain of interest
given the lack of youth-focused imaging studies, with functional and structural imaging
approaches seen as complementary and of importance.

ADOLESCENT RESILIENCE 6
As brief examples of functional imaging studies, police officers who did not show PTSD
symptoms following exposure to a shooting showed increased medial prefrontal cortex activity
(and decreased left amygdala activity) during fMRI scanning while exposed to event cues (Peres
et al., 2011). In addition, Special Forces personnel free from PTSD diagnoses despite exposure to
traumatic events have shown differing fMRI activity in the subgenual prefrontal cortex (PFC)
relative to age and sex matched civilian controls (Vythilingam et al., 2009). Reynaud et al.
(2013) reported functional activation of right amygdala and left orbitofrontal regions in fire-
fighters who score high on a scale of trait hardiness, a construct related to resilience. Finally, van
der Werff et al. (2013) reported unique resting state functional connectivity profiles for adults
who experienced childhood maltreatment but who did not go on to meet criteria for any DSM-IV
axis I disorder. As noted above, we are not aware of youth fMRI studies of broad resilience,
although some have investigated youth at risk for specific disorder categories (e.g., via family
history): in particular, Heitzeg, Nigg, Yau, Zubieta, and Zucker (2008) demonstrated increased
activation of the bilateral orbital frontal gyrus (OFG) and left insula/putamen in adolescent
children of alcoholics with low levels of problem drinking.
Few investigations have focused on structural brain correlates of resilient adaptation.
Gilbertson et al. (2002) report data from a sample of monozygotic adult twins discordant for
trauma exposure, detecting smaller hippocampal volumes based on severity of affected-twin
PTSD even in unaffected co-twins, suggesting that lower hippocampal volume is a risk factor for
the development of PTSD in the face of trauma (and, conversely, that larger hippocampal
volume may be stress-protective) rather than a consequence of trauma itself. Galinowski and
colleagues (2015), using extreme-groups subsets from the IMAGEN study (the large sample also
employed in the current study) found diffusion tensor imaging differences in the anterior corpus
ADOLESCENT RESILIENCE 7
callosum between stress-exposed adolescents with low rates of mental illness (n = 55) versus
stress-exposed adolescents with higher rates (n = 68). These studies demonstrate a key advantage
of structural imaging approaches, which is that findings are independent of moment-to-moment
contextual effects during assessment and thus may be a better marker of one's accumulated
interacting genetic-environmental history. However, no study has yet combined structural
imaging data with the rich, multi-method and multi-domain assessments of adaptation
characteristic of "gold standard" studies of resilience in youth, and many of the studies reviewed
above are limited by relatively small sample sizes.
Thus, the primary goal of the present project was to determine whether structural brain
differences would be observed when adolescents who have experienced adversity yet are doing
well in life were compared with both youth not at risk and youth not doing well, utilizing a large-
scale sample with a range of experienced adversity and competence. Because of the limited
number of empirical studies in this area, we did not have strong a priori predictions; however, we
expected to find evidence for prefrontal differences in resilient vs. non-resilient youth given the
well-documented role of the PFC in prior adult work (e.g., Peres et al., 2011; Vythilingam et al.,
2009) as well as the importance of behavioral-based measures of planning and cognitive control
in predicting resilient adaptation in prior youth work (e.g., Masten et al., 2004).
As a secondary goal, we were interested in testing whether any identified brain regions
would be associated with problematic drinking. We viewed this test as a potential extension of
our results, examining prediction against a criterion that is related to competence (and
psychopathology) but separate from our defining outcome measures. While problematic alcohol
use can disrupt multiple developmental task domains, and is potentially quite dangerous,
abstention from alcohol is not itself considered a developmental task, as some alcohol use is

ADOLESCENT RESILIENCE 8
statistically normative in adolescence (Masten, Faden, Zucker, & Spear, 2008). Therefore, we
were interested if variation in identified brain regions would relate to this measure, both in the
whole sample as well as within any identified resilient groups.
Methods and Materials
Participants
Data for the current project come from the IMAGEN study (Schumann et al., 2010),
representing eight sites across Europe: London, Nottingham, Dublin, Mannheim, Berlin,
Hamburg, Paris and Dresden. Adolescent participants (N = 1,870; 51.5% female; Mage = 14.56
years, SDage = 0.44 years, range = 12.93-16.55 years; 10.8% left-handed) completed a series of
self-report and interview measures, as well as structural MRI scans. Parent-report data were also
included for some constructs. Local ethics research committees at each site approved the study.
On the day of assessment, written consent was obtained from the parent or guardian, and verbal
assent was obtained from the adolescent. Detailed description of recruitment and
inclusion/exclusion criteria are provided in Supplemental Appendix SA1, and additional
information is available from Schumann et al. (2010). For purposes of genetic analyses, the
IMAGEN sample was designed as ethnically homogeneous; recruitment targeted individuals
with all four grandparents from the indicated country. Participants were included in the current
study if they responded to one or more of our primary measures of competence. All data reported
below were cross-sectional.
Measures
Life-Events Questionnaire (LEQ). The Life-Events Questionnaire (LEQ), from which
we drew items reflecting experienced adversity, is an adaptation of the Stressful Life-Event
Questionnaire (Newcomb, Huba, & Bentler, 1981), which uses 39 items to measure the lifetime

ADOLESCENT RESILIENCE 9
occurrence and the perceived desirability of stressful events covering the following domains:
Family/Parents, Accident/lllness, Sexuality, Autonomy, Deviance, Relocation, and Distress. The
life-events valence labels were as follows: 'Very Unhappy', 'Unhappy' ,'Neutral', 'Happy', 'Very
Happy'. Specific items used in the current study are detailed below and in Supplemental
Appendix SA2.
Development and Well-Being Assessment Interview (DAWBA). Individual items
assessing key competence domains were taken from the DAWBA (Goodman, Ford, Richards,
Gatward, & Meltzer, 2000), a series of semi-structured interviews and questionnaires completed
by the adolescents and their parents. The DAWBA assesses a variety of domains and, depending
on content area, items are scored as either present or absent, on a 3-point scale
(never/sometimes/often), or a 4-point scale (never/perhaps/current/past year). For the purposes of
the present study, 3-point and 4-point DAWBA items were recoded into absent versus present
(within the past year).
Strengths and Difficulties Questionnaire (SDQ). The SDQ (Goodman, 1997) is a 25-
item questionnaire completed by both adolescents and parents in the current study. It is divided
into five subscales: emotional symptoms, conduct problems, hyperactivity/inattention, peer
relationship problems, and prosocial behaviors. Each item is scored on a three-point scale (0 =
not true, 1 = somewhat true, 2 = certainly true).
ESPAD. The European School Survey Project on Alcohol and Drugs (ESPAD; Hibell et
al., 1997) was administered using the computerized assessment platform Psytools (Delosis,
London, UK). Psytools presented questionnaire items and response alternatives on a computer
screen, with jump rules to skip inapplicable questions for the sake of brevity. As the Psytools
program was run at the participant’s home without direct supervision by the research team, the

ADOLESCENT RESILIENCE 10
reliability of individual data was checked in a two-stage procedure. Before every task,
adolescents were asked to report on the current testing context including questions about their
attentional focus and the confidentiality of the setting. Automated flags highlighted potentially
problematic testing situations and were followed up by research assistants in confidential face-to-
face sessions. Final reliability ratings were assigned which led to exclusion of the data in certain
cases. Specifically, exclusion criteria for substance use measures included an indication that the
participant was in a hurry, somebody was watching, or an indication of having known of or taken
the sham drug "Relevin".
ESPAD variables were primarily employed to construct a composite variable of binge
drinking risk, detailed below. However, a single ESPAD variable (self-reported grades) was
included as part of the academic competence construct.
Covariates. Age, sex, pubertal development, verbal and performance IQ, study site
(dummy-coded), handedness, and total gray matter volume (GMV) were included as nuisance
covariates, to determine whether any group differences in brain structure remained after
accounting for these potential confounds. In addition, in a subset of analyses detailed below,
five-factor personality (from the NEO-FFI; Costa & McCrae, 1992) and socioeconomic status
(SES1) were added as additional potential confounds. Pubertal development was assessed by an
8-item self-report scale based on Tanner stage (resulting in 5 ordered categories), assessing
growth in stature and pubic hair as well as menarche in females and voice changes in males
(Petersen, Crockett, & Richards, 1988). IQ was assessed using four subscales of the Wechsler
Intelligence Scale for Children – Fourth Edition (WISC-IV; Wechsler, 2003), with Block Design
and Matrix Reasoning making up performance IQ and Similarities and Vocabulary making up
verbal IQ. Scoring of SES was specific to the IMAGEN project, and included a composite of

ADOLESCENT RESILIENCE 11
parental education and employment, household financial difficulties, and household and
neighborhood adequacy; details are provided in Supplemental Appendix SA3.
Imaging. Details of the magnetic resonance imaging (MRI) acquisition protocols and
quality checks have been described previously, including an extensive period of standardization
across MRI scanners (Schumann et al., 2010). MRI Acquisition Scanning was performed at the
eight IMAGEN assessment sites with 3T whole body MRI systems made by several
manufacturers (Siemens: 4 sites, Philips: 2 sites, General Electric: 1 site, and Bruker: 1 site). To
ensure a comparison of MRI data acquired on these different scanners, we implemented image-
acquisition techniques using a set of parameters compatible with all scanners that were held
constant across sites. High-resolution anatomical magnetic resonance images were acquired,
including a 3D T1-weighted magnetization prepared gradient echo sequence (MPRAGE) based
on the ADNI protocol (http://www.loni.ucla.edu/ADNI/Cores/index.shtml), with parameters
adjusted to allow an isotropic 1.5mm voxel size. Full MRI acquisition parameters are provided in
Supplemental Appendix SA4, with quality controls described in Supplemental Appendix SA5.
Structural MRI processing included data segmentation and normalization (to the
Montreal Neurological Institute template) using the SPM (Wellcome Department of
Neuroimaging) optimized normalization routine (Ashburner & Friston, 2005). Gray matter
images were modulated (a typical post-processing step that scales the grey matter volume
estimates to correct for changes brought about by the spatial normalization), and total gray
matter volume included as a covariate, thus facilitating comparisons of regional volumetric,
rather than tissue concentration differences (Ashburner & Friston, 2000). The spatially
normalized and modulated gray matter partitions were smoothed using an 8 mm full-width at
half maximum Gaussian kernel allowing parametric statistical analysis. The planned

ADOLESCENT RESILIENCE 12
comparisons were multiple-comparison corrected using a combination of uncorrected p values (p
< .005) and a cluster extent of 356 voxels, thus correcting for multiple comparsions via a family-
wise error of p < .05 calculated using AFNI’s 3dClustSim (Cox, 1996).
Data Reduction: Construction of Competence and Adversity Scores
Adversity. Judgments of adversity were made from self-report data on the LEQ.
Participants provided lifetime information on 39 potentially stressful life events; as data were
also collected on the emotional impact of each event, we selected only those events for each
participant which resulted in negative reported effects. In addition, ten events (e.g., trouble with
the law, running away from home, receiving poor grades) were excluded from consideration as
they were not independent of participant's own competence-relevant behavior, following prior
resilience research (Gest, Reed, & Masten, 1999). A total count of independent negative life
events was calculated (range = 0-12; M = 3.73; SD = 1.96).
Competence. Continuous scores of competence in age-salient developmental tasks were
constructed by averaging standardized scores across four domains: rule-abiding conduct, social
skills and relationships, academics, and absence of internalizing problems (anxiety and
depression). In each case, variables were first aggregated and standardized within measure, with
extreme scores truncated at +/-3 SD from the mean. Rule-abiding conduct (α = .78) was a
combination of 15 self- and parent-reported dichotomized DAWBA items assessing rule-
breaking behavior within the past year (e.g. lies, fights, bullies) as well as 5 self- and 5 parent-
reported (0-2 scale) SDQ items (irritable, disobedient, fights/bullies, lies/cheats, and steals).
Once aggregated, these variables were reverse-scored such that higher scores represented greater
rule-abiding conduct. Social competence (α = .80) was a combination of 10 self- and 11 parent-
reported DAWBA items representing prosocial behavior (each scored on 0-2 scale: sample items

ADOLESCENT RESILIENCE 13
include "generous", "outgoing/sociable", "caring", "good with friends", and "polite") as well as
10 self- and 10 parent-reported SDQ items representing the Peer Problems (reversed) and
Prosocial Behavior subscales.
Assessment of academic competence (α = .59) included two parent-reported DAWBA
items (0-2 scale; "good at school work" and "general reasoning and school work"), one self-
reported DAWBA item (0-2 scale; "good at school work"), and one ESPAD item (8-point scale
representing "A" to "C-") assessing overall school performance. Finally, emotional health (α =
.73) was measured as the reverse of 5 self- and 5 parent-reported SDQ Emotional Symptoms
items.
Full item descriptions of all variables entering into competence classification are
presented in Supplemental Appendices SA6-SA9. Consistent with prior work (Achenbach,
McConaughy, & Howell, 1987), agreement between self- and parent-report on sub-components
was moderate: conduct SDQ, r = .33; conduct DAWBA, r = .30; social competence, r = .27;
academics, r = .49; and emotional health, r = .37, all ps < .001.
Competence/adversity groupings. Following prior resilience studies (Gest et al., 1999),
we classified adolescents using two dichotomized variables. First, high/low competence scores
were created based on whether participants scored within normal limits—operationalized as a z-
score of -0.5 or above per prior research (Masten et al., 1999) —on all four competence domains.
This is a stringent definition of "doing well" as it encompasses not only meeting external
developmental task criteria (Roisman et al., 2004) but also non-elevated emotional symptoms.
Second, high/low adversity scores were created based on participants scoring +1.0 SD or higher
on negative independent lifetime events. Based on descriptive statistics, this cutoff represented
6+ events.

ADOLESCENT RESILIENCE 14
These two variables (high vs. low competence and high vs. low adversity) were used in
our core voxelwise and ANCOVA analyses. Crossing them created an exclusive and exhaustive
classification of our sample into one of four groupings, which we abbreviate below using the
designations of "C" for high competence, "c" for low competence, "A" for high adversity, and
"a" for low adversity: high competence and low adversity "C/a" (N = 643), sometimes termed
"competent"; high competence and high adversity "C/A", termed "resilient" (N = 124); low
competence (in at least one domain) and high adversity "c/A", sometimes termed "maladaptive"
in prior research (N = 225); and low competence (in at least one domain) and low adversity "c/a"
(N = 878), sometimes termed "vulnerable". Note that the final group contains a larger proportion
of participants than seen in some prior studies, which is likely a consequence of including
emotional health as a competence domain.
Results
Missing Data
The working sample for the current study were participants who had non-missing data for
at least one competence indicator, thereby allowing computation of competence composites in
some form (N = 1,870 across 8 sites; see Table 1). From this working sample, there were no
missing data on life stress, sex, site, and gray matter volume. Missing data percentages for other
included variables ranged from a low of 0.4% (age) to a high of 7.4% (IQ), or 8.8% when
including the secondary covariate of SES. For consistency with prior IMAGEN studies, for
variables with missing data—age, pubertal status, handedness, IQ, personality, and SES—
missing values were replaced via site-and-sex-specific mean imputation.
Descriptives and Preliminary Analyses
ADOLESCENT RESILIENCE 15
Mean verbal IQ for the sample was 107.64 (SD = 14.37) and mean performance IQ was
110.78 (SD = 14.50). In terms of pubertal status, 1%/0% of males and females, respectively
reported Tanner stage I, 12.7%/0.1% stage II, 50.9/9.8% stage III, 34.5%/80.2% stage IV, and
0.9%/10.0% stage V. Regarding associations among primary study variables, the four
competence domains were moderately intercorrelated (rs ranging from .13-.38, all ps < .001).
Aggregated competence (z-scores averaged across domain) was modestly negatively associated
with adversity, r = -.13, p < .001.
For group comparisons, we first tested whether or not the C/A group experienced similar
levels of adversity as their low-competence (c/A) counterparts, and whether they demonstrated
similar levels of competence as their low-adversity (C/a) counterparts. Independent samples t-
tests were conducted with the dependent variable either number of life events or the overall
aggregate of the four competence domains, respectively. C/A youth showed similar negative life
events (M = 6.69, SD = 1.01) as their low-competence c/A comparison group (M = 6.76, SD =
1.06, t[347] = 0.53, p = .59). C/A youth showed slightly lower aggregate competence (M = 0.36,
SD = 0.26) than their low-adversity C/a comparison group (M = 0.41, SD = 0.25, t[765] = 2.17, p
= .03).
Brain Structure Differences in Competence/Adversity Groups
Significant effects, representing anatomical volumetric differences between the
competence and adversity variables, were identified in six regions. Two regions, one showing a
main effect of competence and one showing a main effect of adversity, overlapped substantially
(40% and 77%, respectively) with a larger cluster showing a significant interaction between
competence and adversity. Given our particular focus on interactive effects, these main effect
regions were dropped in lieu of the overlapping interaction area, leaving four regions of focus

ADOLESCENT RESILIENCE 16
(see Table 2 and Figure 1). First, a main effect of competence was observed in the left
orbitofrontal gyrus (Figure 1, yellow cluster; greater volumes in the C/a and C/A groups relative
to the other two): 𝜂𝑝2 = .008, p < .001. Second, significant interactions between competence and
adversity were observed in two right frontal areas: the right middle frontal, 𝜂𝑝2 = .009, p < .001,
and right superior frontal, 𝜂𝑝2 = .009, p < .001, gyri (Figure 1, red and blue clusters, respectively).
In each case, post-hoc tests using Tukey's LSD method showed that effects were driven by
elevated volumes in the C/A group relative to other groups; in the right superior frontal region,
post-hoc tests also showed greater volume in the c/a group relative to the c/A group. Finally, a
crossover interaction between competence and adversity was observed in the fusiform gyrus, 𝜂𝑝2
= .006, p = .001 (Figure 1, green cluster), such that the C/a and c/A groups showed greater
volumes than the c/a and C/A groups.
Results were re-run excluding left-handed participants; all effects remained significant,
with effect sizes within .001 of original values. Additionally, to test whether or not our missing
data strategy affected our results, we repeated the analyses described above restricting our
sample to only those participants who had valid data on all measures (N = 1,547); all findings
remained statistically significant, and no new findings emerged, with all effect sizes (partial eta-
squared) within .002 of original values. Additionally, we re-ran our primary ANCOVA analyses
testing continuous adversity and competence predictors (using aggregate competence across
domains) and their interaction, as well as multiple alternative competence and adversity
thresholds, finding broadly similar results in all cases; details of these robustness checks are
provided in Supplemental Appendix SA10.
Follow-up Analyses
ADOLESCENT RESILIENCE 17
Personality and SES covariates. As expected, personality dimensions differed across
groups. Specifically, c/A and c/a youth scored higher on neuroticism and lower on extraversion,
agreeableness, and conscientiousness, than youth in the other two groups; in addition, c/a youth
scored lower on openness to experience than C/a and C/A youth, and C/A youth scored higher on
openness to experience than c/A youth. These results suggest that personality variables generally
tracked competence composites. In addition, SES also differed across groups, with the C/a group
showing higher SES than the C/A and c/a groups, with the c/a group also higher than the c/A
group. Therefore, we tested whether or not ANCOVA results were affected by inclusion of
personality variables and SES as covariates. In all cases, inclusion of these variables resulted in
the same pattern of results: brain structure differences reported above were maintained at p < .01
and partial eta squared values held within .002 of original values. Personality variables were
themselves modestly associated with ROI volumes (i.e., correlations with average grey matter
volume for each region). Specifically, agreeableness was negatively correlated with GMV for the
right superior frontal gyrus (r = -.07, p = .003) and right middle frontal gyrus (r = -.05, p = .033),
two of the ROIs associated with the interaction of adversity and competence. Neuroticism was
negatively correlated with GMV for all ROIs excepting the right MFG, rs ranging from -.06 to -
.12, all ps < .05. Brain regions were also modestly correlated with maternal SES: right SFG r =
.06, p = .01, right MFG r = .05, p = .028, left OFG r = .08, p < .001, right fusiform r = .12, p <
.001.
Correlation with problematic drinking. Finally, we examined whether volumetric
differences across the four ROIs predicted scores on a problematic drinking composite variable
derived from the ESPAD assessment. The drinking composite variable (valid N = 1,433)
represented an aggregate of 13 questions related to frequency of binge drinking and being drunk

ADOLESCENT RESILIENCE 18
as well as alcohol tolerance (M = 20.04, SD= 9.64). For each group, partial correlations were
conducted between ROI volumes and problematic drinking, controlling for total GMV. For the
C/A group, one ROI negatively predicted problematic drinking: this was the right middle frontal
gyrus ROI (partial r = -.22, p = .023; Figure 1, red cluster and scatterplot). As a comparison, in
the C/A group the multiple correlation predicting binge drinking from all five age 14 personality
variables taken together was .16. No other ROI was associated with problematic drinking for any
other group, partial rs ranging from -.07 to .05, ps ranging from .47 to .95.
Discussion
Despite prominent calls (Charney, 2004; Curtis & Cicchetti, 2003) for greater attention to
the neurobiological and brain correlates of resilience, relatively few empirical reports are
available in this area. In addition, existing studies are commonly limited by small sample sizes or
special populations. The present study sought to fill this gap by examining structural brain
differences in a large sample of European adolescents, while also following the developmental
psychopathology literature on resilience in paying attention to assessment and aggregation of key
outcome variables that represent attainment of age-salient developmental tasks.
Based on crossing experienced adversity with a comprehensive aggregation of multiple
developmental task domains key to adaptive functioning in adolescence—academics, social
relationships, rule-abiding conduct, and emotional health—we grouped adolescents into
competent (C/a), resilient (C/A), maladaptive (c/A), and vulnerable (c/a) categories. Notably,
structural brain regions which differentiated these groups were located primarily in the right
prefrontal area, suggesting that mechanisms related to executive control are implicated in
resilience. Because C/A youth did not show greater average competence than their low-adversity
peers, these results are not explicable by associations between brain volume and competence, but

ADOLESCENT RESILIENCE 19
rather represent the conjunction of competence and adversity, and our robustness checks suggest
that these results were not unduly driven by a particular choice of competence or adversity
threshold. In addition, within the C/A subgroup, grey matter volume in the right middle frontal
gyrus correlated with an important measure not included in the set of competence-defining
indicators, namely risk of problems with alcohol use, with magnitude of prediction exceeding
that of five broad personality variables together for the same outcome.
Given the role that the prefrontal cortex is likely to play in competence and resilience,
based on both theoretical grounds and the small extant literature, we focus our discussion on the
three effects that were observed there, noting that a more complex pattern of effects was
observed in the fusiform gyrus. Further, psychological or functional interpretations of the
observed structural effects are necessarily post hoc so should be treated with caution. With this
caveat in mind, it is nonetheless of interest that right prefrontal cortex should be associated with
resilience given the role of these frontal regions in emotional, behavioral and stress regulation
and in executive control (Aron, Robbins, & Poldrack, 2014; Munakata et al., 2011; Staudinger,
Erk, & Walter, 2011; Whelan et al., 2012) as well as prior resilience-relevant evidence that
unaffected siblings of stimulant-dependent adults show functional hyperactivation of prefrontal
areas (Morein-Zamir, Jones, Bullmore, Robbins, & Ersche, 2013). In addition, these findings are
consistent with prior behavioral evidence that suggests important roles for planning ability in
fostering resilience in high-risk contexts (Rutter, 2013) as well as the role of cognitive ability
more generally in buffering response to stress, reported for depression by Riglin and colleagues
(2015), and the potential role of PFC functioning in promoting healthy sleep as a component of
resilience (Silk et al., 2007) Similarly, that the orbitofrontal cortex should be associated with
competence, as assessed across a broad range of domains, may be related to the broad role that

ADOLESCENT RESILIENCE 20
this region has in affective and social processes and their integration (Blumberg et al., 2003;
Perlman et al., 2014; Watanabe & Sakagami, 2007).
We stress that observed associations between ROIs and resilient outcome are
correlational and do not represent a reduction of psychological resilience to the level of analysis
of brain images. Nonetheless, these results represent a contribution to multilevel studies of
resilience, proponents of which have highlighted the potential implications of this broad area for
prevention and intervention work with at-risk youth (Curtis & Cicchetti, 2003). At this point
intervention implications remain largely speculative, but as our structural measurements become
more detailed and we accumulate more information about the functions and interconnectivity of
varied brain regions, it may be possible to use such data as part of assessments for the evaluation
of intervention effectiveness, in combination with behavioral data and other genetic and
neurobiological information (Curtis & Cicchetti, 2003).
Besides the cross-sectional nature of our data, this study has other important limitations.
Our competence measures include information only from parental report and adolescent report,
so we lack data on adjustment from sources outside the immediate family; more important, our
measure of adversity comes entirely from adolescent report. Our competence measures were also
not fully parallel across all domains, with different measures contributing to the estimates for
different domains. Further, although our decisions in operationalizing and combining
competence domains are based on prior resilience research, they represent a series of study-
specific choices and await replication with other operationalizations of resilience. In particular,
our global adjustment composite approach can be contrasted with a focus on predicting specific
outcome domains (Luthar et al., 2000), and our threshold of average-level competence or greater
in four domains led to a greater frequency of the two low-competence groups as compared to

ADOLESCENT RESILIENCE 21
some prior work. In addition, our overall sample association of adversity and competence was
modest, although within the range of related prior work (Masten et al., 1999). Our study is also
limited in its focus on a single structural measurement, gray matter volume. To help address this
latter issue in future research, we urge study of additional structural brain measurements and we
echo the call of van der Werff and colleagues (2013) for greater study of the interconnectivity of
brain networks theorized to be relevant for resilient adaptation.
These limitations notwithstanding, this investigation suggests that there are identifiable
brain regions associated with resilient adaptation in adolescents—as defined by high competence
despite high adversity—and that these differences are not simply due to common covariates such
as IQ or personality traits. The identified regions are primarily in the right prefrontal cortical
areas, suggesting that mechanisms of executive control may be of key importance in resilient
outcomes.
ADOLESCENT RESILIENCE 22
Key Points:
Recent reviews of the resilience literature have called for focused attention on
the neurobiological and brain-based correlates of resilience.
The present study tested structural brain correlates of resilience, as defined by
positive outcomes despite experiencing adversity, in a large adolescent sample.
Increased grey matter volume was detected in right prefrontal areas in
adolescents who were functioning well across multiple domains despite high
life stress, and analyses controlled for personality, IQ, and SES.

ADOLESCENT RESILIENCE 23
Author's Note
This work was supported by the European Union-funded FP6 Integrated Project
IMAGEN (Reinforcement- related behaviour in normal brain function and psychopathology)
(LSHM-CT-2007-037286), the FP7 projects IMAGEMEND (602450) and MATRICS, the
Innovative Medicine Initiative Project EU-AIMS (115300-2), the Medical Research Council
Programme Grant “Developmental pathways into adolescent substance abuse” (93558), as well
as the Swedish funding agency FORMAS (Project: “Unifying genetic and epigenetic approach to
psychiatric disorders”). Further support was provided by the Bundesministerium für Bildung und
Forschung (BMBF grants 01GS08152 and 01EV0711), the Deutsche Forschungsgemeinschaft
(DFG, Reinhart-Koselleck Award SP383/5-1 and grants SM 80/7-1, SFB 940/1) and the French
MILDT (Mission Interministérielle de Lutte contre la Drogue et la Toxicomanie). Finally, the
authors acknowledge the Vermont Advanced Computing Core which is supported by NASA
(NNX 06AC88G), at the University of Vermont for providing High Performance Computing
resources that have contributed to the research results reported within this paper.
Corresponding author: Keith Burt, University of Vermont, Department of Psychological Science,
2 Colchester Avenue, Burlington, VT 05405. Email: [email protected]

ADOLESCENT RESILIENCE 24
References
Achenbach, T. M., McConaughy, S. H., & Howell, C. T. (1987). Child/adolescent behavioral
and emotional problems: Implications of cross-informant correlations for situational
specificity. Psychological Bulletin, 101, 213-232.
Aron, A. R., Robbins, T. W., & Poldrack, R. A. (2014). Inhibition and the right inferior frontal
cortex: one decade on. Trends in Cognitive Science, 18, 177-185.
Ashburner, J., & Friston, K. J. (2000). Voxel-based morphometry—the methods. NeuroImage,
11, 805-821.
Ashburner, J., & Friston, K. J. (2005). Unified segmentation. NeuroImage, 26, 839-851.
Blumberg, H. P., Leung, H. C., Skudlarski, P., Lacadie, C. M., Fredericks, C. A., Harris, B. C.,
…, Peterson, B. S. (2003). A functional magnetic resonance imaging study of bipolar
disorder: State- and trait-related dysfunction in ventral prefrontal cortices. Archives of
General Psychiatry, 60, 601-609.
Bonanno, G. A., & Diminich, E. D. (2013). Annual Research Review: Positive adjustment to
adversity—trajectories of minimal-impact resilience and emergent resilience. Journal of
Child Psychology and Psychiatry, 54, 378–401.
Charney, D. S. (2004). Psychobiological mechanisms of resilience and vulnerability:
Implications for successful adaptation to extreme stress. American Journal of Psychiatry,
161, 195–216.
Cicchetti, D. (1984). The emergence of developmental psychopathology. Child Development, 55,
1–7.

ADOLESCENT RESILIENCE 25
Cicchetti, D., & Rogosch, F. A. (2007). Personality, adrenal steroid hormones, and resilience in
maltreated children: A multilevel perspective. Development and Psychopathology, 19,
787-809.
Costa, P. T., & McCrae, R. R. (1992). Revised NEO Personality Inventory (NEO PI-R) and NEO
Five-Factor Inventory (NEO FFI): Professional manual. Odessa, FL: Psychological
Assessment Resources.
Cox, R. W. (1996). AFNI: Software for analysis and visualization of functional magnetic
resonance neuroimages. Computers and Biomedical Research, 29, 162-173.
Curtis, W. J., & Cicchetti, D. (2003). Moving research on resilience into the 21st century:
Theoretical and methodological considerations in examining the biological contributors
to resilience. Development and Psychopathology, 15, 773–810.
Curtis, W. J., & Cicchetti, D. (2007). Emotion and resilience: A multilevel investigation of
hemispheric electroencephalogram asymmetry and emotion regulation in maltreated and
nonmaltreated children. Development and Psychopathology, 19, 811-840.
Gest, S. D., Reed, M. J., & Masten, A. S. (1999). Measuring developmental changes in exposure
to adversity: A Life Chart and rating scale approach. Development and Psychopathology,
11, 171-192.
Gilbertson, M. W., Shenton, M. E., Ciszewski, A., Kasai, K., Lasko, N. B., Orr, S. P., & Pitman,
R. K. (2002). Smaller hippocampal volume predicts pathologic vulnerability to
psychological trauma. Nature Neuroscience, 5, 1242-1247.
Goodman, R. (1997). The Strengths and Difficulties Questionnaire: A research note. Journal of
Child Psychology and Psychiatry, 38, 581–586.
ADOLESCENT RESILIENCE 26
Goodman, R., Ford, T., Richards, H., Gatward, R., & Meltzer, H. (2000). The Development and
Well-Being Assessment: Description and initial validation of an integrated assessment of
child and adolescent psychopathology. Journal of Child Psychology and Psychiatry, 41,
645–656.
Haglund, M. E. M., Nestadt, P. S., Cooper, N. S., Southwick, S. M., & Charney, D. S. (2007).
Psychobiological mechanisms of resilience: Relevance to prevention and treatment of
stress-related psychopathology. Development and Psychopathology, 19, 889-920.
Heitzeg, M. M., Nigg, J. T., Yau, W.-Y. W., Zubieta, J.-K., & Zucker, R. A. (2008). Affective
circuitry and risk for alcoholism in late adolescence: Differences in frontostriatal
responses between vulnerable and resilient children of alcoholic parents. Alcoholism:
Clinical and Experimental Research, 32(3), 414-426.
Hibell, B., Andersson, B., Bjarnason, T., Kokkevi, A., Morgan, M., & Narusk, A. (1997). The
1995 ESPAD report: Alcohol and other drug use among students in 26 European
countries. Stockholm: Swedish Council for Information on Alcohol and Other Drugs.
Kim-Cohen, J. (2007). Resilience and developmental psychopathology. Child and Adolescent
Psychiatric Clinics of North America, 16, 271–283.
Luthar, S. S. (2006). Resilience in development: A synthesis of research across five decades. In
D. Cicchetti & D. J. Cohen (Eds.), Development and Psychopatholology, 2nd ed. (Vol. 3,
pp. 739-795). Hoboken, NJ: Wiley.
Luthar, S. S., Cicchetti, D., & Becker, B. (2000). The construct of resilience: A critical
evaluation and guidelines for future work. Child Development, 71(3), 543-562.
Masten, A. S. (2001). Ordinary magic: Resilience processes in development. American
Psychologist, 56, 227–238.

ADOLESCENT RESILIENCE 27
Masten, A. S. (2007). Resilience in developing systems: Progress and promise as the fourth wave
rises. Development and Psychopathology, 19, 921-930.
Masten, A. S., Burt, K. B., Roisman, G. I., Obradović, J., Long, J. D., & Tellegen, A. (2004).
Resources and resilience in the transition to adulthood: Continuity and change.
Development and Psychopathology, 16, 1071-1094.
Masten, A. S., Faden, V. B., Zucker, R. A., & Spear, L. P. (2008). Underage drinking: A
developmental framework. Pediatrics, 121 (Suppl. 4), 235-251.
Masten, A. S., Hubbard, J. J., Gest, S. D., Tellegen, A., Garmezy, N., & Ramirez, M. (1999).
Competence in the context of adversity: Pathways to resilience and maladaptation from
childhood to late adolescence. Development and Psychopathology, 11, 143–169.
Morein-Zamir, S., Jones, P. S., Bullmore, E. T., Robbins, T. W., & Ersche, K. D. (2013).
Prefrontal hypoactivity associated with impaired inhibition in stimulant-dependent
individuals but evidence for hyperactivation in their unaffected siblings.
Neuropsychopharmacology, 38, 1945-1953.
Munakata, Y., Herd, S. A., Chatham, C. H., Depue, B. E., Banich, M. T., & O'Reilly, R. C.
(2011). A unified framework for inhibitory control. Trends in Cognitive Sciences, 15,
453-459.
Newcomb, M. D., Huba, G. J., Bentler, P. M. (1981). A multidimensional assessment of stressful
life events among adolescents: Derivation and correlates. Journal of. Health and Social
Behavior, 22, 400-415.
Peres, J. F. P., Foerster, B., Santana, L. G., Fereira, M. D., Nasello, A. G., Savoia, M., Moreira-
Almeida, A., & Lederman, H. (2011). Police officers under attack: Resilience
implications of an fMRI study. Journal of Psychiatric Research, 45, 727–734.

ADOLESCENT RESILIENCE 28
Perlman, S. B., Hein, T. C., Stepp, S. D., & LAMS Consortium (2014). Emotional reactivity and
its impact on neural circuitry for attention-emotion interaction in childhood and
adolescence. Developmental Cognitive Neuroscience, 8, 100-109.
Petersen, A. C., Crockett, L., & Richards, M. A self-report measure of pubertal status:
Reliability, validity, and initial norms. Journal of Youth & Adolescence, 17, 117-133.
Reynaud, E., Guedj, E., Souville, M., Trousselard, M., Zendjidjian, X., El Khoury-Malhame, M.,
…, Khalfa, S. (2013). Relationship between emotional experience and resilience: An
fMRI study in fire-fighters. Neuropsychologia, 51, 845-849.
Riglin, L., Collishaw, S., Shelton, K. H., McManus, I. C., Ng-Knight, T., Sellers, R., … Rice, F.
(2015). Higher cognitive ability buffers stress-related depressive symptoms in adolescent
girls. Development and Psychopathology (advance online publication).
Roisman, G. I., Masten, A. S., Coatsworth, J. D., & Tellegen, A. (2004). Salient and emerging
developmental tasks in the transition to adulthood. Child Development, 75, 123–133.
Rutter, M. (2013). Annual research review: Resilience—clinical implications. Journal of Child
Psychology and Psychiatry, 54(4), 474-487.
Schumann, G., Loth, E., Banaschewski, T., Barbot, A., Barker, G., Büchel, C., …, Struve, M. &
the IMAGEN consortium (2010). The IMAGEN study: Reinforcement-related behaviour
in normal brain function and psychopathology. Molecular Psychiatry, 15, 1128–1139.
Seligman, M. E. P., & Csikszentmihalyi, M. (2000). Positive psychology: An introduction.
American Psychologist, 55, 5–14.
Silk, J. S., Vanderbilt-Adriance, E., Shaw, D. S., Forbes, E. E., Whalen, D. J., Ryan, N. D., &
Dahl, R. E. (2007). Resilience among children and adolescents at risk for depression:

ADOLESCENT RESILIENCE 29
Mediation and moderation across social and neurobiological contexts. Development and
Psychopathology, 19, 841-865.
Sroufe, L. A., & Rutter, M. (1984). The domain of developmental psychopathology. Child
Development, 55, 17–29.
Staudinger, M. R., Erk, S., & Walter, H. (2011). Dorsolateral prefrontal cortex modulates striatal
reward encoding during reappraisal of reward anticipation. Cerebral Cortex, 21, 2578-
2588.
van der Werff, S. J. A., Pannekoek, J. N., Stein, D. J., & van der Wee, N. J. A. (2013).
Neuroimaging of resilience to stress: current state of affairs. Human
Psychopharmacology: Clinical and Experimental, 28, 529-532.
van der Werff, S. J. A., Pannekoek, J. N., Veer, I. M., van Tol, M.-J., Aleman, A., Veltman, D.
J., … van der Wee, N. J. A. (2013). Resilience to childhood maltreatment is associated
with increased resting-state functional connectivity of the salience network with the
lingual gyrus. Child Abuse & Neglect, 37, 1021-1029.
Vythilingam, M., Nelson, E. E., Scaramozza, M., Waldeck, T., Hazlett, G., Southwick, S. M., …,
Ernst, M. (2009). Reward circuitry in resilience to severe trauma: An fMRI investigation
of resilient special forces soldiers. Psychiatry Research: Neuroimaging, 172, 75–77.
Watanabe, M., & Sakagami, M. (2007). Integration of cognitive and motivational context
information in the primate prefrontal cortex. Cerebral Cortex, 17(Suppl. 1), i101-i109.
Wechsler, D. (2003). Wechsler Intelligence Scale for Children – Fourth Edition (WISC-IV). San
Antonio, TX: Psychological Corporation.

ADOLESCENT RESILIENCE 30
Whelan, R., Conrod, P., Poline, J.-B., Banaschewski, T., Barker, G. J., Bellgrove, M. A., …,
Garavan, H. & the IMAGEN consortium (2012). Adolescent impulsivity phenotypes
characterized by distinct brain networks. Nature Neuroscience, 15, 920–925.

ADOLESCENT RESILIENCE 31
Footnotes
1 As expected, SES was moderately negatively correlated with adversity, r = -.16, p < .001.

ADOLESCENT RESILIENCE 32
Table 1. Sample size and descriptive information by study site.
Site N % Female Age M(SD)
London 235 54.0 14.43(0.42)
Nottingham 269 50.2 14.59(0.34)
Dublin 178 47.2 14.46(0.33)
Berlin 239 53.1 14.61(0.48)
Hamburg 248 54.8 14.43(0.42)
Mannheim 222 56.3 14.70(0.49)
Paris 229 48.5 14.51(0.52)
Dresden 250 47.2 14.70(0.40)
Total 1,870 51.5 14.56(0.44)

ADOLESCENT RESILIENCE 33
Table 2. Significant brain regions identified via voxelwise comparisons.
ROI Contrast X Y Z Vx Region BA
1 Main effect of competence -5 37 -22 646 Left orbital
gyrus
11
2 Adversity x competence
interaction
27 52 24 2016 Right middle
frontal gyrus
10
3 Adversity x competence
interaction
13 19 64 465 Right superior
frontal gyrus
6
4 Adversity x competence
interaction
44 -27 -24 459 Right fusiform
gyrus
20
Notes. Data represent MNI coordinates for each region's center of mass. BA = Brodmann Area.

ADOLESCENT RESILIENCE 34
Figure Caption
Figure 1. Bar graphs indicate the group averages for grey matter volume estimates, summed
across all voxels within each cluster (yellow = left orbitofrontal gyrus [OFG]; red = right middle
frontal gyrus [MFG]; blue = right superior frontal gyrus [SFG]; green = fusiform gyrus) with
error bars indicating standard errors. For the OFC, a main effect of competence was observed
with the C/A and C/a groups showing greater grey matter volume than the c/a and c/A groups. A
significant interaction between competence and adversity was observed for the remaining areas
and significant volumetric differences in pairwise comparisons between the groups are indicated
with horizontal lines. The scatterplot shows the significant relationship between grey matter
volume in the right MFG and the problematic drinking composite score for the C/A subgroup.

Running head: ADOLESCENT RESILIENCE 35
0"
10"
20"
30"
40"
50"
60"
0.25" 0.35" 0.45" 0.55" 0.65" 0.75" 0.85"
0.36%
0.38%
0.40%
0.42%
0.44%
0.46%
0.40$
0.42$
0.44$
0.46$
0.48$
0.50$
0.40$
0.42$
0.44$
0.46$
0.48$
0.50$
0.46%
0.48%
0.50%
0.52%
0.54%
0.56%
Competent
Vulnerable
Maladap ve
Resilient
RightInferiorFrontalGyrusGreyMa erVolume
DrinkingCompositeScore
*
Gre
y M
att
er
Vo
lum
e

ADOLESCENT RESILIENCE 36
Supplemental Materials: "Structural Brain Correlates of Adolescent Resilience"
SA1: IMAGEN study recruitment and inclusion/exclusion criteria For details on the recruitment procedures for the IMAGEN study, please see: http://www.imagen-europe.com/en/Publications_and_SOP.php, Work Package 4, chapter 3.
Category Criterion Action
A) Demographics 1. Child in target age (14 yr) Inclusion
B) Pregnancy and birth
1. Use of alcohol by the mother during pregnancy Exclusion (>210 ml alcohol/week
[e.g. 14 bottles of beer, 9 glasses of
wine, 7 glasses of hard liquor]).
2. Diabetes of the mother during pregnancy (onset before pregnancy, treated by insulin)
Exclusion
3. Premature birth (< 35 weeks) and/or detached placenta
Exclusion
4. Hyperbilirubinemia requiring transfusion Exclusion
C) Child’s medical history
1. Type 1 diabetes Exclusion
2. Systemic rheumatologic disorders
(e.g., complications of strep throat, such as glomerulonephritis or endocarditis
Exclusion
3. Malignant tumors requiring chemotherapy (e.g. leukemia)
Exclusion
4. Congenital heart defects or heart surgery Exclusion
5. Aneurism Exclusion
D) Neurological conditions
1. Epilepsy
2. Bacterial Infection of CNS
3. Brain tumor
Exclusion
4. Head trauma with loss of consciousness >30 minutes
Exclusion
5. Muscular dystrophy, myotonic dystrophy Exclusion
E) Developmental conditions
1. Nutritional and metabolic diseases (e.g. failure to thrive, phenylketonuria)
2. Major neuro-developmental disorders (e.g. autism)
Exclusion
3. Hearing deficit (requiring hearing aid) Exclusion
4. Vision problems (strabismus, visual deficit not correctible)
Exclusion
F) Mental health & abilities
1. Treatment for schizophrenia, bipolar disorder Exclusion
2. IQ < 70 Exclusion
G) MR contraindications
1. Metal implants Exclusion
2. Electronic implants (e.g. pacemakers) Exclusion
3. Severe claustrophobia Exclusion

ADOLESCENT RESILIENCE 37
SA2: Adversity items Measure/informant Item Response scale for current study
LEQ adolescent Note: this scale includes events commonly experienced as positive as well as events commonly experienced as negative. For the present study, items were only included in a participant's adversity score if self-reported effect was negative.
Parents divorced 0 = not experienced, 1 = experienced
Family accident or illness (as above)
Found a new group of friends (as above)
Given medication by physician (as above)
Fell in love (as above)
Death in family (as above)
Face broke out with pimples (as above)
Brother or sister moved out (as above)
Started seeing a therapist (as above)
Parent changed jobs (as above)
Began a time-consuming hobby (as above)
Decided about college / university (as above)
Changed schools (as above)
Joined a club or group (as above)
Met a teacher I liked a lot (as above)
Family had money problems (as above)
Got own TV or computer (as above)
Parents argued or fought (as above)
Started going out with a girlfriend/boyfriend (as above)
Went on holiday without parents (as above)
Started driving a motor vehicle (as above)
Broke up with boy/ girl-friend (as above)
Family moved (as above)
Started making own money (as above)
Found religion (as above)
Parent remarried (as above)
Parent abused alcohol (as above)
ADOLESCENT RESILIENCE 38
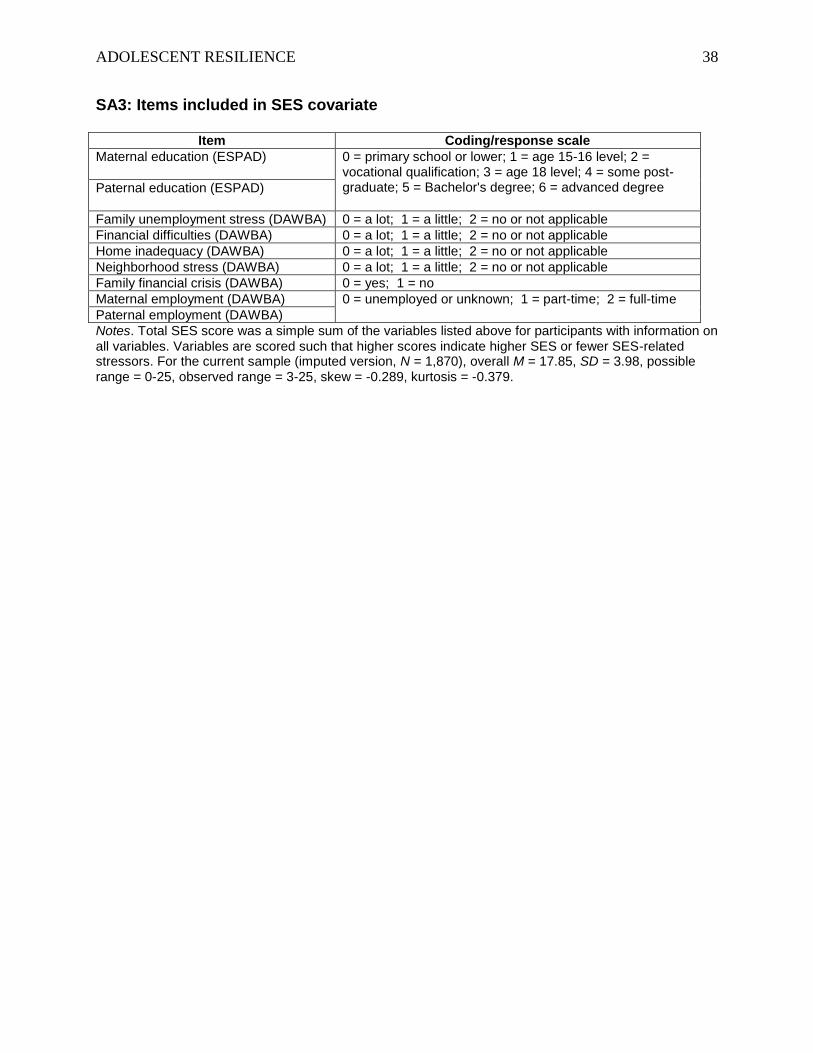
SA3: Items included in SES covariate
Item Coding/response scale
Maternal education (ESPAD)
0 = primary school or lower; 1 = age 15-16 level; 2 = vocational qualification; 3 = age 18 level; 4 = some post-graduate; 5 = Bachelor's degree; 6 = advanced degree Paternal education (ESPAD)
Family unemployment stress (DAWBA) 0 = a lot; 1 = a little; 2 = no or not applicable
Financial difficulties (DAWBA) 0 = a lot; 1 = a little; 2 = no or not applicable
Home inadequacy (DAWBA) 0 = a lot; 1 = a little; 2 = no or not applicable
Neighborhood stress (DAWBA) 0 = a lot; 1 = a little; 2 = no or not applicable
Family financial crisis (DAWBA) 0 = yes; 1 = no
Maternal employment (DAWBA) 0 = unemployed or unknown; 1 = part-time; 2 = full-time
Paternal employment (DAWBA)
Notes. Total SES score was a simple sum of the variables listed above for participants with information on all variables. Variables are scored such that higher scores indicate higher SES or fewer SES-related stressors. For the current sample (imputed version, N = 1,870), overall M = 17.85, SD = 3.98, possible range = 0-25, observed range = 3-25, skew = -0.289, kurtosis = -0.379.

ADOLESCENT RESILIENCE 39
SA4: MRI acquisition parameters
Sequence Parameter Structural - MPRAGE
TR (ms) 2300 (as per ADNI)
TE (ms) 2.8 (as per ADNI)
ETL (as per ADNI) b
Parallel imaging/factor N (as per ADNI)
NSA 1 (as per ADNI)
Scan duration ~ 09:20 (as per ADNI)
Excitation flip angle (degrees) 8-9 (as per ADNI)
2D/3D 3D (as per ADNI)
Matrix freq dirn 256 (as per ADNI)
Matrix phase dirn 256 (as per ADNI)
No. of slices(2D)/Matrix size(3D)
160,170 (as per ADNI) b
FOV frequency (cm) 28.0
FOV phase (%) 94% (as per ADNI)
Slice thickness (mm) 1.1
Slice gap (mm) n/a
Slice orientation Sagittal (as per ADNI)
In-plane phase encode direction
(as per ADNI) b
Slice acquisition order n/a
Slice acquisition direction Left->Right
Sequence specific TI (ms) = 900 (as per ADNI)

ADOLESCENT RESILIENCE 40
SA5: MRI and data coding quality controls A set of parameters compatible with all scanners, particularly those directly affecting image contrast or signal-to-noise, was devised and held constant across sites. Where manufacturer-specific choices had to be made (for example, the design of head coil), the best manufacturer-specific option was used at all sites with the same scanner type. Two quality control procedures were regularly implemented at each site: (1) The American College of Radiology phantom was scanned to provide information about geometric distortions and signal uniformity related to hardware differences in radiofrequency coils and gradient systems, image contrast and temporal stability, and a custom phantom (Tofts et al., 2000) was scanned for diffusion-related parameters. (2) Several healthy volunteers were regularly scanned at each site to assess factors that cannot be measured using phantoms alone and at multiple sites to determine inter-site variability in structural and functional measures (for example, tissue contrast in raw MRI signal, tissue relaxation properties). The details of both quality control procedures are shown below.
Tofts, P. S., Lloyd, D., Clark, C. A., Barker, G. J., Parker, G. J. M., McConville, P., ... & Pope, J. M.
(2000). Test liquids for quantitative MRI measurements of self‐diffusion coefficient in vivo. Magnetic Resonance in Medicine, 43(3), 368-374.
Phantom MRI QC Protocol
Scan Duration Phantom
Localiser & PI calibration ~ 01:00 Dodecane
DTI ~ 10:00 Dodecane
Localiser & PI calibration ~ 01:00 ACR
T2 “QC” ~ 01:00 ACR
Global Task ~ 05:00 ACR
MPRAGE ~ 09:00 ACR
Total ~ 30:00
Frequency: once every 2 months and before and after software or hardware upgrade
In vivo MRI QC Protocol
Scan Duration
Localiser & PI calibration ~ 01:00
T2 & FLAIR ~ 05:00
Global Task ~ 05:00
Breath Hold Calibration ~ 05:00
B0 Field Map ~ 01:00
MPRAGE ~ 09:00
DTI ~ 10:00
Total ~ 35:00
Frequency: twice a year and before and after software or hardware upgrade
Quality control procedures (general)
Clinical, behavioral and neuropsychological assessment battery
Quality indications given by participants on tests assessed via the ‘Psytools’ platform are automatically entered into the data base
Research Assistant (RA) quality ratings and comments entered directly after assessment are manually reviewed. Where reliability ratings are missing or data are flagged as doubtful, study centers are
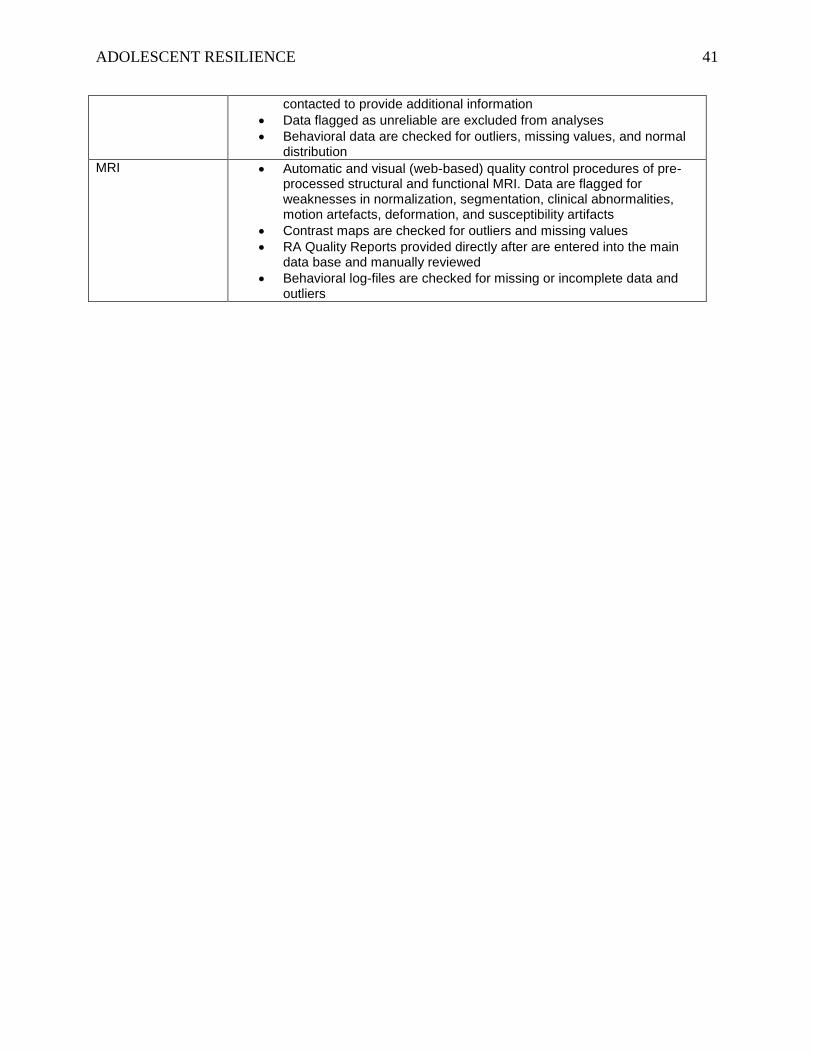
ADOLESCENT RESILIENCE 41
contacted to provide additional information
Data flagged as unreliable are excluded from analyses
Behavioral data are checked for outliers, missing values, and normal distribution
MRI Automatic and visual (web-based) quality control procedures of pre-processed structural and functional MRI. Data are flagged for weaknesses in normalization, segmentation, clinical abnormalities, motion artefacts, deformation, and susceptibility artifacts
Contrast maps are checked for outliers and missing values
RA Quality Reports provided directly after are entered into the main data base and manually reviewed
Behavioral log-files are checked for missing or incomplete data and outliers

ADOLESCENT RESILIENCE 42
Construction of Competence Domains General Description For all domains, items were first aggregated within measure, and then converted to z-scores. After truncation at +/- 3SD from the mean, items were aggregated across informants and measures. Note that for problem-focused items, response scales were recoded from original measures such that higher scores = more competent/adaptive.
SA6: Items included in rule-abiding conduct Measure/informant Item Response scale for current study
DAWBA adolescent & DAWBA parent
Often lies 0 = perhaps, current, or past year, 1 = no
Often starts fights (as above)
Often bullies (as above)
Often stays out later than supposed to
(as above)
Steals (as above)
Has run away more than once (as above)
Truant 0 = yes, 1 = no
Used a weapon 0 = true within past year, 1 = no
Cruel to people (as above)
Cruel to animals (as above)
Firesetting (as above)
Property destruction (as above)
Mugging (as above)
Forced sex (as above)
Broken into a house/car (as above)
SDQ adolescent & SDQ parent
Irritable 0 = certainly true, 1 = somewhat true, 2 = not true
Obedient 0 = not true, 1 = somewhat true, 2 = certainly true
Fights, bullies 0 = certainly true, 1 = somewhat true, 2 = not true
Lies, cheats 0 = certainly true, 1 = somewhat true, 2 = not true
Steals 0 = certainly true, 1 = somewhat true, 2 = not true
SA7: Items included in academic competence
Measure/informant Item Response scale for current study
DAWBA parent School work / ability to reason things out
0 = behind; 1 = average; 2 = ahead
Good at school work 0 = no/not true, 1 = a little, 2 = a lot
DAWBA adolescent Good at school work (as above)
ESPAD adolescent School performance 1 = C- ; 2 = C; 3 = C+; 4 = B-; 5 = B; 6 = B+; 7 = A-; 8 = A

ADOLESCENT RESILIENCE 43
SA8: Items included in social competence Measure/informant Item Response scale for current study
SDQ adolescent & SDQ parent
Solitary, likes to play alone 0 = certainly true, 1 = somewhat true, 2 = not true
Has at least one good friend 0 = not true, 1 = somewhat true, 2 = certainly true
Generally liked 0 = not true, 1 = somewhat true, 2 = certainly true
Picked on or bullied 0 = certainly true, 1 = somewhat true, 2 = not true
Gets on better with adults than other children
0 = certainly true, 1 = somewhat true, 2 = not true
Considerate of others' feelings 0 = not true, 1 = somewhat true, 2 = certainly true
Shares readily 0 = not true, 1 = somewhat true, 2 = certainly true
Helpful if someone is hurt 0 = not true, 1 = somewhat true, 2 = certainly true
Kind to younger children 0 = not true, 1 = somewhat true, 2 = certainly true
Often volunteers to help 0 = not true, 1 = somewhat true, 2 = certainly true
DAWBA adolescent & DAWBA parent
Generous 0 = no, 1 = a little, 2 = a lot
Outgoing, sociable (as above)
Nice personality (as above)
Easygoing (as above)
Good fun, good sense of humor (as above)
Caring, kind-hearted (as above)
Good with friends (as above)
Helpful at home (as above)
Charity work / helping others (as above)
Polite (as above)
DAWBA parent Gets on well with rest of family (as above)
SA9: Items included in emotional health Measure/informant Item Response scale for current study
SDQ adolescent & SDQ parent
Often gets headaches / stomachaches / sickness
0 = certainly true, 1 = somewhat true, 2 = not true
Often worried (as above)
Often unhappy / tearful (as above)
Nervous or clingy in new situations (as above)
Many fears / easily scared (as above)

Running head: ADOLESCENT RESILIENCE 44
SA10: Robustness of primary results to alternative competence/adversity designations
ROI (DV) Effect Original result
Use stricter definition of adversity
1
Remove emotional health from competence
composite2
Use z-score cutoff of
-0.25 rather than -0.50
Use continuous competence, adversity, and interaction term
3
Left orbital gyrus
Main effect of competence
.008***
.008***
.003*
.005**
β = .053*
Right middle frontal gyrus
Main effect of competence
.012***
.007***
.006**
.006**
β = .041
Main effect of adversity
.003*
.000 .001 .004**
β = -.046
Competence*adversity interaction
.009***
.004**
.005**
.006**
β = .087**
Right superior frontal gyrus
Main effect of competence
.004**
.001 .001 .002† β = -.029
Competence*adversity interaction
.009***
.004**
.005**
.008***
β = .086**
Right fusiform gyrus
Competence*adversity interaction
.006**
.006**
.002† .005
** β = -.060
*
Notes. ROI = region of interest. For all results excluding final column, competence = 0/1 (not competent/competent) and adversity = 0/1 (low/high) and numeric results represent partial eta-squared values. For final column, numeric results represent standardized regression weights. See manuscript Table 1 for brain coordinate details. †p < .10.
*p < .05.
**p < .01.
***p < .001.
14+ items from a 9-item Life Events Questionnaire set denoting a more restrictive definition of "not independent from participant's own behavior".
2Competent/not competent cutoff based only on academics, conduct, and social domains
3Continuous competence predictor represents aggregate z-score across academics, conduct, social and emotional health domains