JR-West Group Medium-Term Management Plan 2022 and Results for the Fiscal Year Ended March 31, 2018
May 1, 2018
West Japan Railway Company
Results for FY2018.3 and Forecasts for FY2019.3
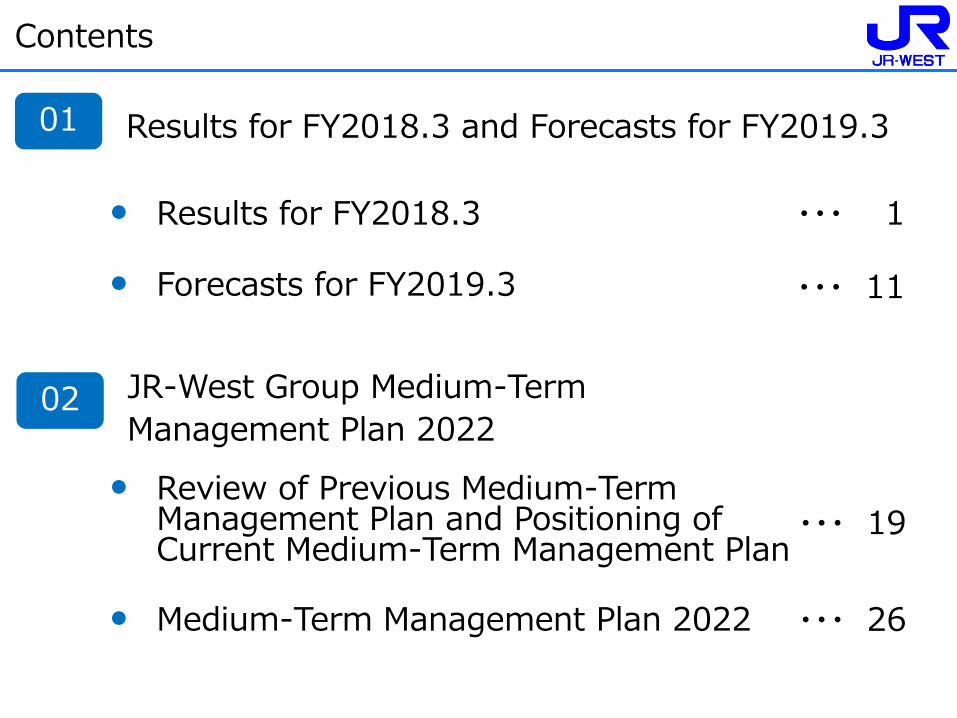
Contents
JR-West Group Medium-Term
Management Plan 2022
01
02
• Results for FY2018.3
• Forecasts for FY2019.3
• Review of Previous Medium-Term Management Plan and Positioning of Current Medium-Term Management Plan
• Medium-Term Management Plan 2022
・・・ 11
・・・ 11
・・・ 19
・・・ 26

Results for FY2018.3 and Forecasts for FY2019.3
1
JR-West Group Medium-Term
Management Plan 2022
01
02
• Results for FY2018.3
• Forecasts for FY2019.3
• Review of Previous Medium-Term Management Plan and Positioning of Current Medium-Term Management Plan
• Medium-Term Management Plan 2022
2
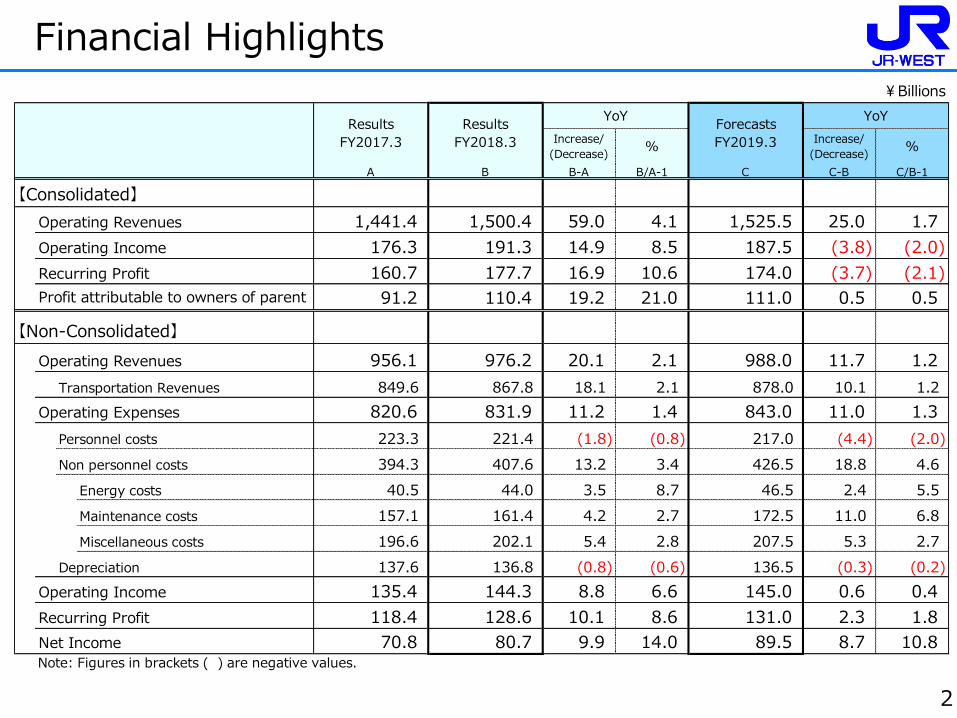
Financial Highlights ¥Billions
Increase/
(Decrease)%
Increase/
(Decrease)%
A B B-A B/A-1 C C-B C/B-1
1,441.4 1,500.4 59.0 4.1 1,525.5 25.0 1.7
176.3 191.3 14.9 8.5 187.5 (3.8) (2.0)
160.7 177.7 16.9 10.6 174.0 (3.7) (2.1)
91.2 110.4 19.2 21.0 111.0 0.5 0.5
956.1 976.2 20.1 2.1 988.0 11.7 1.2
849.6 867.8 18.1 2.1 878.0 10.1 1.2
820.6 831.9 11.2 1.4 843.0 11.0 1.3
223.3 221.4 (1.8) (0.8) 217.0 (4.4) (2.0)
394.3 407.6 13.2 3.4 426.5 18.8 4.6
Energy costs 40.5 44.0 3.5 8.7 46.5 2.4 5.5
Maintenance costs 157.1 161.4 4.2 2.7 172.5 11.0 6.8
Miscellaneous costs 196.6 202.1 5.4 2.8 207.5 5.3 2.7
137.6 136.8 (0.8) (0.6) 136.5 (0.3) (0.2)
135.4 144.3 8.8 6.6 145.0 0.6 0.4
118.4 128.6 10.1 8.6 131.0 2.3 1.8
70.8 80.7 9.9 14.0 89.5 8.7 10.8Note: Figures in brackets ( ) are negative values.
Recurring Profit
Net Income
Transportation Revenues
Operating Expenses
Personnel costs
Non personnel costs
Depreciation
Operating Income
YoY
【Consolidated】
Operating Revenues
Results
FY2017.3
Results
FY2018.3
YoYForecasts
FY2019.3
Operating Revenues
Operating Income
Recurring Profit
Profit attributable to owners of parent
【Non-Consolidated】
[40] [40][40] [40][40] [40][40] [40][40] [40][40] [40][40] [40][40] [40][40] [40][40] [40][40] [40][40] [40][40][40][40][40][40][40][40][40][40][40][40][40][40][40][40] [4[4[4[40][40][40] [4[4[4[4[4[4[4[4[4[4[4[4[4[4[4

3
Non-Consolidated Financial Results ¥Billions
Forecasts
(As of Jan 31)Results
Increase/
(Decrease)%
A B C C-A C/A-1 C-B
Operating Revenues 956.1 972.0 976.2 20.1 2.1 4.2
Transportation revenues 849.6 864.0 867.8 18.1 2.1 3.8
Other 106.4 108.0 108.4 1.9 1.9 0.4
Operating Expenses 820.6 831.0 831.9 11.2 1.4 0.9
Personnel costs 223.3 220.5 221.4 (1.8) (0.8) 0.9
Non personnel costs 394.3 406.0 407.6 13.2 3.4 1.6
Energy costs 40.5 45.0 44.0 3.5 8.7 (0.9)
Maintenance costs 157.1 160.0 161.4 4.2 2.7 1.4
Miscellaneous costs 196.6 201.0 202.1 5.4 2.8 1.1
Rental payments, etc. 30.2 30.5 30.2 (0.0) (0.3) (0.2)
Taxes 34.9 36.0 35.7 0.7 2.1 (0.2)
Depreciation 137.6 138.0 136.8 (0.8) (0.6) (1.1)
Operating Income 135.4 141.0 144.3 8.8 6.6 3.3
(17.0) (16.0) (15.7) 1.2 (7.6) 0.2
Non-operating revenues 6.1 6.0 6.2 0.0 - 0.2
Non-operating expenses 23.1 22.0 21.9 (1.2) - (0.0)
Recurring Profit 118.4 125.0 128.6 10.1 8.6 3.6
(16.5) (3.0) (9.2) 7.3 - (6.2)
Extraordinary profit 18.3 - 29.8 11.5 - -
Extraordinary loss 34.9 - 39.0 4.1 - -
Net Income 70.8 84.5 80.7 9.9 14.0 (3.7)
Note: Figures in brackets ( ) are negative values.
Extraordinary profit and loss, net
Results
FY2017.3
FY2018.3 YoY Difference from the
forecasts
Increase/(Decrease)
Non-operating revenues and expenses, net
4
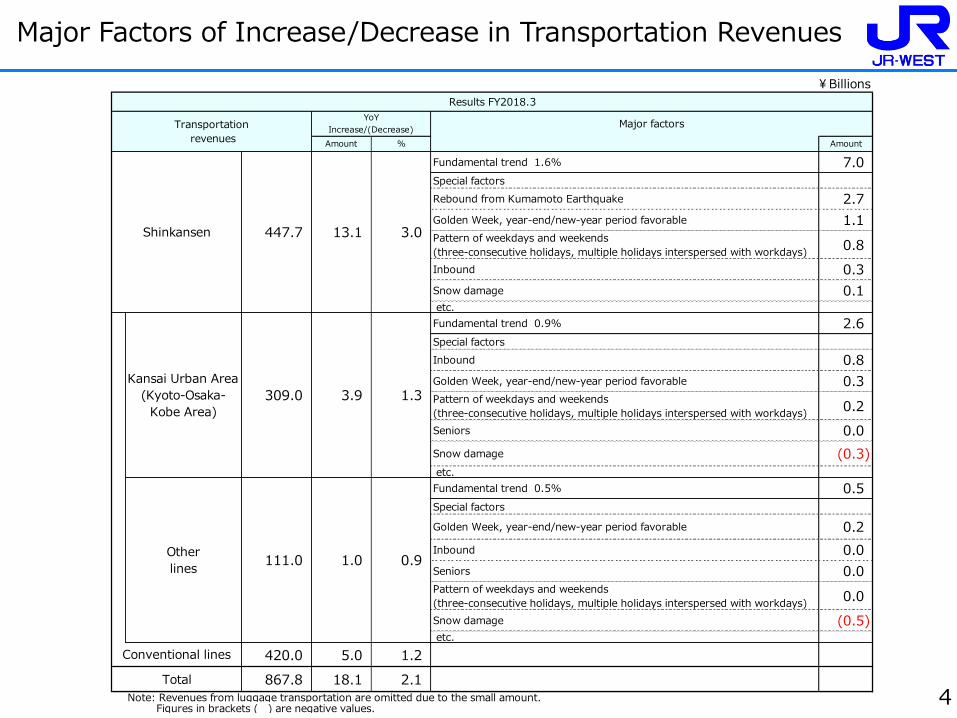
Major Factors of Increase/Decrease in Transportation Revenues ¥Billions
Amount % Amount
Fundamental trend 1.6% 7.0
Special factors
Rebound from Kumamoto Earthquake 2.7
Golden Week, year-end/new-year period favorable 1.1Pattern of weekdays and weekends
(three-consecutive holidays, multiple holidays interspersed with workdays)0.8
Inbound 0.3
Snow damage 0.1 etc.
Fundamental trend 0.9% 2.6
Special factors
Inbound 0.8
Golden Week, year-end/new-year period favorable 0.3Pattern of weekdays and weekends
(three-consecutive holidays, multiple holidays interspersed with workdays)0.2
Seniors 0.0
Snow damage (0.3)
etc.
Fundamental trend 0.5% 0.5
Special factors
Golden Week, year-end/new-year period favorable 0.2
Inbound 0.0
Seniors 0.0Pattern of weekdays and weekends
(three-consecutive holidays, multiple holidays interspersed with workdays)0.0
Snow damage (0.5) etc.
420.0 5.0 1.2
867.8 18.1 2.1Note: Revenues from luggage transportation are omitted due to the small amount. Figures in brackets ( ) are negative values.
Conventional lines
Total
Kansai Urban Area
(Kyoto-Osaka-
Kobe Area)
309.0 3.9 1.3
Other
lines111.0 1.0 0.9
Results FY2018.3
Transportation
revenues
YoY
Increase/(Decrease)Major factors
Shinkansen 447.7 13.1 3.0

5
Transportation Revenues and Passenger-Kilometers
Transportation Revenues Passenger-Kilometers
¥Billions Millions of passenger-kilometers
18.1 1.8 1,020 147
2.1% 0.9% 1.8% 1.1%
13.1 1.6 674 86
3.0% 1.6% 3.3% 1.8%
0.5 0.0 30 7
5.0% 3.5% 3.8% 3.6%
12.6 1.6 643 79
3.0% 1.6% 3.3% 1.7%
5.0 0.1 345 60
1.2% 0.1% 0.9% 0.7%
0.5 0.0 108 18
0.4% 0.3% 0.5% 0.3%
4.4 0.0 237 42
1.6% 0.1% 1.6% 1.1%
3.9 0.3 279 54
1.3% 0.5% 0.9% 0.8%
0.5 0.1 98 19
0.5% 0.4% 0.5% 0.4%
3.4 0.2 181 35
1.8% 0.5% 1.7% 1.3%
1.0 (0.2) 66 6
0.9% (0.8%) 0.8% 0.3%
(0.0) (0.0) 9 (0)
(0.1%) (0.2%) 0.2% (0.1%)
1.0 (0.2) 56 7
1.2% (1.0%) 1.3% 0.7%
Note: Figures in brackets ( ) are negative values.
Non-Commuter Passes 84.9 85.9 21.4 21.2 4,297 4,353 1,085 1,092
Commuter Passes 25.1 25.1 5.8 5.8 4,033 4,043 905 904
11,084 2,686 2,721
Other Lines 110.0 111.0 27.3 27.1 8,330 8,397
Non-Commuter Passes 188.5 192.0 46.8 47.0 10,903
1,990 1,997
Commuter Passes 116.4 116.9 28.0 28.1 18,689 18,787 4,377 4,397
Kansai Urban Area(Kyoto-Osaka-Kobe Area)
305.0 309.0 74.8 75.2 29,592 29,872 7,064 7,118
22,831 5,283 5,301
Non-Commuter Passes 273.5 277.9 68.3 68.3 15,200 15,437
Commuter Passes 141.5 142.0 33.9 34.0 22,723
3,771 3,814
Conventional Lines 415.0 420.0 102.2 102.4 37,923 38,269 9,054 9,115
Non-Commuter Passes 424.3 436.9 101.8 103.4 19,532 20,176 4,674 4,753
Commuter Passes 10.2 10.7 2.5 2.6 815 846 197 204
13,926 14,074
Shinkansen 434.6 447.7 104.4 106.1 20,348 21,022 4,871 4,958
Total 849.6 867.8 206.7 208.5
FY2017.3 FY2018.3 YoY
58,271 59,291
FY2017.3 FY2018.3 YoY
Fiscal Year
(4/1~3/31)
3 months (4Q)
(1/1~3/31)
Fiscal Year
(4/1~3/31)
3 months (4Q)
(1/1~3/31)
FY2017.3 FY2018.3 YoY FY2017.3 FY2018.3 YoY
6
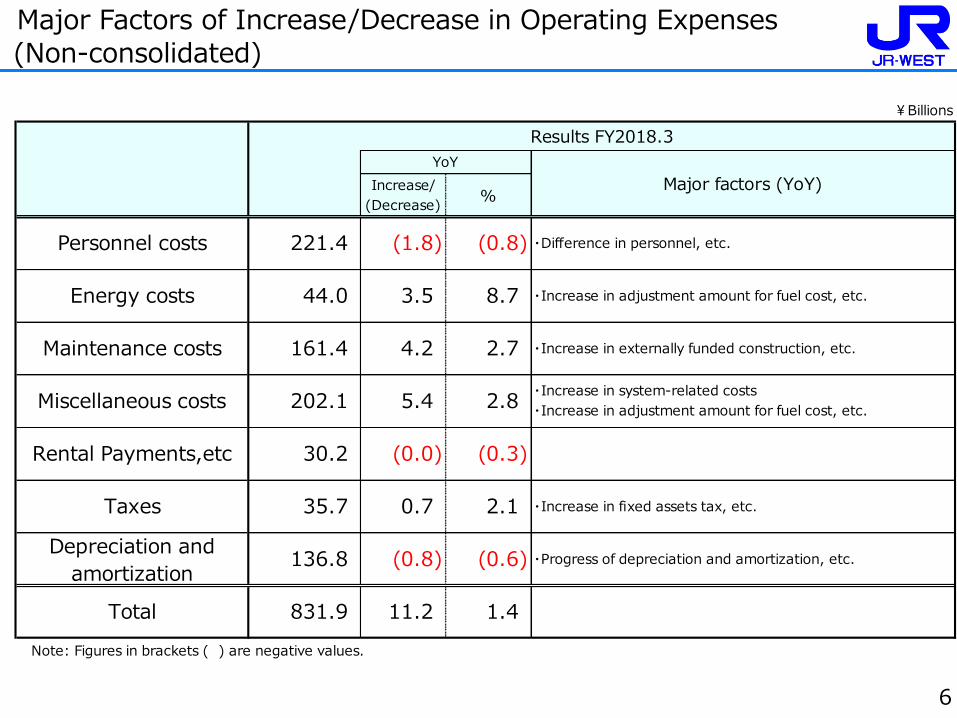
Major Factors of Increase/Decrease in Operating Expenses (Non-consolidated)
¥Billions
Increase/
(Decrease)%
Note: Figures in brackets ( ) are negative values.
Personnel costs 221.4 (1.8) (0.8) ・Difference in personnel, etc.
Results FY2018.3
YoY
Major factors (YoY)
Maintenance costs 161.4 4.2 2.7 ・Increase in externally funded construction, etc.
Energy costs 44.0 3.5 8.7 ・Increase in adjustment amount for fuel cost, etc.
Rental Payments,etc 30.2 (0.0) (0.3)
Miscellaneous costs 202.1 5.4 2.8・Increase in system-related costs
・Increase in adjustment amount for fuel cost, etc.
・Increase in fixed assets tax, etc.
Depreciation and
amortization136.8 (0.8) (0.6) ・Progress of depreciation and amortization, etc.
Total 831.9 11.2 1.4
Taxes 35.7 0.7 2.1

7
Consolidated Financial Results
¥Billions
Forecasts
(As of Jan 31)Results
Increase/
(Decrease)%
A B C C-A C/A-1 C-B
Operating Revenues 1,441.4 1,497.0 1,500.4 59.0 4.1 3.4
Operating Expenses 1,265.0 1,311.5 1,309.0 44.0 3.5 (2.4)
Operating Income 176.3 185.5 191.3 14.9 8.5 5.8
(15.6) (15.0) (13.5) 2.0 (13.0) 1.4
Non-operating revenues 8.0 7.2 9.0 1.0 - 1.8
Non-operating expenses 23.7 22.2 22.6 (1.0) - 0.4
Recurring Profit 160.7 170.5 177.7 16.9 10.6 7.2
(23.0) (4.0) (7.1) 15.9 - (3.1)
Extraordinary profit 19.6 - 32.8 13.2 - -
Extraordinary loss 42.6 - 39.9 (2.6) - -
91.2 110.5 110.4 19.2 21.0 (0.0)
Comprehensive Income 92.0 - 114.1 22.0 24.0 - Note: Figures in brackets ( ) are negative values.
Profit attributable to owners of parent
Results
FY2017.3
FY2018.3 YoY Difference from
the forecasts
Increase/(Decrease)
Non-operating revenues and expenses, net
Extraordinary profit and loss, net

8
Consolidated Financial Results (Segment Information)
¥Billions
Forecasts(As of Jan 31)
ResultsIncrease/
(Decrease)%
A B C C-A C/A-1 C-B
Operating Revenues*1 1,441.4 1,497.0 1,500.4 59.0 4.1 3.4
Transportation 929.1 946.5 950.8 21.7 2.3 4.3
Retail 233.9 240.8 239.8 5.9 2.5 (0.9)
Sales of goods and food services 152.5 162.2 161.7 9.1 6.0 (0.4)
【Accommodation-oriented budget hotels】(restated)*2 【10.8】 【11.7】 【11.6】 【0.8】 【8.2】 【(0.0)】
Department stores 73.4 70.6 70.1 (3.3) (4.5) (0.4)
Real estate 109.5 138.7 139.6 30.0 27.5 0.9
Shopping center 60.5 59.1 59.6 (0.9) (1.5) 0.5
Real estate lease and sale 47.2 77.7 78.1 30.9 65.5 0.4 【Real estate sale】(restated) 【16.1】 【34.9】 【35.0】 【18.8】 【117.2】 【0.0】
Other businesses 168.8 171.0 170.0 1.2 0.7 (0.9)
Hotel 36.2 35.9 35.6 (0.5) (1.5) (0.2)
Nippon Travel Agency 42.0 41.0 41.3 (0.6) (1.6) 0.3
Operating Income*1 176.3 185.5 191.3 14.9 8.5 5.8
Transportation 121.7 127.1 130.3 8.5 7.0 3.2
Retail 5.2 7.0 7.2 2.0 38.9 0.2
Sales of goods and food services 5.1 - 6.0 0.9 18.3 -
Department stores (0.1) - 0.9 1.1 - -
Real estate 32.2 35.5 35.7 3.5 11.1 0.2
Shopping center 9.6 - 8.7 (0.9) (9.9) -
Real estate lease and sale 11.6 - 17.3 5.7 49.3 -
Other businesses 20.4 19.0 19.9 (0.5) (2.5) 0.9
Hotel 2.4 - 1.9 (0.5) (20.4) -
Nippon Travel Agency 0.6 - 0.2 (0.4) (60.7) -Note: Figures in brackets ( ) are negative values.
*1 The breakdowns of operating revenues and operating income by each segment are the sums of those of major subsidiaries.
*2 Figures in brackets 【 】 are the sales of accommodation-oriented budget hotel, "VIA INN", sales, excluding Shimonoseki (non-consolidated),
Asakusa (other business segment), and Hiroshima Kanayamacho (other business segment) locations.
Results
FY2017.3
FY2018.3 YoY Difference from the
forecasts
Increase/(Decrease)
9
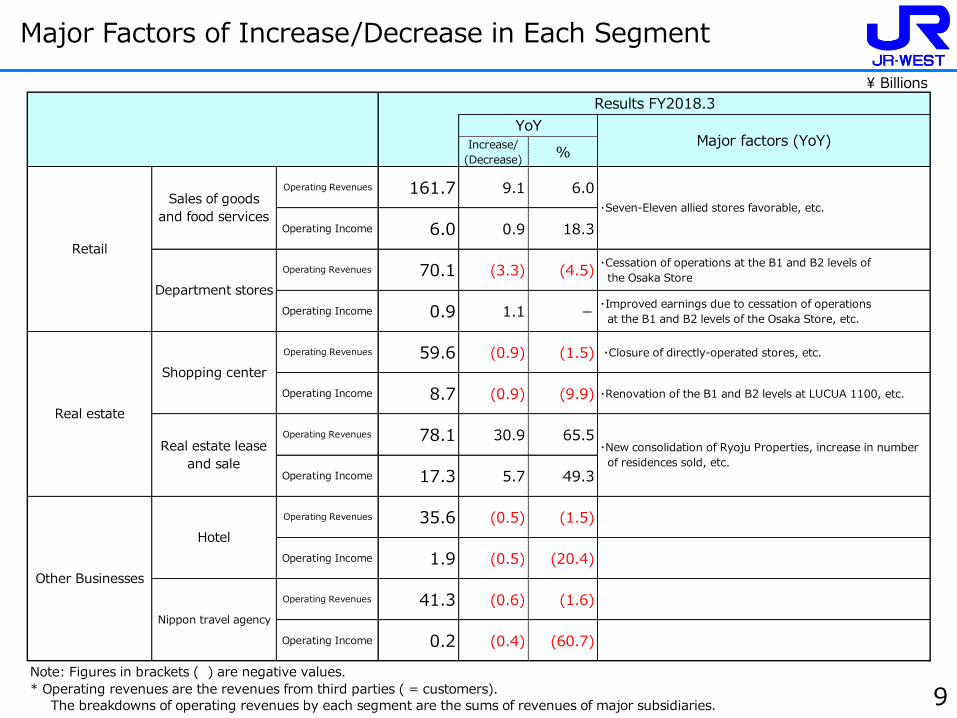
Major Factors of Increase/Decrease in Each Segment
\ Billions
Increase/
(Decrease)%
Operating Revenues 161.7 9.1 6.0
Operating Income 6.0 0.9 18.3
Operating Revenues 70.1 (3.3) (4.5)・Cessation of operations at the B1 and B2 levels of
the Osaka Store
Operating Income 0.9 1.1 -・Improved earnings due to cessation of operations
at the B1 and B2 levels of the Osaka Store, etc.
Operating Revenues 59.6 (0.9) (1.5) ・Closure of directly-operated stores, etc.
Operating Income 8.7 (0.9) (9.9) ・Renovation of the B1 and B2 levels at LUCUA 1100, etc.
Operating Revenues 78.1 30.9 65.5
Operating Income 17.3 5.7 49.3
Operating Revenues 35.6 (0.5) (1.5)
Operating Income 1.9 (0.5) (20.4)
Operating Revenues 41.3 (0.6) (1.6)
Operating Income 0.2 (0.4) (60.7)
Note: Figures in brackets ( ) are negative values.
* Operating revenues are the revenues from third parties ( = customers).
The breakdowns of operating revenues by each segment are the sums of revenues of major subsidiaries.
Results FY2018.3
YoYMajor factors (YoY)
Retail
Sales of goods
and food services・Seven-Eleven allied stores favorable, etc.
Department stores
Real estate
Shopping center
Real estate lease
and sale
・New consolidation of Ryoju Properties, increase in number
of residences sold, etc.
Other Businesses
Hotel
Nippon travel agency

10
¥Billions
As of March 31,
2017
As of March 31,
2018Difference
increase/(decrease)
A B B-A
Assets 3,007.8 3,072.9 65.1
Liabilities 1,975.2 1,956.6 (18.5)
Net assets 1,032.6 1,116.3 83.6
1,037.9 1,032.2 (5.6)
【Average interest rate(%)】 【1.97】 【1.86】 【(0.11)】
Shinkansen Purchase Liability 104.6 103.8 (0.8)
【Average interest rate(%)】 【6.55】 【6.55】 【 - 】
Bonds 534.9 524.9 (9.9)
【Average interest rate(%)】 【1.75】 【1.58】 【(0.17)】
Equity ratio (%) 31.3 33.2 1.9
Net assets per share (¥) 4,857.50 5,273.42 415.92
A B B-A
Cash flows from operating activities 234.1 275.1 40.9
Cash flows from investing activities (295.8) (166.3) 129.4
Free cash flows (61.6) 108.7 170.4
Cash flows from financing activities 44.3 (71.4) (115.7)
Change in cash and cash equivalents, net (17.3) 38.1 55.4
63.3 101.4 38.1
Note: Figures in brackets ( ) are negative values.
Balance of Long-term Debt and Payables
Results
FY2017.3
Results
FY2018.3
YoY
increase/(decrease)
Cash and cash equivalents at the end of the period
Consolidated Financial Situation and Statements of Cash Flows

Results for FY2018.3 and Forecasts for FY2019.3
11
JR-West Group Medium-Term
Management Plan 2022
01
02
• Results for FY2018.3
• Forecasts for FY2019.3
• Review of Previous Medium-Term Management Plan and Positioning of Current Medium-Term Management Plan
• Medium-Term Management Plan 2022
12
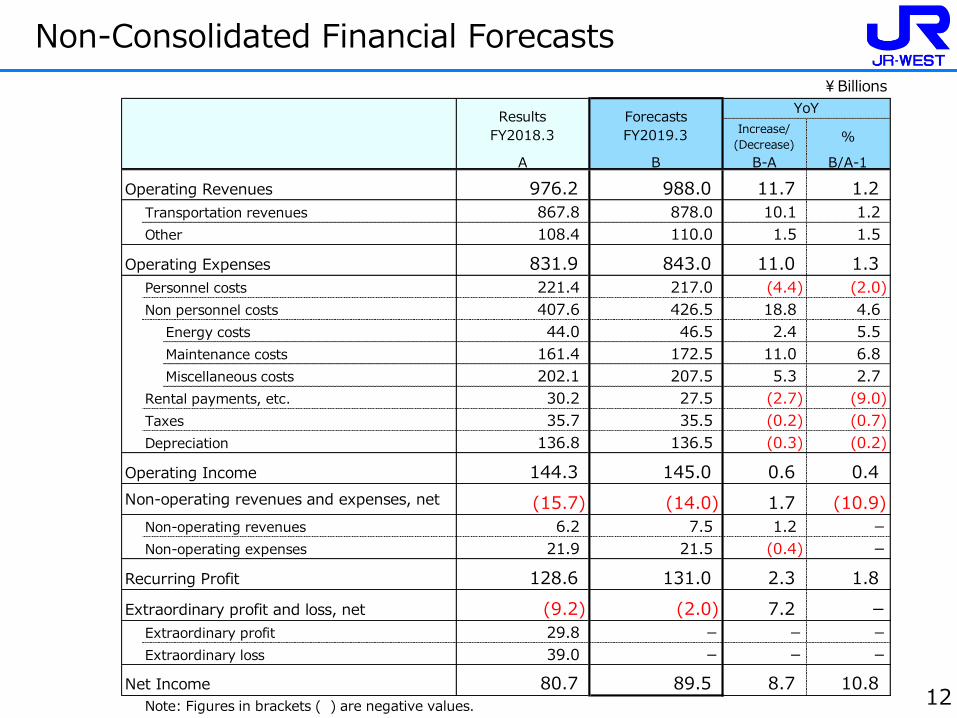
Non-Consolidated Financial Forecasts
¥Billions
Increase/
(Decrease)%
A B B-A B/A-1
Operating Revenues 976.2 988.0 11.7 1.2
Transportation revenues 867.8 878.0 10.1 1.2
Other 108.4 110.0 1.5 1.5
Operating Expenses 831.9 843.0 11.0 1.3
Personnel costs 221.4 217.0 (4.4) (2.0)
Non personnel costs 407.6 426.5 18.8 4.6
Energy costs 44.0 46.5 2.4 5.5
Maintenance costs 161.4 172.5 11.0 6.8
Miscellaneous costs 202.1 207.5 5.3 2.7
Rental payments, etc. 30.2 27.5 (2.7) (9.0)
Taxes 35.7 35.5 (0.2) (0.7)
Depreciation 136.8 136.5 (0.3) (0.2)
Operating Income 144.3 145.0 0.6 0.4
(15.7) (14.0) 1.7 (10.9)
Non-operating revenues 6.2 7.5 1.2 -
Non-operating expenses 21.9 21.5 (0.4) -
Recurring Profit 128.6 131.0 2.3 1.8
(9.2) (2.0) 7.2 -
Extraordinary profit 29.8 - - -
Extraordinary loss 39.0 - - -
Net Income 80.7 89.5 8.7 10.8Note: Figures in brackets ( ) are negative values.
Results
FY2018.3
Forecasts
FY2019.3
YoY
Non-operating revenues and expenses, net
Extraordinary profit and loss, net
13
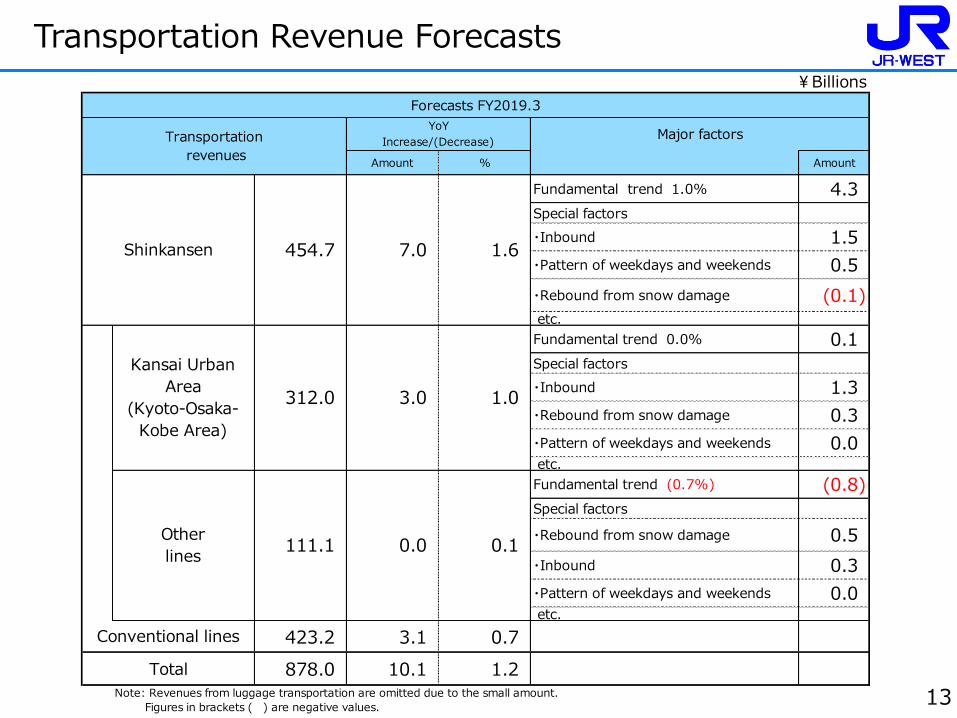
Transportation Revenue Forecasts
¥Billions
Amount % Amount
Fundamental trend 1.0% 4.3
Special factors
・Inbound 1.5
・Pattern of weekdays and weekends 0.5
・Rebound from snow damage (0.1) etc.
Fundamental trend 0.0% 0.1
Special factors
・Inbound 1.3
・Rebound from snow damage 0.3
・Pattern of weekdays and weekends 0.0 etc.
Fundamental trend (0.7%) (0.8)
Special factors
・Rebound from snow damage 0.5
・Inbound 0.3
・Pattern of weekdays and weekends 0.0 etc.
423.2 3.1 0.7
878.0 10.1 1.2Note: Revenues from luggage transportation are omitted due to the small amount.
Figures in brackets ( ) are negative values.
Conventional lines
Total
Kansai Urban
Area
(Kyoto-Osaka-
Kobe Area)
312.0 3.0 1.0
Other
lines111.1 0.0 0.1
Forecasts FY2019.3
Transportation
revenues
YoY
Increase/(Decrease)Major factors
Shinkansen 454.7 7.0 1.6

14
Operating Expenses Forecasts (Non-Consolidated)
¥Billions
Increase/
(Decrease)%
Note: Figures in brackets ( ) are negative values.
Total 843.0 11.0 1.3
Taxes 35.5 (0.2) (0.7)
Depreciation and
amortization136.5 (0.3) (0.2)
Miscellaneous costs 207.5 5.3 2.7・Increase in system-related costs
・Increase in adjustment amount for fuel cost, etc.
Rental Payments,etc 27.5 (2.7) (9.0) ・JR Tozai Line, etc.
Energy costs 46.5 2.4 5.5 ・Increase in adjustment amount for fuel cost, etc.
Maintenance costs 172.5 11.0 6.8・Increase in removal work, etc., accompanying capital expenditures
・Increase in maintenance costs for structures, etc.
Forecasts FY2019.3
YoY
Major factors (YoY)
Personnel costs 217.0 (4.4) (2.0) ・Difference in personnel, etc.

15
Consolidated Financial Forecasts
¥Billions
Increase/
(Decrease)%
A B B-A B/A-1
Operating Revenues 1,500.4 1,525.5 25.0 1.7
Operating Expenses 1,309.0 1,338.0 28.9 2.2
Operating Income 191.3 187.5 (3.8) (2.0)
(13.5) (13.5) 0.0 (0.6)
Non-operating revenues 9.0 8.6 (0.4) -
Non-operating expenses 22.6 22.1 (0.5) -
Recurring Profit 177.7 174.0 (3.7) (2.1)
(7.1) (7.0) 0.1 -
Extraordinary profit 32.8 - - -
Extraordinary loss 39.9 - - -
110.4 111.0 0.5 0.5
Net income per share(¥) 570.72 573.33 - -
Note: Figures in brackets ( ) are negative values.
Profit attributable to owners of parent
Results
FY2018.3
Forecasts
FY2019.3
YoY
Non-operating revenues and expenses, net
Extraordinary profit and loss, net
16
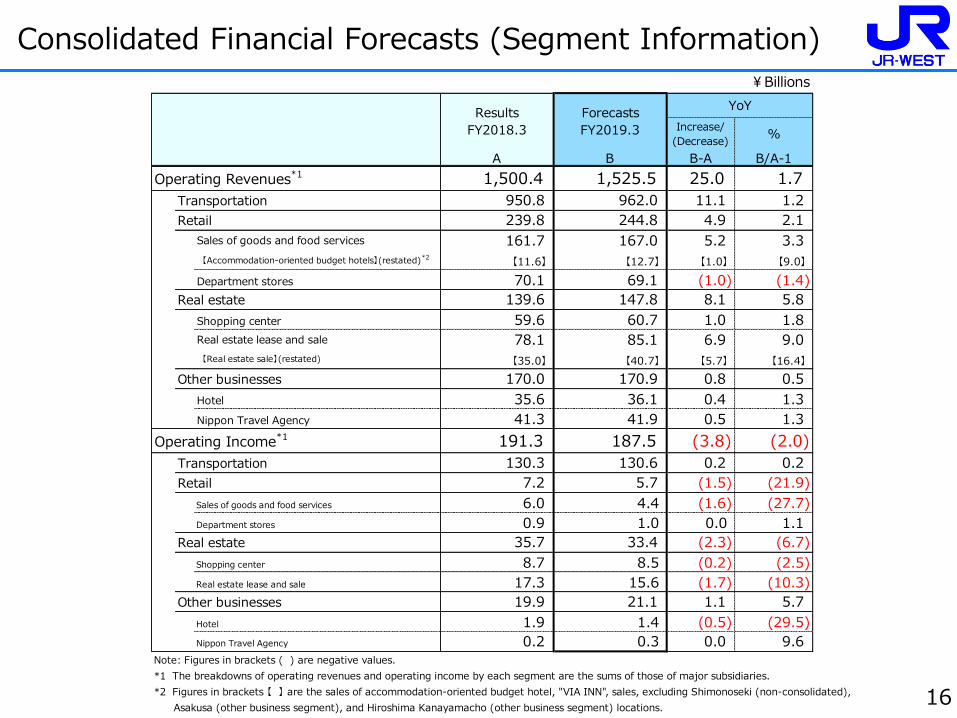
Consolidated Financial Forecasts (Segment Information)
¥Billions
Increase/
(Decrease)%
A B B-A B/A-1
Operating Revenues*1 1,500.4 1,525.5 25.0 1.7
Transportation 950.8 962.0 11.1 1.2
Retail 239.8 244.8 4.9 2.1
Sales of goods and food services 161.7 167.0 5.2 3.3
【11.6】 【12.7】 【1.0】 【9.0】
Department stores 70.1 69.1 (1.0) (1.4)
Real estate 139.6 147.8 8.1 5.8
Shopping center 59.6 60.7 1.0 1.8
Real estate lease and sale 78.1 85.1 6.9 9.0 【Real estate sale】(restated) 【35.0】 【40.7】 【5.7】 【16.4】
Other businesses 170.0 170.9 0.8 0.5
Hotel 35.6 36.1 0.4 1.3
Nippon Travel Agency 41.3 41.9 0.5 1.3
Operating Income*1 191.3 187.5 (3.8) (2.0)
Transportation 130.3 130.6 0.2 0.2
Retail 7.2 5.7 (1.5) (21.9)
Sales of goods and food services 6.0 4.4 (1.6) (27.7)
Department stores 0.9 1.0 0.0 1.1
Real estate 35.7 33.4 (2.3) (6.7)
Shopping center 8.7 8.5 (0.2) (2.5)
Real estate lease and sale 17.3 15.6 (1.7) (10.3)
Other businesses 19.9 21.1 1.1 5.7
Hotel 1.9 1.4 (0.5) (29.5)
Nippon Travel Agency 0.2 0.3 0.0 9.6Note: Figures in brackets ( ) are negative values.
*1 The breakdowns of operating revenues and operating income by each segment are the sums of those of major subsidiaries.
*2 Figures in brackets 【 】 are the sales of accommodation-oriented budget hotel, "VIA INN", sales, excluding Shimonoseki (non-consolidated),
Asakusa (other business segment), and Hiroshima Kanayamacho (other business segment) locations.
Results
FY2018.3
Forecasts
FY2019.3
YoY
【Accommodation-oriented budget hotels】(restated)*2

17
Each Segment Forecasts
\ Billions
Increase/
(Decrease)%
Operating Revenues 167.0 5.2 3.3 ・New opening of Seven-Eleven allied stores, etc.
Operating Income 4.4 (1.6) (27.7) ・Accommodation-oriented hotel opening expenses, etc.
Operating Revenues 69.1 (1.0) (1.4) ・Hindrance from renovation construction, etc.
Operating Income 1.0 0.0 1.1
Operating Revenues 60.7 1.0 1.8 ・Hiroshima ekie opening full-year contribution, etc.
Operating Income 8.5 (0.2) (2.5)
Operating Revenues 85.1 6.9 9.0・Increase in number of residences sold, opening of lease
properties, etc.
Operating Income 15.6 (1.7) (10.3) ・Lease properties new opening expenses, etc.
Operating Revenues 36.1 0.4 1.3
Operating Income 1.4 (0.5) (29.5)
Operating Revenues 41.9 0.5 1.3
Operating Income 0.3 0.0 9.6
Note: Figures in brackets ( ) are negative values.
* Operating revenues are the revenues from third parties ( = customers).
The breakdowns of operating revenues by each segment are the sums of revenues of major subsidiaries.
Real estate
Shopping center
Real estate lease
and sale
Other Businesses
Hotel
Nippon travel agency
Forecasts FY2019.3
YoYMajor factors (YoY)
Retail
Sales of goods
and food services
Department stores
18
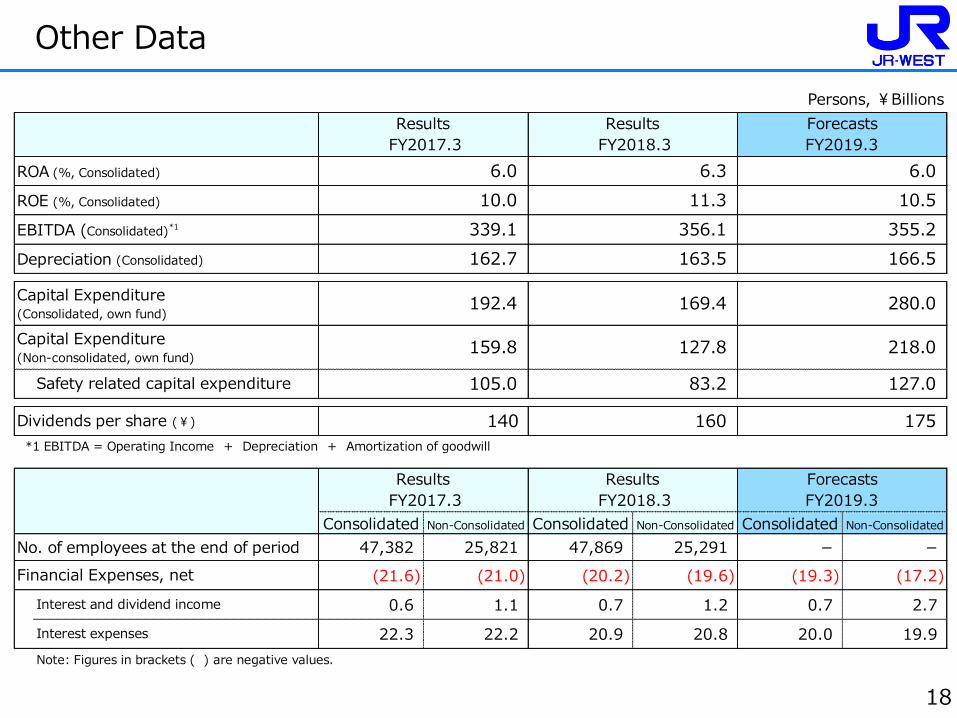
Other Data
Persons, ¥Billions
ROA (%, Consolidated)
ROE (%, Consolidated)
EBITDA (Consolidated)*1
Depreciation (Consolidated)
Consolidated Non-Consolidated Consolidated Non-Consolidated Consolidated Non-Consolidated
47,382 25,821 47,869 25,291 - -
(21.6) (21.0) (20.2) (19.6) (19.3) (17.2)
0.6 1.1 0.7 1.2 0.7 2.7
22.3 22.2 20.9 20.8 20.0 19.9
Note: Figures in brackets ( ) are negative values.
No. of employees at the end of period
Financial Expenses, net
Interest and dividend income
Interest expenses
Dividends per share (¥) 140 160 175
*1 EBITDA = Operating Income + Depreciation + Amortization of goodwill
Results
FY2017.3
Results
FY2018.3
Forecasts
FY2019.3
Capital Expenditure(Non-consolidated, own fund)
159.8 127.8 218.0
Safety related capital expenditure 105.0 83.2 127.0
162.7 163.5 166.5
Capital Expenditure(Consolidated, own fund)
192.4 169.4 280.0
10.0 11.3 10.5
339.1 356.1 355.2
Results
FY2017.3
Results
FY2018.3
Forecasts
FY2019.3
6.0 6.3 6.0
Results for FY2018.3 and Forecasts for FY2019.3
19
JR-West Group Medium-Term Management Plan 2022
01
02
• Results for FY2018.3
• Forecasts for FY2019.3
• Review of Previous Medium-Term Management Plan and Positioning of Current Medium-Term Management Plan
• Medium-Term Management Plan 2022

321
281
152
65
41
25
13 17
0
20
40
60
80
100
120
0
50
100
150
200
250
300
350
400
05.3期 06.3期 07.3期 08.3期 09.3期 10.3期 11.3期 12.3期 13.3期 14.3期 15.3期 16.3期 17.3期 18.3期
Railway accidents with casualties on platforms (right)
Transportation disruptions due to internal factors
Accidents at level crossing (right)
Review of JR-West Group Medium-Term Management Plan 2017 (1) — (Safety)
○ Safety Think-and-Act Plan 2017 Objectives
Even though we did not meet a portion of our objectives, the number of railway operation accidents, etc., has generally been following a declining trend.
20
FY13.3 results FY18.3 objectives FY18.3 results
Railway accidents that result in casualties among our customers 0 cases 0 cases
in 5 years 0 cases
in 5 years
Railway labor accidents that result in fatalities among our employees 0 cases 0 cases
in 5 years 2 cases
in 5 years
Railway accidents with casualties on platforms 13 cases 9 cases (30% reduction) 17 cases
Accidents at level crossings 41 cases 25 cases (40% reduction) 25 cases
Transportation disruptions due to internal factors 281 cases 140 cases (50% reduction) 152 cases
(Cases)
Figures in parentheses are indexed to FY05.3 = 100.
(100)
(100)
(Cases)
(88)
(63)
※ Totals from FY13.3
Platform gates (Osaka station)
(47)
(38)
*Preliminary figures
FY05.3 FY06.3 FY07.3 FY08.3 FY09.3 FY10.3 FY11.3 FY12.3 FY13.3 FY15.3 FY16.3 FY17.3 FY14.3 FY18.3 (Preliminary)
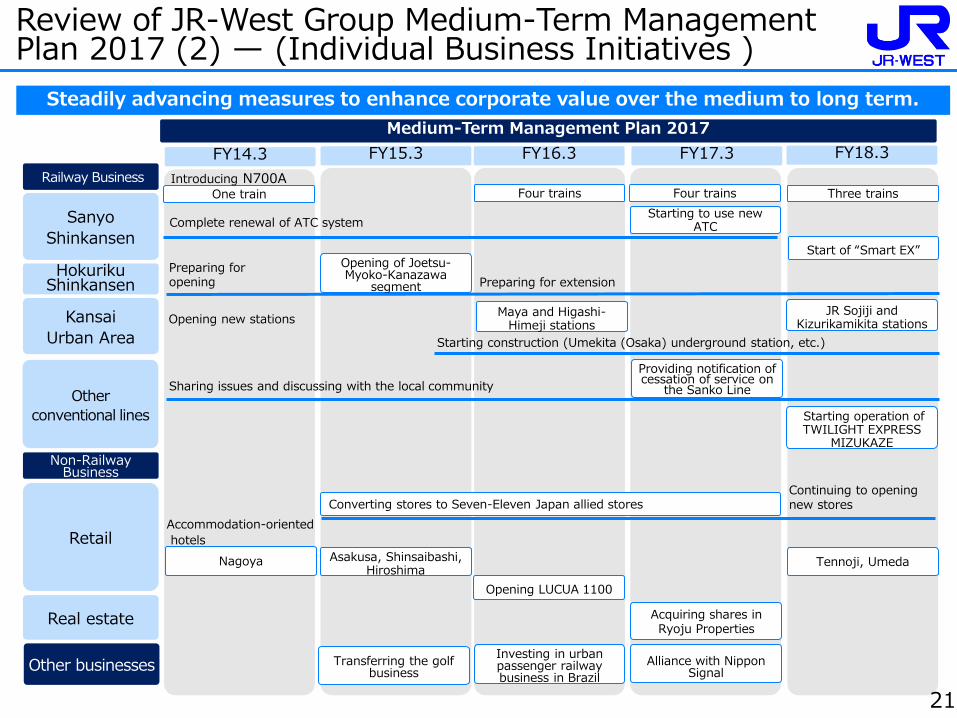
Review of JR-West Group Medium-Term Management Plan 2017 (2) — (Individual Business Initiatives )
Railway Business
Non-Railway Business
Medium-Term Management Plan 2017
Start of “Smart EX”
Sanyo
Shinkansen
Hokuriku Shinkansen
Preparing for opening Preparing for extension
Kansai
Urban Area
Retail
Real estate
Starting construction (Umekita (Osaka) underground station, etc.)
Opening new stations
Converting stores to Seven-Eleven Japan allied stores
Acquiring shares in Ryoju Properties
Continuing to opening new stores
Other businesses
Starting to use new ATC Complete renewal of ATC system
Opening LUCUA 1100
Four trains Three trains Four trains One train
Opening of Joetsu-Myoko-Kanazawa
segment
Investing in urban passenger railway business in Brazil
Steadily advancing measures to enhance corporate value over the medium to long term.
FY14.3 FY15.3 FY16.3 FY17.3 FY18.3
Maya and Higashi-Himeji stations
JR Sojiji and Kizurikamikita stations
Other
conventional lines
Sharing issues and discussing with the local community
Providing notification of cessation of service on
the Sanko Line
Nagoya
Accommodation-oriented
hotels
Tennoji, Umeda Asakusa, Shinsaibashi, Hiroshima
Transferring the golf business
Alliance with Nippon Signal
21
Starting operation of TWILIGHT EXPRESS
MIZUKAZE
Introducing N700A

Review of JR-West Group Medium-Term Management Plan 2017 (3) — (Financial Indicators)
FY13.3 results FY18.3 objectives FY18.3 results
Consolidated operating revenues ¥1,298.9 billion ¥1,423.0 billion ¥1,500.4 billion
Consolidated EBITDA ¥290.3 billion ¥325.5 billion ¥356.1 billion
Consolidated ROA 4.9% 5.5% 6.3%
Consolidated ROE (Reference) 8.3% 9.8% 11.3%
Rate of total distribution on net assets 2.9% Approx. 3% 3.2%
○ Financial Indicators
ROA
4.7%
6.4%
(0.4%)
7.3% 7.1%
5.8%
Invested capital
(total assets)
○ Trends in ROA by segment (FY13.3 → FY18.3) *Circle size indicates operating income
Achieving results that substantially exceeded objectives for all financial indicators, Realizing steady growth in all segments
Transportation Real estate
Retail
4.2% 4.8%
Other businesses
22
¥100 billion ¥300 billion ¥600 billion ¥2,000 billion
3%
6%
Note: Figure in bracket ( ) is negative value.

Hokuriku Shinkansen opening
Growth through medium to long term initiatives
10,000
15,000
20,000
14.3期 15.3期 16.3期 17.3期 18.3期 19.3期 20.3期 21.3期 22.3期 23.3期
Positioning of Medium-Term Management Plan 2022
○ Trends in consolidated operating revenues
(¥ Billion)
23
Continuation of growth Preparations for further growth
Securing business sustainability
Medium-Term Management Plan 2017
Enhansing safety
Toward further growth
Our Vision
The Ideal Forms Around 2030
¥2 trillion
Steadfastly maintaining the direction taken to date. At the same time, adding a backcasting perspective to target sustained growth over the long term.
Medium-Term Management Plan 2022
・Strengthening Shinkansen competitiveness ・Increasing the value of railway belts in the Kansai Urban Area ・Increasing asset efficiency and expanding operational scale in non-railway businesses
・Setting objectives from long-term viewpoint
・Maximizing effectiveness of large-scale projects
【Securing business sustainability】 ・Increasing productivity by utilizing new technologies, etc. ・Using opportunities presented by updates of large-scale
facilities in order strengthen functionality
2,000
1,500
1,000
FY16.3 FY17.3 FY14.3 FY15.3 FY20.3 FY21.3 FY18.3 FY19.3 FY23.3 FY22.3
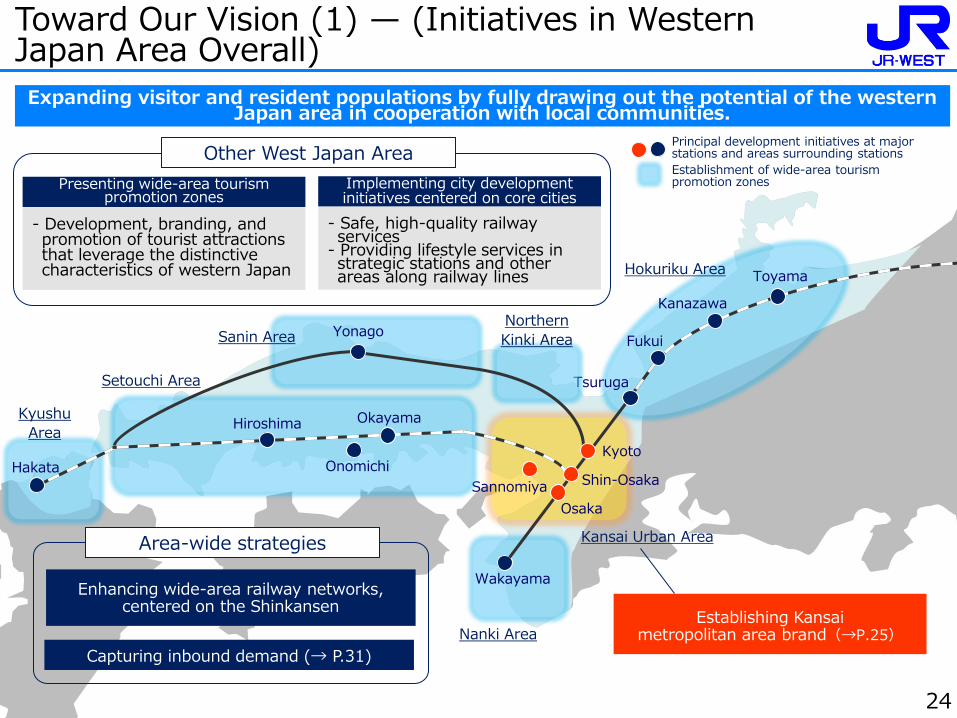
Toward Our Vision (1) — (Initiatives in Western Japan Area Overall)
Kyoto
Osaka
Sannomiya
Expanding visitor and resident populations by fully drawing out the potential of the western Japan area in cooperation with local communities.
Toyama
Kanazawa
Fukui
Tsuruga
24
Shin-Osaka
Hiroshima Okayama
Onomichi
Yonago
Wakayama
Hakata
Sanin Area
Setouchi Area
Kyushu
Area
Nanki Area
Northern
Kinki Area
Hokuriku Area
Kansai Urban Area
Enhancing wide-area railway networks, centered on the Shinkansen
Capturing inbound demand (→ P.31)
Implementing city development initiatives centered on core cities
Presenting wide-area tourism promotion zones
Establishing Kansai metropolitan area brand(→P.25)
Area-wide strategies
Other West Japan Area Principal development initiatives at major stations and areas surrounding stations
Establishment of wide-area tourism promotion zones
- Safe, high-quality railway services
- Providing lifestyle services in strategic stations and other areas along railway lines
- Development, branding, and promotion of tourist attractions that leverage the distinctive characteristics of western Japan

Toward Our Vision (2) — (Establishing Kansai Metropolitan Area Brand)
約50
Contributing to the establishment of the Kansai metropolitan area brand as a region that is suited to be the gateway to “Japan”.
Increasing appeal as an international city by enhancing railway networks and developing areas
along railway lines
・Naniwasuji Line / Considering Yumeshima Access
Creating the liveliness of the community through the development of the area surrounding Osaka Station
・Implementing city development initiatives, centered on the Umekita (Osaka) underground station
Developing the Shin-Osaka area into a wide-area hub base and demonstrating its potential as an
international business site
・Increasing Shin-Osaka's base functionality (integration of transportation connecting point functions and city functions), with a focus on the super mega-region (merging of the big three metropolitan areas)
Establishing a brand for appealing areas along railway lines
・Developing railway belt terminal stations as bases
25

26
JR-West Group Medium-Term
Management Plan 2022
01
02
• Medium-Term Management Plan 2022
Results for FY2018.3 and Forecasts for FY2019.3
• Results for FY2018.3
• Forecasts for FY2019.3
• Review of Previous Medium-Term Management Plan and Positioning of Current Medium-Term Management Plan
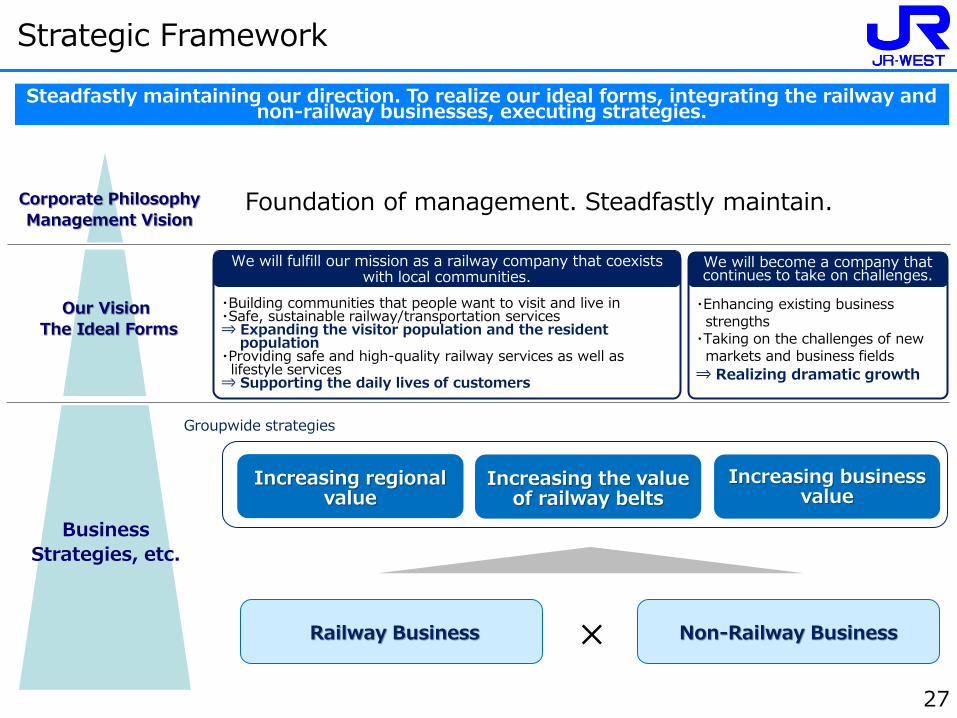
Strategic Framework
Corporate Philosophy
Management Vision
Our Vision
The Ideal Forms
Business
Strategies, etc.
We will fulfill our mission as a railway company that coexists with local communities.
Foundation of management. Steadfastly maintain.
We will become a company that continues to take on challenges.
Steadfastly maintaining our direction. To realize our ideal forms, integrating the railway and non-railway businesses, executing strategies.
・Building communities that people want to visit and live in ・Safe, sustainable railway/transportation services ⇒ Expanding the visitor population and the resident
population ・Providing safe and high-quality railway services as well as lifestyle services
⇒ Supporting the daily lives of customers
・Enhancing existing business strengths
・Taking on the challenges of new markets and business fields
⇒ Realizing dramatic growth
Increasing regional value
Increasing the value of railway belts
Increasing business value
Railway Business Non-Railway Business ×
Groupwide strategies
27

Operating Environment Changes
Formulating strategies with consideration for changes in the operating environment (opportunities/threats) and for our strengths
Further increases in inbound customers
Arrival of timing for updates of large-scale facilities
Intensification of natural disasters
Technological innovation (self-driving automobiles,
etc.)
Active contributions by women and seniors
Regional development activities
Concentration of population in urban areas
Technological innovation (use of AI, etc.)
Opportunities Threats Medium-Term
Management Plan 2022
Application Response
28
Strengths Strength through collaboration with
people in local communities Strength through implementation of
Groupwide measures
・Increasing regional value
・Increasing the value of railway belts
・Increasing business value
・Capturing inbound demand etc.
Market contraction and workforce declines
accompanying decreasing population
Projects such as the Hokuriku Shinkansen
extension, etc.

8.3%
11.3%
0.0%
3.0%
6.0%
9.0%
12.0%
13.3期実績 18.3期実績 23.3期目標
(参考)連結ROE
2,903
3,561
0
2,000
4,000
13.3期実績 18.3期実績 23.3期目標
連結EBITDA
408.0*
Management KPIs
35
Expanding the scale of revenue and profits while maintaining asset efficiency at a high level.
12,989
15,004
10,000
13,000
16,000
13.3期実績 18.3期実績 23.3期目標
連結営業収益
4.9% 6.3%
0.0%
3.0%
6.0%
9.0%
12.0%
13.3期実績 18.3期実績 23.3期目標
連結ROA
(¥ Billion) (¥ Billion) 1,630.0
Mid-6% range
Approx. 10%
* Excluding opening preparation expenses related to the Hokuriku Shinkansen Tsuruga extension, which will be non-recurring expenses in FY2023/3.
400.0
Consolidated operating revenues Consolidated EBITDA
Consolidated ROA (Reference) Consolidated ROE
1,600
1,300
1,000
1,298.9
1,500.4 400
200
290.3 356.1
FY13.3 result
FY13.3 result
FY13.3 result
FY13.3 result
FY18.3 result FY18.3 result
FY18.3 result FY18.3 result
FY23.3 objective FY23.3 objective
FY23.3 objective FY23.3 objective 29

Groupwide Strategies (1) — Increasing Regional Value / the Value of Railway Belts
Railway and non-railway businesses working together to maximize regional value / the value of railway belts.
Developing contents that draw customers
・ Drawing on regional appeal to develop strategic stations ・ Developing appealing accommodation facilities ・ Uncovering local products
Increasing regional value Increasing the value of railway belts
Developing wide-area tourism routes
・ Enhancing the convenience and appeal of the Sanyo Shinkansen ・ Enhancing stations that will be tourism connection points ・ Operating new long-distance trains, etc. ・ Combining railways and cruise ships
Maximizing Tsuruga extension effect
・ Implementing development initiatives at stations and areas surrounding stations
・ Developing tourist attractions through collaboration with local communities
Setouchi Area
Hokuriku Area
Kansai Urban Area
Enhancing transportation services
・ Enhancing safety ・ Realizing seamless mobility through ICOCA ・ Advancing barrier-free initiatives and station beautification to
address diverse needs
Development initiatives at stations, station buildings, and areas surrounding stations
Spring 2019 Opening a new station on the KyotoTanbaguchi
segment of the Sagano Line Opening two hotels in front of the Hachijo Exit of Kyoto Station
2020 Umekoji: Opening community-oriented casual hotels
2018-20 Kyoto Station commercial facility large-scale renovation
30
Kyoto
June 2018 Opening of Hotel Vischio Osaka Spring 2019 Opening of northern section of Osaka
Higashi Line Spring 2023 Opening of Umekita (Osaka)
underground station 2023 and thereafter Developing the western part of Osaka
Station Spring 2031 objective Opening of Naniwasuji Line
Osaka
2023 and thereafter Station building development
Sannomiya
Tennoji
Osaka
Shin-Osaka
Kizu
Kyoto
Kyobashi
Sasayamaguchi
Nara
Oji Kyuhoji
Hanaten
JR Namba
Amagasaki
Sakurajima
Suita
Kishibe
Ibaraki
Nishi-Kujo
Shimamoto
Universal-City
Sannomiya Kobe Akashi
Maya Ashiya
Tsukamoto
Fukushima
Yumeshima
Condominium development
Station improvement / in-station development
Condominium development
Development of areas surrounding
stations
In-station development
Station improvement / in-station development
Development of areas surrounding stations
Development of areas surrounding stations
Development of areas surrounding stations
Condominium development
A new station on the Kyoto-Tanbaguchi
segment
Umekita underground station
Vorthern section of Osaka Higashi Line
Completing double track of Nara Line
(phase 2)
○ Major development plans
0
200
400
600
18.3期 23.3期
0
100
200
300
18.3期 23.3期
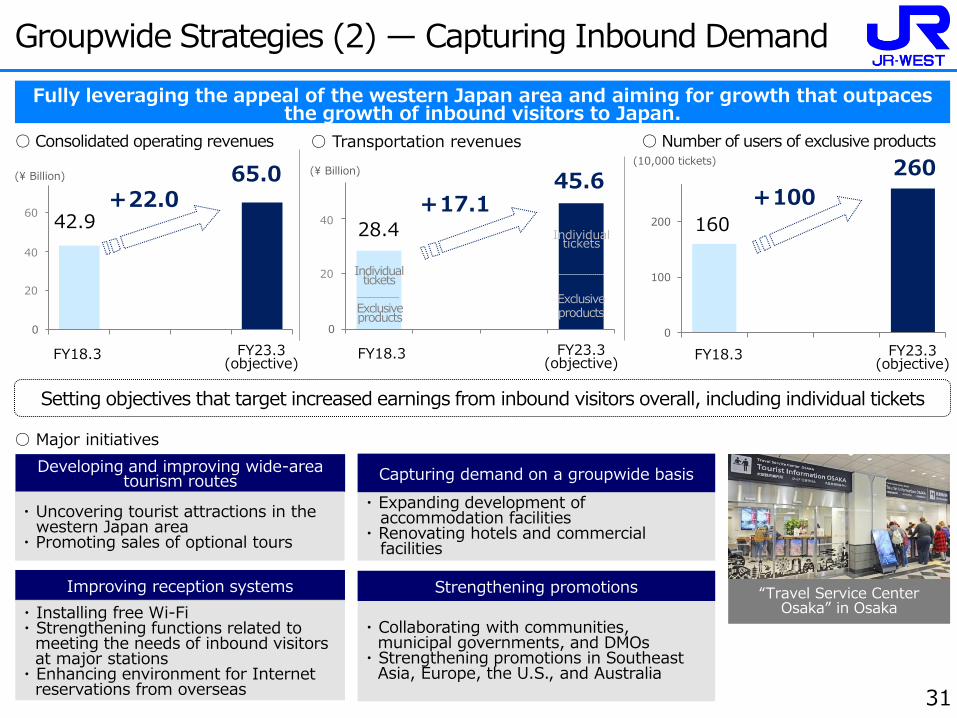
Groupwide Strategies (2) — Capturing Inbound Demand
Improving reception systems Strengthening promotions
+100
Developing and improving wide-area tourism routes
+17.1
Fully leveraging the appeal of the western Japan area and aiming for growth that outpaces the growth of inbound visitors to Japan.
・ Uncovering tourist attractions in the western Japan area
・ Promoting sales of optional tours
・ Installing free Wi-Fi ・ Strengthening functions related to
meeting the needs of inbound visitors at major stations
・ Enhancing environment for Internet reservations from overseas
・ Collaborating with communities, municipal governments, and DMOs
・ Strengthening promotions in Southeast Asia, Europe, the U.S., and Australia
○ Transportation revenues ○ Number of users of exclusive products
(目標) (目標)
○ Major initiatives
31
260 45.6
28.4 160
(10,000 tickets)
Exclusive products
Individual tickets
Individual tickets
Exclusive products
0
200
400
600
800
18.3期 23.3期
(目標)
○ Consolidated operating revenues
42.9
65.0 +22.0
(¥ Billion)
Capturing demand on a groupwide basis
・ Expanding development of accommodation facilities
・ Renovating hotels and commercial facilities
“Travel Service Center Osaka” in Osaka
(¥ Billion)
60
40
20
40
20
FY18.3 FY23.3 (objective)
FY18.3 FY23.3 (objective)
FY18.3 FY23.3 (objective)
Setting objectives that target increased earnings from inbound visitors overall, including individual tickets

・New rolling stock ・ Equipment for detecting
abnormalities in bogies
・ Earthquake resistance reinforcement, reinforcement of slopes, anti-wind barriers
・ Sanyo Shinkansen derailment prevention guards
Railway Business (1) — Enhancing Safety
Safety is the foundation of management and the most important strategy. We will continue ongoing efforts, including both tangible and intangible initiatives.
Capital expenditure
¥530 billion
32
Objectives
Train accidents that result in casualties among our customers
0 cases in 5 year
Railway labor accidents that result in fatalities among our employees
0 cases in 5 year
Objectives
Railway accidents that result in casualties among our customers
Further 10% reduction*
Accidents at level crossings Further 10% reduction*
Transportation disruptions due to internal factors
Further 10% reduction*
○ JR-West Group Railway Safety Think-and-Act Plan 2022 「Objectives」
* Benchmarks are objectives from Safety Think-and-Act Plan 2017. If objectives are achieved, then another 10% reduction from that value.
Pursuing Shinkansen safety
Responding to intensifying natural disasters
Addressing social needs
・Platform gates
Tangible measures
・Advancing self-service ticket purchases
- Expanding ICOCA area, promoting Internet reservations
・Revising station sales systems - Mechanization, transitioning to call
centers ・Revising workforce, including full automation
・Advancing one-person operation of trains
・Transitioning to new maintenance methods
- Transitioning from ground-based inspections to on-board inspections, condition monitoring on trains used to carry passengers
・Mechanization and revision of facilities structure
- Transitioning to hyper overhead electrical lines, using rail grinder trains, using utility pole handling vehicles
・Simplifying ground equipments
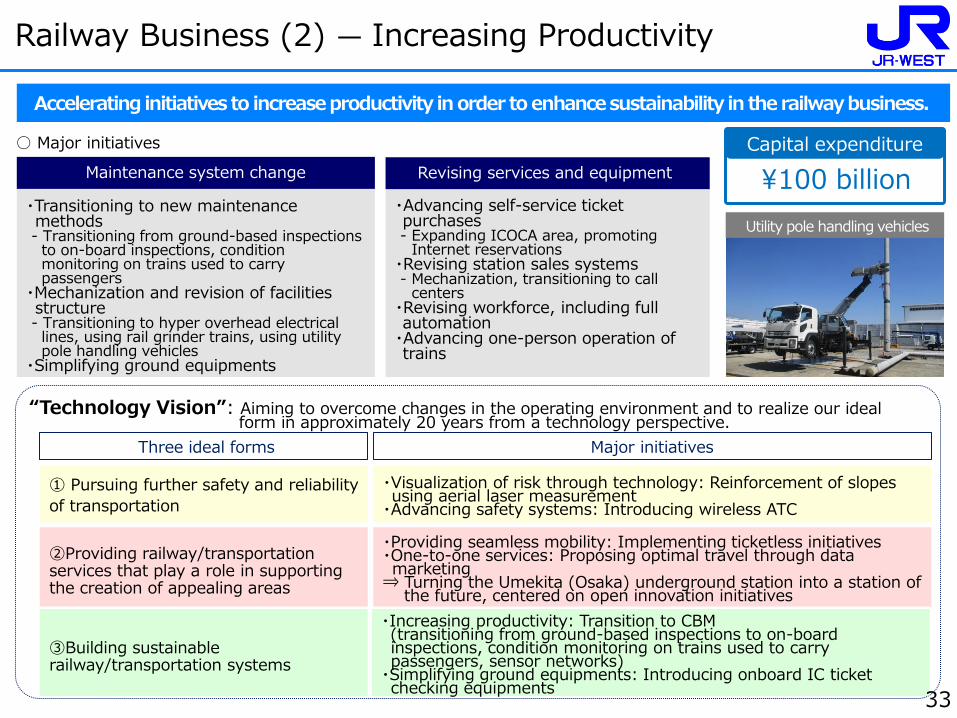
Railway Business (2) — Increasing Productivity
Revising services and equipment Maintenance system change
Accelerating initiatives to increase productivity in order to enhance sustainability in the railway business.
Capital expenditure
¥100 billion
○ Major initiatives
“Technology Vision”: Aiming to overcome changes in the operating environment and to realize our ideal form in approximately 20 years from a technology perspective.
・Increasing productivity: Transition to CBM (transitioning from ground-based inspections to on-board inspections, condition monitoring on trains used to carry passengers, sensor networks)
・Simplifying ground equipments: Introducing onboard IC ticket checking equipments
③Building sustainable railway/transportation systems
・Providing seamless mobility: Implementing ticketless initiatives ・One-to-one services: Proposing optimal travel through data marketing
⇒ Turning the Umekita (Osaka) underground station into a station of the future, centered on open innovation initiatives
②Providing railway/transportation services that play a role in supporting the creation of appealing areas
・Visualization of risk through technology: Reinforcement of slopes using aerial laser measurement
・Advancing safety systems: Introducing wireless ATC
① Pursuing further safety and reliability
of transportation
Three ideal forms Major initiatives
33
Utility pole handling vehicles

3,570
4,477 4,547
3,000
4,000
5,000
13.3期 18.3期 19.3期 23.3期
Railway Business (3) — Shinkansen
Safe, reliable transportation Fostering tourism demand Enhancing transportation services
・Increasing frequencies
・Enhancing the convenience of Internet reservations
・Working toward self-service ticket purchases
・Providing special services for frequent users
・Improving wide-area tourism routes, campaigns
・Capturing inbound demand(→P.31)
○ Trends in transportation revenues
Largest growth driver. Investing management resources to increase competitiveness and expand the visitor population.
Capital expenditure
¥380 billion
・Introducing new rolling stock
・Introducing equipment for detecting abnormalities in bogies
○ Major initiatives
34
(¥ Billion)
Securing business sustainability
・Renovation of Depot (Hakata)
Maximizing the Tsuruga extension effect for the Hokuriku Shinkansen
470.7
(目標) (予想)
500
400
300
357.0
447.7 454.7
FY18.3 FY23.3 (objective)
FY13.3 FY19.3 (forecast)
・Expanding the railway network by opening new lines/new stations
・Implementing Groupwide initiatives to develop areas along railway lines
1,230 1,110 1,111
500
1,000
1,500
2,000
2,500
13.3期 18.3期 19.3期 23.3期
2,889 3,090
3,120
2,000
2,500
3,000
3,500
4,000
13.3期 18.3期 19.3期 23.3期
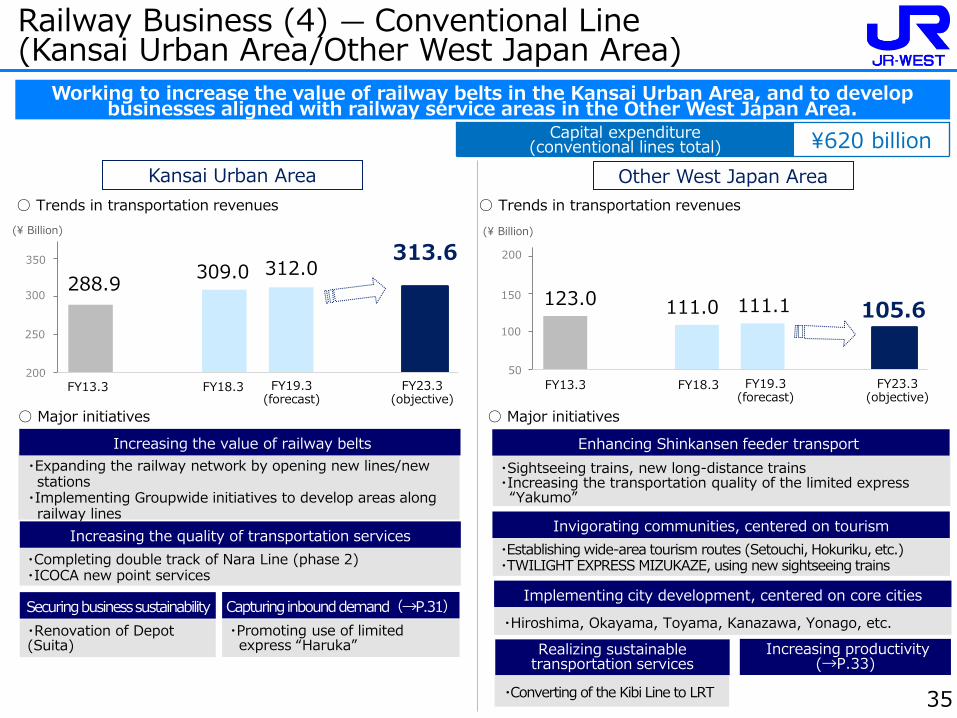
Railway Business (4) — Conventional Line (Kansai Urban Area/Other West Japan Area)
Increasing the quality of transportation services
Increasing the value of railway belts
Kansai Urban Area
Invigorating communities, centered on tourism
・Establishing wide-area tourism routes (Setouchi, Hokuriku, etc.) ・TWILIGHT EXPRESS MIZUKAZE, using new sightseeing trains
Implementing city development, centered on core cities
Realizing sustainable transportation services
・Hiroshima, Okayama, Toyama, Kanazawa, Yonago, etc.
・Completing double track of Nara Line (phase 2) ・ICOCA new point services
Other West Japan Area
35
Working to increase the value of railway belts in the Kansai Urban Area, and to develop businesses aligned with railway service areas in the Other West Japan Area.
○ Major initiatives ○ Major initiatives
(¥ Billion)
Securing business sustainability
・Renovation of Depot (Suita)
313.6
105.6
(目標) (目標)
Capturing inbound demand(→P.31)
・Promoting use of limited express “Haruka” Increasing productivity
(→P.33)
Enhancing Shinkansen feeder transport
・Sightseeing trains, new long-distance trains ・Increasing the transportation quality of the limited express “Yakumo”
・Converting of the Kibi Line to LRT
Capital expenditure (conventional lines total) ¥620 billion
(予想) (予想)
○ Trends in transportation revenues
(¥ Billion)
350
300
250
200
288.9 309.0 312.0
FY18.3 FY23.3 (objective)
FY13.3 FY19.3 (forecast)
FY18.3 FY23.3 (objective)
FY13.3 FY19.3 (forecast)
200
150
100
50
123.0 111.0 111.1
○ Trends in transportation revenues

Railway Business (5) — Operating Expenses (Non-Consolidated)
Ongoing gradual increase. Excluding non-recurring factors and external factors, slight increase. To be utilized in measures to address decrease in employees and to increase revenue.
36
FY18.3 FY23.3
(¥851.0 billion)
¥831.9
billion
-¥18.0 billion
+¥8.0 billion
Decrease in the number of
employees
Securing business sustainability ・Enhancing
safety, etc.
・Investing in human resources
Increasing productivity ・ Systemati-
zation, etc.
・ R&D
External environment Fuel cost increase
Hokuriku Shinkansen opening preparation
expenses *FY2023/3, non-recurring
factor
+¥8.0 billion
+¥5.0 billion
+¥8.0 billion
+¥11.0 billion*
¥843.0
billion*
* Excluding opening preparation expenses related to the Hokuriku Shinkansen Tsuruga extension, which will be a non-recurring factor in FY23.3.
(+¥19.0 billion)
Addressing decrease in employees
+¥14.5 billion
Measures to increase revenue ・Transportation improvement
・Internet reservations
-¥6.5 billion
Other
(forecast)
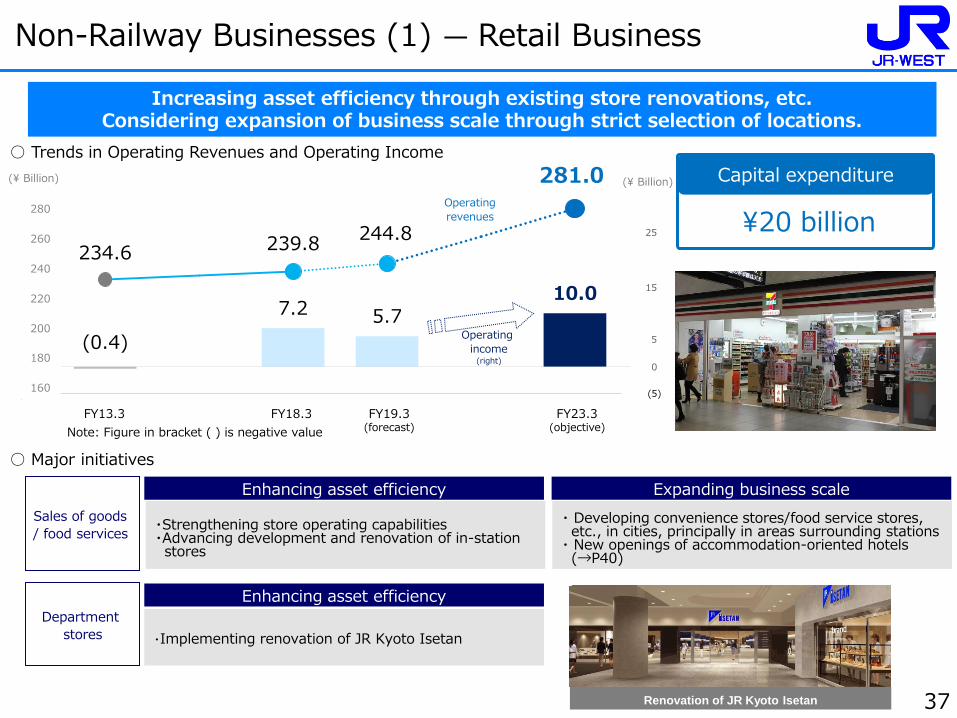
・Strengthening store operating capabilities ・Advancing development and renovation of in-station stores
(0.4)
7.2 5.7 10.0
234.6 239.8 244.8
▲ 50
50
150
250
350
1,600
1,800
2,000
2,200
2,400
2,600
2,800
3,000
13.3期 18.3期 19.3期 23.3期
Non-Railway Businesses (1) — Retail Business
Sales of goods
/ food services ・ Developing convenience stores/food service stores, etc., in cities, principally in areas surrounding stations
・ New openings of accommodation-oriented hotels (→P40)
37
Increasing asset efficiency through existing store renovations, etc. Considering expansion of business scale through strict selection of locations.
Capital expenditure
¥20 billion
○ Trends in Operating Revenues and Operating Income
(¥ Billion)
Operating
revenues
Operating
income (right)
○ Major initiatives
(¥ Billion) 281.0
0
5
15
25
Department
stores
Expanding business scale Enhancing asset efficiency
・Implementing renovation of JR Kyoto Isetan
Enhancing asset efficiency
Renovation of JR Kyoto Isetan
(objective) (予想)
280
260
240
220
200
180
160 (5)
FY13.3 FY18.3 FY19.3 (forecast)
FY23.3 (objective) Note: Figure in bracket ( ) is negative value

Non-Railway Businesses (2-1) — Real Estate Business
Real estate lease and sale
(→P.39)
・ Implementing development/renovations with consideration for local conditions (strategic stations/regional cities, etc.)
・Increasing efficiency by standardizing systems and implementing low-cost operations at each shopping center
28.0
35.7 33.4
41.5 90.9
139.6 147.8
200
300
400
500
600
300
500
700
900
1,100
1,300
1,500
1,700
13.3期 18.3期 19.3期 23.3期
38
Capital expenditure
¥260 billion
○ Trends in Operating Revenues and Operating Income
Growth driver following the Shinkansen. Increasing asset efficiency, expanding business scale, investing management resources from long-term viewpoint.
Operating
revenues
Operating
income
(right)
○ Major initiatives
Implementing city development starting from stations
(¥ Billion)
168.5 (¥ Billion)
Shopping centers
Expanding business scale
Enhancing asset efficiency
Expanding SUITA GREEN PLACE (目標) (予想)
FY19.3 (forecast)
FY23.3 (objective)
FY18.3 FY13.3
50
40
30
20
150
130
110
90
70
50
30

Opening: Spring 2019 Floor space: Approx. 11,000m2
Uses: Hotels, commercial facilities ※Joint project
Fukushima-ku 5/7 joint development
Non-Railway Businesses (2-2) — Real Estate Business (Lease and Sale)
Sale
35.0
Lease
54.7
FY18.3 results
FY23.3 objectives
(¥ billion)
Implementing development initiatives, centered on railway service area but also including areas outside of railway service area. Maximizing value of railway service area by leveraging
accumulated know-how through expansion of business opportunities.
Sale
49.9
Lease
43.1
78.1
104.7 ○ Trends in Operating Revenues
Osaka Kita NK
Building
Opening: Jun, 2018 Floor space: Approx. 14,000m2
Use: Hotel, etc.
39
・Advancing plans for the Big Three Projects
(Osaka, Sannomiya, and Hiroshima) ・Advancing development initiatives at stations and areas surrounding stations
Implementing city development
starting from stations
Expanding business scale
(areas outside of railway service
area)
・Expanding initiatives in growth markets, such as Tokyo metropolitan area, etc.
Maximizing regional value/railway belt
value in western Japan area
Maya City STATION GATE
Delivery planned for March 2019 Number of units: 175 ※Joint project
The Terrace
Totsuka Grand
Terminal Delivery planned for September 2019 Number of units: 118 ※Joint project
J.GRAN City Tsukamoto
Delivery planned for March 2020 Number of units: 312
VIERRA Kishibe Kento
Opening: Fall 2018 Floor space: Approx. 27,000m2
Uses: Clinics, hotels, etc.
Leveraging accumulated know-how through expansion of business opportunities
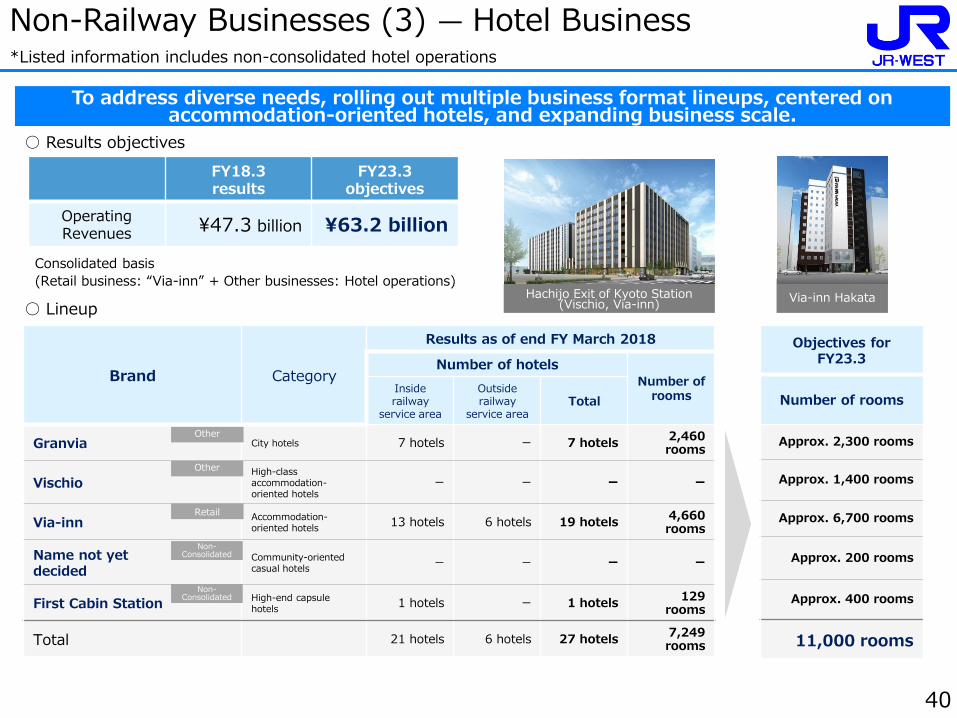
Non-Railway Businesses (3) — Hotel Business *Listed information includes non-consolidated hotel operations
FY18.3 results
FY23.3 objectives
Operating Revenues ¥47.3 billion ¥63.2 billion
Brand Category
Results as of end FY March 2018
Number of hotels Number of
rooms Inside railway
service area
Outside railway
service area Total
Granvia City hotels 7 hotels ー 7 hotels 2,460 rooms
Vischio High-class accommodation-oriented hotels
ー ー ー ー
Via-inn Accommodation-oriented hotels
13 hotels 6 hotels 19 hotels 4,660 rooms
Name not yet decided
Community-oriented casual hotels
ー ー ー ー
First Cabin Station High-end capsule hotels
1 hotels ー 1 hotels 129
rooms
Total 21 hotels 6 hotels 27 hotels 7,249 rooms
To address diverse needs, rolling out multiple business format lineups, centered on accommodation-oriented hotels, and expanding business scale.
○ Results objectives
○ Lineup
Consolidated basis
(Retail business: “Via-inn” + Other businesses: Hotel operations)
Objectives for FY23.3
Number of rooms
Approx. 2,300 rooms
Approx. 1,400 rooms
Approx. 6,700 rooms
Approx. 200 rooms
Approx. 400 rooms
11,000 rooms
40
Other
Other
Retail
Non- Consolidated
Hachijo Exit of Kyoto Station (Vischio, Via-inn)
Via-inn Hakata
Non- Consolidated

ESG Initiatives
• Global environment - Advancing the establishment of
environmentally-friendly stations, etc.
- Realizing further progress in railway energy-saving and resource conservation
Safety(→P.32) • Human resources
and motivation - Working style
reforms - Advancing diversity
• Customer satisfaction - Implementing initiatives for safe
and reliable transportation - Enhancing provision of
information about transportation disruptions
- Offering appropriate, easy-to-understand guidance services
• Human rights - Responding to human
rights issues, which are becoming more diverse and complex
Establishing priority fields, implementing initiatives. Aiming to fulfill our responsibilities as a member of society and to achieve sustained growth.
• Governance - Establishing and operating framework that reflects consideration for the purpose of Corporate Governance Code
- Enhancing two-way communication with stakeholders
• Risk management - Incorporating risk management
initiatives into management system - Recognizing and improving issues
with our corporate culture
Transitioning group management system to in-house company system Creating
organizations
E (Environmental)
S (Social)
G (Governance)
41
• Coexisting with communities - Implementing city development
initiatives in collaboration with local communities
- Realizing safe, sustainable railway/transportation services
- Creating new value by leveraging regional resources

Financial Strategies
Operating cash flow
Capital expenditure
(→P.43)
Returns to shareholders
(→P.44)
Dividends
Acquisition of treasury stock
【Priority ranking for uses of cash】
① Highest priority on safety/growth investment ・ Investing in safety, which is the foundation of
management ・ Implementing growth investment to increase corporate
value over the long term ・ Investing to increase business sustainability
② Shareholder return ・ Balancing uses of cash ・ Allocating free cash flow to shareholder return
42
Debt reduction
Clarifying priority ranking for uses of cash. Considering balance between investment and shareholder returns, as well cost of capital.
* Balance of cash and deposits: Generally maintaining current level
Increasing cash generating ability
③ Basically, we will not implement debt reduction.
・ Considering the procurement of new debt for additional investment, while maintaining corporate credit ratings

Capital expenditure, etc.
(Breakdown by segment) * Amount of increase/decrease
excludes equity investment
Transportation
Operations
¥940 billion
(+¥150 billion)
Retail business
Other
Real estate business
¥260 billion
(+¥130 billion)
Strengthening investment in safety, which is the foundation of management, as well as investment in initiatives contributing to sustained growth.
43
¥20 billion (-¥5 billion)
¥50 billion (+¥5 billion)
Equity investment
¥130 billion
Medium-Term Management Plan 2022
Capex for growth
¥460 billion
Medium-Term Management
Plan 2017
¥1,120 billion
Capex for growth
¥280 billion
Capex for maintenance and
upgrades
¥710 billion
Safety capex ¥490 billion
【Investment details】
Capex for maintenance and upgrades
¥810 billion
Safety capex
¥530 billion
(+¥40 billion)
¥1,270 billion (+¥150 billion)
Securing business sustainability
Enhancing safety
Increasing railway competitiveness ・ Additional rolling stock ・ Expansion of ICOCA area ・ Promoting Internet reservations
Expanding businesses in which we have strengths ・ Real estate lease
and sale (strategic stations, areas outside of areas along railway lines, areas outside of railway service area)
・ Hotel business (new openings)
Increasing asset efficiency ・ Shopping center /
department store renovations
・ Strengthening operating capabilities for SEJ franchise stores, etc.
Increasing productivity
・ Maintenance system change
・ Revising services/facilities
Upfront investment in large-scale projects ・ Hokuriku Shinkansen
Tsuruga extension ・ Umekita (Osaka)
underground station ・ Developing Sannomiya,
Hiroshima, etc.
¥150 billion ¥100 billion
・Renovating depots
Capital expenditure from a long-term viewpoint
Updating aged equipment
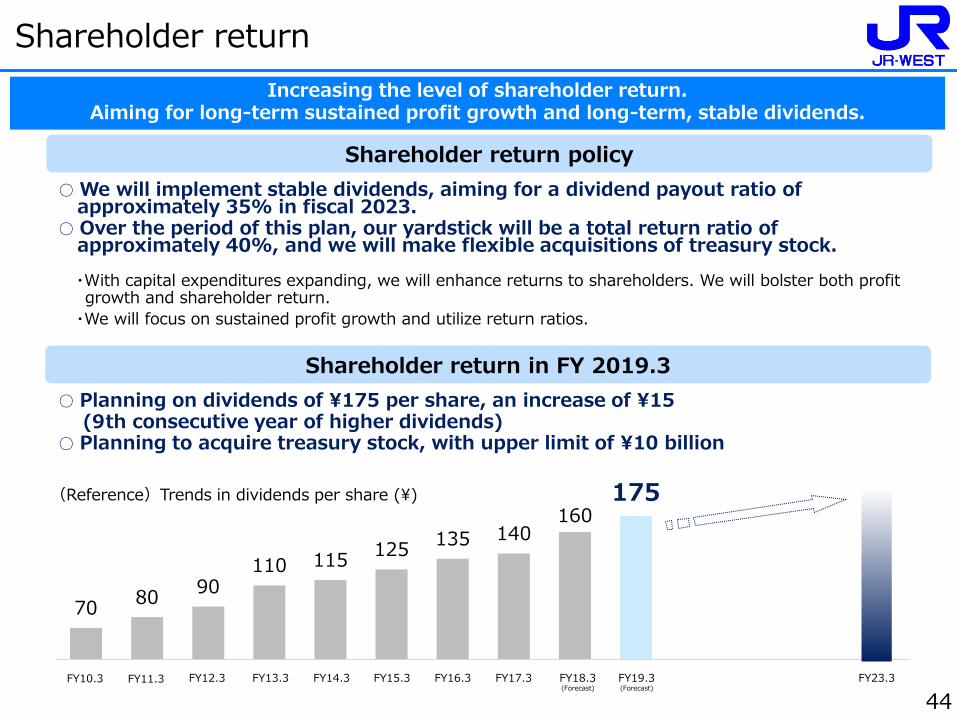
70 80
90 110 115
125 135 140
160 175
10.3期 11.3期 12.3期 13.3期 14.3期 15.3期 16.3期 17.3期 18.3期 19.3期 20.3期 21.3期 22.3期 23.3期
Shareholder return
○ We will implement stable dividends, aiming for a dividend payout ratio of approximately 35% in fiscal 2023.
○ Over the period of this plan, our yardstick will be a total return ratio of approximately 40%, and we will make flexible acquisitions of treasury stock.
Shareholder return in FY 2019.3
Shareholder return policy
(予定) (予定)
44
Increasing the level of shareholder return. Aiming for long-term sustained profit growth and long-term, stable dividends.
・With capital expenditures expanding, we will enhance returns to shareholders. We will bolster both profit growth and shareholder return.
・We will focus on sustained profit growth and utilize return ratios.
○ Planning on dividends of ¥175 per share, an increase of ¥15 (9th consecutive year of higher dividends) ○ Planning to acquire treasury stock, with upper limit of ¥10 billion
(Reference)Trends in dividends per share (¥)
FY10.3 FY11.3 FY12.3 FY13.3 FY14.3 FY15.3 FY16.3 FY17.3 FY18.3 (Forecast)
FY19.3 (Forecast)
FY23.3

【Reference】 Results objectives (Consolidated)
Results for FY2018.3 Objectives for FY2023.3 Increase/Decrease
Operating Revenues ¥1,500.4 billion ¥1630.0 billion +¥129.5 billion
Transportation ¥950.8 billion ¥977.5 billion +¥26.6 billion
Retail business ¥239.8 billion ¥281.0 billion +¥41.1 billion
Real estate business
¥139.6 billion ¥168.5 billion +¥28.8 billion
Other ¥170.0 billion ¥203.0 billion +¥32.9 billion
Operating Income ¥191.3 billion ¥210.0 billion +¥18.6 billion
Transportation ¥130.3 billion ¥139.5 billion +¥9.1 billion
Retail business ¥7.2 billion ¥10.0 billion +¥2.7 billion
Real estate business
¥35.7 billion ¥41.5 billion +¥5.7 billion
Other ¥19.9 billion ¥23.0 billion +¥3.0 billion
Recurring Profit ¥177.7 billion ¥197.0 billion +¥19.2 billion
Profit attributable to owners of parent
¥110.4 billion ¥128.0 billion +¥17.5 billion
EBITDA* ¥356.1 billion ¥400.0 billion +¥43.8 billion
ROA 6.3% Mid-6% range ー
ROE 11.3% Approx. 10% ー
Transportation Revenues
¥867.8 billion ¥890.0 billion +¥22.1 billion
*EBITDA = Operating Income+Depreciation+Amortization of goodwill 45
【¥218.0 billion】
【¥205.0 billion】
【¥134.0 billion】
【¥408.0 billion】
Figures in 【 】exclude Hokuriku Shinkansen opening preparation expenses
【+¥26.6 billion】
【+¥27.2 billion】
【+¥23.5 billion】
【+¥51.8 billion】

Cautionary Statement Regarding Forward-looking Statements
This presentation contains forward-looking statements that are based on JR-West’s current expectations,
assumptions, estimates and projections about its business, industry, and capital markets around the world.
These forward-looking statements are subject to various risks and uncertainties. Generally, these forward-looking statements can be identified by the use of forward-looking terminology such as “may”, “will”, “expect”, “anticipate”, “plan” or similar words. These statements discuss future expectations, identify strategies, contain projections of results of operations or of JR-West’s financial condition, or state other forward-looking information.
Known or unknown risks, uncertainties and other factors could cause the actual results to differ materially from
those contained in any forward-looking statements. JR-West cannot promise that the expectations expressed in these forwardlooking statements will turn out to be correct. JR-West’s actual results could be materially different from and worse than expectations.
Important risks and factors that could cause actual results to be materially different from expectations include, but are not limited to:
expenses, liability, loss of revenue or adverse publicity associated with property or casualty losses;
economic downturn, deflation and population decreases;
adverse changes in laws, regulations and government policies in Japan;
service improvements, price reductions and other strategies undertaken by competitors such as passenger railway
and airlines companies;
infectious disease outbreak and epidemic;
earthquake and other natural disaster risks; and
failure of computer telecommunications systems disrupting railway or other operations
All forward-looking statements in this release are made as of May 1, 2018 based on information available to JR-
West as of May 1, 2018 and JR-West does not undertake to update or revise any of its forward-looking statements or reflect future events or circumstances.
Compensation for damages caused by the accident on Fukuchiyama Line happened on April 25, 2005 is NOT
considered in this presentation.