MIT/WHOI 2003-08
Massachusetts Institute of Technology Woods Hole Oceanographic Institution
OFilC^
Joint Program in Oceanography/
Applied Ocean Science and Engineering
1930
DOCTORAL DISSERTATION
Fine-Grained Sedimentation on the Chenier Plain Coast and Inner Continental Shelf, Northern Gulf of Mexico
by
Amy Elizabeth Draut
June 2003
D5STRIBUH0N STATEMENT A Approved for Public Release
Distribution Unlimited m
MIT/WHOI
2003-08
Fine-Grained Sedimentation on tiie Chenier Plain Coast and Inner Continental Shelf, Northern Gulf of Mexico
by
Amy Elizabeth Draut
Massachusetts Institute of Technology Cambridge, Massachusetts 02139
and
Woods Hole Oceanographic Institution Woods Hole, Massachusetts 02543
June 2003
DOCTORAL DISSERTATION
Funding was provided by the Office of Naval Research grant N00014-98-0083, the Geological Society of America Foundation grant 6873-01, the Association of Petroleum Geologists (Kenneth H. Crandall
Memorial grant) and the Clare Boothe Luce Foundation.
Reproduction in whole or in part is permitted for any purpose of the United States Government. This thesis should be cited as: Amy Elizabeth Draut, 2003. Fine-Grained Sedimentation on the Chenier Plain Coast and
Inner Continental Shelf, Northern Gulf of Mexico. Ph.D. Thesis. MIT/WHOI, 2003-08.
Approved for publication; distribution unlimited.
Approved for Distribution:
Robert S. Detrick, Chair
Department of Geology and Geophysics
yu^ ^Av^^^yK ^^^>^ Paola Malanotte-Rizzoli » John W. Farrington MIT Director of Joint Program WHOI Dean of Graduate Studies
Fine-grained Sedimentation on the Chenier Plain Coast and Inner Continental Shelf, Northern Gulf of Mexico
by Amy Elizabeth Draut
B. S., Tufts University (Geological Sciences), 1997
Submitted in partial fulfillment of the requirements for the degree of Doctor of Philosophy
At the MASSACHUSETTS INSTITUTE OF TECHNOLOGY
And the WOODS HOLE OCEANOGRAPHIC INSTITUTION
June 2003 © 2003 Woods Hole Oceanographic Institution. All rights reserved.
OfP^Mt.. Author Joint Program in Oceanography, Massachusetts Institute of Technology and Woods Hole
Oceanographic Institution March 3 L 2003
C^rufiedby ...iMi.t:.KuM(l£ f \ ' Gail C. Kineke
ProfeWar of Geology & Geophysics, Boston College; Adjunct Scientist, WHOI Thesis Supervisor
ih.nk Certified by. Peter D. Clift
Associate Scientist, WHOI Research Supervisor
.i)..^.C.,..M£(L.4i,. Certified by Daniel C. McCorkle
Chair, Joint Committee for Marine Geology & Geophysics

Fine-grained Sedimentation on the Chenier Plain Coast and Inner Continental Shelf, Northern Gulf of Mexico
by
Amy Elizabeth Draut
Submitted in partial fulfillment of the requirements for the degree of Doctor of Philosophy at the Massachusetts Institute of Technology and the
Woods Hole Oceanographic Institution June, 2003
Abstract This thesis examines the evolution of a mud-dominated coastal sedimentary
system on multiple time scales. Fine-grained systems exhibit different properties and behavior from sandy coasts, and have received relatively little research attention to date. Evidence is presented for shoreline accretion under energetic conditions associated with storms and winter cold fronts. The identification of energetic events as agents of coastal accretion stands in contrast to the traditional assumption that low-energy conditions are required for deposition of fine-grained sediment. Mudflat accretion is proposed to depend upon the presence of an unconsolidated mud sea floor immediately offshore, proximity to a fluvial sediment source, onshore winds, which generate waves that resuspend sediment and advect it shoreward, and a low tidal range.
This study constrains the present influence of the Atchafalaya River on stratigraphic evolution of the inner continental shelf in western Louisiana. Sedimentary and acoustic data are used to identify the western limit of the distal Atchafalaya prodelta and to estimate the proportion of Atchafalaya River sediment that accumulates on the inner shelf seaward of Louisiana's chenier plain coast. The results demonstrate a link between sedimentary facies distribution on the inner shelf and patterns of accretion and
shoreline retreat on the chenier plain coast.
Thesis Supervisor: Dr. Gail C. Kineke Title: Associate Professor of Geology, Boston College; Adjunct Scientist, WHOI
Thesis Co-Supervisor: Dr. Peter D. Clift Title: Associate Scientist, WHOI
Thesis Committee: Dr. Gail C. Kineke, Associate Professor, Boston College; Adjunct Scientist, WHOI
Dr. Peter D. Clift, Associate Scientist, WHOI Dr. David C. Mohrig, Assistant Professor, MIT Dr. W. Rockwell Geyer, Senior Scientist and Department Chair, WHOI Dr. Robert L. Evans, Associate Scientist, WHOI (Committee Chair)
Acknowledgements
Many, many people have contributed to this thesis research. Gail Kineke provided the great majority of financial support through her grant from the Office of Naval Research (Grant NOOOl4-98-0083), in addition to her contribution by discussion and the exchange of ideas, all of which are greatly appreciated. I would like to thank the rest of my thesis committee also for their time in providing valuable feedback and insight: Peter
Clift, David Mohrig, Rocky Geyer, and Rob Evans. Many others assisted with field and laboratory work for this project. David
Velasco (Boston College) operated echo sounding equipment and assisted with core collection. Peter Schultz (BC) assisted with two cruises in 2001. Ryan Prime and Katie Hart (BC), Kristi Rotondo (Louisiana State University), Liz Gordon, Mary Cathey, and Miguel Goiii (University of South Carolina), Ryan Clark and John Galler (Tulane University) assisted with other aspects of field work. Ryan Prime and Katie Fernandez (BC) helped with grain size analyses. The captain and crew of the R/V Pelican are thanked for their work during the March 2001 cruise. The captain and crew of the R/V Eugenie are thanked for their work during cruises in June and July 2001. Mead Allison (Tulane) is thanked for extensive support, including provision of his x-ray unit and kasten corer, isotope analyses conducted in the Tulane gamma counting lab, and valuable
discussion and sharing of ideas. Oscar K. Huh, of Louisiana State University's Coastal Studies Institute, has
contributed many years' worth of aerial photographic data to this work. Dr. Hub's generosity and collaboration have been essential to this thesis. Photographs were reproduced by Kerry Lyle (LSU). Bruce Coffland of the NASA Ames Research Center graciously provided additional aerial photographs. Chris Moeller (University of Wisconsin) helped collect and interpret aerial surveys. Jay Grymes (LSU; Louisiana state climatologist) provided meteorological data and answered my many questions.
Many others have contributed their time and insight, notably: Sam Bentley (LSU), Miguel Gofii (USC), Shea Penland (University of New Orleans), Mike Bothner and Michael Casso (USGS), Ken Buesseler, Ed Sholkovitz, and John Anderson. Brad Moran (University of Rhode Island) conducted gamma counting analyses of my samples. Geochron Laboratories in Cambridge, MA performed radiocarbon analyses. Robert Morgan and Paul Palmieri at the US Army Corps of Engineers (New Orleans branch) have been helpful in answering questions, as have many others: John Wells (University of North Carolina), Carl Amos, Valeria Quaresma, Sergio Capucci, Michael Collins, and
Dorrick Stow (Southampton Oceanography Centre), Yoshiki Saito (Geological Survey of
Japan), and Greg Stone (LSU).
I am extremely grateful to Peter Clift for five years of mentoring during graduate
school. Peter's extraordinary dedication to students, and his contagious enthusiasm for
earth science, have had a profound impact on every aspect of my development as a
scientist. I have been very fortunate to spend the past five years working with him, and
hope to continue our productive collaboration studying arc-continent collision.
I would also like to thank other faculty members with whom I have worked on
various interesting projects, and whose advising and collaboration have made a positive
contribution to my time here: Maureen Raymo, Jerry McManus, Delia Oppo, Hans
Schouten, David Mohrig, Peter Kelemen, Greg Hirth, and Ken Sims. Susan Humphris
and Dan McCorkle are thanked for their valuable contribution as education coordinators.
Funding for my education has been coordinated by the Academic Programs
office, for which I am very thankful! Among my funding sources was a two-year
fellowship from the Clare Booth Luce Foundation. I have received research grants from
the Geological Society of America Foundation (Grant 6873-01) and the American
Association of Petroleum Geologists (Kenneth H. Crandall Memorial grant). I have
received travel grants and visited the Southampton Oceangraphy Centre thanks to the
efforts of Judy McDowell, John Farrington, and Paola Rizzoli. Julia Westwater, Marsha
Bissonette, and Ronni Schwartz have been extremely helpful in handling adminstration
for the Joint Program. Roberta Bennett-Calorio, Pam Foster, Diane Pencola, Maryanne
Ferreira, and Angle DiPietro are also thanked for their frequent help in logistical matters.
Joe Hankins and Kathy Keefe of MIT's Lindgren Library have been very helpful, as have
the staff of the MIT Inter-Library Borrowing Office, who have procured documents for
me from unbelievably obscure sources. I have benefited greatly from interaction and collaboration with many graduate
students. Although there are too many to name individually, I would like to acknowledge
in particular Bill, Mark, Simon, Amy M., John T., Kristy, Astri, Rhea, Jeff, Fernanda,
Mike, Chris, and Marin. Bill and Kyle, my office mates, have been very tolerant and
supportive during my thesis writing.
My husband, Jason, has been incredibly supportive and encouraging, for which I
am very, very thankful. Jason participated in several aspects of this work, helping with
occasional lab work and a field trip to Pennsylvania. My family (Mom, Dad, Carolyn)
and extended family are thanked for their encouragement. I'm grateful to many friends,
also, for their support (Nicole, Cori and Stew, Carrie, Rose, and my amazing Park Street
women).

To my father, Robert E. Gillette

Contents
Chapter 1. Introduction and Background
1.1. Motivation 15
1.1.1. Previous Work 17
1.2. Field Area 21
1.2.1. The Mississippi-Atchafalaya River System 21
1.2.2. Coastal Land Loss in Louisiana 24
1.2.3. The Chenier Plain Coast 26
1.2.4. Near-Shore Oceanic Conditions 27
1.3. Project Design 28
1.4. Outline of Chapters 2-A 30
Endnote 31
Figures 32
Chapter 2. Chenier Plain Coastal Morphology and Sedimentation
Abstract 35
2.1. Introduction: Chenier Plain Development 36
2.1.1. Definition and Geomorphology of the Chenier Plain 37
2.1.2. Recent Chenier Plain Accretion 38
2.1.3. Near-Shore Stratigraphic and Geomorphic Characterization 40
2.2. Methods of Modem Chenier Plain Characterization 41
2.2.1. Coastal Characterization Survey 42
2.2.2. Near-Shore Core Collection 42
2.2.3. Isotopic Analyses by Gamma Counting 43
2.2.4. Grain Size and Porosity Analyses 44
2.2.5. Aerial Photographic Surveys of the Freshwater Bayou Area 46
2.3. Results 46
2.3.1. Coastal Characterization: Patterns of Erosion and Accretion 47
2.3.2. Results of Isotopic Analyses 47
2.3.3. Sedimentary Facies 48
2.4. Discussion 52
2.4.1. Identification of Eroding and Accreting Shoreline 52
2.4.2. Regional Accretion and Erosion Patterns on the Chenier Plain 55
2.4.3. Effects of Freshwater Bayou Dredging on Mudflat Accretion 59
2.4.4. Development of the Freshwater Bayou Mudflat Since 1990 63
2.4.5. Facies Variability in the Near-Shore Environment 66
2.5. Conclusions 70
Acknowledgements 71
Endnote 71
Figures 72
Appendix 2-A. Core Collection Information 92
Appendix 2-B. Particle Size Analysis and Sample Preparation 93
Appendix 2-C. Sediment Properties of Near-Shore Cores 103
Chapter 3. Seasonal to Decadal-Scale Shoreline Evolution and Response
to Episodic Energetic Events
Abstract Ill
3.1. Introduction and Objectives 112
3.1.1. Previous Work 114
10
3.1.2. Available Resources 115
3.1.3. Storms and Frontal Systems on the Northern Gulf of Mexico Coast 116
3.1.4. The Synoptic Weather Type (SWT) Record 117
3.1.5. Definition of Frontal Conditions 118
3.2. Methods 121
3.2.1. Interpretation of Aerial Still Photographs (ASPs) and Video Surveys (VSs) 121
3.2.2. Interpretation of the Synoptic Weather Type Record 124
3.3. Results 125
3.3.1. Results of Aerial Survey Interpretation 125
3.3.2. Post-Hurricane Video Surveys 128
3.3.3. Interpretation of Meteorological and Fluvial Discharge Variations 130
3.3.3.1. Interval 1: Increasing FOR Activity, Increasing Fluvial Sediment Flux ...
131
3.3.3.2. Interval 2: Moderate Fluvial Sediment Flux, High Storm (GTD) Activity .
132
3.3.3.3. Interval 3: High FOR Activity, High Fluvial Sediment Flux 134
3.4. Discussion 137
3.4.1. Shoreline Migration on the Chenier Plain, 1987-2001 137
3.4.2. Natural Accretion on the Eastern Chenier Plain 142
3.4.2.1. Meteorological Conditions Driving Front Passage 142
3.4.2.2. Oceanic Conditions During Front Passage: Mechanism for Shoreward ...
Transport of Sediment 143
3.4.2.3. Mechanism for Sediment Deposition on Mudflats 144
3.4.2.4. Morphologic Response to Cold Front Passage 150
3.4.2.5. Hydrodynamics Contributing to Localized Accretion 154
3.4.3. Hurricane Impact 158
3.4.3.1. Historical Incidence of Hurricanes on the Chenier Plain 159
3.4.3.2. Impact of Hurricanes and Tropical Storms on Coastal Areas 161
11
3.4.3.2.1. Storm Centers West of the Chenier Plain 162
3.4.3.2.2. Storm Centers East of the Chenier Plain 164
3.4.3.3. Hurricane-Induced Mud Deposition 166
3.4.4. A Global Context for Mudflat Accretion 168
3.4.4.1. Response of Other Mud-Rich Shorelines to Energetic Conditions ... .169
3.4.4.1.1. Two Analogues for the Louisiana Chenier Plain 172
3.4.4.1.2. Factors Promoting Accretion Under Energetic Conditions 175
3.4.4.2. Other Causes of Mudflat Accretion 179
3.4.5. Preservation of Coastal Mud Deposits in the Geologic Record 180
3.5. Conclusions 182
Acknowledgements 184
Endnotes 185
Table 3-1. Yield Strength and Critical Thickness Calculations 187
Table 3-2. Comparison of Mud-Dominated Coasts 188
Figures 189
Appendix 3-A. Synoptic Weather Type (SWT) Summary 212
Appendix 3-B. Coastal Characterization Diagrams, 1984-2002 214
Appendix 3-C. The Saffir-Simpson Hurricane Scale 223
Chapter 4. Three-Dimensional Fades Variability of the Inner
Continental Shelf: Influence of the Atchafalaya River on Stratigraphic
Evolution
Abstract 225
4.1. Introduction and Objectives 226
4.1.1. Three-Dimensional Stratigraphy on the Chenier Plain Inner Shelf 226
4.1.2. Holocene Development of the Inner Shelf 228
12
4.1.2.1. The Delta Cycle 229
4.1.2.2. Vertical Stratigraphic Succession on the Delta Plain 231
4.1.3. Previous Sedimentary Studies on the Atchafalaya-Chenier Plain Shelf 232
4.2. Methods 234
4.2.1. Core Collection 235
4.2.2. X-radiograph Imaging and Sub-sampling of Core Sediment 235
4.2.3. Grain Size and Porosity Analyses 236
4.2.4. Isotope Activity Measurement 237
4.2.4.1. ^"*Pb and '"Cs by Gamma Analysis 237
4.2.4.2. '"C Age Analysis 238
4.2.5. Shallow Acoustic Imaging: Dual-Frequency Echo Sounder 239
4.3. Results 241
4.3.1. Sedimentary Facies 241
4.3.2. Results of Isotopic Analyses 245
4.3.2.1. ^'*^b and '"Cs Activity 246
4.3.2.2. '"C Dating of Shell Material 247
4.3.3. Shallow Acoustic Transects 248
4.4. Discussion 251
4.4.1. Modem Sediment Accumulation: Influence of the Atchafalaya River Sediment
Source on Inner Shelf Stratigraphy in the Chenier Plain Area 251
4.4.1.1. The Surface Mixed Layer 251
4.4.1.2. Decadal-scale Accumulation: Eastern Chenier Plain Inner Shelf 254
4.4.1.2.1. Two Models for ^'°Pb Geochronology 255
4.4.1.2.2. Application of Accumulation Models to Sites OF and 01 256
4.4.1.3. Western Extent of Atchafalaya Sediment Accumulation 260
4.4.1.3.1. Significance of the Chenier Plain Inner Shelf in the Atchafalaya
River Sedimentary System 265
4.4.2. Relict Sediment: Central Chenier Plain Inner Shelf 268
13
4.4.2.1. Age and Source of Relict Sediment 269
4.4.2.2. Development of Stratal Geometry 272
4.4.2.2.1. Dissected Clinoforms 273
4.4.2.2.2. Vertical stratification: Storm Horizons? 274
4.4.2.2.3. Preservation of Millimeter-scale Lamination 276
4.4.3. Future Development of the Chenier Plain 279
4.5. Conclusions 280
Acknowledgements 281
Table 4-1. '"C Ages of Shell Horizons 283
Table 4-2. Ages of Delta Lobe Activity 284
Figures 285
Appendix 4-A. Core Collection Information 316
Appendix 4-B. Sediment Properties of Cores 317
Appendix 4-C. Shore-Parallel Acoustic Transects 323
Appendix 4-D. Mass Balance Calculations 333
Chapter 5. Summary 337
References 343
14
Chapter 1. Introduction and Background
1.1. Motivation
The goal of this study is to improve constraints on the factors that govern coastal
geomorphic evolution and near-shore sedimentation along the mud-dominated shoreline
west of the Atchafalaya River outlet, Louisiana. The results presented directly address
several important "gaps in knowledge" perceived by the scientific community regarding
mud-dominated coasts: understanding erosion/accretion cycles on mudflats,
quantification of coastal erosion and muddy coast land loss over time, and "short and
long-term macroscale evolution of muddy coast topography due to episodic events
against a background of longer term environmental forcing and human influence" (Wang
et al., 2002a). To approach these research problems and to enhance the current
understanding of sedimentary processes on this coast, this study has examined temporal
and spatial evolution of coastal geomorphology, near-shore sedimentary facies, and
stratigraphic development on the inner continental shelf.
15
Mud-dominated shorelines are common worldwide, found on every continent
except Antarctica, in areas that receive an abundant and continual supply of fine-grained
sediment (Wang et al., 2002a). A muddy coast has been defined as
"a sedimentary-morphodynamic type characterized
primarily by fine-grained sedimentary deposits -
predominantly silts and clays - within a coastal
sedimentary environment. Such deposits tend to form rather
flat surfaces, and are often, but not exclusively, associated
with broad tidal flats."
- Scientific Committee on Oceanic Research,
Working Group No. 106 (Wang et al., 2002b).
Coastal morphology associated with mud-dominated coasts may include not only
broad tidal flats, but also enclosed sheltered bay deposits, estuarine coastal deposits, inner
deposits of lagoons enclosed by barrier islands, storm-surge (backshore) deposits, swamp
marshes and wetlands, mangrove forests and swamps, ice-deposited mud veneer (as in
the Arctic), and sub-littoral mud deposits (Wang et al., 2002b). The most extensive
muddy coastal regions are tropical mangrove swamps and temperate salt marshes
(Flemming, 2002), which comprise over 75% of the global shoreline between 25°N and
25"S (e.g., Chapman, 1974; see Flemming, 2002 for an extensive review of the global
distribution of muddy coasts).
Despite their common occurrence, mud-dominated shorelines have received little
research attention relative to sand-rich coastal environments. While the dynamics of
shoreline evolution on sandy beaches have been heavily studied (e.g., Inman and Filloux,
1960; Aubrey, 1979; Bruun, 1983; Niederoda et al., 1984; Wright and Short, 1984;
Clarke and Eliot, 1988; Eliot and Clarke, 1988; Wright et al., 1991), even fundamental
16
questions of sediment transport, geomorphic evolution, ecosystem development, and
human impact on muddy coasts are still in the nascent stages of investigation (e.g., Wells
and Coleman, 1981a; Rine and Ginsburg, 1985; Gorsline, 1985; Kirby, 2000; Wang et
al., 2002a). Inherent differences in sediment properties and behavior between sandy and
muddy coastal systems render models inapplicable to muddy coasts that effectively
predict evolution of sandy beaches (Kirby, 2000; 2002). Much additional research is
therefore needed to enhance understanding of mud-dominated shorelines.
1.1.1. Previous Work
The last several decades have seen substantial advancement in the study of
cohesive sediment behavior. Laboratory and theoretical studies by H. A. Einstein (1941),
R. B. Krone (1962, 1963) and members of the Delft Hydraulics Laboratory (1962)
showed that suspended sediment composed of silt and clay particles forms a non-
Newtonian (thixotropic) "fluid mud" (concentrations >10 g/1) and attains a yield strength;
at concentrations on the order of 100s g/1, the consistency of fluid mud resembles that of
yogurt. Subsequent laboratory investigations by Einstein and Krone (1962) and field and
laboratory studies by A. J. Mehta and others during the 1980s and 1990s have provided
valuable insight into the behavior of cohesive sediment and the development of fluid mud
layers in coastal and estuarine systems (e.g., Mehta, 1988; Ross and Mehta, 1989; Kranck
et al., 1993; Kineke et al., 1996; Lee and Mehta, 1997; Vinzon and Mehta, 1998; Li and
Mehta, 1998). Comprehensive reviews of studies concerned with cohesive sediment
properties and behavior have been compiled in volumes from the International
Conferences on Cohesive Sediment Transport (INTERCOM; Mehta, 1986, 1993; Mehta
17
and Hayter, 1989; Burt et al., 1997; McAnally and Mehta, 2001; Winterwerp and
Kranenburg, 2002).
Despite the twentieth-century proliferation of laboratory investigations devoted to
fine-grained sediment (Mehta et al., 1994), field research remained sparse, and limited to
estuarine systems, until the 1980s. Early studies by Postma (1961) in the Dutch Wadden
Sea, by Eisma and Van der Marel (1971) in Guiana, by Allen (1971) and Allen et al.
(1977) in the Gironde estuary of France, and by Kirby and Parker (1983) in the Severn
estuary, U.K., were among the first field investigations of mud-rich shorelines.
Additional studies of South American and Korean coasts were conducted in the early
1980s (e.g.. Wells and Coleman, 1981a, b; Wells, 1983; Rine and Ginsburg, 1985),
forming the basis for future work in the same regions.
Based on those studies and on contemporaneous investigations of the Louisiana
coast (Wells and Kemp, 1981; Wells and Roberts, 1981), wave attenuation over a mud-
rich sea bed was documented. This notable property of mud-rich coasts had long been
known to mariners, who take shelter in calmer muddy waters near shore during storms
(e.g., the western Louisiana "mud hole"). Low wave energy is a common feature of many
mud-dominated coastal environments (Wells, 1983; Kemp, 1986; Lee and Mehta, 1997).
The mechanism by which wave energy is attenuated over a fluid mud sea bed remains
uncertain and requires further investigation. Several possible explanations for dampening
of wave energy have been proposed: internal friction within a fluid mud layer, boundary-
layer friction at the sea floor, and dissipation of incoming wave energy into a fluid sea
bed by propagation of a wave within viscous mud (Wells, 1983; Lee and Mehta, 1997;
see Mehta et al. [1994] for a review of modeling studies of the interaction between waves
and fluid mud). Viscous dissipation into soft mud is believed to be a particularly
important process by which wave energy is attenuated; the viscosity of mud can be up to
four orders of magnitude greater than the viscosity of water (Lee and Mehta, 1997). As a
result of substantial wave attenuation near mud-rich coasts, incoming sinusoidal wave
forms are reduced to low-amplitude wave fronts that approximate solitary wave crests
and often do not break (e.g., Wells and Coleman, 1981a; Wells, 1983; Kemp, 1986). This
reduced wave energy is linked to reduced shear stress over the seabed, encouraging
deposition of suspended sediment carried by incoming waves (Wells and Roberts, 1981).
This pattern is thus opposite to that which occurs as waves shoal on sandy beaches, where
wave height and corresponding basal shear stress increase as waves approach the coast
and eventually break in shallow water.
The reduction of incoming wave energy due to an unconsolidated muddy sea bed
near shore has a profound effect on the potential impact of storms on a mud-dominated
coast, a topic explored in detail during this research. Field study of mudflats during the
1980s in Surinam (Rine and Ginsburg, 1985) and Louisiana by H. H. Roberts and O. K.
Huh led to the observation that large quantities of mud may be deposited at the shoreline
under energetic conditions (Roberts et al., 1987, 1989; Huh et al., 1991). This finding
highlights another fundamental difference between sand- and mud-dominated coasts:
while storms erode the shoreface of a sandy beach, storms on muddy coasts can, under
certain circumstances, be agents of coastal accretion (e.g., Wells and Roberts, 1981; Rine
and Ginsburg, 1985). This contradicts traditional assumptions that very low-energy
environmental conditions are required for settling and deposition of fine-grained
sediment.
The role of fluid mud in sediment transport and coastal morphology was
investigated in detail during the AmasSeds project (A multi-disciplinary Amazon shelf
19

Sediment study) conducted during the eariy 1990s. Results from that study documented
layers of fluid mud up to several meters thick on the middle continental shelf of Brazil,
and showed that most sediment released from the Amazon River is transported within
these bottommost layers and not in the surface plume (Kineke and Stemberg, 1995;
Kineke et al., 1996). In addition to providing a mechanism by which large volumes of
sediment are distributed on the shelf, fluid mud layers on the Amazon shelf were shown
to dictate the vertical extent of boundary layer turbulence on the shallow shelf, limit
mixing of saline and fresh water near the river mouth, and affect propagation of the tidal
wave (e.g., Trowbridge and Kineke, 1994; Allison et al., 1995a, b; Geyer, 1995; Kineke
etal., 1996).
The results of the AmasSeds project have provided the impetus for a five-year
study of the role of fluid mud in sediment transport and wave attenuation on the
Louisiana coast directed by Gail C. Kineke of Boston College, supported by the Office of
Naval Research. Southwestern Louisiana was chosen for this study because it shares
many similarities with other major mud-dominated shorelines of the world, including
proximity to a source of abundant fine-grained sediment, in this case the Atchafalaya
River. Five cruises were conducted with the RA^Pelican on the continental shelf west of
the Atchafalaya River outlet, in October 1997, March 1998, April 1998, February 1999,
and March 2001. These cruises allowed observations over a range of environmental
conditions including energetic conditions associated with cold front passage, variable
wave energy and river discharge, and therefore variable salinity and suspended sediment
concentration. Results from this work have demonstrated the ability of waves associated
with cold front passage to induce sediment resuspension on the inner shelf and net
transport toward shore (Kineke et al., 2001). The documentation of shoreward sediment
20
transport during cold fronts supports and explains post-front field observations of mudflat
deposition by Roberts et al. (1987) and Huh et al. (1991), and is a crucial step necessary
to address the evolution of mudflats described in this study. Additional results of the
Atchafalaya project, presented by Allison et al. (2000a), allowed quantification of
seasonal and long-term deposition rates on the inner shelf west of the Atchafalaya River,
information relevant to this study of inner shelf stratigraphic evolution.
Specific topics addressed by this thesis include the link between episodic
energetic events and coastal mud deposition, stratigraphic facies variability and
development along and across the inner shelf, and patterns of westward migration of
sediment from the Atchafalaya River. The knowledge gained from this thesis project
complements previous water-column observations (Kineke et al., 2001); together these
data sets are used here to assess the influence of a muddy substrate and associated
hydrodynamic processes on the development of coastal morphology and inner shelf
stratigraphy.
1.2. Field Area
1.2.1. The Mississippi-Atchafalaya River System
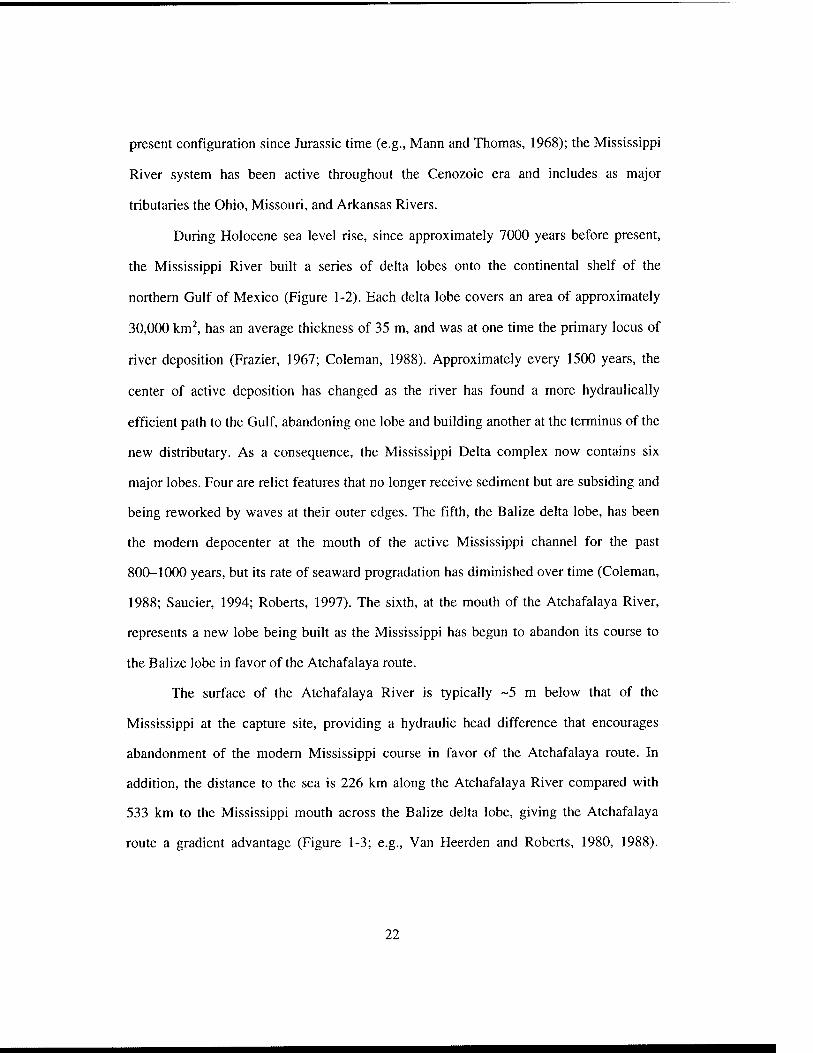
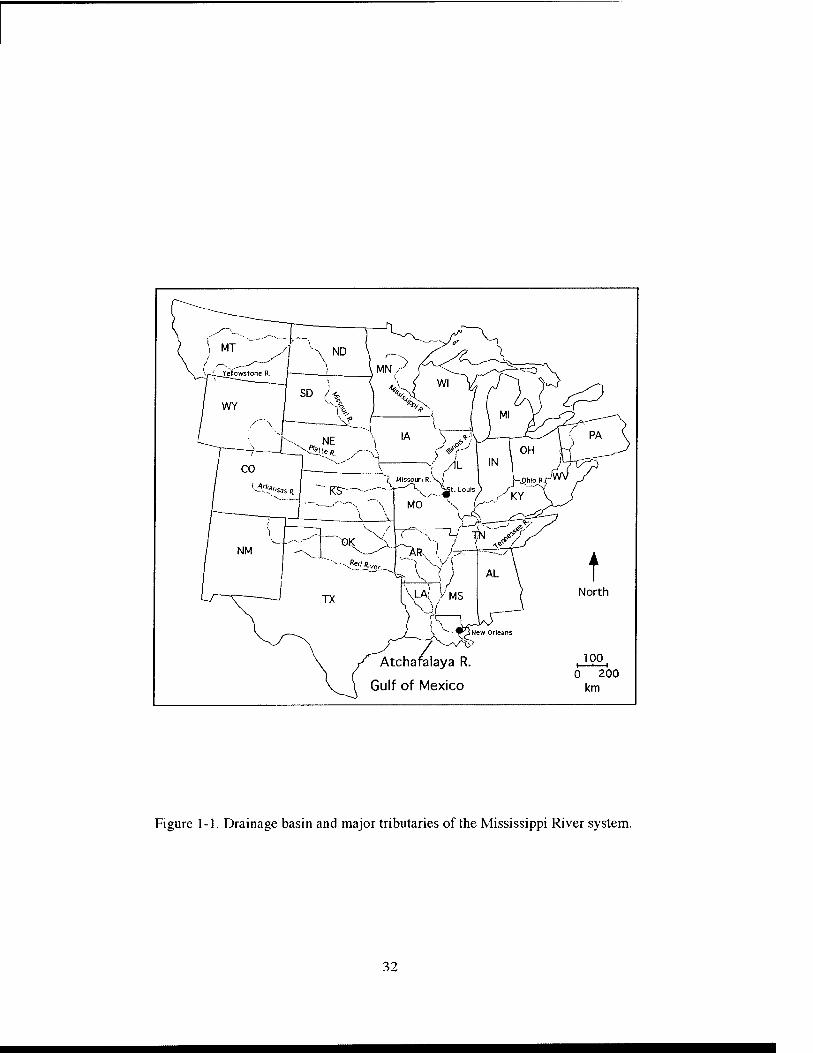
The Atchafalaya River is a distributary of the Mississippi River system that lies at
the extreme western edge of the vast Mississippi delta complex. The Mississippi is the
largest river in North America, with a drainage basin that covers 3,344,560 km^ spanning
the North American craton from the Rocky Mountains to the Appalachians and extending
just north of the Canadian border (Figure 1-1). The drainage basin has existed in its
21
present configuration since Jurassic time (e.g., Mann and Thomas, 1968); the Mississippi
River system has been active throughout the Cenozoic era and includes as major
tributaries the Ohio, Missouri, and Arkansas Rivers.
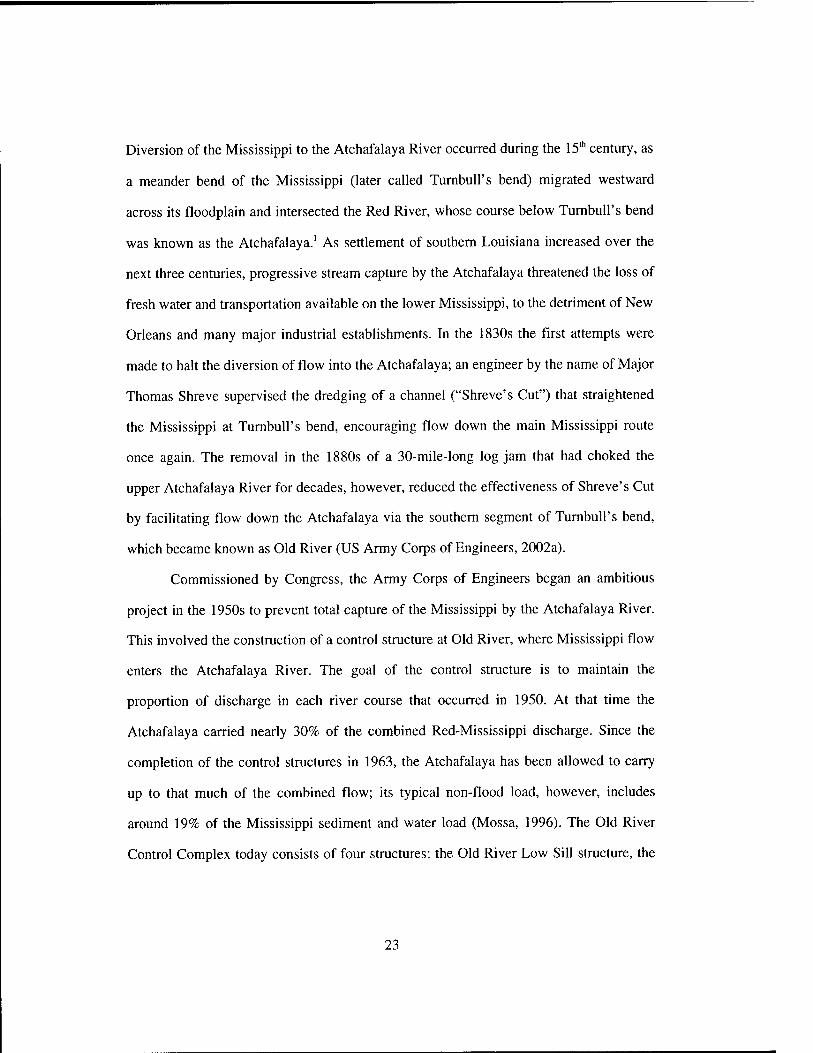
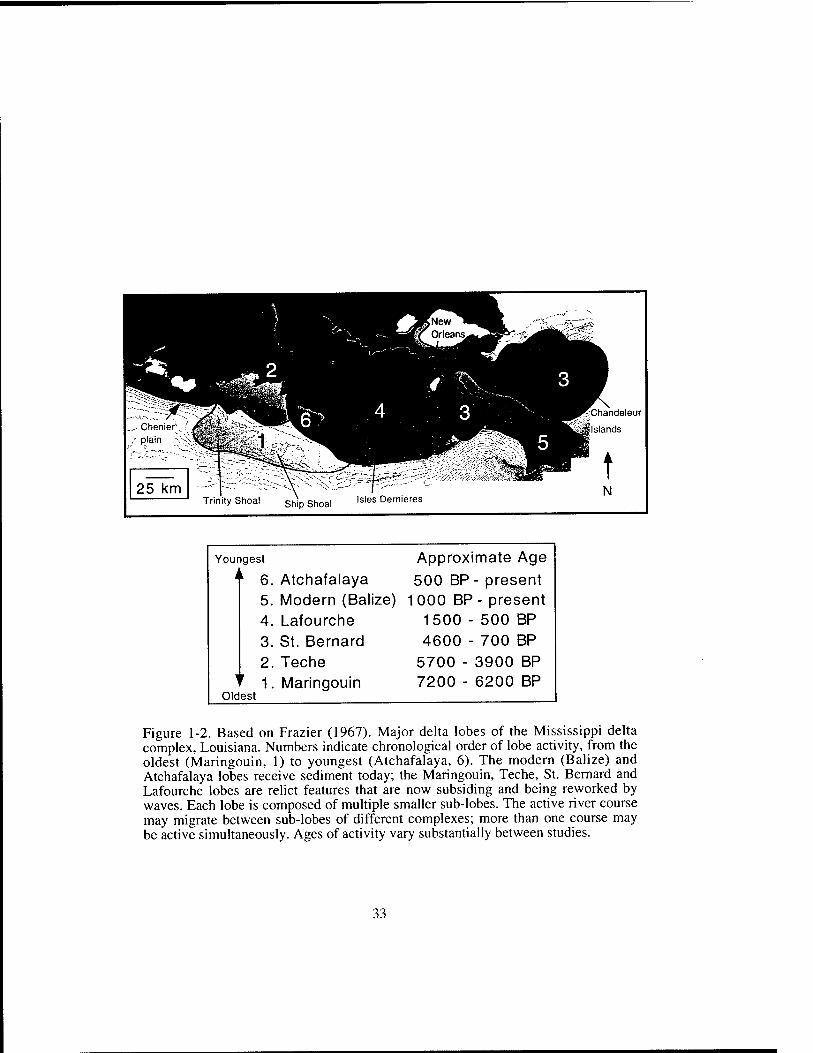
During Holocene sea level rise, since approximately 7000 years before present,
the Mississippi River built a series of delta lobes onto the continental shelf of the
northern Gulf of Mexico (Figure 1-2). Each delta lobe covers an area of approximately
30,000 km^ has an average thickness of 35 m, and vk'as at one time the primary locus of
river deposition (Frazier, 1967; Coleman, 1988). Approximately every 1500 years, the
center of active deposition has changed as the river has found a more hydraulically
efficient path to the Gulf, abandoning one lobe and building another at the terminus of the
new distributary. As a consequence, the Mississippi Delta complex now contains six
major lobes. Four are relict features that no longer receive sediment but are subsiding and
being reworked by waves at their outer edges. The fifth, the Balize delta lobe, has been
the modem depocenter at the mouth of the active Mississippi channel for the past
800-1000 years, but its rate of seaward progradation has diminished over time (Coleman,
1988; Saucier, 1994; Roberts, 1997). The sixth, at the mouth of the Atchafalaya River,
represents a new lobe being built as the Mississippi has begun to abandon its course to
the Balize lobe in favor of the Atchafalaya route.
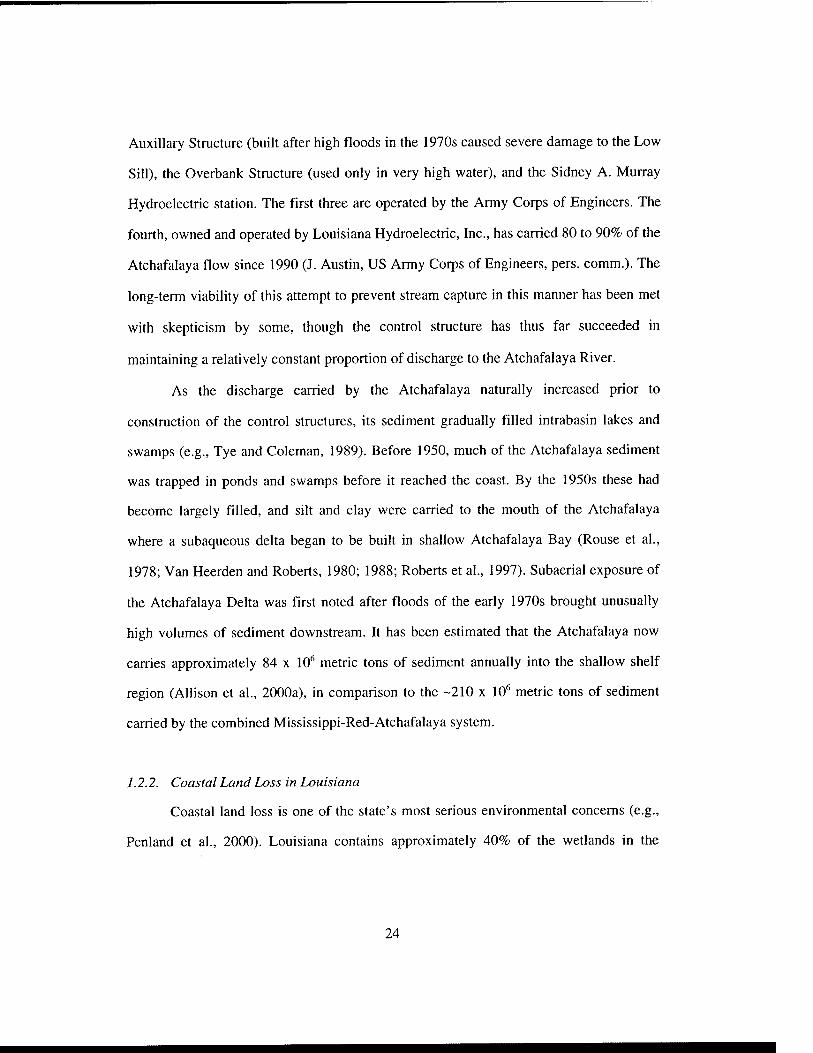
The surface of the Atchafalaya River is typically ~5 m below that of the
Mississippi at the capture site, providing a hydraulic head difference that encourages
abandonment of the modem Mississippi course in favor of the Atchafalaya route. In
addition, the distance to the sea is 226 km along the Atchafalaya River compared with
533 km to the Mississippi mouth across the Balize delta lobe, giving the Atchafalaya
route a gradient advantage (Figure 1-3; e.g.. Van Heerden and Roberts, 1980, 1988).
22
Diversion of the Mississippi to the Atchafalaya River occurred during the IS"" century, as
a meander bend of the Mississippi (later called Tumbull's bend) migrated westward
across its floodplain and intersected the Red River, whose course below Tumbull's bend
was known as the Atchafalaya.' As settlement of southern Louisiana increased over the
next three centuries, progressive stream capture by the Atchafalaya threatened the loss of
fresh water and transportation available on the lower Mississippi, to the detriment of New
Orleans and many major industrial establishments. In the 1830s the first attempts were
made to halt the diversion of flow into the Atchafalaya; an engineer by the name of Major
Thomas Shreve supervised the dredging of a channel ("Shreve's Cut") that straightened
the Mississippi at Tumbull's bend, encouraging flow down the main Mississippi route
once again. The removal in the 1880s of a 30-mile-long log jam that had choked the
upper Atchafalaya River for decades, however, reduced the effectiveness of Shreve's Cut
by facilitating flow down the Atchafalaya via the southem segment of Tumbull's bend,
which became known as Old River (US Army Corps of Engineers, 2002a).
Commissioned by Congress, the Army Corps of Engineers began an ambitious
project in the 1950s to prevent total capture of the Mississippi by the Atchafalaya River.
This involved the construction of a control structure at Old River, where Mississippi flow
enters the Atchafalaya River. The goal of the control structure is to maintain the
proportion of discharge in each river course that occurred in 1950. At that time the
Atchafalaya carried nearly 30% of the combined Red-Mississippi discharge. Since the
completion of the control stmctures in 1963, the Atchafalaya has been allowed to carry
up to that much of the combined flow; its typical non-flood load, however, includes
around 19% of the Mississippi sediment and water load (Mossa, 1996). The Old River
Control Complex today consists of four structures: the Old River Low Sill structure, the
23
Auxiliary Structure (built after high floods in the 1970s caused severe damage to the Low
Sill), the Overbank Structure (used only in very high water), and the Sidney A. Murray
Hydroelectric station. The first three are operated by the Army Corps of Engineers. The
fourth, owned and operated by Louisiana Hydroelectric, Inc., has carried 80 to 90% of the
Atchafalaya flow since 1990 (J. Austin, US Army Corps of Engineers, pers. comm.). The
long-term viability of this attempt to prevent stream capture in this manner has been met
with skepticism by some, though the control structure has thus far succeeded in
maintaining a relatively constant proportion of discharge to the Atchafalaya River.
As the discharge carried by the Atchafalaya naturally increased prior to
construction of the control structures, its sediment gradually filled intrabasin lakes and
swamps (e.g., Tye and Coleman, 1989). Before 1950, much of the Atchafalaya sediment
was trapped in ponds and swamps before it reached the coast. By the 1950s these had
become largely filled, and silt and clay were carried to the mouth of the Atchafalaya
where a subaqueous delta began to be built in shallow Atchafalaya Bay (Rouse et al.,
1978; Van Heerden and Roberts, 1980; 1988; Roberts et al., 1997). Subaerial exposure of
the Atchafalaya Delta was first noted after floods of the early 1970s brought unusually
high volumes of sediment downstream. It has been estimated that the Atchafalaya now
carries approximately 84 x 10^ metric tons of sediment annually into the shallow shelf
region (Allison et al., 2000a), in comparison to the -210 x 10*^ metric tons of sediment
carried by the combined Mississippi-Red-Atchafalaya system.
7.2.2. Coastal Land Loss in Louisiana
Coastal land loss is one of the state's most serious environmental concerns (e.g.,
Penland et al., 2000). Louisiana contains approximately 40% of the wetlands in the
24
United States, and an estimated 80% of the nation's annual loss of wetland area occurs in
Louisiana (over 100 km^ per year; Gagliano et al., 1981; Penland and Ramsey, 1990).
Louisiana's rates of coastal submergence are the highest in the United States, with an
average rate of shoreline retreat of 4.2 m/yr (Penland and Suter, 1989; Penland et al.,
1990; Westphal et al., 1991; Williams, 1994). In comparison, the average rate for the
Gulf of Mexico shoreline is 1.8 m/yr, the U. S. Atlantic coast erodes at an average rate of
0.8 m/yr, and the Pacific coast experiences no net shoreline change (Penland et al., 1990).
The most rapid land loss in Louisiana occurs on barrier islands that fringe the abandoned
delta lobes on the Mississippi delta plain.
Land loss occurs due to natural processes of eustatic sea level rise, delta switching
(which removes the sediment supply from old delta lobes), subsidence and compaction of
land (in particular, abandoned delta lobes), and is exacerbated by episodic storm events.
Human impact has also contributed to coastal land loss, by the construction of levees
along nearly all of the Mississippi River course and those of its distributary channels.
Levees block sediment from reaching coastal marshes by preventing overbank
sedimentation and crevasse splays that would occur naturally. Dredging of navigation
canals through wedands inhibits natural drainage of marshes, and subsurface withdrawal
of oil and natural gas contributes to subsidence of the land. Largely due to subsidence on
the low-gradient coastal plain, the rate of relative sea level rise on the Louisiana coast is
substantially greater than that of eustatic sea level rise (0.3 cm/yr); relative sea level rises
at 1.21 cm/yr on the Mississippi delta plain, and at 0.45 cm/yr on the chenier plain of
southwestern Louisiana, west of the delta complex (Penland and Suter, 1989).
25
1.2.3. The Chenier Plain Coast
Given the widespread and rapid coastal retreat occurring on most of Louisiana's
shoreline, the presence of accreting mudflats downdrift of the Atchafalaya River, on a
section of coast known as the southwestern Louisiana chenier plain, is unique. Mudflat
progradation has been observed in this region during several previous studies (Morgan et
al., 1953; Morgan and Larimore, 1957; Adams et al., 1978; Wells and Roberts, 1981) and
is a major focus of this thesis work.
The chenier plain shoreline begins approximately 150 km west of the Atchafalaya
River outlet and extends -200 km west (Figure 1-3). The chenier plain includes shore-
parallel ridges 1 to 3 m high composed of coarse sand and shells, alternating with low-
lying marshes that represent relict progradational mudflat zones (Gould and McFarlan,
1959; Byrne et al., 1959; Beall, 1968; Hoyt, 1969; Otvos and Price, 1979). This shoreline
has been determined by radiocarbon dating to have developed beginning approximately
3000 years ago (Gould and McFarlan, 1959) as mudflats prograded during times when
the Mississippi River delivered sediment to the western edge of the delta complex. It is
believed that as delta-switching processes shifted the sediment supply to a new lobe
farther east, eliminating contribution to mudflat growth on the chenier plain, earlier
deposits were reworked and the coarse lag sediment was concentrated into the ridges that
separate marsh zones. Mudflat progradation and chenier ridge development are therefore
linked to Holocene sea level history and also to delta switching events (e.g., Russell and
Howe, 1935; Gould and McFarlan, 1959; Otvos and Price, 1979; Penland and Suter,
1989;Augustinus, 1989).
26
Similar chenier plains are common in other mud-rich coastal environments. Their
presence has been documented, for example, on the Guyana-Surinam-French Guiana
coast of South America (Daniel, 1989; Prost, 1989, Augustinus et al., 1989), in England
(e.g., Greensmith and Tucker, 1969), along the Chinese coast (Xitao, 1986, 1989;
Qinshang et al., 1989; Wang and Ke, 1989; Saito et al., 2000), in western Africa
(Anthony, 1989), on the northern coast of Australia (Wright and Coleman, 1973; Short,
1989), on the North Island of New Zealand (Woodroffe et al., 1983), on marine and
inland sea coasts of the former Soviet Union (see Shuisky, 1989, for a summary) and on
the Mekong delta of southern Vietnam (e.g., Nguyen et al., 2000).
1.2.4. Near-Shore Oceanic Conditions
The coast and inner continental shelf of western Louisiana is a sedimentary
system generally exposed to low wave energy and low tidal forcing that experiences
episodic passage of higher-energy storms and cold fronts. The mean tidal range on the
chenier plain coast is 0.45 m, and tidal currents are therefore relatively weak (e.g., Adams
et al., 1982; Kemp, 1986). In shallow water of the northwestern Gulf of Mexico, a
prevailing westward coastal current occurs in response to Coriolis deflection of fresh-
water discharge from the Mississippi and Atchafalaya Rivers (e.g., Cochrane and Kelley,
1986; Geyer et al., in press). This coastal current flows across the western Louisiana
inner shelf at approximately 0.1 m/s within the 10 m isobath. In deeper water seaward of
the continental shelf, the larger Loop Current entrains the majority of Gulf water in
anticyclonic circulation. Wave energy on the southwestern Louisiana coast is typically
low in the absence of approaching cold fronts or tropical depression systems, with a mean
wave height of 1.5 m at 4.5-6 second periods (Wells and Roberts, 1981; Kemp, 1986).
27
The northern Gulf of Mexico coast experiences frequent energetic conditions
associated with cold fronts that occur every 4-7 days during fall, winter, and early spring
(e.g., Moeller et al., 1993). Occasional hurricanes and tropical storms affect this coast as
well. On average, Louisiana experiences tropical storms (with winds greater than 17.2
m/s) every 1.6 years. Hurricanes (with winds over 33.3 m/s) cross some part of the
Louisiana coast every 4.1 years (Penland and Suter, 1989).
1.3. Project Design
Field research, laboratory work, and analysis of aerial surveys were designed to
test two hypotheses. The first, based on work by Roberts, Wells, Huh, and others, holds
that sediment derived from the Atchafalaya River is responsible for causing widespread
accretion on the chenier plain, locally reversing the statewide trend of coastal erosion.
Wells and Roberts (1981) concluded, for instance, that due to the increase in discharge
from the Atchafalaya River "the erosional trend is reversing and the western half of the
state is receiving a new pulse of sediment". Characterization of geomorphic patterns,
from which erosion and accretion have been inferred, was accomplished through field
observations and analyses of aerial photographs with the intention of testing that
assumption.
The second hypothesis, initially based on field observations by Roberts and Huh
in the late 1980s, contends that extensive coastal accretion can occur under high-energy
conditions (Rine and Ginsburg, 1985; Roberts et al., 1987; Huh et al., 1991, 2001). As
discussed above, this intriguing idea contradicts traditional beliefs that storms are
28
exclusively erosive events on shorelines and that deposition of fine-grained sediment in a
coastal environment requires quiescent, low-energy conditions. The link between
energetic environmental conditions and the accumulation of mud onshore was studied
using aerial photographs, video surveys, and meteorological records combined with
water-column observations made by Gail Kineke.
In addition to testing the two hypotheses posed above, a further goal of this study
was to assess the influence of the Atchafalaya River on stratigraphic evolution of the
inner continental shelf adjacent to the chenier plain. The western extent of the modem
Atchafalaya prodelta, and subsequent variability of stratal geometry on the inner shelf,
have been investigated using sediment cores and acoustic data. Sedimentary facies
variability associated with westward migration of the Atchafalaya prodelta has been
evaluated and linked to patterns of coastal geomorphic evolution, from which general
inferences may be made regarding processes of fine-grained sediment dispersal in this
shallow marine environment.
The chapters to follow incorporate data from field observations and sediment
cores collected near shore during the March 2001 cruise of the RA^ Pelican (Kineke,
2001a). A later cruise in June 2001, using the RA^ Eugenie, was curtailed due to the
arrival of a tropical storm. Although no data could be collected offshore at that time, the
circumstances enabled observation of storm-induced flooding on coastal marshes,
relevant to subsequent investigations of storm impact on this shoreline. During a third
cruise, with the RA^ Eugenie in July 2001, sediment cores and shallow sub-surface
acoustic data were collected on the inner shelf that faces the same section of the shoreline
studied during the March 2001 field work. The effect of high-energy environmental
conditions on coastal morphology was investigated in detail using twenty years of
29
historical weather records and an extensive collection of aerial photographs and video
surveys maintained by Louisiana State University (LSU) and the Louisiana Geological
Survey (LGS), which were examined during a visit to LSU in the spring of 2002.
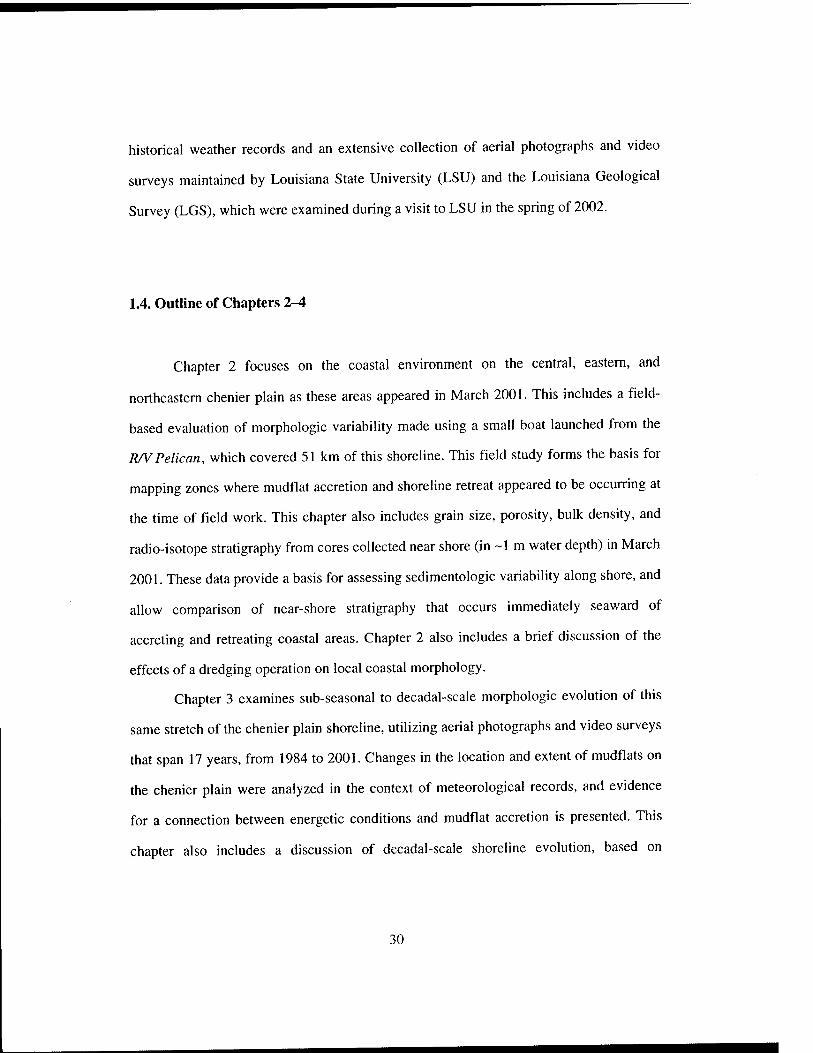
1.4. Outline of Chapters 2-4
Chapter 2 focuses on the coastal environment on the central, eastern, and
northeastern chenier plain as these areas appeared in March 2001. This includes a field-
based evaluation of morphologic variability made using a small boat launched from the
RA^Pelican, which covered 51 km of this shoreline. This field study forms the basis for
mapping zones where mudflat accretion and shoreline retreat appeared to be occurring at
the time of field work. This chapter also includes grain size, porosity, bulk density, and
radio-isotope stratigraphy from cores collected near shore (in ~1 m water depth) in March
2001. These data provide a basis for assessing sedimentologic variability along shore, and
allow comparison of near-shore stratigraphy that occurs immediately seaward of
accreting and retreating coastal areas. Chapter 2 also includes a brief discussion of the
effects of a dredging operation on local coastal morphology.
Chapter 3 examines sub-seasonal to decadal-scale morphologic evolution of this
same stretch of the chenier plain shoreline, utilizing aerial photographs and video surveys
that span 17 years, from 1984 to 2001. Changes in the location and extent of mudflats on
the chenier plain were analyzed in the context of meteorological records, and evidence
for a connection between energetic conditions and mudflat accretion is presented. This
chapter also includes a discussion of decadal-scale shoreline evolution, based on
30
measurements made from aerial photographs taken 14 years apart. A discussion of other
mud-dominated coasts is presented, in order to provide a global context for the response
to energetic events that has been observed on the Louisiana chenier plain. Chapter 3
concludes with a brief examination of the occurrence of prograding muddy shoreline
environments that have been identified in the geologic record.
In Chapter 4, the area of focus has been expanded to include the inner continental
shelf seaward of the central, eastern, and northeastern chenier plain. This section presents
strati graphic, isotopic, and X-radiograph data from cores collected along the 10 m isobath
during the RA^ Eugenie cruise in July 2001. Used in conjunction with acoustic reflection
data collected simultaneously from the same area using an echo sounder, these data
address factors that control stratal geometry and stratigraphic evolution. The results
presented have allowed identification of the westward limit of the Atchafalaya prodelta.
Stratigraphic development on the chenier plain inner shelf is tied to processes of
depocenter migration within the larger context of the Mississippi Delta system. A
connection is established between the distribution of sedimentary facies on the inner shelf
and the observed patterns of coastal geomorphic development discussed in Chapters 2
and 3. Chapter 4 concludes with a discussion of the expected future evolution of the
chenier plain sedimentary system.
Hacha falaia is Choctaw for river long.
31
Atchafalaya R.
Gulf of Mexico
North
0 200 km
Figure 1-1. Drainage basin and major tributaries of the Mississippi River system.
32
25 km
Youngest Approximate Age i ^ 6. Atchafalaya 500 BP - present
5. Modern (Balize) 1000 BP- present 4. Lafourche 1500 - 500 BP 3. St. Bernard 4600 - 700 BP 2. Teche 5700 - 3900 BP
Old ' 1. Maringouin est
7200 - 6200 BP
Figure 1-2. Based on Frazier (1967). Major delta lobes of the Mississippi delta complex, Louisiana. Numbers indicate chronological order of lobe activity, from the oldest (Maringouin, 1) to youngest (Atchafalaya, 6). The modern (Balize) and Atchafalaya lobes receive sediment today; the Maringouin, Teche, St. Bernard and Lafourche lobes are relict features that are now subsiding and being reworked by waves. Each lobe is composed of multiple smaller sub-lobes. The active river course may migrate between sub-lobes of different complexes; more than one course may be active simultaneously. Ages of activity vary substantially between studies.
33
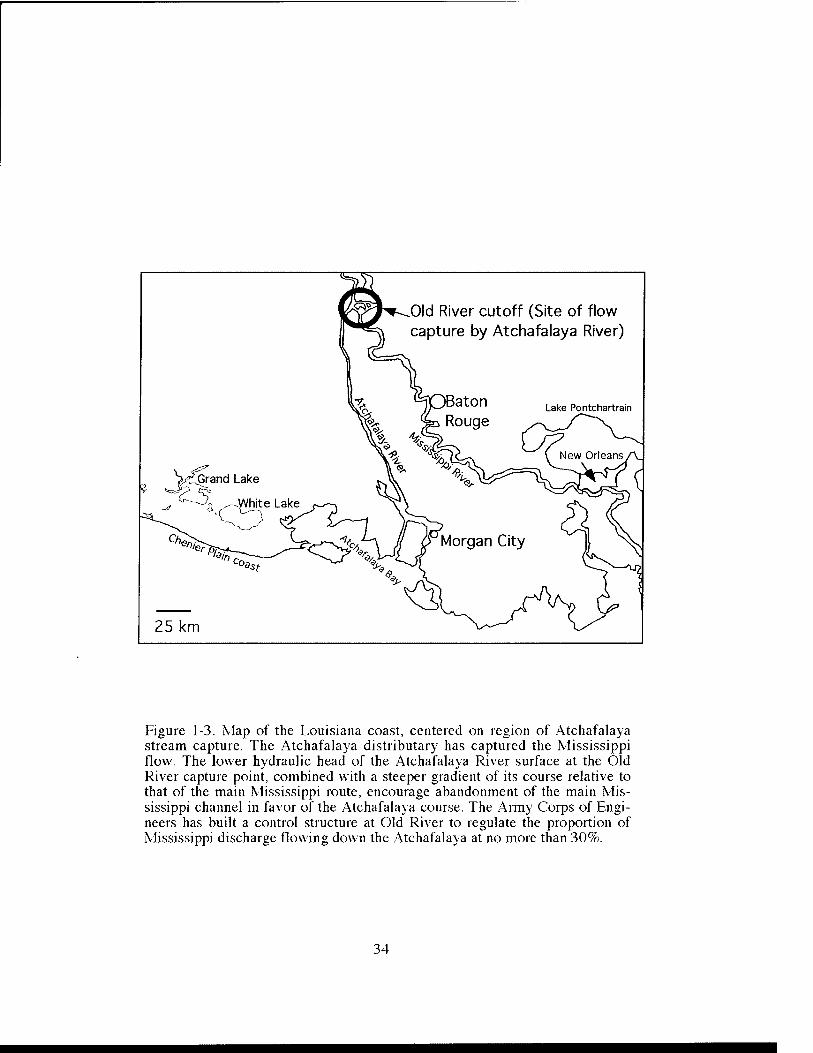
Figure 1-3. Map of the Louisiana coast, centered on region of Atchafalaya stream capture. The Atchafalaya distributary has captured the Mississippi flow. The lower hydraulic head of the Atchafalaya River surface at the Old River capture point, combined with a steeper gradient of its course relative to that of the main Mississippi route, encourage abandonment of the main Mis- sissippi channel in favor of the Atchafalaya course. The Army Corps of Engi- neers has built a control structure at Old River to regulate the proportion of Mississippi discharge flowing down the Atchafalaya at no more than 30%.
34
Chapter 2. Chenier Plain Coastal Morphology and Sedimentation
Abstract
Rates of coastal land loss in Louisiana are the highest in North America due to a
combination of rising sea level, subsidence, and reduced sediment supply as depocenters
migrate within the Mississippi Delta. Along Louisiana's chenier plain, downdrift of the
Atchafalaya River outlet, mudflat accretion has been observed, in contrast to the
statewide trend of coastal retreat. During this study, patterns of coastal morphology were
assessed along 51 km of the chenier plain. This survey identified alternating areas of
erosion (shoreline retreat) and mudflat accretion along the central, eastern, and
northeastern chenier plain (between Little Constance Lake and Chenier au Tigre).
Accretion and progradation were found to be more areally limited than previous studies
have indicated. Pronounced accretion is inferred on the eastern chenier plain,
immediately downdrift of the Freshwater Bayou shipping channel. Field observations,
examination of aerial photographs, and isotopic analyses of sediment samples from near-
shore cores indicate that accretion on the eastern chenier plain, fed by sediment discharge
from the Atchafalaya River and aided by winter cold front activity, is enhanced by
dredging activity in the Freshwater Bayou channel. Stratigraphic analyses of ten cores
35
collected near shore allow resolution of along-shore variability in sedimentary facies
along this coast.
2.1. Introduction: Chenier Plain Development
This study focuses on the chenier plain coast of southwestern Louisiana, a coastal
environment that experiences morphologic and sedimentary processes distinct from those
of the marshes and sandy barrier islands associated with the Mississippi Delta complex.
The chenier plain shoreline, a relatively linear section of the coast that receives fine-
grained sediment from the Atchafalaya River, was chosen for detailed assessment of
meter-scale variations in coastal morphology and near-shore sediment composition. The
goal of this study is to revisit earlier assessments of localized accretion and erosion along
this dynamic shoreline by conducting the first detailed field survey of chenier plain
erosion, accretion, and near-shore sedimentology made in the past two decades, and to
examine more closely a rapidly prograding zone identified downdrift of Freshwater
Bayou (Figure 2-1). In addition to evaluating natural sediment transport processes, this
study also assesses the local effects of dredging on coastal morphology of the Freshwater
Bayou area, using isotope profiles of sediment cores to identify dredged material that had
been recently deposited and reworked. The results of this near-shore sedimentary study
form the basis for the assessment of temporal evolution of shoreline morphology
addressed in Chapter 3, and for development of a regional sedimentary picture discussed
in Chapter 4.
36
2.1.1. Definition and Geomorphology of the Chenier Plain
The chenier plain coast, downdrift of the Atchafalaya River outlet, extends -200
km west from Chenier au Tigre (Figure 2-lb) into eastern Texas. This shoreline is
characterized by shore-parallel ridges up to 3 m high composed of relatively coarse sand
and shells, alternating with relict progradational mudflat zones (Gould and McFarlan,
1959; Byrne et al., 1959; Beall, 1968; Hoyt, 1969; Otvos and Price, 1979). Several of
these ridges are indicated in Figure 2-2. The term 'chenier' is derived from the Cajun-
French word for 'oak', the dominant trees and shrubs that have colonized the ridge crests.
The chenier plain developed during late Holocene sea level rise beginning approximately
3000 years before present (Gould and McFarlan, 1959) as mudflats prograded during
times when a major distributary of the Mississippi River was located at the western edge
of the large Mississippi Delta complex to provide a sediment source. It is believed that as
delta-switching processes shifted the Mississippi depocenter to the eastern part of the
delta, greatly reducing sediment supply to the chenier plain, earlier deposits were
reworked and the coarse lag sediment was concentrated into the 1-3 m high ridges now
apparent. Episodes of mudflat progradation and ridge development can thus be tied to
Holocene sea level history and also to delta lobe abandonment (e.g., Russell and Howe,
1935; Gould and McFarlan, 1959; Otvos and Price, 1979; Penland and Suter, 1989;
Augustinus, 1989; Kirby, 2000, 2002).
The mud deposits that separate five major sand-and-shell chenier ridges are
typically composed of clay and fine silt, fining upward and modified by later growth of
vegetation (Byrne et al., 1959; Beall, 1968). Such mudflats are believed to have been
built up largely by progressive accumulation of unconsolidated mud onshore during
seasonal cold fronts (e.g., Roberts et al., 1989) at times when these now inter-ridge
37
lowlands were exposed directly to the ocean; a lack of extensive bioturbation in modem-
day chenier plain mudflats further suggests rapid sediment deposition (Beall, 1968).
Today, continual growth of freshwater marsh vegetation covers these relict mudflat
deposits that lie between chenier ridges. A detailed summary of stratigraphic
classification on the chenier plain has been compiled by Penland and Suter (1989).
2.1.2. Recent Chenier Plain Accretion
Episodic mudflat accretion has been observed along the chenier plain coast since
the mid-twentieth century. A number of studies (e.g., Morgan et al., 1953; Morgan and
Larimore, 1957; Morgan, 1963; Adams et al., 1978; Wells and Kemp, 1981; Wells and
Roberts, 1981) have documented transient mudflat development there, and episodic
accretion on the chenier plain has been correlated with pulses of increased sediment
discharge from the Atchafalaya River (e.g., following subaerial delta emergence in the
1970s; Wells and Kemp, 1981). Accretion of fine-grained sediment on this coast has
often been noted to occur in discontinuous zones directly adjacent to areas experiencing
active shoreline retreat, and mudflat development is characteristically short-lived;
mudflats on the chenier plain are often ephemeral features that persist on time scales of
weeks to months (Wells and Kemp, 1981). In recent years the presence of an unusually
persistent zone of rapid mudflat accretion, active continuously since the late 1980s, has
been documented directly west of Freshwater Bayou on the eastern chenier plain (Roberts
et al., 1989; Huh et al., 2001).
The processes by which fine-grained sediment is deposited as mudflats along the
chenier plain, both in the modem environment and presumably during development of
relict mudflats that separate chenier ridges, are linked to unique physical properties of
38
concentrated fluid muds. Wells (1983) and Kemp (1986) noted the dampening effects of
an unconsolidated mud sea bed on coastal wave energy. The reduction of shear stress
associated with waves moving over a shallow muddy seabed has been proposed to
promote fine-grained sediment settling and deposition along this coast (Wells and
Roberts, 1981; Kemp, 1986), though processes of wave attenuation over a mud sea floor
are not yet considered to be thoroughly understood.
Deposition and mudflat growth on the chenier plain are aided significantly by
hydrographic conditions that accompany frequent winter cold fronts (e.g., Chuang and
Wiseman, 1983; Roberts et al., 1987, 1989; Moeller et al., 1993; Huh et al., 1991, 2001).
Remote sensing techniques (e.g., Moeller et al., 1993) indicate that the 20 to 40 cold
fronts that affect the Louisiana coast during fall, winter and early spring each year follow
a predictable pattern of wave set-up and set-down capable of transporting large quantities
of fine-grained sediment onshore. As a cold front approaches the coast from the
northwest, long-fetch southerly winds blow toward the advancing front. Southerly winds
generate waves that resuspend sediment, and cause water-level set-up along the coast that
can raise the sea surface elevation by 0.30 to 1.22 m (Boyd and Penland, 1981; Chuang
and Wiseman, 1983; Roberts et al., 1987, 1989; Penland and Suter, 1989). Wave set-up
brings water and suspended sediment onshore (Chapter 3). Rapid wave set-down then
accompanies post-frontal northerly winds, stranding large quantities of mud onshore as
water drains seaward and off of the mudflat. Field observations (e.g., Huh et al., 1991)
have shown that the resulting deposits consist of gel-like fluid mud that may desiccate
and harden into polygonal bricks up to 0.2 m thick that are believed to "armor" the coast
against future wave attack (Figure 2-3). Although substantial onshore deposition of mud
derived from the continental shelf can occur during major hurricanes (Morgan et al.,
39
1958; see Chapter 3), the cumulative effect of less powerful but more frequent cold fronts
is thought to have a greater impact on chenier plain morphology over time (e.g., Roberts
etal., 1989).
2.1.3. Near-Shore Stratigraphic and Geomorphic Characterization
To evaluate modem geomorphology and near-shore sedimentation on the
Louisiana chenier plain, a combination of km-scale field survey and individual site
analyses have been employed. Facies analyses of sediment cores allow detailed
characterization of the sediment that comprises the near-shore region of the chenier plain.
Stratigraphic characterization was accomplished during this study through grain size
analyses, facies description, and isotope geochemistry.
This study utilizes '^^Cs, an isotope with a 30-year half-life that was introduced to
the environment during testing of hydrogen bombs beginning in the 1950s, and ^'°Pb, a
naturally-occurring daughter product of "*U with a half-life of 22.3 years. '"Cs has been
almost entirely removed from the atmosphere by rainfall, and is now introduced to the
marine environment primarily via sediment that has been eroded from land and
discharged by rivers into the ocean (e.g.. Smith and Ellis, 1982). ^'°Pb in the marine
environment has several sources: delivery by fluvial discharge, fallout to surface water
following its production in the atmosphere from the decay of ^^^Rn gas, production in
seawater from its parent and grandparent isotopes, and production from ^^'^Ra in marine
sediment. The amount of ^'°Pb in sediment produced in situ by continual ^^'^Ra decay (via
^^^Rn, with a 3.8-day half-life) is referred to as the supported ^'°Pb level. Because the
half-life of ^^'^Ra is long (1622 years), supported ^'°Pb is produced in marine sediment by
^^'^Ra decay for thousands of years after its deposition and isolation from other ^'°Pb
40
sources. Unsupported, or excess, ^'°Pb, is that amount of ^'°Pb (in excess of the supported
level) that is present in fluvial sediment upon initial deposition, plus that which is
adsorbed from seawater by sediment. Supported values of ^'°Pb in a sediment sample can
be identified by measurement of ^'''Pb, an intermediate daughter product between ^^^Rn
and ^'°Pb (half-life 26.8 minutes) that is assumed to be in secular equilibrium with ^'Vb.
Levels of excess ^'°Pb, the difference between total and supported ^"¥b, may then be used
to evaluate sedimentation history. ^'°Pb and '"Cs have been used together in other near-
shore environments to estimate accumulation rates and deposition age of sediment (e.g.,
Duursma and Gross, 1971; Nittrouer, 1978; Nittrouer et al., 1979; Smith and Walton,
1980; Smith and Ellis, 1982; DeLaune et al., 1983; Buesseler and Benitez, 1994; Allison
et al., 1995a, b, 1998, 2000a; Jaeger and Nittrouer, 1995; Kuehl et al., 1995, 1997;
Sommerfield et al., 1995; Goodbred and Kuehl, 1998; Noller, 2000).
2.2. Methods of Modern Chenier Plain Characterization
Field observations, isotopic and sedimentological analyses of sediment cores, and
aerial photographic interpretation were used to assess patterns of erosion (shoreline
retreat) and accretion active along the chenier plain in March 2001. Understanding
sedimentary and geomorphic trends in the near-shore environment, based on these
analyses, forms the basis for further investigations of regional-scale facies evolution and
coastal response to energetic events.
41
2.2.1. Coastal Characterization Survey
Using a small boat launched from the RN Pelican during two weeks in March
2001, a coastal characterization survey was conducted along 51 km of the chenier plain
between Little Constance Lake and Chenier au Tigre (central, eastern, and northeastern
chenier plain; Figure 2-lb). This survey categorized sections of shoreline as accreting or
eroding based upon field observations of geomorphology, types and distributions of
sedimentary facies, and patterns of vegetation. The term "erosion" used in the context of
this study implies landward advance of the water line across backshore marsh and
associated submergence of that older marsh surface, and does not necessarily imply
scouring and advection of coastal sediment away from the present shoreline. Areas
experiencing erosion were identified by carbonate sand washover deposits encroaching
upon well-established backshore marsh shrubs near the shoreline, often underlain by a
partially submerged peat terrace that contained abundant stems and roots of older
vegetation. The peat terrace formed intermittent "mud cliffs" along the coast, as is
common in other erosion-dominated muddy shorelines (Kirby, 2000, 2002). Areas of
accretion and progradation were characterized by low-lying intertidal mudflats fronting
the coast, often containing juvenile colonies of living wedand grasses. Locations of all
field sites were verified using a Northstar^"^ Differential Global Positioning System
module.
2.2.2. Near-Shore Core Collection
Push cores were collected at the locations indicated in Figure 2-lb during field
work from the coastal vessel. All cores were sub-sampled on board the Pelican. Cores
42
from sites CSA, CSB, and CSD were collected in or immediately above the swash zone
at their respective locations, and sampled primarily peat material. All other cores were
obtained immediately offshore in a water depth of 1 m. Cores CSB and CSD were
collected in Plexiglas trays suitable for X-radiograph imaging; all other cores were
collected in PVC tubes. The Plexiglas trays, while useful in allowing X-ray images to be
made of the sediment, were too fragile for use in collecting long cores and were not
practical in offshore settings where low visibility in turbid water made core recovery
challenging. PVC is a much stronger material able to withstand stresses applied during
core recovery, but is impenetrable to X-rays. Detailed observations of stratigraphic
characteristics were made of all cores. Four of the near-shore cores were selected for
isotopic analysis of sediment; grain size analyses were made on six of the seven near-
shore cores collected. Detailed information on the locations and conditions of core
collection is listed in Appendix 2-A.
2.2.3. Isotopic Analyses by Gamma Counting
Gamma activity measurement provides a straightforward and efficient means of
establishing the radioactive isotope content in sediment (e.g., Gaggler et al., 1976). Each
isotope emits gamma radiation at a characteristic frequency associated with its decay.
Because detection by this method involves analysis of multiple gamma wave frequencies
simultaneously, the activities of all desired isotopes are assessed in one counting session.
Cores from stations CSF, CSI, CSJ, and CSC (in order from east to west) were selected
for isotopic analyses based upon their relative location and similar water depth. Core CSF
was obtained on the northeastern chenier plain opposite a section of shoreline that
appeared to be actively retreating. CSI and CSJ were located within a large mud bank
43
located immediately west of Freshwater Bayou on the eastern chenier plain, and CSC was
collected on the central chenier plain seaward of an area in which retreating and accreting
morphology alternated.
Sediment samples were dried at 50-60°C and homogenized prior to gamma
counting; between 7 and 30 g (dry mass) of sediment were analyzed in each sample.
Gamma activity analyses were performed on sediment samples from cores CSI, CSJ and
CSC at the Woods Hole Oceanographic Institution. Activity levels of '"Cs and ^'°Pb were
measured using net counts of the 661.6 and 46.5 keV peaks respectively; excess ^'°Pb
activity was calculated from independent measurement of ^'''Pb at 352 keV (Livingston
and Bowen, 1979; Joshi, 1987). Samples were analyzed on Canberra 2000 mm^ LEGe
planar germanium detectors for 24-48 hours (e.g., ^"^b error < +/- 3%). Efficiency
corrections were empirically determined for '^^Cs using Standard SCG-83 and for ^'°Pb
using a solid uranyl nitrate standard. Samples from core CSF were analyzed at Tulane
University using a Canberra LEGe closed-end coaxial well detector; efficiency
calibrations for this instrument were determined using the L\EA-300 Baltic Sea sediment
standard.
2.2.4. Grain Size and Porosity Analyses
Grain size and porosity data were collected from cores CSF, CSG, CSH, CSI,
CSJ, and CSC. To evaluate sediment porosity, 13-20 g of wet sediment were dried and
the subsequent dry weight measured. Porosity (n), the ratio of the void volume (volume
occupied by water) to total volume (see Lee and Chough, 1987), was calculated as
follows:
44
n=^^ ^-^P- (2.1)
where m„ and m^ are the mass of sediment and water, respectively, obtained from the
difference between dry and wet weight of the sediment, p^ is density of sediment (taken
to be 2650 kg/m\ the density of quartz), and p„ is the density of seawater (assumed to be
1010 kg/m^). Saturated bulk density (see Lee and Chough, 1987) was calculated using
volume fractions of water (porosity) and sediment by:
m V V Pw. = ^=-^P.+^P. (2-2)
where m, and V, are the total mass and total volume of the saturated bulk sample,
respectively.
Particle size analyses were made using 2-8 g (dry mass) of sediment per sample.
Sediment was disaggregated and homogenized using an ultrasonic probe and mechanical
stirring device to agitate a slurry of sediment in 0.1% sodium metaphosphate solution.
The sand fraction was separated using a 63 |a.m sieve (4.0 ((), the lower hmit of very fine
sand according to the Wentworth classification [e.g., Boggs, 1995]), dried, and weighed.
Grain size distribution within the silt-clay fraction (<63 |J.m) was analyzed using the
Micromeritics SediGraph 5100 particle size analyzer at Boston College. This instrument
uses the intensity of X-ray energy passing through the sample relative to that of a
baseline liquid (0.1% sodium metaphosphate solution) to evaluate particle size
distribution in the sample, assuming Stokes settling behavior for spherical particles
(McCave and Syvitski, 1991; Coakley and Syvitski, 1991; Micromeritics, 2001). A
45
detailed discussion of this method of particle size analysis and of the sample preparation
used in this study is included in Appendix 2-B.
The sand fraction (>63 )im) of each sample was further sieved at even ^ intervals
to determine the grain size distribution within the coarse fraction. Sieve mesh diameters
corresponding to 125 |j,m (3.0 (j), fine sand), 250 (xm (2.0 ([>, medium sand), 500 |xm (1.0
(]), coarse sand), 1000 |im (0.0 (|), very coarse sand), and 2000 )im (-1.0 (^, granule) were
used to separate this fraction. Observations of sediment composition (carbonate,
silicilastic, or organic material) were made using a binocular microscope.
2.2.5. Aerial Photographic Surveys of the Freshwater Bayou Area
Aerial photographic interpretations were made using orthorectified color images
taken with conventional and infrared cameras (US Geological Survey, 1990, 2001;
Louisiana State University, 1998; National Aeronautics and Space Administration, 2001);
declassified Corona satellite images were also used for comparison of shoreline
morphology over several decades. For this portion of the study, discussion of aerial
photographic surveys will be restricted to points relevant to the development of the
Freshwater Bayou mudflat due to alterations in dredging operations since 1990. A more
detailed discussion of aerial surveys is included in Chapter 3.
2.3. Results
Locations of eroding and accreting environments along the chenier plain have
been compiled into a map (Figure 2-4a). Isotope activity plots for '■'^Cs and ^"^b in a
46
hypothetical undisturbed sediment core are shown in Figure 2-5 for comparison with the
data to be presented from the chenier plain near-shore cores. Schematic diagrams of core
stratigraphy are presented for all cores collected in March 2001, as are X-radiograph
images for Cores CSB and CSD. For cores for which isotope, porosity, and grain size
analyses were made, all results have been grouped together by core and are displayed
together in Figures 2-6 through 2-15. Core figures are arranged such that the easternmost
core is presented first (Core CSF, in Figure 2-6), followed in order by cores collected
increasingly farther west. A summary of porosity, bulk density, and grain size
distribution for all sediment samples analyzed is presented in Appendix 2-C.
2.3.1. Coastal Characterization: Patterns of Erosion and Accretion
Accretion and erosion patterns inferred from this coastal characterization survey
are shown in Figure 2-4a. Results of the last similar survey (Wells and Roberts, 1981),
which was based upon aerial photographs taken in the mid-1970s, are illustrated in Figure
2-4b.
2.3.2. Results oflsotopic Analyses
Isotope activity plots for '^^Cs and excess ^"^b from the four cores obtained in
shallow water at sites CSF, CSI, and CSJ, and CSC are included in the composite Figures
2-6, 2-9, 2-11, and 2-12. A layer of sediment was evident at the top of Cores CSI and CSJ
(obtained 2 km and 11 km west of Freshwater Bayou, respectively; Figures 2-9 and 2-11)
that contained no '"Cs and had slightly lower levels of excess ^"^b than the sediment
below it. Core CSF, collected -1.5 km east of Freshwater Bayou, did not show a similar
'"Cs-deficient layer at the surface. Core CSC, collected 25.5 km west of Freshwater
47
Bayou, contained very low levels of both '"Cs and excess ^"'Pb (near the detection limit).
Sediment from the near-shore cores analyzed displayed relatively uniform grain size;
isotopic activity in these samples therefore does not vary as a function of highly
heterogeneous grain size.
2.3.3. Sedimentary Fades
Core CSF (Figure 2-6), the easternmost core collected, consisted primarily of
bioturbated mud (dominantly clay) with two prominent layers of coarser material (each
containing -85% sand) at 0.20 m and 0.58 m depth below sea floor (bsf). The sand
horizon at 0.20 m bsf contained 82% very fine siliciclastic sand grains, while the horizon
at 0.58 m bsf contained a wider distribution of siliciclastic particles (very fine through
medium sand) in addition to -10% carbonate shell material by mass in the medium sand
through granule size fractions (Appendix 2-B). A third, minor, sand layer was present at
0.50 m bsf that contained -25% sand. Within Core CSF, the sand horizon at 0.20 m
coincided with the base of '^^Cs and excess ^'°Pb activity. Above the sand horizon at 0.20
m, activities of both isotopes were fairly uniform within Core CSF. Average porosity in
this core was 70% below 0.25 m; porosity data were not available for the upper 0.25 m of
the core. The sand layer at 0.58 m depth yielded a porosity of 51%. Organic material was
present in all samples from Core CSF, with a distinctive dark brown "coffee ground"
appearance similar to that noted by Kemp (1986) in the same general area.
Cores CSG and CSH showed similar grain size and porosity (Figures 2-7 and 2-
8). These two cores were collected less than 1 km apart on the east and west margins of
the Freshwater Bayou navigation canal respectively, in order to allow evaluation of
differences in sediment properties across the canal. Average porosity was similar
48
throughout the cores (80% for Core CSG, 81% for Core CSH) and slightly higher at the
surface in Core CSG (88% relative to 85% in Core CSH). During sampling, it was noted
that Core CSG contained an unconsolidated "mixed layer" of mud that spanned the upper
0.12-0.15 m of the core; below that, greater consolidation was apparent. That depth
corresponded to a decrease in porosity from -86% to -82%. A minor sand layer (20%
sand, dominantly very fine siliciclastic grains) appeared in Core CSG at 0.35 m bsf.
Traces of a basal sand layer at 0.85 m, which had been disturbed during core collection,
were observed during core sampling. This layer was not apparent in Core CSH, which
showed extremely homogenous porosity and grain size distribution throughout the length
of the core. CSH consisted almost uniformly of -78% clay and -20% silt, with only trace
amounts of sand. Neither of the two sand layers visible in Core CSG was detected in
Core CSH. The consolidation boundary evident at -0.15 m bsf in Core CSG was not
observed during sampling of Core CSH; sediment throughout Core CSH was observed to
be very pooriy consolidated and easily disturbed. Both cores showed bioturbation (in the
form of burrows) throughout their stratigraphy.
Core CSI, collected 2 km west of Freshwater Bayou, showed no discernible sand
layers (Figure 2-9). Sediment was observed to be poorly consolidated throughout,
although a gradual transition from near-fluid mud (surface porosity of 86%, bulk density
1240 kg/m^) to slightly better consolidation (-82% porosity, bulk density 1300 kg/m^)
occurred over the uppermost 0.2 m of the core. Average porosity throughout this core
was 80%. Sediment consisted primarily of clay (-74-99%) with the remainder composed
almost entirely of silt. Sand content never rose above 1% until the basal sample at 0.94 m
bsf, which contained 5% sand. No difference in porosity or grain size was apparent
49
between the 0.35-m-thick '^'Cs-depleted layer at the top of Core CSI and the sediment
below 0.35 m that contains appreciable levels of '"Cs.
Core CSE (Figure 2-10) showed very similar facies to sediments from Cores CSI
and CSJ. This core consisted of soft gray mud that was not consolidated enough to hold
its shape. The uppermost 0.12 m of Core CSE comprised an entirely unconsolidated
mixed layer. Due to its location between Cores CSI and CSJ, and the uniformity of the
coastal environment (an extensive mudflat) between those sites, detailed analyses of
isotopic content, porosity, and grain size were not made on Core CSE.
Core CSJ (Figure 2-11), collected 11 km west of Freshwater Bayou, showed
extremely uniform sedimentary facies, similar to that seen in Cores CSI and CSE. The
top -0.13 m consisted of very poorly consolidated mud (surface porosity of 85%), with a
gradual transition to better consolidation (average porosity 80% throughout the core).
Clay content ranged from 65-86%, with silt content 15-25%. Only trace amounts of sand
were detected, the highest proportion in the basal unit at 7.7% (at 0.95 m bsf). As in Core
CSI, no difference in porosity or grain size was evident between the 0.10-m thick '"Cs-
depleted layer at the top of the core and the '"Cs-rich sediment below.
Core CSC, the westernmost core collected at 1 m water depth, showed markedly
different stratigraphy than the others obtained a similar distance offshore and in a similar
water depth (Figure 2-12). This core consisted entirely of peat material, the uppermost
0.07 m comprising a brown well-consolidated peat layer with surface porosity of 79%.
Below that, the core contained uniform gray peat with abundant organic material (plant
roots and sticks) with variable porosity that ranged from 58-81% and averaged 71%.
Aside from a sample at 0.015 m (1.5 cm) bsf that contained 12% sand, only trace
amounts of sand were detected in Core CSC.
50
The three cores west of Site CSC were collected in the swash zones of
beach/marsh areas determined to be in active erosion. These cores, from Sites CSA, CSB,
and CSD, contained primarily peat and shell material with minor mud content. Core CSB
contained a 0.02-m-thick mass of carbonate shell material within its peat, visible on an X-
ray image (Figure 2-13). Core CSA consisted entirely of well-consolidated brown peat
that included sticks up to 0.02 m in diameter (Figure 2-14). Porosity measurements made
on several samples from Core CSA indicated -70% porosity within the peat. No clear
stratigraphy was apparent within Cores CSA or CSB. Core CSD showed better-defined
stratigraphy; in core description and in X-ray image, a layer of carbonate shell material
-0.1 m thick was observed between a 0.03-m-thick layer of unconsolidated mud at the
top of the core and uniform peat below the shell horizon (Figure 2-15).
In summary, all cores showed a downward increase in consolidation from a
generally unconsolidated mixed layer at the core top to porosity -78% and bulk density
-1350 kg/m^ within the consolidated portion of the core. Sediment was composed almost
exclusively of clay and silt grain sizes, with the exception of two prominent sand layers
in the easternmost core (Core CSF) and a minor sand layer in Core CSG. No variation in
grain size occurred across porosity and bulk density boundaries that marked the transition
from unconsolidated to consolidated mud. High organic content was observed at the
easternmost and westernmost sites (Cores CSF and CSC) with organic matter rare or
absent in sediment in the cores collected in the vicinity of the Freshwater Bayou mudflat.
Two cores, CSI and CSJ, taken west (downdrift) of Freshwater Bayou on the large
mudflat, contained uppermost sediment in which '"Cs was entirely absent. Such an
isotopic profile is anomalous for a shallow marine sediment core (compare with Figure 2-
51
5). The '^'Cs-free layer was observed to thin westward (downdrift) between the two
cores, and was not present in Core CSF, collected east (updrift) of Freshwater Bayou.
2.4. Discussion
2.4.1. Identification of Eroding and Accreting Shoreline
The geomorphic features used to infer shoreline retreat and accretion on the
Louisiana chenier plain are fairly typical characteristics of mud-dominated coasts. Kirby
(2000, 2002) has described eroding muddy shorelines as low-lying and concave in cross-
section, often backed by peat cliffs that represent a disconformity between tidal mudflats
and the backshore salt marsh (Figure 2-16; see also Friedrichs and Aubrey, 1996). The
peat terrace may be topped by carbonate shell material that accumulate as a winnowed
deposit brought onshore by waves (Kirby, 2000). Exposed vertical sections of marsh
terrace may show desiccation cracks and are often fronted by collapsed blocks of salt
marsh.
During field characterization of the Louisiana chenier plain, coastal areas
experiencing erosion and ongoing land loss (landward migration of the shoreline) were
identified by carbonate sand washover deposits encroaching upon established backshore
marsh vegetation, often underlain by a partially submerged peat terrace containing
abundant stems and roots of older vegetation. The peat terrace is a nearly ubiquitous
feature along the central section of the chenier plain (Figure 2-17a, b; sites shown in
photographs are indicated in Figure 2-1). This surface consists of highly cohesive mud
and organic matter. In some areas the surface is present as a nearly submerged layer in
52
the swash zone, as in Figure 2-17a, an example from Coastal Station B (CSB), east of the
East Little Constance Bayou outlet. In an X-radiograph image of Core CSB (Figure 2-
13), plant stems can be seen throughout the core, and the overall dark nature of the image
reflects the dominance of fine grain sizes (silt and clay). Occasional patches of coarser
grains may be found, as is the case near the top of Core CSB, where the X-ray image
reveals a brighter patch of denser shell hash (see Figure 2-13). Elsewhere, the peat forms
a terrace that can be elevated up to 1 m above the water level, as in Figure 2-17b, an
example from the central chenier plain at approximately 92.5°W.
Areas of exposed peat terrace may extend into the water as spits or tombolos, the
well-consolidated peat efficiently resisting erosion. A crenulated shoreline was typically
present in such cases, where carbonate sand forms pocket beaches in embayments
between protrusions formed by marsh cliffs. This crenulation effect is believed to be
enhanced by the abrasive power of shell material on marsh sediment in these
embayments during wave activity (Amos et al., 2000; Thompson and Amos, 2002). Such
an environment is common along mud-dominated eroding coastlines; "mud cliffs"
alternating with pocket beaches of carbonate shell material are common features on
eroding muddy coasts in Europe and the British Isles, for example (Whitehouse et al.,
2000; Kirby, 2000, 2002; Ke and Collins, 2002).
The present shoreline in this area represents the degree to which the ocean has
transgressed landward over older stable marsh terrain since the last glacial episode. As
relative sea level continues to rise, coarse shell hash washes over the older marsh peat
and mud. This formation of washover deposits often results in exposure of the old marsh
surface in and near the surf zone underlying carbonate sand. Along sections of the coast
that display only a sandy beach environment, it is probable that the ubiquitous old marsh
53
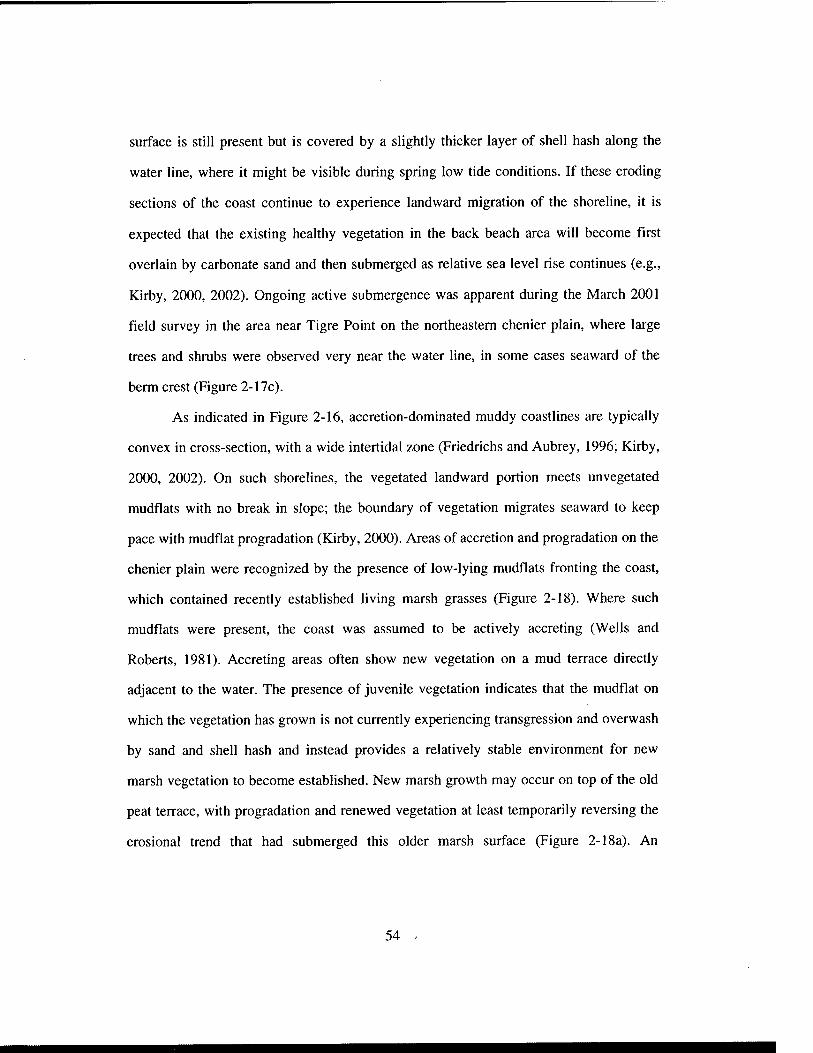
surface is still present but is covered by a slightly thicker layer of shell hash along the
water line, where it might be visible during spring low tide conditions. If these eroding
sections of the coast continue to experience landward migration of the shoreline, it is
expected that the existing healthy vegetation in the back beach area will become first
overlain by carbonate sand and then submerged as relative sea level rise continues (e.g.,
Kirby, 2000, 2002). Ongoing active submergence was apparent during the March 2001
field survey in the area near Tigre Point on the northeastern chenier plain, where large
trees and shrubs were observed very near the water line, in some cases seaward of the
berm crest (Figure 2-17c).
As indicated in Figure 2-16, accretion-dominated muddy coastlines are typically
convex in cross-section, with a wide intertidal zone (Friedrichs and Aubrey, 1996; Kirby,
2000, 2002). On such shorelines, the vegetated landward portion meets unvegetated
mudflats with no break in slope; the boundary of vegetation migrates seaward to keep
pace with mudflat progradation (Kirby, 2000). Areas of accretion and progradation on the
chenier plain were recognized by the presence of low-lying mudflats fronting the coast,
which contained recently established living marsh grasses (Figure 2-18). Where such
mudflats were present, the coast was assumed to be actively accreting (Wells and
Roberts, 1981). Accreting areas often show new vegetation on a mud terrace direcdy
adjacent to the water. The presence of juvenile vegetation indicates that the mudflat on
which the vegetation has grown is not currently experiencing transgression and overwash
by sand and shell hash and instead provides a relatively stable environment for new
marsh vegetation to become established. New marsh growth may occur on top of the old
peat terrace, with progradation and renewed vegetation at least temporarily reversing the
erosional trend that had submerged this older marsh surface (Figure 2-18a). An
54
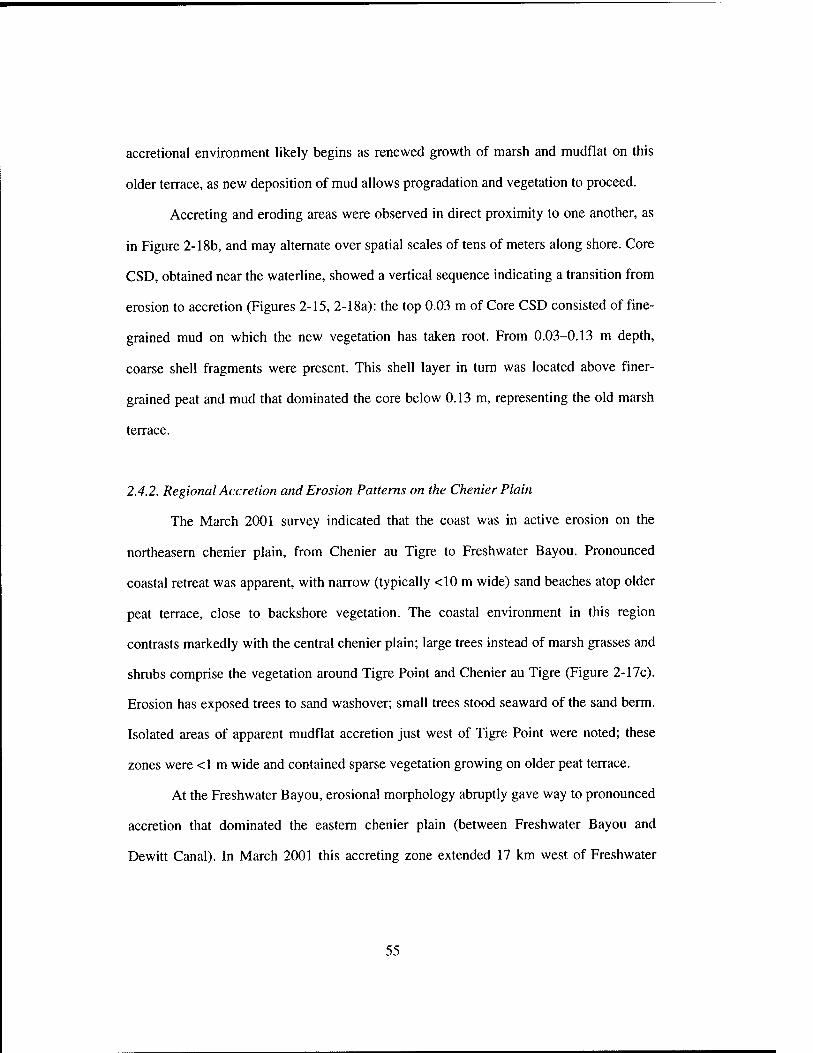
accretional environment likely begins as renewed growth of marsh and mudflat on this
older terrace, as new deposition of mud allows progradation and vegetation to proceed.
Accreting and eroding areas were observed in direct proximity to one another, as
in Figure 2-18b, and may alternate over spatial scales of tens of meters along shore. Core
CSD, obtained near the waterline, showed a vertical sequence indicating a transition from
erosion to accretion (Figures 2-15, 2-18a): the top 0.03 m of Core CSD consisted of fine-
grained mud on which the new vegetation has taken root. From 0.03-0.13 m depth,
coarse shell fragments were present. This shell layer in turn was located above finer-
grained peat and mud that dominated the core below 0.13 m, representing the old marsh
terrace.
2.4.2. Regional Accretion and Erosion Patterns on the Chenier Plain
The March 2001 survey indicated that the coast was in active erosion on the
northeasem chenier plain, from Chenier au Tigre to Freshwater Bayou. Pronounced
coastal retreat was apparent, with narrow (typically <10 m wide) sand beaches atop older
peat terrace, close to backshore vegetation. The coastal environment in this region
contrasts markedly with the central chenier plain; large trees instead of marsh grasses and
shrubs comprise the vegetation around Tigre Point and Chenier au Tigre (Figure 2-17c).
Erosion has exposed trees to sand washover; small trees stood seaward of the sand berm.
Isolated areas of apparent mudflat accretion just west of Tigre Point were noted; these
zones were <1 m wide and contained sparse vegetation growing on older peat terrace.
At the Freshwater Bayou, erosional morphology abruptly gave way to pronounced
accretion that dominated the eastern chenier plain (between Freshwater Bayou and
Dewitt Canal). In March 2001 this accreting zone extended 17 km west of Freshwater
55
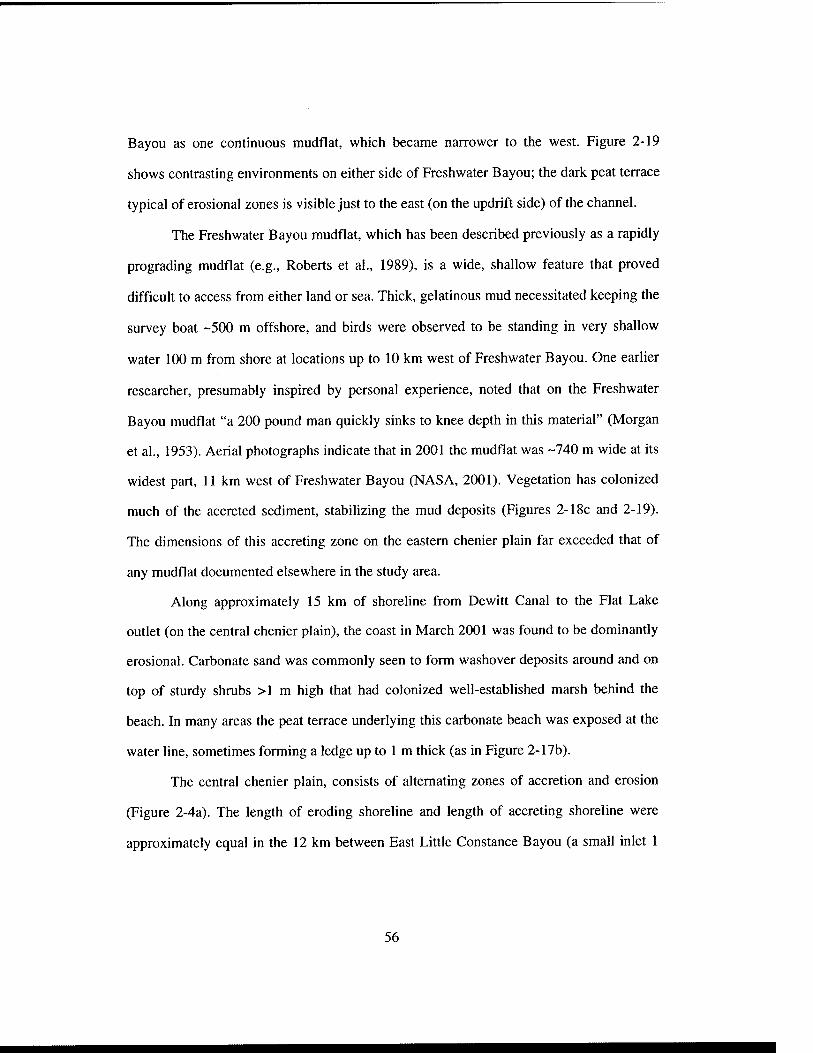
Bayou as one continuous mudflat, which became narrower to the west. Figure 2-19
shows contrasting environments on either side of Freshwater Bayou; the dark peat terrace
typical of erosional zones is visible just to the east (on the updrift side) of the channel.
The Freshwater Bayou mudflat, which has been described previously as a rapidly
prograding mudflat (e.g., Roberts et al., 1989), is a wide, shallow feature that proved
difficult to access from either land or sea. Thick, gelatinous mud necessitated keeping the
survey boat -500 m offshore, and birds were observed to be standing in very shallow
water 100 m from shore at locations up to 10 km west of Freshwater Bayou. One earlier
researcher, presumably inspired by personal experience, noted that on the Freshwater
Bayou mudflat "a 200 pound man quickly sinks to knee depth in this material" (Morgan
et al., 1953). Aerial photographs indicate that in 2001 the mudflat was -740 m wide at its
widest part, 11 km west of Freshwater Bayou (NASA, 2001). Vegetation has colonized
much of the accreted sediment, stabilizing the mud deposits (Figures 2-18c and 2-19).
The dimensions of this accreting zone on the eastern chenier plain far exceeded that of
any mudflat documented elsewhere in the study area.
Along approximately 15 km of shoreline from Dewitt Canal to the Flat Lake
outlet (on the central chenier plain), the coast in March 2001 was found to be dominantly
erosional. Carbonate sand was commonly seen to form washover deposits around and on
top of sturdy shrubs >1 m high that had colonized well-established marsh behind the
beach. In many areas the peat terrace underlying this carbonate beach was exposed at the
water line, sometimes forming a ledge up to 1 m thick (as in Figure 2-17b).
The central chenier plain, consists of alternating zones of accretion and erosion
(Figure 2-4a). The length of eroding shoreline and length of accreting shoreline were
approximately equal in the 12 km between East Little Constance Bayou (a small inlet 1
56
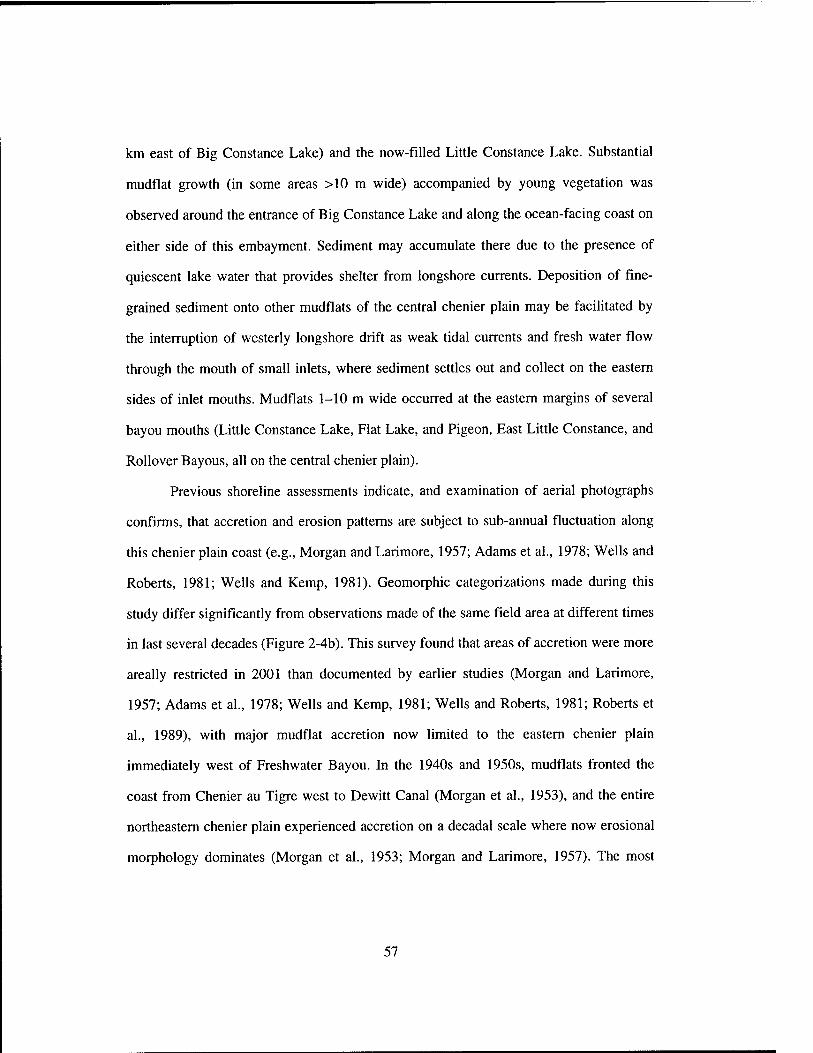
km east of Big Constance Lake) and the now-filled Little Constance Lake. Substantial
mudflat growth (in some areas >10 m wide) accompanied by young vegetation was
observed around the entrance of Big Constance Lake and along the ocean-facing coast on
either side of this embayment. Sediment may accumulate there due to the presence of
quiescent lake water that provides shelter from longshore currents. Deposition of fine-
grained sediment onto other mudflats of the central chenier plain may be facilitated by
the interruption of westerly longshore drift as weak tidal currents and fresh water flow
through the mouth of small inlets, where sediment setties out and collect on the eastern
sides of inlet mouths. Mudflats 1-10 m wide occurred at the eastern margins of several
bayou mouths (Little Constance Lake, Flat Lake, and Pigeon, East Little Constance, and
Rollover Bayous, all on the central chenier plain).
Previous shoreline assessments indicate, and examination of aerial photographs
confirms, that accretion and erosion patterns are subject to sub-annual fluctuation along
this chenier plain coast (e.g., Morgan and Larimore, 1957; Adams et al., 1978; Wells and
Roberts, 1981; Wells and Kemp, 1981). Geomorphic categorizations made during this
study differ significantly from observations made of the same field area at different times
in last several decades (Figure 2-4b). This survey found that areas of accretion were more
areally restricted in 2001 than documented by earlier studies (Morgan and Larimore,
1957; Adams et al., 1978; Wells and Kemp, 1981; Wells and Roberts, 1981; Roberts et
al., 1989), with major mudflat accretion now limited to the eastern chenier plain
immediately west of Freshwater Bayou. In the 1940s and 1950s, mudflats fronted the
coast from Chenier au Tigre west to Dewitt Canal (Morgan et al., 1953), and the entire
northeastern chenier plain experienced accretion on a decadal scale where now erosional
morphology dominates (Morgan et al., 1953; Morgan and Larimore, 1957). The most
57
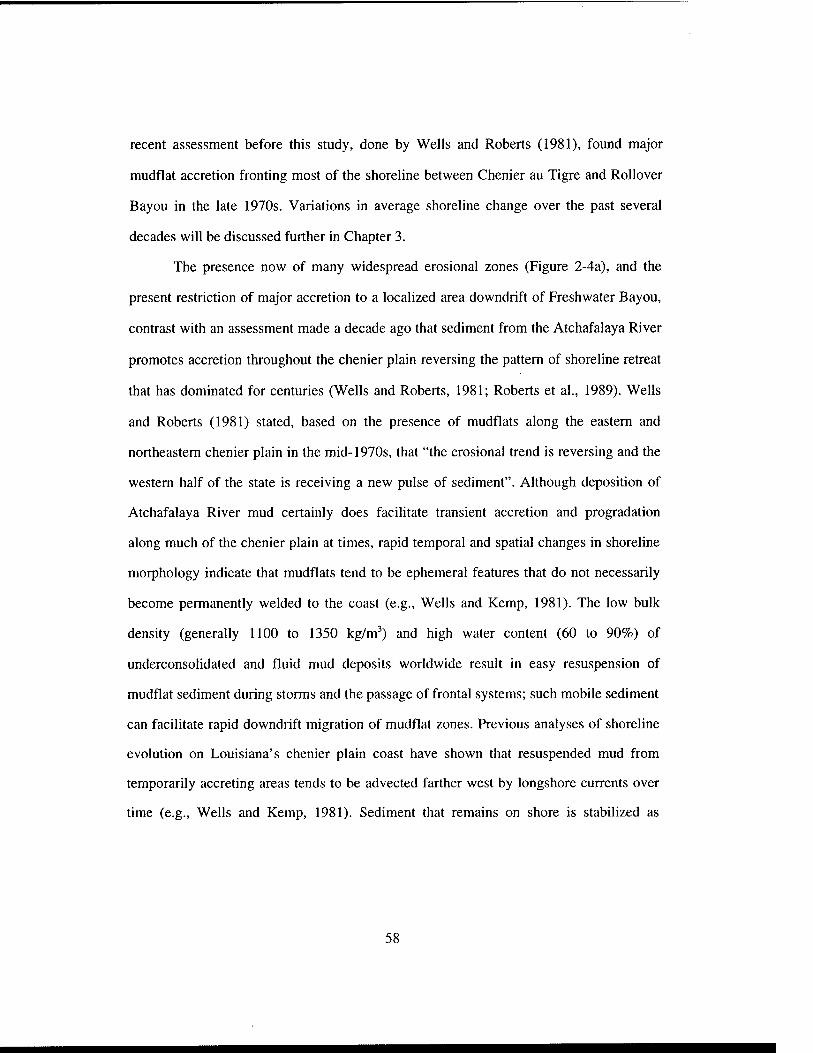
recent assessment before this study, done by Wells and Roberts (1981), found major
mudflat accretion fronting most of the shoreline between Chenier au Tigre and Rollover
Bayou in the late 1970s. Variations in average shoreline change over the past several
decades will be discussed further in Chapter 3.
The presence now of many widespread erosional zones (Figure 2-4a), and the
present restriction of major accretion to a localized area downdrift of Freshwater Bayou,
contrast with an assessment made a decade ago that sediment from the Atchafalaya River
promotes accretion throughout the chenier plain reversing the pattern of shoreline retreat
that has dominated for centuries (Wells and Roberts, 1981; Roberts et al., 1989). Wells
and Roberts (1981) stated, based on the presence of mudflats along the eastern and
northeastern chenier plain in the mid-1970s, that "the erosional trend is reversing and the
western half of the state is receiving a new pulse of sediment". Although deposition of
Atchafalaya River mud certainly does facilitate transient accretion and progradation
along much of the chenier plain at times, rapid temporal and spatial changes in shoreline
morphology indicate that mudflats tend to be ephemeral features that do not necessarily
become permanently welded to the coast (e.g., Wells and Kemp, 1981). The low bulk
density (generally 1100 to 1350 kg/m^) and high water content (60 to 90%) of
underconsolidated and fluid mud deposits worldwide result in easy resuspension of
mudflat sediment during storms and the passage of frontal systems; such mobile sediment
can facilitate rapid downdrift migration of mudflat zones. Previous analyses of shoreline
evolution on Louisiana's chenier plain coast have shown that resuspended mud from
temporarily accreting areas tends to be advected farther west by longshore currents over
time (e.g., Wells and Kemp, 1981). Sediment that remains on shore is stabilized as
58
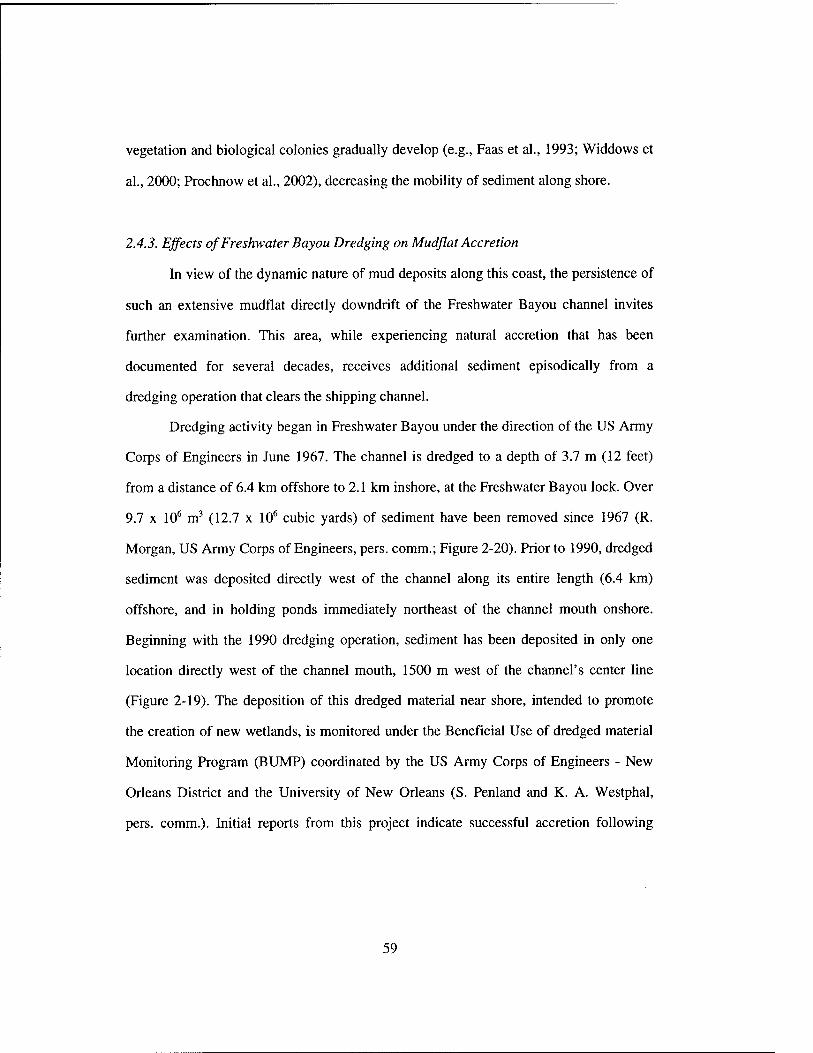
vegetation and biological colonies gradually develop (e.g., Faas et al., 1993; Widdows et
al., 2000; Prochnow et al., 2002), decreasing the mobility of sediment along shore.
2.4.3. Effects of Freshwater Bayou Dredging on Mudflat Accretion
In view of the dynamic nature of mud deposits along this coast, the persistence of
such an extensive mudflat directly downdrift of the Freshwater Bayou channel invites
further examination. This area, while experiencing natural accretion that has been
documented for several decades, receives additional sediment episodically from a
dredging operation that clears the shipping channel.
Dredging activity began in Freshwater Bayou under the direction of the US Army
Corps of Engineers in June 1967. The channel is dredged to a depth of 3.7 m (12 feet)
from a distance of 6.4 km offshore to 2.1 km inshore, at the Freshwater Bayou lock. Over
9.7 X 10^ m^ (12.7 x 10* cubic yards) of sediment have been removed since 1967 (R.
Morgan, US Army Corps of Engineers, pers. comm.; Figure 2-20). Prior to 1990, dredged
sediment was deposited directly west of the channel along its entire length (6.4 km)
offshore, and in holding ponds immediately northeast of the channel mouth onshore.
Beginning with the 1990 dredging operation, sediment has been deposited in only one
location directly west of the channel mouth, 1500 m west of the channel's center line
(Figure 2-19). The deposition of this dredged material near shore, intended to promote
the creation of new wetlands, is monitored under the Beneficial Use of dredged material
Monitoring Program (BUMP) coordinated by the US Army Corps of Engineers - New
Orleans District and the University of New Orleans (S. Penland and K. A. Westphal,
pers. comm.). Initial reports from this project indicate successful accretion following
59
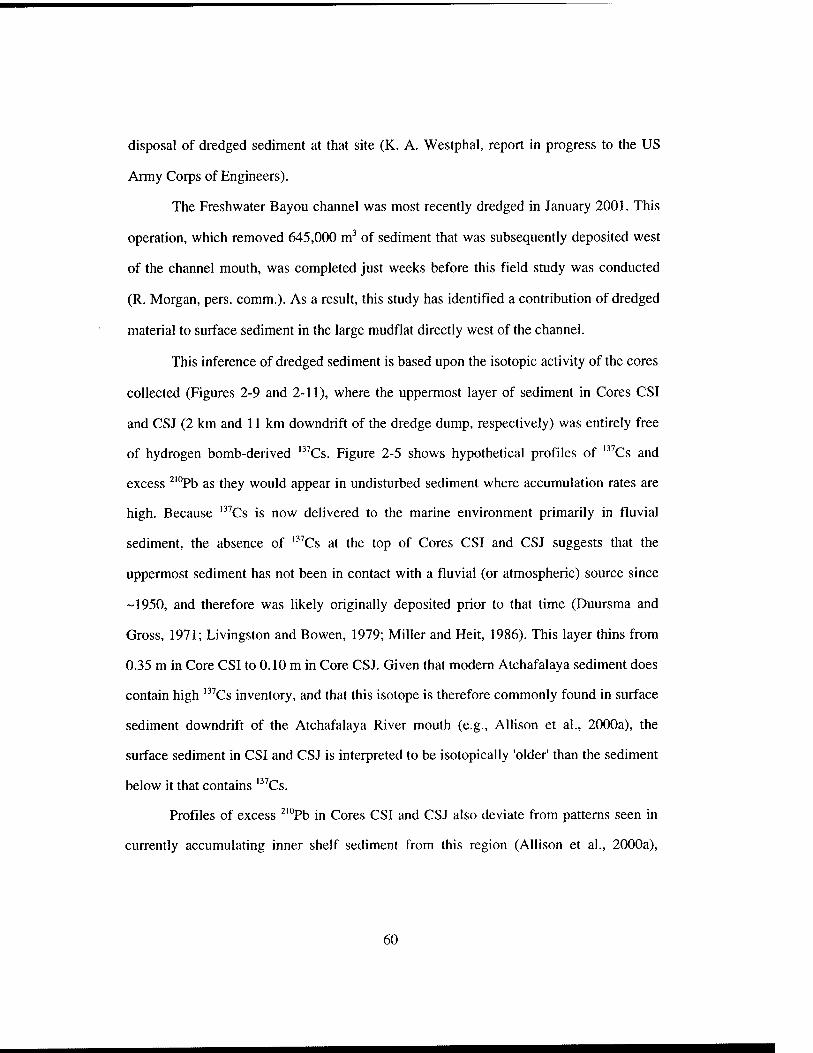
disposal of dredged sediment at that site (K. A. Westphal, report in progress to the US
Army Corps of Engineers).
The Freshwater Bayou channel was most recently dredged in January 2001. This
operation, which removed 645,000 m^ of sediment that was subsequently deposited west
of the channel mouth, was completed just weeks before this field study was conducted
(R. Morgan, pers. comm.). As a result, this study has identified a contribution of dredged
material to surface sediment in the large mudflat directly west of the channel.
This inference of dredged sediment is based upon the isotopic activity of the cores
collected (Figures 2-9 and 2-11), where the uppermost layer of sediment in Cores CSI
and CSJ (2 km and 11 km downdrift of the dredge dump, respectively) was entirely free
of hydrogen bomb-derived '"Cs. Figure 2-5 shows hypothetical profiles of '"Cs and
excess ^'"Pb as they would appear in undisturbed sediment where accumulation rates are
high. Because '"Cs is now delivered to the marine environment primarily in fluvial
sediment, the absence of '"Cs at the top of Cores CSI and CSJ suggests that the
uppermost sediment has not been in contact with a fluvial (or atmospheric) source since
-1950, and therefore was likely originally deposited prior to that time (Duursma and
Gross, 1971; Livingston and Bowen, 1979; Miller and Heit, 1986). This layer thins from
0.35 m in Core CSI to 0.10 m in Core CSJ. Given that modem Atchafalaya sediment does
contain high '^'Cs inventory, and that this isotope is therefore commonly found in surface
sediment downdrift of the Atchafalaya River mouth (e.g., Allison et al., 2000a), the
surface sediment in CSI and CSJ is interpreted to be isotopically 'older' than the sediment
below it that contains '"Cs.
Profiles of excess ^'°Pb in Cores CSI and CSJ also deviate from patterns seen in
currently accumulating inner shelf sediment from this region (Allison et al., 2000a),
60
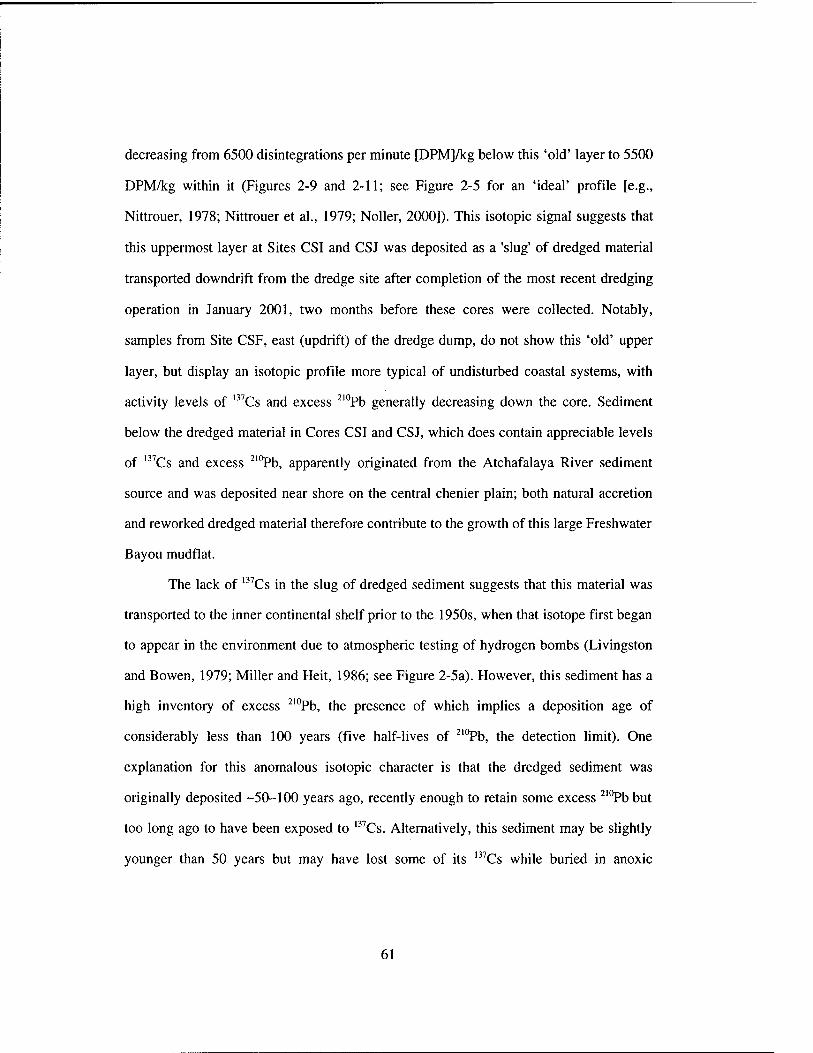
decreasing from 6500 disintegrations per minute [DPM]/kg below this 'old' layer to 5500
DPM/kg within it (Figures 2-9 and 2-11; see Figure 2-5 for an 'ideal' profile [e.g.,
Nittrouer, 1978; Nittrouer et al., 1979; Noller, 2000]). This isotopic signal suggests that
this uppermost layer at Sites CSI and CSJ was deposited as a 'slug' of dredged material
transported downdrift from the dredge site after completion of the most recent dredging
operation in January 2001, two months before these cores were collected. Notably,
samples from Site CSF, east (updrift) of the dredge dump, do not show this 'old' upper
layer, but display an isotopic profile more typical of undisturbed coastal systems, with
activity levels of '^'Cs and excess ^'*^b generally decreasing down the core. Sediment
below the dredged material in Cores CSI and CSJ, which does contain appreciable levels
of '"Cs and excess ^'°Pb, apparently originated from the Atchafalaya River sediment
source and was deposited near shore on the central chenier plain; both natural accretion
and reworked dredged material therefore contribute to the growth of this large Freshwater
Bayou mudflat.
The lack of '"Cs in the slug of dredged sediment suggests that this material was
transported to the inner continental shelf prior to the 1950s, when that isotope first began
to appear in the environment due to atmospheric testing of hydrogen bombs (Livingston
and Bowen, 1979; Miller and Heit, 1986; see Figure 2-5a). However, this sediment has a
high inventory of excess ^'°Pb, the presence of which implies a deposition age of
considerably less than 100 years (five half-lives of ^'°Pb, the detection limit). One
explanation for this anomalous isotopic character is that the dredged sediment was
originally deposited -50-100 years ago, recently enough to retain some excess ^"^b but
too long ago to have been exposed to '^^Cs. Alternatively, this sediment may be slightly
younger than 50 years but may have lost some of its '^'Cs while buried in anoxic
61
sediment in the Freshwater Bayou channel. Anoxic conditions lower the sediment/water
partition coefficient of '"Cs, increasing its mobility in pore water (Sholkovitz et al.,
1983; Sholkovitz and Mann, 1984). Although bioturbation in Cores CSI and CSJ argues
against anoxic conditions in the surface sediment of the mudflat, this sediment may have
been buried in an anoxic environment within the shipping channel prior to dredging.
While possible, this explanation is considered insufficient because the mobility of '"Cs in
anoxic sediments is unlikely to drive the activity level to zero, as observed (E. R.
Sholkovitz, pers. comm.; K. O. Buesseler, pers. comm). Shoreward transport of '"Cs-free
shelf sediment in the channel and subsequent redeposition of this offshore sediment by
dredging is an unlikely origin for this sediment, because surface sediment offshore of
Freshwater Bayou does contain '^'Cs (Allison et al., 2000a; M. A. Allison, unpublished
data, 2001).
The most plausible explanation for high excess ^"*Pb in the absence of '"Cs is
scavenging of ^'"Pb from the water column during dredge-induced resuspension of
sediment. As discussed in Section 2.1.3, ^'°Pb is abundant in the marine water column;
^'°Pb is typically readily available in seawater due to the high inventory of its
grandparents ^^*U and ^^*Ra in the ocean (e.g., Turekian, 1977; DeMaster et al., 1986).
Because Pb is highly particle-reactive (with a sediment-water partition coefficient K^, =
10'), any event that resuspends sediment in the water column provides an opportunity for
^'°Pb to be scavenged from the water and absorbed onto particle surfaces, ^"^b scavenged
in this manner will then settle to the sea floor with the sediment (e.g., DeMaster et al.,
1986; Baskaran and Santschi, 2002). Scavenging of dissolved trace metals from seawater
by resuspended sediment is known to be an important process near shore, where waves
and current action promote resuspension (Duursma and Gross, 1971; Baskaran and
62
Santschi, 2002). Dredging and subsequent redeposition of older sediment that had lost
most of its original excess ^"'Pb signal would allow this sediment to scavenge ^'°Pb from
the water, "resetting" its excess ^'°Pb inventory to near modem values while adding little
to no new '^'Cs. This is proposed as the most likely mechanism by which the isotopic
signal of Cores CSI and CSJ could be attained.
The lack of a clear trend in '"Cs activity in Cores CSI and CSJ below this 2001
dredge deposit may reflect reworking of the stratigraphy within this mudbank, possibly
by resuspension by waves during cold front passage. Neither the base of '^^Cs activity nor
the characteristic peaks associated with its variable input into the environment through
time (Figure 2-5) are visible in these cores. Due to the absence of these features in Cores
CSI and CSJ, it is therefore not practical to use the '^^Cs data to calculate rates of natural
sediment accumulation at these two sites.
2.4.4. Development of the Freshwater Bayou Mudflat Since 1990
Examination of aerial photographs yields valuable information about the timing of
development of the Freshwater Bayou mudflat. Corona satellite images taken in 1963,
before dredging began, and in 1970, three years after the first operation, show no mudflat
at that site (USGS, 2001). Accretion has been noted at this location since the mid-
twentieth century (Morgan et al., 1953; Kemp, 1986; Adams et al., 1978; Wells and
Kemp, 1981), Until the late 1980s, however, the permanent presence of a mudflat was not
apparent, and sediment deposited at that location was observed to gradually migrate
farther west (Wells and Kemp, 1981). The present episode of progradation began in the
late 1980s, and was first described by Roberts et al. (1989).
63
A natural origin unrelated to dredging is the most likely explanation for this initial
accretion given that no dredging was done in Freshwater Bayou between 1985 and 1990
(Figure 2-20). However, the relocation of the dredge dump in 1990 to its present location
directly west of the channel mouth (at the eastern extent of this large accreted area) has
apparently contributed enough sediment to the area in excess of its natural supply to
stabilize and further encourage additional, natural, sediment accumulation by positive
feedback mechanisms. As described by previous studies (Wells, 1983; Kemp, 1986;
Mehta et al., 1994; Lee and Mehta, 1997), the presence of an unconsolidated mud sea bed
near shore dampens incoming wave energy. Although the exact mechanism by which
wave energy is attenuated over a mud sea bed is uncertain, it has been previously
proposed that wave dampening may occur due to high viscosity of fluid mud
(concentrations 10-170 g/1; Krone, 1962) and dissipation into a fluid mud sea bed by
formation of a viscous mud wave (Wells, 1983; Lee and Mehta, 1997). Reduction of
wave energy in turn promotes further deposition of suspended sediment, encouraging
mudflat growth. It is proposed that such positive feedback, aided by the input of dredged
sediment, has led to additional mud deposition beyond what would naturally accumulate
on the eastern chenier plain. In contrast to repeated aerial surveys made before the 1990
relocation of the dredge dump, all photographs since then have shown mudflats present at
this location (see Chapter 3).
Rapid growth has followed the relocation of the dredge dump; between 1990 and
2001 the mudflat has prograded seaward at rates that are locally as high as 50 m/yr at the
"Triple Canal" site of Huh et al. (2001), 2 km west of the channel (Figure 2-19), although
the rate of growth has not been constant. Analysis of aerial photographs shows that six
months before the relocation of the dredge dump in 1990, the area of the entire accreted
64
area (defined as all land, vegetated and unvegetated, seaward of a relict shoreline that is
level with the mouths of the Triple Canal site, the Exxon canals, and Dewitt Canal) was
approximately 1.6 kml As of 1998 the area had increased substantially, to approximately
6.4 kml Photographs taken on April 1, 2001 (Figure 2-19) show an accreted area that
occupied approximately 4.6 km^, although not all of the accreted zone seaward of the
canals (Triple, Exxon, and Dewitt Canals) appeared to be in active growth when the 2001
photographs were taken. Field observations in March 2001 indicated that much of the
volume of this mudflat is submerged and may not be visible from the air. Some of the
sediment deposited due to the November 2000 - January 2001 dredge had likely already
been transported away from the mudflat by the time the March 2001 field survey was
made; the small mudflats observed near Big Constance Lake (Figure 2-4a) are not
common in photographs taken in other years (Chapter 3), suggesting that these are a
transient result of the January 2001 dredging operation.
The dimensions of the Freshwater Bayou mudflat, far in excess of any other
accreting area presently active on the chenier plain coast, and the isotopic evidence for
longshore transport of dredged sediment more than 10 km west of the dredge dump,
suggest that dredging activity has an appreciable impact on coastal morphology in this
environment. The influence of dredging should therefore be taken into consideration in
future assessments of geomorphic trends on this shoreline. The isotopic signature of
dredged material occupies only the uppermost sediment (up to -0.35 m) in the cores
where it appears; the mud bank west of Freshwater Bayou is known to be over 2 m thick
(Morgan et al., 1953; Rotondo and Bentley, 2002; Roberts et al., 2002). The volumetric
contribution of dredged sediment itself to the mudflat composition is therefore assumed
to be relatively minor, analogous to thin icing on a thick cake. However, due to the wave-
65
dampening properties of an unconsolidated mud-rich sea bed, as discussed above,
positive feedback mechanisms may allow the disposal of dredged sediment to be a factor
driving accretion on this section of the coast today.
The Freshwater Bayou area is, in practice, an excellent field example of a
management strategy for tidal flat regeneration proposed by Kirby (2000) for mud-
dominated coasts (see also Mehta et al., 1994). This strategy, intended to induce accretion
on muddy shorelines currently experiencing erosion and to promote further accretion of
prograding mudflats, relies on positive feedback mechanisms of wave attenuation due to
high suspended sediment concentration. As envisioned by Kirby (2000), mudflat
accretion can be encouraged by the disposal of dredged mud at the updrift end of a
designated mudflat.' Dispersal of dredged sediment was proposed to cause the mudflat to
assume a more convex cross-sectional shape and higher elevation in the intertidal zone,
geomorphic characteristics of accretion-dominated muddy coasts (as in Figure 2-16;
Kirby, 2002). Such a shape is beneficial to biologic stability and diversity within the
mudflat, providing increased area for colonization by intertidal flora, fauna, and avian
populations that depend on them (Kirby, 2000).
2.4.5. Fades Variability in the Near-Shore Environment
Isotope activity patterns, which may be used to infer sediment sources and to
calculate accumulation rates in coastal environments, proved to be of limited use in this
area. The anomalous isotopic signal of the inferred dredged sediment from Cores CSI and
CSJ, and indications of a depositional hiatus in Core CSF, preclude accurate estimation
of accumulation rates using '"Cs and ^"^b. 'Be, an isotope with a 53-day half-life that
forms naturally in the atmosphere, has been used successfully in other studies to infer
66
recent deposition of fluvial sediment. Allison et al. (2000a) used ^Be to calculate seasonal
accumulation rates along the inner shelf south of the chenier plain. That study found
seasonal sedimentation rates 2-6 times greater than annual accumulation rates of
0.55-0.63 cm/yr (0.0055-0.0063 m/yr) at a site named WH6, located 2.5 km offshore of
the central chenier plain at 29.54''N, 92.48''W in a water depth of 7 m (shown in Figure 2-
Ib). However, all coastal samples analyzed for this work contained no detectable levels
of ^Be. Like ^Be, '"Cs is delivered to the coastal environment primarily from fluvial
discharge, but the half-life of '^^Cs is much longer (30 years). The presence of '"Cs in
most of our samples implies that the sediment analyzed was originally delivered in fluvial
discharge (presumably from the Atchafalaya River), but the absence of ^Be indicates that
it had been deposited more than six months before core collection (five half-lives of 'Be,
the detection limit).
It is noteworthy that sediment collected at station WH6 in March 2001 did contain
'Be at an activity level of 550 DPM/kg (M. A. Allison, unpublished data), a typical level
for that station (Allison et al., 2000a). The presence of 'Be at that site, 2.5 km offshore,
and the lack of 'Be in the near-shore samples (within ~5CX) m from shore) suggests that
the landward extent of freshly deposited Atchafalaya sediment was located between 500
and 2500 m offshore in March 2001. 'Be was detected in cores taken along the
Freshwatwer Bayou mudflat (-1000 m offshore) in late spring of 2001 (Rotondo and
Bentley, 2002).
Isotope activity patterns of '"Cs and ^'°Pb in Core CSF can be used to define the
depth of a surface mixed layer, similar to that shown in Figure 2-20b. Within the top
-0.20 m of Core CSF, activity levels of both isotopes are uniform and high. This implies
that the upper 0.20 m of sediment at this site are subject to homogenization by physical or
67
biological processes, generating a constant isotopic signal to all sediment within this
mixed layer (e.g., Nittrouer, 1978; see caption to Figure 2-5). A minimum deposition rate
of 0.53 cm/yr (0.0053 m/yr) might be inferred for Site CSF based on a depth of 0.15 m
bsf for the base of '"Cs activity, or 0.20 cm/yr (0.0020 m/yr) based on the rate at which
excess ^'^h decreases from its value of 7500 DPM/kg in the surface mixed layer to
background levels below 0.20 m (although only three data points are available for this
calculation). However, neither deposition rate is likely to represent a long-term
accumulation rate at Site CSF, where the core was collected -100 m offshore. Neither
isotope clearly shows the gradually decreasing activity trend associated with undisturbed
accumulation, and the abrupt loss of both isotopes at a distinct sand horizon at -0.20 m
bsf in Core CSF (Figure 2-6) implies renewed deposition above a disconformity (the sand
layer). It is most likely that the uppermost 0.17-0.20 m that form the surface mixed layer
in this core have been affected by reworking during storm and cold front activity.
Geomorphology characteristic of an eroding environment onshore at this location (a thin
carbonate sand beach perched on exhumed marsh terrace) further imply that mud
deposition offshore is not presently initiating observable coastal progradation there.
With the exception of cores collected in the peat terrace of eroding areas (Sites
CSB, CSA, and CSD), near-shore cores displayed generally similar sedimentary facies.
Cores taken in 1 m water depth along the chenier plain typically contained <5% sand,
10-25% silt, and >70% clay, with occasional sand horizons present (such as those in
Core CSF). In general, sand layers show lower porosity than adjacent finer-grained
horizons because small particles in a poorly sorted sample occupy pore spaces between
larger grains, although the exact relation between porosity and grain size depends on the
degree of sorting and consolidation of the sediment. Previous analyses of clay mineralogy
68
in sediment collected from mudflats on the eastern chenier plain showed an average
composition of 17-19% kaolinite, 31-43% illite, and 20-39% smectite within recent mud
deposits (Kemp, 1986), indicating a composition very similar to that of the sediment
leaving the Atchafalaya River (Mobbs, 1981; Kemp, 1986).
Cores CSG and CSH indicate similar environments immediately east and west of
Freshwater Bayou, although the observed basal sand traces and slightly more obvious
consolidation boundary within Core CSG may reflect the greater proximity of Site CSH
to the 2001 dredge dump just west of the channel mouth. Stratigraphic homogeneity
within the cores collected from the Freshwater Bayou mudbank (Cores CSH, CSI, CSE,
and CSJ) indicates very uniform sedimentary characteristics within that accretional zone.
Lack of variability in grain size between the isotopically identified dredged material and
the sediment below it (as in Cores CSI and CSJ) implies that sediment removed from the
Freshwater Bayou channel has a composition indistinguishable from that of sediment
naturally accumulating on the chenier plain.
The low activity levels of '"Cs and ^'°Pb in Core CSC, combined with the high
peat content observed during core dissection, indicate that this core primarily sampled
material from the peat terrace that underlies the chenier plain surface. These results from
this site, the westernmost of the near-shore cores, imply sediment bypass in this region
(~92.55°W) rather than long-term accumulation presently. This conclusion agrees with
the observation of eroding conditions at that location made during the coastal
characterization survey (Figure 2-4a).
69
2.5. Conclusions
The chenier plain coast in March 2001 contained alternating areas of erosion and
accretion. Major active mudflat extent was limited relative to that identified in previous
studies, confined to a stretch of shoreline 17 km long immediately west (downdrift) of the
Freshwater Bayou channel, on the eastern chenier plain. Previous studies have identified
this area as a rapidly prograding mudflat that accretes during energetic conditions
associated with the passage of winter cold fronts. Isotopic analyses imply contribution by
dredged material to the sediment in this accreting region adjacent to Freshwater Bayou.
Aerial photographs suggest that accretion, initiated by Atchafalaya River sediment and
continuous in that area since the late 1980s, are enhanced by the presence of a dredge
dump at the updrift end of the accreting mudflat. Although volumetric contribution from
the dredge dump is likely minor compared with naturally accreting sediment, positive
feedback mechanisms involving wave attenuation over a muddy sea bed offshore may
cause the dredged sediment to "seed" natural accretion beyond what occurred before the
placement of the dredge dump. The area of the accreted zone has more than tripled
between 1990 and 2001, and in Spring 2001 covered more than 4.5 km^.
Near-shore cores that contained unconsolidated sediment rather than peat
displayed homogenous composition and porosity, with sand and clay dominating the
stratigraphy of all cores. Several prominent sand horizons identified in the sub-surface
east of the Freshwater Bayou mudflat zone were not detected in cores within the
Freshwater Bayou mudflat. Their absence in the mudflat cores is believed to reflect rapid
accumulation rates at the mudflat sites relative to locations that did not correspond to
coastal progradation.
70
Acknowledgements
Dr. Oscar K. Huh (Louisiana State University) is thanked for the photographs that
appear in Figure 2-3. David Velasco and Peter Schultz assisted in all aspects of field
work and core collection. The captain (Joe Malbrough) and crew of the RN Pelican
provided much appreciated help and logistical support for this field work, as did Gail
Kineke and Mead Allison (Tulane University). Jon Andrews and Ken Buesseler at
WHOI, Michael Casso and Mike Bothner at the USGS, and Dan Duncan at Tulane
assisted with gamma counting of sediment samples. Robert Morgan of the Army Corps of
Engineers provided valuable information regarding dredging activity. Bruce Coffland at
the NASA Ames Research Center facilitated procurement of aerial photographs. Valeria
Quaresma (Southampton Oceanography Centre) is thanked for helpful discussion
regarding erosional processes on marsh shorelines. Ryan Prime, Katie Fernandez, Ryan
Clark, Jason Draut, Liz Gordon, Mary Cathey, and Miguel Goili assisted with lab work.
Shea Penland and Karen Westphal are thanked for their comments and discussion
regarding disposal of dredged sediment in this field area. This work was funded by ONR
grant NOOO14-98-1-0083 to G. C. Kineke, and by student grants to A. Draut from the
GSA Foundation and the AAPG.
' Kirby (2000) proposed using dredged sediment in combination with a floating structure anchored offshore to further attenuate incoming wave energy; no such structure is in use on the Louisiana chenier plain.
71
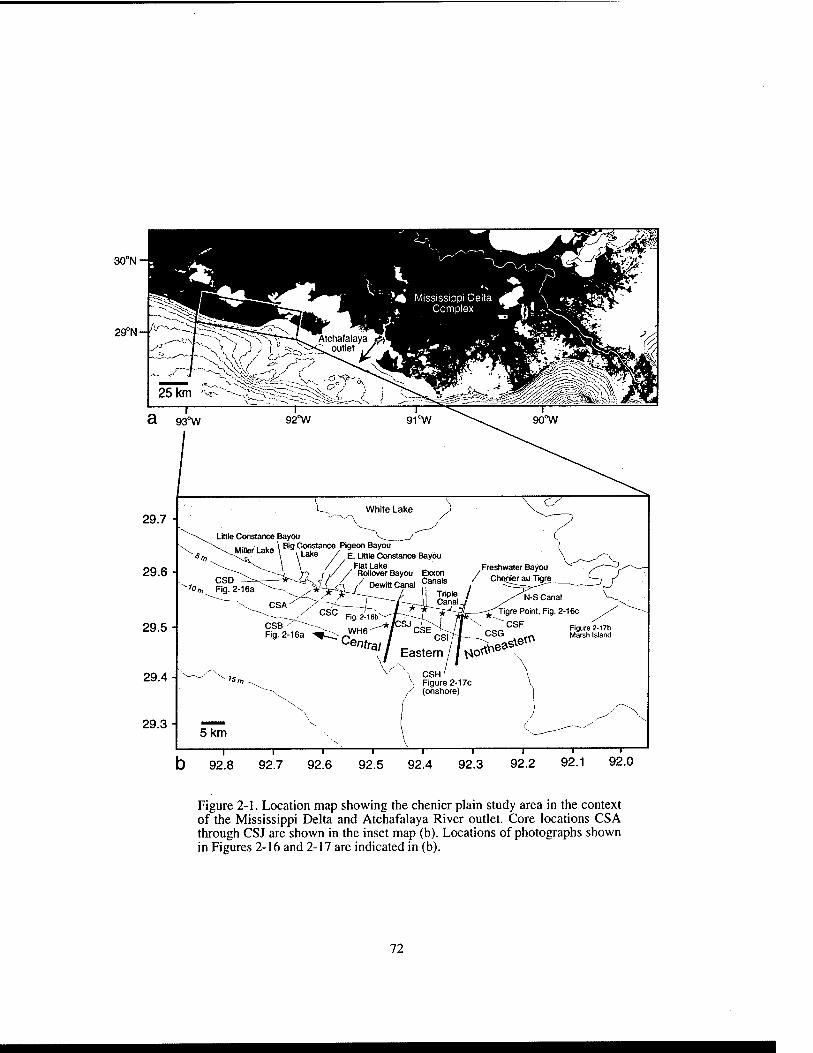
30°N
29°N-
Figure 2-1. Location map showing the chenier plain study area in the context of the Mississippi Delta and Atchafalaya River outlet. Core locations CSA through CSJ are shown in the inset map (b). Locations of photographs shown in Figures 2-16 and 2-17 are indicated in (b).
72
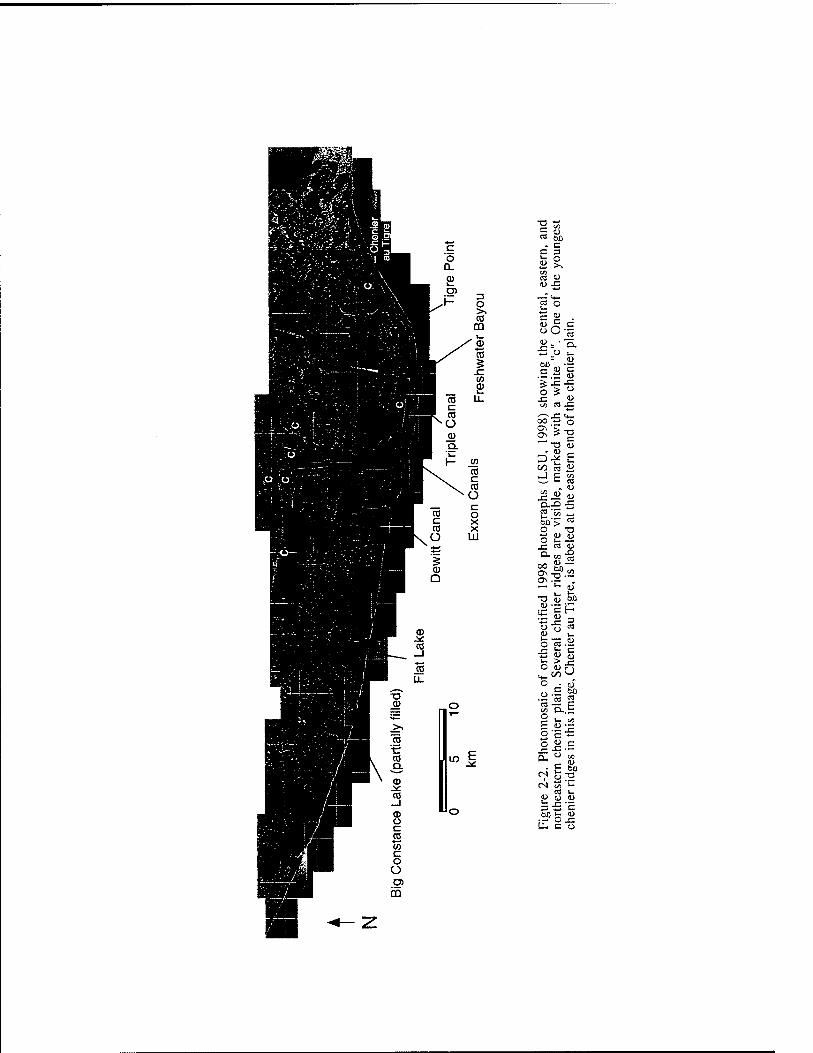
■a t? 5 •" . c
2^
— <*. g o
u = c
^ = •0. ■£ o V.
: 1) 60 • — c a =
° ^ ^
dE ^
Q.X> ■
O T3 ■" U 0) O w- —
o.,,, -^
It- — >- (U
11? O o «
o c^J .2i *-. ^ (U
O . oT
M ex.5 9 V. ^
2 c-S o^ c
,, ^ "- o a> (L> = :Sc
tu c o
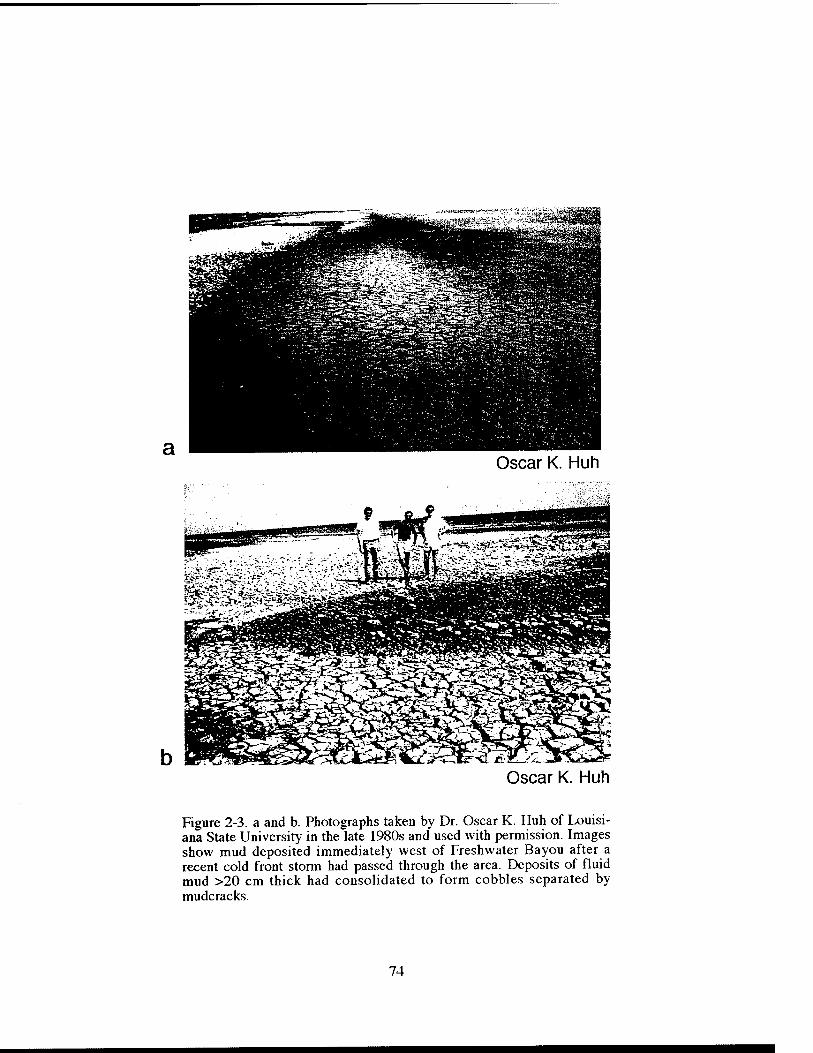
Oscar K. Huh
Oscar K. Huh
Figure 2-3. a and b. Photographs taken by Dr. Oscar K. Huh of Louisi- ana State University in the late 1980s and used with permission. Images show mud deposited immediately west of Freshwater Bayou after a recent cold front storm had passed through the area. Deposits of fluid mud >20 cm thick had consolidated to form cobbles separated by mudcracks.
74
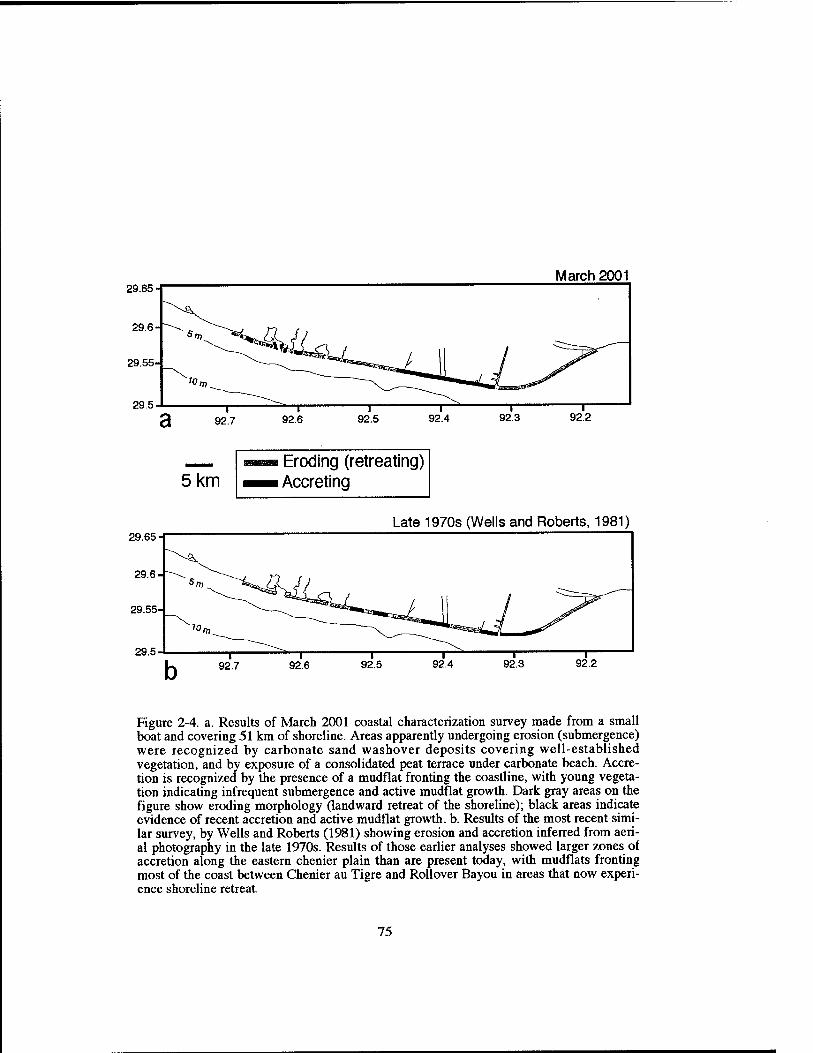
March 2001 29.65
29.6-
29.55-
29.5
29.65
5 km I Eroding (retreating) I Accreting
Late 1970s (Wells and Roberts, 1981)
Figure 2-4. a. Results of March 2001 coastal characterization survey made from a small boat and covering 51 km of shoreline. Areas apparently undergoing erosion (submergence) were recognized by carbonate sand washover deposits covering well-established vegetation, and by exposure of a consolidated peat terrace under carbonate beach. Accre- tion is recognized by the presence of a mudflat fronting the coastline, with young vegeta- tion indicating infrequent submergence and active mudflat growth. Dark gray areas on the figure show eroding morphology (landward retreat of the shoreline); black areas indicate evidence of recent accretion and active mudflat growth, b. Results of the most recent simi- lar survey, by Wells and Roberts (1981) showing erosion and accretion inferred from aeri- al photography in the late 1970s. Results of those earlier analyses showed larger zones of accretion along the eastern chenier plain than are present today, with mudflats fronting most of the coast between Chenier au Tigre and Rollover Bayou in areas that now experi- ence shoreline retreat.
75
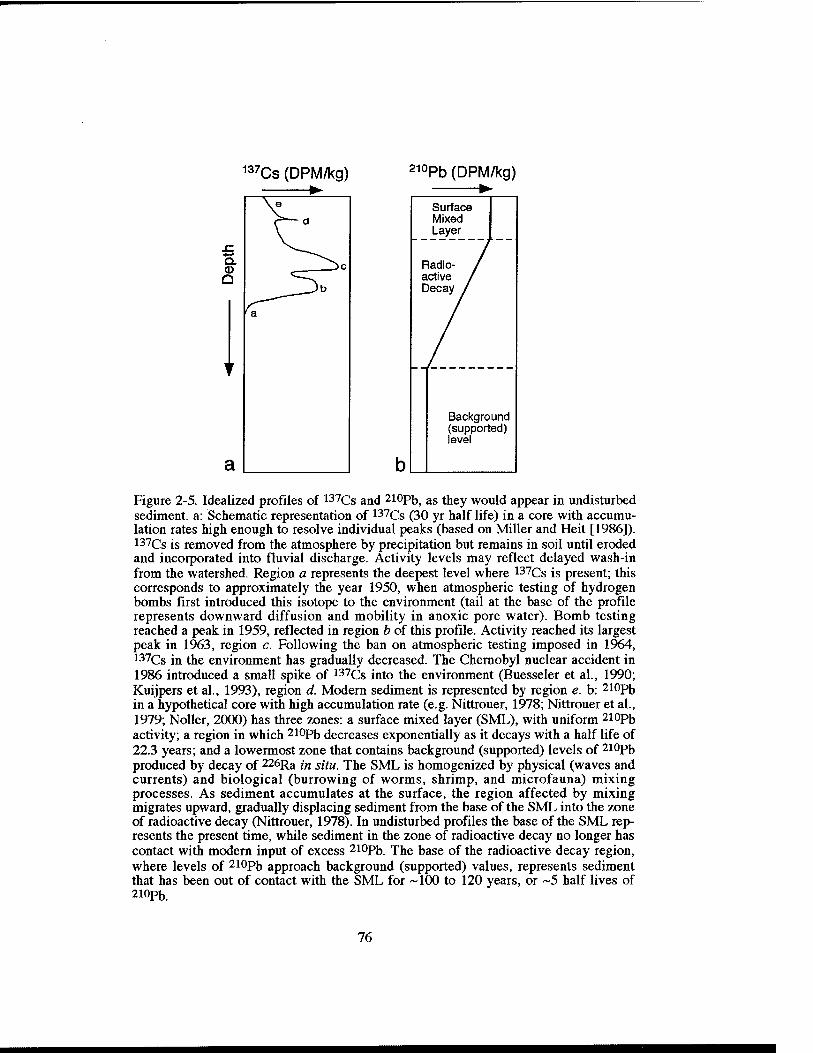
137CS (DPM/kg) 2iopb (DPM/kg)
Surface Mixed Layer
Radio- / active / Decay /
b
Background (supported) level
Figure 2-5. Idealized profiles of iS'^Cs and 2lOpb, as they would appear in undisturbed sediment, a: Schematic representation of ^^'^Cs (30 yr half life) in a core with accumu- lation rates high enough to resolve individual peaks (based on Miller and Heit [1986]). 137Cs is removed from the atmosphere by precipitation but remains in soil until eroded and incorporated into fluvial discharge. Activity levels may reflect delayed wash-in from the watershed. Region a represents the deepest level where ^'^'^Cs is present; this corresponds to approximately the year 1950, when atmospheric testing of hydrogen bombs first introduced this isotope to the environment (tail at the base of the profile represents downward diffusion and mobility in anoxic pore water). Bomb testing reached a peak in 1959, reflected in region b of this profile. Activity reached its largest peak in 1963, region c. Following the ban on atmospheric testing imposed in 1964, l37Cs in the environment has gradually decreased. The Chernobyl nuclear accident in 1986 introduced a small spike of I37cs into the environment (Buesseler et al., 1990; Kuijpers et al, 1993), region d. Modem sediment is represented by region e. b: 2i0pb in a hypothetical core with high accumulation rate (e.g. Nittrouer, 1978; Nittrouer et al., 1979; Noller, 2000) has three zones: a surface mixed layer (SML), with uniform 2l0pb activity; a region in which 210pb decreases exponentially as it decays with a half life of 22.3 years; and a lowermost zone that contains background (supported) levels of 2l0pb produced by decay of 226Ra in situ. The SML is homogenized by physical (waves and currents) and biological (burrowing of worms, shrimp, and microfauna) mixing processes. As sediment accumulates at the surface, the region affected by mixing migrates upward, gradually displacing sediment from the base of the SML into the zone of radioactive decay (Nittrouer, 1978). In undisturbed profiles the base of the SML rep- resents the present time, while sediment in the zone of radioactive decay no longer has contact with modern input of excess 2l0pb. The base of the radioactive decay region, where levels of 2l0pb approach background (supported) values, represents sediment that has been out of contact with the SML for ~100 to 120 years, or ~5 half lives of 210pb.
76
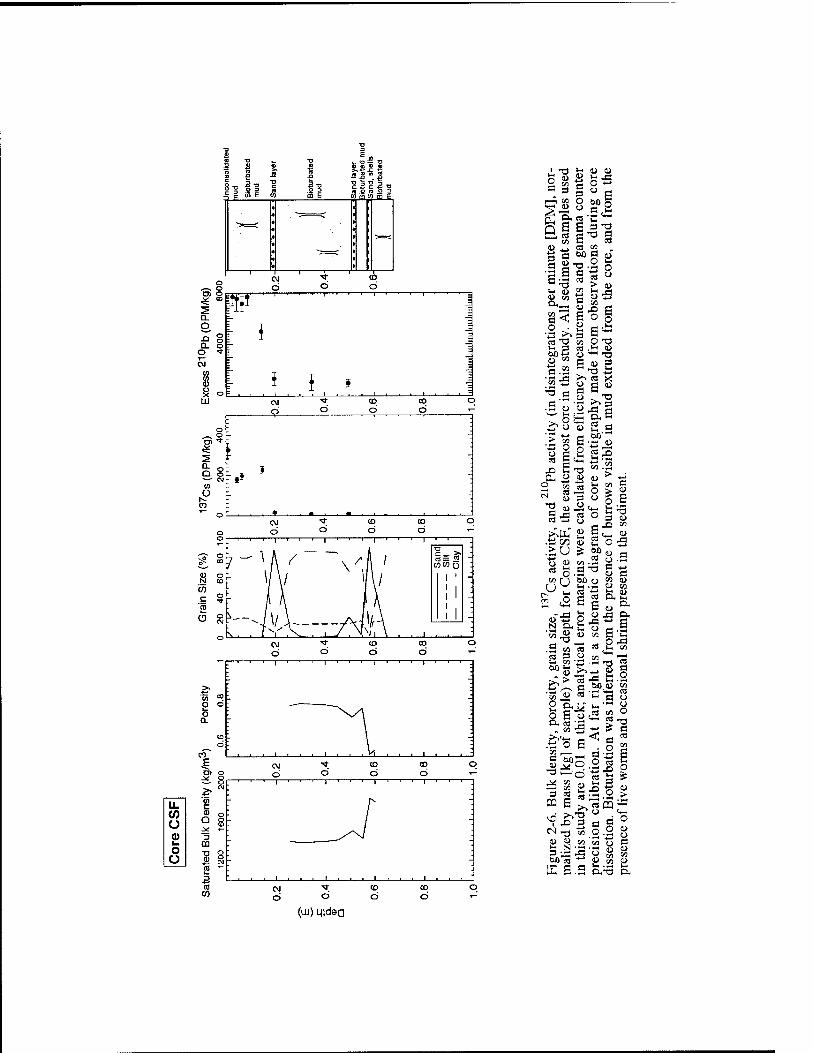
Q- Q
O
to c
5
o a
CO
E
u. c CO tu o o Q a m D v. CQ O o E 8
■(5 '
1 T3 ir: w u
^. =* § " 6
■" ^ 60 a u
n
S-0.2 1§
I- S a !- ^ CLi , n w ^
(s "g CO p 13 i-c p ca ,!-< (U
a S <U 3
"■S o d S ■« rt 55 "^ -rt
.2J3 § •o a
5 P «S
2 1 « o
5=^ ja c3 o C3 •4-* 3 D
j-X) " 5 =—, « 2 o6
o.a « a
>^ f 2 tS fe « 6"' « Cu „
-M o « JO
ca t-4 en
55 « U K g C • S M (8
C3 3 O „ ■ — W( OT 'Ti -^ -rt ra
•aT > rt •* C -is
S u « fc, j3 (3
o S -Is '^ nJ -ri ^ Vi S -^ > d
CO ,—, a -^ g S^o.o « 5
CQ g >,«CQ;2
Cs) — ti o O P « M to tj 5 ;S '^ O i .. 60 13 -^ <U M <t>
o
(ill) mdea
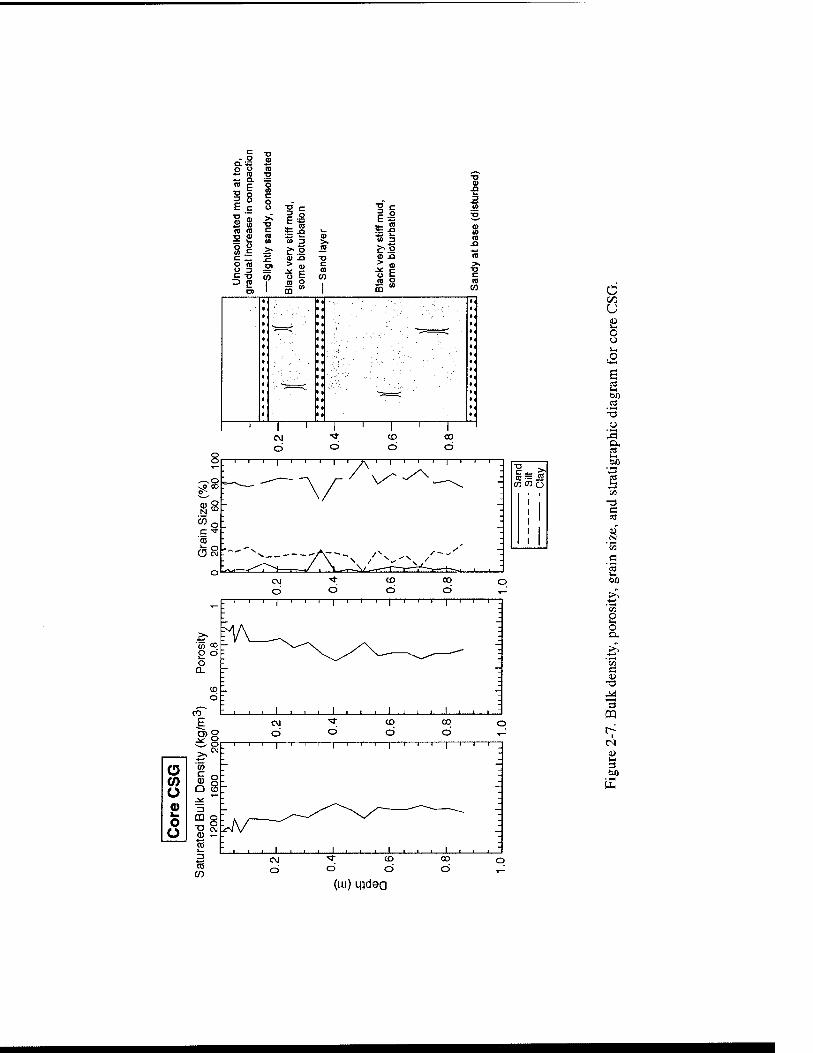
Q..= <= ■i= (0 T3 t: a.
(0 ni
O U si ■a c
•o c
u_ to r ff m
ud,
batio
n
T3 01 n §, 13 5 S "
(0 CO 3 >, £* 2 J5 £• o c ~ ^ OJ XI ■a « -a o ra
f.i c > a,
^-f^ CO
1 en o t
g^ i^ o
o
60 s -3
S3
a
I
3
(ui) M5d9a
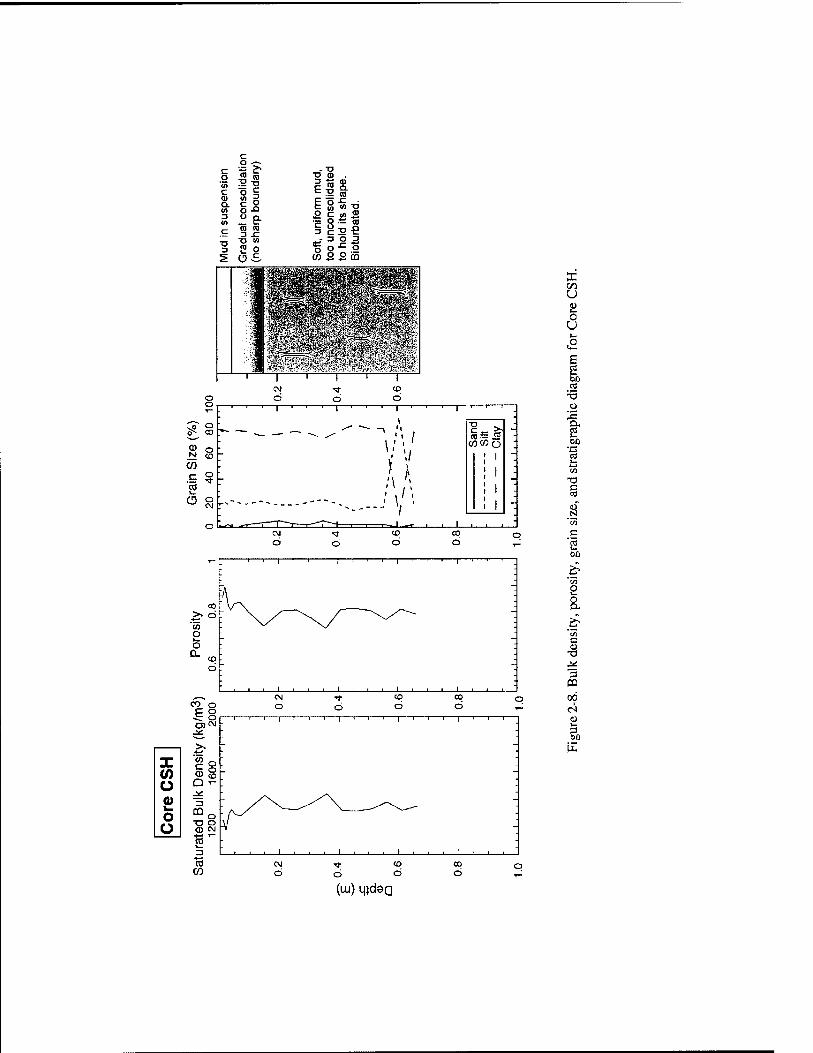
X o 0)
o o
c o c <v a. «) <n c
3
C
•|£=
"I o -o " 8-
•o "> «> o
c O
£ c to ® ? P := TO
*j^ = o 3 f o-^ g CO £ £ CO
^ 1 1 1 1 1 1 1 1 f ' ;
00 ■V\ '-
>< d " \ /—\ / "^-^/""^ ~ CO
§ : \/ \y
-^
^ CD ;
o
III.!. CO O
CM d d
CD
d oo d
(0 c 8 U T-
Jx:
3 m o T7 o (D CM
to 3
CO CM d
a: u 0 u
bo cS
a, G3
CO
T3 c
N
P ■5 t- 00
.$^ S
T3 ;^ 03
00
3 SJO
(LU) l|}d9a
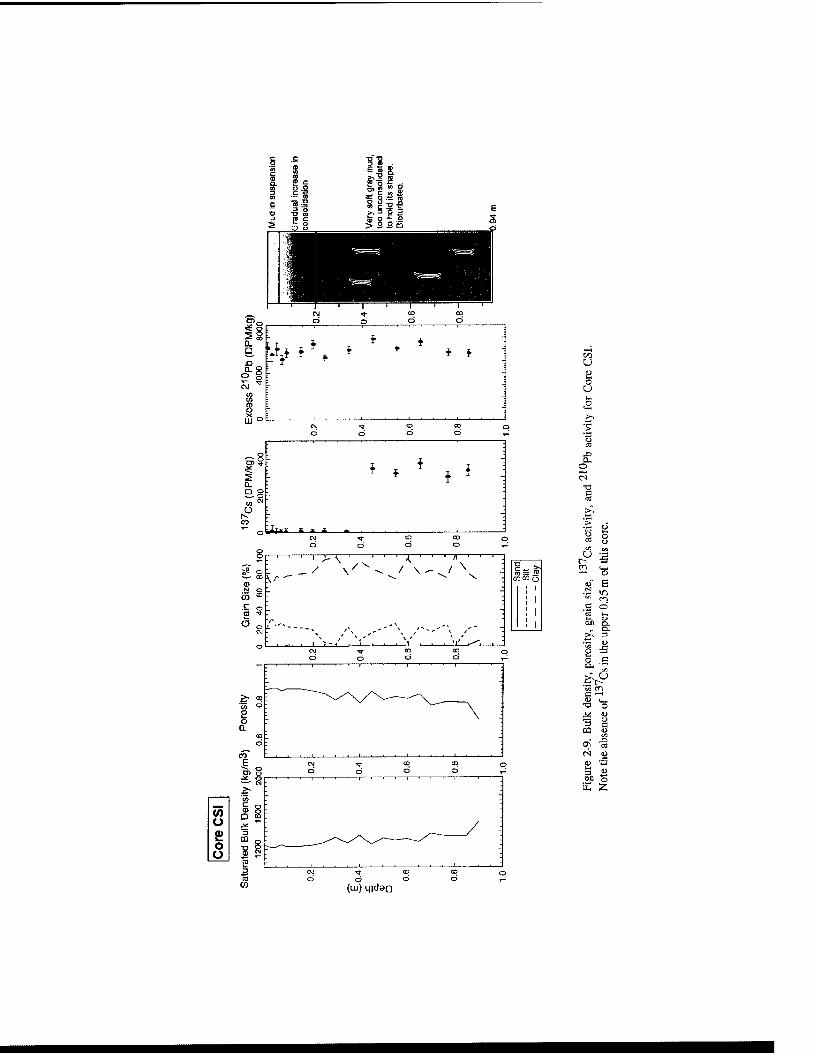
u £ o
t/2 u
a. o
•a
r^ 3 fi
O
«" H ir^
tn en C r-»
>, n a>
?i ■H o c P-r
u -- l/i ■o G
•S -s
oa o o\ C3 (N U 91 5 BO o
LL, 2
(ui) ifldea
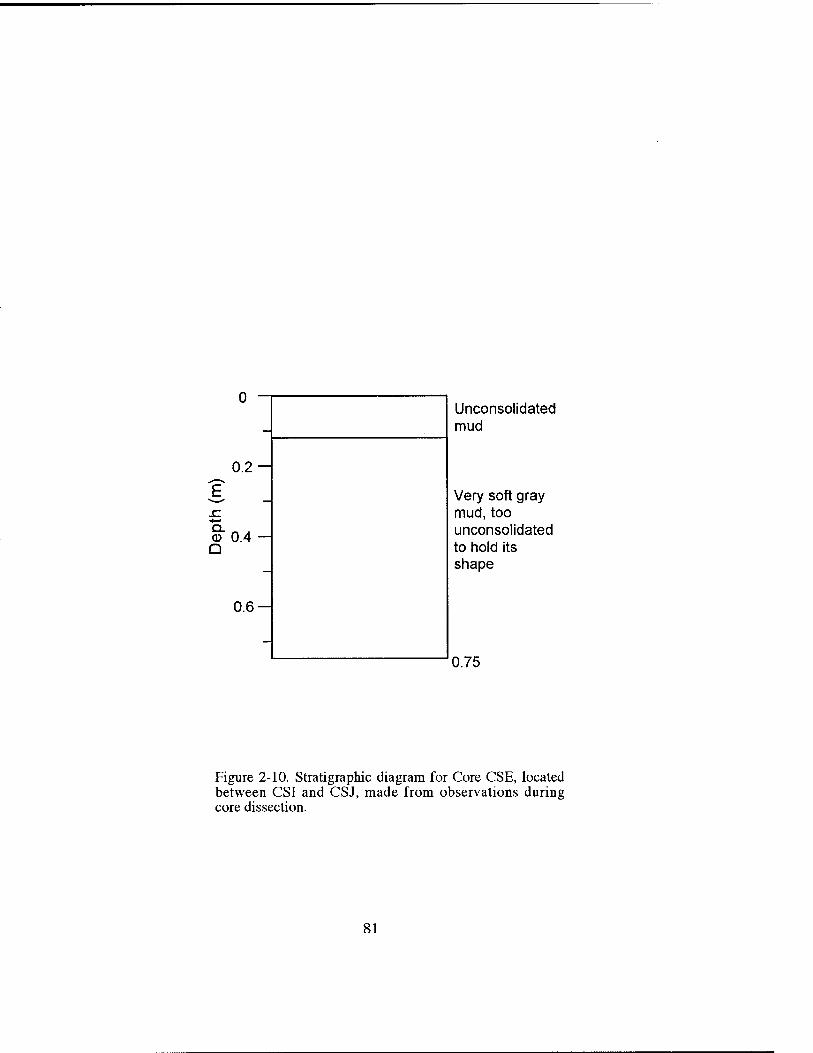
Unconsolidated mud
Very soft gray mud, too unconsolidated to hold Its shape
0.75
Figure 2-10. Stratigraphic diagram for Core CSE, located between CSl and CSJ, made from observations during core dissection.
81
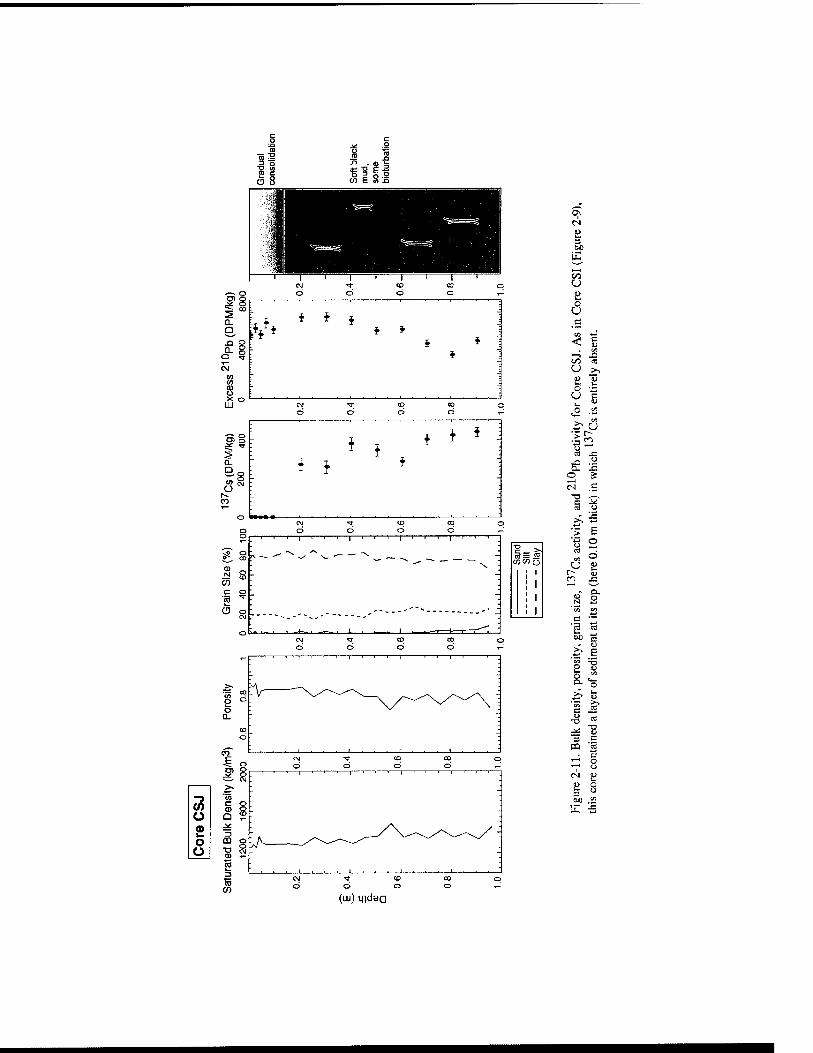
6 8 o 3 0.2 (n S in J3
O a> O o
(S n =1 W)
UL, ^H
C/1 U
f|>
o U
1=1
u
< t/3
1—> n ol « U >i
u o U p
i:^ U *> rt ..c: ^ CJ
a. x: o ^ cs tJ
•n ,„^
s ^ u
>. j=
> fc ^ o o
c; ^ I-- fi x: i-H
p o. QJ n
e C3 rt DO p
1) ^ E g V
3 OQ
C £
(uj) Mjdsa
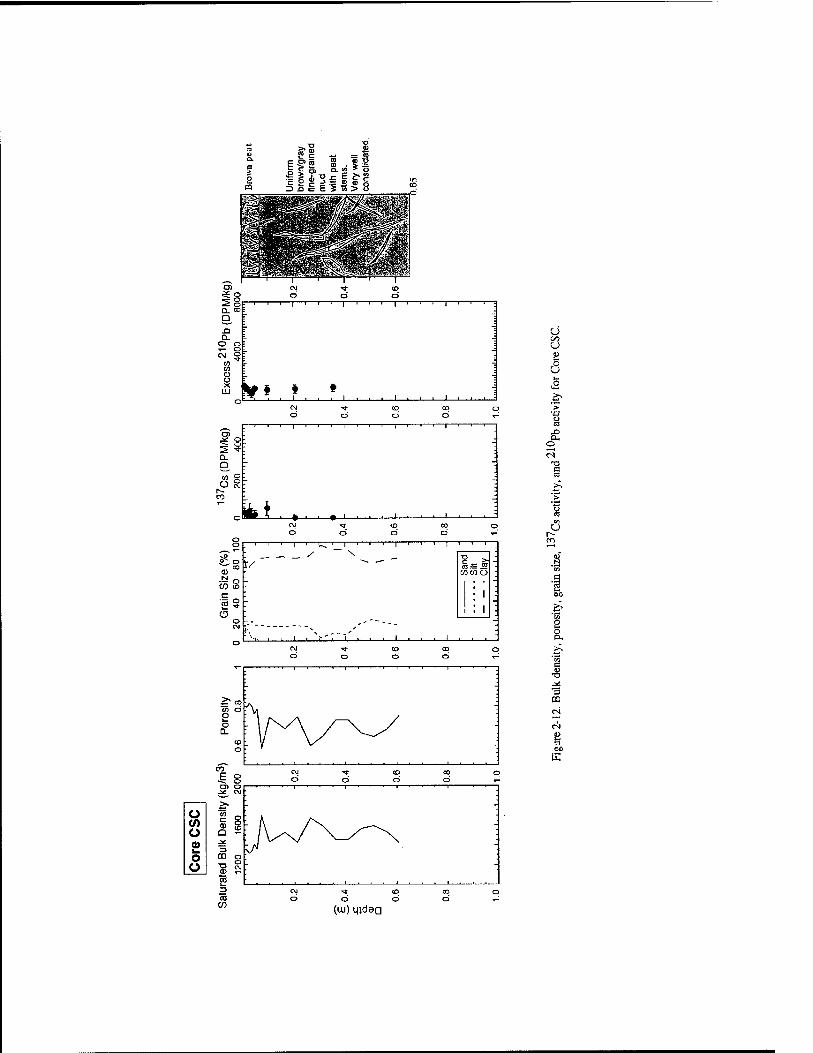
Bro
wD p
eat
Uni
form
br
own/
gray
fin
e-gr
aine
d m
ud
with
pea
t st
ems.
V
ery
wel
l co
nsol
idat
ed.
).6.
i
"3 11 CL<0 Q
.Q Q.
° 8 CNi O
CO CO (U
§^ LU
1 -I 1 w -^r (D o o o
. 1 1 1 1 I t > 1 1 . ■ 1 1 > > 1 . > .
r
rr * . 1 . . . 1 . . . 1 , , , 1 . , ,
1 <J ] 0
1 6 ] a
CU ^ CD G d O
CO d
o >
^8 CL Q
to g O g
m
o
o
t ' ' ' 1 ' ' ' 1 :
H T.^....i...i...i... CM ^ <D (li CD O
CO d 5 .-
CO CD
O o CM
.'''!''—' ■ 1 1 1 1
1 C 2 >
DCOO
J 1 : 1
1 1 oo
. 1
- s o
O PJ -c CO CD <3 CD
oo d
o >^ "^ '53
CO o o
CO d fVA^^
—' ■■
■ ■
Fig
ure
2-12
. B
ulk
de
CO
^ 8 CM TT CD O CJ o
CO d
o
2£ CJ
OQ o
:jv..r^^. o £ o o
-
■
3
CO
c\j -* to c> o d
(uj) Midea
CO d
p
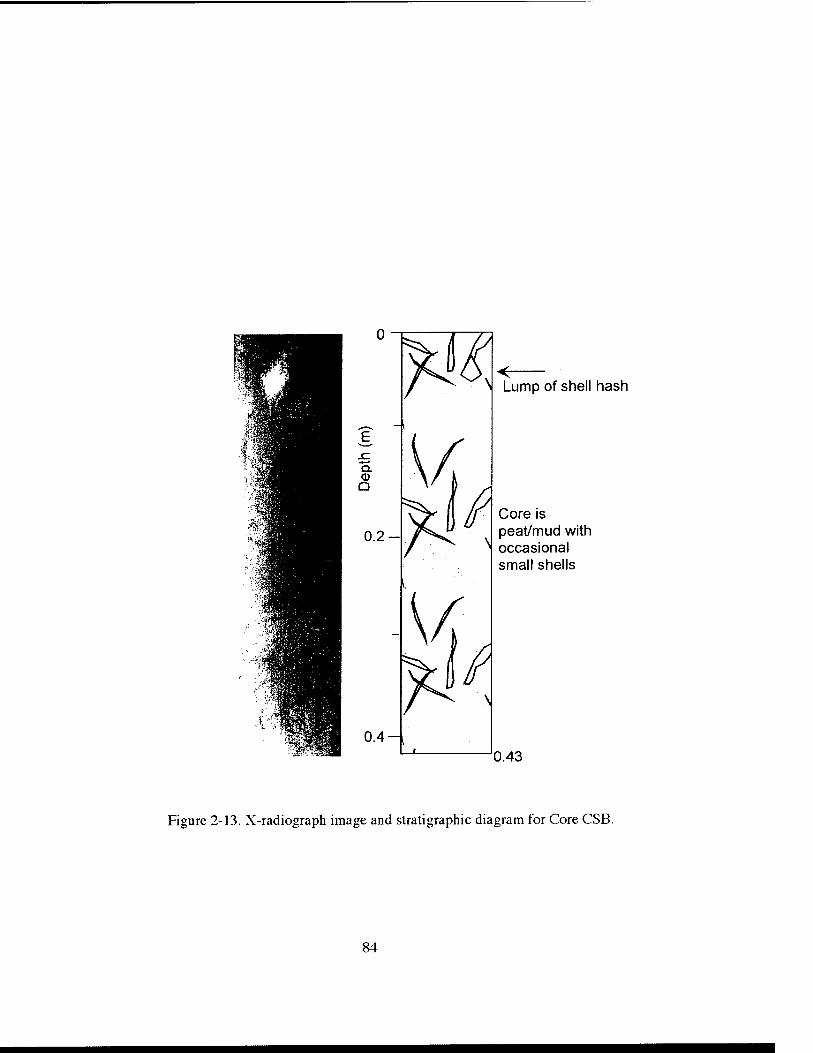
N Lump of shell hash
Core is peat/mud with occasional small shells
0.43
Figure 2-13. X-radiograph image and stratigraphic diagram for Core CSB.
84
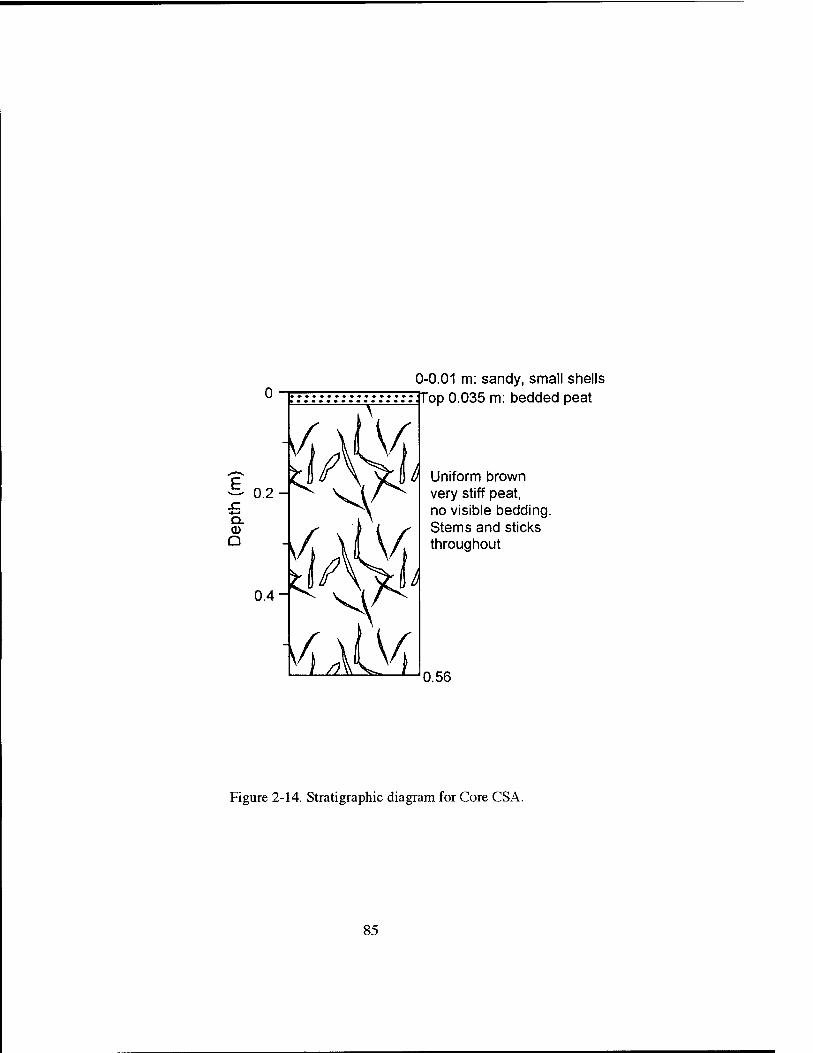
Q.
Q
0.01 m: sandy, small shells fop 0.035 m: bedded peat
Uniform brown very stiff peat, no visible bedding. Stems and sticks throughout
0.56
Figure 2-14. Stratigraphic diagram for Core CSA.
85
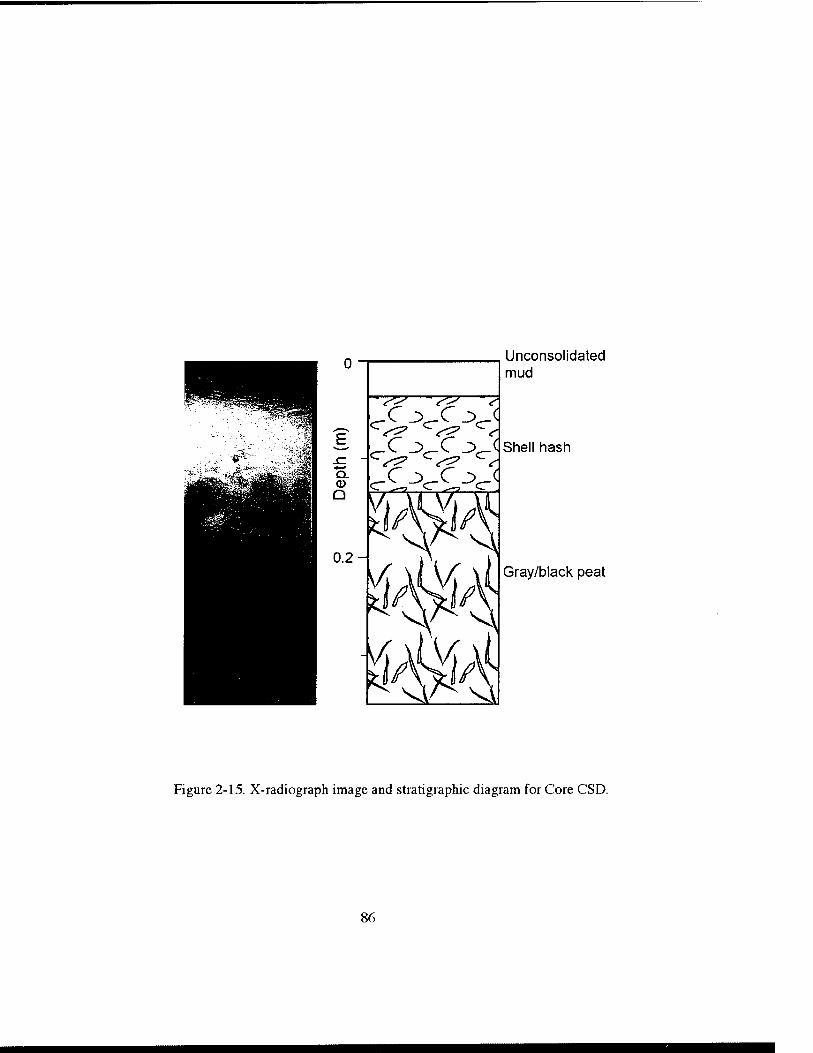
C j> C j> (
^C 3^C 3^ H Shell hash
Unconsolidated mud
Gray/black peat
Figure 2-15. X-radiograph image and stratigraphic diagram for Core CSD.
86
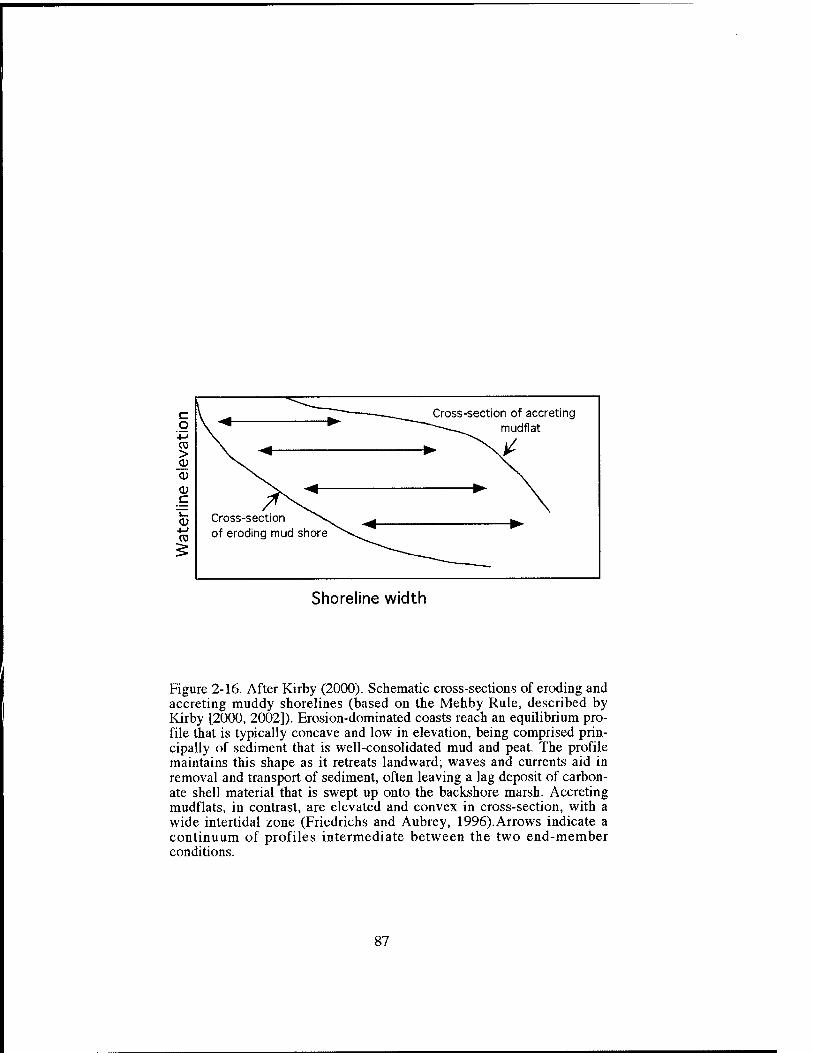
c o
■M CO >
o c
■M TO
^ Cross-section of accreting ~-~--„..^^ mudflat
^T
Cross-section ^\. of eroding mud shore ^"^
P* \
^
Shoreline width
Figure 2-16. After Kirby (2000). Schematic cross-sections of eroding and accreting muddy shorelines (based on the Mehby Rule, described by Kirby [2000, 2002]). Erosion-dominated coasts reach an equilibrium pro- file that is typically concave and low in elevation, being comprised prin- cipally of sediment that is well-consolidated mud and peat. The profile maintains this shape as it retreats landward; waves and currents aid in removal and transport of sediment, often leaving a lag deposit of carbon- ate shell material that is swept up onto the backshore marsh. Accreting mudflats, in contrast, are elevated and convex in cross-section, with a wide intertidal zone (Friedrichs and Aubrey, 1996). Arrows indicate a continuum of profiles intermediate between the two end-member conditions.
87
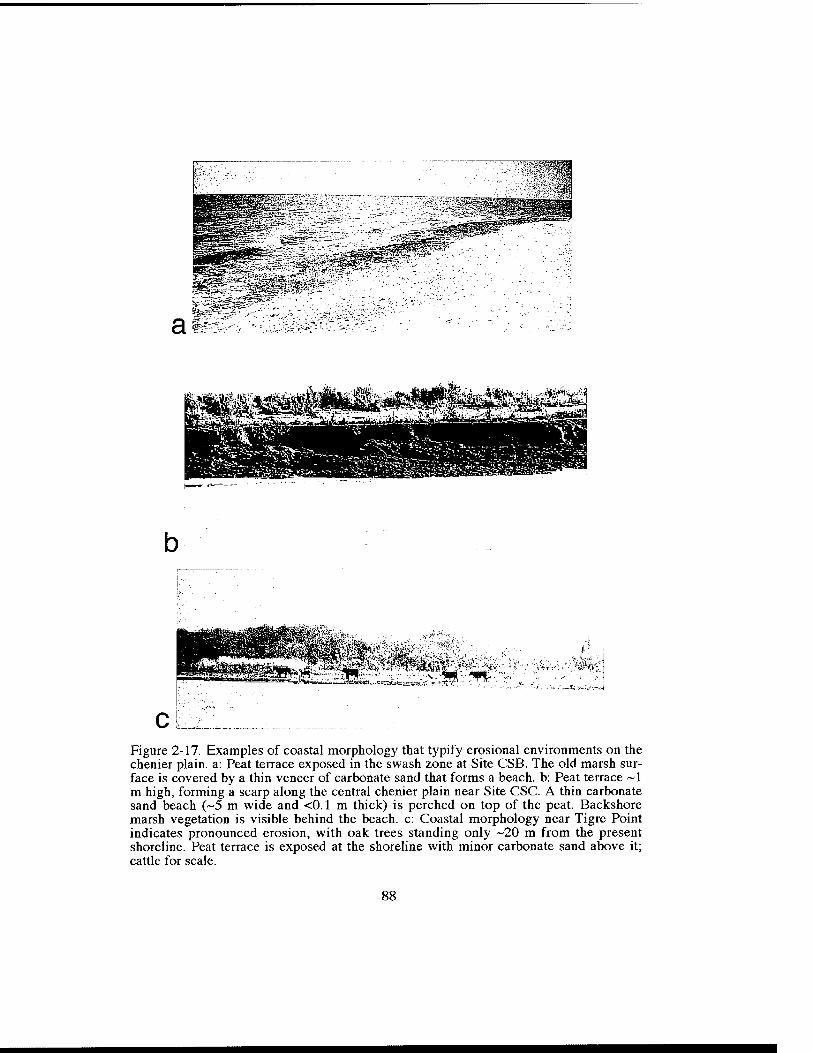
3W TT- \i*ik
Figure 2-17. Examples of coastal morphology that typify erosional environments on the chenier plain, a: Peat terrace exposed in the swash zone at Site CSB. The old marsh sur- face is covered by a thin veneer of carbonate sand that forms a beach, b: Peat terrace ~1 m high, forming a scarp along the central chenier plain near Site CSC. A thin carbonate sand beach (^5 m wide and <0.1 m thick) is perched on top of the peat. Backshore marsh vegetation is visible behind the beach, c: Coastal morphology near Tigre Point indicates pronounced erosion, with oak trees standing only ~20 m from the present shoreline. Peat terrace is exposed at the shoreline with minor carbonate sand above it; cattle for scale.
88
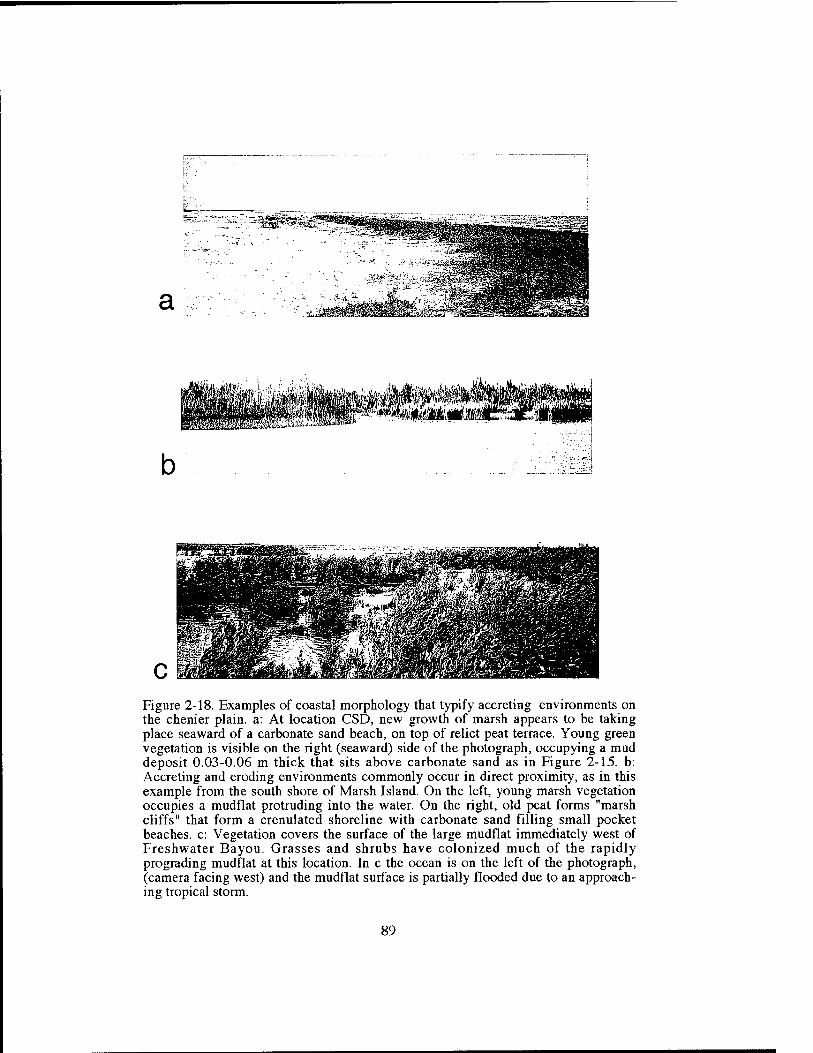
-?s^r;a^j^
a rjSEik?!
b
Figure 2-18. Examples of coastal morphology that typify accreting environments on the chenier plain, a: At location CSD, new growth of marsh appears to be taking place seaward of a carbonate sand beach, on top of relict peat terrace. Young green vegetation is visible on the right (seaward) side of the photograph, occupying a mud deposit 0.03-0.06 m thick that sits above carbonate sand as in Figure 2-15. b: Accreting and eroding environments commonly occur in direct proximity, as in this example from the south shore of Marsh Island. On the left, young marsh vegetation occupies a mudflat protruding into the water. On the right, old peat forms "marsh cliffs" that form a crenulated shoreline with carbonate sand filling small pocket beaches, c: Vegetation covers the surface of the large mudflat immediately west of Freshwater Bayou. Grasses and shrubs have colonized much of the rapidly prograding mudflat at this location. In c the ocean is on the left of the photograph, (camera facing west) and the mudflat surface is partially flooded due to an approach- ing tropical storm.
89
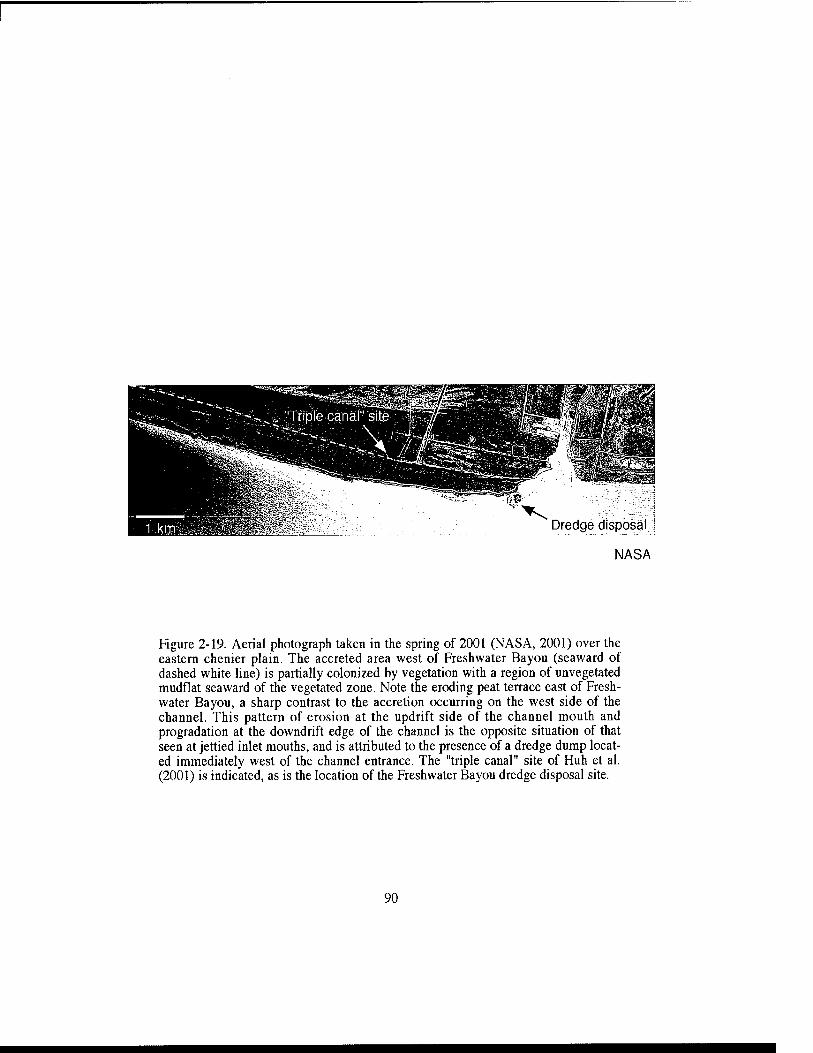
Dredge disposal j
NASA
Figure 2-19. Aerial photograph taken in the spring of 2001 (NASA, 2001) over the eastern chenier plain. The accreted area west of Freshwater Bayou (seaward of dashed white line) is partially colonized by vegetation with a region of unvegetated mudflat seaward of the vegetated zone. Note the eroding peat terrace east of Fresh- water Bayou, a sharp contrast to the accretion occurring on the west side of the channel. This pattern of erosion at the updrift side of the channel mouth and progradation at the downdrift edge of the channel is the opposite situation of that seen at jettied inlet mouths, and is attributed to the presence of a dredge dump locat- ed immediately west of the channel entrance. The "triple canal" site of Huh et al. (2001) is indicated, as is the location of the Freshwater Bayou dredge disposal site.
90
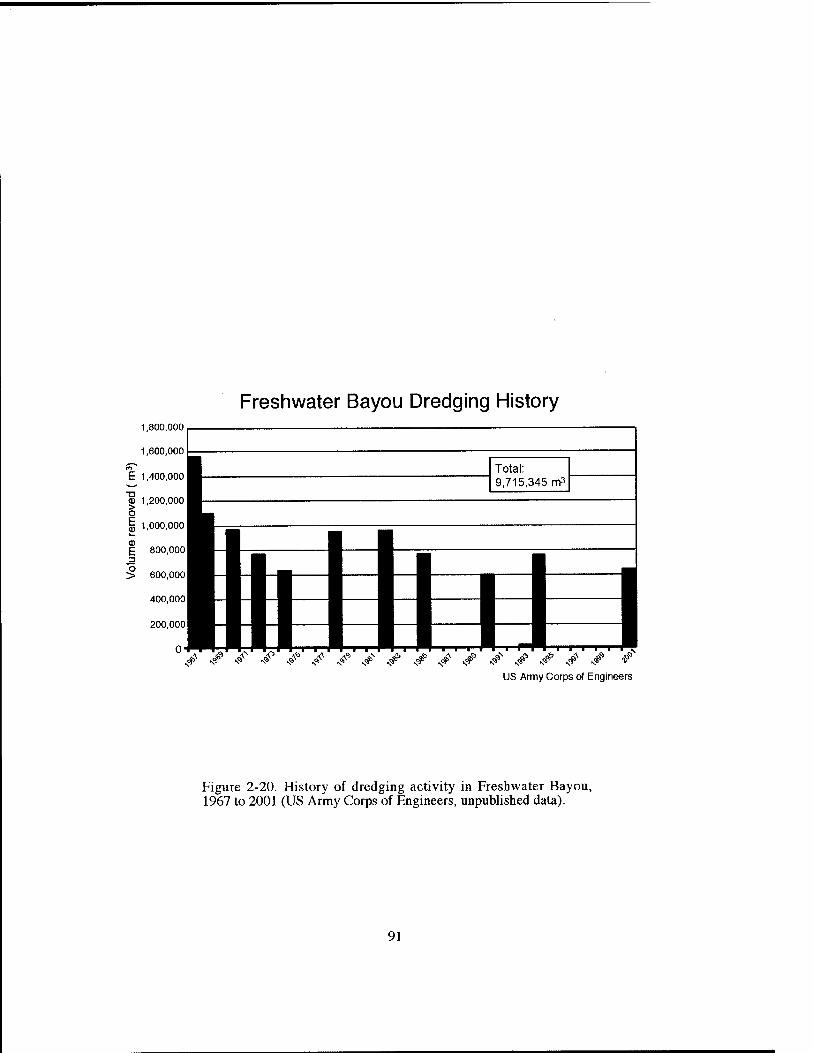
Freshwater Bayou Dredging History 1,800,000
1,600,000
E 1,400,000
<D 1,200,000
1,000,000
£ 800,000
> 600,000
400,000
200,000
° ^ .<# J' J^ .4^'' .o<^ .<?? ,*^ <.^ .^ ^ .<^ ^^ ^^ ^^ ^ ^ /■ ^*^ N# •?' ■$!■ ^^' ^^' ^^' ^#' ^^ <p -ir N^
us Army Corps of Engineers
Figure 2-20. History of dredging activity in Freshwater Bayou, 1967 to 2001 (US Army Corps of Engineers, unpublished data).
91
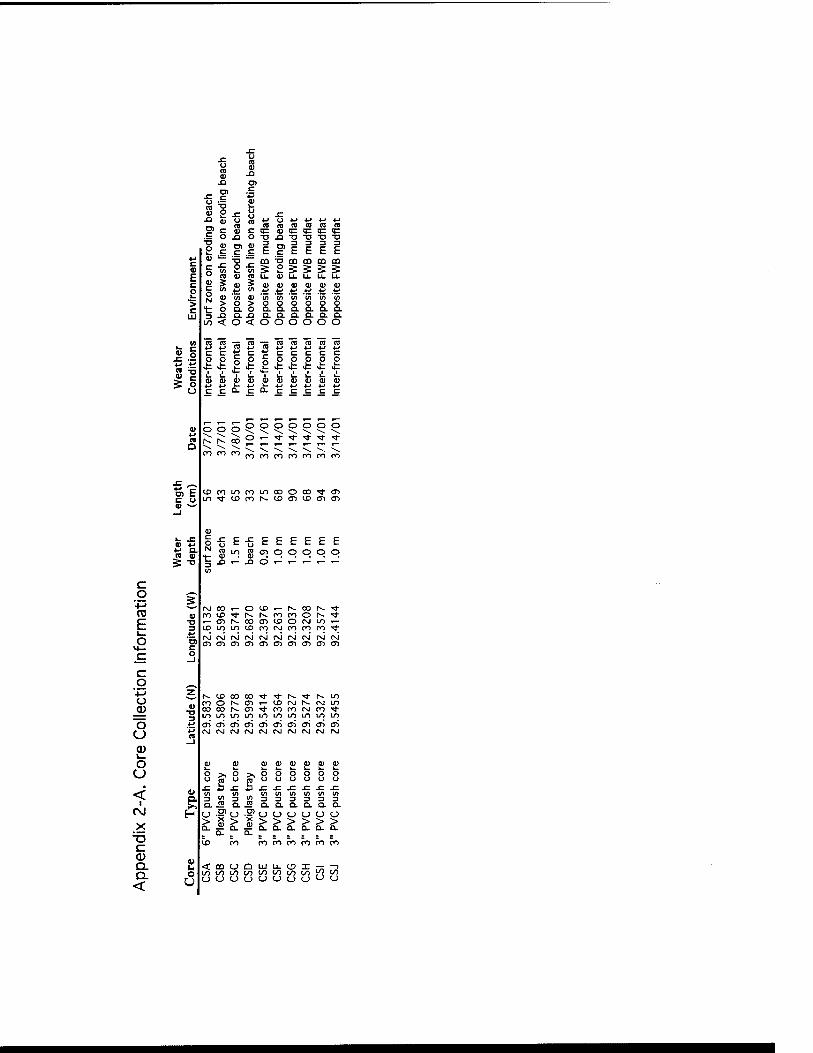
11 ♦3 id.
■2 = 5 o o
c O
TO E i_ o
_c c .2
'■M o
_a) ■Q o Q) i_ o o
X T3 C 0) Q. D. <
0) 4-> t-i Q. CO 0) 5 -O
a.
4>
o
o 0) SI ja m rn c
f u
lU P s: x: 0) () a 4-) c> *-» +j 4-* 4-* ffl va m ra (0 (U c S) c 3= « q= *: 3= iC o n o Tl n TI T) T) Tl
P c r c 3 F r
3 F
3 F
3 F
3 F
0) m ■a m m m m c o p w 5 p 5 5
(L) U- <u U- U- Ij- \x.
c (1) Q) <ii n) <i) <ii <l>
N <v a) itt > O > o o o t- o n o a a Q.
.Q Q. XI a. Q. D. a O. Q. 00 < O < O o O o O O
CO CO T= CB "Z: CO (0 CO nj CO
22o2o22eS2
CCD-CD-CCCCC
0000000 \ \ \ \ \ \ ^ O ^ ■>!- 'j- ■* ■>!- M-
ro ro CO ro fo ro ro
tDrotnromooooO'i-m
(1)
0 0 E x: r) E E E E E E
-1
0) XI
LO
XI <Tl 0 0 0 0 0
.- 0 .- t- 1- t- r-
fOiD-^t^r«-roroor--'i- .— <Dh-00(Dli>O(vJLr>>—
rJcNJrJcvJrOrJrsJcNJtNjrJ
iooooO'<l-Tt-r^'>3-s.Ln
LOLnLnLomLOLnLOLnLr)
C\Jt\JCSJC\J(NJ(SJC\JfSif\J(NJ
o >, o
V)
Qj 0) qj Oj 0) 0)
tf) (/I (/) tf) V) (/> 3!23!2333333 o-i: a.is 0.0.0.0.0.0.
og'cjg'uouuoo >g>g>>>>>> CD CO Forororofofo
<0QUQLLIL1.(J3X,-;:-;
Appendix 2-B. Particle Size Analysis and Sample Preparation
Grain size analyses were obtained using the SediGraph 5100 instrument,
manufactured by Micromeritics, Inc., at the Boston College Coastal Processes
Laboratory. This instrument employs the properties of X-ray attenuation to evaluate the
grain size distribution of sediment in a given sample. SediGraph particle size analyzers
have been in widespread use since the 1970s (this particular model since 1988). The
following is a brief description of the X-ray attenuation method of particle size analysis
and sample preparation used in this work.
The Micromeritics SediGraph 5100
Particle size analysis using the SediGraph 5100 is accomplished using the
sedimentation of a homogenous suspension. Like earlier SediGraph models, this
instrument determines the sediment concentration remaining in decreasing sedimentation
depths in a cell filled with a suspension of the sediment to be analyzed (McCave and
Syvitski, 1991; Coakley and Syvitski, 1991; Micromeritics, 2001). Sediment is
homogenized in a holding cell using an ultrasonic probe and mechanical stirrer. A small
sub-sample is suctioned into a cell made of transparent homalite (cell dimensions arel.27
cm wide, 3.5 cm high, and 0.53 cm thick, total volume 2.36 cm^). A finely collimated X-
ray beam is passed through the thin suspension-filled cell and the intensity of radiation
passing through the cell is measured while the cell is continuously lowered, speeding
analysis time. By assessing the degree to which X-rays passed through the suspension are
attenuated over time, changes in sediment concentration due to setding are determined.
Concentration changes are converted into equivalent spherical sedimentation diameter
93
(ESSD) values for the particles in suspension, thus assuming that all particles behave as
spheres and settle according to Stokes' Law. Results are reported as a cumulative
percentage of sample mass finer than a given equivalent spherical sediment diameter.
The introduction of SediGraph grain size analysis in the 1970s provided several
distinct advantages over earlier, manual methods of particle size analysis such as pipette
and hydrometer, including analysis speed, automated operation, the ability to process a
small sample size (~2 g), and isolation of the sample from temperature fluctuations
during analysis (Coakley and Syvitski, 1991; Micromeritics, 2001). The advertised range
of grain sizes handled by this machine is 0.1 - 300 |im. It should be noted, however, that
particle sizes <1 )im may be recorded inaccurately due to temperature fluctuations
(McCave and Syvitski, 1991). Analyses made during this thesis work extended from
sediment 0.1 - 63 )a.m in diameter, but the data presented in Chapters 2 and 4 show only
the break between silt and clay sizes as 4 (xm (Boggs, 1991) and therefore are not affected
by temperature-induced inaccuracies in measuring the sub-micron fraction.
X-ray Attenuation: Analytical Theory and Assumptions
This method of particle size analysis relies on the assumptions that grains are
spherical and behave according to Stokes' Law of settling, and that particles in the
sample have uniform density (and mineralogy). As discussed by Coakley and Syvitski
(1991), the settling behavior of particles can be fairly simply related to transmittance of
X-radiation through a homogenous suspension of sediment, which is used by the
SediGraph 5100 to calculate particle size distribution.
Stokes's law of particle settling is given as:
94
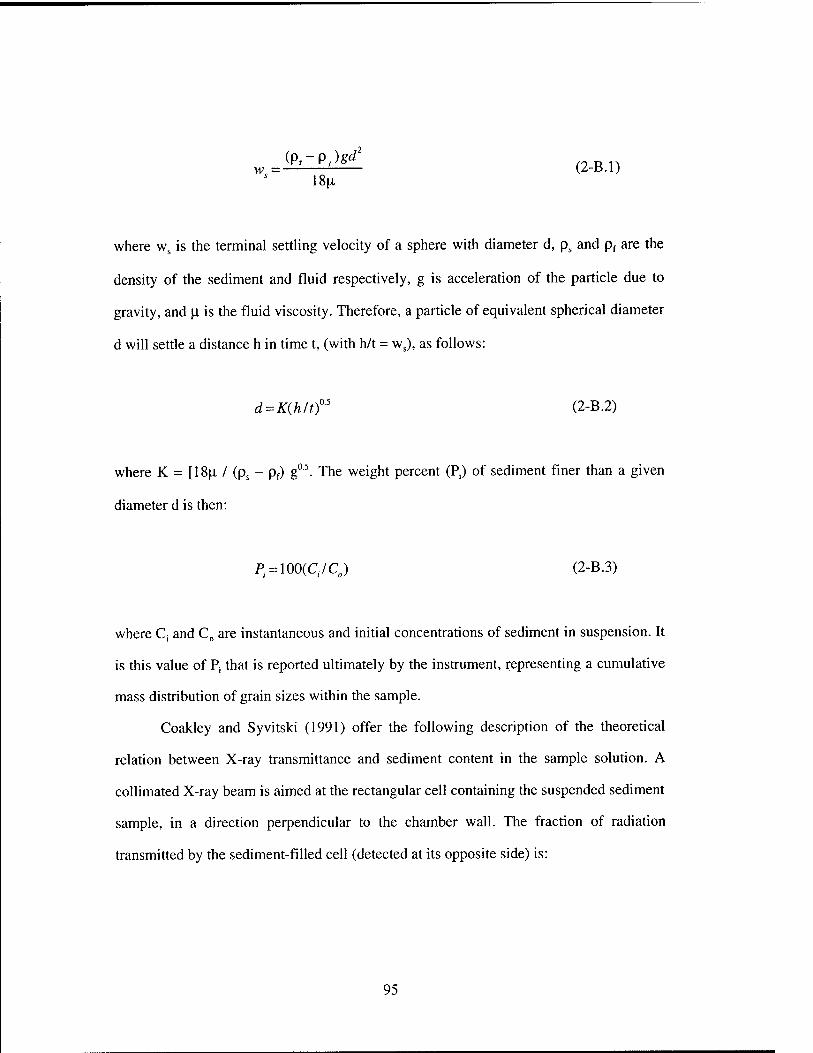
18[x
where w, is the terminal setthng velocity of a sphere with diameter d, p^ and Pf are the
density of the sediment and fluid respectively, g is acceleration of the particle due to
gravity, and \l is the fluid viscosity. Therefore, a particle of equivalent spherical diameter
d will setrte a distance h in time t, (with h/t = w^), as follows:
d = Kih/tf' (2-B.2)
where K = [18^1 / (p^ - pf) g°\ The weight percent (P) of sediment finer than a given
diameter d is then:
i^. = 100(C,/Q) (2-B.3)
where C^ and C^ are instantaneous and initial concentrations of sediment in suspension. It
is this value of Pj that is reported ultimately by the instrument, representing a cumulative
mass distribution of grain sizes within the sample.
Coakley and Syvitski (1991) offer the following description of the theoretical
relation between X-ray transmittance and sediment content in the sample solution. A
collimated X-ray beam is aimed at the rectangular cell containing the suspended sediment
sample, in a direction perpendicular to the chamber wall. The fraction of radiation
transmitted by the sediment-filled cell (detected at its opposite side) is:
95
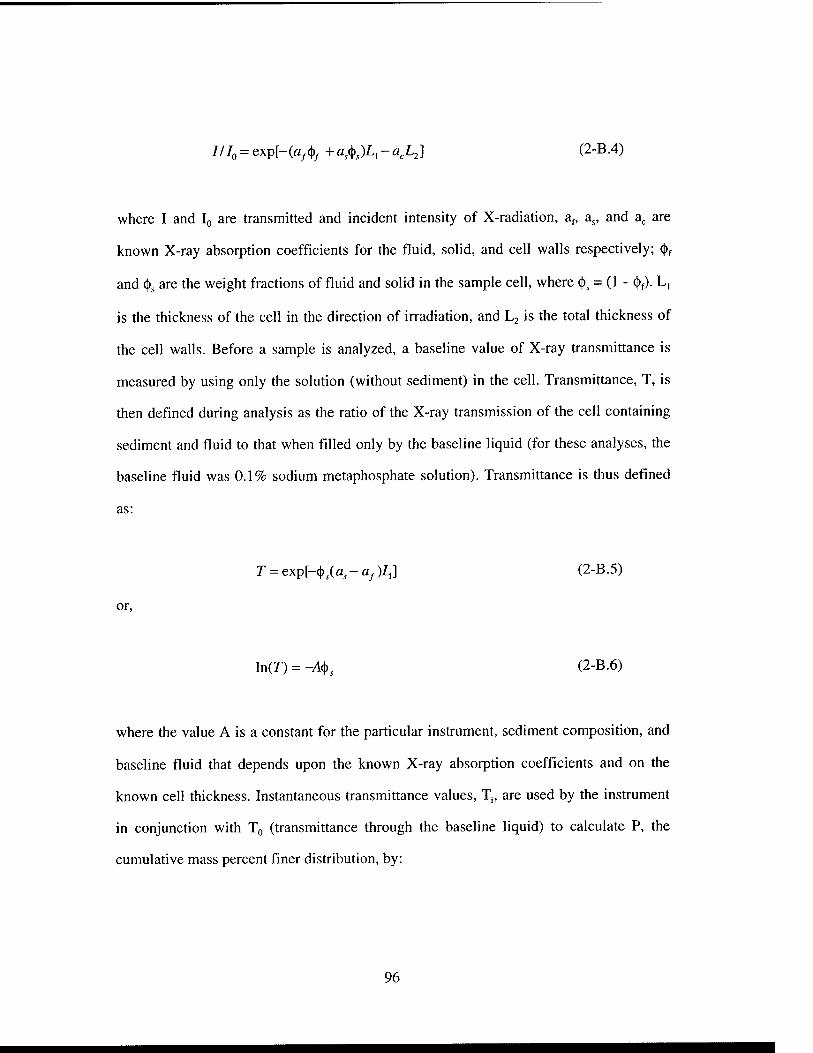
///o = exp[-(fl,(i), +a^<^JL,-a^L,] (2-B.4)
where I and IQ are transmitted and incident intensity of X-radiation, af, a,, and a^ are
known X-ray absorption coefficients for the fluid, solid, and cell walls respectively; (t)f
and (j), are the weight fractions of fluid and solid in the sample cell, where ^, = (1 - ^f). L,
is the thickness of the cell in the direction of irradiation, and Lj is the total thickness of
the cell walls. Before a sample is analyzed, a baseline value of X-ray transmittance is
measured by using only the solution (without sediment) in the cell. Transmittance, T, is
then defined during analysis as the ratio of the X-ray transmission of the cell containing
sediment and fluid to that when filled only by the baseline liquid (for these analyses, the
baseline fluid was 0.1% sodium metaphosphate solution). Transmittance is thus defined
as:
r = exp[-(|),(a,-apZ,] (2-B.5)
or,
ln(r) = -A(j), (2-B.6)
where the value A is a constant for the particular instrument, sediment composition, and
baseline fluid that depends upon the known X-ray absorption coefficients and on the
known cell thickness. Instantaneous transmittance values, Tj, are used by the instrument
in conjunction with TQ (transmittance through the baseline liquid) to calculate P, the
cumulative mass percent finer distribution, by:
96
P = 100(ln7;/lnro) (2-B.7)
Sample Preparation
Grain size analyses on the SediGraph 5100 used 2-8 g (dry mass) of sediment per
sample. Samples had been dried prior to analysis to determine porosity and bulk density,
and were subsequently re-wetted with a solution of 0.1% sodium metaphosphate solution
(a surfactant recommended by Micromeritics, Inc. to disaggregate floccules and facilitate
dispersal) made with deionized water. Sediment was disaggregated and homogenized
using an ultrasonic probe and mechanical stirring device to agitate the slurry of sediment.
The fraction of sediment <63 |im was separated with a sieve and reserved for SediGraph
analysis. Some samples showed signs of organic content (in particular, Cores CSC and
CSF discussed in Chapter 2). Discussions with Micromeritics representatives indicated
that the presence of organic material would not affect grain size analysis because organic
particles do not absorb X-radiation. In view of this, and because methods used to remove
organic material would have destroyed some of the clay fraction (J. C. Ridge, pers.
comm., M. A. Gofii, pers. comm.), samples were not treated to remove organic material.
The 0.1% sodium metaphosphate solution was used as the baseline liquid to calibrate X-
ray transmittance prior to analysis. Baseline analyses were repeated every 18 samples.
Samples were run using an automatic 18-sample loader (MasterTech schedule,
made by Micromeritics, Inc.) from which samples were suctioned into the analysis cell
through an intake hose attached to a small pump. Before entering the cell, each sample
was treated with an ultrasonic probe and mechanical stirring rod for 120 seconds to
97
ensure homogenization prior to subsampling for the analysis cell. Between analyses, the
analysis cell and intake hose were programmed to be rinsed twice with deionized water.
In establishing parameters for the material to be analyzed, the SediGraph 5100
must assume uniform density (which implies uniform mineralogy) for the sediment. For
these analyses, the density was chosen to be 2650 kg/m^ that of quartz. Although this
was undoubtedly not the only mineral present, this is a reasonable approximation when a
uniform density must be assumed. Other minerals present in sediment from this area
(Mobbs, 1981; Kemp, 1986) include the clay minerals kaolinite, illite, and smectite. As
with other clay minerals, these three typically show a range of chemical composition and
therefore a range of densities, all of which are similar to that of quartz (2000-3000 kg/nv'
for smectite, 2600-2900 kg/m^ for illite, -2600 kg/m^ for kaolinite, and 2300-3000 kg/m^
for montmorillonite). Minerals of the feldspar groups, ubiquitous in most natural
siliciclastic sediment, have densities that range from -2500 to 2800 kg/ml The use of
2650 kg/m^ as the assumed density for sediment in these analyses is therefore considered
an appropriate estimate.
Accuracy, Precision, and Comparison to Other Methods
A study by Oliver et al. (1971) showed that the combined mechanical and
electrical error from SediGraph instruments was less than 1%. SediGraph instruments
have been shown to measure grain size distribution with precision (reproducibility of
results on the same sample run repeatedly) well within 1 standard deviation of the
cumulative mass percent for each size fraction (Coates and Hulse, 1985). Similar
reproducibility was verified for the SediGraph 5100 in the Boston College Coastal
Processes Laboratory. Tests conducted between instruments within the same laboratory
98
and between laboratories (e.g., Singer, 1986) have shown high precision between
different SediGraph analyzers.
Variation may occur, however, between subsamples of the same batch of
sediment prepared separately. This was observed during this study, and is believed to be
caused by difficulty in homogenizing a large sample of sediment prior to extracting the 2
g needed for analysis (e.g., Coates and Hulse, 1985). To counteract this potential
misrepresentation, care was taken during sample preparation to manually homogenize
sediment by stirring before extracting sediment to be weighed and dried for subsequent
SediGraph analysis. Error may also potentially be introduced when the concentration of
sediment in suspension is too high (Micromeritics, Inc. recommends using 5-10%
sediment by volume; several studies discussed below have found better accuracy with
concentrations <2%, although concentrations that low tended to generate error messages
during analysis in this study). Interactions between particles, which are more frequent in
highly concentrated suspensions, may alter the sedimentation rate due to turbulent eddies
between particles (hindered settling; Coakley and Syvitski, 1991). Interaction between
grains and the wall of the analysis cell may also affect results, although this effect is
estimated to adjust values by less than 0.1% (Oliver et al., 1971). Particles <1 |J.m may
also be affected by Brownian motion and minor temperature changes of the fluid, causing
misrepresentation of true ESSD (Coakley and Syvitski, 1991; McCave and Syvitski,
1991).
Stein (1985) compared grain size results obtained with a SediGraph 5000D and a
Coulter Counter (which infers spherical grain diameter based on electrical resistance
detected as particles in an electrically conducting solution pass through an aperture
containing electrodes). That study found that SediGraph data showed finer modes and
99
medians than did the Coulter Counter, and that this discrepancy was more pronounced in
finer sediment. This was attributed to the different properties measured by each
instrument (settling velocity vs. resistivity) being influenced by irregular grain shapes and
different densities of different minerals in the sample. This same study found that
SediGraph data were similar to those obtained using the Atterberg method (which uses a
sedimentation column to separate size fractions by physical settling velocity), and that
Atterberg-SediGraph values differed systematically by <3%. It was concluded (Stein,
1985) that the SediGraph provided a rapid and accurate means of obtaining grain size
information, and that accuracy was greatest when the sediment is used in a solution with
concentration <2%.
Multiple studies have demonstrated that the results of SediGraph particle size
analysis compare favorably with those obtained by other methods. Welch et al. (1979)
showed a correlation coefficient R = 0.97 among 55 samples run on a SediGraph
instrument and the results of manual pipette analyses. Singer et al. (1988) examined the
results of analyzing sediment samples on the SediGraph 5000E (a model that differs from
the 5100 only in its associated computing capabilities), on a Malvem Laser Sizer
(E3600), an Electrozone Particle Counter (model 112), and a hydrophotometer (a photo-
extinction apparatus, similar in theory to a SediGraph X-ray attenutation analyzer, that
specializes in evaluating size distributions of silt). The Malvern Laser Sizer and
Electrozone Particle Counter use sizing techniques. The particle counter, similar to the
Coulter Counter in standard use, measures the disturbance in voltage as electrically
resistive sediment grains suspended in an electrolyte solution pass through an aperture
with electrodes on either side. The Malvem Laser Sizer is baesd on the principle of laser
diffraction: particle diameter determines the angle at which the sediment diffracts light.
100
and so the angular distribution of light scatter after passing through the sample is related
to grain size.
That study by Singer et al. (1988) found good agreement between all methods,
with differences in the results attributable to the fact that the different instruments
measure different sediment properties (SediGraph and hydrophotometer measure particle
settling velocity; the other two measure size more directly). Singer et al. (1988)
concluded that all four instruments performed well in the analysis of sorted silt. Analyses
on samples containing silt/clay mixtures showed more discrepancy between instruments,
which was attributed to light dispersion, influence of fluid viscosity at very small particle
sizes, and interaction between particles. With sub-micron clay particles, aberrant settling
behavior due to Brownian motion is known to affect grain size analyses (e.g. Coakley and
Syvitski, 1991). The SediGraph was shown to accurately identify modes in polymodal
samples, and produced highly accurate, highly reproducible results. As in the study by
Stein (1985), this was particularly true when sample concentrations <2% were used
(Singer et al., 1988). In such cases, the SediGraph consistently outperformed the
hydrophotometer, which operates on a similar theory of particle settling. There is no
established calibration or correction factor for adjusting SediGraph grain size results to
those obtained by other methods (A. Keith, Micromeritics, Inc., pers. comm.).
101

102
Appendix 2-C
Sediment Properties of Near-Shore Cores
103
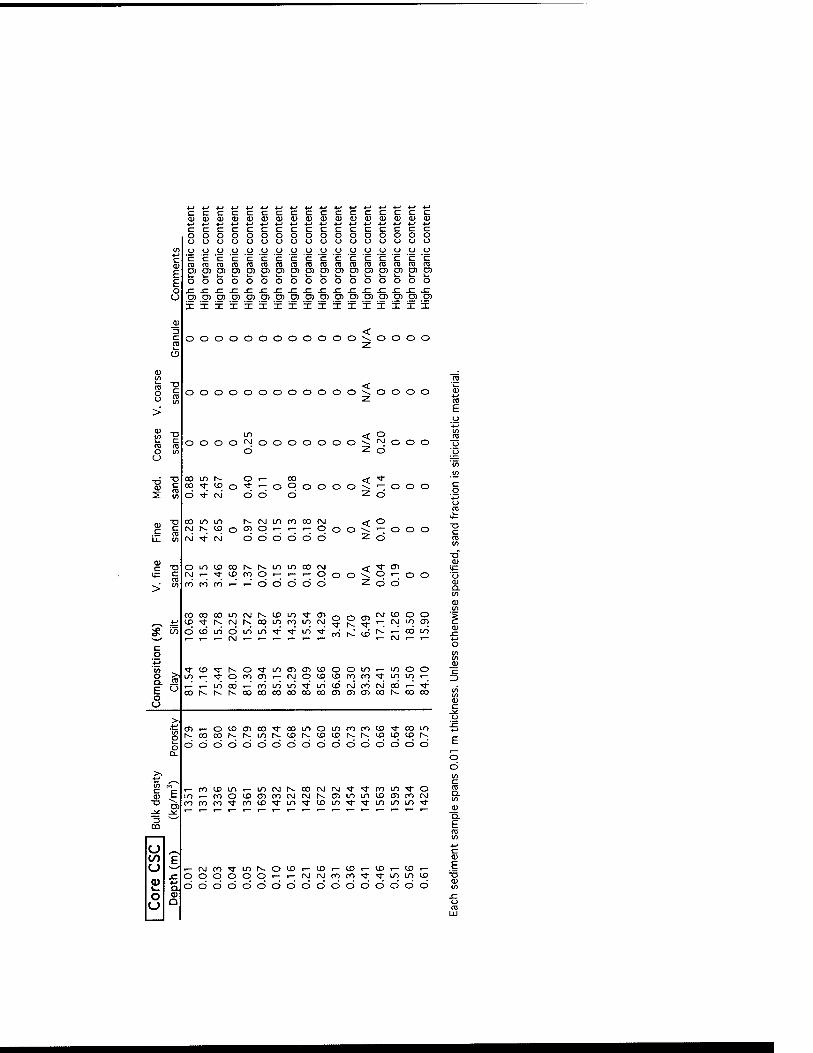
c c c c c c a> <u oj 0) 0) ID
o
0) c il- in
c c
^ i/J
Q. i5 E <-> o
c <u
■D
3
o o o (j y o o 'c 'c 'c c ■ ro ro ra O) O) D)
SI ^ sz O) D) D) X ± X
C C o o o u o o 'c 'c
CO TO TO (13 ro ro 0)0)0)0)0 0) ^ L- 1_ ^_ k_ k- o o o o o o
SI s: ^ SI sz ^ O) O) D) D) O) O) X X X X ix X
c c <U 0) c c o o o o o o c c
o o
D) D) X X
c c o o o o o o c c ro ro O) O) O O
SI sz O) D) X X
C C C C o o o o o o o o o o o o c 'c 'c 'c TO TO ro ro O) D) D) O) L_ i- k. I- O O O O
SZ ^ O) D) X X
D) D) X X
oooooooooooo-^oooo
oooooooooooo\oooo
oooot^ooooooo^f^ooo d z o
C0'<J-lDo'*'-OOOOOO^'-. O d'^frJodd zd
oomin KfNjLnmcocM <o c\jr^u)o<^0'~'~'~ooo-^'-:ooo (sJTfrO d d> d> d> di d ^d
OiniDooh-r--uoir)OOrg << (\Jr-'<tlDcoq.-;.-;r-qoO^ roror') i-'i-' ddddd ^
oooooOLncMr^iDio^O) iD^r^tNjh-oOLoroLoiNj di^LodLouS-^^'ir)'^ ,-,-r-(\Jr-,— ■— .-r-,-
"D 0)
'S- CD iC o r- o o o o o 0)
Q. U) <u to
fVI (.0 o C3 5 C\J in O) O O CD 'T r-- •<J-
■ r^ lij i:: ?:; 2 !^ ro
■"tiOM-t-^O'^LncDaiiooomr-uooo m.-M-Ooo<J)r-cMOtDU3POrO'<};iouit— t-^r-^uSodr-'royiin^'iniDcjrotsJcOi-^^ oot^r^r^ooooooooooco(Da)a)ooh--oooo
(Dr— oiDOoO'*oomomrorou3'3-oOLn
did>dididididid>did>d>c>d>d>d>didi
1— roU)mr-i/)CMr^00f\JfM';f'^r0Ln':fO ir)i— coOiDcnroojtMl^cDLnLntDffirorj
u to F u r- c\] ro ■>!- LD r^
x: o o o O O O a o o o o o o
o 0)
u LJ
CDr— (Dt— tOt— (X)r-(Df— r-(>J(\JCOfO'<t'*l/)LntD dddddddddd
o d
Q. E
c 0)
E X) 0)
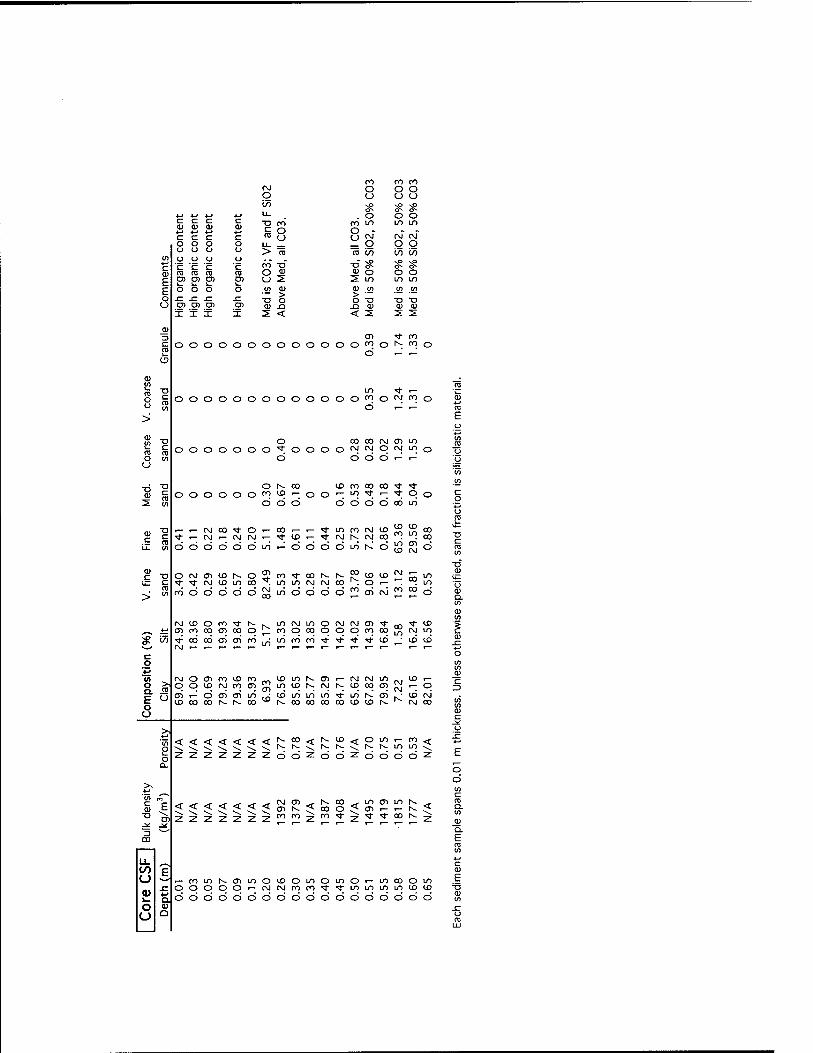
o
c
S In
D. J5 E u o a
■° fr, -^ ji 3 """ m
u. to F U ^-> (U I- a o 0)
u u
(M o CO
4-* ♦J +-> *-» U- c
4-»
c •D c TO
CO O
f- r c c ( ) o o o o Ll_ o o o o > TO (J (> o o r r c c ro ■D m m (n ro ( ) rn ni O) O) (j > o o o o _{0 0)
^ ^ -C ^ n D> D) C!) D) <u J3 X X X X i. <
00 ro ro O C^ C) U O u ^ ^ ^ o o o
ro in in in O .. „ .. f ^ (M rj r\j
o O O ro to w w "a" ;« ^ ?§ <u o o o i LO m in <u > tf) tn en
"D "D T) n <U (U a) < >. i. i.
CT) ^ ro ooooooooooooof^o^t^
o .- .-
ooooooooooooo<^o o
■<t r- c\j ro o
o 00 00 c~j m m 0000000'*"0000'^<^C)'^"^0
d d d o --^ ^
or^co iDrooooo'^'* oooooof^"^'^oo'-:'^^'-:'^Po
odd ddddcoin
.— CM 00 ■* o ,-oOr-^^LnrotNJioSJS
d d d d d d Lfi ■- d d d d in rv! d in ID
en rvj d
o rM ■<!■
ID to in
o 00
ro m
"4- 00 CM ro 00
00 lO o lO rj ro in m
jC
ro O o o o o 00 m o O O o m CT) ro ci ro O
ID ro
00
o 00
00
CO ■<1- 00 q
ro iri
LO ro in
q ro
in CO ro
O O o o ro
lO
00 ro
lO
to in ID
rd o <T> ro ID ro ^ q q ID rvj ro tT5 55 CT) f-^ d <7> a^ in ID ro ro r^ r^- ro ID
LniDh~(Njr--iDoqqj^ (DinininM-ins-df^- r^rorororoiDiDh-'^
.- o <D rvi f\j ro
<<<<<<<f^'=°<f^"'<OLni-ro ^vi<:<:<;<;<:rv.r^<h.r^<;i^r^Lnin < *- zzzzzzzdd^dd^ddddz
<<<<<<<Si^<E5§< 1 $ ro ■* $ z z z z z z
in a^ in r^ (J) r- .- N. Tf Tj- ro t^
.— roint--a)Loo<DOLn OOOOO'-tNJtMrOfO
O in o ■- in ro o in m u^ m m ii> ^
oooooooooooooooooo
o d
0} a. E
0) E
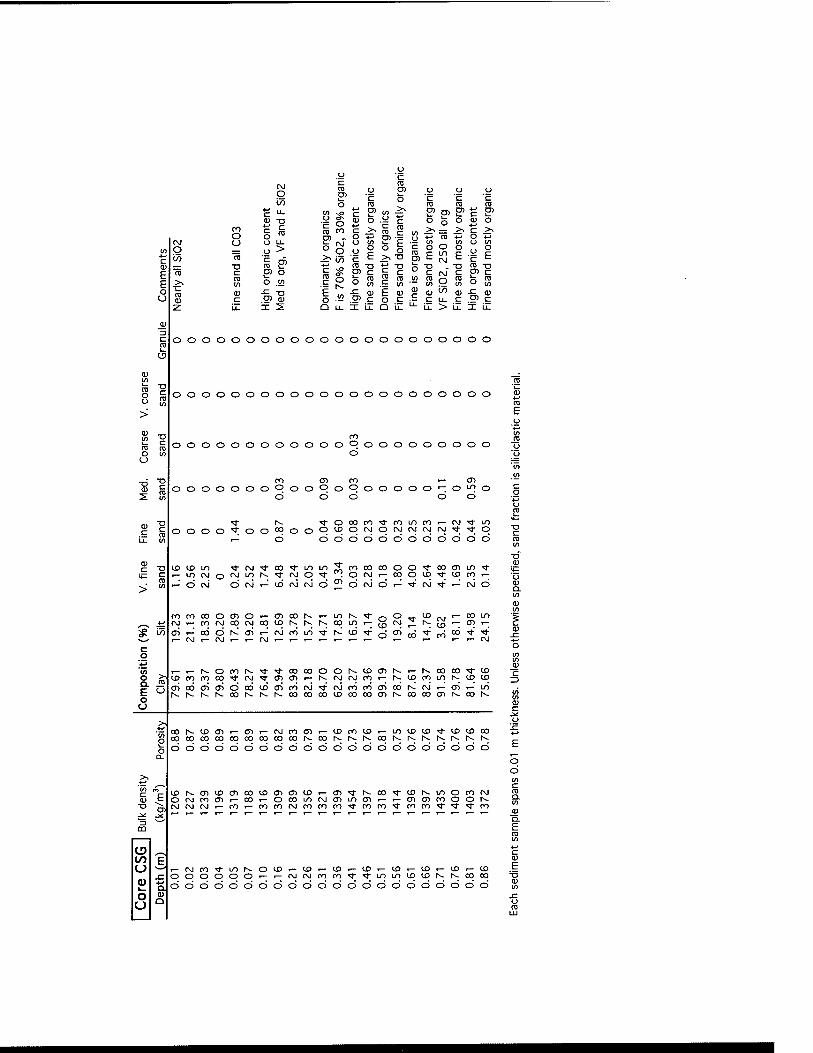
o o
o
Q. i5 E u o o
o
O to "TO
ro O O
T3 c ro en a> c
O CO
O " o u. y >
D) O O .(/)
X s
,. ° ^ .y ^ £ ro (O c D) . O ^ (M <J
Q y ^ i/) c +-> ^ ro S ^ P> c P O
Q u. X
o 'c ro ?^ u +:? 0 c 0 0 >1 re ro
r" >, 4-1 m ■»-► tn b 0 0 c 0 0
E >, -o ro E I/) (SI
XJ c ro c X) 0 "n
t t. 1- ro in
ro (n
_U} ro in 0
0) F 0) 0) 0) (/) i. 0 I c LL.
Li- Q U- u. >
o o c c ro ro D) ti en L- C 1- o <u o 4-' >. c >^ 4= O 4= in u in ° u ° E -i E C p C ro k ro in ^ tn "U -5, <l> c ra c LL X U.
0000000000000000000000
CO CD ro >— OOOOOOOOoOOoOOOOOO'-O
CD CD O O m o
^r r-^ ':focioro^coLOro.— c\j'<}-m OOOO'^OOO^OOO^'O^O'^^'^f^'^'^O
,-: d ddddcDdcDdcDdcJd
ID CD LO r- in c\j r-' d CNJ
■T (^ T CO ■^ m u~l rj in t^ -"f (\j O M- : o CM .- 00 o CD OCMt-tDCM00Oji'O(MOt-Tf
Tl- ID CO .- ■<t --^ rO d
coroooocnOr-cnoor^.-ioi^Tl- c\j.-co{\joqt\ioqiDtv.t--.h-.oqin.-;gtM_^hs.
t— 00 in r- <Tl f~
en >— CO 00
KCD^rOfOtn^}-I^lD'<l-ri'^fri'*rri°° r- CM
r-.-KOcor--'<l-'<i-tx3rooot^cD<Dr^r-rv.oocoTfco lDrorOCX3Tf-C-J'^CT)a>.-;S-(NJ(NJrOr-h.tDcOLON.lDlO <jicdcjic^dcidcDCT>ro[\JTt-'c\Jrocoaio6t^cJ.--^cri.-'in iv.h^r^i-..ooh-h-h-oooooocDooooCT5r^cocoiDr^oor--
0000000000000000000000 aj
ooooooooooooOooooooooo o
cocooooo^foocnintj- ic
OOKIDCJI.— CT).-CV]rOCT)^lDcOlX>t— inCDlD'tl-lDlDClO cocx3oococooococooor^oor^r--Koor^r-~t^i^h~-i~--K dddddddddddddddddddddd
iDh-oiiDCTioocDCTicniD.— cT>-^r--cO'<rcDr^mocooj ocsjcocDi— 00.— ocOLoojo^Locn.— .— oiCTicooor^ CNjtMCNJ.— CO.— rococNJrorooo-^coro^rorO'S-'^^co
0 to F 0 ^—>
r a> 4-> 1- u 0 u
0) Q
.-CVJCO'^mr^OlD.— CD.— CD.— CD.-tO.-tDt— CD.— CD oooooOr-.— (vjc-jcoro'^r^mtotDtDh-i^cocn oooocioc5cioociooooo<5cic5dic5o
a. E
o ro LU
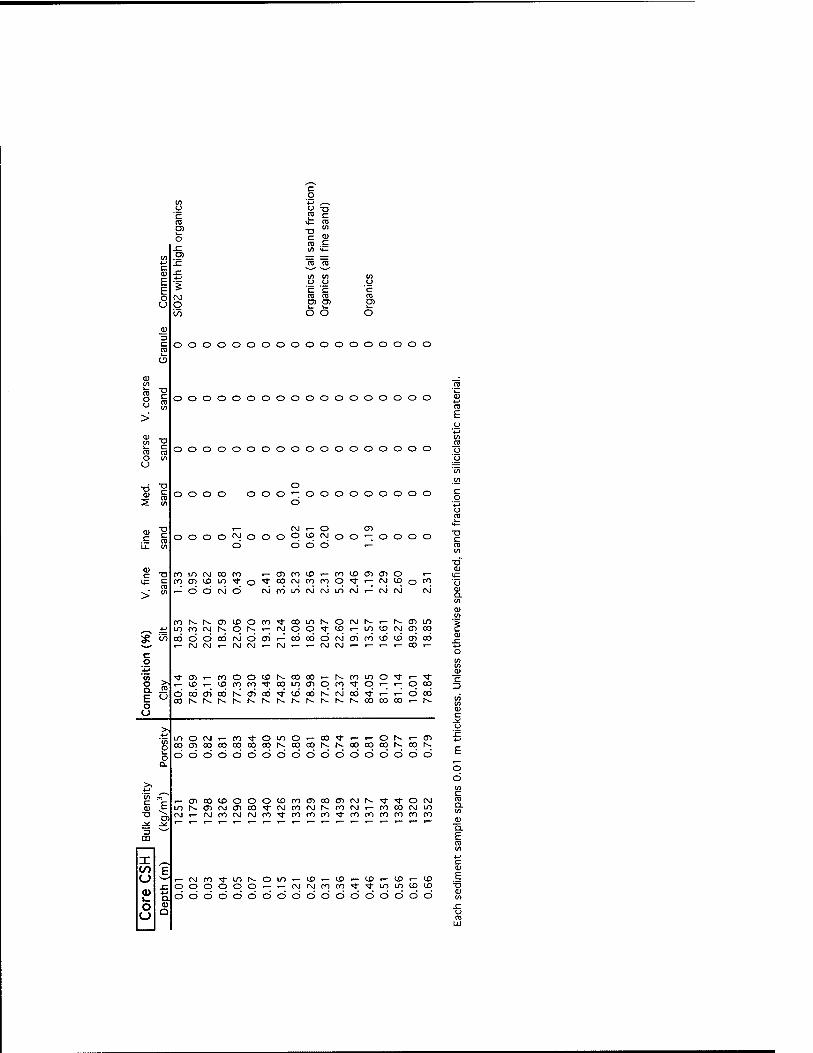
o
c g
c
o C ro tu c
sz in l4— v) u> 4-/ x: 15 "ro c a> E
x: 4-1 in tn t/^
s o o o
E 'c c 'c o u
CM ro ro ro O D> E P C/) 6 o O
0) 3
2 o o o o o o o o o O o o o o o o O o
<j
(U tn
8 -a c ro o o o o o o o o o O o o o o o o O o
> 0) ■D
ro c ro o o o o o o o o o O o o o o o o o o O in O
T3 c
tn o o o o o o o
o O o o o o o o o o
2 d
<u T3 CM _ o CD c ro tn
o o o o CM o o o o ID CM o o »-; o o o o ii- d d d d •~
TJ ro in CM CO ro <T> ro ID ro ID CD CD o _ ii: c m CD to irt <!f o ? CO CM ro 00 q ■<1; 1— 00 CD o oo
> ro t/) ■— d d CM d CM ro LO CM Ovi UO CM *" 00 00 00
ro 1^ r-- <T> to o CO M- CO m r^ o 00 t^ t^ (T> in ,_ *-> tn 00 CM N. q 1^ »-_ CM O O '4- ID ■— m ID CM CD 00
^ 1/5 00 d d 00 CM d CT> 1-^ ocj Otj d ro ai 00 to to (D otj >>—' CM CM I— CM CM I— CM 1— t— ro ro r— r— r— r— 00 I—
c o 4f 'to TT Oi ,— CO o O ID t^ 00 CO r— N- ro in o tf I— •^ o > ro
O
to T— t£> ro CO ■^ 00 m CT) o m ■^r O O 0C5 Q.
5 d Otj tJi Otj r^ ci 00 ■^ to Otj r^ 00 00 ■^
^ ^ d OtJ CX3 h-. r-- h- K h- 1^ 1^ r- r^ r-- K r^ oo 00 00 tv.
> 4-* 'tn O
IT) o CM t~- ro ^ o IT) o ,— 00 'f r— f— o h- I— cr> OD <n CO 00 00 00 CO h- 00 00 K r-- CO 00 00 h- 00 r^
o 6 d d d d d d d d d d d d d d d d d (£
>, ■^
V)
E ,— <T) 00 to o o o ID 00 01 00 c^ CM h~ 'd- ■0- o 00
<u LO h- <T) CM C7) 00 * CM ro OJ t^ ro C^ f— oo 00 oo in X) CM r— (M ro CM CM ro ■<J- oo ro 00 t 00 ro oo ro ro ro ^ »~ »" *~ f"" »~ *~ *~ «~ •~ •"" '— *" ' ^~ *" *~ *" *~ 3 '—'
CQ
X CO ? u ,— CM ro ■^ LT) r^ o in T— ID r— ID (— (X) T— to t— iS>
£ x: O O O o O o T— CM Ovl ro 00 ■<1- ■^ in in CD ID
s d d d d d d d d d d d d d d d d d d o 0)
ro tu ro E o
•o a)
0 a
o d
E
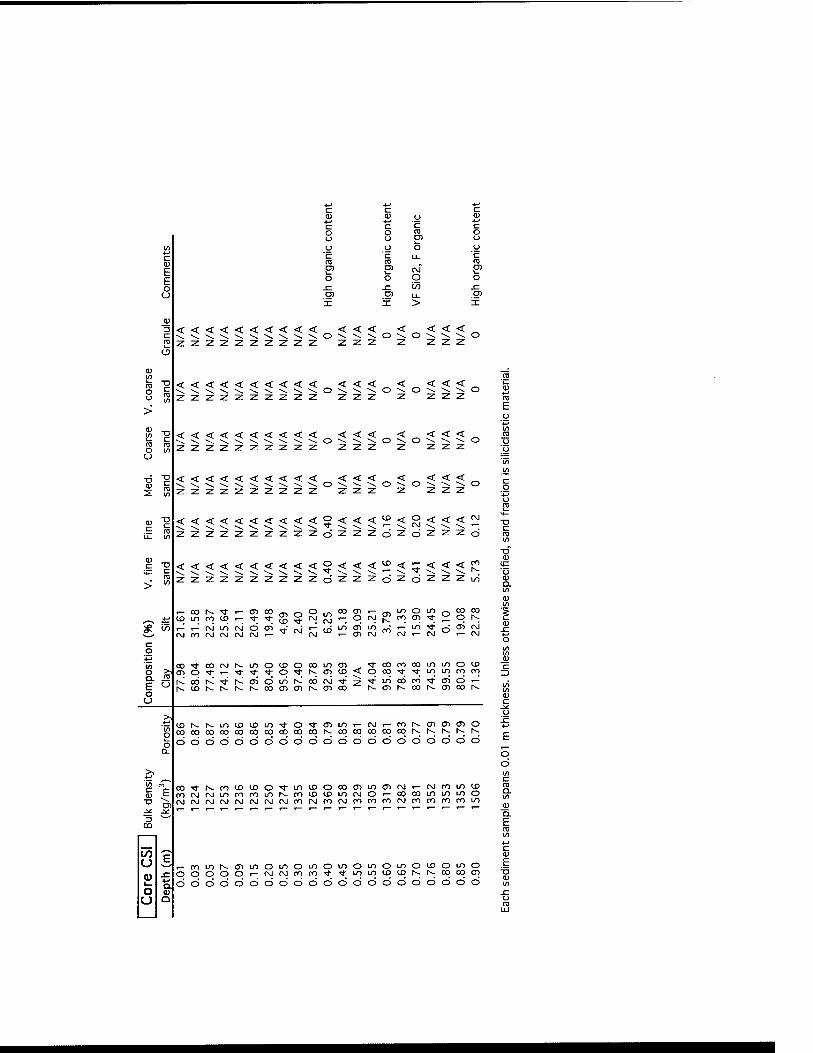
o CJ
c "5
^ i/o
o. is E " o
c c C 0) <u (U
c c c o o o o (j E o CJ o o o c c Li_ c ro re P O) t\J o o o o ^ J: to sz D) D) Ll- D)
I I > X
<<<<<<<<<<„<<<^<^<<<^
zzzzzzzzzz zzz z zzz
zzzzzzzzzz zzz z zzz
.<<<<<<<:<<<<<<j_j<Q<<<Q zzz z zzz z z z z z
<<<<<<<<<<°<<<i£<S"*<'< z z z z z d z d
o
d z d ^ -o
<<<<<< <<<<2<<< z z z z z
lo < ■- ^ ?: '*• d z d
< < < \ ^ \ zzz
1^
r- CO t^ ■<l- ■- CT> 00 ID Lo CO ID r-^ ^ •<»; i-^ ■-^ oJ Ln od d cri CM ro rj CJ t\i oj t—
LT) O LO ro en 'J- Tf '^ fsj "-:"-: '^ r^
-, 00 CO i P "^ -: oi c\j -" .- fvj
oOTToooor^LnoioocOLOoi TroorooouiLooto CT>o'^i-'!r'>l-'>J-0'<J;l~~;Oi<i><poq'<);'>};Lni^roro r^odh-!M-r~-oidLnt^o6(\JTf^''^"^°o^^'^^'- r^tDr^h-t^r^oocT>cT)r^o^oo r^cj>r^cor^cDoor^
Q.
oooocooooooooocooocor^oqoqcocooqh--h-r--;r^t^ ddcJdddddddcDCDdddcJddddd
cO'}-Krr)U3iDO'^uitDOco<T>Loai(Njt— rvjnuicD f^c\jc\jmrr)COLnr^rotjDi£)mr\JO«— oooOLOiOLOO t\jrd(M(\i(\j(Mc\it\]ro(NJroc\jrorocofMcororocoLo
to a E^
?> x: n u <D
o o
t-roLot^aiLOOLOomOinOLnOLnOiDOLOo OOOOO"— fMtMPonTf^ini/iu3iON-N;0qcocn ododdoddddoddciddoddoci
o d
Q. E ro
c 0) E
o ro
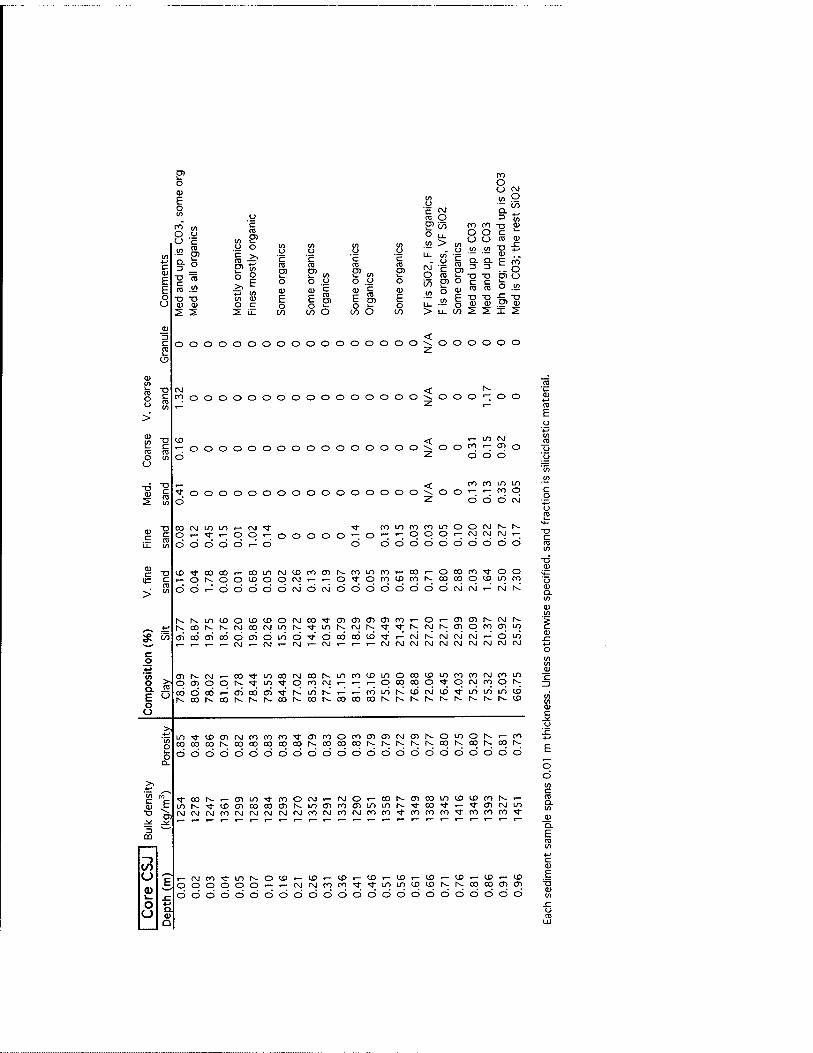
ro O in Q
ro O O tn
u 'c ro o
'c ro o 8 tn o S3
o ,tn
CO
> tn o
00
O u tn
ro O O tn
-D C ro
X)
0)
tu
4-'
4-' c a> E E o
Q. 3
X> c ro ■o
o "ro
'c ro o
4-'
o ro ro
yt
'c ro Dl i- in
c ro LL.
oo" O
t/T o 'c ro
'c ro Dl L-
Q.
T3
Q. 3
■a Dl U
in
E in
o OJ
E
o 0)
E
o c ro
O
tu
E
o 'c ro Dl
o OJ
E CO
tn o tn
o 01
E
c ro T3
c ro T3
O
Dl
tn
■D CJ <u 0) O c o o o o u. o tij 01 <V
2 2 2 b- CO CO 6 CO 6 CO > U- CO :s 2 X S
(U
3 < c o o o O O o o o o o o o o o o o O O o o o o o 2 2
(5
(U
S2 TO o o
T) (\J < h- c ro ro o o o o o o o o o o o o O o o O O o o
,-■
o o
>
■a ID < y_ in 00
ro O
c ro 1— o o o o o o o o o o o o o o o o \ O o ro *~ <y> o d z d d d
U
0)
■u ^ < ro ro in LO
c 5 o o o o o o o o o o o o o o o o \ o o »— *~ ro q 2
ro d z d d d 00
■D CO 00 LO LO (\J ■>!- ■■r ro LO ro ro in o o 00 r^ t^
c c o ■<1- o q o o o o o f— o r— r— O O o r— 00 00 00 •— iz ro d d d d d •- d d d d d d d d d d d d
"O <s> tj- ro ro ro LO 00 ID ro CTl r»- ro LO ro _ ro _ o ro ro ^ o o H= c o h- o o ID O o 00 o ■>r o ro ID ro r^ ro ro q CD in ro
> ro d d ■- d d d d d 00 d 00 d d d d d d d d 00 00 *~ 00 r-^
r^ t^ LO ID o lO ID o OJ ro ■<r CTl tn CT^l CTl ro o CTl CTl r^ OJ h-
/-** ■*-* h- ro r-- N. CM 00 (VJ LO r^ •>t m h- 00 r«- ■<}- ■^ F^ 00 r^ CTl o ro CTl in
o
to
(75 (ji 00 oi o6 d oi d in d ■5f d CO ai ID ■^' i_ oj r--! 00 Oj' 00 t— d in
(M 00 00 00 ' 00 00 OJ 00 00 OJ OJ oo 00 00
CTl K rj ro •>r in ro OJ ro h- LO ro to in o ro to in ro ro 00 ro m o > ro
O
q Ol O o h- ■^ LO •>r o ro OJ .— f— *— q ro ro q •^ o 00 ro q h- Q.
E o o
00 d 00 ^ oi ro oi •t r^' Lfi NI ^ ^ ro iri t--; ID 00 to ■<r in LO LO tD
r-^ ro h- ro 1^ r«- r~- ro K ro h- ro ro ro r^ h- K r~- r-- r-- r^ r-. r-- CD
>. ^^ LO ■<r IS> CTl OJ ro ro ro Tj- oi ro o ro CTl CTl 00 CTl N- o LO o r-- I— ro
o ro ro ro 1^ ro ro ro ro ro t^ ro ro ro r^ K r^ t^ N. ro r^ ro h- ro 1^
o Q.
d d d d d d d d d d d d d d d d d d d d d d d d
>^ /^ C 0) "E tl- ro r^ , IT) in ■<l- ro o 00 ,_ 00 o r- ro r^ 01 ro in to to ro r^ r-
Ul h- ■^ ID CTl ro ro CTl r^ LO oi ro o^ in in K ^t- ro ■>*■ I— ■>!- CTl OJ in
•a CM CM (\j ro CM ro OJ OJ 00 ro 00 00 00 ro ro ■^f ro ro ro 't ro ro ro ■*
-^ »— «— r— »— *— »— '^ '~ '— *~ '^ •— *" *~ *~ *" *~ *~ '~ '" *~ *" ^~ *" D m
—) CO U 'E
, (M ro ■51- LO r^ o ID ,_ ID ,_ ID ,_ ID ,_ CD j— to r~ to ,— CD r~ CD
(U 1-
o O O o o o 00 OJ ro CO ■<!- ■4- in in ID ID r^ t^ ro ro CTl 01
^ d d d d d d d d d d d d d d d d d d d d d d d d o -M
u a Q
"D C
o (U £2.
_9i c 3
tu
o d
Q. E
c tu £ tu

no
Chapter 3. Seasonal to Decadal-Scale Shoreline Evolution and
Response to Episodic Energetic Events
Abstract
Aerial surveys conducted between 1984 and 2001 reveal coastal morphologic
evolution on Louisiana's chenier plain on weekly to decadal time scales. On a decadal
scale, the northeastern and central chenier plain experience net shoreline retreat. Mudflat
progradation does occur in those areas on sub-seasonal time scales, as sediment derived
from the Atchafalaya River and shallow inner shelf accretes onto the coast, but mudflats
are ephemeral and most sediment is subsequently transported to the west by longshore
currents. Pronounced accretion has formed an increasingly stable mudflat on the
prograding eastern chenier plain, the result of both natural processes and reworking of
dredged sediment.
Aerial still photography, aerial video surveys, synoptic weather-type
classification, and the historical hurricane record have been examined to evaluate the
chenier plain's response to energetic events. Mudflat accretion on the eastern chenier
plain is shown to correlate with the occurrence of winter cold fronts. Cold front passage
111
is associated with onshore winds, which generate waves that resuspend inner shelf
sediment and transport it landward and along shore. Water-level elevation during pre-
frontal wave set-up can deposit sediment on inter-tidal mudflats and above the high tide
line. The amount of mud potentially deposited on the eastern chenier plain by this method
in one year is roughly equivalent to -2-7% of the fine-grained sediment load carried by
the Atchafalaya River annually.
Energetic events have not been widely recognized as agents of coastal accretion.
This study provides insight into the little-studied phenomenon of fine-grained sediment
deposition under energetic conditions. The results highlight major differences between
the behavior of sand- and mud-dominated coastal systems under energetic conditions. An
examination of the literature indicates that mudflat accretion during energetic events is
most probable on muddy coasts that have a high supply of fine-grained fluvial sediment
to maintain an unconsolidated sea bed immediately offshore, that experience dominant
wind direction toward shore during energetic conditions, and that have a low tidal range.
3.1. Introduction and Objectives
Field observations of 51 km of Louisiana's chenier plain shoreline (Figure 3-1) in
March 2001 revealed both erosional and depositional regimes (Chapter 2). Eroding areas
were identified by carbonate sand deposits encroaching on backshore marsh and by an
exposed marsh terrace at the waterline, which often forms a crenulated shoreline.
Accreting zones were characterized by linear, unconsolidated mudflats fronting the coast,
often colonized by young vegetation. A wide, continuous mudflat was present for 17 km
112
west of Freshwater Bayou (on the eastern chenier plain), indicating pronounced accretion
there. On the northeastern chenier plain, erosional features dominated coastal
morphology. The central chenier plain showed alternating regions of erosion and
accretion when studied in March 2001 (Figure 2-4).
In view of the considerable variation in morphology and observed length scales of
eroding and accreting zones found during field work, a further study was undertaken with
two objectives: 1) to assess decadal-scale evolution along the chenier plain coast over a
14-year period from 1987 to 2001, using the aerial photographic record; and 2) to
evaluate short-term shoreline response to episodic energetic events, using aerial still
photographs and video surveys, synoptic weather records, and the historical record of
hurricanes and tropical storms. For this second objective, the study distinguishes the
effects of winter cold fronts from those of less frequent but spatially concentrated
hurricanes and tropical storms.
This analysis also clarifies the relative importance of fluvial sediment discharge
and meteorological activity in controlling coastal accretion on Louisiana's chenier plain.
Accreting environments, such as the eastern chenier plain, are atypical for the Louisiana
coast, which experiences rapid coastal land loss due to sea level rise and gradual
compaction and subsidence of sediment (see Chapter 1). Because the controls on mudflat
accretion are poorly understood in comparison to those governing shoreline retreat in this
area, attention was focused primarily on variations in the extent of coastal accretion to
constrain its contributing factors. Finally, the results of this work were compared with
other studies of mud-dominated shorelines to define a global context for the controls on
mudflat accretion inferred for the Louisiana chenier plain.
113
3.1.1. Previous Work
Several surveys were completed during the 20"' century that assessed historical
shoreline evolution on the chenier plain. Morgan and Larimore (1957) conducted a map-
based study that incorporated shoreline records from 1932 to 1954, and estimated rates of
erosion and accretion accordingly. This same study used early surveys and the results of
the 1932-1954 shoreline change rates to reconstruct (extrapolate) a shoreline position for
1812, when Louisiana joined the Union. Adams et al. (1978) used infrared aerial
photography to characterize erosion and accretion rates along the entire Louisiana coast.
These authors included in their assessment rates of land loss around inland lakes in
coastal zones, which had not been possible in the earlier Morgan and Larimore (1957)
map-based work. The Adams et al. (1978) study, which incorporated photographic
records from 1954-1969, provided a comparison with a 1971 land loss assessment by the
US Army Corps of Engineers, a study intended to facilitate coastal management
recommendations (USAGE, 1971).
Wells and Kemp (1981) and Wells and Roberts (1981) examined aerial
photographs taken in 1974, 1978, and 1979 to gauge the extent of mudflats on the eastern
chenier plain after the time period covered by the Adams et al. (1978) study. The work by
Wells and Kemp (1981) and Wells and Roberts (1981) did not include calculated rates of
shoreline change. More recent comprehensive summaries of state-wide shoreline change
were completed in the 1990s by the Louisiana Geological Survey (Westphal et al., 1991)
and by the U. S. Geological Survey (Williams, 1994; Penland et al., 2000), though these
studies did not focus in detail on the chenier plain. These prior studies provide a
114
comprehensive record of shoreline change against which to compare modem rates and
patterns of shoreline evolution on the chenier plain.
3.1.2. Available Resources
Beginning in 1987, the Coastal Studies Institute of Louisiana State University
(LSU) obtained aerial photographs of the chenier plain through a cooperative program
with the National Aeronautics and Space Administration (NASA) Airborne Photography
program. Between 1987 and 1998, 17 missions were flown over this area as part of this
program, executed by the NASA Ames Research Center. Access to, and reproductions of,
these photographs for the purpose of this study have been provided through the
generosity of Oscar K. Huh of LSU's Coastal Studies Institute. One set of photographs
taken under the National Aerial Photography Program was obtained from the US
Geological Survey (USGS, 1990), and photographs taken in 2001 were provided by the
Ames Research Center (NASA, 2001). Together these aerial surveys allow examination
of decadal, annual, and sub-seasonal shoreline evolution and the determination of
erosion/accretion rates to a degree of accuracy comparable with the earlier studies
mentioned above.
A resource particularly valuable to the storm-response portion of this study is a
collection of aerial video surveys sponsored and maintained by the Louisiana Geological
Survey (LGS) and Louisiana State University (LSU). Intended to facilitate assessment of
hurricane impact, these video surveys were conducted by helicopter after several major
storms passed over the chenier plain in the 1980s and 1990s and continue to be collected
as the need occurs. In addition to using videotapes recorded after hurricanes and tropical
storms, this study also draws upon two LGS video surveys that did not follow major
115
storms, made in 1984 and 1986. Although accurate estimation of distances and locations
is more difficult from video footage than from a still photograph, these video surveys
have provided a valuable means of inferring past and potential hurricane effects on this
shoreline. Numerous additional resources through the National Hurricane Center (NHC)
and in the literature provide information on hurricane impact from the 19* and 20'^
centuries and even earlier.
3.1.3. Storms and Frontal Systems on the Northern Gulf of Mexico Coast
Two kinds of energetic weather systems affect the northern Gulf of Mexico coast:
extratropical systems associated with the passage of cold fronts, and tropical cyclones
(hurricanes and tropical storms). The extratropical fronts are common large winter
systems that develop at mid- to high-latitude and move from west to east across North
America, covering an area up to 1000 km across (e.g., Chuang and Wiseman, 1983;
Morton, 1988; Moeller et al., 1993). In contrast, tropical storm systems originate near the
equator and move poleward from east to west, often across the Gulf of Mexico. Storms
resulting from tropical depressions are intense and spatially concentrated, 100-300 km in
diameter (e.g., Simpson and Riehl, 1981). Both types of systems will be considered in
this analysis of coastal response to episodic energetic conditions.
Weather patterns over southern Louisiana are dominated in fall, winter, and early
spring by extratropical cold fronts. Fronts typically arrive every 4-7 days; each year sees
between 20 and 40 fronts pass over the chenier plain (e.g., Roberts et al., 1987). These
fronts delineate the boundary between cold, dry air over the North American continent
(which originates over the Pacific or in colder Arctic high pressure cells) and the warmer,
moist, tropical air masses that form over the Gulf of Mexico and Caribbean Sea.
116
Extratropical cold fronts play an important role in near-shore sedimentary
processes on the chenier plain. Long-fetch southerly winds, which precede the arrival of
each front, increase wave energy and cause sediment resuspension on the inner shelf,
transporting suspended sediment landward as the cold front approaches (Kineke, 2001a,
b; Kineke et al., 2001). Sediment can also be transported toward shore during post-frontal
northerly winds, as coastal upwelling forces sediment-rich bottom water to flow landward
(Kineke, 2001b). Land-based field study by O. K. Huh, H. H. Roberts and others have
indicated that mudflats on the eastern chenier plain coast can experience rapid and areally
significant mud deposition during wave set-up immediately prior to the arrival of cold
fronts. Deposition on mudflats is followed by wave set-down during northerly frontal
winds that can strand mud onshore. Subsequent desiccation may stabilize the sediment,
allowing it to become permanently incorporated into a mudflat (e.g., Roberts et al., 1987,
1989; Huh et al., 1991, 2001). Mudflat deposition has been previously observed in
multiple field studies, though it is not known whether sufficient water level elevation
occurs to bring substantial quantities of mud onshore with every cold front; the higher the
water level elevation during cold front passage, the greater the potential land area
available for onshore deposition of sediment.
3.1.4. The Synoptic Weather Type (SWT) Record
While the process of front-related mudflat accretion on the Louisiana chenier
plain has been documented through field research (e.g.. Huh et al., 1991) and the
meteorological patterns of cold front activity verified through remote sensing techniques
(Moeller et al., 1993; Van de Voorde and Dinnel, 1998), a connection between historical
weather records and seasonal accretion on the chenier plain has not previously been
117
investigated. Climate records in the form of synoptic weather type (SWT) indices have
been used for this purpose. SWT indices are composite evaluations of weather that
incorporate wind speed and direction, air temperature, dewpoint temperature, relative
humidity, visibility, cloud type, and percent cloud cover (Barry and Perry, 1973; Muller,
1977; Muller and Wax, 1977; Muller and Willis, 1983). Synoptic climatology, widely
used in meteorological classification, relates local weather conditions to continent-scale
atmospheric circulation. Synoptic indices are therefore considered more representative of
regional weather patterns than are individual parameters such as average temperature or
wind speed (e.g., Barry and Perry, 1973; Barry and Carleton, 2001). Synoptic
descriptions of weather are applied regionally to meteorological systems with a
horizontal scale of up to 2000 km (Barry and Carleton, 2001).
Meteorological records from the closest weather station to the chenier plain, 110
km northwest of Freshwater Bayou at the Lake Charles municipal airport, have been
recorded twice daily (at 0600 and 1500 CST) since January 1981 and are reported in the
form of SWT indices (J. M. Grymes and R. Muller, unpublished data). Eight SWTs are
used to categorize weather patterns over southeastern Louisiana: Pacific High (PH),
Continental High (CH), Frontal Overrunning (FOR), Coastal Return (CR), Gulf Return
(GR), Frontal Gulf Return (FGR), Gulf High (GH), and Gulf Tropical Disturbance
(GTD). The meteorological attributes of each SWT are listed in Appendix 3-A (Muller,
1977; Muller and Wax, 1977; Muller and Willis, 1983).
5.7.5. Definition of Frontal Conditions
Of the eight SWT categories, the occurrence of Frontal Overrunning (FOR)
weather most closely reflects the duration and frequency of cold front passage, believed
118
to be linked to sediment deposition on the eastern chenier plain. FOR weather implies the
presence of a frontal squall line almost directly over the weather station (Appendix 3-A).
Wind patterns associated with a cold front are shown schematically in Figure 3-2. Two
additional weather types are specifically associated with southerly winds that precede the
arrival of FOR conditions (J. M. Grymes, pers, comm.): Gulf Return (GR) and Frontal
Gulf Return (FGR). Gulf Return (GR) weather includes Gulf-derived southeasterly wind
comprising coastal return flow that, during winter, may rise as it approaches a cold front,
but is affected only by distant fronts to the northwest. In summer, GR conditions
dominate Gulf Coast weather as the "sea breeze" that flows landward to replace warm air
that rises from the land during daytime heating, in that case being unrelated to
approaching cold fronts. Sustained wind speeds during GR weather range from 3.1 to 4.1
m/s and rarely exceed 5.1 m/s. Ousting wind and precipitation are generally not present
during GR conditions (J. M. Grymes, pers. comm.).
Frontal Gulf Return (FGR) weather is direcdy related to an approaching cold
front. As warm Caribbean and Gulf of Mexico air flows north toward a cold front that is
moving from northwest to southeast across North America, the interaction of the
approaching cold front with the so-called coastal return flow generates atmospheric
turbulence with dominant winds that veer from southeast around through due south to
approach the front line from the southwest (Muller and Willis, 1983; Figure 3-2). The
FGR weather type is assigned to conditions in which a cold front coming from the
northwest is present within 560 km (350 miles) of the relevant weather station. During
"pre-frontal" (FGR) conditions, sustained wind speed offshore typically exceeds 10 m/s
(National Data Buoy Center [NDBC], http://www.ndbc.noaa.gov; J. M. Grymes, pers.
comm.). FGR weather includes gusts of winds that may reach substantially higher
119
velocities, >25 m/s (J. M. Grymes, Louisiana Office of State Climatology, pers. comm.),
and is often accompanied by precipitation, thunder, and lightning. FGR conditions tend
to induce water-level set-up by 0.30 to 1.22 m (Boyd and Penland, 1981).
Data collected by multiple offshore wave-sensor buoys in the Gulf of Mexico
indicate that sustained wind speeds of 10 m/s in pre-frontal conditions are associated with
a significant wave height of approximately 1.8 m, with a range from -1.5 to 2.0 m.
Prefrontal wave period typically ranges between 7.5 and 8.5 seconds (NDBC, 2001). This
range in wave period corresponds to a range in wavelengths of -90 to 110 m. The
resulting wave-orbital velocity near the sea floor under these wave conditions, u^, can be
calculated using the following relationship for intermediate-water waves (waves that
occur in a water depth that is between 1/2 and 1/20 of the wavelength):
".= — (3-1) " rsinh(2jtJ/L)
where H is wave height, T the wave period, d the water depth, and L wavelength (e.g.,
Komar and Miller, 1975; Komar, 1998). Using this relationship, wave conditions
associated with prefrontal winds are expected to produce near-bed orbital velocities of
0.1 m/s (the threshold orbital velocity needed to mobilize coarse silt particles; e.g.,
Komar and Miller, 1975; see also Madsen and Grant, 1975) in water depths shallower
than 36 m (for T = 7.5 s, L = 90 m, H = 1.5 m) and in water depths shallower than 47 m
for the high-end values of T, L, and H (e.g., Komar, 1998). Such conditions, with this
calculated potential for sediment motion on the inner continental shelf, occur with the
passage of cold fronts every 4-7 days between October and April, for a total of 20 to 40
fronts per year (e.g., Chuang and Wiseman, 1983; Roberts et al., 1987; Huh et al., 1991).
120
Before each front, the pre-frontal FGR phase lasts between one and six hours depending
upon the speed at which the frontal boundary migrates. It is noteworthy that although
frontal passage, and the pre-frontal FGR phase in particular, can bring weather
considered in lay terminology to be "stormy" (sustained elevated wind speeds, wind
gusts, and sometimes precipitation, thunder, and lightning), cold front passage does not
meet the mariner's technical definition of a "storm", which requires sustained wind
speeds above 24.7 m/s (48 knots; Force 10 on the 12-step Beaufort Scale, exceeding gale
conditions; US Naval Oceanographic Office, 1958). Cold front passage will therefore not
be referred to as a "storm" herein, but instead as an "energetic event".
3.2. Methods
3.2.1. Interpretation of Aerial Still Photographs (ASPs) and Video Surveys (VSs)
Nineteen sets of aerial still photographs (ASPs) were analyzed for this study:
seventeen from the cooperative program run by LSU and NASA, one set (from February-
March 1990) from the EROS data center at the US Geological Survey, and one set (April
2001) from the NASA Ames Research Center. ASPs taken before January 1988 were
obtained using a NASA Stennis Learjet platform from an altitude of 13.7 km (45,000
feet). ASPs taken after January 1988 were obtained by a NASA ER-2 aircraft from an
altitude of 18.9 km (62,000 feet). All ASPs were obtained using a Wild-Heerbrugg RC-
10 metric mapping camera with a focal length of 304.8 mm. Each exposure covers an
area of 14.8 x 14.8 km (8 x 8 nautical miles). Coastal geomorphology was analyzed using
a hand lens to examine original positive ASP film illuminated on a light table.
121
Reproductions were made using a digital camera on a mount aimed vertically down at a
light table. The 2001 images were analyzed in the form of scanned high-resolution
reproductions.
The earliest and the most recent series of ASPs available (taken on January 27,
1987 and April 1, 2001, respectively) were digitally georectified using PCI Works
OrthoEngine AE"^*^ photographic correction software in order to enable direct comparison
of the shorelines for those two surveys taken 14 years apart (e.g., Drury, 2001). Locations
of the more than 100 ground control points used in georectification were obtained from
the Atlas Geographic Information Systems (GIS) online service maintained by LSU
(LSU, 1998). Coordinates of all ground control points were obtained in a UTM Zone 14
projection using the NAD83 datum. Differences in shoreline position were evaluated by
measuring minimum distances to the shoreline from easily identifiable ground control
points (man-made structures) common to both sets of photographs, and from additional
points located at measured distances between such structures. All distances were
measured using ESRI ArcView^" GIS software. The resulting shore-perpendicular
transects were spaced at intervals less than 1 km apart between 92.15°W and 92.65°W.
Differences in shoreline position between January 1987 and April 2001 were divided by
14.2 years to yield average annual rates of shoreline change.
To examine annual to sub-seasonal shoreline evolution, accretion and erosion
patterns were assessed for each individual set of ASPs and the results converted into
coastal characterization diagrams similar to the field-based analysis discussed in Chapter
2. As in the field-based study, erosional environments were inferred in ASPs from the
presence of an exposed peat terrace at the shoreline, indicating landward migration of the
water line over older marsh. This exhumed marsh surface is readily identifiable in aerial
122
photographs by its dark, patchy appearance; exposed marsh often occurs in close
association with carbonate sand deposits that form a veneer of light-colored material over
the peat and may encroach onto backshore marsh vegetation as washover deposits. The
exposed peat terrace consists of well-consolidated clay and organic material, and as such
is resistant to erosion (Chapter 2). This surface therefore typically forms a crenulated
shoreline in plan view, with islands of peat protruding into the swash zone, a pattern
easily visible from the air. On the northeastern chenier plain near Tigre Point (Figure 3-
Ib), eroding zones may also contain small trees or shrubs visible seaward of the berm
crest.
Accretion is inferred from ASPs based on the presence of mudflats fronting the
coast, often accompanied by turbid, muddy water immediately offshore. New and
actively growing mudflats are distinguished from the exposed peat terrace by their linear,
rather than crenulated, appearance. They show a lighter, more homogenous color pattern
compared to the dark, patchy organic marsh terrace, although field observations have
shown that newly accreting mudflats may overlie and reoccupy exposed peat terrace.
Mudflats may become colonized by vegetation (typically Spartina alterniflora, also
called cord grass or oyster grass) if they persist above water in the same location for
several weeks; in such cases, new vegetation is recognizable in aerial photographs by
circular, doughnut-shaped nuclei of young vegetation colonies. If mudflats remain stable
for several seasons to years, vegetation spreads such that an accreting zone must be
identified by the demarcation of a pre-existing shoreline, as is the case on the extensive
accreted area on the eastern chenier plain (immediately west of Freshwater Bayou).
Video surveys (VS) conducted by the LGS were used to gauge the effects of
hurricane and tropical storm activity on coastal morphology in this area. Video surveys
123
were conducted at mid-day (within 3^ hours on either side of noon, keeping low sun
behind the camera) from a heHcopter flown at an altitude of 200 feet, using a Panasonic
WV-F250 3CCD color video camera. VS data were used to interpret the general character
of coastal morphology but were not used to measure dimensions of mudflats or estimate
changes in shoreline position. Five of the eight VSs analyzed for this study were made
immediately after the passage of tropical storms or hurricanes: Hurricanes Danny and
Juan, in August and November 1985 respectively, Tropical Storm Allison in July 1989,
Hurricane Andrew in August 1992, and another storm named Tropical Storm Allison in
June 2001 (LGS, 1985a, b; 1989; 1992; 2001). Three additional VSs were used to
generate coastal characterization diagrams similar to those made from ASPs, because
they covered intervals of time from which no ASPs were available: July 1984, July 1986,
and July 1991 (LGS, 1984; 1986; 1991).
3.2.2. Interpretation of the Synoptic Weather Type Record
Meteorological records for the Lake Charles weather station, where the synoptic
weather type (SWT) index is recorded twice daily, were condensed into a format
indicating the number of days in which each SWT category was noted in every month
since January 1981. The resulting plots were compared with intervals in the aerial
photographic record, focusing on FOR weather, directly associated with cold front
activity, as the most likely to promote resuspension and shoreward sediment transport.
FOR occurrence was closely evaluated over three intervals of time during the late 1980s
and early 1990s when temporal spacing of aerial surveys was most frequent. Variations in
Atchafalaya River sediment flux and water discharge (USAGE, 2002b) were also
assessed for the three intervals from which weather records were examined in detail.
124
While the presence of FOR conditions at the weather station does not necessarily
signify southerly winds at the weather station itself, FOR conditions at the Lake Charles
weather station imply FOR conditions (with strong southerly to southwesterly winds)
over the eastern chenier plain coast, -100 km to the southeast. For this reason, this study
has used the occurrence of FOR conditions at the Lake Charles weather station as an
indicator of cold front activity (with associated pre-frontal southerly winds) on the
chenier plain.
The collection of ASPs was not deliberately timed to coincide with the passage of
particular weather types. Surveys made several weeks to several months apart, therefore,
will not be able to resolve the effects of individual energetic events, which occur on time
scales of hours to days. Quantitative evaluation of coastal accretion is limited because
measurements of mudflat thickness are not available from which volumetric calculations
could be made. The objective of this study is to investigate a possible connection between
coastal geomorphology and cold front incidence, recognizing the limits imposed by the
nature and temporal spacing of aerial surveys.
3.3. Results
3.3.1. Results of Aerial Survey Interpretation
Figure 3-3 shows the locations of 73 shore-perpendicular transects used to
estimate rates of coastal erosion and accretion between January 27, 1987 and April 1,
2001. Net rates of shoreline change over that time are shown in Figure 3-4; numbers
reflect average rates of change in shoreline position over the 14.2-year interval between
125
the two surveys. The results of two earlier surveys are shown for comparison in Figure 3-
4. Erosion rates, which reflect landward retreat of the shoreline, are indicated with minus
signs (-) before the number; rates of accretion (seaward advance of the shoreline) are
indicated with plus (+) signs. As shown in Figure 3-4, for clarity the study will be
considered in three segments: the northeastern (extending from east of Chenier au Tigre
to Freshwater Bayou), the eastern (from Freshwater Bayou to Dewitt Canal) and the
central chenier plain (from Dewitt Canal to the western extent of the study area, near the
now-filled Little Constance Lake).
This study found net erosion on the northeastern chenier plain. Between Chenier
au Tigre and Tigre Point, average shoreline change of-1.4 m/yr reflects landward retreat
of the coast during the interval considered (1987-2001). At Chenier au Tigre itself, the
rate of change (an average from four transects analyzed) was -1.6 m/yr. Between Tigre
Point and Freshwater Bayou, erosion occurred slightly faster, at an average rate of -3.0
m/yr. On the eastern chenier plain (beginning immediately west of Freshwater Bayou),
pronounced accretion was apparent; between Freshwater Bayou and Dewitt Canal, this
study measured net rates of shoreline change that averaged +28.9 m/yr. On the central
chenier plain (west of Dewitt Canal), erosion was once again dominant; this study
recorded rates of shoreline change there that averaged -6.2 m/yr.
Coastal characterization diagrams for all sets of ASPs and VSs are summarized in
Figure 3-5. A complete description of the coastal environment observed in all aerial
surveys (as well as two field surveys) is included in Appendix 3-B. Data in Figure 3-5
and Appendix 3-B that are based on VS observations are indicated with an asterisk (*)
next to the survey date; the locations of accreting zones in those diagrams are estimated
as accurately as possible given the limitations of measurement using an oblique camera
126
angle. The dynamic nature of the chenier plain coast is clear from Figure 3-5; mudflat
accretion waxes and wanes on seasonal and sub-seasonal times scales. ASPs showed that
mudflats change shape and area between surveys made weeks or even days apart.
Mudflats tend to occur most commonly on the eastern chenier plain, immediately west of
Freshwater Bayou; all surveys made since the late 1980s show a large actively accreting
mudflat between Freshwater Bayou and Dewitt Canal that may measure up to several
hundred meters wide. Although this so-called "Freshwater Bayou mudflat" has grown
considerably since the relocation in 1990 of a dredge dump immediately west of the
channel mouth (Chapter 2), the mudflat has not shown a uniform increase in size from
survey to survey. Rather, its cross-shore width, shape, and western extent vary, and
sediment bars and runoff channels on the mudflat surface visibly alter drainage patterns.
Narrow mudflats (generally <10 m wide) were occasionally observed on the
central chenier plain (notably in two 1985 post-hurricane surveys, as well as in post-
tropical storm surveys of July 1989, June 2001, and in the March 2001 field survey
discussed in Chapter 2 that followed dredging activity). Mudflats on the northeastern
chenier plain were very rare, seen only in the February 1991 and December 1992 surveys.
Another feature of shoreline evolution apparent over the 17 years studied is the
gradual filling of coastal lakes. A number of lakes close to the shoreline (Miller, Little
Constance, Big Constance, and Flat Lake) appear on maps of the chenier plain. Of those.
Miller and Little Constance Lakes have been filled entirely since the mid-twentieth
century, and the area covered by Big Constance Lake has been greatly reduced. The
diminishing size of Big Constance Lake between 1987 and 1998 is shown in Figure 3-6.
This phenomenon is common to near-shore lakes along the entire length of the chenier
plain (Adams et al., 1978). The source of sediment that fills these nearshore lakes is
127
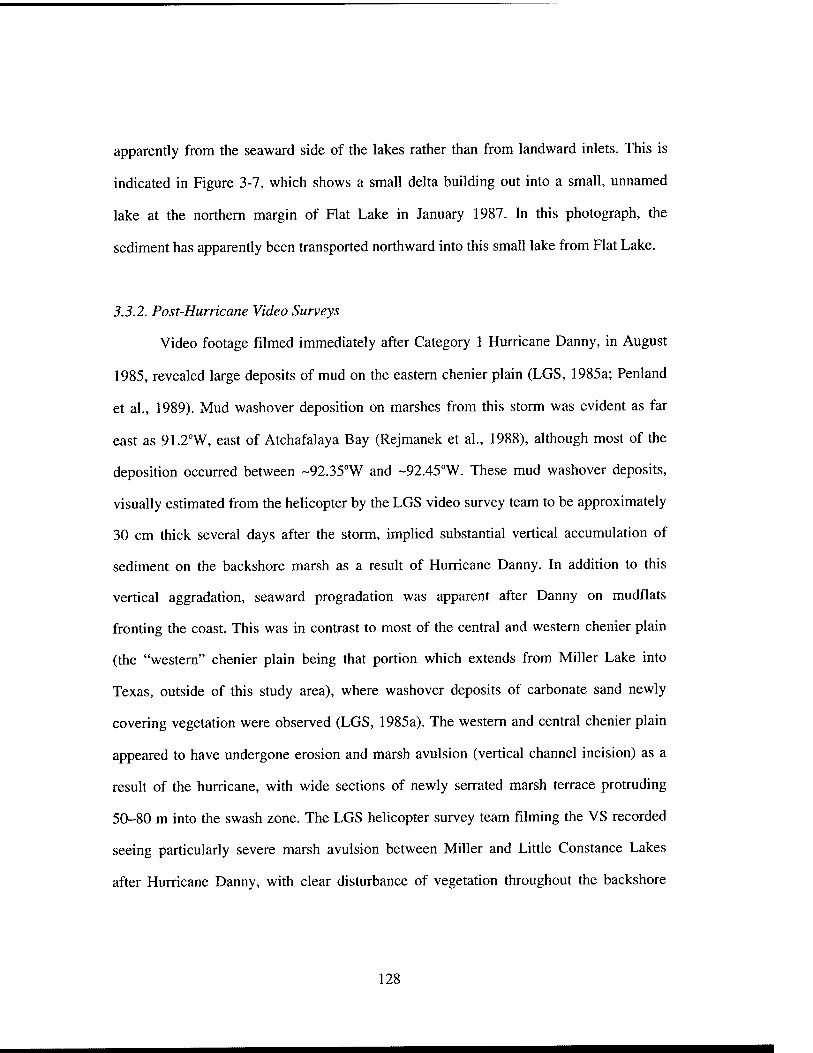
apparently from the seaward side of the lakes rather than from landward inlets. This is
indicated in Figure 3-7, which shows a small delta building out into a small, unnamed
lake at the northern margin of Flat Lake in January 1987. In this photograph, the
sediment has apparently been transported northward into this small lake from Flat Lake.
3.3.2. Post-Hurricane Video Surveys
Video footage filmed immediately after Category 1 Hurricane Danny, in August
1985, revealed large deposits of mud on the eastern chenier plain (LGS, 1985a; Penland
et al., 1989). Mud washover deposition on marshes from this storm was evident as far
east as 91.2''W, east of Atchafalaya Bay (Rejmanek et al., 1988), although most of the
deposition occurred between ~92.35''W and ~92.45°W. These mud washover deposits,
visually estimated from the helicopter by the LGS video survey team to be approximately
30 cm thick several days after the storm, implied substantial vertical accumulation of
sediment on the backshore marsh as a result of Hurricane Danny. In addition to this
vertical aggradation, seaward progradation was apparent after Danny on mudflats
fronting the coast. This was in contrast to most of the central and western chenier plain
(the "western" chenier plain being that portion which extends from Miller Lake into
Texas, outside of this study area), where washover deposits of carbonate sand newly
covering vegetation were observed (LGS, 1985a). The western and central chenier plain
appeared to have undergone erosion and marsh avulsion (vertical channel incision) as a
result of the hurricane, with wide sections of newly serrated marsh terrace protruding
50-80 m into the swash zone. The LGS helicopter survey team filming the VS recorded
seeing particularly severe marsh avulsion between Miller and Little Constance Lakes
after Hurricane Danny, with clear disturbance of vegetation throughout the backshore
128
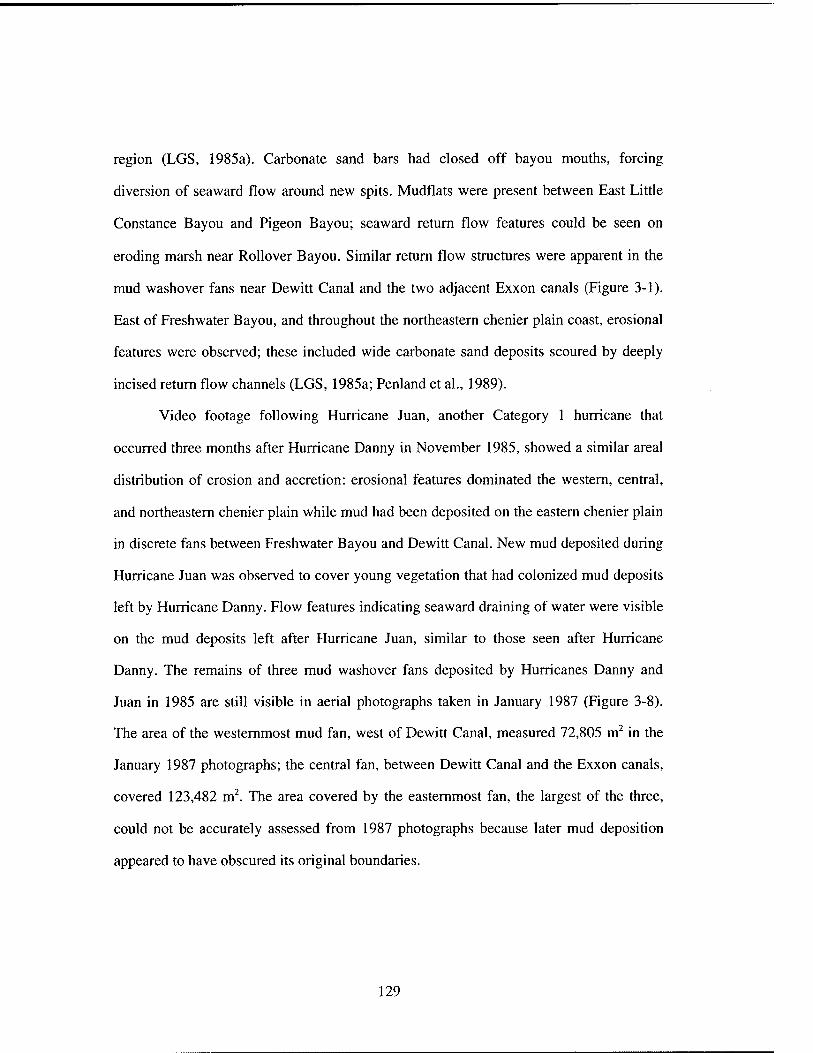
region (LGS, 1985a). Carbonate sand bars had closed off bayou mouths, forcing
diversion of seaward flow around new spits. Mudflats were present between East Little
Constance Bayou and Pigeon Bayou; seaward return flow features could be seen on
eroding marsh near Rollover Bayou. Similar return flow structures were apparent in the
mud washover fans near Dewitt Canal and the two adjacent Exxon canals (Figure 3-1).
East of Freshwater Bayou, and throughout the northeastern chenier plain coast, erosional
features were observed; these included wide carbonate sand deposits scoured by deeply
incised return flow channels (LGS, 1985a; Penland et al., 1989).
Video footage following Hurricane Juan, another Category 1 hurricane that
occurred three months after Hurricane Danny in November 1985, showed a similar areal
distribution of erosion and accretion: erosional features dominated the western, central,
and northeastern chenier plain while mud had been deposited on the eastern chenier plain
in discrete fans between Freshwater Bayou and Dewitt Canal. New mud deposited during
Hurricane Juan was observed to cover young vegetation that had colonized mud deposits
left by Hurricane Danny. Flow features indicating seaward draining of water were visible
on the mud deposits left after Hurricane Juan, similar to those seen after Hurricane
Danny. The remains of three mud washover fans deposited by Hurricanes Danny and
Juan in 1985 are still visible in aerial photographs taken in January 1987 (Figure 3-8).
The area of the westernmost mud fan, west of Dewitt Canal, measured 72,805 m^ in the
January 1987 photographs; the central fan, between Dewitt Canal and the Exxon canals,
covered 123,482 m^. The area covered by the easternmost fan, the largest of the three,
could not be accurately assessed from 1987 photographs because later mud deposition
appeared to have obscured its original boundaries.
129
After Hurricane Andrew passed over the Gulf coast in 1992, causing extensive
damage to property in Florida, Alabama, and Mississippi, very little storm impact was
apparent on Louisiana's chenier plain (LGS, 1992). As in most aerial still photographs,
the central and northeastern chenier plain after Hurricane Andrew showed typical
erosional characteristics, while mudflats were visible along most of the shoreline between
Dewitt Canal and Freshwater Bayou. The LGS video survey team noted from their
helicopter that marsh vegetation did not appear to be matted down, indicating little
impact from flooding due to Hurricane Andrew.
A video survey made by the LGS by helicopter days after major flooding
associated with Tropical Storm Allison 2001 receded from the chenier plain recorded
(qualitatively) more impact following this storm than after Hurricane Andrew, though
without the major mud washover deposits of the two 1985 hurricanes. Recently deposited
lines of driftwood and other debris were visible on beaches along the central chenier plain
in June 2001, and a wide expanse of unvegetated mud could be seen on the mudflat
immediately west of Freshwater Bayou, some of which was attributed to a mud washover
event near Dewitt Canal (LGS, 2001). Similar morphologic trends were noted after an
earlier tropical storm also named Tropical Storm Allison, which occurred in July 1989
(LGS, 1989). After the 1989 Tropical Storm Allison, narrow (<10 m wide) mudflats were
apparent on the central chenier plain in the vicinity of Big Constance Lake, and a mudflat
hundreds of meters wide covered the eastern chenier plain near Freshwater Bayou.
3.3.3. Interpretation of Meteorological and Fluvial Discharge Variations
Figure 3-9 shows variation through time in the number of days per month during
which FOR conditions occurred, from 1981 through 2001. Atchafalaya River discharge
130
(both water discharge and fluvial sediment flux; data from the US Army Corps of
Engineers, 2002b) are shown for the same time interval. Water and sediment discharge
do not necessarily peak simultaneously or follow identical trends from year to year. This
disparity is due largely to the dependence of the river's sediment load on agricultural
activity in midwestem states, the intensity of which depends in turn on latitude and local
weather. The high incidence of cold front activity during winter months is evident in
Figure 3-9, which shows FOR peaks that span fall, winter, and early spring. Some
inherent bias is introduced by the timing of aerial surveys (vertical arrows in Figure 3-9),
especially during the mid-1990s when aerial surveys were made only once per year and
always in the spring, coinciding with the end of the cold-front season and with peak
Atchafalaya River discharge. Surveys made in spring may show more active accretion
than at randomly chosen times of year, given that cold front occurrence and high river
discharge may facilitate coastal accretion.
Several groups of aerial surveys are sufficiently closely spaced in time to compare
weather records and Atchafalaya River discharge with the relative extent of mudflat
accretion evident in photographs. Three intervals examined at high resolution are shown
in Figure 3-10: October 1987 through January 1988, April through September 1989, and
November 1990 through February 1991.
3.3.3.1. Interval 1: Increasing FOR Activity, Increasing Fluvial Sediment Flux
Interval 1 spans three months between 10/22/87 and 1/22/88. No mudflats could
be unequivocally identified in the 10/22/87 survey. The only indication of potential
accretion in that survey was a zone of wave attenuation in turbid water near Dewitt Canal
and the Exxon canals. That set of ASPs was taken after a period of low FOR activity
131
during the summer and fall of 1987, which corresponded to a spring and summer of
moderate to high sediment discharge from the Atchafalaya River (Figure 3-10). During
the time between the two sets of ASPs in Interval 1, winter cold front season began and
the proportion of FOR activity increased, implying an increase in FGR conditions (with
associated southerly winds) on the chenier plain. In eariy January 1988, several cold
fronts passed through this area that each lasted three to four days. A peak in sediment
discharge from the Atchafalaya River occurred approximately one month before the
1/22/88 survey (Figure 3-10), presumably contributing a pulse of sediment to the inner
shelf. In the 1/22/88 photographs, taken during the peak of frontal activity that winter and
after the late December sediment pulse, noticeable accretion had occurred relative to the
10/22/87 survey. Uniform, unvegetated mudflats fronted the coast for neariy the entire
distance from Freshwater Bayou to Dewitt Canal on 1/22/88, measuring 130 m wide at
Triple Canal and 43 m wide at the Exxon canals where there had been no mudflat visible
three months earlier.
3.3.3.2. Interval 2: Moderate Fluvial Sediment Flux, High Storm (GTD) Activity
Interval 2 included two sets of ASPs and one VS. The ASPs, from 4/1/89 and
9/19/89, were spaced five and a half months apart and spanned the summer of 1989. The
VS was made between the two sets of ASPs, on 7/18/89. FOR activity had been high
during the winter of 1989, but had begun to decrease in the two months prior to the first
survey of this interval (Figure 3-10). Sediment flux from the Atchafalaya River had been
moderate to high in the winter and spring prior to the 4/1/89 ASPs. Between 4/1/89 and
9/19/89, FOR activity experienced a typical summer low, with the FOR index comprising
only one to two days per month throughout the summer. Fluvial sediment flux during
132
Interval 2 remained moderate, with levels in late August similar to those of mid-March
(unusually high for that time of year). Sediment flux had begun to decrease further as of
early September 1989. In that set of ASPs, narrow, partially submerged mudflats were
visible from Freshwater Bayou to half way between the Exxon canals and Dewitt Canal.
Mudflat width was 158 m at Triple Canal and 130 m at the Exxon canals; the mudflat
surface was marked by drainback features and sparse vegetation.
Although frontal activity had contributed litde to the summer weather patterns of
this area between April and September 1989 and fluvial sediment flux had remained
largely unchanged, the onset of hurricane season had become an increasingly important
factor in those months. Gulf Tropical Disturbance (GTD) events typically occur first in
late spring, and continue to influence weather in this region through late fall. For eight
days in late June 1989, coastal Louisiana experienced high winds and torrential rains
associated with Tropical Storm Allison (not to be confused with the storm of the same
name that hit the same area in June 2001). The extensive destruction that resulted from
the 1989 Tropical Storm Allison on the northern Gulf coast was largely the result of the
storm's convoluted path; after making landfall just west of Houston, Texas, the storm
center took several days to complete a 360° clockwise looping track over western
Louisiana before continuing to move to the northeast (National Hurricane Center [NHC],
2002).
Within Interval 2, the VS made between the two sets of ASPs two weeks after
Tropical Storm Allison departed (on 7/18/89), showed mudflats on the central chenier
plain in an area typically prone to erosion, and documented the presence of accreted mud
opposite Dewitt Canal where none was visible in the 4/1/89 survey (Appendix 3-B, part
x; LGS, 1989). As of 9/19/89, substandal accretion had occurred just west of Freshwater
133
Bayou relative to 4/1/89. At both the Triple Canal and the Exxon canal sites, mudflats in
the September photographs measured approximately 173 m wide; at Dewitt Canal, where
in April there had been no mud accreted, a mudflat measuring 101 m wide had grown. In
contrast to the partially submerged, sparsely vegetated mudflats of 4/1/89, the 9/19/89
accreted zone was well-vegetated on its landward side, implying stable sediment for the
previous several months.
GTD (Gulf Tropical Disturbance) events occurred on several other occasions
during the summer of 1989, and became less frequent through the fall. Only one other
event within Interval 2 was prominent enough to be named. Hurricane Chantal was a
Category 1 hurricane that passed near western Louisiana in the final week of July and
made landfall in eastern Texas on August 1, 1989. During Hurricane Chantal the chenier
plain coast experienced a storm tide of approximately 1.3 m above mean sea level;
thirteen deaths were attributed to Hurricane Chantal in Texas and western Louisiana
(NHC, 2002). Interval 2 thus records geomorphic variation over a time of moderate and
fairiy constant fluvial sediment flux but intense storm activity due to tropical depressions.
3.3.3.3. Interval 3: High FOR Activity, High Fluvial Sediment Flux
Interval 3 included three closely spaced sets of ASPs over a three-month period
between November 1990 and February 1991. ASPs within this interval were taken on
11/14/90, three weeks later on 12/8/90, and again on 2/15/91. This interval spanned both
increasing FOR activity and increasing fluvial sediment flux. Because these surveys were
made during winter, GTD events did not occur during Interval 3. Prior to the first ASPs
of this interval, FOR activity had been low in the summer months of 1990. Sediment flux
that summer was likewise extremely low. Interval 3 spanned a sharp peak in frontal
134
activity (Figure 3-10), most of which was accounted for by unusually vigorous cold front
activity between the 12/8/90 and 2/15/91 surveys. The average number of FOR days per
winter month at the Lake Charles weather station (calculated for October through March
over the twenty years of available data at that station, 1981-2001) is 8.2. January 1991
saw 18.0 days of FOR weather, with the thirty-day period between 12/30/90 and 1/30/91
including 19.5 days of FOR conditions. During the last six weeks of Interval 3, a
substantial peak in sediment flux occurred. This increase in sediment flux was largely
accounted for by unusually high water discharge from the Atchafalaya River; maximum
water discharge and fluvial sediment flux was recorded during the last week of January
1991 and reached levels not normally achieved until spring flood runoff (Figure 3-10).
Examination of aerial photographs from Interval 3 revealed no substantial
changes in the three weeks between the first two surveys, from 11/14/90 to 12/8/90. The
extent of mudflat occurrence at this time was likely higher than would occur naturally,
due to a dredging operation that left sediment at the western edge of the Freshwater
Bayou mouth between late September and early October 1990 (see Figure 2-19). A wide
mudflat was visible on 11/14/90 and 12/8/90 that extended from Freshwater Bayou west
to ~2 km east of Dewitt Canal. Mudflat width between those two surveys decreased
slightly at Triple Canal from 216 m to 173 m. At the Exxon canals the mudflat widened
from 114 m to 130 m over those three weeks, while at Dewitt Canal a narrow (-15 m
wide) mudflat present on 11/14/90 had disappeared by 12/8/90. Between 12/8/90 and
2/15/91, the period marked by very high FOR activity and a peak in fluvial sediment flux,
dramatic growth of mudflats occurred on the eastern chenier plain (Figure 3-5; Appendix
3-B, part xv). Uniform, pale brown mudflats 200-300 m wide fronted the coast in the
2/15/91 photographs all along the northeastern and eastern chenier plain (from 92.1°W to
135
~1 km east of Dewitt Canal). The mud appeared unvegetated and its seaward extent
graded into very turbid water. An additional zone of turbid water and possible incipient
accretion was evident on the central chenier plain, between Rollover Bayou and Dewitt
Canal. Mudflat width at Triple Canal increased from 173 m to 259 m between 12/8/90
and 2/15/91, while at the Exxon canals the mudflat shrank from 130 m to 43 m over the
same time.
In summary, the three intervals considered span a range of weather conditions and
fluvial sediment discharge. The environmental conditions sampled by these intervals
dictate the ability of this exercise to distinguish the relative influence of fluvial sediment
flux and meteorological activity on mudflat extent. Intervals 1 and 3, which covered late
fall and winter months, revealed coastal geomorphic evolution during a time of year
dominated by cold front activity. During the time between the two surveys included in
Interval 1, FOR activity increased concurrently with increasing sediment flux from the
Atchafalaya River. Corresponding mudflat accretion occurred on the eastern chenier
plain during Interval 1. Interval 3 spanned three months of high fluvial sediment flux and
unusually high FOR activity; pronounced accretion occurred on the eastern and
northeastern chenier plain during this time. In contrast to those two fall/winter intervals.
Interval 2 spanned late spring and summer. Fluvial sediment flux was moderate during
Interval 2; FOR activity was absent, but high-energy events occurred in the form of a
hurricane and a tropical storm, both of which made landfall to the west of the chenier
plain. Substantial mudflat growth occurred during the summer covered by Interval 2.
136
3.4. Discussion
3.4.1. Shoreline Migration on the Chenier Plain, 1987-2001
Decadal-scale shoreline evolution on the chenier plain, as indicated by Figure 3-4,
follows a similar general pattern to the most recent study of comparable scope, by Adams
et al. (1978; Figure 3-4b). These results are also consistent with rates of shoreline change
indicated for the chenier plain by Westphal et al. (1991) in a summary of the northern
Gulf Coast shoreline. These studies have found erosion on the northeastern chenier plain,
localized accretion on the eastern chenier plain, and erosion on the central chenier plain
(Figure 3-4). On eroding segments of the chenier plain, local rates of shoreline change are
more rapid than expected from simple eustatic sea level rise. Eustatic sea level currently
rises at a rate of ~3 mm/yr (Houghton, 1997). On a coastal plain with a 1° slope, eustatic
sea level rise would account for -0.17 m/yr of landward migration of the water line. The
slope on the chenier plain is somewhat steeper than 1°, and near-vertical marsh cliffs
front much of the coast, so a shoreline retreat there of less than 0.17 m/yr is attributable
to eustatic sea level rise. Actual rates of shoreline retreat measured in this study exceed
that due to global sea level change by more than an order of magnitude. This finding is
consistent with previous studies that have shown much higher rates of relative sea level
rise on the Louisiana coast than eustatic sea level change (Penland and Ramsey, 1990)
Transects measured in this study yielded a rate shoreline migration of -2.2 m/yr
on the northeastern chenier plain, between Chenier au Tigre and Freshwater Bayou (a
combination of -1.4 m/yr from Chenier au Tigre to Tigre Point [transects 1 through 13;
Figure 3-3] and -3.0 m/yr from Tigre Point to Freshwater Bayou [transects 14 through
25]). From 1954 to 1969, the northeastern chenier plain eroded at a more rapid average
137
rate of-5 m/yr (Adams et al., 1978). In contrast, Morgan and Larimore (1957) identified
this same area as having undergone progradation between 1812 and 1954, at rates of+2.7
m/yr immediately west of Chenier au Tigre, and +4.8 m/yr around Tigre Point. Figure 3-
11, based on the work of Morgan et al. (1953), shows the extent of accretion noted on the
eastern and northeastern chenier plain until the 1950s. Although the transects analyzed by
Morgan and Larimore (1957) were fewer and more widely spaced (-1.7 km apart) than in
this analysis (-0.7 km), the shift from accretion to erosion on the northeastern chenier
plain over the past 50 years is clearly evident.
The transition from progradation to net shoreline retreat on the northeastern
chenier plain may be due to a steady decrease in sediment load carried by the Mississippi
River and its distributaries over the past six decades (Keown et al., 1986; Kesel, 1988;
Meade, 1995). Soil conservation practices initiated in the Midwest in the 1930s have
significantly reduced erosion on farmland there (Keown et al., 1986). Dams, reservoirs,
and flood control structures built on the Mississippi, Arkansas, and Missouri Rivers in the
1950s and 1960s trap additional sediment upstream (Keown et al., 1986; Kesel, 1988;
Meade, 1995; Mossa, 1996). The amount of sediment contributed to river discharge by
bank erosion has also decreased substantially due to the emplacement of concrete lining
along the main course of the Mississippi River. Sediment flux in the lower Mississippi is
now approximately one third of that measured before 1950 (Mossa, 1996), and the
Atchafalaya River sediment load has seen a corresponding decrease (P. Palmieri, US
Army Corps of Engineers, pers. comm.). The additional influence of sills at the Old River
Control Structure, which since 1963 has regulated the proportion of Mississippi discharge
entering the Atchafalaya River, is believed to make a minimal contribution to reduction
of the Atchafalaya River sediment load (J. Austin, pers. comm.). Probably as a
138
consequence of the reduced sediment load on the Mississippi-Atchafalaya River system,
the northeastern chenier plain, which had experienced net accretion until the 1950s, now
develops prograding mudflats only in response to higher than normal flood discharge
flushing sediment down the river. Mudflat development was noted on the northeastern
chenier plain after major flood events in 1973 and 1975 (Rouse et al., 1978; Wells and
Roberts, 1981). This may explain episodic mudflat accretion on the northeastern chenier
plain following high Atchafalaya River discharge in February 1991 and December 1992
(Appendix 3-B, parts xv and xix, respectively).
On the eastern chenier plain (between Freshwater Bayou and Dewitt Canal), this
study measured rates of shoreline change that averaged +28.9 m/yr. Every transect from
Transect 26 through 44 (Figure 3-3), the latter 0.9 km west of Dewitt Canal, indicated net
seaward progradation over the 14-year study period. The highest rates of accretion were
found near the eastern end of this zone, where, near the Exxon canals, several transects
recorded rates exceeding +35 m/yr, for overall seaward progradation of more than 500 m
between 1987 and 2001. Rapid morphologic changes occur on this "Freshwater Bayou
mudflat" of the eastern chenier plain, and the average rates of shoreline change inferred
from these two sets of ASPs (January 1987 and April 2001) would vary if photographs
from different dates were used. Although this rate of +28.9 m/yr represents the average
annual change between January 1987 and April 2001, between more closely-spaced
surveys this mudflat shoreline may accrete more rapidly, more slowly, or may even erode
(Appendix 3-B).
The eastern chenier plain has been observed since the 1950s to be the site of
intermittent mudflat accretion, a phenomenon attributed by most authors since Morgan et
al. (1953) to Atchafalaya sediment discharge and, more recently, to that source in
139
combination with cold front storm activity (e.g., Huh et al., 2001). Morgan and Larimore
(1957) found mudflat progradation on the eastern chenier plain progressing at a rate of
+6.3 m/yr between 1932 and 1954. Within this section from 1954 to 1969, Adams et al.
(1978) observed shoreline retreat at -4 m/yr on the eastern chenier plain, with the
exception of 3 km of shoreline immediately east of Dewitt Canal where progradation at a
rate of +9 m/yr was observed. Those authors attributed the increased accretion rate on
this eastern chenier plain (from +6.3 m/yr to +9 m/yr) to naturally increasing sediment
flux from the Atchafalaya River as it captured more of the Mississippi flow prior to
construction of the Old River flow control structure in 1963 (Adams et al., 1978).
As summarized in Figure 3-4, west of Dewitt Canal on the central chenier plain,
rates of shoreline change averaged -5.6 m/yr from 1812 to 1954 (Morgan and Larimore,
1957; that rate referred to the coast extending 100 km west from Dewitt Canal) and at
-11.7 m/yr from 1954 to 1969 (Adams et al., 1978). The increased erosion rate between
those two earlier studies may have been due in part to severe localized erosion on the
central chenier plain due to Hurricane Audrey in 1957 (Morgan et al., 1958; Adams et al.,
1978). Erosion on the central chenier plain between 1987 and 2001 was comparable to
the rate found by Morgan and Larimore (1957), with rates of shoreline change averaging
-6.2 m/yr.
The higher rates of erosion on the central chenier plain compared with the
northeastern and eastern chenier plain may be caused by exposure to higher wave energy
on this southwest-facing coast relative to the northeastern chenier plain (northeast of
Tigre Point). The presence of Trinity Shoal (Figure 3-la) -30 km offshore of the
northeastern chenier plain may provide some shelter from wave energy, allowing erosion
to proceed at a slower rate on the northeastern chenier plain relative to the central chenier
140
plain. The area west of Freshwater Bayou where mudflat accretion is common apparently
receives some shelter in the lee of this shoal.
The fastest erosion rates measured during this study, -6.2 m/yr on the central
chenier plain, are similar to rates of erosion due to natural wave attack on the Mississippi
Delta. The most rapid erosion on the Louisiana coast occurs on south-facing shorelines of
the western Mississippi Delta plain, on barrier islands that form the margins of
abandoned Holocene delta lobes (see Figure 1-1): -5 to -8 m/yr on the southwestern delta
plain, and up to -14 m/yr on the south central delta plain, although localized sections of
barrier islands may erode at rates exceeding -20 m/yr (e.g., Gagliano and van Beek,
1970; USAGE, 1971; Adams et al. 1978; Westphal et al., 1991).
To date, no engineering projects have been undertaken to mitigate erosion on the
central and northeastern chenier plain. Although jetties have been constructed at the
mouths of the Sabine River (on the Texas-Louisiana border, at ~93.85''W on the western
chenier plain) and Calcasieu River (93.4''W) to keep navigation channels open, erosion-
control projects on the undeveloped central and northeastern chenier plain are considered
not to be cost effective (USAGE, 1971; Adams et al., 1978). Low population density and
lack of development on most of the chenier plain coast has resulted in little demand for
state intervention, hence a "non-critical erosion" designation of this shoreline by the
Army Gorps of Engineers. This area has been allowed to erode naturally, with the
exception of routine maintenance at the Freshwater Bayou shipping channel for
commercial purposes, which has provided dredged sediment to the eastern chenier plain
mudflats since 1990 (Ghapter 2).
141
3.4.2. Natural Accretion on the Eastern Chenier Plain
Naturally occurring accretion on the eastern chenier plain, so anomalous
compared to the rapid shoreline retreat elsewhere on the Louisiana coast, is believed to be
caused primarily by deposition of Atchafalaya sediment resuspended from the inner shelf
during cold fronts (e.g.. Wells and Kemp, 1981; Roberts et al., 1987, Huh et al., 2001).
Although mudflat growth in this area has been accelerated (and existing mudflats
stabilized) by the presence of a dredge spoil dump at the mouth of Freshwater Bayou
since 1990 (Chapter 2), that area has experienced natural accretion for decades longer
than the dredged sediment has been a contributing factor. This accretion phenomenon,
and possible explanations for its concentration on the eastern chenier plain, are explored
further here.
3.4.2.1. Meteorological Conditions Driving Front Passage
Mudflat accretion appears to be closely tied to frontal passages during fall, winter,
and early spring. Such accretion, particularly on the eastern chenier plain, is believed to
be aided by weather conditions that favor strong southerly winds associated with cold
front passage. Pre-frontal southerly winds blowing across the Gulf of Mexico generate
long-fetch waves that resuspend sediment on the inner shelf and transport suspended
sediment landward and to the west (Kineke, 2001a, b; Kineke et al., 2001). Wave set-up
and storm surge can then bring suspended sediment onshore, where it is deposited as
mudflats (e.g., Roberts et al., 1987). The power of these frontal systems to facilitate
mudflat growth lies not only in the strength of the southerly winds that immediately
precede the arrival of a front's squall line, but also in the abrupt transition from southerly
to northeriy winds that strand mud onshore during wave set-down as the front arrives
142
(e.g., Fernandez-Partagas and Mooers, 1975). These contrasting wind directions on either
side of a front have been shown schematically in Figure 3-2. The exact orientation of the
squall line and the wind direction behind the front vary depending on the origin of the air
behind the front (Roberts et al., 1987). Fronts that border a Pacific High (PH) system
trend more shore-oblique and bring more northwesterly winds relative to fronts that
border Continental High (CH) air masses, which trend more shore-parallel and bring
colder northerly to northeasterly winds (Muller and Willis, 1983; Roberts et al., 1987).
The arrival of fronts associated with CH conditions involves higher wind speeds than the
PH case and therefore causes more rapid wave set-down immediately after front passage.
3.4.2.2. Oceanic Conditions During Front Passage: Mechanism for Shoreward Transport
of Sediment
In addition to promoting landward transport of fine-grained sediment on the
eastern chenier plain inner shelf, variable winds and the oceanographic response to
frontal passage affects the size and distribution of the Atchafalaya discharge plume, as
well as salinity, water level, suspended sediment concentration, and sea surface
temperatures in Atchafalaya Bay and inner shelf water (Moeller et al., 1993; Walker and
Hammack, 2000).
Field observations by Kineke et al. (2001) have documented rapid mixing and
destratification of the water column with respect to suspended sediment concentration,
salinity, and temperature during cold front approach. Multiple cold fronts analyzed as
part of that study resulted in net onshore sediment flux during pre-frontal and frontal
conditions in March 2001. Sediment is transported shoreward by a depth-averaged
current of 0.20-0.25 m/s, with a comparable along-shore (westward) velocity component.
143
Under those conditions, concentrations of suspended sediment near the bed (0.3 m
elevation) can exceed 2 g/1 (Kineke, 2001a; Kineke et al., 2001).
Stratification in the water column is rapidly re-established with onset of northerly
winds within 1-2 hours of front passage. During wave set-down due to post-frontal
northerly winds, the dominant direction of surface water transport is offshore. Upwelling
occurs near shore in response to seaward movement of surface water, resulting in
continued shoreward transport within the lowermost water column. Because sediment
concentrations are highest in the lowest part of the re-stratified lower water column, the
landward transport occurring in the lowermost water column leads to a net flux of
sediment toward the shore during the post-frontal phase. Post-frontal wind direction is
generally from the north, but resulting sediment flux may be either eastward or westward.
Thus sediment flux is shoreward during pre-frontal southerly winds, when the water
column is well-mixed with respect to suspended sediment concentration, and also during
post-frontal wave set-down when surface water transport is governed by northerly winds,
because the highly-concentrated lower water column is transported landward due to
upwelling (Kineke, 2001b; Kineke et al., 2001). Figure 3-12 illustrates this process,
showing suspended sediment flux in the water column that corresponds to net transport
toward shore during pre- and post-frontal conditions.
3.4.2.3. Mechanism for Sediment Deposition on Mudflats
The mechanism discussed above explains shoreward transport of sediment during
both pre-frontal and post-frontal conditions. An additional mechanism is required to
explain deposition of sediment onshore in the form of mudflats as a result of cold front
passage, as observed by land-based field study (Kemp, 1986; Roberts et al., 1987; Huh et
144
al., 1991). The process proposed by H. H. Roberts and O. K. Huh to explain observations
of gelatinous mud deposits onshore relies on wave set-up to elevate the water level
sufficiently to bring mud onshore above the high-tide level. Measurements of sea surface
elevation have shown that water level can increase by 0.30 to 1.22 m due to cold front
passage, depending on the intensity of the event (Boyd and Penland, 1981; Penland and
Suter, 1989). "Stronger" front passage (events involving higher pre-frontal southerly
wind velocity) produces greater elevation of the sea surface (due to water level set-up)
and therefore have greater potential to facilitate onshore deposition of mud above the
high tide mark, where it may become permanently accreted to the coast.
Fluid mud deposited at the mudflat surface during cold fronts can occur in
concentrations >100 g/1 (Kemp, 1986), high enough that its yield strength becomes
significant (e.g., Einstein, 1941; see McCave, 1984). Laboratory experiments have shown
an exponential increase in the yield strength of fluid mud with increasing suspended
sediment concentration (Krone, 1962, 1963; Owen, 1970; Hydraulics Research Station,
1979; see also Merckelbach et al., 2002 and Dearnaley et al., 2002). The following
empirical relationship between sediment concentration and yield strength was determined
by Krone (1962):
T,=4.9*10-'C'-' (3.2)
where Tb is the yield strength and C is sediment concentration.
Though field observations of newly deposited mud were not made during this
study, data obtained by Kemp (1986) during a cold front on the Louisiana chenier plain
may be used to examine properties related to sediment deposition there. Kemp (1986)
145
measured a sediment concentration of 416 g/1 from the surface of newly deposited mud,
equivalent to a bulk density of 1260 kg/m^ The shear strength of this material was
calculated to be 17.1 Pa, according to equation 3.2 above of Krone (1962).
As a slurry of sediment washes up the mudflat surface with each wave, it will
spread and thin until the velocity of the material decreases to zero. For mud which has
spread sufficiently that its thickness drops below a critical value, the yield strength will
enable this material to remain at rest and to resist down-slope movement due to gravity.
The shear stress acting on the slurry of sediment at rest is equal to:
T - pghS (3.3)
where p is the density of the mud (1260 kg/m^), g is acceleration due to gravity (9.81
m/s), h is the thickness of the mud layer, and S is the slope of the mudflat on which it
rests. When this shear stress is set equal to the yield strength of the sediment (17.1 Pa) as
determined by Kemp (1986), and a slope of 0.01 is assumed for the mudflat surface based
on surveyed profiles also made by Kemp (1986), this relationship can be solved to yield a
thickness (h) of -0.14 m. For areas of the mud deposit with a thickness less than this
critical value, the yield strength (Tb) is greater than the shear stress acting on it (T) and
the material will resist the tendency to flow seaward. Table 3-1 shows the yield strength
and critical thickness (h) calculated for mud with a range of sediment concentrations and
mudflat surface slopes based on equations 3.2 and 3.3 above.
As the new deposit gradually de-waters, seaward return flow of clear water may
be observed over recent mud deposits, as has been noted in prior field studies (Huh et al.,
2001; O. K. Huh, pers. comm.). The above calculations have been made using
146
measurements from one study of post-frontal mud deposition (Kemp, 1986), and could be
refined by incorporating field data from more cold front events. Additional field study of
onshore deposition during cold fronts is recommended to provide in situ measurements of
yield strength that could clarify this proposed mechanism of sediment deposition.
There remain questions regarding the mechanism by which sediment
concentration increases from that measured near the sea bed in 5 m water depth, ~2 km
offshore (on the order of 10 g/1; Kineke, 2001a, b) to that measured on the mudflat
surface (order 100 g/1; Kemp, 1986). The formation of such high sediment concentrations
in a new mud deposit may be related to trapping and convergence processes not yet
thoroughly understood. Formation of concentrated fluid mud layers (order 100 g/1) on the
Amazon shelf has been shown to occur due to trapping of sediment in the convergence
zone of near-bottom currents at a salinity front (Kineke et al., 1996). It is possible that a
comparable convergence of currents occurs on the chenier plain inner shelf that has not
yet been identified; for example, onshore bottom currents resulting from upwelling may
encounter a convergence zone at a salinity front in shallow water. This zone would also
be the region of the onset of stratification (i.e. the transition from shallow, well-mixed
water column to a stratified water column). Such convergence would enhance setding
and may generate the high sediment concentrations observed by Kemp (1986) on the
eastern chenier plain mudflat surface.
In the manner described above, sediment may be left behind as a deposit above
the high tide line where it remains stranded after the front has passed, and also as inter-
tidal mudflats from which sediment may be re-mobilized when inter-tidal mudflats are
submerged during the next tidal cycle. If deposition is not immediately followed by re-
submergence (either by the next tidal cycle, if below the high tide mark, or by the next
147
cold front if above the high tide limit), mud deposits may subsequently undergo
stabilization through three processes. First, a muddy, unconsolidated sea bed immediately
offshore dampens incoming wave energy (Wells, 1983; Kemp, 1986), greatly reducing
the potential for waves to erode the gelatinous new deposits in the inter-tidal zone, while
encouraging further deposition of sediment carried by incoming waves. Second,
desiccation over several days causes the mud deposits above the high tide line to dry and
form mud cracks (Huh et al., 1991, 2001). The resulting sturdy, consolidated cobbles help
to armor the coast against future wave attack. Such a deposit was observed several times
on the Freshwater Bayou mudflat in the late 1980s (see Figure 2-3).' Third, colonization
by vegetation will stabilize the new mud deposit and serve to further reduce the wave
energy available to erode the deposit (e.g.. Huh et al., 1991). Panicum and Spartina
grasses grow rapidly enough to at least partially cover a mud deposit hundreds of square
meters in area in less than three months (LGS, 1985b).
Figure 3-13 shows stages of the two mechanisms proposed to explain (1)
landward sediment transport during a cold front (Kineke, 2001a, b; Kineke et al., 2001)
and (2) mud deposition during a cold front and its possible eventual stabilization (Kemp,
1986; Huh et al., 1991, 2001). Episodic deposition in this manner, assuming little erosion
between cold front events, results in a sequence of stacked deposits identifiable in
mudflat stratigraphy. Such uniform deposits, 2-10-cm-thick beds of homogenous bulk
density, have been recognized in cores collected on the Freshwater Bayou mudflat
(Coleman, 1966; Kemp, 1986) and immediately offshore (Rotondo and Bentley, 2002).
The rapid deposition time of these beds is reflected in a lack of bioturbation features in
the lower part of each deposit, with burrows and root growth appearing only in the upper
portion of each event bed (Coleman, 1966; Kemp, 1986). Instantaneous deposition rates
148
(with deposition assumed to occur between 1 and 30 seconds) on this mudflat have been
estimated to range between 2 and 50 kg/mVs (Kemp, 1986), the upper Mmit of which is
approximately five orders of magnitude higher than the rate of fine-grained sedimentation
on the continental shelf.
By estimating the mass of sediment deposited during one cold front, it is possible
to gauge the importance of front-induced mud deposition relative to sediment transport in
the regional sedimentary system. To make such a calculation, ASPs of the Freshwater
Bayou mudflat in early 1998 were used to estimate the potential area available for mud
deposition.^ The total accreted area seaward of the canal mouths visible in the 1998
photographs, measured using ArcView GIS, is 6.40 kml Of that area, unvegetated land
comprised 2.54 km^.
Field observations (Wells and Kemp, 1981; Kemp, 1986; Huh et al., 1991) have
shown that desiccated mud may consolidate into cobbles that compact from 0.10-0.20 m
when freshly deposited to approximately 0.05-0.15 m thick when dry. Using a thickness
of 0.05-0.15 m for dry sediment with a density of 2650 kg/m^ and assuming a layer of
sediment with uniform thickness and density over the unvegetated area of the mudflat,
the mass of sediment deposited during one cold front event would be 336,600 to
1,009,700 metric tons. Over the course of one year, 20 to 40 cold fronts may pass over
this coast. If 20 cold fronts occur, the total mass deposited on the Freshwater Bayou
mudflat would correspond to 10-29% of the annual fine-grained sediment mass carried
by the Atchafalaya River (-70 x 10* metric tons; Allison et al., 2000a). It is likely that not
every front would leave a deposit of this magnitude over the area considered; if 25%, or 5
out of 20, cold fronts per year left such a deposit, the annual total would be equivalent to
approximately 2-7% of the annual fine-grained Atchafalaya sediment load.
149
These values are presented to show the relative volumetric significance of front-
induced mud deposition to this coastal system in comparison to the sediment load of the
Atchafalaya River. The mudflat is not, however, assumed to be a common initial
deposition site of Atchafalaya sediment; resuspended Atchafalaya sediment from the
inner shelf is believed to account for most of the material deposited during each cold
front. Deposition is seldom permanent; between fronts, mud is known to migrate along
shore primarily in response to westward-flowing currents (e.g.. Wells and Kemp, 1981).
However, the calculations above illustrate the quantitative importance of onshore
deposition due to cold fronts in this coastal system, implicating such energetic events as
significant factors affecting coastal geomorphology.
3.4.2.4. Morphologic Response to Cold Front Passage
Analysis of mudflat extent and meteorological conditions Intervals 1 and 3
discussed above (Sections 3.3.3.1 through 3.3.3.3) indicates a link between the extent of
mudflat accretion on the eastern chenier plain and the occurrence of winter cold fronts.
As shown in Figure 3-10, observations of Intervals 1 and 3 suggest that mudflat accretion
is linked to both Atchafalaya sediment flux and cold front activity. Both intervals were
preceded by very low FOR activity and very low sediment flux. Each interval covered a
time of increasing FOR activity and increasing sediment flux. The first survey of Interval
1, on 10/22/87, followed a typical summer with very little storm activity and showed no
discernible mudflats along the eastern or central chenier plain. Three months later, after
the cold front season had begun and fluvial sediment flux had shown a small peak, the
1/22/87 survey revealed substantial accretion over that interval. The widespread mudflat
150
accretion observed during Interval 3, notably, followed a month of substantially above-
average cold front activity and high fluvial sediment output.
Discerning the relative importance of cold fronts and Atchafalaya sediment flux
to coastal geomorphic development is complicated by the coincidental increase in cold
front activity and fluvial sediment flux during late winter and early spring (Mossa and
Roberts, 1990). In many aerial surveys the individual effects of these two factors were
not distinguishable but presumably worked together to promote accretion. Conditions
during Interval 2, during which sediment flux remained fairly constant while storm
activity (in the form of GTD events) was high, may help clarify the relative roles of
fluvial discharge and storms. This interval, which spanned the summer of 1989, saw
substantial accretion following powerful storms (Tropical Storm Allison and Hurricane
Chantal) that were not accompanied by an increase in Atchafalaya sediment flux.
Conversely, observations made from video footage shot in July 1984 imply that even a
large and sustained pulse of fluvial sediment alone cannot guarantee subsequent mudflat
accretion on the chenier plain. Although Atchafalaya sediment flux had been unusually
high (over 4x10^ tons/day) for approximately six months before the 7/9/84 survey, that
survey found no significant mudflats on the chenier plain (LGS, 1984). The 7/9/84
survey, made after several months of virtually no FOR activity or GTD events, showed
nearly the lowest incidence of accretion of any survey studied, despite the recent high
input of sediment. This implies that for accretion to occur on the chenier plain, high-
energy conditions are necessary to resuspend and transport sediment toward shore.^
To quantify the relationship between cold front activity and mudflat growth, two
representative variables were correlated. The length of shoreline fronted by mudflat
between Chenier au Tigre and Big Constance Lake was compared with the number of
151
FOR days in the previous 30 days before each set of ASPs between 1987 and 2001.
Mudflat length was used rather than area because mudflat area on this low-gradient
coastal plain is subject to substantial variability with tidal level. Video footage that
immediately followed GTD events were eliminated from this exercise, because the
oblique camera angle used during VSs made it difficult to measure mudflat lengths
precisely and because the meteorological effects of GTD events on the coast vary widely
depending on the relative location of the hurricane's landfall zone and the coastal area of
interest. The resulting correlation between mudflat length and FOR occurrence is shown
in Figure 3-14. The correlation coefficient, R, was determined to be 0.49, and the sample
size, n, was 20 surveys. Assuming bivariate normal distributions for each variable, the
probability that they are independent (that the null hypothesis is true) is <0.025, a
statistically significant correlation (e.g.. Table A-2 of Larsen and Marx, 1986;
"significance" defined as having a probability <0.05 that the null hypothesis of variable
independence is true). For the same sample size, mudflat length and FOR days in the past
60 days before each survey (Figure 3-14b) produced a weaker but still significant
correlation (R = 0.39; probability of variable independence <0.05). Mudflat length
plotted against the maximum recorded sediment flux from the Atchafalaya River in the
eight weeks prior to each survey did not yield a statistically significant correlation.
The correlation plot in Figure 3-14a shows a majority of surveys (14 out of 20) in
which mudflat length was -15 km. In all surveys where this was the case, mudflats were
observed immediately west of Freshwater Bayou, usually forming one continuous strip of
active accretion. Data may therefore be better considered as two populations rather than
as 20 surveys with a common trend; this is illustrated in Figure 3-15. One population, the
three data points designated as Population I in Figure 3-15, represents conditions when no
152
cold front activity has been present, and low occurrence of mudflats accompanies a lack
of cold front activity. Of the remaining 17 ASP sets, 14 form a second population
outlined in the center of the plot on Figure 3-15, Population II. These indicate that when
there has been cold front activity, mudflats on the chenier plain form with a tendency to
occupy a total length of approximately 15 km. The boundary around Population II is
drawn to exclude three outliers. Of the 17 sets of ASPs that follow non-zero cold front
activity, the mean mudflat length is 15.6 km, median is 15.0 km, and the standard
deviation is 6.8 km. The data suggest that increasing cold front activity does not produce
a consistent corresponding increase in mudflat length, but instead that cold front activity
fuels the formation of -15 km of mudflat on the eastern chenier plain. It is hypothesized
that, once formed, this mudflat responds to additional cold front activity by increasing in
volume (aggrading vertically and prograding seaward) without acquiring additional
length. The most informative comparison would be obtained using estimates of mudflat
volume from each survey date rather than length; however, no measurements of mudflat
thickness were made at the time the ASP or VS sets were taken.
The relative roles of river discharge and storm events in causing coastal accretion,
as inferred from these aerial surveys, contrast with assumptions made by earlier
researchers regarding the necessity of ongoing high fluvial sediment discharge for
mudflat growth to occur (Kemp, 1986; Mossa and Roberts, 1990). Although most
accretion apparently occurs in late winter and early spring when cold front activity and
fluvial sediment flux are both high (Kemp, 1986), this study shows that summer storm
events (GTDs) may induce substantial accretion while Atchafalaya discharge is low.
Notably, the video footage from July 1984 implies that even sustained high sediment
discharge from the Atchafalaya River is not alone sufficient to promote accretion in the
153
absence of high-energy events. The power of hurricanes and tropical storms to promote
accretion during times of year when Atchafalaya sediment flux is at a minimum implies
that the source of sediment deposited onshore during those summertime events, just as in
winter cold fronts, is predominantly from the sea bed (resuspension of inner shelf mud)
rather than sediment directly incorporated from the Atchafalaya discharge.
3.4.2.5. Hydrodynamics Contributing to Localized Accretion
Localization of mudflat progradation on the eastern chenier plain implies that
hydrodynamic conditions favor sediment deposition in that region relative to the central
and northeastern chenier plain. Bathymetry is proposed to provide some protection to the
eastern chenier plain coast during high wave energy, and to encourage deposition of
sediment carried by the westward coastal current.
A submerged relict delta lobe forms the 30-km wide Trinity Shoal southeast of
the chenier plain (Figure 3-la). Waves associated with major hurricanes can interact with
the sea floor down to depths of more than 200 m on the northern Gulf of Mexico shelf
(e.g., Morton, 1988; Stone et al., 1995). Wave field studies have shown that during
hurricanes, bathymetry of the inner shelf in the Mississippi Delta region influences the
wave energy reaching shore by controlling wave refraction and focusing energy on
underwater headlands (Stone et al., 1995). Wave energy is similarly focused on the
shallow headland of Trinity Shoal, providing some protection to the eastern chenier plain
during high wave activity.
Flow expansion is expected to occur as the dominant westward currents pass over
the western margin of Trinity Shoal into deeper water (Figure 3-la). The resulting
decrease in current energy is expected to promote deposition of suspended sediment in
154
deeper water immediately west of Trinity Shoal. This inferred local depocenter is
consistent with near-bottom suspended-sediment concentration data collected by Kineke
(2001a) and with locally high accumulation rates on the inner shelf discussed in Chapter
4. The presence of abundant unconsolidated sediment on the inner shelf just west of
Trinity Shoal is proposed to aid conditions favorable to deposition on the eastern chenier
plain, landward of this area (e.g., Morgan et al., 1953).
Westward currents are also affected by the presence of oyster reefs within 15 km
of the southern coast of Marsh Island (Saucier, 1994, p. 158). These reef shoals, some of
which are exposed high enough above water to support vegetation, decrease current
strength over Trinity Shoal and are believed to deflect westward currents to the south
(Morgan et al., 1953; Van Lopik, 1956; Adams et al., 1978; Huh et al, 1991; Saucier,
1994). As a result, sediment-laden water flowing west from the Atchafalaya outlet tends
to meet the chenier plain coast at approximately the latitude of the eastern chenier plain.
This southward deflection of westward sediment-laden currents may result in a higher
supply of fine-grained sediment available to the eastern chenier plain coast relative to the
northeastern chenier plain. In times of anomalously high sediment supply, that
northeastern shoreline does experience transient mudflat growth. Such was the case in the
2/15/91 survey of Interval 3, during the major floods of the 1970s, and in earlier decades
when fluvial sediment load was higher (Morgan et al., 1953; Wells and Roberts, 1981;
Kemp, 1986). Tidal currents leaving Vermilion Bay through a 25-m deep channel at
Southwest Pass (Figure 3-la) may prohibit deposition of fine-grained sediment, further
inhibiting mudflat growth there (N. D. Walker, pers. comm.; J. Malbrough, pers. comm.).
Wave energy that reaches the eastern chenier plain is affected by attenuation over
a muddy sea bed, a positive feedback mechanism that further enhances the potential for
155
deposition. It has been shown (e.g., Wells, 1983; Kemp, 1986; Higgins, 2002) that an
unconsolidated mud sea bed near shore effectively dampens incident wave energy on the
eastern chenier plain. Notably, a comparison between wave regimes over mud- and sand-
rich sea beds on the Louisiana coast has indicated that the muddy sea floor much more
effectively dissipates wave energy (Sheremet and Stone, 2001). Wave attenuation is a
common feature of shorelines where a mud sea floor is present. Although the
mechanisms by which wave energy is attenuated are not thoroughly understood, several
reasons for this phenomenon have been proposed: viscosity within fluid mud, sea-bed or
boundary-layer friction, and/or dissipation of incoming wave energy into a fluid sea bed
by propagation of a wave within the viscous mud (Wells, 1983; Lee and Mehta, 1997).
Wave attenuation produces low-amplitude wave fronts that approximate solitary wave
crests (e.g.. Wells and Coleman, 1981a, b; Wells, 1983; Kemp, 1986). Solitary waves do
not show the sinusoidal form typical of linear waves, but instead have flat troughs and
isolated, widely-spaced crests that rarely break. This reduced wave energy implies
reduced boundary shear stress over the sea bed, facilitating settling of suspended
sediment carried by incoming waves (Wells and Roberts, 1981; Wells and Coleman,
1981a, b). With this subsequent settling of new sediment, wave attenuation promotes
further "trapping" of mud brought to the eastern chenier plain by westward currents. The
high quantity of sediment in this area is then available to be transported onshore to form
mudflats during pre-frontal southerly winds (as shown in Figure 3-13).
The central chenier plain has, in all prior long-term surveys, been dominated by
erosion (Morgan and Larimore, 1957; Adams et al., 1978; Wells and Kemp, 1981).
Although intermittent accretion of narrow (generally <10 m wide), ephemeral mudflats
has been observed to occur there as sediment from eastern chenier plain mudflats
156
migrates west by longshore transport, the coasthne west of Dewitt Canal shows annual
and decadal-scale erosion of the exhumed peat terrace and shoreward transgression of the
associated carbonate sand deposits (Figure 3-4).
There are several explanations for the rarity of mudflat progradation on the central
chenier plain. First, deposition of mud near Freshwater Bayou for the reasons discussed
above may simply reduce the amount of sediment available for transport to the central
chenier plain by longshore drift. Second, offshore bathymetry on the central chenier plain
is steep relative to that of the eastern chenier plain, where Trinity Shoal offers some
protection from wave attack. The steeper shelf off the central chenier plain (Figure 3-la)
exposes that part of the coast to higher wave energy, promoting erosion there during cold
fronts and GTD events, and hindering stabilization of the transient mudflats that do form
(e.g., Morgan et al., 1958).
Importantly, the distribution of unconsolidated fine-grained sediment on the inner
shelf opposite the chenier plain likely plays a major role in determining where coastal
mudflats may develop. The poorly consolidated muddy sea bed offshore of the eastern
chenier plain provides sediment available for resuspension, shoreward transport, and
deposition on prograding mudflats, while the sea floor shows greater consolidation
opposite the eroding central chenier plain. This topic will be explored in further detail in
Chapter 4. A final contributing factor to the lack of mudflats on the central chenier plain
relates to the variable strength and direction of longshore currents. Although most studies
have shown dominant flow to the west (Adams et al., 1982; Cochrane and Kelley, 1986),
currents near shore may stagnate or even reverse direction and flow east. This has been
documented in particular shortly after the passage of a cold front, as northerly to
northwesterly winds affect inner shelf circulation (Adams et al., 1982). An example is
157
shown in Figure 3-16, in which fresh water leaving Miller Lake, Little Constance Lake,
East Little Constance Bayou, and Rollover Bayou is deflected to the east upon entering
inner shelf waters (LSU, 1998). This phenomenon further reduces the ability of
Atchafalaya River sediment to reach the central and western chenier plain and promote
progradation there.
3.4.3. Hurricane Impact
Hurricanes and tropical storms have a profound geomorphic impact on the Gulf
Coast shoreline. During the 20"' century, nearly 60 tropical storms or hurricanes made
landfall on the Louisiana coast. Hurricanes and tropical storms occur with much lower
frequency than cold front passage, but with greater intensity concentrated over smaller
spatial scales. Frontal passage and tropical depressions dominate different times of the
year; storms that form from tropical depressions tend to occur in summer and fall, with
the highest incidence in September (Stone et al., 1997). Local effects of these storms
depend upon the storm track, intensity, and pre-existing coastal environmental
conditions. It has already been shown that storms of this nature can cause mudflat
accretion on the eastern chenier plain, bringing suspended sediment onshore. In other
areas, notably the barrier islands of the outer Mississippi Delta plain, severe erosion and
landward retreat of coastal sand accompany hurricanes (e.g., McGowan et al., 1970;
Nummedal et al., 1980; Dingier and Reiss, 1995). Because sediment supply to outer
barrier islands is low, those areas experience only partial recovery following major
hurricanes; erosion that occurs during hurricanes and tropical storms is responsible for up
to 90% of Louisiana's shoreline retreat measured in historic time (Stone et al., 1997).
158
Sediment eroded from shorelines during hurricanes is often deposited on backshore
marshes, which can cause vertical aggradation of tens of centimeters during a single
storm that, even after later compaction, partially offsets long-term land loss of coastal
marshes (Rejmanek et al., 1988; Cahoon et al., 1995; Guntenspergen et al., 1995).
Accretion and seaward progradation of mudflats during hurricanes, as opposed to
the vertical aggradation of backshore marshes by storm overwash, occurs on the eastern
chenier plain but has been described nowhere else on the Louisiana coast. Although the
cumulative effect of the more frequent cold fronts is believed to play the greater role in
shaping coastal morphology over time, the intense impact of hurricanes on this coast is
clear. This section will discuss the documented impact of hurricanes and tropical storms
on the chenier plain coast, with emphasis on the variable effects of such storms
depending on the position of hurricane landfall relative to the chenier plain. Figure 3-17
shows the tracks of five hurricanes discussed in detail in this section. The Saffir-Simpson
scale, used to categorize hurricane intensity, is described in Appendix 3-C.
3.4.3.1. Historical Incidence of Hurricanes on the Chenier Plain
Few early records exist of hurricanes on the chenier plain, due to the geographic
isolation and low population density of this coast. The first major storm documented
there during historical times was a "southeast hurricane" of September 1766, which
resulted in the loss of a vessel named the Constante. The 1785 log book of a captain in
the Spanish Royal Armada refers to this shipwreck opposite the area on the central
chenier plain where several lakes and bayous now bear the name Constance (Hackett,
1931). Notable hurricanes of the nineteenth century included the "Racer's Storm" of
October 1837, which made landfall on the western chenier plain and caused widespread
159
flooding (Redfield, 1846), an unnamed hurricane of 1842 that reached land over eastern
Texas (Redfield, 1846), and the famous "Last Island Disaster" of 1856 that passed over
Marsh Island, inundating the coast for -50 km inland and destroying every house in the
town of Abbeville (e.g., Morgan et al., 1958; Figure 3-17). One hurricane in 1865 and
two in 1886 produced major flooding, notably that of October 8-13, 1886, which brought
seawater 20 miles inland near the Texas-Louisiana border (Tannehill et al., 1938).
Weather records have been kept consistently since the late 1800s by the National
Weather Service (formerly called the Weather Bureau, from 1891 to 1970). In that time
Louisiana has experienced tropical storms (with winds greater than 17.2 m/s) at an
average spacing of 1.6 years. Hurricanes (with winds over 33.3 m/s) occur every 4.1
years on average (Penland and Suter, 1989). Between 1897 and 1940, seven hurricanes
are known to have inflicted flooding damage on the chenier plain. The years between
1931 and 1960 brought unusually high hurricane activity to the Gulf Coast in general;
over half of the 60 twentieth-century hurricanes and tropical storms to make landfall in
Louisiana occurred during those three decades (Stone et al., 1997).
By far the biggest storm impact on the chenier plain during the 20"' century came
from Hurricane Audrey, a fast-moving hurricane that made landfall near the Texas-
Louisiana border on June 27, 1957. Estimated winds placed this hurricane in Category 4
of the Saffir-Simpson hurricane intensity scale (Appendix 3-C); this is the only Category
4 hurricane to have made landfall in the United States in the month of June. Hurricane
Audrey remains the sixth deadliest storm in US history, having caused approximately 500
deaths, of which all but 10 occurred in coastal Louisiana despite widespread evacuation.
Storm surge of over 4 m caused devastating flood damage more than 45 km inland.
160
inundating land all along the chenier plain and causing severe flooding as far east as the
central Mississippi Delta plain (Morgan et al., 1958).
In August 1969, Hurricane Camille became the first (and, at present, the only)
Category 5 hurricane to make landfall in the United States. The chenier plain coast, to the
west of the storm's path, was spared the intense damage experienced by eastern
Louisiana (northeastern Mississippi Delta plain) and coastal Mississippi, where
unprecedented devastation was recorded (DeAngelis and Nelson, 1969; Glaczier, 1998;
NHC, 2002). Less intense Category 1 Hurricanes Danny and Juan in 1985 passed to the
west of the chenier plain (Figure 3-17) and caused flooding and mud deposition (LGS,
1985a, b) - Juan remains the 8"' costliest storm in US history with $1.5 billion in damage
and 63 deaths (NHC, 2002). The chenier plain coast escaped major devastation during
Hurricane Andrew in 1992, as the path of this Category 4 hurricane led due north up the
mouth of the Atchafalaya River (NHC, 2002).
3.4.3.2. Impact of Hurricanes and Tropical Storms on Coastal Areas
The damage inflicted on coastal areas by storms associated with tropical
depressions depends greatly on the relative position of a given area to the storm center.
Whether the eye of the storm makes landfall to the east or west will determine the wind
stress regime experienced by the coast, which in turn affects salinity, sea level, and
suspended-sediment concentration in shallow coastal areas (e.g.. Walker, 2001). Because
northern hemisphere tropical depressions induce counterclockwise circulation around the
storm center, hurricanes that move northward across the Gulf of Mexico to intersect the
shoreline bring the highest winds and storm tides on the east side of the hurricane. The
west side of the storm center experiences heavy rain but decreased wind intensity relative
161
to the east side, as northward movement of the storm reduces wind speed there. While
rain-induced flooding affects areas on both sides of the storm center, the east side of the
storm suffers the most flood damage from seawater inundation as storm winds drive
water onshore and raise tidal levels well above the normal 0.5 m range. Strong Gulf
Coast hurricanes may raise sea level by 2-7 m, in contrast to the 0.30-1.22 m observed
during cold fronts (Boyd and Penland, 1981; Penland and Suter, 1989; Bao and Healy,
2002). Such drastic elevation of sea level is typically the most damaging consequence of
hurricanes in low-lying coastal Louisiana.
3.4.3.2.1. Storm Centers West of the Chenier Plain
Of the hurricanes and tropical storms that develop in tropical Atlantic latitudes,
many never enter the Gulf of Mexico but migrate instead up the eastern Atlantic coast
before making landfall or dissipating over the ocean. Most of the hurricanes that enter the
Gulf make landfall to the east of the chenier plain. In all reported cases of damage to the
area around the chenier plain, the storms in question passed to the west of where damage
was concentrated. This accounts for the significant impact of relatively small storms such
as 1985 Hurricanes Danny and Juan (both Category 1; e.g., Rejmanek et al., 1988;
Penland et al., 1989), or of 1989 and 2001 Tropical Storms Allison on the chenier plain
coast - this area experienced high winds and seawater inundation due to passage of those
storm centers to the west of the area in question. In such cases where the storm center
made landfall to the west of the chenier plain, strong southerly winds caused water level
set-up and sediment resuspension that effected onshore mud deposition in a similar
manner to that which precedes winter cold fronts, but with greater intensity.
162
Hurricanes that make landfall to the west of the chenier plain tend to inflict severe
erosional damage on the marsh-and-shell shoreline of the western, central, and
northeastern chenier plain while causing accretion on the eastern chenier plain, where
mudflats are common. The best-studied example of such a storm is Hurricane Audrey,
the highly destructive Category 4 hurricane of 1957 (storm track shown in Figure 3-17).
After Hurricane Audrey, areas fronted by peat terrace (e.g., central chenier plain) did not
show an immediate change in shoreline position. The well-consolidated and organically
stabilized peat terrace proved resistant to short-term erosive effects of the hurricane,
although scouring of the marsh as flood waters drained seaward did incise the marsh
terrace deeply. The more mobile carbonate beach sand that overlies the marsh terrace was
moved up to 200 m landward of its pre-hurricane position (Morgan et al., 1958). Over the
next three years after Hurricane Audrey, the edge of the peat terrace migrated landward
and gradually returned to an equilibrium position immediately seaward of the carbonate
beach berm (Morgan et al., 1958; Adams et al., 1978). This situation of "delayed erosion"
of the marsh coastline contrasts with the immediate response of sandy beaches to storms
(e.g., Wright and Short, 1984).
Even during such a powerful hurricane, the mudflat coastline on the eastern
chenier plain remained stable after Hurricane Audrey had passed. The exact lateral limit
of mudflats at that time is not known, but their presence is mentioned in the vicinity of
Freshwater Bayou immediately after Hurricane Audrey (Morgan et al., 1958). No
changes in shoreline position were apparent there in aerial photographs taken shortly after
the hurricane (Morgan et al., 1958). That mud-fronted section of the coast was the only
part of the chenier plain that, in the long term, experienced no retreat attributable to
Hurricane Audrey (Adams et al., 1978).
163
One additional, and probably very rare, effect of Hurricane Audrey was observed.
In two locations on the east-central chenier plain, near the present-day locations of the
Exxon canals and Dewitt Canal, two discrete bodies of consolidated mud were deposited
on shore that had apparently been torn from the continental shelf. These so-called mud
arcs (Morgan et al., 1958) were arcuate, consolidated masses of mud composed of better-
sorted, finer-grained material than mud sampled from the Freshwater Bayou mudflat. The
western mud arc, deposited 107 km east of the storm center, had its western end at
92.65°W. Oriented approximately parallel to shore, this deposit measured 320 m wide
and 60 cm thick on average, and was laterally continuous for 3.76 km to the east. The
eastern mud arc began at 92.36°W and extended for 3.46 km to the east (Morgan et al.,
1958). This deposit had an average width of 305 m; its thickness was not measured.
Neither mud arc can be identified in modem aerial photographs; gradual desiccation and
colonization by marsh grasses may have incorporated this sediment permanently into the
shoreline. Deposition of consolidated mud from offshore in discrete units such as these is
not believed to be a common occurrence, and has not been documented after any storm
since Hurricane Audrey.
3.4.3.2.2. Storm Centers East of the Chenier Plain
In stark contrast to the damage inflicted by hurricanes that reach land to the west
of the chenier plain, hurricanes and tropical storms that pass to the east have historically
shown little impact on that area. Two prominent examples are Hurricane Camille (1969)
and Hurricane Andrew (1992). Although Camille made history as the only Category 5
hurricane to make landfall in the US, and caused devastation in Mississippi east of the
storm's path (e.g., Wright et al., 1970; Glaczier, 1998), there is no record of significant
164
damage to southwestern Louisiana. Although that area experienced rain and wind from
the west side of the storm, seawater inundation and wind damage were negUgible.
The impact of Hurricane Andrew, the costhest natural disaster in US history, was
likewise minimal on the chenier plain. After inflicting $26 billion in damage in Florida,
Andrew veered almost due west across the Gulf for several days in August 1992 before
turning north and moving directly up the Atchafalaya River. As the storm approached
Louisiana, significant wave heights of over 13 m were observed in deep water; upon
landfall in Louisiana, Andrew brought a maximum storm surge of 1.71 m (Stone et al.,
1995; 1997). Catastrophic overwash and erosion occurred along the outer Mississippi
Delta plain during Hurricane Andrew (Stone and Finkl, 1995). Sediment loss from barrier
islands in some areas exceeded 90 m^ per meter of shoreline (Dingier and Reiss, 1995).
Along the Isles Demieres, barrier islands located -70 km southeast of the Atchafalaya
River outlet, all sand was stripped away by Hurricane Andrew, leaving an exposed relict
marsh platform (Stone and Finkl, 1995). Even in such close proximity to this hurricane,
the chenier plain received no discernible damage, as documented by the Louisiana
Geological Survey overflight on August 29, 1992. Having flown east from the Texas
border for many miles seeing no remarkable evidence of Andrew, the survey party
commented upon reaching Tigre Point that it would be worthwhile to "speed this up and
save tape for the impacted areas" (LGS, 1992).
Field studies conducted from the RN Longhom in October 2002 in the week after
Category 2 Hurricane Lili made landfall near Marsh Island indicated similar patterns of
coastal impact to that which followed Hurricanes Andrew and Camille. Damage to
vegetation on the chenier plain coast after Hurricane Lili was limited to an isolated area
at Chenier au Tigre, approximately 6 km west of where the storm center passed. There,
165
the pattern of trees fallen to the northwest suggested that the damage was inflicted by
easterly winds at the northern edge of Hurricane Lili as the storm moved north (Figure 3-
18). No other evidence of coastal storm damage was observed on the chenier plain
shoreline at that time. Because the storm had passed to the east of the chenier plain, no
mudflat deposition due to Hurricane Lili was expected to have occurred near Freshwater
Bayou, where winds would have blown offshore from the north; as expected, no recent
mud deposition was evident there (Appendix 3-B, part;cxa).
3.4.3.3. Hurricane-Induced Mud Deposition
The video surveys and ASPs discussed above indicate major differences between
the response of mud- and sand-dominated coasts to storm activity. While storms of
hurricane and tropical storm intensity are generally considered erosional agents on sandy
beaches, this study shows that such events can result in mud deposition on the mud-rich
eastern chenier plain. Within this coast, erosional features and landward retreat of marsh
shoreline were documented on the central and western chenier plain after hurricanes
(Morgan et al., 1958; Adams et al., 1978; LGS, 1985a; Penland et al., 1989), areas
typically dominated by erosional morphology in the aerial surveys studied. In contrast, on
the eastern chenier plain, an area commonly prone to natural accretion and high fine-
grained sediment supply, accretion has been documented following hurricanes and
tropical storms (Morgan et al., 1958; LGS, 1985a, b, 2001; Penland et al., 1989).
Washover deposition of sediment on coastal marshes is a well-known result of
elevated sea level during major storms (e.g., Donnelly et al., 2001; Bao and Healy, 2002).
However, that occurs on most shorelines at the expense of the shoreface - sand is eroded
from barrier island beaches and sandy coasts and redistributed across the backshore
166
marsh surface due to elevated water level and wave action, resulting in vertical marsh
aggradation and pronounced landward retreat of the shoreline (e.g., Dingier and Reiss,
1995). What distinguishes the eastern chenier plain from other areas is the deposition of
washover mud without simultaneous shoreline retreat. As noted above, the combined area
of mud washover fans deposited on backshore marsh in this region after Hurricanes
Danny and Juan in 1985 well exceeded 200,000 ml This figure does not account for
additional deposition of an unknown quantity of mud at the shoreline that contributed to
seaward progradation of the mudflat. Qualitative observations from field studies and
helicopter-based surveys following hurricanes indicate that mudflats on the eastern
chenier plain do prograde, and that the mud-rich eastern chenier plain may be the only
region to escape long-term erosion following major hurricanes (Morgan et al., 1958;
Adams et al., 1978). Although an increasing number of studies have described the effects
of hurricanes and tropical storms on mud-rich shorelines, the potential for these storms to
have a net aggradational and progradational effect has received very little attention in the
literature to date. This study shows, however, that storm-induced accretion can affect
sediment transport and geomorphic evolution of mud-dominated coasts.
Huh et al. (1991) concluded that hurricanes and cold fronts produce essentially
the same effect upon the coast in terms of their ability to deposit mud in some areas (e.g.,
eastern chenier plain) while exacerbating erosion in areas already experiencing erosion
(e.g., western and central chenier plain, barrier islands, and sediment-starved areas of the
Mississippi Delta). This assertion appears accurate. Although mud washover deposits
resulting from hurricanes may be larger than those observed after cold front events due to
higher storm surge associated with hurricanes, the cumulative effect of the more frequent
front passages combined with their larger spatial coverage likely exceeds that of the
167
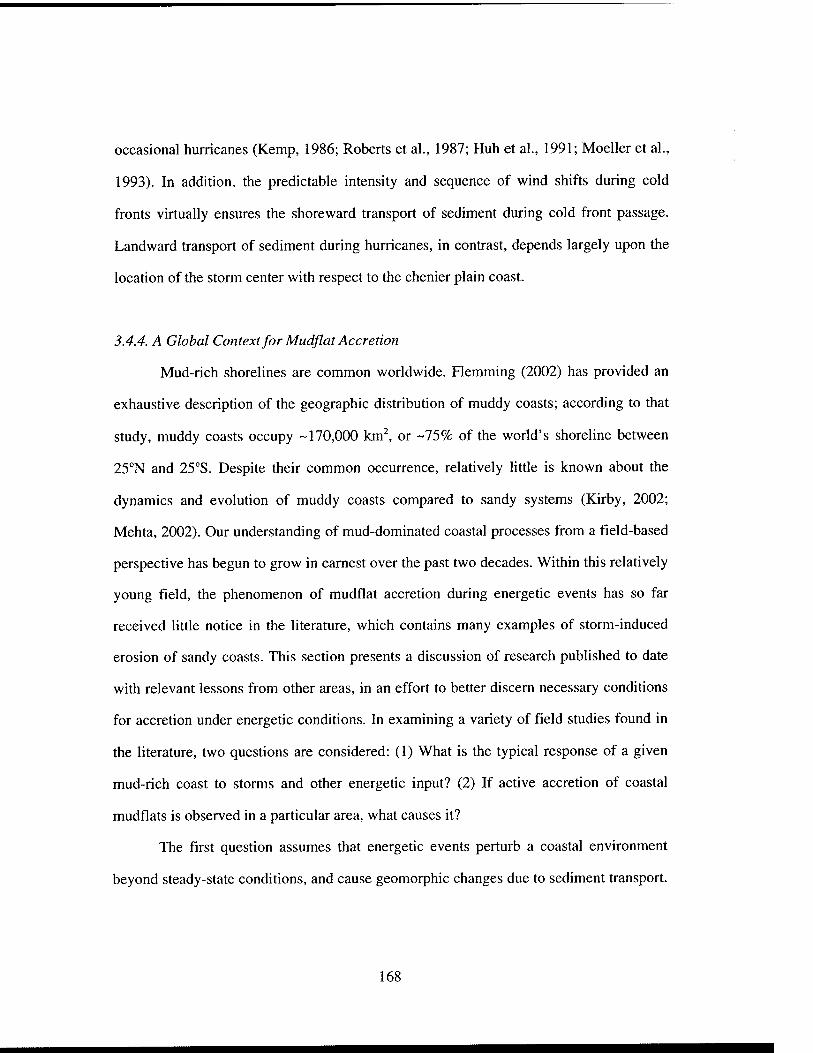
occasional hurricanes (Kemp, 1986; Roberts et al., 1987; Huh et al., 1991; Moeller et al.,
1993). In addition, the predictable intensity and sequence of wind shifts during cold
fronts virtually ensures the shoreward transport of sediment during cold front passage.
Landward transport of sediment during hurricanes, in contrast, depends largely upon the
location of the storm center with respect to the chenier plain coast.
3.4.4. A Global Context for Mudflat Accretion
Mud-rich shorelines are common worldwide. Flemming (2002) has provided an
exhaustive description of the geographic distribution of muddy coasts; according to that
study, muddy coasts occupy -170,000 km^ or -75% of the worid's shoreline between
25°N and 25''S. Despite their common occurrence, relatively little is known about the
dynamics and evolution of muddy coasts compared to sandy systems (Kirby, 2002;
Mehta, 2002). Our understanding of mud-dominated coastal processes from a field-based
perspective has begun to grow in earnest over the past two decades. Within this relatively
young field, the phenomenon of mudflat accretion during energetic events has so far
received little notice in the literature, which contains many examples of storm-induced
erosion of sandy coasts. This section presents a discussion of research published to date
with relevant lessons from other areas, in an effort to better discern necessary conditions
for accretion under energetic conditions. In examining a variety of field studies found in
the literature, two questions are considered: (1) What is the typical response of a given
mud-rich coast to storms and other energetic input? (2) If active accretion of coastal
mudflats is observed in a particular area, what causes it?
The first question assumes that energetic events perturb a coastal environment
beyond steady-state conditions, and cause geomorphic changes due to sediment transport.
168
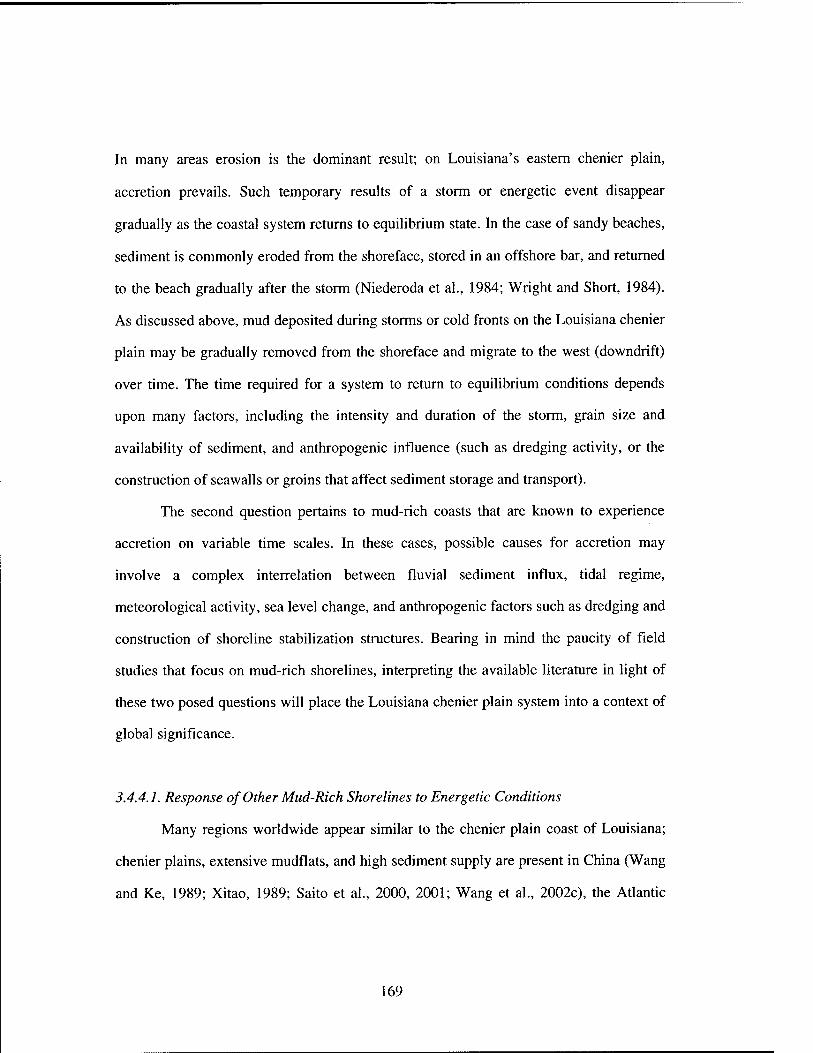
In many areas erosion is the dominant result; on Louisiana's eastern chenier plain,
accretion prevails. Such temporary results of a storm or energetic event disappear
gradually as the coastal system returns to equilibrium state. In the case of sandy beaches,
sediment is commonly eroded from the shoreface, stored in an offshore bar, and returned
to the beach gradually after the storm (Niederoda et al., 1984; Wright and Short, 1984).
As discussed above, mud deposited during storms or cold fronts on the Louisiana chenier
plain may be gradually removed from the shoreface and migrate to the west (downdrift)
over time. The time required for a system to return to equilibrium conditions depends
upon many factors, including the intensity and duration of the storm, grain size and
availability of sediment, and anthropogenic influence (such as dredging activity, or the
construction of seawalls or groins that affect sediment storage and transport).
The second question pertains to mud-rich coasts that are known to experience
accretion on variable time scales. In these cases, possible causes for accretion may
involve a complex interrelation between fluvial sediment influx, tidal regime,
meteorological activity, sea level change, and anthropogenic factors such as dredging and
construction of shoreline stabilization structures. Bearing in mind the paucity of field
studies that focus on mud-rich shorelines, interpreting the available literature in light of
these two posed questions will place the Louisiana chenier plain system into a context of
global significance.
3.4.4.1. Response of Other Mud-Rich Shorelines to Energetic Conditions
Many regions worldwide appear similar to the chenier plain coast of Louisiana;
chenier plains, extensive mudflats, and high sediment supply are present in China (Wang
and Ke, 1989; Xitao, 1989; Saito et al., 2000, 2001; Wang et al., 2002c), the Atlantic
169
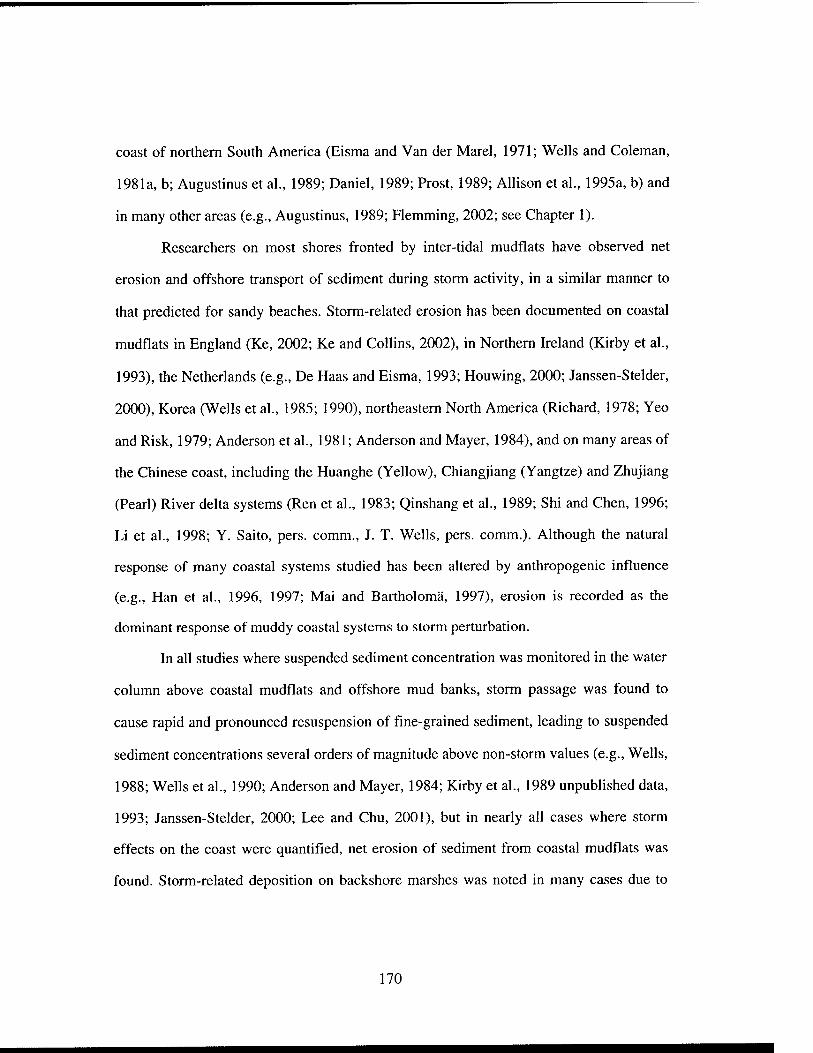
coast of northern South America (Eisma and Van der Marel, 1971; Wells and Coleman,
1981a, b; Augustinus et al., 1989; Daniel, 1989; Prost, 1989; Allison et al., 1995a, b) and
in many other areas (e.g., Augustinus, 1989; Flemming, 2002; see Chapter 1).
Researchers on most shores fronted by inter-tidal mudflats have observed net
erosion and offshore transport of sediment during storm activity, in a similar manner to
that predicted for sandy beaches. Storm-related erosion has been documented on coastal
mudflats in England (Ke, 2002; Ke and Collins, 2002), in Northern Ireland (Kirby et al.,
1993), the Netherlands (e.g., De Haas and Eisma, 1993; Houwing, 2000; Janssen-Stelder,
2000), Korea (Wells et al., 1985; 1990), northeastern North America (Richard, 1978; Yeo
and Risk, 1979; Anderson et al., 1981; Anderson and Mayer, 1984), and on many areas of
the Chinese coast, including the Huanghe (Yellow), Chiangjiang (Yangtze) and Zhujiang
(Pearl) River delta systems (Ren et al., 1983; Qinshang et al., 1989; Shi and Chen, 1996;
Li et al., 1998; Y. Saito, pers. comm., J. T. Wells, pers. comm.). Although the natural
response of many coastal systems studied has been altered by anthropogenic influence
(e.g., Han et al., 1996, 1997; Mai and Bartholoma, 1997), erosion is recorded as the
dominant response of muddy coastal systems to storm perturbation.
In all studies where suspended sediment concentration was monitored in the water
column above coastal mudflats and offshore mud banks, storm passage was found to
cause rapid and pronounced resuspension of fine-grained sediment, leading to suspended
sediment concentrations several orders of magnitude above non-storm values (e.g.. Wells,
1988; Wells et al., 1990; Anderson and Mayer, 1984; Kirby et al., 1989 unpublished data,
1993; Janssen-Stelder, 2000; Lee and Chu, 2001), but in nearly all cases where storm
effects on the coast were quantified, net erosion of sediment from coastal mudflats was
found. Storm-related deposition on backshore marshes was noted in many cases due to
170
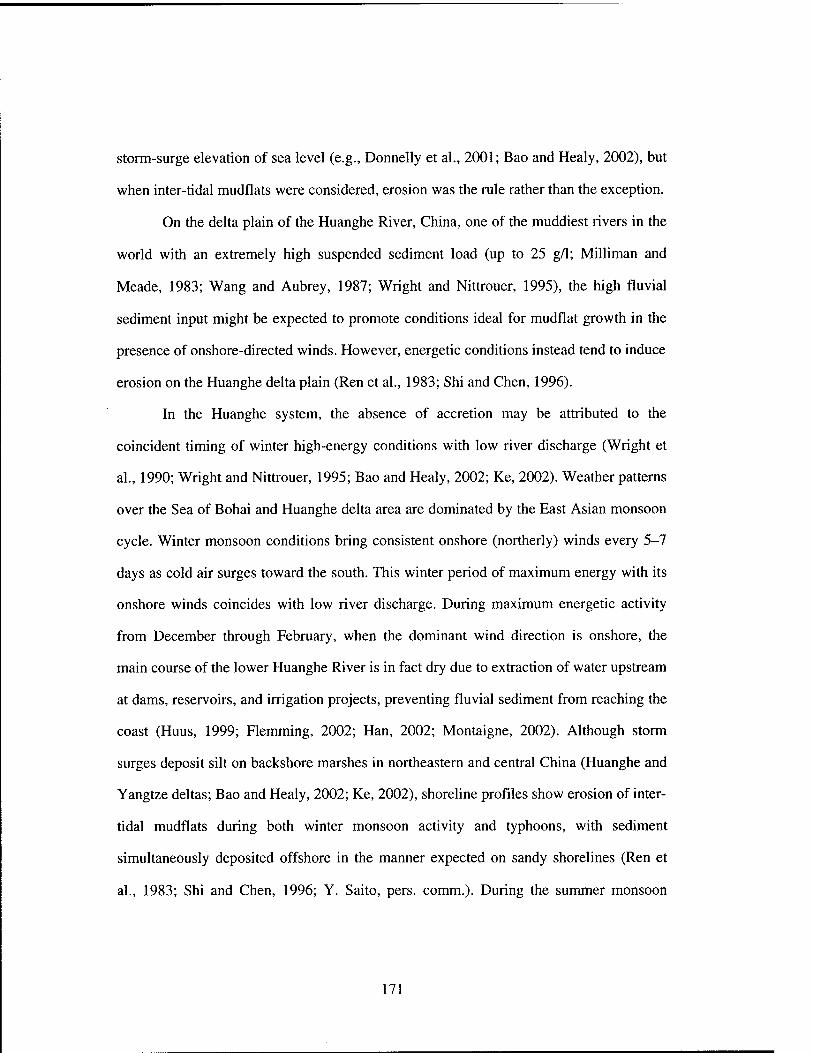
storm-surge elevation of sea level (e.g., Donnelly et al., 2001; Bao and Healy, 2002), but
when inter-tidal mudflats were considered, erosion was the rule rather than the exception.
On the delta plain of the Huanghe River, China, one of the muddiest rivers in the
world with an extremely high suspended sediment load (up to 25 g/1; Milliman and
Meade, 1983; Wang and Aubrey, 1987; Wright and Nittrouer, 1995), the high fluvial
sediment input might be expected to promote conditions ideal for mudflat growth in the
presence of onshore-directed winds. However, energetic conditions instead tend to induce
erosion on the Huanghe delta plain (Ren et al., 1983; Shi and Chen, 1996).
In the Huanghe system, the absence of accretion may be attributed to the
coincident timing of winter high-energy conditions with low river discharge (Wright et
al., 1990; Wright and Nittrouer, 1995; Bao and Healy, 2002; Ke, 2002). Weather patterns
over the Sea of Bohai and Huanghe delta area are dominated by the East Asian monsoon
cycle. Winter monsoon conditions bring consistent onshore (northerly) winds every 5-7
days as cold air surges toward the south. This winter period of maximum energy with its
onshore winds coincides with low river discharge. During maximum energetic activity
from December through February, when the dominant wind direction is onshore, the
main course of the lower Huanghe River is in fact dry due to extraction of water upstream
at dams, reservoirs, and irrigation projects, preventing fluvial sediment from reaching the
coast (Huus, 1999; Flemming, 2002; Han, 2002; Montaigne, 2002). Although storm
surges deposit silt on backshore marshes in northeastern and central China (Huanghe and
Yangtze deltas; Bao and Healy, 2002; Ke, 2002), shoreline profiles show erosion of inter-
tidal mudflats during both winter monsoon activity and typhoons, with sediment
simultaneously deposited offshore in the manner expected on sandy shorelines (Ren et
al., 1983; Shi and Chen, 1996; Y. Saito, pers. comm.). During the summer monsoon
171
season (June through September), high precipitation leads to high fluvial sediment
discharge, but the dominant wind direction is offshore (southerly) during this rainy
season. Due largely to the effect of offshore summer monsoon winds on oceanic
circulation, sediment is widely dispersed around the Sea of Bohai rather than being
confined near shore where it could accrete during onshore winds of the winter monsoon
season.
3.4.4.1.1. Two Analogues for the Louisiana Chenier Plain
One area other than Louisiana where mudflat accretion is known to occur under
energetic conditions is on the southwestern coast of India. India's long coastline contains
areas of abundant mud deposition, in large part fueled by the major Indus and Ganges-
Brahmaputra river systems that drain the Himalayas. Non-vegetated mudflat area alone is
estimated to cover more than 23,000 km^ nationwide (Baba and Nayak, 2002). Notably,
one area far from the outlet of these major rivers appears to provide a close analogy to the
mud deposition that occurs on the Louisiana chenier plain. Extensive mud banks occur in
the coastal state of Kerala (e.g., Nair, 1976; Mallik et al., 1988), at various locations
along a stretch of shoreline approximately 270 km long (Figure 3-19). The source of mud
on the Kerala coast is three local drainage basins of southwestern India that receive heavy
rain during the summer monsoon season, washing soft lateritic soil material into the
Indian Ocean (Mallik et al., 1988). As on the Louisiana coast, mudflat area waxes and
wanes throughout the year, with deposits seldom accreting permanently to the shoreline
but migrating in response to longshore current action. Individual mudbanks remain within
the 10 m isobath, cover distances of up to 8 km along the coast, and can occupy an area
more than 25 km^ (Gopinathan and Qasim, 1974; Mallik et al., 1988). Significant
172
attenuation of wave energy has been recognized in mud-rich areas of the southwest
Indian coast for more than three centuries (Mathew and Baba, 1995).
Mudflat deposition has been most widely documented on the Kerala coast in
association with summer monsoon activity, although storms in other seasons can also
cause episodic deposition of large quantities of mud, similar to the storm-induced
deposition observed on the chenier plain. Maximum growth of mudflats on the Kerala
coast occurs during the wet summer monsoon season, between June and September,
when high precipitation brings abundant fluvial sediment into coastal waters (e.g., Nair,
1976). At that time of year, persistent swells approach the coast from the west-northwest
and west-southwest (dominantly from the southwest), causing resuspension of the
unconsolidated sea bed, generating fluid mud and transporting sediment toward shore
(Mallik et al., 1988). The result is a shoreward-thickening mudbank on the sea bed that
lasts until early fall, when onshore winds weaken and currents flow north, redistributing
coastal mud along shore (Mallik et al., 1988). The coincident timing of onshore winds
and high sediment flux to the coastal ocean during the summer monsoon season thus
facilitates mud bank formation on the Kerala coast. This situation is analogous to the
synchronous timing of high river discharge and cold front activity during the spring on
the Louisiana chenier plain (Mossa and Roberts, 1990).
A second system in which mudflat growth is apparently linked to energetic
conditions is the coast of northeastern South America (Figure 3-20). Although storm
events (passage of frontal systems and tropical depressions) do not occur in this
equatorial setting, high-energy conditions occur due to strong trade winds between
January and March (Nittrouer and DeMaster, 1996). The Amazon River, which
discharges onto this shelf, is the world's largest river in terms of water discharge and one
173
of the three largest in terms of sediment discharge (Milliman and Meade, 1983). Much
Amazon sediment is incorporated into fluid-mud suspensions on the inner shelf (Kineke
and Sternberg, 1995; Kineke et al., 1996). Amazon sediment also affects coastal regions
up to 1000 km north of the river mouth, promoting mudflat progradation and chenier
plain growth in northern Brazil, French Guiana, Surinam, and Guyana (Figure 3-20; e.g..
Delft Hydraulics Laboratory, 1962; Vann, 1969; Eisma, 1971; Wells and Coleman,
1981a, b; Augustinus et al., 1989; Daniel, 1989; Prost, 1989; Eisma et al., 1991; Allison
et al., 1995a, b, 2000b; Allison and Lee, in press). The structure and dynamics of mud
deposits near the Amazon mouth and along the northeastern South American coast were
studied as part of the AmasSeds (A Multidisciplinary Amazon Shelf Sediment Study)
project during the 1990s (e.g., Allison et al., 1995a, b; Nittrouer and DeMaster, 1996).
A major result of AmasSeds was the discovery of near-bed suspensions of fluid
mud that occupy an area between 5,700 and 10,000 km^ on the mid-shelf. Most of the
sediment transport on this shelf occurs within fluid-mud suspensions (Kineke and
Sternberg, 1995). Additional northward transport of suspended Amazon sediment by
coastal currents supplies sediment for inter-tidal mudflat accumulation along the
shoreline beginning -250 km north of the river mouth (Figure 3-20). Locally, mudflat
accretion is concentrated in areas where tidal energy is weakest (tidal range is ~6 m near
the Amazon mouth, ~2 m for most of northeastern South America). Inter-tidal mud banks
in northern Brazil, French Guiana, Surinam, and Guyana consist primarily of Amazon
sediment (Eisma and Van der Marel, 1971). Mud banks can be very large (10 km x 20
km; in contrast, the Freshwater Bayou mudflat is -10 km by <0.7 km) and front most of
the 1600 km-long northeast South American coast while migrating along shore at an
average rate of 1.5 km/year (Wells and Coleman, 1981a, b). Regional shoreline accretion
174
responds to annual fluctuations in Amazon sediment supply, and shows periodicity
associated with tidal cycles and the strength of trade winds (Allison et al. 1995a, b;
2000b; Allison and Lee, in press). Intensification of onshore-directed trade winds occurs
simultaneously with rising fluvial discharge from January through March (e.g., Nittrouer
and DeMaster, 1996). This season of high sediment delivery and strong northeast trade
winds is accompanied by an increase in coastal mudflat accretion (Allison et al., 2000b).
Accretion rates, determined from aerial photography and field investigations, follow a
decadal cycle of trade wind intensity (-30 year period), and are highest when trade winds
are strongest (Vann, 1969; Eisma et al., 1991). When trade winds are weak, mudflats may
experience non-deposition or erosion (Allison et al., 1995a, 2000b). The mudflat
response to trade wind strength on the northeastern coast of South America, though not a
function of episodic storm or cold front events, is analogous to mud deposition in
Louisiana in the sense that mudflat accretion responds to fluctuations in coastal wind
direction and intensity.
3.4.4.1.2. Factors Promoting Accretion Under Energetic Conditions
The three areas where accretion occurs under energetic meteorological conditions
(southwestern Louisiana, southwestern India, and northeastern South America) share
several important traits. Their similarities suggest that certain environmental conditions
must be met for energetic events to cause mudflat accretion. These include: abundant
supply of fine-grained sediment that maintains an unconsolidated sea floor, dominant
onshore wind direction during energetic conditions, and a low tidal range. Table 3-2
shows these and other physical characteristics of these three coasts compared with other
muddy coasts where accretion typically does not occur under energetic conditions.
175
A nearby source of abundant fine-grained sediment, which maintains an
unconsolidated muddy sea bed, is needed to cause substantial attenuation of wave energy.
As discussed earlier, the wave-dampening effect of fluid mud, though still not thoroughly
understood, is the critical property that allows incident wave energy to dissipate near
shore and protects muddy coasts from wave attack. The reduction of wave energy
associated with protection of the coast during storms is assumed to require an
unconsolidated mud sea bed (e.g., Lee and Mehta, 1997). Pronounced wave attenuation
near shore has been documented on the Kerala, Surinam, and Louisiana chenier plain
coasts. A fluvial mud source provides sediment to the inner shelf of the coast where
mudflats form, and allows them to persist by replacing sediment that is lost from a given
location by longshore transport. The sea bed remains mud-rich and unconsolidated due to
a high (though seasonally variable) supply of fluvial fine-grained sediment and physical
reworking. Although mudflat extent in Louisiana was not found to correlate directly with
fluvial sediment discharge, it is thought that the delivery of fluvial sediment plays a
critical role in maintaining an underconsolidated sea bed, from which sediment is easily
resuspended during storms and cold fronts to contribute to mudflat growth. On muddy
coasts where there is no major source of fine-grained sediment, erosion during storms is
common (e.g., in the British Isles, Kirby et al., 1993; Ke and Collins, 2002).
A second factor presumed to be necessary for energetic conditions to induce
accretion is an onshore wind direction during energetic conditions that coincides with
seasonal high sediment delivery. As shown by Kineke et al. (2001) for the Louisiana
coast, shoreward transport of mud occurs on the inner shelf due to winter cold front
passage. In southwestern India, summer monsoon wind patterns are such that winds (and
associated sea swell) approach the coast from the southwest, approximately perpendicular
176
to the northwest-trending shoreline (see Figure 3-19; Mallik et al., 1988). This season of
onshore winds coincides with the timing of high fluvial sediment delivery to the Kerala
coast during the rainy season, analogous to the coincident timing of spring high river
discharge and cold front activity in Louisiana. Likewise, the strongest northeast trade
winds induce resuspension and shoreward sediment transport on the northeastern South
American coast coincident with rising sediment discharge from the Amazon River, which
fuels mudflat growth (see Nittrouer and DeMaster, 1996). Thus the Louisiana, Kerala,
and northeastern South American coasts experience predictable onshore wind patterns
associated with energetic conditions during a season of high fluvial discharge, and
therefore are prone to onshore transport of unconsolidated mud.
Third, a low tidal range likely facilitates accretion of sediment on mudflats. Tidal
range is approximately 0.5 m on the Louisiana and Kerala coasts, and ~2 m on the
Guyana-Surinam-French Guiana coast. Low variation in water level between high and
low tide reduces the influence of tidal currents on sediment transport on these coasts. The
lack of strong tidal currents allows sediment to remain relatively near the source of
fluvial input rather than being dispersed rapidly, increasing the potential for wave
attenuation (J. T. Wells, pers. comm.). The absence of strong tidal currents is believed to
aid accretion by minimizing the means by which mud is often transported and kept in
suspension on coasts with higher tidal ranges (Postma, 1961; Wells et al., 1988, 1990).
Shorelines with abundant fine-grained sediment input but with a high tidal range have not
been observed to experience accretion under energetic conditions. The western coast of
Korea is an appropriate example; although this shore receives abundant muddy sediment,
strong tidal currents associated with its 5-9 m tidal range inhibit settling and
accumulation of sediment. Most sediment that is deposited on mudflats is remobilized
177
during the next tidal cycle, providing little opportunity for long-term accretion (Wells et
al., 1990).
Future investigation may reveal additional examples of mudflat accretion under
energetic conditions. Storm effects on mud deposits of major rivers such as the Ganges-
Brahmaputra have been studied from offshore (e.g., Kuehl et al., 1990, 1997; Allison et
al., 1998; Michels et al., 1998; Goodbred and Kuehl, 1999), but relatively little is known
about the behavior of their extensive coastal mudflats. The timing of high fluvial
sediment flux coincides with dominant shoreward winds during the summer monsoon
season on the Ganges-Brahmaputra delta, as on the Kerala coast of India, creating a
situation potentially conducive to accretion under energetic conditions. The potential for
preservation of accreted mudflats on the Ganges-Brahmaputra delta may be low due to
mesotidal conditions there (2-4 m range), but the high rate of sediment supply and large
mudflat area (Baba and Nayak, 2002) invite further investigation of that area.
Other candidates for additional study include the prograding mud-rich delta
systems of the Mekong and Irrawaddy Rivers, which carry sediment from the Tibetan
Plateau to the coasts of Vietnam and Myanmar (Burma), respectively. The Mekong delta
in particular is located in a mesotidal area on the border between Vietnam and
Kampuchea (Cambodia), and includes extensive mudflats and mangrove swamps
(Flemming, 2002). With an annual sediment discharge of 160 x 10^ tons/year, the
Mekong is one of the largest rivers in Asia (Milliman and Meade, 1983) but litde is
known about the muddy shoreline at its delta. Recent investigations of the Mekong delta
(e.g., Nguyen et al., 2000; Ta et al., 2002; Saito, 2002) indicate that rates of progradation
there are presently decreasing and chenier ridges are developing as waves have become a
stronger influence than during Holocene sea level rise. While the effects of energetic
178
conditions on this coast have not been widely studied to date, it is believed that increased
wave activity due to monsoon winds may be responsible for removal of sediment from
the delta front, causing erosion rather than accretion (Ta et al., 2002). Further
investigation of this major sedimentary system is expected to yield additional insight into
the evolution of mud-dominated coasts.
3.4.4.2. Other Causes of Mudflat Accretion
In mud-dominated systems where storms are not significant agents of coastal
progradation, other means of shoreline accretion can be evaluated. Growth of mudflats
due to high supply of fine-grained sediment at river mouths is common at most deltas
worldwide (e.g., Flemming, 2002), but other factors such as tidal currents, wind strength,
and vegetation also affect the rate and extent of shoreline accretion.
In addition to the trade-wind regulation of mudflat growth discussed above, a
supplemental explanation for 30-year periodicity in mudflat accretion on the South
American coast was given by Wells and Coleman (1981b) based on a study of Guyana
and Surinam mudflats between the Amazon and Orinoco Rivers. According to this
hypothesis, low-frequency tidal components, rather than trade wind strength, control
accretion periodicity. Wells and Coleman (1981b) showed that increased rates of mudflat
accretion coincide with combined lows in 6-month and 18.6-year components of the tidal
cycle. Lower tidal range had caused increased subaerial exposure of mudflat area at the
upper limit of the tidal range (and, consequently, a reduced area of inundation). The
newly exposed supra-tidal mudflats consolidated rapidly and become colonized by
mangroves. Rapid growth of mangroves within weeks after deposition stabilized these
mudflats, effectively trapping sediment. Water level set-up associated with storms or cold
179
fronts in Louisiana exerts an analogous control on exposed mudflat area than would cm-
scale fluctuations in tidal range.
Variations in the extent of biogenic colonization can play an important role in
mudflat stability and erodibility (Widdows et al., 2000). All studies that discuss mudflat
growth on the South American margin emphasize the importance of vegetation to
stability of these deposits. Rapid colonization by mangroves, especially, is an important
factor in converting new mud deposits to a permanent part of the coast (e.g.. Wells and
Coleman, 1981a, b; Allison et al., 1995a, b, 2000b; Wolanski et al., 2002; Allison and
Lee, in press). The root systems of these plants grow quickly and form an effective trap
for sediment. In higher latitudes where mangroves do not grow, biogenic stabilization by
other plants and algal mats is important to the sequestering of newly accreted sediment
onshore (e.g.. Huh et al., 1991; Faas et al., 1993; Kirby et al., 1993; Wolanski et al.,
2002; Prochnow et al., 2002). On Louisiana mudflats, where Panicum and Spartina
marsh grasses dominate the vegetation, colonization of new mudflats by these plants is
believed to similarly enhance the stability of these deposits (Huh et al., 1991, 2001).
3.4.5. Preservation of Coastal Mud Deposits in the Geologic Record
Examples of mud-dominated shoreline sequences such as that of the Louisiana
chenier plain have not been widely recognized in the stratigraphic record. Coastal
deposits, which are volumetrically minor in the geologic record, have the best chance of
intact preservation if they are located on a shoreline that is undergoing rapid sea level
regression, stranding the mudflats inland, or on the margin of a basin experiencing rapid
subsidence, so that the sequence will be quickly buried below storm wave base. Neither
180
of these situations describes the Louisiana shoreline, and so the probability that the
eastern chenier plain mudflats will be preserved over geologic time is assumed to be low.
One area where a prograding muddy shoreline appears to have been well-
preserved is in the Paleozoic Catskill Delta of central Pennsylvania (Allen and Friend,
1968; Walker and Harms, 1971, 1976; Woodrow, 1983). Located on the eastern margin
of the Appalachian orogenic front, the sedimentary sequence of the Catskill deltaic
complex records sea level regression during the Devonian Acadian Orogeny (-370 Ma;
e.g., Woodrow, 1983). Within the Upper Devonian sequence, the Irish Valley Member
contains 25 repeated sequences of (in increasing strati graphic order): a sharp basal
(erosional) surface, fine sandstone with marine fossils including brachiopods and
crinoids, green fissile shale, siltstones with thin wave-rippled sandstones and marine
fauna, red siltstones with mud cracks and root impressions, and finally red siltstones with
root traces, mud cracks, tan calcareous nodules, and occasional coarse-grained alluvial
deposits (Figure 3-21; Allen and Friend, 1968; Walker and Harms, 1971).
This sequence has been interpreted by Walker and Harms (1971, 1976) to indicate
first marine transgression, then progradation of a mud-dominated shoreline, and finally
accretion on a coastal plain dissected by alluvial channels. Desiccation cracks (Figure 3-
21b, c) and root traces (Figure 3-2Id) indicate frequent wetting and drying at the water
line. The vertical proximity of these mudflat features to marine fauna led Walker and
Harms (1971) to infer a tidal range of less than 2 m for the mudflats. The lack of major
sand horizons within the siltstones suggests shoreline progradation by the longshore
transport of mud, analogous to Louisiana's eastern chenier plain. This would require
proximity to a major ancient river source. This Irish Valley Member occupies 600 m of
stratigraphic thickness within the Catskill Delta complex (Allen and Friend, 1968). The
181
25 repetitions of this sequence indicate transgression and regression of sea level that may
have been controlled by sediment supply, tectonism, or eustatic sea level variations
(Walker and Harms, 1971). This sequence presumably owes its preservation to uplift
along the Acadian orogenic front, stranding the coastal sediments well above sea level.
3.5. Conclusions
Aerial photographs reveal decadal-scale shoreline change on Louisiana's chenier
plain between 1987 and 2001. Over this time, the eastern chenier plain has shown rapid
mudflat accretion, while the coast to either side of this prograding zone has experienced
net retreat. On time scales of weeks to months, mudflat extent waxes and wanes, with
sediment gradually migrating to the west due to longshore currents. Mudflats on the
eastern chenier plain, immediately west of the Freshwater Bayou channel, show evidence
of growth following energetic conditions associated with winter cold fronts, hurricanes,
and tropical storms. This study shows a positive correlation between the incidence of
winter cold fronts and the extent of mudflats on the chenier plain coast. This is consistent
with previous studies that indicate shoreward transport and onshore deposition of mud in
this area during cold fronts. The mass of sediment deposited on the eastern chenier plain
mudflats by cold fronts during one year is likely equivalent to -2-7% of the mass of
sediment carried by the Atchafalaya River annually. Mudflat sediment is believed to be
derived primarily from resuspension of Atchafalaya sediment from the inner shelf.
Accretion under energetic conditions is proposed to be fueled by the substantial
influx of sediment from the Atchafalaya River, which encourages wave attenuation near
182
shore, protecting the coast from erosion during storms, and maintains an unconsolidated
sea bed that provides resuspended sediment for mudflat growth. Deposition of sediment
in deeper water as current strength decreases immediately west of subaqueous shoals,
combined with wave refraction toward those shoals, further encourages localization of
mud deposits on the eastern chenier plain. Strong winds that blow toward shore, such as
during pre-frontal conditions or the passage of a hurricane to the west of this area,
resuspend large quantities of fine sediment from the inner shelf, and transport it toward
shore, where it may be brought onshore above the high tide level due to wave set-up and
storm surge. Mud may subsequently be stranded on shore during water level set-down
after the storm or frontal system has passed.
A low tidal range leads to a low probability that newly deposited mud will be
eroded by currents; rapid growth of vegetation further stabilizes mudflats. Given
conditions of abundant, unconsolidated fine-grained sediment, low tidal range, and
onshore wind direction, even major storms may induce seaward progradation and vertical
aggradation of mudflats. A comparison of the Louisiana chenier plain with other mud-
rich coasts worldwide indicates a similarity with Kerala, southwestern India, which
experiences mudflat growth during high fluvial sediment flux and shore-perpendicular
winds related to the summer monsoon, and with areas of northeastern South America
where mudflat growth responds to sediment flux from the Amazon River combined with
fluctuations in trade wind strength. The results of this study imply that the passage of
storms and energetic cold fronts can promote coastal accretion in mud-dominated
environments, a process that has received little attention in the literature and is still not
thoroughly understood. The notable difference between this finding and the well-studied
erosive effects of storms on sandy shorelines provides ample incentive for further study.
183
Acknowledgements
Dr. Oscar K. Huh (Louisiana State University) provided almost all of the aerial
photographs used in this chapter, and graciously hosted me during a visit to LSU in
March 2002. Chris Moeller (University of Wisconsin) was instrumental in the collection
of aerial photographs. Bruce Coffland of the NASA Ames Research Center kindly
provided aerial photographs taken in 2001. Jay Grymes, Louisiana State Climatologist,
provided weather records and supplemental SWT information used in this chapter;
Robert Muller (LSU) developed the synoptic weather type classification scheme used for
Louisiana. Karen Westphal was extremely helpful in providing access to video surveys
made by the Louisiana Geological Survey (now owned and maintained by LSU), and the
section of this chapter that dealt with hurricane impact was inspired by discussion with
Shea Penland (University of New Orleans). Photographer Kerry Lyle (LSU) reproduced
aerial photographs for analysis. The captain and crew of the R/W Longhom are thanked
for their work during post-Hurricane Lili data collection in October 2002, which was
funded by a grant from NSF to Miguel Gofii (University of South Carolina). Kelin
Whipple (MIT) is thanked for providing OrthoEngine software used to georectify aerial
photographs; Linda Meinke is thanked for technical support. Paul Palmed of the U. S.
Army Corps of Engineers, New Orleans branch, and Sam Bentley (LSU) provided
sediment discharge data for the Atchafalaya River. Jim Austin (USAGE) answered
questions about sediment flow through the Old River control structure. Jason Draut, Bill
Lyons, and Andy Solow provided guidance related to questions of statistics. The
discussion of global mudflat processes was helped significantly by conversations with
184
Gail Kineke, John Wells (University of North Carolina), Mead Allison (Tulane
University), Michael Collins, Sergio Cappucci, and Carl Amos (all of Southampton
Oceanography Centre), Yoshiki Saito (Geological Survey of Japan) and Ping Wang
(University of South Florida). The chapter was improved by comments and advice from
Elazar Uchupi. This work was funded by student grants from the Geological Society of
America Foundation and the American Association of Petroleum Geologists.
' During field study for this research, conditions did not permit observation of the mudflat surface immediately after cold front passage to determine whether such a deposit was present then; as discussed in Chapter 2, our survey vessel was unable to come within 500 m of the coast near the Freshwater Bayou mudflat, due to an extremely shallow muddy
sea bed.
^ The mudflat visible in the 1998 set of ASPs was chosen as the representative mudflat for this calculation because the dimensions and appearance of this mudflat at that time were comparable to most of the other 18 sets used in this work; its length spanned -14.75 km, from Freshwater Bayou to 1.25 km west of Dewitt Canal. No dredging operations had occurred in Freshwater Bayou for four years before these photographs were taken, eliminating dredging as a major influence on this section of the coast at that time. The 1998 photographs were digitally orthorectified by GIS specialists at Louisiana State University and were treated to remove solar glare from the water surface (LSU, 1998), which facilitated resolution of the seaward boundary of the unvegetated mud. These calculations consider deposition during cold fronts occurring only on the unvegetated portion of the accreted area, considered to be the "active" mudflat.
^ As discussed in Section 3.1.4., Gulf Return (GR) weather includes southeriy winds, as do FOR and GTD systems, but with velocity (3.1 to 4.1 m/s) well below the sustained wind speeds of FOR and GTD. GR weather is not associated with coastal mud accumulation; a comparison of GR frequency and mudflat length on the chenier plain yielded no statistical correlation. The 7/9/84, 7/22/86, and 10/22/87 surveys, all of which followed summer GR peaks, showed a near total absence of mudflats. Although GR
185
winds blow from the south, their low velocity and absence of associated wave set-up or storm surge results in low potential for sediment resuspension and onshore transport. The accretion observed during Interval 2, which spanned the summer of 1989 when GR conditions were active, is therefore assumed to have responded primarily to the passage of the two intense GTD events that summer.
186
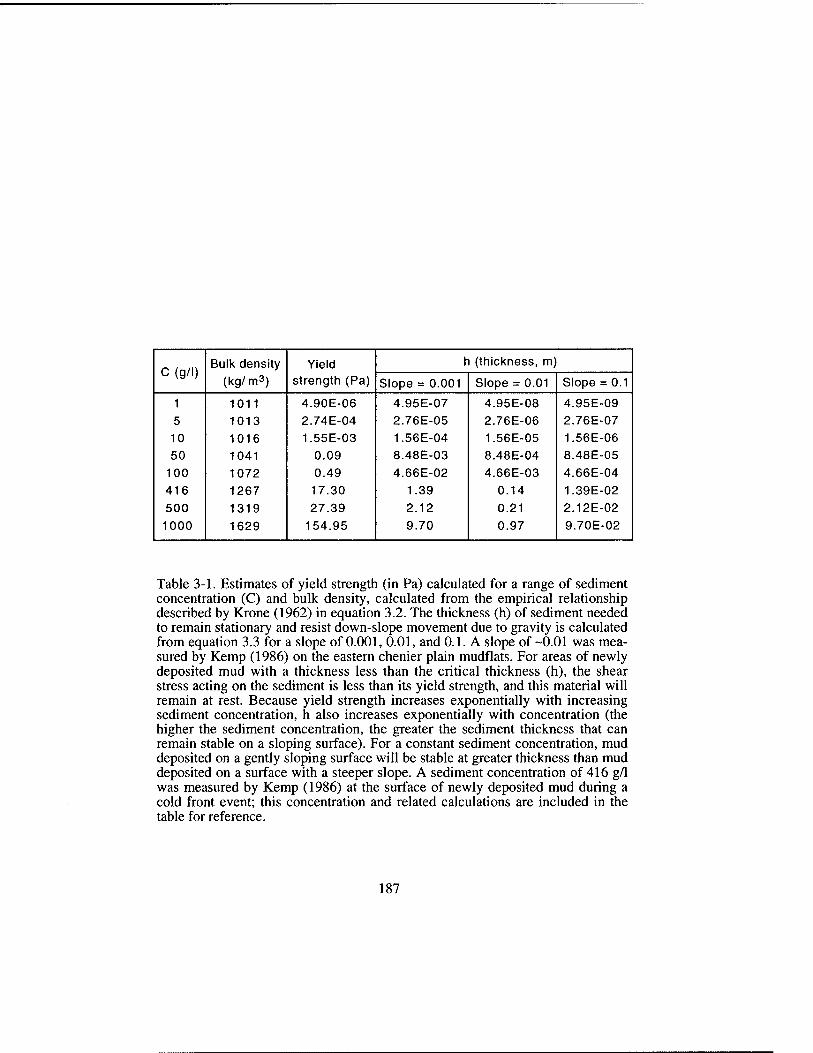
c (g/i) Bulk density
(kg/m3) Yield
strength (Pa)
h (thickness, m)
Slope = 0.001 Slope = 0.01 Slope = 0.1
1 1011 4.90E-06 4.95E-07 4.95E-08 4.95E-09
5 1013 2.74E-04 2.76E-05 2.76E-06 2.76E-07
10 1016 1.55E-03 1.56E-04 1.56E-05 1.56E-06
50 1041 0.09 8.48E-03 8.48E-04 8.48E-05
100 1072 0.49 4.66E-02 4.66E-03 4.66E-04
416 1267 17.30 1.39 0.14 1.39E-02
500 1319 27.39 2.12 0.21 2.12E-02
1000 1629 154.95 9.70 0.97 9.70E-02
Table 3-1. Estimates of yield strength (in Pa) calculated for a range of sediment concentration (C) and bulk density, calculated from the empirical relationship described by Krone (1962) in equation 3.2. The thickness (h) of sediment needed to remain stationary and resist down-slope movement due to gravity is calculated from equation 3.3 for a slope of 0.001, 0.01, and 0.1. A slope of -0.01 was mea- sured by Kemp (1986) on the eastern chenier plain mudflats. For areas of newly deposited mud with a thickness less than the critical thickness (h), the shear stress acting on the sediment is less than its yield strength, and this material will remain at rest. Because yield strength increases exponentially with increasing sediment concentration, h also increases exponentially with concentration (the higher the sediment concentration, the greater the sediment thickness that can remain stable on a sloping surface). For a constant sediment concentration, mud deposited on a gently sloping surface will be stable at greater thickness than mud deposited on a surface with a steeper slope. A sediment concentration of 416 g/1 was measured by Kemp (1986) at the surface of newly deposited mud during a cold front event; this concentration and related calculations are included in the table for reference.
187
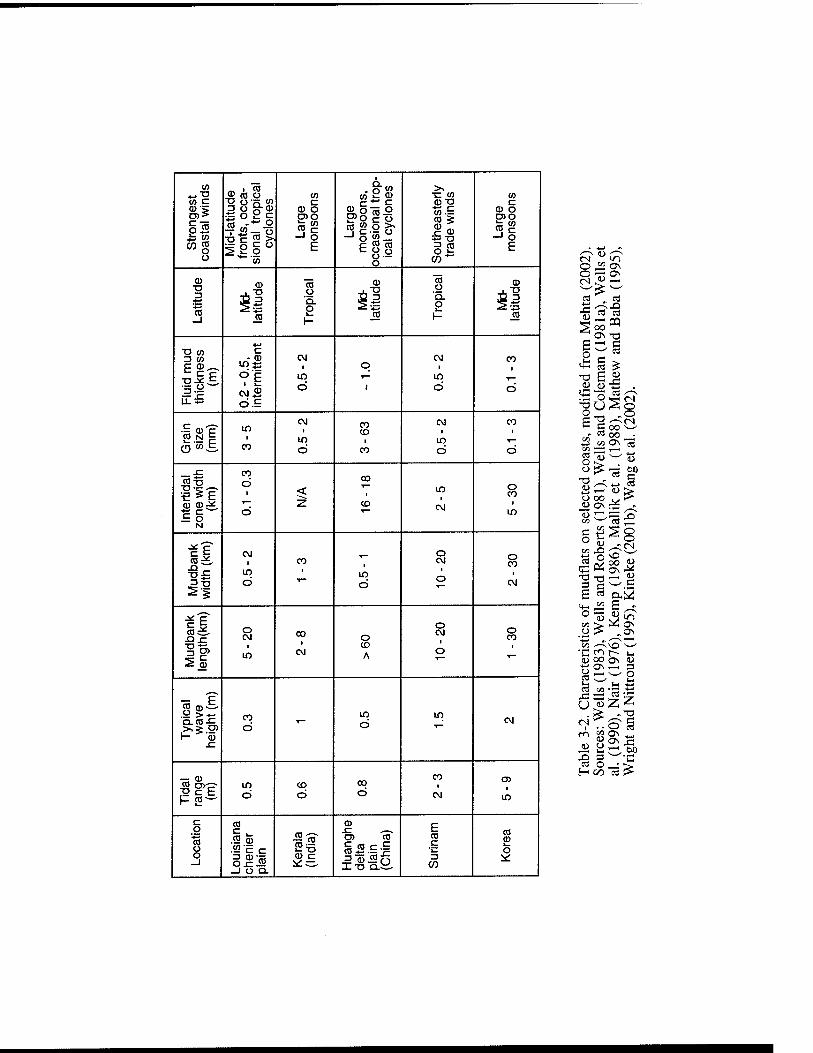
a> cc o CO 03 b; CD — CO CO CO c T3 cJo «
T3 c ™ ><
c c*" c CD"D c 8,5 Q) O s.o'co-e n
1^ CD 0
C3)0 ™ C -J O
cog 12§" E E|g §2 E o "" CO
o — o CO
■u 0) lo o
CD 0
.-i 5
S 3 ■Q.
2 H
53
5 Q. S 1-
■•-'
■D to c 3 10 .«-<!' OJ CM CO E 2 — ints 1 0 1
X3 J£ t ?E in 1- in T-
1-r CM5 o i 0 0
U-*= ci.S
Gra
in
size
(m
m) in
CM
in
CO CD
CM 1
in
CO 1
CO o CO 0 0
^ CO
lida
w
idt
m) d
^ 00
m 0 CO
0) (D:^ ■* z CO CM • S o
o ■^ m
N
5^
CM 1 CO ■
0 CM 0
CO in ■ in
CD 0 CM
^i ^_^
o CO 0 ^ 0
CO
in CM A 0
-
■s; E CO 0)^. ." >- CO
d m in
1— 0, ■^ a CM
^
— 0) CO o> S c E H£5-
in CD I
o O 0 CM in
CO
S •- ™ a) .52 E c
_J O QL
0)
O) CO E CO c
■c 3
CO
CO
a? 2
|C ,1-H C '+- CO T3 E (U <u
rs o T3 U
.. CO
IT) OS
CO
-4-t CO
CN
CO ' O 1
<u : o 00
tzi —
CO X)
g §
3^ •C c^
CO izi
u «
00 ^-^ 00 _•
I ON CO
- s (U >
-^ ^ is
^ H c/D
vo ^^
C3N U
^_- O u- is
ON x:
"cO ^
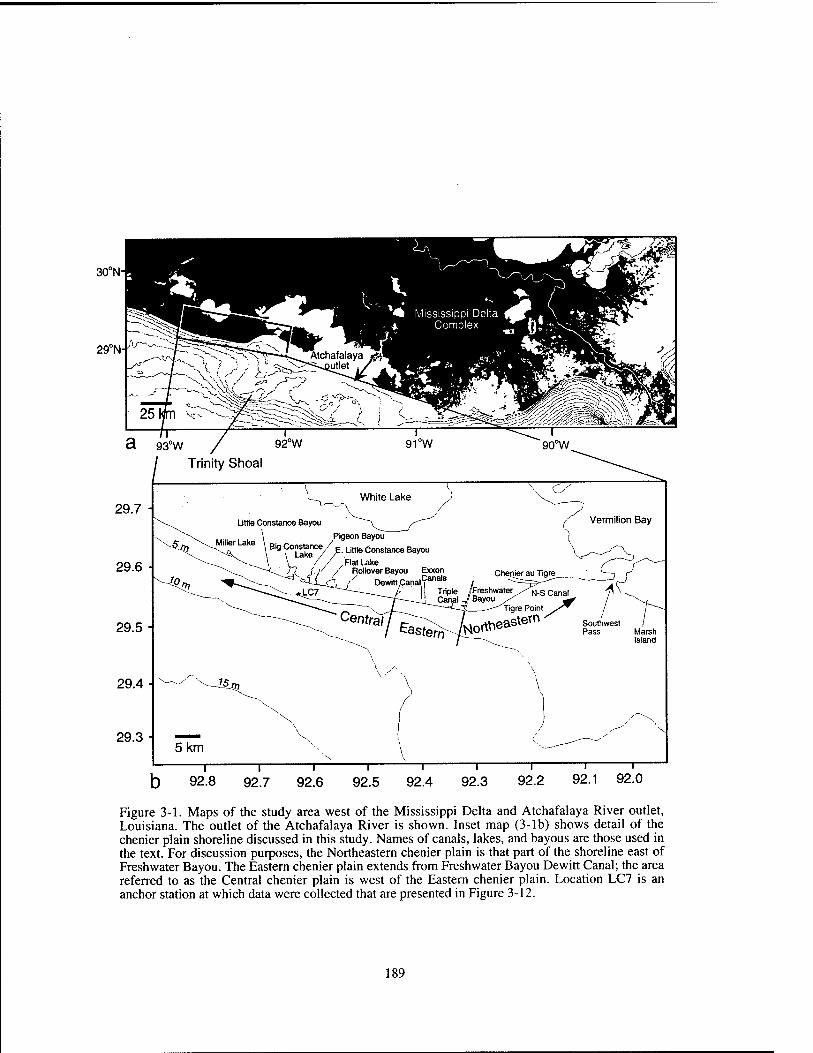
30°N
29°N l°M- -^'
29.7
29.6
29.5
29.4
29.3
92.1 92.0
Figure 3-1. Maps of the study area west of the Mississippi Delta and Atchafalaya River outlet, Louisiana. The outlet of the Atchafalaya River is shown. Inset map (3-lb) shows detail of the chenier plain shoreline discussed in this study. Names of canals, lakes, and bayous are those used in the text. For discussion purposes, the Northeastern chenier plain is that part of the shoreline east of Freshwater Bayou. The Eastern chenier plain extends from Freshwater Bayou Dewitt Canal; the area referred to as the Central chenier plain is west of the Eastern chenier plain. Location LC7 is an anchor station at which data were collected that are presented in Figure 3-12.
189
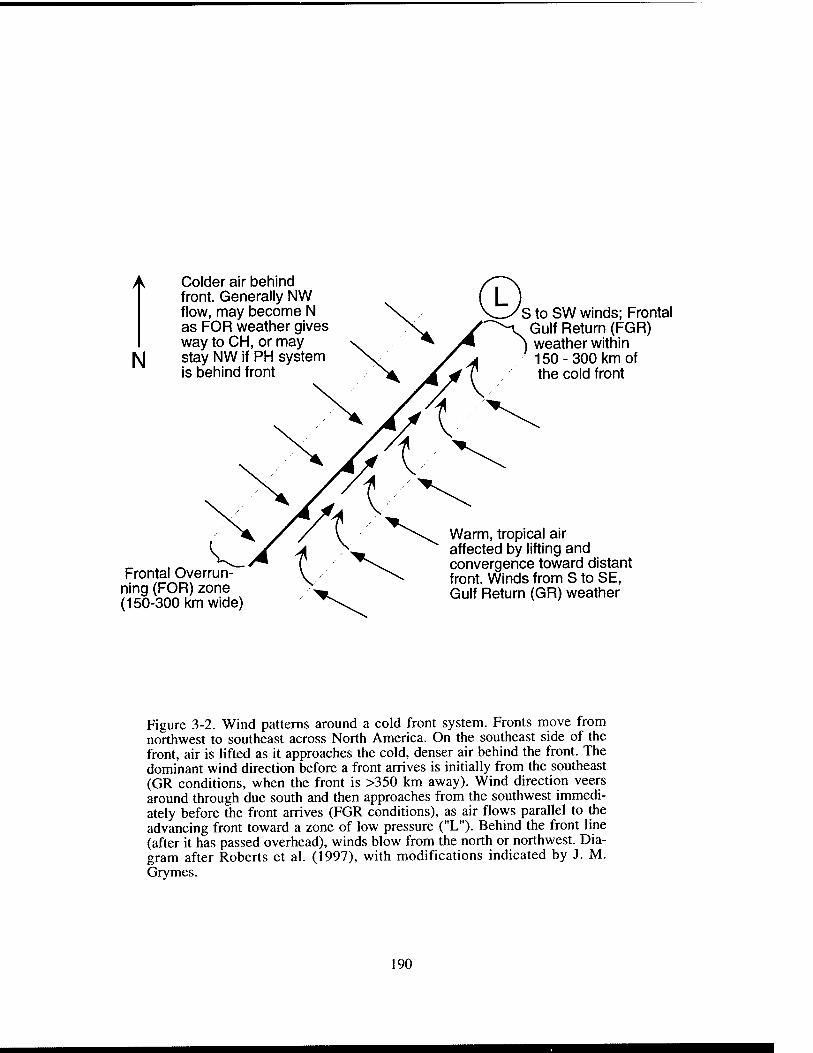
N
Colder air behind front. Generally NW flow, may become N as FOR weather gives way to CH, or may stay NW if PH system is behind front
Frontal Overrun ning (FOR) zone (150-300 km wide)
S to SW winds; Frontal Gulf Return (FGR) weather within 150-300 km of the cold front
Warm, tropical air affected by lifting and convergence toward distant front. Winds from S to SE, Gulf Return (GR) weather
Figure 3-2. Wind patterns around a cold front system. Fronts move from northwest to southeast across North America. On the southeast side of the front, air is lifted as it approaches the cold, denser air behind the front. The dominant wind direction before a front arrives is initially from the southeast (GR conditions, when the front is >350 km away). Wind direction veers around through due south and then approaches from the southwest immedi- ately before the front arrives (FGR conditions), as air flows parallel to the advancing front toward a zone of low pressure ("L"). Behind the front line (after it has passed overhead), winds blow from the north or northwest. Dia- gram after Roberts et al. (1997), with modifications indicated by J. M. Grymes.
190
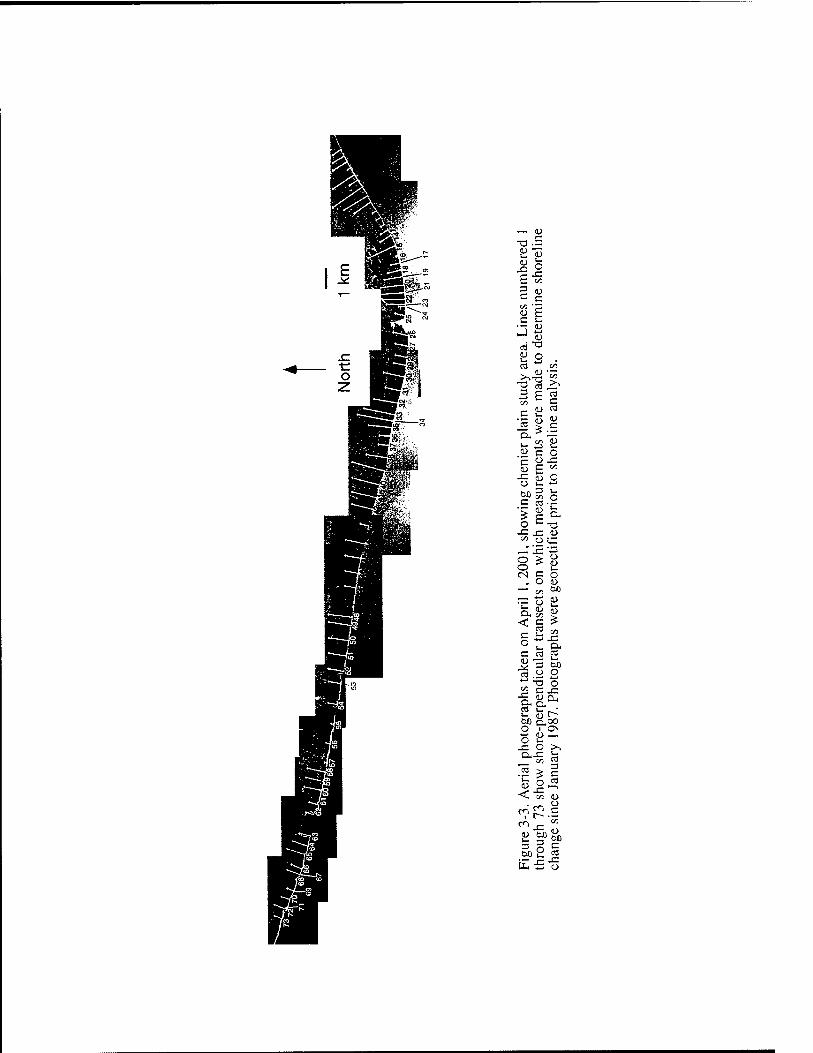
rS'i
— <u
H-s
C « c C u E C 1- •- (D
5J O
^ <« — 3 E 2 '^ S 5- <- «\ ■;;; <u Si iS > c '^ ■71 h ^ ^ H c o aj E "^ o £. -^
O '^ T3 •S -= ""
o 8^ (N C
, O
C Ki s
-S <u 0-1
I- oj f^ bo n^oo
jr o >^ en <^
o o
.2 1)
-I O to
&0 fc: 52
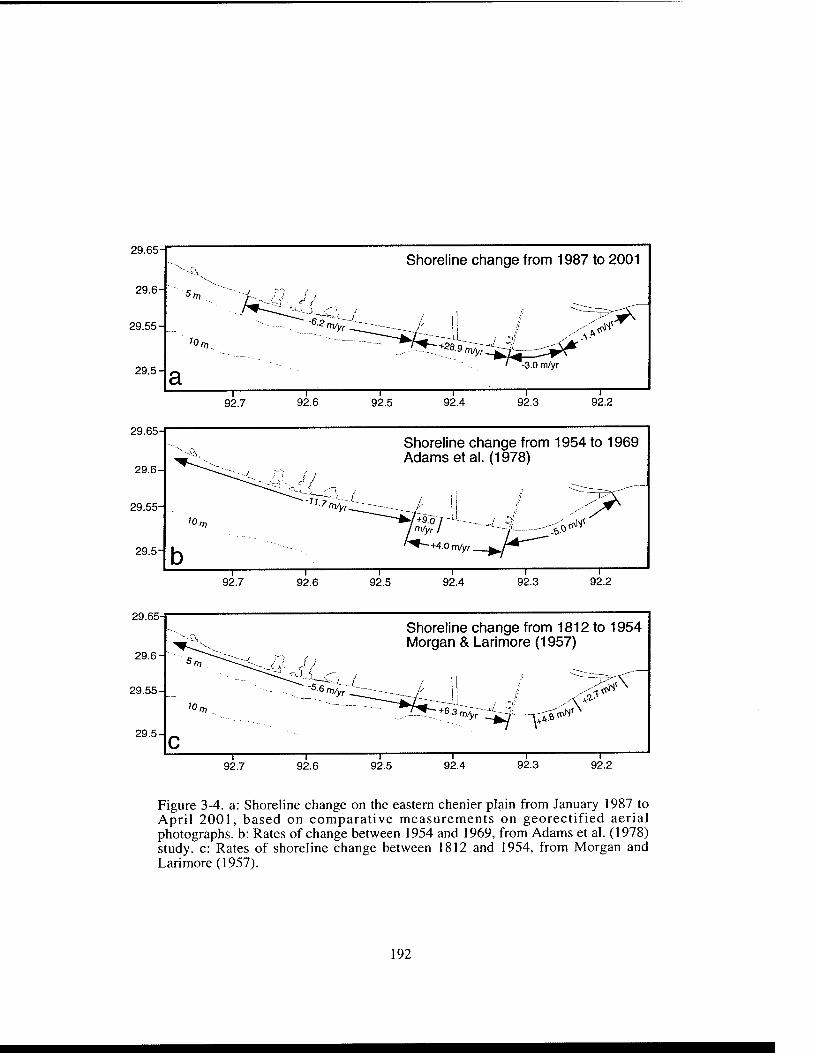
29.65
29.6-
29.55-
29.5-
10 "7.
a
Shoreline change from 1987 to 2001
3.0 m/yr
;s^
—I— 92.2
29.65-
29.6-
29.55-
29.5-
92.7 92.6 92.5 —I 92.4 92.3
Shoreline change from 1954 to 1969 Adams etal. (1978)
+9.07-'^-^- m/yr I
+4.0 m/yr
y^ 92.7 92.6 92.5 92.4 92.3 92.2
29.65-
29.6-
29.55-
29.5- c 1 .
Shoreline change from 1812 to 1954 Morgan & Larimore (1957)
1 1^ ^—
92.7 92.6 92.5 92.4 92.3 92.2
Figure 3-4. a: Shoreline change on the eastern chenier plain from January 1987 to April 2001, based on comparative measurements on georectified aerial photographs, b: Rates of change between 1954 and 1969, from Adams et al. (1978) study, c: Rates of shoreline change between 1812 and 1954, from Morgan and Larimore (1957).
192
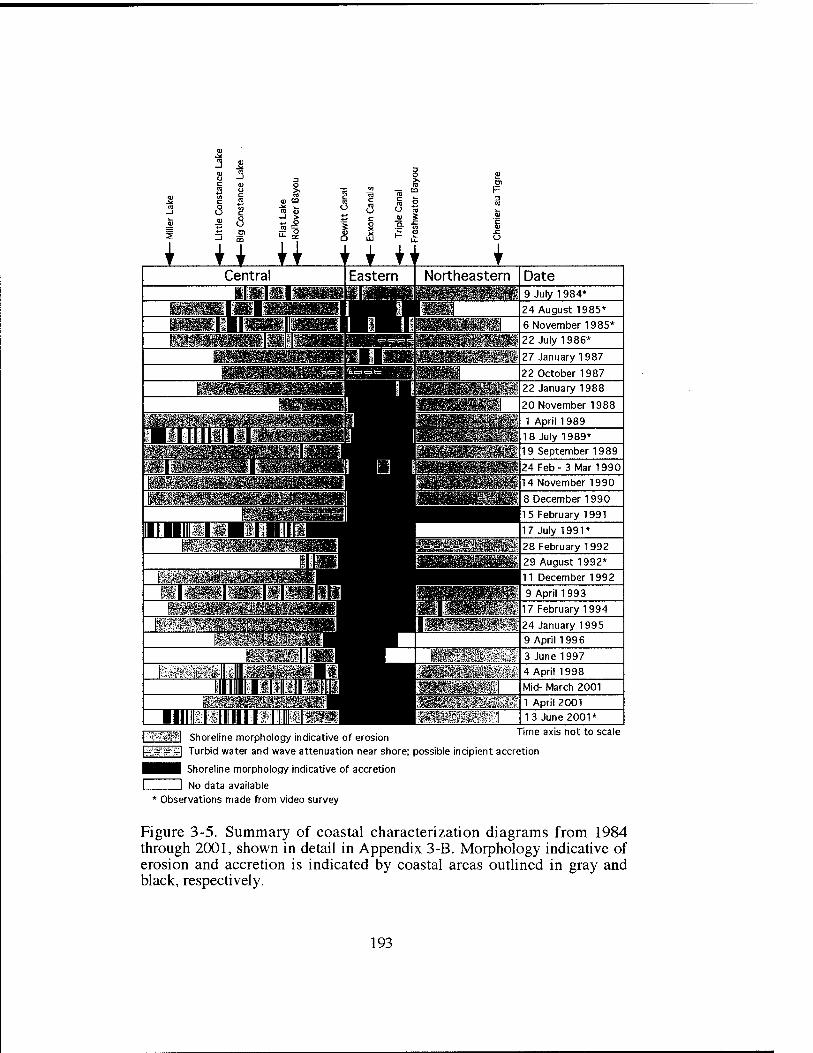
<u o o
3 4) ii>
^ -it w
o -J > o t; ° .5' E S
i M u Central
■Pit?
A
imia •^'p ''..to...-"-*-*^ Il5 February 1991
•- .y^'-^Cl^^
' . ,%ii,% -t'. %flJ?^JSg! ^'^'■*>;^Vg^t^,^
'^L
r"r-^^M.'^ll III ^.j.i» .^^41
iinrr iMi llllllliiilBl
HI
17 July 1991*
28 February 1992
'^^m^n:;^^! 29 August 1992*
^m^^ 11 December 1992
9 April 1993 ^^i^i^ij^' ■- 17 February 1994 1 .J^ iV* j^ - 24 January 1995
9 April 1996
3 June 1997
•■i 4 April 1998
t^-n;^ - Mid- March 2001
55 ^ , 1 April 2001
1 13 June 2001*
'"t^ "1 Shoreline morphology indicative of erosion Time axis not to scale
[-^■ra ^1 Turbid water and wave attenuation near shore; possible incipient accretion
HHH Shoreline morphology indicative of acaetion
I I No data available * Observations made from video survey
Figure 3-5. Summary of coastal characterization diagrams from 1984 through 2001, shown in detail in Appendix 3-B. Morphology indicative of erosion and accretion is indicated by coastal areas outlined in gray and black, respectively.
193
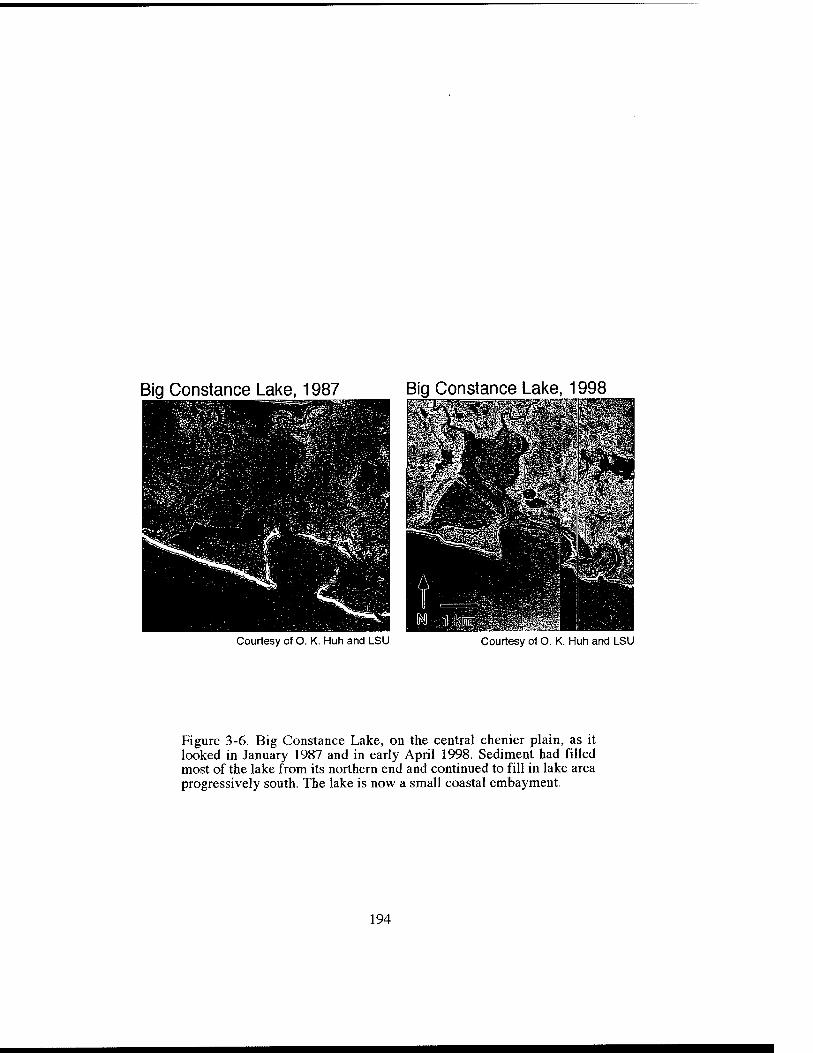
Big Constance Lake, 1987 Big Constance Lake, 1998
Courtesy of O. K. Huh and LSU Courtesy ot O. K. Huh and LSU
Figure 3-6. Big Constance Lake, on the central chenier plain, as it looked in January 1987 and in early April 1998. Sediment had filled most of the lake from its northern end and continued to fill in lake area progressively south. The lake is now a small coastal embayment.
194
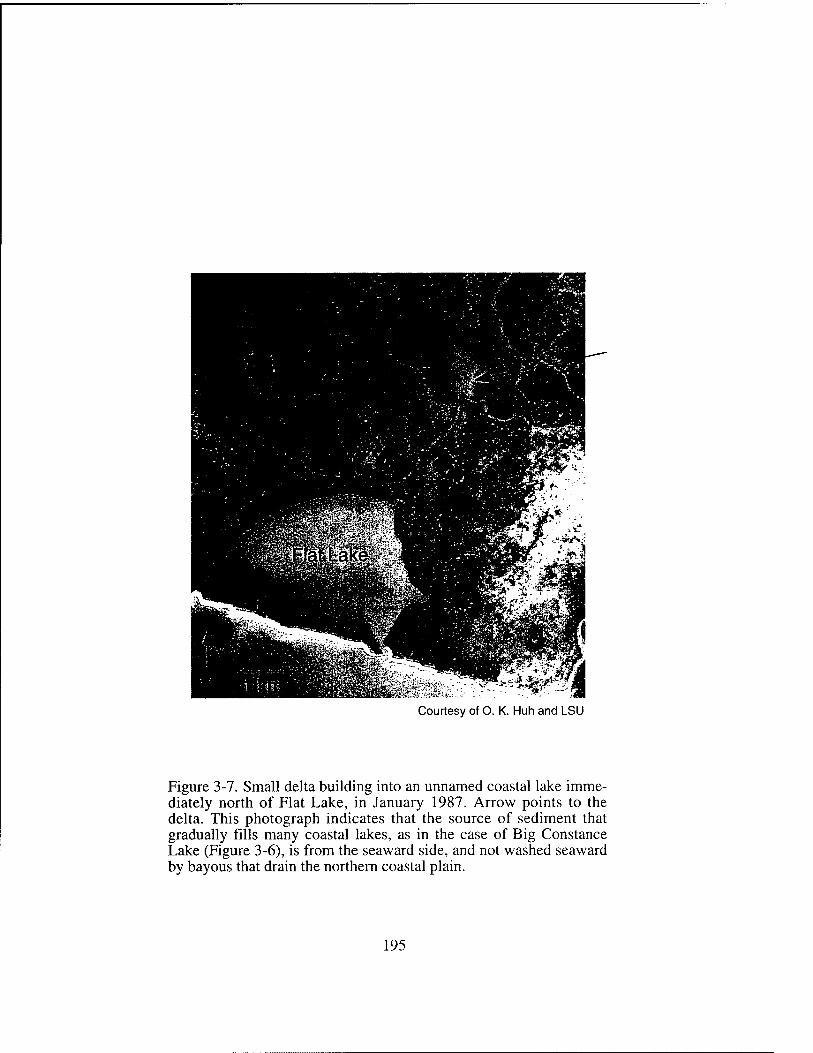
Courtesy of O. K. Huh and LSU
Figure 3-7. Small delta building into an unnamed coastal lake imme- diately north of Flat Lake, in January 1987. Arrow points to the delta. This photograph indicates that the source of sediment that gradually fills many coastal lakes, as in the case of Big Constance Lake (Figure 3-6), is from the seaward side, and not washed seaward by bayous that drain the northern coastal plain.
195
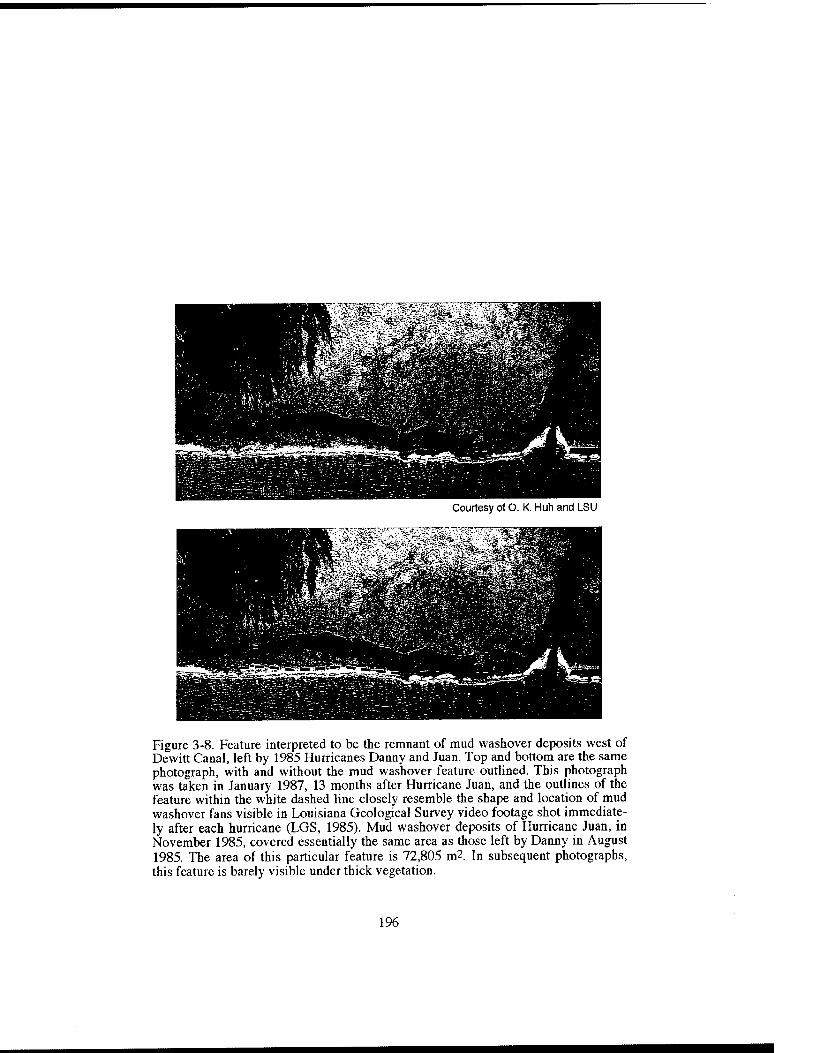
Courtesy of O. K. Huh and LSU
Figure 3-8. Feature interpreted to be the remnant of mud washover deposits west of Dewitt Canal, left by 1985 Hurricanes Danny and Juan. Top and bottom are the same photograph, with and without the mud washover feature outlined. This photograph was taken in January 1987, 13 months after Hurricane Juan, and the outlines of the feature within the white dashed line closely resemble the shape and location of mud washover fans visible in Louisiana Geological Survey video footage shot immediate- ly after each hurricane (LGS, 1985). Mud washover deposits of Hurricane Juan, in November 1985, covered essentially the same area as those left by Danny in August 1985. The area of this particular feature is 72,805 m2. In subsequent photographs, this feature is barely visible under thick vegetation.
196
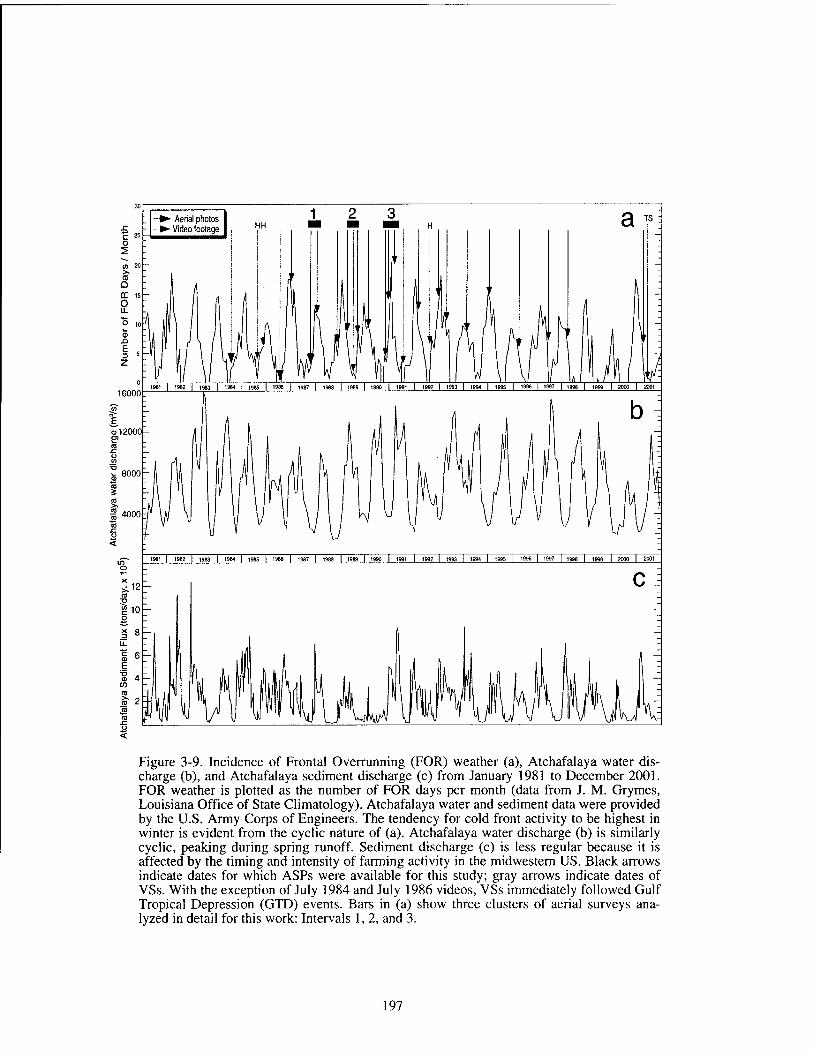
Figure 3-9. Incidence of Frontal Overrunning (FOR) weather (a), Atchafalaya water dis- chiarge (b), and Atchafalaya sediment discharge (c) from January 1981 to December 2001. FOR weather is plotted as the number of FOR days per month (data from J. M. Grymes, Louisiana Office of State Climatology). Atchafalaya water and sediment data were provided by the U.S. Army Corps of Engineers. The tendency for cold front activity to be highest in winter is evident from the cyclic nature of (a). Atchafalaya water discharge (b) is similarly cyclic, peaking during spring runoff. Sediment discharge (c) is less regular because it is affected by the timing and intensity of farming activity in the midwestem US. Black arrows indicate dates for which ASPs were available for this study; gray arrows indicate dates of VSs. With the exception of July 1984 and July 1986 videos, VSs immediately followed Gulf Tropical Depression (GTD) events. Bars in (a) show three clusters of aerial surveys ana- lyzed in detail for this work: Intervals 1, 2, and 3.
197
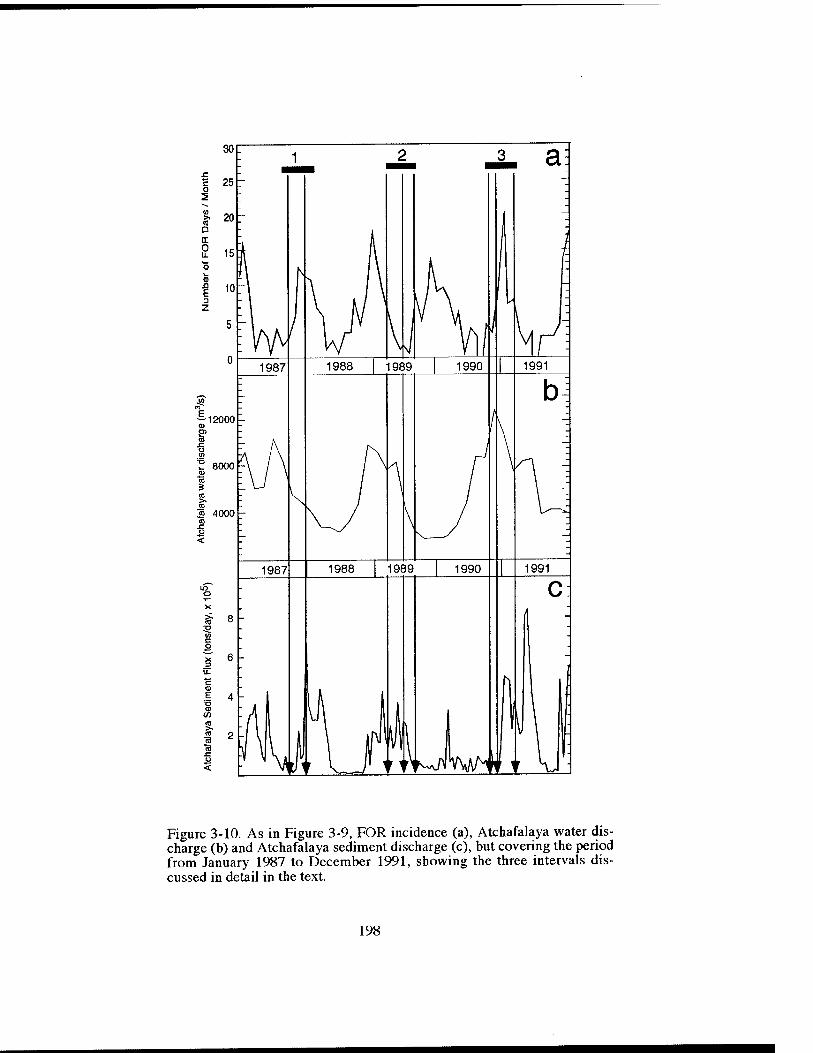
Figure 3-10. As in Figure 3-9, FOR incidence (a), Atchafalaya water dis- charge (b) and Atchafalaya sediment discharge (c), but covering the period from January 1987 to December 1991, showing the three intervals dis- cussed in detail in the text.
198

29.6-r
29.5-
Chenler auTiqre,,^ A
Present location of ^^^^^ Freshwater Bayou ^^ ̂ ^^
"*^'linII|flliEiliii..i.^ Canal V / r A
North km
Y//\ Land area accreted between 1837 and 1927
H Area accreted between 1927 and 1951
1 1 r* 92.4 92.3 92.2
Figure 3-11. Based on a map drafted by Morgan et al. (1953): Extent of accretion observed on the eastern chenier plain between 1837 and 1927, and from 1927 to 1951. Accretion had taken place over almost the entire eastern and northeastern chenier plain, including shoreline that is now dominantly erosional east of Freshwater Bayou (northeastern chenier plain). Morgan et al. (1953) note that the 1837-38 survey was conducted by Rightor and McCollum, Deputy US Surveyors, the 1927 survey was conducted by Walter Y. Kemper of Franklin, LA, and the 1951 shoreline is based on US Navy aerial photographs.
199
Figure 3-12 (facing page). Profiles showing suspended sediment flux in the water column during pre- and post-frontal conditions (data from G. C. Kineke, collected in March 2001). Location is an anchor station ~2 km offshore near Big Constance Lake, in a water depth of -5 m (location marked LC7 in Figure 3-1). Sediment flux is calculated as the product of suspended sediment concentration (measured by Optical Backscatterance Sensor [OBS] and calibrated to direct measurements from filtered sediment concentrations) and current velocity obtained from a Marsh-McBimey current meter deployed on the same instrument tripod as the OBS. Current velocity has been rotated to reflect orientation relative to the shoreline, and is expressed in along-shore (positive to the east) and across-shore (positive toward shore) components. All plots show 5-hour averaged profiles, with measurements made approximately every 30 minutes. Inference of pre- and post-frontal conditions is made from wind direction and wind speed, a and b: Sediment flux prior to the arrival of a cold front is toward shore (a) and westward (b), as winds blow dominantly from the southeast prior to arrival of a cold front, c: Suspended sediment flux during post-frontal conditions is seaward in the upper water column due to winds that blow from the north (offshore). A compensating upwelling circulation drives the lower water column, where sediment concentration is highest, toward shore; the net flux in profile c is positive (-0.4 mg cm"^ s"'), indicating net transport of sediment toward shore, d: Post-frontal sediment flux shows an eastward component.
200
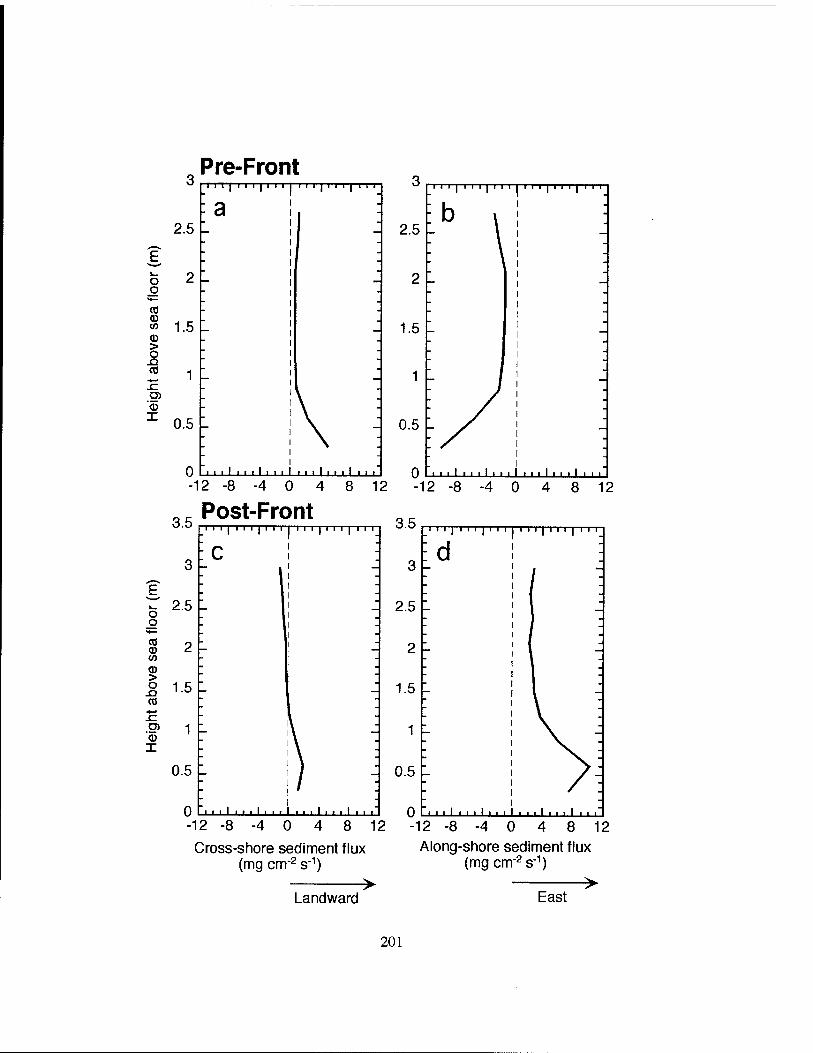
Pre-Front
3 S Post-Front
3
■ 11111111 ■ 1
:C r I
1111ll111 ■ 11
E ■
j_ ?.5 1 ■
o 1 o . .
**— _ . CO 2 - . Q) — — « - - <1) " • > ■
O o 1.6 — _ OS : * sz - I D) 1 " \ J CO . \ X - \
0.5 - ) '■
0 '■>il IMII.I ■
-12 -8-4 0 4 8 12 -12 -8-4 0 4 8 12
Cross-Shore sediment flux Along-shore sediment flux (mg cm-2 s"^) (mg cm'^ s"^) > > Landward East
201
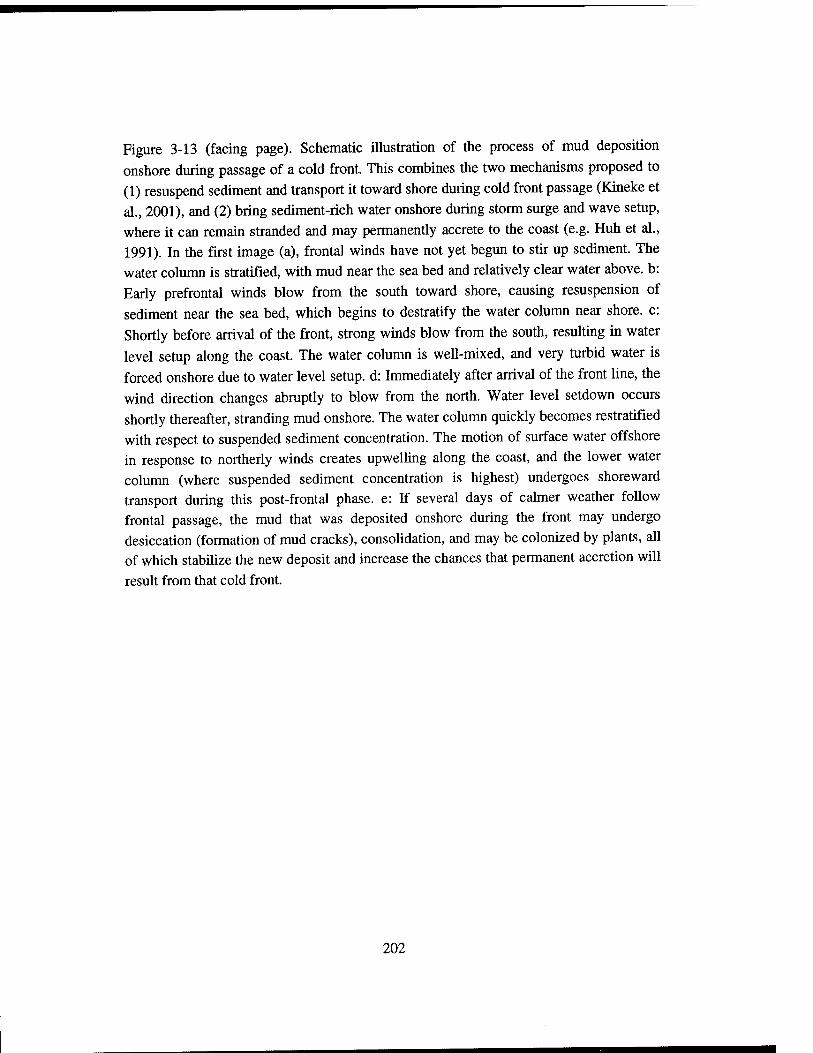
Figure 3-13 (facing page). Schematic illustration of the process of mud deposition onshore during passage of a cold front. This combines the two mechanisms proposed to (1) resuspend sediment and transport it toward shore during cold front passage (Kineke et al., 2001), and (2) bring sediment-rich water onshore during storm surge and wave setup, where it can remain stranded and may permanently accrete to the coast (e.g. Huh et al., 1991). In the first image (a), frontal winds have not yet begun to stir up sediment. The water column is stratified, with mud near the sea bed and relatively clear water above, b: Early prefrontal winds blow from the south toward shore, causing resuspension of sediment near the sea bed, which begins to destratify the water column near shore, c: Shortly before arrival of the front, strong winds blow from the south, resulting in water level setup along the coast. The water column is well-mixed, and very turbid water is forced onshore due to water level setup, d: Immediately after arrival of the front line, the wind direction changes abruptly to blow from the north. Water level setdown occurs shortly thereafter, stranding mud onshore. The water column quickly becomes restratified with respect to suspended sediment concentration. The motion of surface water offshore in response to northerly winds creates upwelling along the coast, and the lower water column (where suspended sediment concentration is highest) undergoes shoreward transport during this post-frontal phase, e: If several days of calmer weather follow frontal passage, the mud that was deposited onshore during the front may undergo desiccation (formation of mud cracks), consolidation, and may be colonized by plants, all of which stabilize the new deposit and increase the chances that permanent accretion will result from that cold front.
202
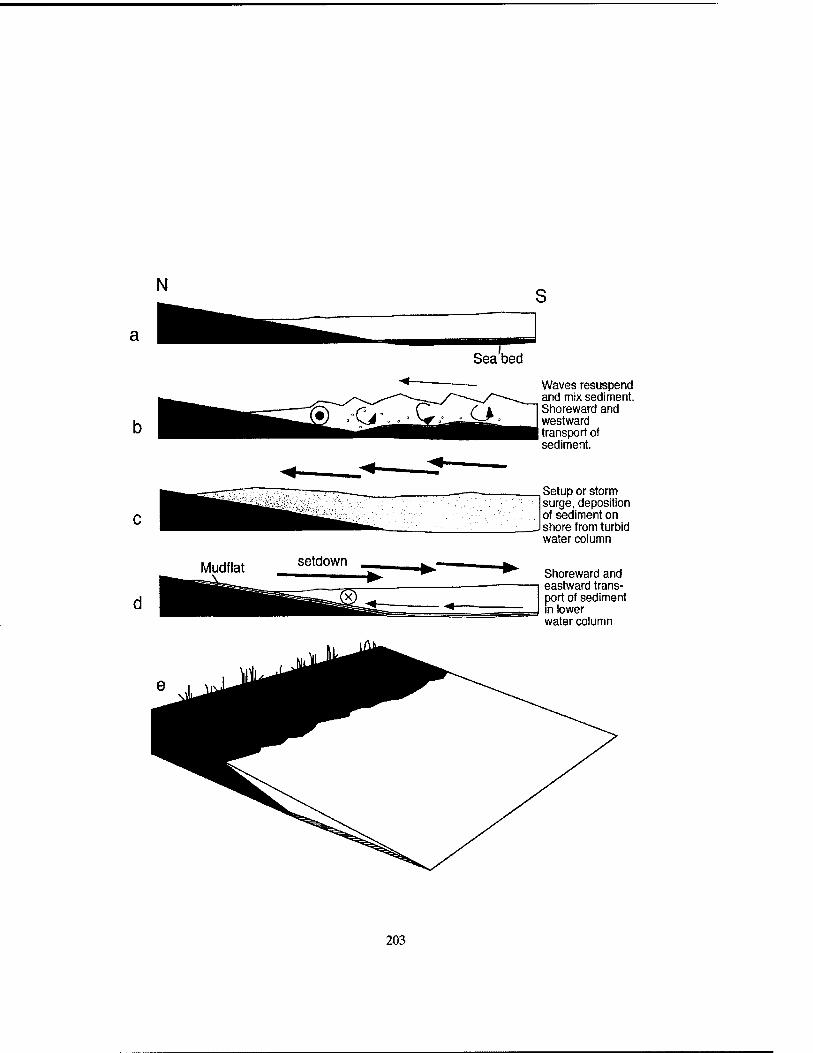
—T Sea bed
Mudflat setdown
Waves resuspend and mix sediment. Siioreward and westward transport of sediment.
Setup or storm surge, deposition of sediment on shore from turbid water column
Sfioreward and eastward trans- port of sediment in lower water column
203
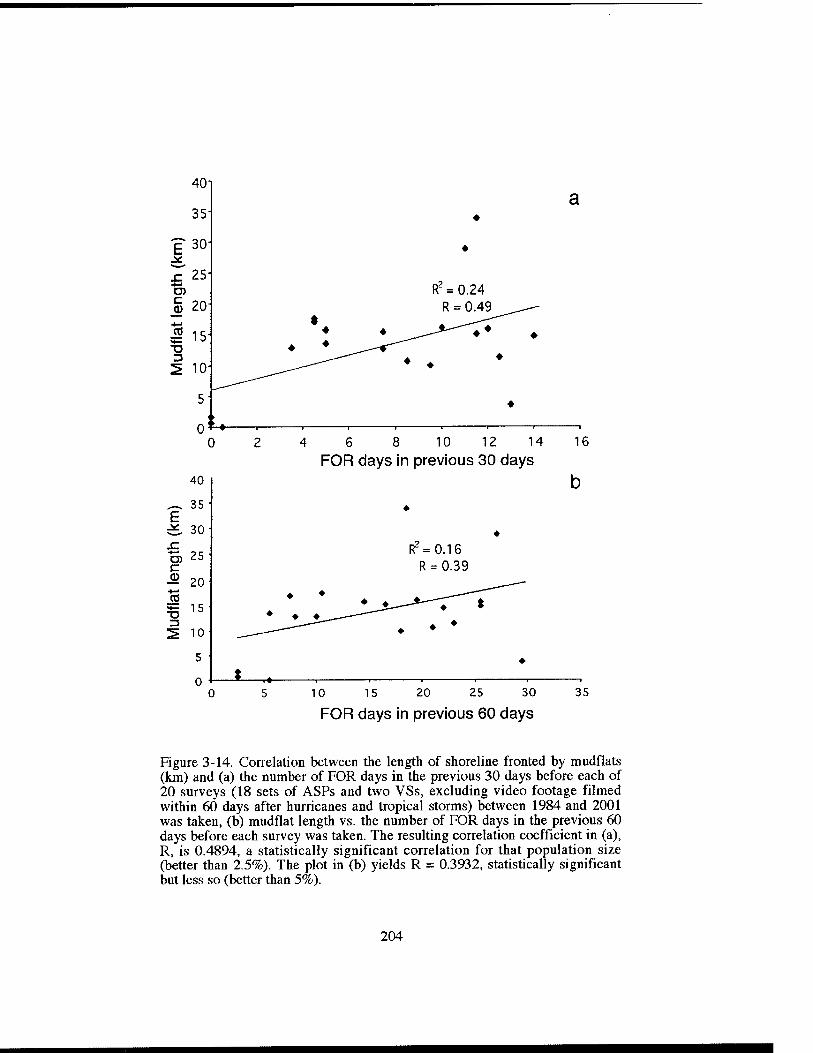
E
c
■o
E
x: ■♦—' D) C
■*—'
3
40
35
30
25
20
15
10
5
0 0
40
35
30
25'
20
15 ■
10
5 ■
0
R' = 0.24
4 6 8 10 12 14 FOR days in previous 30 days
16
b
R^=0.16 R = 0.39
0 10 15 20 25 30
FOR days in previous 60 days
35
Figure 3-14. Correlation between the length of shoreline fronted by mudflats (km) and (a) the number of FOR days in the previous 30 days before each of 20 surveys (18 sets of ASPs and two VSs, excluding video footage filmed within 60 days after hurricanes and tropical storms) between 1984 and 2001 was taken, (b) mudflat length vs. the number of FOR days in the previous 60 days before each survey was taken. The resulting correlation coefficient in (a), R, is 0.4894, a statistically significant correlation for that population size (better than 2.5%). The plot in (b) yields R = 0.3932, statistically significant but less so (better than 5%).
204
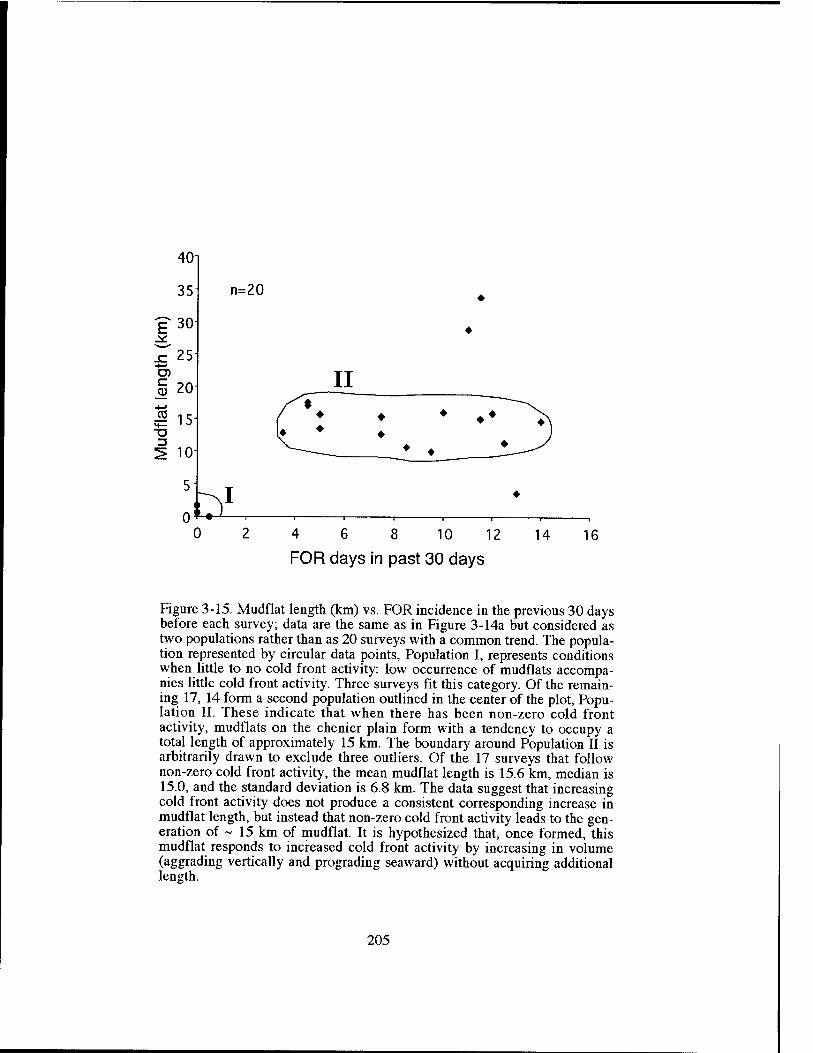
sz
c CD
40
35
30
25
201
^ 15
i 10
51
n=20
4 6 8 10 12 14 16
FOR days in past 30 days
Figure 3-15. Mudflat length (km) vs. FOR incidence in the previous 30 days before each survey; data are the same as in Figure 3-14a but considered as two populations rather than as 20 surveys with a common trend. The popula- tion represented by circular data points. Population I, represents conditions when little to no cold front activity: lovi' occurrence of mudflats accompa- nies little cold front activity. Three surveys fit this category. Of the remain- ing 17, 14 form a second population outlined in the center of the plot, Popu- lation II. These indicate that when there has been non-zero cold front activity, mudflats on the chenier plain form with a tendency to occupy a total length of approximately 15 km. The boundary around Population II is arbitrarily drawn to exclude three outliers. Of the 17 surveys that follow non-zero cold front activity, the mean mudflat length is 15.6 km, median is 15.0, and the standard deviation is 6.8 km. The data suggest that increasing cold front activity does not produce a consistent corresponding increase in mudflat length, but instead that non-zero cold front activity leads to the gen- eration of ~ 15 km of mudflat. It is hypothesized that, once formed, this mudflat responds to increased cold front activity by increasing in volume (aggrading vertically and prograding seaward) without acquiring additional length.
205
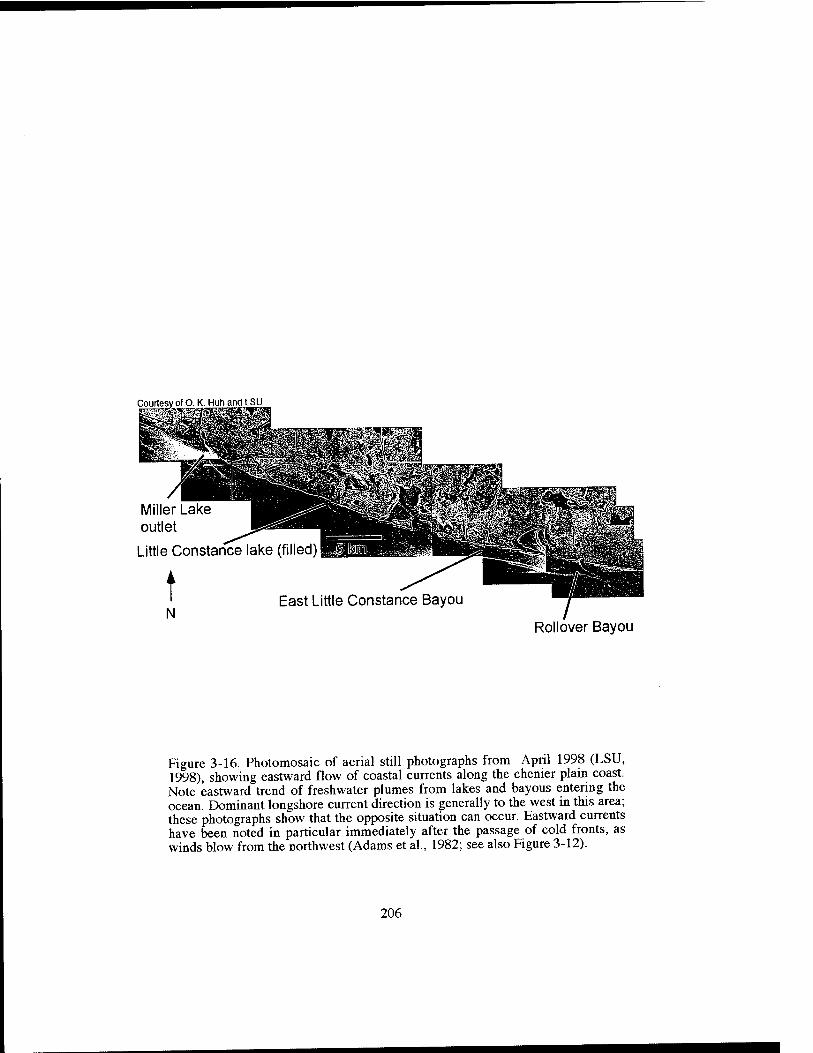
Little Constance
East Little Constance Bayou
Rollover Bayou
Figure 3-16. Photomosaic of aerial still photographs from April 1998 (LSU, 1998), showing eastward flow of coastal currents along the chenier plain coast. Note eastward trend of freshwater plumes from lakes and bayous entering the ocean. Dominant longshore current direction is generally to the west in this area; these photographs show that the opposite situation can occur. Eastward currents have been noted in particular immediately after the passage of cold fronts, as winds blow from the northwest (Adams et al., 1982; see also Figure 3-12).
206
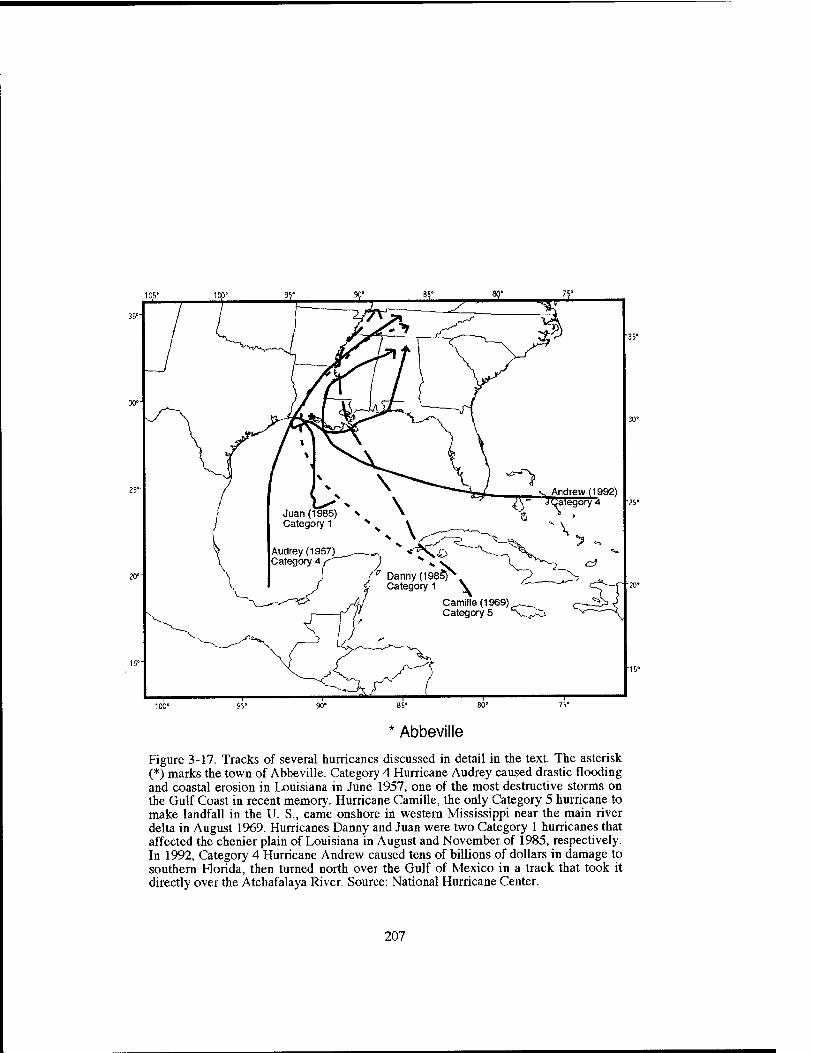
Juan (1985) v ^ Category 1 '^ ^ \
^1 ■^Andrew (1992)
A' ^category 4
f Danny (1985) ^ Category 1 \
Camille (1969) ,^__^ ;—~2> 4 Category 5 '^^^^ S,—-^
—r 76*
* Abbeville
Figure 3-17. Tracks of several hurricanes discussed in detail in the text. The asterisk (*) marks the town of Abbeville. Category 4 Hurricane Audrey caused drastic flooding and coastal erosion in Louisiana in June 1957, one of the most destructive storms on the Gulf Coast in recent memory. Hurricane Camille, the only Category 5 hurricane to make landfall in the U. S., came onshore in western Mississippi near the main river delta in August 1969. Hurricanes Danny and Juan were two Category 1 hurricanes that affected the chenier plain of Louisiana in August and November of 1985, respectively. In 1992, Category 4 Hurricane Andrew caused tens of billions of dollars in damage to southern Florida, then turned north over the Gulf of Mexico in a track that took it directly over the Atchafalaya River. Source: National Hurricane Center.
207
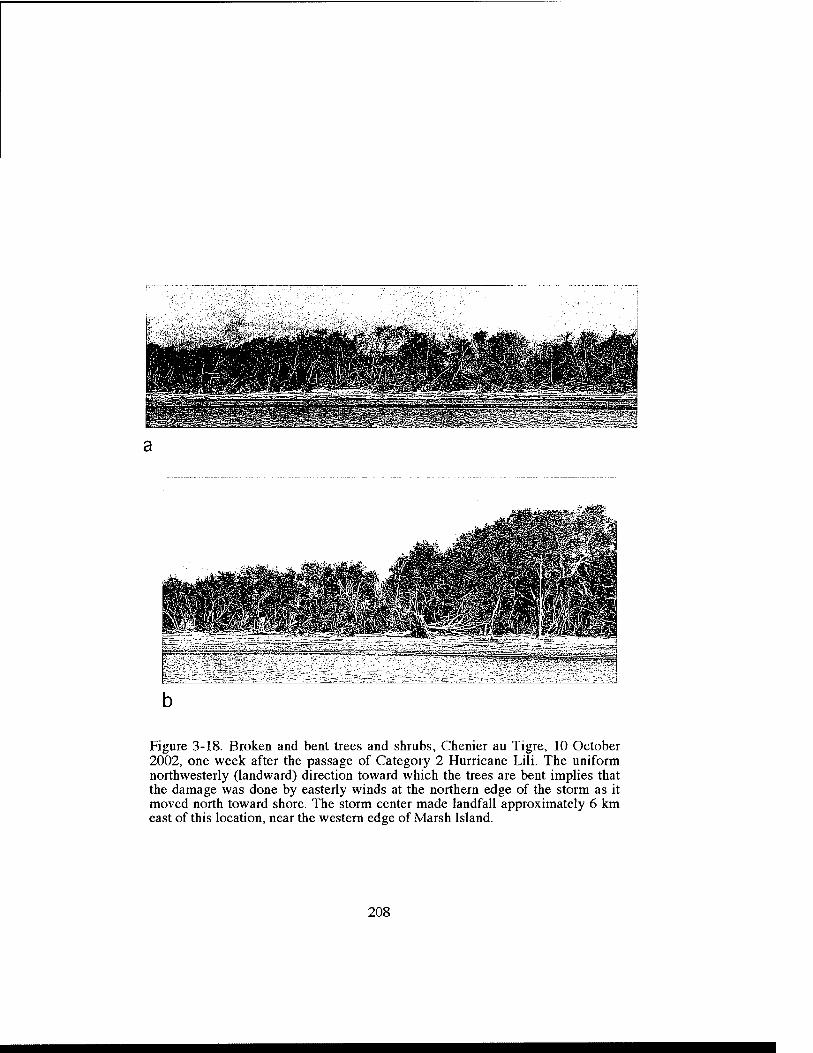
ft^.
Figure 3-18. Broken and bent trees and shrubs, Chenier au Tigre, 10 October 2002, one week after the passage of Category 2 Hurricane Lili. The uniform northwesterly (landward) direction toward which the trees are bent implies that the damage was done by easterly winds at the northern edge of the storm as it moved north toward shore. The storm center made landfall approximately 6 km east of this location, near the western edge of Marsh Island.
208
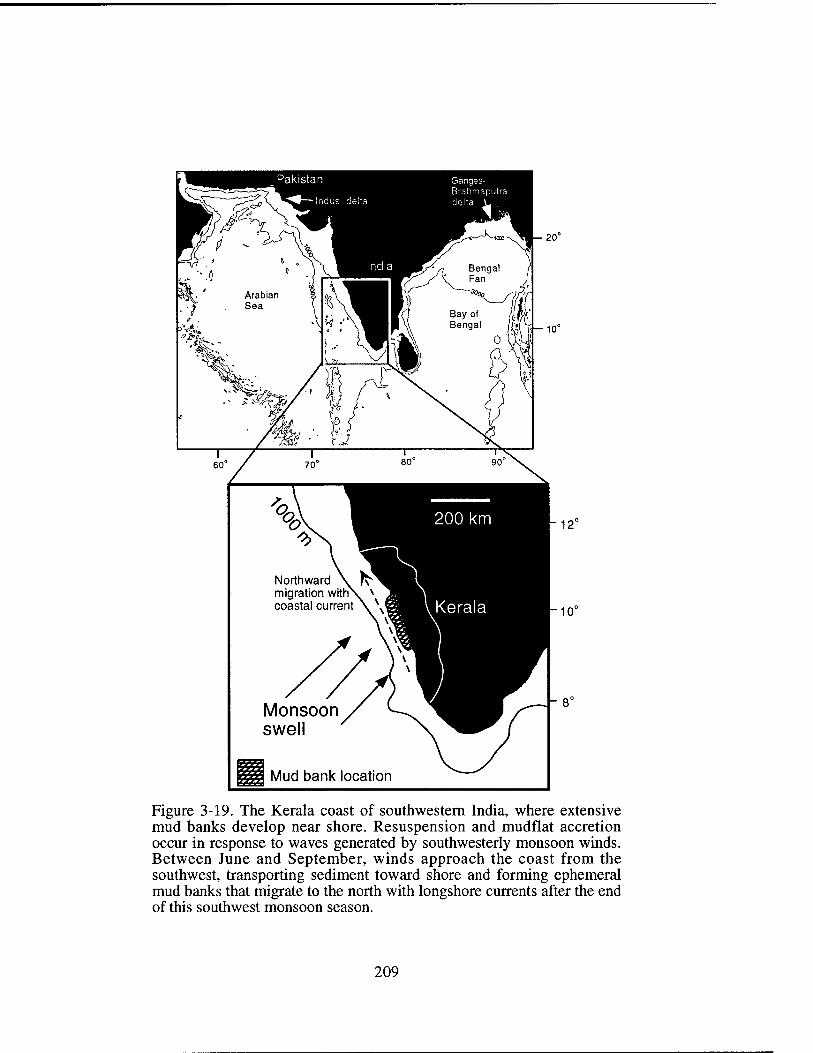
Monsoon swell
Mud bank location
Figure 3-19. The Kerala coast of southwestern India, where extensive mud banks develop near shore. Resuspension and mudflat accretion occur in response to waves generated by southwesterly monsoon winds. Between June and September, winds approach the coast from the southwest, transporting sediment toward shore and forming ephemeral mud banks that migrate to the north with longshore currents after the end of this southwest monsoon season.
209
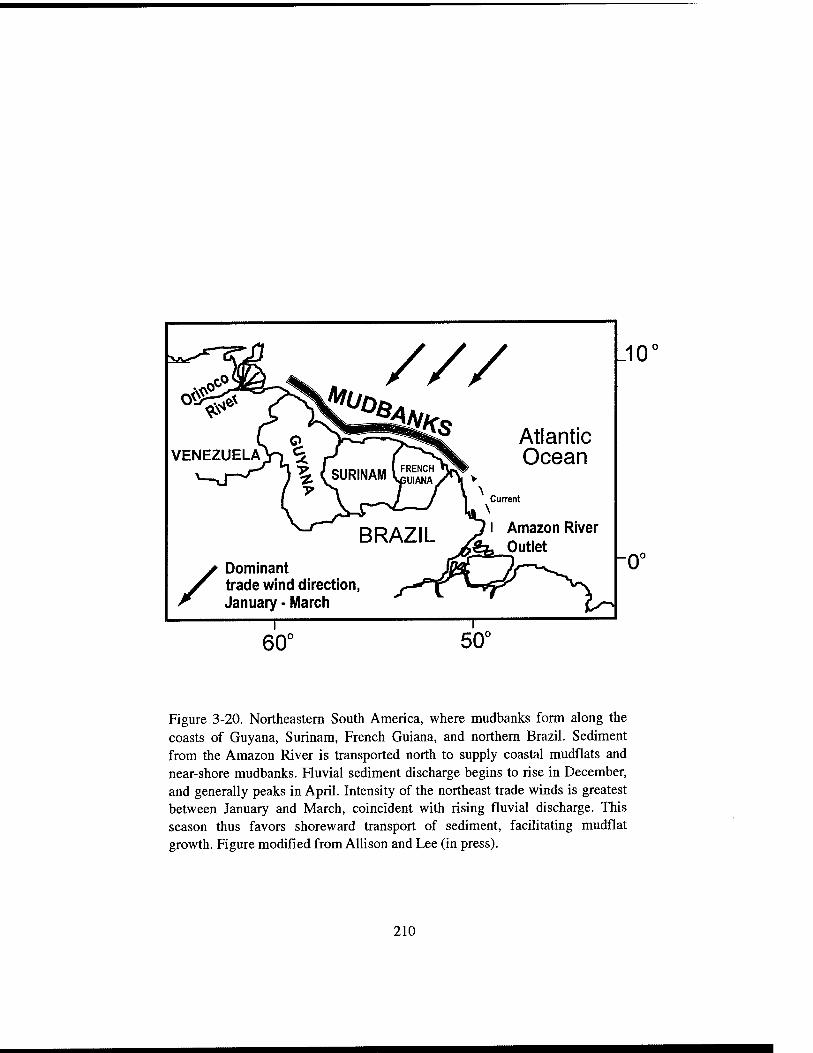
Atlantic Ocean
I Amazon River Outlet
Dominant trade wind direction, January - March
_10
0^
60°
Figure 3-20. Northeastern South America, where mudbanks form along the coasts of Guyana, Surinam, French Guiana, and northern Brazil. Sediment from the Amazon River is transported north to supply coastal mudflats and near-shore mudbanks. Fluvial sediment discharge begins to rise in December, and generally peaks in April. Intensity of the northeast trade winds is greatest between January and March, coincident with rising fluvial discharge. This season thus favors shoreward transport of sediment, facilitating mudfiat growth. Figure modified from Allison and Lee (in press).
210
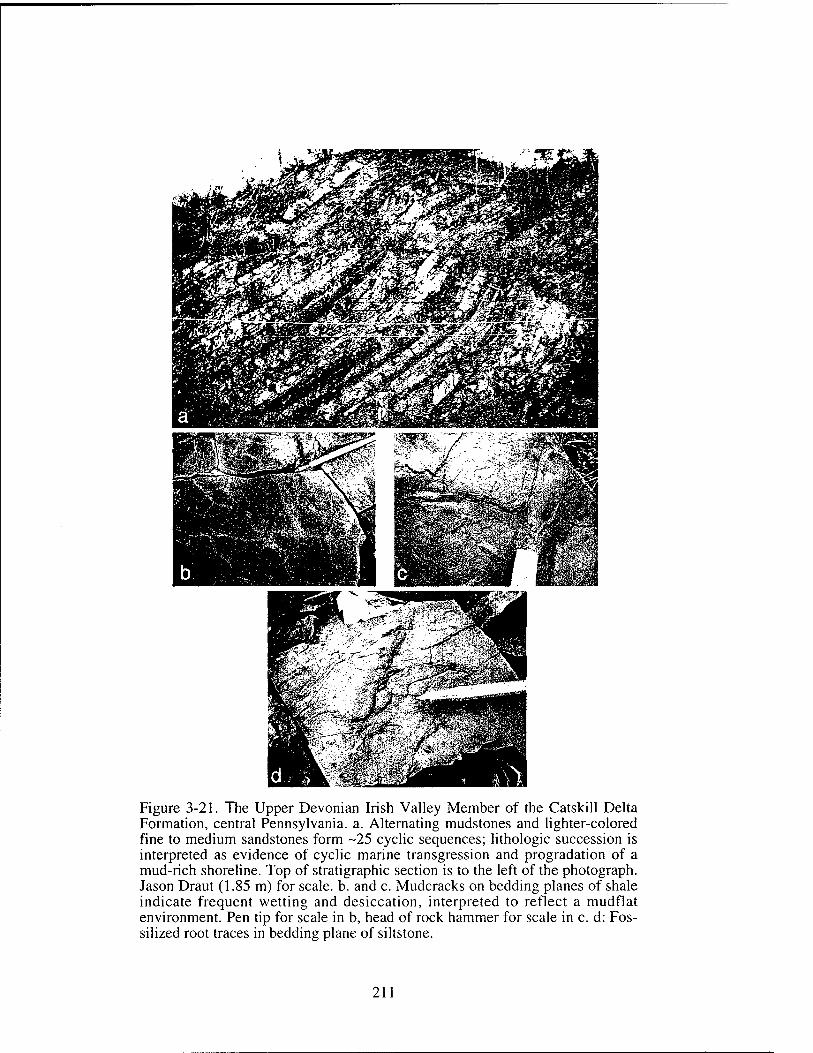
Figure 3-21. The Upper Devonian Irish Valley Member of the Catskill Delta Formation, central Pennsylvania, a. Alternating mudstones and lighter-colored fine to medium sandstones form -25 cyclic sequences; lithologic succession is interpreted as evidence of cyclic marine transgression and progradation of a mud-rich shoreline. Top of stratigraphic section is to the left of the photograph. Jason Draut (1.85 m) for scale, b. and c. Mudcracks on bedding planes of shale indicate frequent wetting and desiccation, interpreted to reflect a mudflat environment. Pen tip for scale in b, head of rock hammer for scale in c. d: Fos- silized root traces in bedding plane of siltstone.
211
Appendix 3-A. Synoptic Weather Type (SWT) Summary (modified
from MuUer and Willis, 1983):
Pacific High (PH): After passage of a cold front sourced by Pacific air, coastal Louisiana
experiences fair weather with mild, dry air and dominant NW winds entrained in cyclonic
circulation around a low pressure cell to the north.
Continental High (CH): Fair weather associated with cold, dry air and dominant N to NE
winds that accompany an Arctic high pressure. Cold air flows from the polar regions
southward toward coastal Louisiana. This category includes only the cold, fair weather
associated with the continental high pressure cell itself, and does not include the rapid
changes in wind direction that accompany the arrival of the front (see FOR).
Frontal Overrunning (FOR): This category refers to conditions associated with the arrival
of a front (boundary between cold continental. Pacific, or polar air with the warm, moist
Gulf air) over the coast. Cloudy and rainy conditions prevail with winds from the NE;
cold fronts may become stationary across the Gulf coast, and atmospheric boundary layer
waves may develop that migrate to the northeast bringing precipitation and strong NE
winds. The back (northwest) side of the front contains polar or arctic air associated with
Continental High (CH) conditions, or Pacific air associated widi a PH high pressure cell.
Coastal Return (CR): High pressure ridges may develop over the eastern U. S.
approximately parallel to the Appalachians. When the crest of such a high pressure ridge
migrates to the east of the LA coast, easterly to southeasterly winds ("return" flow of
coastal air) and fair, mild weather dominate. During winter and spring, clockwise
circulation around the high pressure region may modify cooler, drier continental or polar
air by brief passage over the Gulf or Atlantic. In late summer and fall, CR weather
patterns may include a situation called the Bermuda High, in which tropical air extends
over the southeastern US with easterly flow across the Gulf toward a high pressure ridge.
212
Gulf Return (GR): When a high pressure ridge over the eastern U. S. drifts even farther
eastward than in the CR condition, strong southerly to souflieasterly winds may bring
warm, moist, tropical air from the Caribbean Sea and Gulf of Mexico across the LA coast
in response to clockwise circulation around that high pressure region. This northward air
flow may be enhanced by the presence of developing low pressure over the Texas
Panhandle. Coastal return flow of modified continental air (as in the CR situation) is
replaced by warmer, moist, tropical air as winds shift from east to southeast to south.
Frontal Gulf Return (FGR): This situation describes Gulf Return flow affected by a cold
front approaching from the north or northwest. GR flow of warm tropical air is lifted
toward the approaching front and begins to converge with frontal (e.g., CH or PH) air.
Weather becomes stormy and turbulent, with strong southerly winds that switch rapidly
to northerly winds as the front arrives and passes over the coast. This weather type
indicates that an approaching cold front is <560 km from the weather station.
Gulf High (GH): This SWT involves a high pressure cell over the Gulf of Mexico
positioned such that SW winds flow across coastal LA. In summer months, the high
pressure cell may be the Bermuda High displaced over the Gulf, with the southwesterly
winds bringing maritime tropical air or occasionally drier and warmer continental air over
the coast. In winter and spring, the high pressure cell over the Gulf may be a polar-
derived high, in which case southwesterly winds bring modified polar air over the coast.
Gulf Tropical Dismrbance (GTD): Late spring, summer, and fall months bring "hurricane
season" to the Gulf coast, during which tropical depression systems may pass over
coastal LA in the form of severe hurricanes, tropical storms, or weaker storm systems.
These low pressure systems generate heavy precipiation and high winds. The eye of GTD
systems most commonly passes to the east of the chenier plain, bringing heavy rain to
that area but without strong winds. Less commonly, the eye of the storm makes landfall
west of the chenier plain, in which case the chenier plain experiences high southerly
winds capable of transporting sediment onshore during major flooding.
213
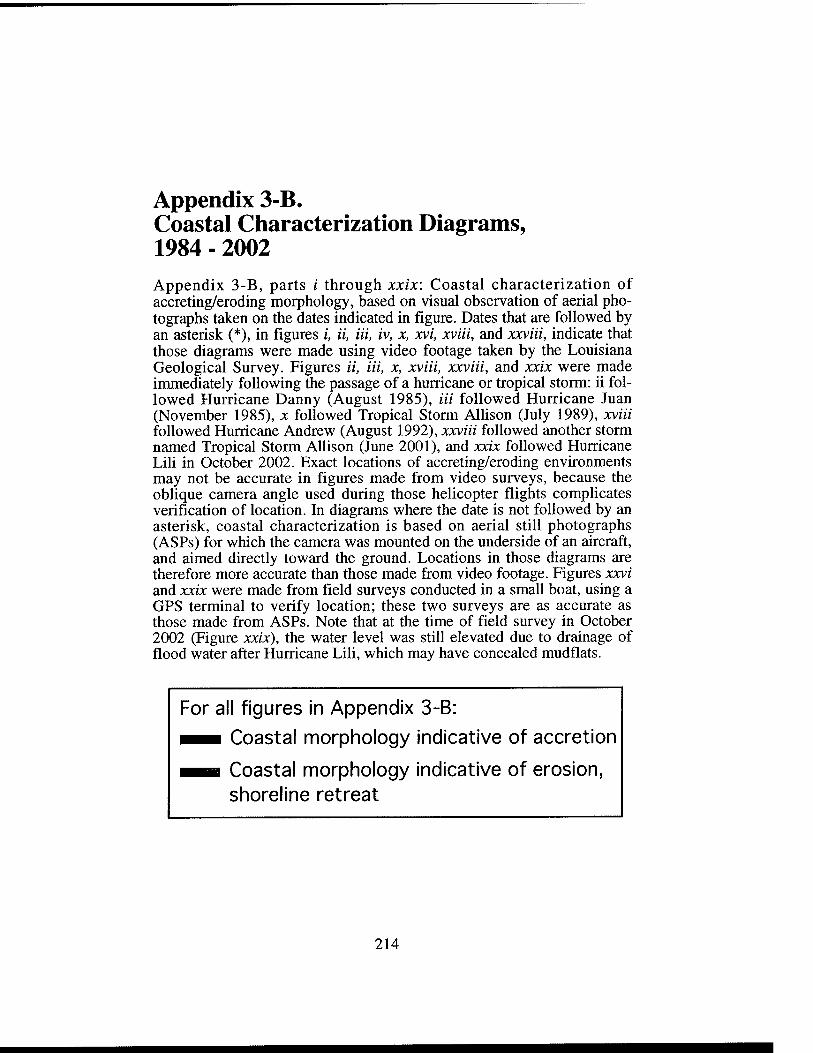
Appendix 3-B. Coastal Characterization Diagrams, 1984 - 2002 Appendix 3-B, parts i through xxix: Coastal characterization of accreting/eroding morphology, based on visual observation of aerial pho- tographs taken on the dates indicated in figure. Dates that are followed by an asterisk (*), in figures /, ii, Hi, iv, x, xvi, xviii, and xxviii, indicate that those diagrams were made using video footage taken by the Louisiana Geological Survey. Figures ii, Hi, x, xviii, xxviii, and xxix were made immediately following the passage of a hurricane or tropical storm: ii fol- lowed Hurricane Danny (August 1985), Hi followed Hurricane Juan (November 1985), x followed Tropical Storm AlHson (July 1989), xviii followed Hurricane Andrew (August 1992), xxviii followed another storm named Tropical Storm Allison (June 2001), and xxix followed Hurricane Lili in October 2002. Exact locations of accreting/eroding environments may not be accurate in figures made from video surveys, because the oblique camera angle used during those helicopter flights complicates verification of location. In diagrams where the date is not followed by an asterisk, coastal characterization is based on aerial still photographs (ASPs) for which the camera was mounted on the underside of an aircraft, and aimed directly toward the ground. Locations in those diagrams are therefore more accurate than those made from video footage. Figures xxvi and xxix were made from field surveys conducted in a small boat, using a GPS terminal to verify location; these two surveys are as accurate as those made from ASPs. Note that at the time of field survey in October 2002 (Figure xxix), the water level was still elevated due to drainage of flood water after Hurricane Lili, which may have concealed mudflats.
For all figures in Appendix 3-B:
^^ Coastal morphology indicative of accretion
i^H Coastal morphology indicative of erosion, shoreline retreat
214
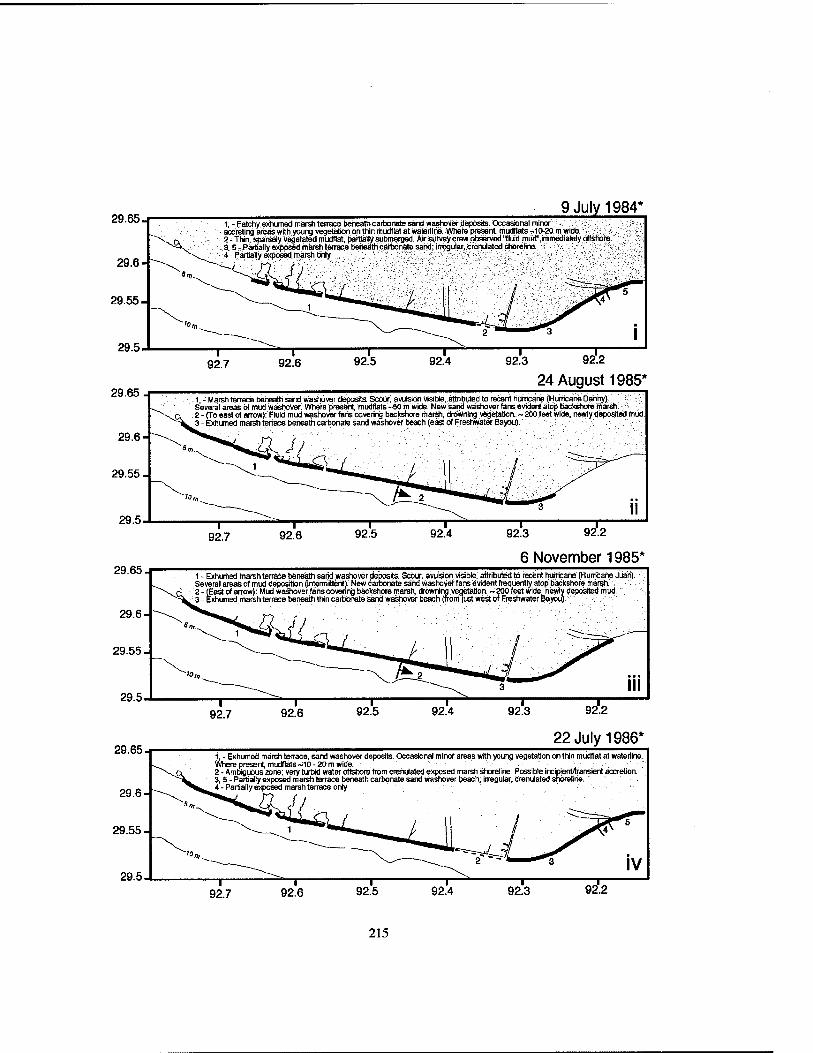
29.65.
29.6-^
29.55-
29.5.
9 July 1984*
"^:
1, - Patch/. e>dKjmed marsh tenabs behealh cartnnate sand washoVer depbats. Occasional minor accreting areas with young vegetation on thin itiudtlat at wateriine. Where present hiudllats ~lO-20 m wida
' 2 - tNn, sparsely Vegetated mijdnat. partially submerged. Air survey Qriaw observiad "fluid mud" immediately offshore :.3.5 r Fatally eiXj>3sed inarsh teitace befieithcdrtxinats sand; iiT^ula^^
■4-Partiallyexposeclmarshtxiy ;, .'.'■;:':v: >•'?■ i;Mi^^^?,■#;;>W^K;Mv V-.v^;\^v
T- 92.6 92.2
29.65 ,
—I— 92.7 92.5 92.4 92.3
24 August 1985*
29.65 -r
1, - Marsh terrace tjahaath sand washover deposits. Scour, avulsidn visible, attributed to recent hurricane (Hurricana Dahny), ; i;': •: Several areas of mud wsihoverl Where present, mudflats ^.60 th Wide. New sand washoverfans evident atop backshate itiareh: : •
: 2 - (To east of aitow): Fluid mud washover fans coveiirg becltshors liiar*, dno*riing vegetation. -200.feet wide, newly deposited mud. 3 - Exhumed marsh terrace beneath carbonate sand washover beach (e^ of Freshwater .Bayou). ^ ..;
92.7 92.6
6 November 1985*
29.65.
1 - Exhumed Inarsh terrace beneath sand washover deposits. Scour, avulsioh viable, attributed to recfent hutricahe (Hurricane Juan). Several areas of mud deposition (intemiittenl). New eaibonate sand washovef fans evident frequently atop bacicshore marsh. ; : ^ 2 - (East dt arrow): Mud waSiover fainscovienr^ backshore marsh, drowning vegetation. ~ 200 feet wide newly deposited mild. . 3 - Exhumed iiiarshtena» beneath tNn carljbfke saiid w^hover beach (frorti |ua »»e5t of Freshwater Mybu^', .
92.7 92.6
22 July 1986* 1, - Exhmied marsh terrace, sand washover depoeite. Occasional minor areas with young vegetation on thin mudflat at wateriine. Where present, mudflats ~10 - 20 m wide. . 2 - Ambiguous zone; very turbid water offshore from cienulated exposed marsh shoreline. Possible incipient/transient accretion. 3, 5 - Paitiailyexpffiied marsh terrace beneath carbonate sand washover beach; irregular, crehulated snorethe. 4 - Partially e)^osed marsh terrace only
92.7
215
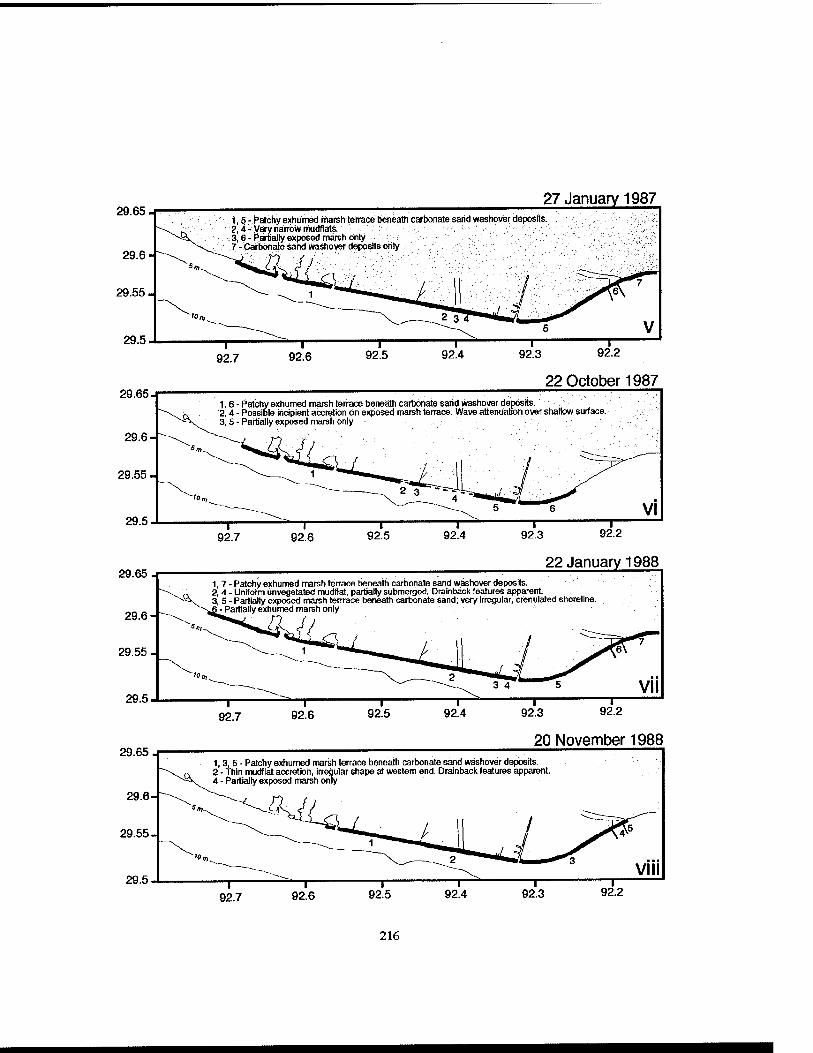
29.65 27 January 1987
29.6-
29.55-
29.5
1,5 - Patchy exhumed marsh terrace beneath cartmnate sand washover deposits. 2,4 - Very nairow nnudflats. 3, 6 - Partially exposed marsh only 7 - Carbonate sand washover deposits only
92.7
29.65-r 22 October 1987
1.6- Patchy exhumed marsh terrace beneath cartxxiate sand washover deposits. 2, 4 - Possible incipient accretion on exposed marsh terrace. Wave attenuation over stiallow surface. 3, 5 - Partially exposed marsh only
29.65,
92.3 92.2
22 January 1988
-V. 1, 7 - Patchy exhumed marsh terrace beneath carbonate sand washover deposits. 2,4 - Uniform unvegetated mudflat, partially submerged. Dralnback features apparent. 3, 5 - Partially exposed marsh tern-ace beneath carbonate sand; very irregular, crerulated shoreline.
- Partially exhumed marsh only
29.65 J-
92.3 92.2
20 November 1988 1, 3, 5 - Palchy exhumed marsh terrace beneath carbonate sand washover deposits. 2 - Thin mudflat accretloh, irregular shape at western end. Dralnback feMures apparent. 4 - Partially exposed marsh only
216
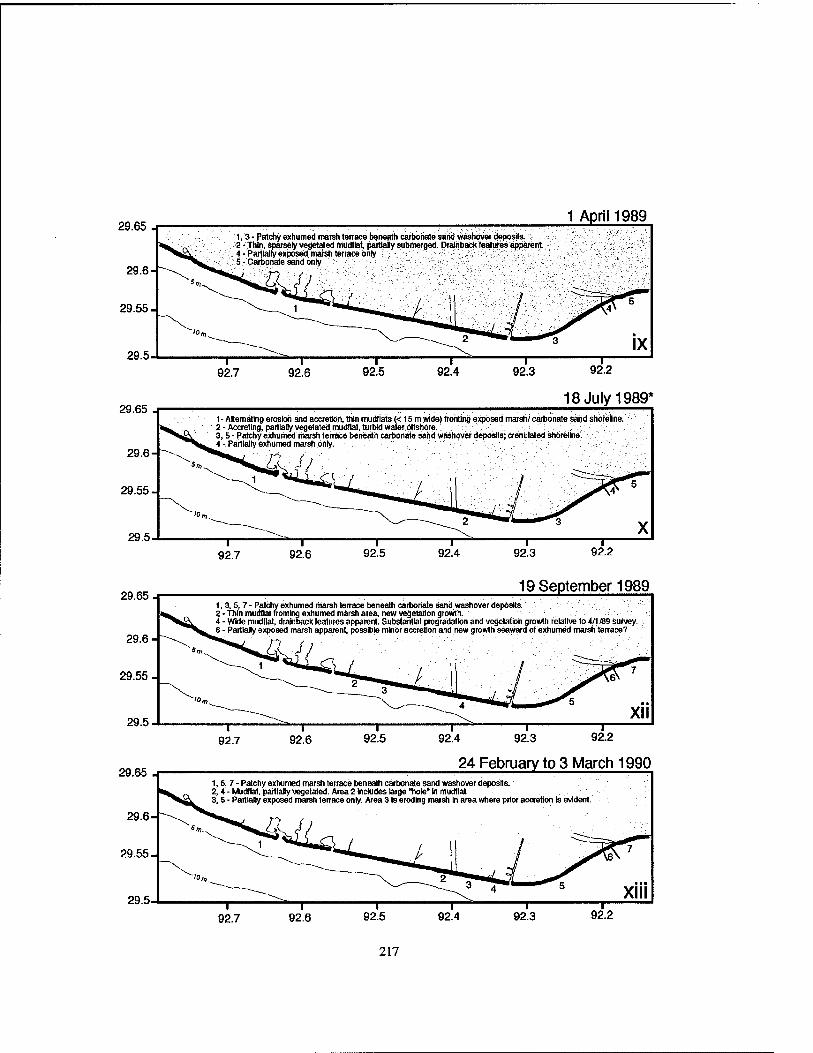
1 April1989
29.65 J- 18 July 1989*
29.65-r
1 - Altemaimg erosiori and accretion, thin mudflats (< 15 m wide) (rontirg exposed marsh/ carbonate sand shorelne. 2 - Accreting, partially vegetated mudflat, tuibid water offsliore. 3,5 - Potciiy exhuitted rnarsli terrace beneatli carbonate sand wasiiover deposits; crenuialed stioreline. 4 - Partially exhUmed marsh only.
92.3
19 September 1989
29.65
1,3,5,7 - Patchy exhumed niarsli terrace beneath carbotiaie sand washover deposits. 2 - Thin mudliat fronting exhumed marsh area, new vegetation growth. 4 - Wide mudiiat, dtainbackleatures apparent. Substantial progradalion and yegeladloh growth reiatlve to 4/1 /69 survey. 6 - Partlaily exposed marsh apparent, possible minor accretion and new growth seaward of exhurned marsh terrace?
24 February to 3 March 1990
29.6-
29.55-
29.5.
1,5,7 - Patchy exhumed nrarsh terrace beneath carbonate sand washover deposits. 2.4 - Mudllat, partlaly vegetated. Area 2 includes large Iwle'in mudtial 3.5 - Partiaiiy exposed marsh terrace only. Area 3 is eroding marsh In area where prior accretion is evident.
92.7 92.6
217
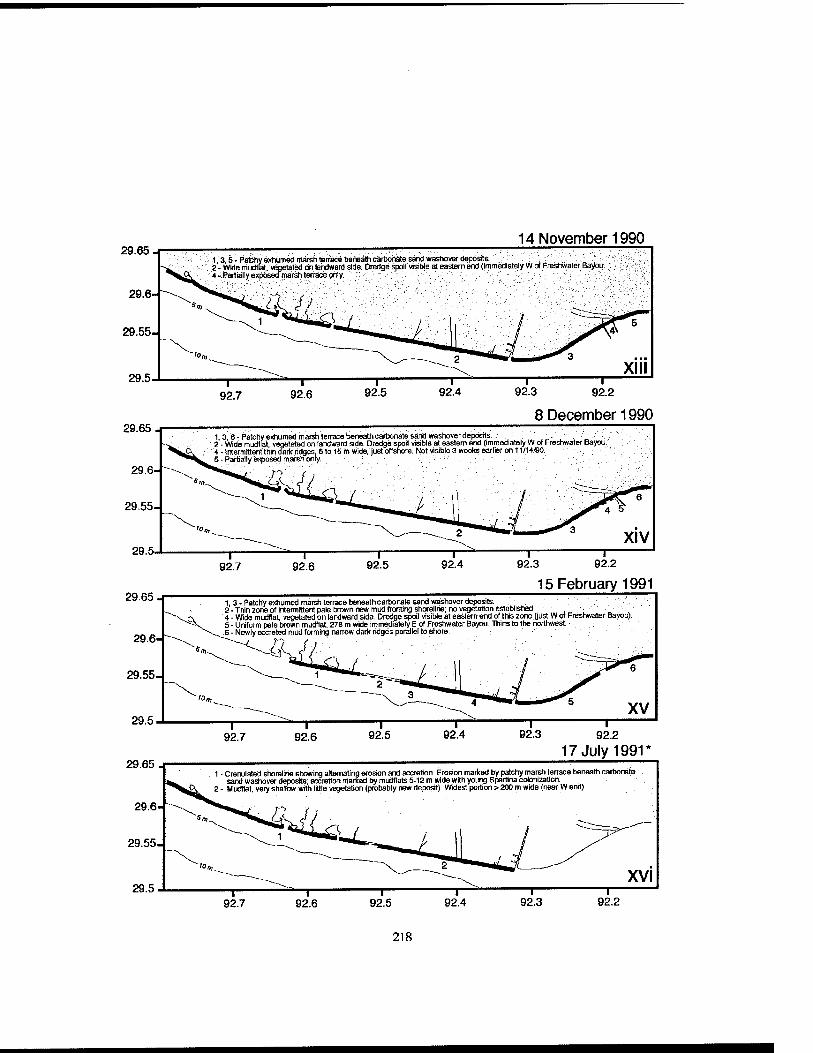
29.65 a- 14 November 1990
1:3, S-PaiShyBxhumadmSrshtBrraeebSnBalhcSrtJonaas^ :■ 'i':-''''%^''^ <:^^^'-'^' 2 - Wide riiudtlat. vegetated on landward side. Dredge spaii visible at eastern end (immediately W olFresriwater Bayou.; 4-IPartiallyexp&ed marsh teifacB only. '-:;'■; ',;!:■ ^'-'u'y/- '■■,''■■■■.'.:'::'.' \-:i::^/y ■"■/";.''?"?;!
92.3 92.2
8 December 1990 29.65 j-
1,3, 6-Patctiy exhumed marsh terrace beneaUicailxnate sand washoverdepdsKs. .^^ .;: „ 2 - Wide mudlfat vegetated on landward side. Dredge spoil visible at eastern end (inimediately W of Freshwater Bayou. 4 - Intermittent thin dartt ridges 6 to 15 rn wide, just offshore, igpt visible 3 weeks earlier on 11/14/90. 5 - Partially exposed mareh only. .-,
29.65, 15 February 1991
1, 3. Patchy exhumed marsh terrace beneath carbonate sand washover deposits. 2-Thin zone of Intermittent pale brown new mud ironting shoreline: no vegetanon established. ■ ,_ ■ „ . , 4 - Wide mudflat, vegetated on landward side. Dredge spoil visible at eaaem end of the zone Qust W of Freshwater Bayou). 5 - Uniform pale brown mudflal 278 m wide immediately E of Freshwater Bayou. TTiins to the horthvrest.
_6 - Newly accreted mud forming narrow dark ridges parallel to shore.
n
29.65,
XV r
92.2 17 July 1991
1 - Crenulated shoreline showing aJemating erosion and accretion. Erosion marked by patchy marsh terrace beneath carbonate sand washover deposits: accretion madted by mudflats 5-12 m wide with yoing Spartlna cotonizallon. .
2 - Mudflat very shallow with little vegetation (probably new deposit). Widest portion > 200 m wWe (near W end)
XVI
92.2
21B
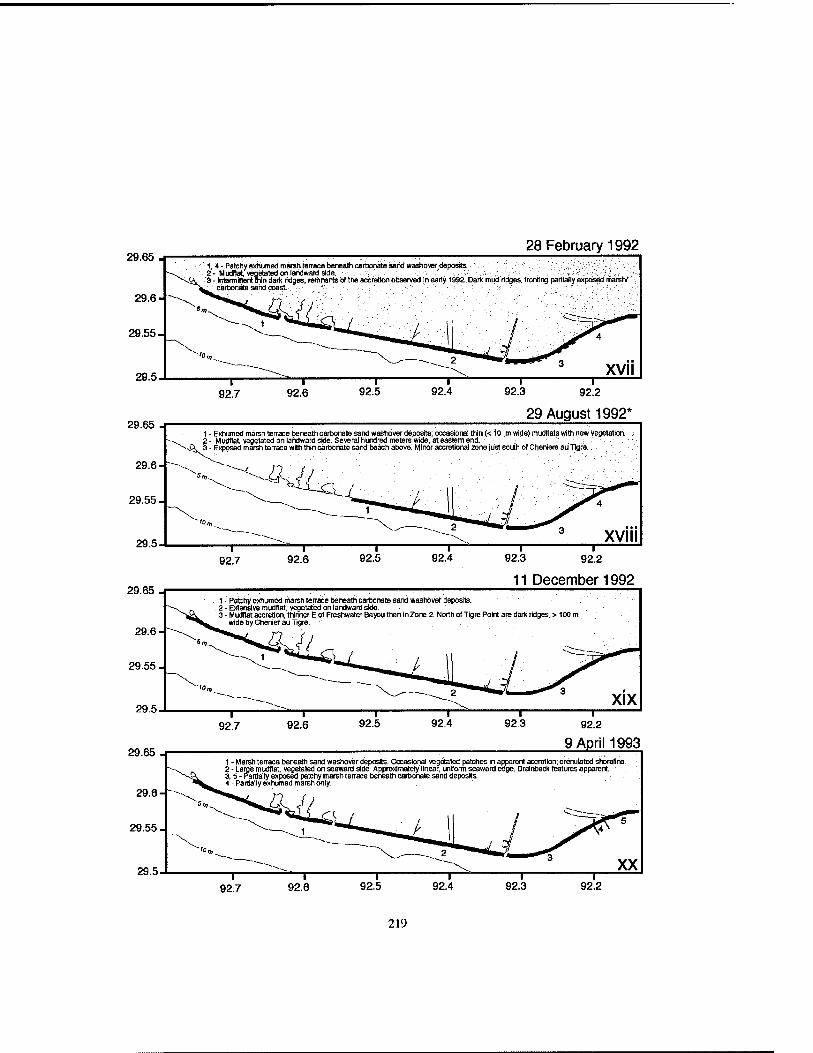
29.65 J- 28 February 1992
1, 4- Patahy(Bchumedriiarshten-aceberwathcarbonateMr^ ■' y-'W^'r■■'■■>"'■':■:■■^/■^':■-
'^ 7 IntefTniHent mjn dark rkjges, rerhrarits of the accretkxi observed in eariy 1692. Dark mud ridges, f^^ marsFV
92.7
29.65 29 August 1992*
1 - Exhumed marsh terrace beneath cartjonale sand washover deposfts; occasional thin (< 10 m wide) mudflats With new vegetation. .^ - 2 - Mudtlat, vegetated on landward side. Sewral hurdred meters wide, at eastern end. ^v(X 3-E><poEBd marsh terrace with thin carbonate sand tMach above. Minor accratlonal zone )ust south of ChenloreauTlgra.,
29.6--
29.55-
29.5.
92.7
29.65
92.3 92.2
11 December 1992
29.6-
29.55 .
1 • Patchy exhumed rtiarsh tenace beneath carbonate sand washover deposte. 2 - Extensive mudtlat, vegetated on landward side. 3 - Mudflat accretion, tMmer E of Freshwater Bayou than In Zone 2. North of TIgre Point are iafit ridges, > 100 m
wide byChenier au Tigre.
^4i^,
29.5-
29.65 .
29.8-
29.55-
29,5-
T" 92.3 92.7 92.6 92.5 92.4 92.2
9 April 1993 1 - Marsh terrace beneath sand washover deposits. Occasional vegetated patehes in apparent accretton; crenulated shoreline. 2 - Lame mixtflat, vegetated on seaward side. Approximately linear, uniform seaward edge. Drainback features appaienL 3, 5 - Partially exposed patchy marsh terrace beneath carbonate sand deposits. 4 - Partially exhumed marehonly.
92.7 92.8 92.5 92.4 92.3 —r- 92.2
219
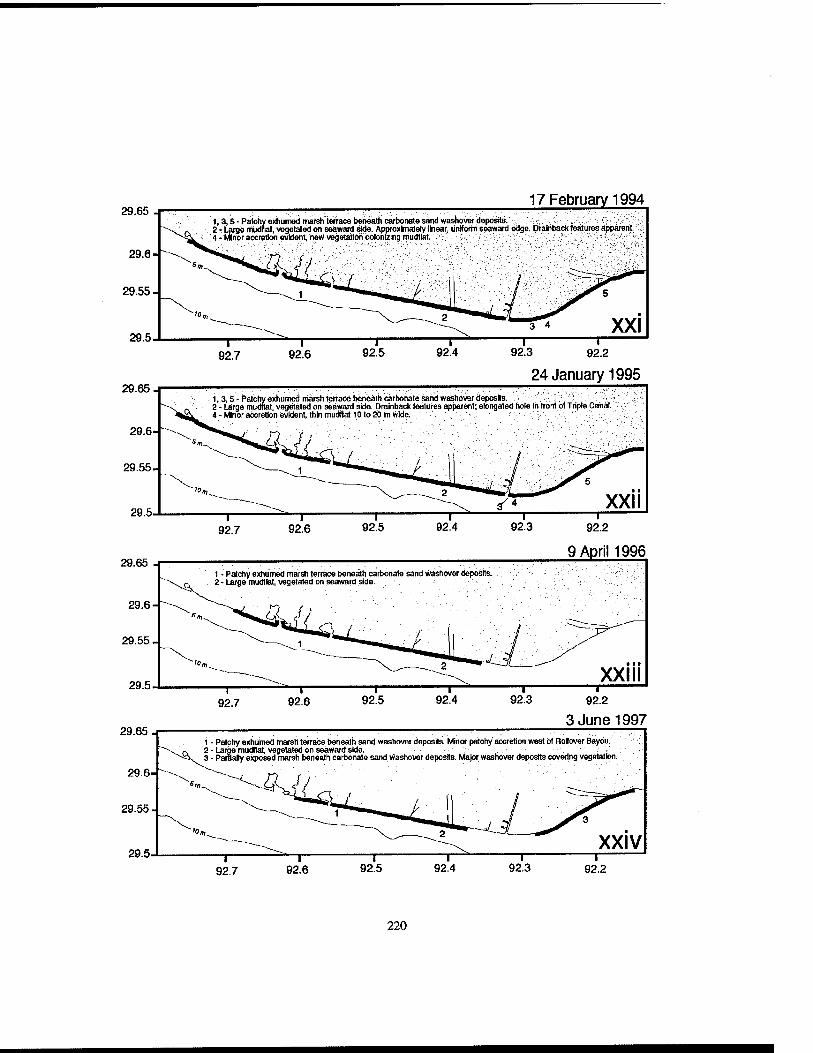
29.65 17 February 1994
1, 3,5 - Patchy exhumed marsh lecrace beneath carbonate sand washovei deposrts 2 - Large mudflat, vogetaled on seaward side. Approxtnalely linear uniform seaward edge Drawback leatuios apparent 4 - Minor accretion evident, new vegetation colon&Ing mudllat.
3 4 XXI 1
92.2
24 January 1995 29.65 _r
1,3,5 - Patchy exhumed niarsh terrace beneath carbonate sand washovcr deposls. 2 - Large mudflal, vegetated on seaward side Drainback features apparent; elongated hole in front ol Triple Canal ■ - Mhior accretion evident, thin mudflaj 10 lo 20 m wkte.
92.7
29.65 4-
29.6-
29.55.
9 April 1996 t - Patchy exhumed marsh terrace beneath carbonate sand washover deposits.
P 2 • Large mudflat, vegetated on seaward side.
29.5. XXIII
92.7 92.6
29.65-r
92.2
3 June 1997 1 - Patchy exhumed tnarsM terrace beneath sand washover deposits. Minor patchy accretion wist bf Rolover Bayou.
^ 2 - Large mudllal, Vegetated on seaward side. ~-*S^ 3 - PaiBaHy exposed marsh beneath carbonate sand washover deposits. Major washover deposits covering vegetation.
220
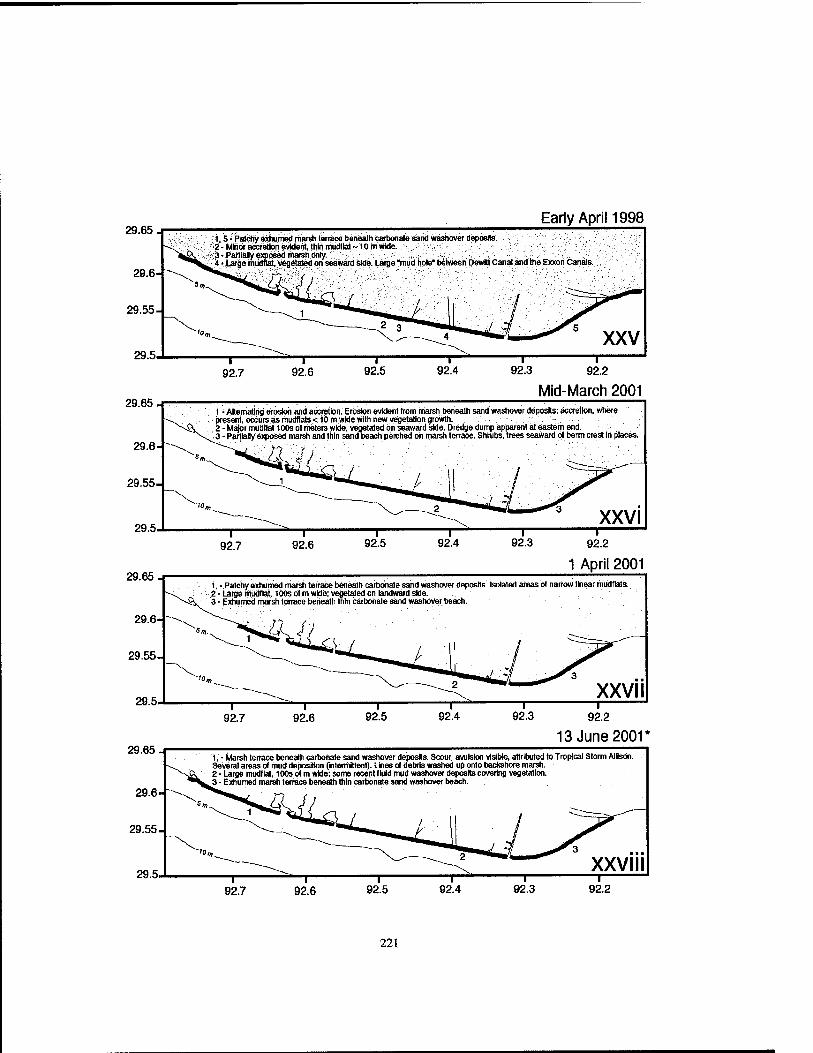
29.65 J- Early April 1998
1,5- Patchy extximed marsh teriHce beneath cartonele sand washover deposits. ■2 ■ Mho( accretion evident, thin mudllal ~ t Q m wide. 3 ■ Partiaiy eioosed marsh only. 4 • Large mudrlat, vegetated on seaward side. Urge Tnud hole' l)elween Dewlt Canal and me Exxon Canals.
29.65-r
92.2
Mid-March 2001 \ - AKematlng erosion and accretbn. Erosion evideni from marsh beiiealh sand washover deposits; accretion, wtiere present, occurs as mudflats < ib m wide with new v^etation growth. 2-Major mudJIal lOOsoi meters wide, vegetated oh seaward sMe. Dredge dump apparent at eastern end. 3 - Partially exposed marsh and thin sand beach perched oh marsh terrace. Shruljs, trees seaward of lierm ores! In places.
29.65, 1 April 2001
\c^_ 1, - Patchy exhunhed marsh terrace beneath carhonals sand washover deposits. Isolated areas of narrow linear mudflats 2 ■ Large nludllai, I dbs dt m wide; vegetated on landward side. 3 - Exhumed marsh terrace beneath tnln carbonate sand washover beach.
XXVII 92.7 92.6 92.2
13June200r 29.65,
1, - Marsh terrace beneafli carbonate sand washover deposls. Scour, avulsion visible, attributed to Tropical Storm Allbdn. Several areas of mud deposition Ontenhittenl). Lines of debris washed up onto bactehore marsh. 2 ■ Laige mudflat, 100s of m wide: some recent fluid mud washover dep<>slts coveting vegetation. '3 - Exhumed marsh terrace benetfh thin carbonate sand washover beach.
221
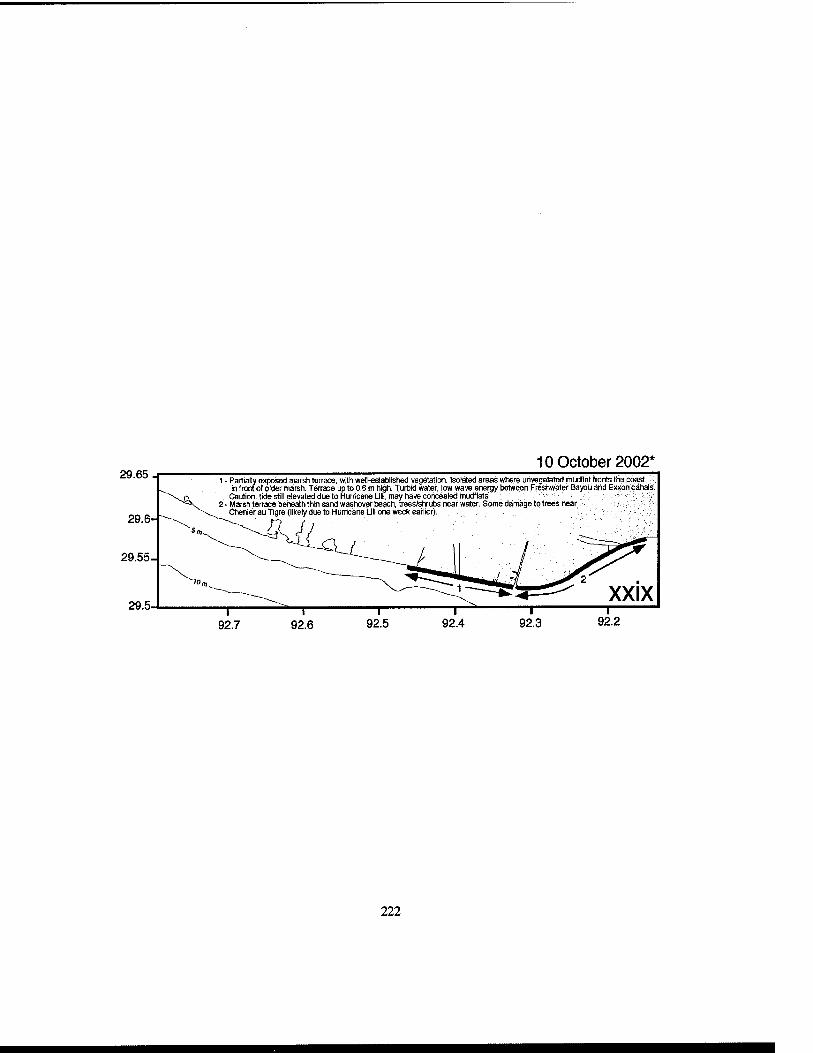
10 October 2002* 29.65 J-
29.6-
29.55-
29.5
• Partially expcsed marsh terrace, with well-eslabiished vegetatioa Isolated areas where unvegekted mudflat fronts the boast „ in front ot older marsh. Terrace up to 0.6 m high. Tuitid water, low wave energy between Freshwater Bayou Srid Exxon ddhals.
Caution: tide still elevated due to Hurricane US, may have coricealed rtiudflats. : /■,■.■:';,■ ;.:~-\:i:>,'i-.^.:!-- Marsh terrace beneath thin sand washover beach, trees/shrubs near water. Some damage to trees hear Chenier au Tigre (likely due to Hurricane Ull one week earlier).
222
Appendix 3-C. Saffir-Simpson Hurricane Intensity Scale
The Saffir-Simpson scale is a 5-part system used to categorize hurricane intensity based
upon measurements of sustained wind strength. The scale was developed in 1969 by H.
Saffir and R. Simpson (NHC, 2002).
Category One: Winds 33.1 - 42.5 m/s (118 - 152 km/hr, 74 - 95 mph, 64 - 82 kt).
Minimal damage to fixed buildings. Damage may occur to coastal structures, mobile
homes and vegetation. Some coastal road flooding. Storm surge generally 0.9-1.5 m (3-5
feet). (Actual local elevation of water level above normal levels also depends on range of
non-storm tide and astronomical tide phase). Minimum pressure less than or equal to 980
mb (normal fair-weather atmospheric pressure in the northern hemisphere is 1013.25
mb).
Category Two: Winds 42.9 - 49.2 m/s (153 - 176 km/hr, 96 - 110 mph, 83 - 95 kt)
Damage to roofing material, doors, and windows of buildings; substantial damage to
vegetation (trees may blow over), coastal structures, and unanchored buildings. Coastal
roads flood two to four hours before arrival of the storm center. Mooring lines on small
craft may break. Storm surge 1.8-2.4 m (6-8 feet), minimum pressure 981-965 mb.
Category Three: Winds 49.6 - 58.1 m/s (177 - 208 km/hr, 111-130 mph, 96-113 kt)
Some structural damage to small fixed buildings. Mobile homes destroyed. Coastal
flooding destroys small structures, larger structures may be damaged by floating debris.
Large trees blown down. Coastal flooding presents significant problems for land below a
223
1.5-m (5-foot) elevation. Coastal roads flooded three to five hours before storm center
arrives. Storm surge 2.7-3.7 m (9-12 feet), minimum pressure 964 - 945 mb.
Category Four: Winds 58.6 - 69.3 m/s (209 - 248 km/hr, 131 - 155 mph, 114 - 135 kt)
Extensive failure of buildings, extensive damage to lower floors of buildings near shore,
some complete roof failures. Coastal flooding may force evacuation of all land with
elevation <3.1 m (10 feet). Major beach erosion. Storm surge 4.0-5.5 m (13-18 feet),
pressure 944-920 mb.
Category Five: Winds above 69.3 m/s (248 km/hr, 155 mph, 135 kt)
Complete failure of roofs on many fixed buildings. Some complete building failures, with
small buildings and utility structures blown over or away. Extensive damage to lower
floors of all buildings with elevation <4.6 m (15 feet). Widespread evacuation of coastal
and inland areas required. Storm surge >5.5 (18 feet), pressure below 920 mb.
224
Chapter 4. Three-Dimensional Fades Variability of the Inner Continental Shelf: Influence of the Atchafalaya River on Stratigraphic Evolution
Abstract
The recent stratigraphic evolution of the chenier plain inner shelf has been
investigated using shallow acoustic images, radioisotope chemistry, and sedimentary
facies data. These data constrain the modem westward extent of the Atchafalaya prodelta
on the inner continental shelf, and show that accumulation of sediment from the
Atchafalaya River is ephemeral west of -QZ.SS^W. Within the prodelta boundary,
century-scale accumulation of Atchafalaya mud occurs as well-defined clinoforms
prograde seaward. Distal prodelta deposits on the eastern chenier plain shelf are
homogenized by biogenic and physical mixing processes, which largely obscure the
original stratification. Coastal mudflat accretion on the eastern chenier plain corresponds
to the area on the inner shelf in which underconsolidated Atchafalaya sediment is present.
Mass balance calculations suggest that the eastern chenier plain inner shelf and coastal
zone form a sink for 7 ± 2% of the total sediment load carried by the Atchafalaya River.
225
West of -92.55 "W, on the central chenier plain inner shelf, relict sediment is
exposed at or near the sea floor that was originally deposited between -1200 and 600
years BP during activity of the Lafourche delta lobe, the last major lobe active on the
Mississippi Delta complex prior to development of the modem (Balize) course.
Lafourche lobe activity also corresponded to a time of major coastal progradation on the
chenier plain. The coast and inner shelf of the central chenier plain currently experience
net erosion. The erosional trend may reverse in the future as the influence of Atchafalaya
sedimentation extends farther west, though this is limited by human control of the
distributary development.
4.1. Introduction and Objectives
4.1.1. Three-Dimensional Stratigraphy on the Chenier Plain Inner Shelf
Understanding the processes that control sediment dispersal from a fluvial source
entering a shallow marine environment is a first-order research problem for those who
study both modem and ancient sedimentary systems. Distribution and accumulation of
sediment on the inner continental shelf are affected by sediment supply and the
hydrodynamic regime, each of which is determined by processes that act and interact on
multiple temporal and spatial scales. Sediment supply to the inner shelf varies with
fluvial sediment load, human activity, subsidence on the delta plain, is redistributed by
channel migration (delta switching), and, on a longer time scale (10* yr), is affected by
tectonic activity in the drainage basin providing sediment. Hydrodynamic forcing
includes the influence of waves generated by episodic storms and winter cold fronts, tidal
226
cycles, fluvial outflow and associated local current variability, eustatic sea level, and
basin-scale oceanic circulation. The majority of previous studies that have examined the
influence of these factors on coastal and shallow marine sedimentation have concentrated
on sand-dominated systems, while mud-dominated near-shore environments have
relatively recently begun to receive comparable attention (see Chapter 1). The goal of this
study is to provide insight into the dispersal and reworking of fine-grained sediment on
the inner shelf, and to link patterns of inner shelf facies distribution with inferred
geomorphic evolution in the coastal and near-shore environment.
Chapters 2 and 3 discussed the distribution of coastal morphology indicative of
erosion and accretion, assessed sedimentary and stratigraphic variability of the near-shore
environment, examined decadal-scale rates of shoreline change, and evaluated the
influence of cold fronts, hurricanes and tropical storms, and dredging activity on the
Louisiana chenier plain. Knowledge gained from these prior sections of this study, used
to assess the influence of a mud-rich, unconsolidated sea bed on coastal evolution, must
be placed in the larger context of Holocene to Recent evolution of the Gulf Coast
shoreline and inner shelf. In order to resolve the relative influence exerted by energetic
events and fluvial sediment supply on shoreline evolution, and to better understand the
processes that control coastal geomorphology and near-shore sedimentation, this section
expands the characterization of the chenier plain seaward by considering along- and
across-shelf stratigraphic variations in three dimensions.
A three-dimensional investigation of the shelf seaward of the chenier plain not
only links observations of coastal geomorphic trends to inner shelf sedimentology, but
also determines the extent to which the Atchafalaya River has affected sedimentation
west of its mouth. Addressing the influence of the Atchafalaya sediment source on
227
regional stratigraphic development is fundamental to an assessment of fine-grained
fluvial sediment dispersal in this shallow marine environment.
This analysis has combined sediment coring with contemporaneous shallow
acoustic data collection landward of the 20 m isobath. The use of both methods to
characterize sedimentary facies and stratal geometry, coupled with isotopic
geochronology of sediment samples, has allowed calculation of sediment accumulation
rates, estimation of fluvial and storm influence on sediment delivery and deposition, and
the resolution of lateral and vertical facies continuity on this inner continental shelf.
4.1.2. Holocene Development of the Inner Shelf
The Mississippi River system has carried sediment to the Gulf of Mexico
continuously since Cretaceous time (e.g., Mann and Thomas, 1968), with local
depocenters migrating on annual to millennial time scales. Variations in depocenter
location within the delta complex have a first-order effect on the nature of inner shelf
sedimentation and stratigraphic development along the northern Gulf Coast, controlling
the rate and content of regional sediment supply. Quaternary development of the
Mississippi Delta complex was affected by continental glaciation and the corresponding
decrease in eustatic sea level, which reached its lowest level at approximately 18 ka
(-120 m below present; Fairbanks, 1989). During this sea-level lowstand, sediment was
delivered by the Mississippi River near the outer edge of the continental shelf while
fluvial channels incised the shelf and older deltaic deposits. After 18 ka, as Holocene sea
level gradually rose, fluvial sediment first filled alluvial valleys (-18-9 ka) and then,
after -9 ka, began to construct the delta plain now active at the Mississippi terminus (e.g..
228
Tye and Coleman, 1989; see Coleman [1988] and Saucier [1994] for a complete review
of Quaternary and Recent geomorphic development on the Mississippi Delta plain).
4.1.2.1. The Delta Cycle
On the Mississippi Delta complex, as in other deltas worldwide, loci of active
sediment deposition migrate on multiple temporal and spatial scales as river flow
occupies the most hydraulically efficient route to the sea. Since the nineteenth century,
several hundred studies have examined the processes of channel migration and delta lobe
development in the Mississippi Delta system. Classic papers on this subject include the
work of Trowbridge (1930), Fisk (1944), Kolb and Van Lopik (1958), Scruton (1960),
Coleman and Gagliano (1964, 1965), and a comprehensive review paper by Coleman
(1988).
On the greatest spatial scale, six episodes of major delta lobe construction are
identified on the Mississippi Delta complex, each occupying thousands to tens of
thousands of square kilometers (Figure 4-1). The total area of the Mississippi Delta plain
now covers more than 30,000 km^ accounting for substantial spatial overlap between the
six major lobes (e.g., Coleman, 1988; Roberts, 1997). Early radiometric dating of the
major delta lobes was undertaken by Fisk and McFarlan (1952), Brannon et al. (1957),
McFarlan (1961), and Saucier (1963). Models of delta development formed on the basis
of these dates were subsequently modified by Frazier (1967) in a classic study that used
over 500 samples from bore holes and 150 radiocarbon dates. The Frazier (1967) study
has formed the basis for nearly all general interpretations of the Mississippi Delta cycle
since its publication; it is this interpretation of the six major delta lobes that is illustrated
in Figure 4-1.
229
Although the Frazier (1967) study dealt specifically with the Mississippi Delta
complex, its findings and inferences have been widely applied to analyses of other deltaic
systems. That study showed that a new active depocenter region, on the scale of the six
major Mississippi lobes, has been initiated there every 1500 to 2000 years. Within each
of these large delta lobes are between 3 and 6 smaller sub-lobes, each of which remained
active for -200-500 years (Frazier, 1967) and occupies up to -300 km^ (e.g., Penland et
al., 1987; Roberts, 1997). On the smallest spatial scale of Mississippi River distributaries
are crevasse splays and overbank splay deposits, which form when the natural levees that
line the sub-delta channels are breached or overtopped, respectively. These local
depocenters remain active for years to decades, and each occupies an area on the order of
tens of km^ (e.g., Roberts, 1997). Since the nineteenth century, boundaries of distributary
channels on the Mississippi Delta have been controlled by artificial levee construction,
altering the natural tendency of this system to form new courses of the types described
above.
While a splay or delta lobe is active within the Mississippi Delta complex,
sediment is supplied faster than subsidence occurs, and rapid seaward progradation
results. After a depocenter is abandoned in favor of a new river course, the deposits
compact, subside, and are modified by wave action. A portion of the coarsest sediment is
reworked into barrier islands, while some coarse sand and most of the finer fraction may
be redistributed along shore by currents. Transgression occurs rapidly over the subsiding
and sediment-starved land on this coast, a process responsible for most of the rapid
wetland loss that occurs in Louisiana (e.g., Penland et al., 1990). Over much of the
Mississippi complex, such relict depocenters have been overlain by progradation of a
230
new sub-lobe hundreds or thousands of years after their initial abandonment (e.g.,
Penland and Boyd, 1981).
4.1.2.2. Vertical Stratigraphic Succession on the Delta Plain
Continual subsidence on the delta plain due to compaction of sediment and
loading of the crust, and reoccupation of earlier depocenters due to successive changes in
distributary courses, has led to vertical stacking of cyclic sedimentary sequences within
the Mississippi Delta complex. A typical vertical sedimentary section within each cycle
of this delta contains marine sediment (hemipelagic, biogenic ooze) at its base, overlain
by fine-grained distal prodelta facies (silt and clay) deposited as a delta lobe first began to
prograde over that site. Above the fine-grained prodelta sediments are coarser silts and
sands of the delta front. In turn, above this sandy material may be marsh peat and/or
floodplain sediments that accumulate landward of the zone of active deposition. Once
this particular depocenter is abandoned and the sediments subside and compact, marine
transgression may cover this entire vertical sequence with younger marine sediments. At
some later time the active river course may renew deposition in this area, and the cycle
begins again with prodelta silts and clays overlying the transgressive surface (e.g.,
Scruton, 1960; Coleman and Gagliano, 1964; Penland and Boyd, 1981; Coleman, 1988;
Van Heerden and Roberts, 1988).
Recent studies have somewhat modified the ages of major complexes and minor
sub-delta lobes determined initially by Frazier (1967), and have reinterpreted some
details of sub-lobe activity within the six major phases (e.g., Penland et al., 1987; Levin,
1991; Tomqvist et al., 1996). The absolute chronology of delta sub-lobes and the six
major complexes varies substantially between studies, which have employed different
231
sampling strategies to quantify the age of first activation in a given channel. For the
purposes of this study, recognition of the locations of previous Mississippi outflow, and
the times at which various channels in the delta complex were active, will assist
interpretation of how stratal geometry has evolved on the inner shelf.
4.1.3. Previous Sedimentary Studies on the Atchafalaya-Chenier Plain Shelf
Numerous studies have investigated the composition of sediment on the Gulf of
Mexico continental shelf. A volume compiled by Shepard et al. (1960) summarizes an
early comprehensive sedimentary study of the northwest Gulf of Mexico, conducted from
1951 to 1958 by the American Petroleum Institute. Emery (1968) placed the known
characteristics of sedimentary facies in the Gulf of Mexico into a global context,
delineating the occurrence of relict sediments worldwide. A majority of work conducted
on the northern Gulf Coast has concentrated on modem and relict delta lobes of the
Mississippi Delta plain, including the studies of delta lobe chronology discussed above.
Within the region of the shelf affected by sedimentation from the Atchafalaya River,
Thompson (1951) first identified subaqueous sediment deposits originating from the
Atchafalaya source. That study described more than 1 m of "soft, gelatinous mud" within
Atchafalaya Bay, and noted that similarly unconsolidated mud occurred seaward of the
Point au Fer shell reef (Thompson, 1951), which forms the seaward boundary of shallow
Atchafalaya Bay, shown in Figure 4-2. Following high sediment delivery during river
floods in the early 1970s, a subaerial delta forming at the mouth of the Atchafalaya River
was described by Schlemon (1975), and examined by Rouse et al. (1978) using satellite
images. Sedimentological studies were conducted on the subaerial and shallow
subaqueous Atchafalaya delta by Roberts et al. (1980), by Van Heerden and Roberts
232
(1980), and were subsequently revisited by Van Heerden and Roberts (1988). Those
investigations provided information necessary for detailed reconstruction of the annual-
scale development of subaerial portions of the delta.
Allison and Neill (2002) presented a recent analysis of sedimentary facies and
accumulation rates (using ^'°Pb geochronology) on the Atchafalaya prodelta, coupled
with seismic profiles collected with a Chirp sub-bottom seismic profiling unit. That study
covered an area from the Point au Fer shell reef seaward to a water depth of 25 m, and
westward onto the relict Maringouin-Teche delta lobes, which form the submerged
Trinity Shoal complex immediately southeast of the chenier plain (Figures 4-1 and 4-2a).
The results of the Allison and Neill (2002) study form a valuable basis for comparison
with this work.
Two further studies, conducted in conjunction with inner shelf water-column
investigations from 1997 to 2001 by Gail Kineke, quantified rates of seasonal and long-
term accumulation on the inner continental shelf west of the Atchafalaya outlet. Allison
et al. (2000a) used ^'°Pb, '^^Cs, and ^Be geochronology from sediment cores at four
sample sites (Figure 4-2a) to constrain seasonal and decadal-scale accumulation rates.
Isotope geochronology was used with organic carbon content and 5"C values to identify
the presence of a seasonal deposit left after high river discharge in the spring, and to
evaluate the degree to which sediment in that seasonal deposit was resuspended during
cold front passage. A biogeochemical study by Gordon et al. (2001) constrained patterns
of organic carbon, total nitrogen, and 6'^C within Atchafalaya sediment offshore and west
of the river mouth. A sediment budget calculated as part of the Gordon et al. (2001)
study, based on the average annual Atchafalaya sediment discharge calculated by Allison
233
et al. (2000a), estimated that 31% of the Atchafalaya River sediment was deposited
annually in the study area considered (the dashed area outlined in Figure 4-2).
The inner continental shelf seaward of the chenier plain lies between the
Atchafalaya prodelta and, to its west along the Texas shelf, an area characterized by
minor amounts of clastic sediment delivered by the Brazos and Trinity Rivers. Clastic
sediment on the Texas shelf has been found to contain a substantial biogenic (calcareous)
fraction. Several studies have described the sedimentary facies of the Texas inner shelf
west of the chenier plain. Morton and Winker (1979) used approximately 4000 samples
collected within 16 km of shore to assess the distribution of coarse clastic and biogenic
sediments on the inner shelf. Results of that study were carried further by Morton
(1981), who identified storm deposits within the sedimentary facies of this area and
correlated stratigraphic horizons representative of storm events to measured storm-
induced current conditions on the sea floor.
4.2. Methods
This study has used a combination of shallow acoustic data and core stratigraphy
to assess facies variation and stratal geometry along the inner continental shelf opposite
the chenier plain coast. Data were collected using the RA^ Eugenie during a cruise in July
2001. Figure 4-2b shows the location of transects along which the acoustic data were
obtained using a dual-frequency echo sounder, as well as the locations of core sites used
to ground-truth the shallow seismic record.
234
4.2.1. Core Collection
Cores were collected at five stations along the 10 m isobath, as indicated in Figure
4-2b. Sites were chosen at regularly spaced intervals on shore-perpendicular seismic
transects. Core locations, lengths, and conditions during collection are listed in Appendix
4-A. A kasten corer (Kuehl et al., 1985; Zangger and McCave, 1990) was deployed from
the UN Eugenie to obtain cores. Kasten corers have been widely used to collect shallow
marine sediment because they provide large quantities of sediment and cause minimal
disturbance of sediment on recovery (Zangger and McCave, 1990). The kasten corer is a
steel gravity corer with a rectangular barrel 0.15 x 0.15 m in cross section and 3 m long
(Figure 4-3). Lead weights were added to increase the depth of seafloor penetration; an
additional square weight suspended around the base of the barrel helps to keep the barrel
vertical during its descent. With all available weights used, the total weight of the kasten
corer was 310 kg. At the base of the core barrel is a core-catcher that consists of two trap
doors. When the barrel hits the sea floor and fills with sediment, levers that had held the
trap doors open are triggered by drag from the surrounding sediment to close, retaining
the sediment in the barrel.
One of the four sides of the core barrel consists of removable steel plates. After
core recovery, the barrel was laid horizontally on the deck and the plates removed to
expose sediment and allow sampling. The upper end of the core was covered and held
stationary with a steel plate to prevent deformation of sediment during sampling.
4.2.2. X-radiograph Imaging and Sub-sampling of Core Sediment
After core recovery, sediment was imaged by X-radiography. Open-ended, three-
sided Plexiglas trays each 0.5 m long were placed on the exposed sediment surface and a
235
fourth side of Plexiglas slid into place to surround the sediment in the tray without
deforming it (e.g., Kuehl et al., 1988). Neoprene-covered plastic slabs were placed
against the upper and lower surfaces of the sediment in the X-ray trays to prevent
deformation during extraction. The Plexiglas trays containing sediment were then
removed from the core barrel and X-rayed on board the ship using a Kramex model PX-
20N portable X-ray machine, set at 15mA/70keV. X-radiograph film was developed in a
laboratory on land. These negatives were digitized using a scanner with X-ray adaption
capabilities. The inclination of stratigraphic horizons visible in the X-radiographs was
used to infer the angle of core penetration (assuming horizontal strata), and sediment
depth in each core was accordingly re-calculated to true vertical stratigraphic depth.
The sediment remaining in the kasten core barrel was sampled at 0.05-m intervals,
with each interval containing 0.02 m of vertical sediment thickness. Additional samples
were collected at intermediate depths at which any facies changes were observed. Visual
descriptions and measurements (stratigraphic logs) of sediment were recorded throughout
the entire length of each core. After completion of the cruise, particle size, porosity, and
radio-isotope analyses were conducted on sediment samples.
4.2.3. Grain Size and Porosity Analyses
Grain size and porosity data were obtained from all kasten cores. Methods of
evaluating porosity and particle size in these cores are the same as those described in
Chapter 2, Section 2.2.4, for cores collected near shore. Porosity measurements were
made using 13-20 g of wet sediment; samples were dried in an oven at 50-60°C and the
subsequent dry weight measured and used to calculate porosity and bulk density.
236
Grain size analyses used 2-8 g (dry mass) of sediment per sample. Sediment was
disaggregated and homogenized using an ultrasonic probe and mechanical stirring device
to agitate a slurry of sediment in 0.1% sodium metaphosphate solution. The sand fraction
was separated using a 63 ji.m sieve, dried, and weighed. Grain size distribution within the
silt-clay fraction (<63 jam) was analyzed using the Micromeritics SediGraph 5100
particle size analyzer at the Boston College Coastal Processes Laboratory. Details of
sample preparation and the operation of this instrument may be found in Appendix 2-B
(McCave and Syvitski, 1991; Coakley and Syvitski, 1991; Micromeritics, 2001).
The sand fraction (>63 p,m) of each sample was further sieved at even ^ intervals
to determine the grain size distribution within this portion of the sediment. Observations
of sediment composition (carbonate, silicilastic, or organic material) were made using a
binocular microscope.
4.2.4. Isotope Activity Measurement
4.2.4.1. ^'"Pb and '"Cs by Gamma Analysis
Selected sediment samples were analyzed for ^'"Pb and '^^Cs activity at the
University of Rhode Island using gamma radiation detection methods similar to those
described in Chapter 2. These isotopes have been used in studies of near-shore and inner
shelf sedimentation to assess accumulation rates. ^'°Pb, a naturally occurring naturally-
occurring daughter product of ^^^U, has a half-life of 22.3 years, allowing identification of
sediment deposited within the past -100 years, or five half-lives. '^'Cs is an isotope with
a 30-year half-life produced by hydrogen bomb testing; its presence indicates that
sediment has been in contact with an atmospheric or fluvial source more recently than the
1950s, when this isotope was first introduced to the environment (e.g., Livingston and
237
Bowen, 1979; Miller and Heit, 1986). A detailed discussion of the theory behind the use
of these isotopes, and of other studies that have used them to address sedimentation rates,
is presented in Chapter 2 (Sections 2.1.3 and 2.4.4.).
Isotope activity analyses were performed by gamma counting (e.g., Gaggler et al.,
1976) on selected samples from cores OF, 01, OBC, and OMLb (Figure 4-2b). Frozen
sediment samples were dehydrated and disaggregated using a dessication chamber at the
US Geological Survey laboratory in Woods Hole, MA, and homogenized prior to gamma
counting; 8-10 g (dry weight) of sediment were analyzed in each sample. Samples were
analyzed on Canberra model GCW 3023 pure germanium well detectors for 48-96 hours
(e.g., ^'"Pb error < +/- 3%). Efficiency corrections were empirically determined using an
Analytics Co. mixed gamma standard for detector calibration (SRS#51276-399). Activity
levels of '^^Cs and ^'"Pb were measured using net counts of the 661.6 and 46.5 keV peaks
respectively; excess ^'°Pb activity was calculated from independent measurement of ^""Pb
at 352 keV (Livingston and Bowen, 1979; Joshi, 1987).
4.2.4.2. "C Age Analysis
Three samples of sediment that contained sufficient carbonate shell material were
selected for '"C age analysis. Dates obtained for these samples reflect the time at which
the organisms that constructed the shells died, and ceased to incorporate new carbonate
matter into the shell structure. The age of the shell is therefore not necessarily the age at
which the shell was deposited in its present stratigraphic position. '"C ages of shell
material are useful for establishing a maximum deposition age for sediment in and above
those shell horizons, and for indicating possible correlation (or lack of correlation)
238
between stratigraphic horizons of different cores. Organic material was not present in
sufficient quantities to permit its dating by these methods.
Three samples were chosen for '"C dating of shell material: one from the base of
core OF (at a depth of 1.56 m), one from a prominent horizon of large shells in core OBC
(at a depth of 0.51 m), and one from core OMLb at a depth of 0.41 m. The shell samples
were prepared and analyzed by Geochron Laboratories in Cambridge, MA. Shell material
was cleaned in an ultrasonic cleaner and leached thoroughly with dilute HCl to remove
any surficial impurities. The clean shells were hydrolyzed with concentrated HCl in a
vacuum chamber, and the COj gas was recovered for analysis by accelerator mass
spectrometry. The analytical error is ± 1% based on analysis of a laboratory standard with
95% of the activity of an NBS oxalic acid standard.
Ages of shell material in the three samples analyzed by the radiocarbon method
are based upon the '"C half-life of 5570 years and are reported in years referenced to the
year 1950. To adjust these ages into time before 2003, 53 years have been added to each
'"C date obtained. A further reservoir correction of 200-400 years is made for each date
to account for the incorporation of "old" carbon from surface sediment into the shells at
the time of their growth (Stuiver et al., 1986). The magnitude of this reservoir correction
is in accordance with the method of Goiii et al. (1998), and is based on rapid transition
from fluvial to marine organic carbon in surface sediment away from the mouths of the
Mississippi and Atchafalaya Rivers.
4.2.5. Shallow Acoustic Imaging: Dual-Frequency Echo Sounder
Images of the sea floor and shallow sub-bottom stratigraphy were obtained using
a Knudsen echo sounding system mounted on the /?/V Eugenie. The Knudsen 320B/P
239
dual-frequency echo sounder emits acoustic energy at 50 and 200 kHz simultaneously,
with beam widths of 6-10° and 17-31° respectively (Knudsen Engineering, 1996). The
instrument transmits ultrasonic pulses, measures the time for the echo to return from the
sea floor or subsurface impedance contrasts, and then converts the data to depth using a
uniform sound velocity of 1500 m/s. The same transducer that transmits the signal
receives the echo. The signal is then processed through a band-pass filter with its pass
band centered at the frequency transmitted. This instrument is an effective tool for
imaging the sea floor and shallow stratigraphy with penetration up to ~5 m through fine
sediment (Velasco, 2003).
A NorthstarT'^ differential GPS unit was interfaced with the echosounder during
operation, allowing simultaneous collection of location and acoustic data. During the
survey from the RA^ Eugenie in July 2001, acoustic data were obtained by this method
along 19 transects that covered a total area of approximately 680 km^ (Figure 4-2b).
Vessel speed during the survey was maintained at approximately 8 km/hr to ensure
optimal data collection.
The data for each transect were edited to remove acoustic scatter associated with
the sea surface, as well as occasional spurious points. An algorithm developed by D. W.
Velasco (Velasco, 2003) was used to isolate the sub-surface reflectors in each image with
the most distinct impedance contrast; this method selects the highest density of acoustic
return data for a given depth bin size and time interval set by the user. Reflectors selected
by this algorithm were inspected and, where necessary, smoothed manually to best
represent the subsurface stratigraphy.
240
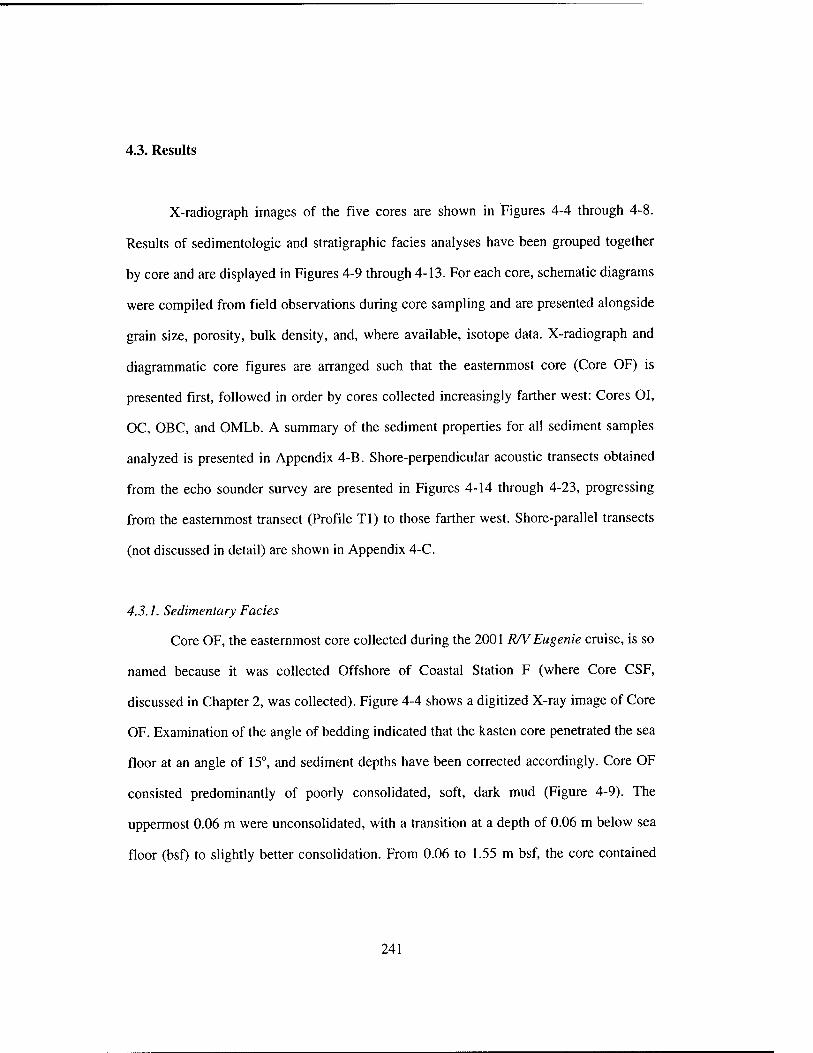
4.3. Results
X-radiograph images of the five cores are shown in Figures 4-4 through 4-8.
Results of sedimentologic and stratigraphic facies analyses have been grouped together
by core and are displayed in Figures 4-9 through 4-13. For each core, schematic diagrams
were compiled from field observations during core sampling and are presented alongside
grain size, porosity, bulk density, and, where available, isotope data. X-radiograph and
diagrammatic core figures are arranged such that the easternmost core (Core OF) is
presented first, followed in order by cores collected increasingly farther west: Cores 01,
OC, OBC, and OMLb. A summary of the sediment properties for all sediment samples
analyzed is presented in Appendix 4-B. Shore-perpendicular acoustic transects obtained
from the echo sounder survey are presented in Figures 4-14 through 4-23, progressing
from the easternmost transect (Profile Tl) to those farther west. Shore-parallel transects
(not discussed in detail) are shown in Appendix 4-C.
4.3.1. Sedimentary Facies
Core OF, the easternmost core collected during the 2001 RA^ Eugenie cruise, is so
named because it was collected Offshore of Coastal Station F (where Core CSF,
discussed in Chapter 2, was collected). Figure 4-4 shows a digitized X-ray image of Core
OF. Examination of the angle of bedding indicated that the kasten core penetrated the sea
floor at an angle of 15°, and sediment depths have been corrected accordingly. Core OF
consisted predominantly of poorly consolidated, soft, dark mud (Figure 4-9). The
uppermost 0.06 m were unconsolidated, with a transition at a depth of 0.06 m below sea
floor (bsf) to slightly better consolidation. From 0.06 to 1.55 m bsf, the core contained
241
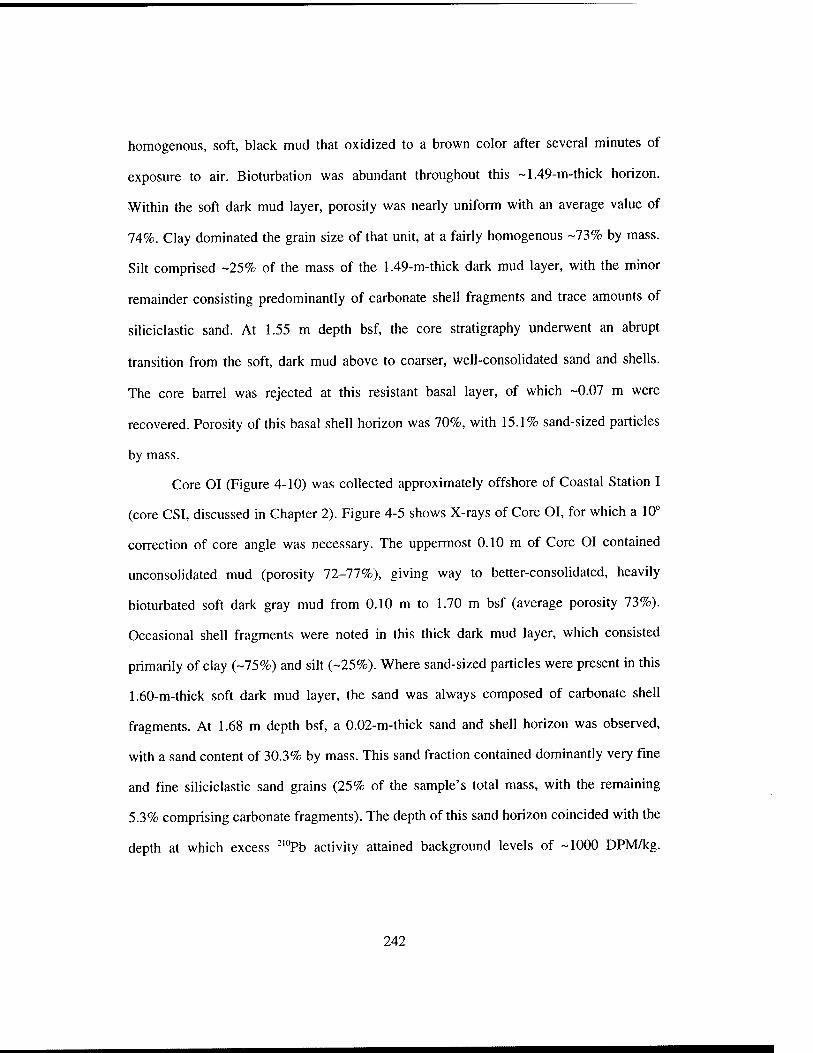
homogenous, soft, black mud that oxidized to a brown color after several minutes of
exposure to air. Bioturbation was abundant throughout this ~1.49-m-thick horizon.
Within the soft dark mud layer, porosity was nearly uniform with an average value of
74%. Clay dominated the grain size of that unit, at a fairly homogenous -73% by mass.
Silt comprised -25% of the mass of the 1.49-m-thick dark mud layer, with the minor
remainder consisting predominantly of carbonate shell fragments and trace amounts of
siliciclastic sand. At 1.55 m depth bsf, the core stratigraphy underwent an abrupt
transition from the soft, dark mud above to coarser, well-consolidated sand and shells.
The core barrel was rejected at this resistant basal layer, of which -0.07 m were
recovered. Porosity of this basal shell horizon was 70%, with 15.1% sand-sized particles
by mass.
Core OI (Figure 4-10) was collected approximately offshore of Coastal Station I
(core CSI, discussed in Chapter 2). Figure 4-5 shows X-rays of Core OI, for which a 10°
correction of core angle was necessary. The uppermost 0.10 m of Core 01 contained
unconsolidated mud (porosity 72-77%), giving way to better-consolidated, heavily
bioturbated soft dark gray mud from 0.10 m to 1.70 m bsf (average porosity 73%).
Occasional shell fragments were noted in this thick dark mud layer, which consisted
primarily of clay (-75%) and silt (-25%). Where sand-sized particles were present in this
1.60-m-thick soft dark mud layer, the sand was always composed of carbonate shell
fragments. At 1.68 m depth bsf, a 0.02-m-thick sand and shell horizon was observed,
with a sand content of 30.3% by mass. This sand fraction contained dominantly very fine
and fine siliciclastic sand grains (25% of the sample's total mass, with the remaining
5.3% comprising carbonate fragments). The depth of this sand horizon coincided with the
depth at which excess ^'"Pb activity attained background levels of -1000 DPM/kg.
242
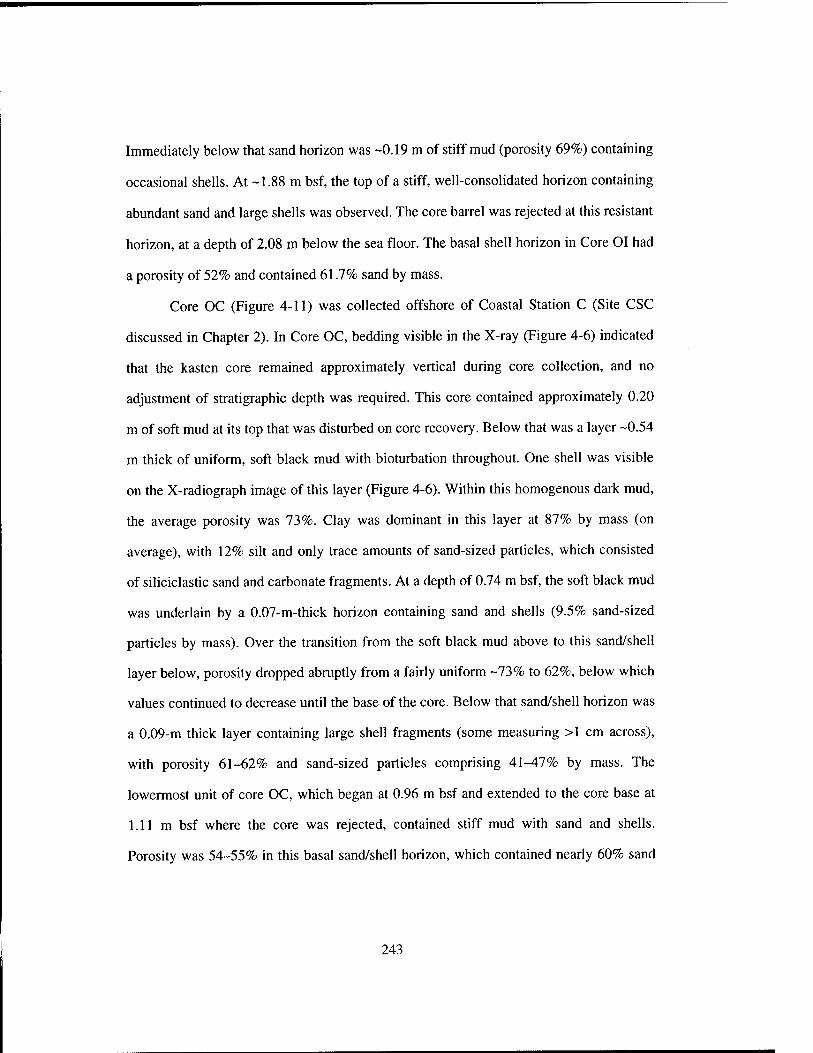
Immediately below that sand horizon was -0.19 m of stiff mud (porosity 69%) containing
occasional shells. At -1.88 m bsf, the top of a stiff, well-consolidated horizon containing
abundant sand and large shells was observed. The core barrel was rejected at this resistant
horizon, at a depth of 2.08 m below the sea floor. The basal shell horizon in Core 01 had
a porosity of 52% and contained 61.7% sand by mass.
Core OC (Figure 4-11) was collected offshore of Coastal Station C (Site CSC
discussed in Chapter 2). In Core OC, bedding visible in the X-ray (Figure 4-6) indicated
that the kasten core remained approximately vertical during core collection, and no
adjustment of stratigraphic depth was required. This core contained approximately 0.20
m of soft mud at its top that was disturbed on core recovery. Below that was a layer -0.54
m thick of uniform, soft black mud with bioturbation throughout. One shell was visible
on the X-radiograph image of this layer (Figure 4-6). Within this homogenous dark mud,
the average porosity was 73%. Clay was dominant in this layer at 87% by mass (on
average), with 12% silt and only trace amounts of sand-sized particles, which consisted
of siliciclastic sand and carbonate fragments. At a depth of 0.74 m bsf, the soft black mud
was underiain by a 0.07-m-thick horizon containing sand and shells (9.5% sand-sized
particles by mass). Over the transition from the soft black mud above to this sand/shell
layer below, porosity dropped abruptly from a fairly uniform -73% to 62%, below which
values continued to decrease until the base of the core. Below that sand/shell horizon was
a 0.09-m thick layer containing large shell fragments (some measuring >1 cm across),
with porosity 61-62% and sand-sized particles comprising A\-A1% by mass. The
lowermost unit of core OC, which began at 0.96 m bsf and extended to the core base at
1.11 m bsf where the core was rejected, contained stiff mud with sand and shells.
Porosity was 54-55% in this basal sand/shell horizon, which contained neariy 60% sand
243
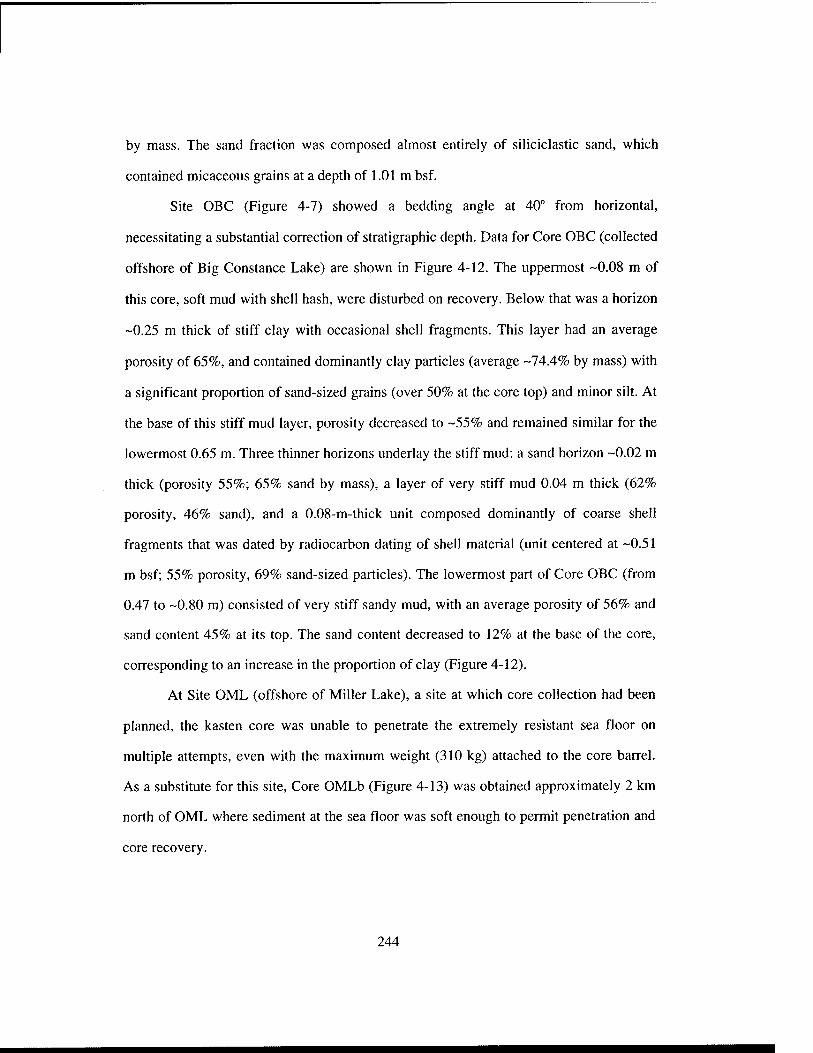
by mass. The sand fraction was composed almost entirely of siliciclastic sand, which
contained micaceous grains at a depth of 1.01 m bsf.
Site OBC (Figure 4-7) showed a bedding angle at 40° from horizontal,
necessitating a substantial correction of stratigraphic depth. Data for Core OBC (collected
offshore of Big Constance Lake) are shown in Figure 4-12. The uppermost -0.08 m of
this core, soft mud with shell hash, were disturbed on recovery. Below that was a horizon
-0.25 m thick of stiff clay with occasional shell fragments. This layer had an average
porosity of 65%, and contained dominantly clay particles (average -74.4% by mass) with
a significant proportion of sand-sized grains (over 50% at the core top) and minor silt. At
the base of this stiff mud layer, porosity decreased to -55% and remained similar for the
lowermost 0.65 m. Three thinner horizons underlay the stiff mud: a sand horizon -0.02 m
thick (porosity 55%; 65% sand by mass), a layer of very stiff mud 0.04 m thick (62%
porosity, 46% sand), and a 0.08-m-thick unit composed dominantly of coarse shell
fragments that was dated by radiocarbon dating of shell material (unit centered at -0.51
m bsf; 55% porosity, 69% sand-sized particles). The lowermost part of Core OBC (from
0.47 to -0.80 m) consisted of very stiff sandy mud, with an average porosity of 56% and
sand content 45% at its top. The sand content decreased to 12% at the base of the core,
corresponding to an increase in the proportion of clay (Figure 4-12).
At Site OML (offshore of Miller Lake), a site at which core collection had been
planned, the kasten core was unable to penetrate the extremely resistant sea floor on
multiple attempts, even with the maximum weight (310 kg) attached to the core barrel.
As a substitute for this site. Core OMLb (Figure 4-13) was obtained approximately 2 km
north of OML where sediment at the sea floor was soft enough to permit penetration and
core recovery.
244
X-radiographs from Core OMLb are shown in Figure 4-8; bedding from this
image indicates that the core barrel penetrated at a 29° angle, and sediment depths were
corrected accordingly. The resistant sediment in this core could not be collected in
Plexiglas X-ray trays in the usual manner (placing the three-sided tray on the core
surface, then sliding the fourth side into place to avoid disturbing the sediment), but had
to be cut into blocks with a knife and the blocks placed into the Plexiglas X-ray trays.
This treatment of the sediment as discrete blocks is apparent in the image shown in
Figure 4-8. The uppermost 0.08 m of this core consisted of stiff mud with small shell
fragments (porosity averaged 67% in the top 0.08 m; Figure 4-13). From a depth of
0.08-0.46 m bsf, the core contained fairly well-consolidated mud (average porosity 67%,
average clay content 84.4%, with 12.5% silt and minor carbonate sand). On the X-
radiograph (Figure 4-8), this horizon can be seen to contain sub-centimeter-scale planar
bedding that was not apparent during core dissection. At a depth of 0.41 m bsf, a thin
(0.01-m-thick) sand and shell horizon occurred. Below that, the remaining 0.91 m of the
core contained very stiff mud with the consistency of modeling clay (porosity 63% on
average, but locally as low as -52%; average 64% clay, 34% silt, with minor carbonate
sand). Within this stiff basal mud layer, the upper section (from a depth of -0.50 to 0.62
m bsf) contained planar bedding, with the thickness of individual laminae on the order of
millimeters to centimeters visible in the X-radiograph (Figure 4-8).
4.3.2. Results of Isotopic Analyses
Activity levels of ^'"Pb and '"Cs are shown in the composite diagrams for Cores
OF, 01, OBC, and OMLb in Figures 4-9, 4-10, 4-12, and 4-13. Red arrows on the plots
for Cores OF, OBC, and OMLB (Figures 4-9, 4-12, and 4-13) indicate the depths at
245
which '''C ages were obtained. Ages are listed beneath the appropriate diagram in each
figure, and in Table 4-1.
4.3.2.1. ^'°Pb and '^^Cs Activity
Cores OF and 01 (Figures 4-9 and 4-10) displayed appreciable excess ^'°Pb
activity in the uppermost sediment of each core. At Site OF, excess ^'°Pb reached a
uniform "background" level (-1000 DPM/kg) at a depth of approximately 0.55 m bsf. No
apparent sedimentary transition accompanied the isotopic transition to background
activity level. The magnitude of this background (supported) ^'"Pb level is consistent with
that observed in relict fine-grained sediment on the inner Texas shelf (Holmes, 1985).
Heterogeneous values of ^'"Pb were detected in the upper 0.15-0.20 m of Core OF. '^'Cs
was present only in very small quantities (near the lower detection limit) in the upper
0.15 m sediment of Core OF. At Site 01 the pattern of decreasing excess ^'°Pb activity
was not regular, but background levels of 1000 DPM/kg occurred below a depth of ~1.60
m bsf. The top 0.10 m of Core OI showed heterogeneous, irregular ^'°Pb activity. '^^Cs
displayed an irregular pattern compared to that expected in undisturbed shallow marine
sediment (see Figure 2-20). '"Cs activity was detected in the upper 0.30 m of Core OI,
then decreased to zero just above 0.40 m depth bsf. A second peak in '^'Cs activity was
detected between depths of 0.95 and 1.30 m bsf in Core OI (Figure 4-10).
The two western cores for which ^'°Pb and '"Cs data were obtained, OBC, and
OMLb, showed low activity of excess ^'°Pb and '"Cs throughout the core. The uppermost
-0.07 m of Core OBC (Figure 4-12) contained nonzero, heterogeneous activity of both
isotopes. Below that depth in Core OBC, excess ^'°Pb and '"Cs displayed activity near
zero, with a minor peak in '"Cs at -0.45 m and a minor peak in excess ^'°Pb centered at
246
-0.50 m depth bsf, though ^'°Pb activity in that "peak" was still below 1000 DPM/kg, the
background levels of excess ^^^h in Cores OF and 01. Core OMLb (Figure 4-13) showed
heterogeneity of both isotopes in its uppermost -0.12 m; below that, '"Cs was not
detected, and excess ^'°Pb remained at background levels of -1000 DPM/kg, similar to
background levels observed in Cores OF and 01.
4.3.2.2. '"C Dating of Shell Material
Table 4-1 shows ages of shell material obtained at selected horizons in Cores OF,
OBC, and OMLb. The basal shell horizon in Core OF (from a sample depth centered at
1.56 m) yielded an age of 730-930 years BP, after reservoir correction (Gofii et al.,
1998). A shell layer in Core OBC that spans -0.49-0.51 m depth below sea floor yielded
an age of 1260-1460 years BP after reservoir adjustment, and a shell horizon in Core
OMLb (0.41 m depth bsf) yielded a similarly corrected age of 1110-1310 years BP.
In summary, surface sediment in the eastern part of the study area (Cores OF and
OL collected offshore of the eastern chenier plain) was dominated by a layer of soft, dark,
bioturbated mud. This unit showed very homogenous porosity and grain size distribution.
The homogenous mud layer was present, though thinner and with overall finer grain size,
at Site OC. Core OC was the geographically central of the five cores, collected nearly
adjacent to the transition between the eastern and central chenier plain coastal
environments. In Cores OF, OI, and OC, the homogenous soft mud layer was underlain
by a resistant basal horizon of lower porosity and much coarser grain size (sand and
shells). Activity levels of excess ^'°Pb were high within this unit at Sites OF and 01 and
gradually decreased down-core to background levels, while activity levels of '"Cs were
247
near zero except for a local peak below 1 m bsf at Site OI. Below this soft, dark mud unit
in Cores OF and 01, ^'°Pb was present at background levels and '^^Cs was absent. This
dark mud horizon was not present in the western part of the study area (Cores OBC and
OMLb). Those two cores, offshore of the central chenier plain, displayed extreme facies
heterogeneity, with individual stratigraphic units 0.01-0.10 m thick showing a variety of
sediment composition and grain size. Porosity of sediment collected opposite the central
chenier plain was in general lower than that in the eastern cores. At Site OMLb, the
sediment was sufficiently stiff and resistant to hinder sample collection. Sediment at Site
OMLb displayed sub-centimeter parallel laminae; these bedding features were observed
only at Site OMLb.
4.3.3. Shallow Acoustic Transects
Figures showing acoustic data from shore-parallel (even-numbered) transects are
included in Appendix 4-C. The shore-perpendicular transects (Tl, T3, T5, T7, T9, Til,
T13, T15, T17, and T19) are shown in Figure 4-14 through 4-23, as these are the most
informative of variability in cross-shore stratigraphic geometry.
The easternmost shore-perpendicular transect. Profile Tl, revealed bedding that
dipped gently seaward (Figure 4-14). The deepest sub-bottom penetration in Transect Tl
is approximately 1.7 m, where the stratigraphy resolved by the echo sounder is truncated
by a strong reflector in the low-frequency (50 kHz) depth return signal. Core OF was
collected ~11.5 km offshore along Transect Tl. The strong lowermost reflector apparent
in the Tl acoustic data coincides with the depth at which a basal sand/shell layer first
appeared in Core OF, below the homogenous soft dark mud that dominated the
sedimentary facies at that site (Figure 4-9). Shell material from this horizon yielded a
248
date of 730-930 years BP (Table 4-1). The shoreward portion of Transect Tl shows a
disturbed sea bed.
Profile T3, a shore-perpendicular transect approximately 10 km west of Tl, shows
a stratal geometry noticeably different from that seen in Transect Tl (Figure 4-15).
Although there is a -1.5 km data gap in Transect T3 that was caused by a defective data
disk, it is clear that the bedding forms sigmoidal clinoforms that dip seaward more
steeply than the bedding in Profile Tl. This sedimentary package is 5 m thick at the
thickest portion detected by the low frequency depth return signal. Individual beds appear
to pinch out toward the landward and seaward ends of the transect, as the lowermost
reflector converges with the sea floor. Sea-floor geometry is convex in the cross-shore
direction.
In Transect T7 (Figure 4-17), no clinoforms are visible; the general sea floor
geometry suggests a convex shape, similar to that of the sea floor seen in T3. Some
bedding is apparent in the low-frequency reflectors of Profile T7. Core 01, collected
approximately 13.5 km offshore along Profile T7, contains a basal shell horizon at a
depth of 1.88 m bsf that approximately coincides with the depth of the deepest reflector
in Transect T7 beneath Site 01.
Profile Til, located approximately 20 km west of (and parallel to) Profile T7,
reveals bedding at its landward end that appears to pinch out seaward (Figure 4-19). Core
OC was collected -9.5 km offshore along Tl 1. Beneath Site OC in the acoustic data, a
sub-bottom reflector occurs approximately 0.8 m below the sea floor. This coincides
approximately with the depth within Core OC at which a transition occurred between
soft, black mud and coarser sand-and-shell facies with lower porosity than the soft mud
249
above (0.74 m bsf). The sea floor geometry in Profile Tl 1 is broadly concave, in contrast
to the convex profiles seen in transects to the east.
All transects west of Profile Til display a similar stratal geometry to that shown
in Tl 1, with reflectors present at the landward end of each transect that are truncated by
intersection with the sea floor as they extend offshore; the sea floor dips seaward more
steeply than the bedding horizons. Transects Til through T19 all show sea floor
geometry that is concave, rather than convex. Profile T15 (shown in Figure 4-21) shows
one dominant reflector that is located -0.3-0.4 m below the sea floor at Site OBC. This is
approximately the same depth at which the sediment of Core OBC undergoes a
downward transition from clay to lower-porosity, coarser facies. Within a horizon 0.5 m
below the sea floor in Core OBC (-0.1 m below the deepest reflector of Profile T15),
shell material yielded a radiocarbon age of 1260-1460 years BP (Table 4-1).
The westernmost transect, T19, is shown in Figure 4-23. The sea floor is concave
in the cross-shore direction. Two sub-bottom reflectors are visible, which are truncated
by the seafloor. Core OMLb was collected - 6.5 km offshore along T19. A reflector at
-0.4-0.5 m bsf at Site OMLb approximately coincided with the depth of a sand and shell
horizon (0.41 m bsf) that yielded a radiocarbon age of 1110-1310 years BP.
250
4.4. Discussion
4.4.1. Modern Sediment Accumulation: Influence of the Atchafalaya River Sediment
Source on Inner Shelf Stratigraphy in the Chenier Plain Area
Sedimentary facies, radioisotope activity, and stratal geometry inferred from
shallow acoustic data constrain the degree to which the Atchafalaya River affects
sedimentation on the inner shelf seaward of the chenier plain. The following section
examines variability in the thickness of the isotopic surface mixed layer (SML) in cores,
decadal-scale accumulation rates calculated from ^"*Pb profiles, identifies the western
extent of the Atchafalaya prodelta evident in these data, and defines the regional
significance of deposition on the chenier plain shelf.
4.4.1.1. The Surface Mixed Layer
A typical modem sedimentary ^"*Pb profile will contain a zone of uniform activity
at its top (see Figure 2-5). This is interpreted as a surface mixed layer (SML), which is
continually homogenized by physical and biological mixing processes, causing its
uniform isotopic profile (Nittrouer et al., 1979). As sediment accumulates over time, the
region of sediment affected by mixing migrates upward, gradually displacing sediment
from the base of the surface mixed layer and into a lower zone where radioactive decay
dominates (Nittrouer et al., 1979). If waves and currents resuspend sediment and carry
most of it away from the site of its original deposition, the zone of radioactive decay may
be thin or absent; if it is absent, the SML may sit directly above relict sediment with
isotopic activity at supported levels. The base of the SML thus represents the present
251
time, while sediment beneath the SML no longer has contact with modem input of excess
On the western Louisiana inner shelf, as in other areas, initial deposition of
surface sediment does not always lead to long-term accumulation but may be followed by
resuspension and transport of sediment away from the source. Substantial transient
sedimentation may occur due to high sediment delivery during spring flood discharge
from the Atchafalaya River. A seasonal flood deposit has been previously identified on
the chenier plain shelf by its characteristic terrestrial organic carbon content and 6''C
character, and by its 'Be-enriched isotopic signature, indicative of recent fluvial sediment
(Allison et al., 2000a). In cores examined during this study, the absence of'Be in surface
sediment precludes positive identification of a fresh seasonal flood deposit, but the
variability in thickness of the SML along- and across-shelf can provide valuable
information about patterns of fluvial sediment dispersal from the Atchafalaya outlet.
The uppermost section of each sediment core analyzed in this study contains a
region of nearly constant isotopic activity with respect to excess ^'°Pb and '"Cs,
interpreted as a SML. Core OF contained a SML approximately 0.17 m thick, based upon
the depth to which levels of excess ^'°Pb remained constant and high (Figure 4-9).
Activity levels of '"Cs are consistent with this interpretation; '^'Cs was present in Core
OF in only the upper ~0.17 m and decreased to zero below this layer.
At Site OL the SML is interpreted to be between 0.10 and 0.40 m thick. Although
Core OI showed irregular isotopic patterns, suggesting possible reworking of sediment
throughout the core, a mixed layer of thickness between 0.10 and 0.40 m is implied by
the consistency of both '"Cs and excess ^'°Pb in the uppermost sediment (Figure 4-10).
The more conservative interpretation of 0.10 m is in closer agreement with SML
252
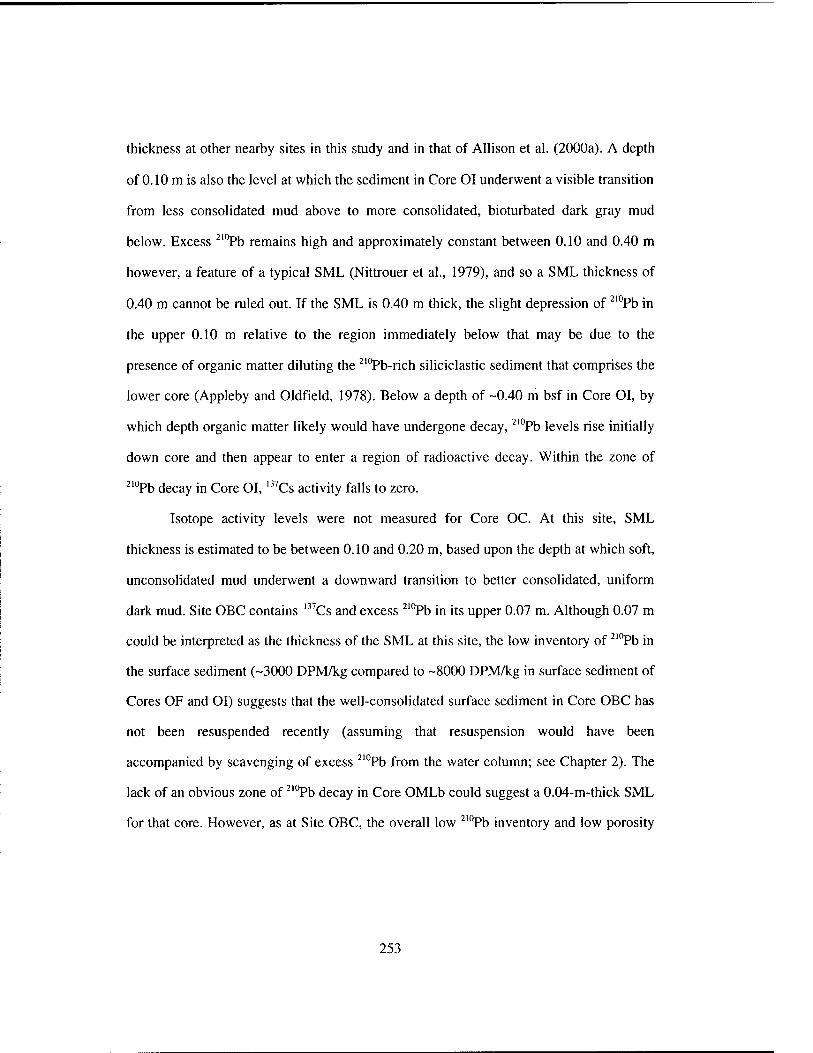
thickness at other nearby sites in this study and in that of Allison et al. (2000a). A depth
of 0.10 m is also the level at which the sediment in Core 01 underwent a visible transition
from less consolidated mud above to more consolidated, bioturbated dark gray mud
below. Excess ^'°Pb remains high and approximately constant between 0.10 and 0.40 m
however, a feature of a typical SML (Nittrouer et al., 1979), and so a SML thickness of
0.40 m cannot be ruled out. If the SML is 0.40 m thick, the slight depression of ^"'Pb in
the upper 0.10 m relative to the region immediately below that may be due to the
presence of organic matter diluting the ^'°Pb-rich siliciclastic sediment that comprises the
lower core (Appleby and Oldfield, 1978). Below a depth of -0.40 m bsf in Core OI, by
which depth organic matter likely would have undergone decay, ^'°Pb levels rise initially
down core and then appear to enter a region of radioactive decay. Within the zone of
^'°Pb decay in Core OI, '"Cs activity falls to zero.
Isotope activity levels were not measured for Core OC. At this site, SML
thickness is estimated to be between 0.10 and 0.20 m, based upon the depth at which soft,
unconsolidated mud underwent a downward transition to better consolidated, uniform
dark mud. Site OBC contains '^^Cs and excess ^'°Pb in its upper 0.07 m. Although 0.07 m
could be interpreted as the thickness of the SML at this site, the low inventory of ^'°Pb in
the surface sediment (-3000 DPM/kg compared to -8000 DPM/kg in surface sediment of
Cores OF and OI) suggests that the well-consolidated surface sediment in Core OBC has
not been resuspended recently (assuming that resuspension would have been
accompanied by scavenging of excess ^'°Pb from the water column; see Chapter 2). The
lack of an obvious zone of ^'°Pb decay in Core OMLb could suggest a 0.04-m-thick SML
for that core. However, as at Site OBC, the overall low ^'°Pb inventory and low porosity
253
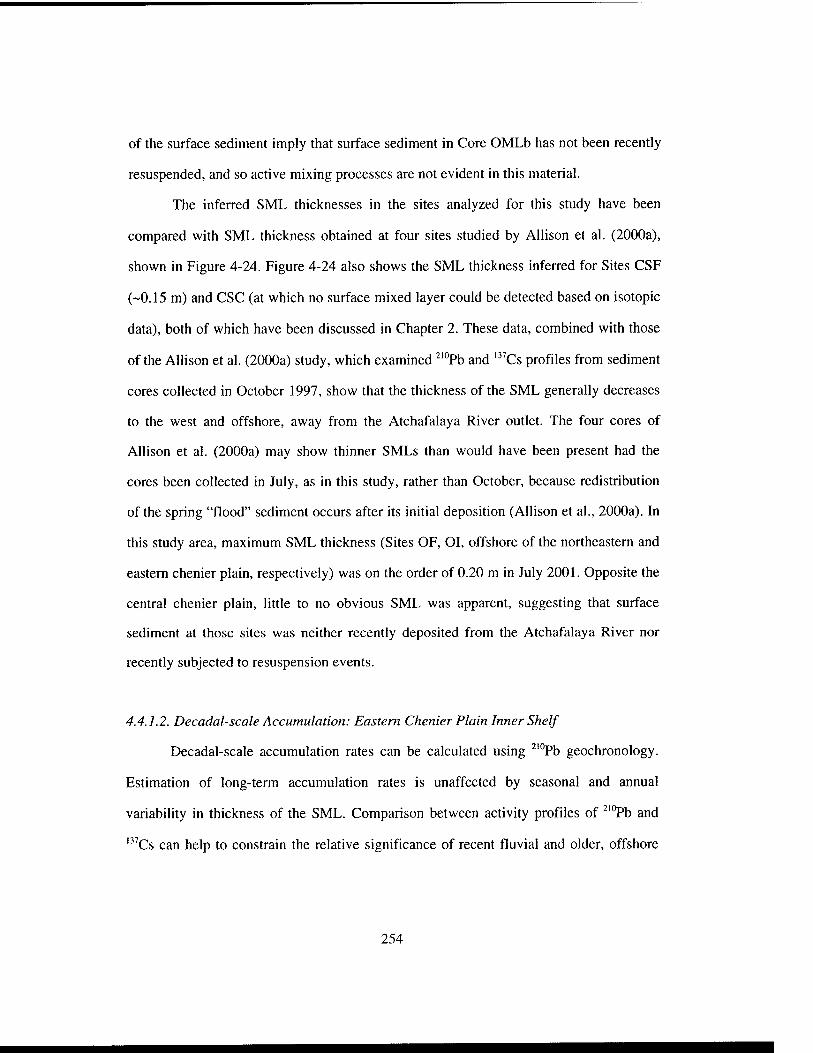
of the surface sediment imply that surface sediment in Core OMLb has not been recently
resuspended, and so active mixing processes are not evident in this material.
The inferred SML thicknesses in the sites analyzed for this study have been
compared with SML thickness obtained at four sites studied by Allison et al. (2000a),
shown in Figure 4-24. Figure 4-24 also shows the SML thickness inferred for Sites CSF
(-0.15 m) and CSC (at which no surface mixed layer could be detected based on isotopic
data), both of which have been discussed in Chapter 2. These data, combined with those
of the Allison et al. (2000a) study, which examined ^'°Pb and '^^Cs profiles from sediment
cores collected in October 1997, show that the thickness of the SML generally decreases
to the west and offshore, away from the Atchafalaya River outlet. The four cores of
Allison et al. (2000a) may show thinner SMLs than would have been present had the
cores been collected in July, as in this study, rather than October, because redistribution
of the spring "flood" sediment occurs after its initial deposition (Allison et al., 2000a). In
this study area, maximum SML thickness (Sites OF, OL offshore of the northeastern and
eastern chenier plain, respectively) was on the order of 0.20 m in July 2001. Opposite the
central chenier plain, little to no obvious SML was apparent, suggesting that surface
sediment at those sites was neither recently deposited from the Atchafalaya River nor
recently subjected to resuspension events.
4.4.1.2. Decadal-scale Accumulation: Eastern Chenier Plain Inner Shelf
Decadal-scale accumulation rates can be calculated using ^'°Pb geochronology.
Estimation of long-term accumulation rates is unaffected by seasonal and annual
variability in thickness of the SML. Comparison between activity profiles of ^"'Pb and
'^'Cs can help to constrain the relative significance of recent fluvial and older, offshore
254
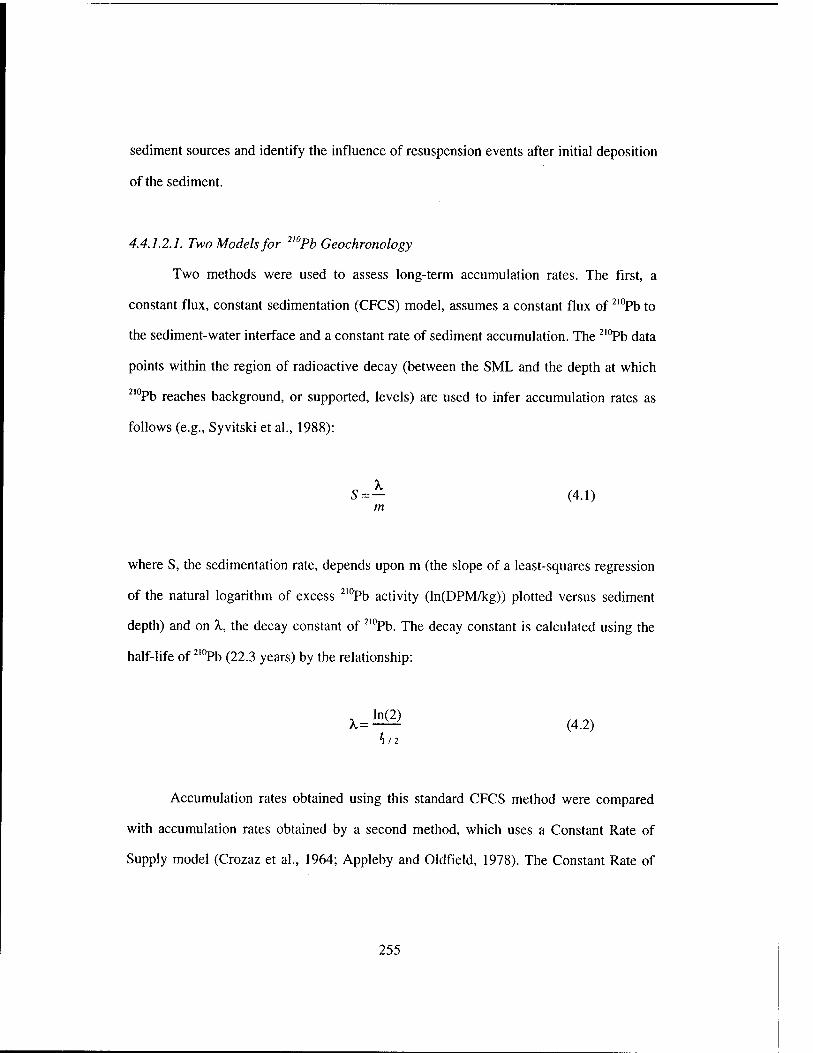
sediment sources and identify the influence of resuspension events after initial deposition
of the sediment.
4.4.1.2.1. Two Models for ^'°Pb Geochronology
Two methods were used to assess long-term accumulation rates. The first, a
constant flux, constant sedimentation (CFCS) model, assumes a constant flux of ^'°Pb to
the sediment-water interface and a constant rate of sediment accumulation. The ^"^b data
points within the region of radioactive decay (between the SML and the depth at which
^'°Pb reaches background, or supported, levels) are used to infer accumulation rates as
follows (e.g., Syvitski et al., 1988):
S = - (4.1) m
where S, the sedimentation rate, depends upon m (the slope of a least-squares regression
of the natural logarithm of excess ^"^b activity (ln(DPM/kg)) plotted versus sediment
depth) and on X, the decay constant of ^'°Pb. The decay constant is calculated using the
half-life of ^"^b (22.3 years) by the relationship:
X^^ (4.2) «l/2
Accumulation rates obtained using this standard CFCS method were compared
with accumulation rates obtained by a second method, which uses a Constant Rate of
Supply model (Crozaz et al., 1964; Appleby and Oldfield, 1978). The Constant Rate of
255
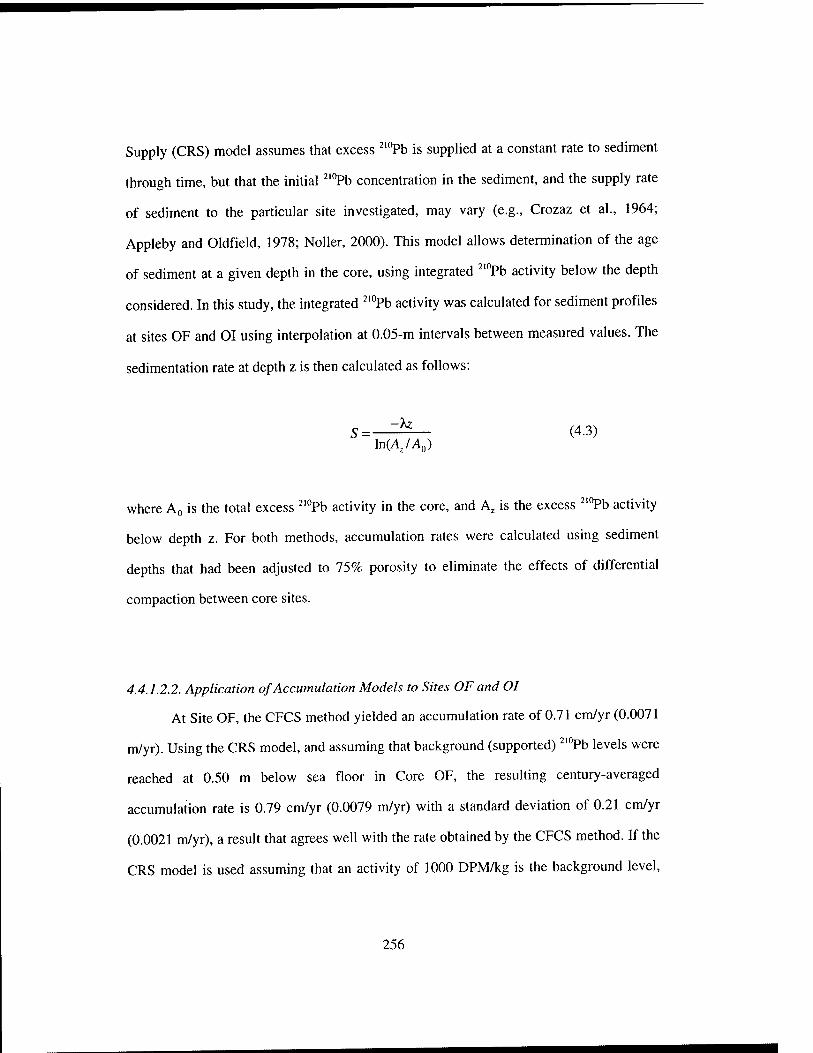
Supply (CRS) model assumes that excess ^'°Pb is supplied at a constant rate to sediment
through time, but that the initial ^'°Pb concentration in the sediment, and the supply rate
of sediment to the particular site investigated, may vary (e.g., Crozaz et al., 1964;
Appleby and Oldfield, 1978; Noller, 2000). This model allows determination of the age
of sediment at a given depth in the core, using integrated ^'°Pb activity below the depth
considered. In this study, the integrated ^"Vb activity was calculated for sediment profiles
at sites OF and 01 using interpolation at 0.05-m intervals between measured values. The
sedimentation rate at depth z is then calculated as follows:
5 = ^^- (4.3) ln(4/Ao)
where AQ is the total excess ^'°Pb activity in the core, and A, is the excess ^'°Pb activity
below depth z. For both methods, accumulation rates were calculated using sediment
depths that had been adjusted to 75% porosity to eliminate the effects of differential
compaction between core sites.
4.4.1.2.2. Application of Accumulation Models to Sites OF and OI
At Site OF, the CFCS method yielded an accumulation rate of 0.71 cm/yr (0.0071
m/yr). Using the CRS model, and assuming that background (supported) ^'°Pb levels were
reached at 0.50 m below sea floor in Core OF, the resulting century-averaged
accumulation rate is 0.79 cm/yr (0.0079 m/yr) with a standard deviation of 0.21 cm/yr
(0.0021 m/yr), a result that agrees well with the rate obtained by the CFCS method. If the
CRS model is used assuming that an activity of 1000 DPM/kg is the background level.
256
the resulting century-averaged accumulation rate is slightly higher at 0.94 cm/yr (0.0094
m/yr), with a standard deviation of 0.15 cm/yr (0.0015 m/yr). In Core OF, activity levels
of '^^Cs are too low to be used for independent verification of the ^"^b-derived
accumulation rates because the base of '"Cs inventory, where present, is near the lower
detection limit of the gamma counters.
The low inventory of '"Cs in sediment from Core OF that contains high excess
^'°Pb suggests that sediment initially delivered by a fluvial source has been resuspended
after its initial deposition, scavenging ^'"Pb from the water column and possibly mixing
with older sediment before being redeposited at this site. Unlike '^^Cs, a bomb-derived
isotope that is concentrated in fluvial discharge, ^'°Pb is introduced to marine water also
by atmospheric fallout from the decay of ^^^Rn gas and from decay of ^^^Rn and ^^"^Ra (the
^'°Pb grandparent) in seawater. Because lead is quickly adsorbed onto particle surfaces,
and because ^"*Pb inventory is elevated in seawater due to preferential concentration of its
grandparent U and Ra isotopes in the ocean (e.g., Turekian, 1977; DeMaster et al., 1986),
any event that resuspends sediment after its initial deposition will provide an opportunity
for sediment to scavenge ^"*Pb from surrounding seawater (e.g., Duursma and Gross,
1971; Scrudato and Estes, 1976; Smith and Ellis, 1982; Baskaran and Santschi, 2002).
If resuspension occurs on the continental shelf away from the immediate
influence of fluvial fresh water, resuspended sediment will adsorb ^'°Pb from seawater
but will not be exposed to additional '"Cs. Repeated exposure of sediment to new ^'°Pb
through multiple resuspension events will thus increase its excess ^'°Pb inventory while
not affecting '"Cs activity. '"Cs present in the sediment due to its past exposure to fluvial
discharge will be lost to radioactive decay, and may also be lost due to remobilization in
anoxic pore water (Sholkovitz et al., 1983; Sholkovitz and Mann, 1984). Older sediment
257
advected to Site OF during resuspension events would thus contain excess ^'°Pb but little
or no '"Cs, and its mixing with more recent fluvial sediment would dilute the isotopic
signal of the more recent fluvial input (e.g.. Holmes, 1985). Resuspension events that
affect this area of the inner shelf include the frequent winter cold fronts that pass through
this area as well as occasional hurricanes and tropical storms (Chapter 3).
Core 01 (Figure 4-10) displayed activity profiles of ^'°Pb and '"Cs that differed
markedly from those found in Core OF (Figure 4-9) and also from those of typical
undisturbed sedimentary environments (Figure 2-20). There is no clear transition in the
^"I'b profile from an upper SML to a region of radioactive decay to a region of
background (supported) ^'"Pb activity. Using the five data points filled in white on the
^'"Pb profile (Figure 4-10) to approximate the region of radioactive decay, the CFCS
method of estimating accumulation rate yields a rate of 2.70 cm/yr (0.027 m/yr). Using
only the lower three points filled in white, the rate becomes 1.28 cm/yr (0.0128 m/yr).
This latter rate is more consistent with the near-constant activity within the upper three
points that could suggest a 0.40-m-thick SML (Section 4.4.1.1). The CRS model yields
an accumulation rate for Site 01 that falls between the two accumulation rates given by
the CFCS method, with a century-averaged rate of 1.98 cm/yr (0.0198 m/yr) and a
standard deviation of 0.29 cm/yr (0.0029 m/yr; assuming that 1000 DPM/kg represents
background levels of ^'°Pb). With an accumulation rate of approximately 2 cm/yr (0.02
m/yr), the lower limit of '"Cs (representing the year 1950, when this isotope was first
introduced to the environment) would be expected to occur at a depth of -1.00 m bsf. A
peak in '"Cs in fact occurs slightly below that depth, reaching activity levels of up to
-180 DPM/kg in a broad peak that spans >0.30 m of sediment (Figure 4-10). Above this
258
peak, '^'Cs is absent between 0.40 and 0.90 m bsf, and occurs in the SML at levels
slightly lower than in the deeper peak.
This '"Cs profile could be explained by a catastrophic event that disturbed
sediment at this site. The proximity of Site 01 to a field of oil rigs (~1 km to the north)
raises the possibility that platform construction or pipeline emplacement could have
disrupted normal sedimentation, allowing older ('"Cs-free) sediment to settle above
younger fluvial sediment that comprises the deep '^^Cs peak.
Alternatively, a combination of fluvial discharge, resuspension events, and mixing
with offshore (older) sediment could have produced the resulting profiles. The elevated
'"Cs activity in the deep peak (-0.95-1.35 m bsf) may represent a river flood event,
which deposited a layer of "^Cs-rich sediment thick enough that subsequent resuspension
events did not rework its entire thickness, allowing much of its original '^'Cs signal to be
retained. Above this possible flood event, the absence of '"Cs accompanied by moderate
levels of excess ^'°Pb is similar to the pattern seen in Core OF, and may imply that
sediment was resuspended by storm events on the inner shelf that allowed it to scavenge
new ■^'°Pb but not '^^Cs. As in Core OF, resuspension events may have been accompanied
by mixing and redeposition with '"Cs-free sediment from farther offshore. The
reappearance of '^^Cs near the top of Core 01, in and just below the SML, implies a
recent fluvial source for this uppermost sediment.
Cores OBC and OMLb, sites from the inner shelf seaward of the central chenier
plain at which no SML could be definitively identified (Section 4.4.1.1.), show low levels
of '"Cs and excess ^'°Pb activity that reach background (supported) levels almost
immediately below the sea floor. The absence of '"Cs and excess ^'°Pb throughout most
of these two cores implies that they contain relict sediment, which has not been exposed
259
to the water column within the past 100 years (five half-lives of ^'°Pb, the detection limit;
e.g., Holmes, 1985). Due to the low isotopic inventory, no long-term accumulation rates
can be calculated for Cores OBC and OMLb. These sites likely receive some sediment
seasonally, but are not presently sites of long-term accumulation.
4.4.1.3. Western Extent of Atchafalaya Sediment Accumulation
The sedimentary facies data, isotopic characteristics, and stratal geometry
presented here can be used to define the westward extent of the Atchafalaya prodelta. In
contrast to the coarser sand-sized particles that are concentrated in a relatively small (tens
of km^) delta lobe immediately seaward of the river mouth, finer silt and clay form a
broad fan of sediment (prodelta) that is carried seaward in the plume of turbid fluvial
water and deposited along and across the shelf, affected secondarily by resuspension
events (e.g., Kolb and Van Lopik, 1958; Coleman and Gagliano, 1964; Sutton and
Ramsayer, 1975; Hyne et al., 1979; Coleman, 1981, 1988; Syvitski et al., 1985, 1988;
Nemec, 1995; Allison and Neill, 2002).
Although aggregation and settling substantially reduce the suspended sediment
concentration in the river plume within 10 km of the river mouth, distal sediments of the
prodelta cover an area in excess of 1000 km^ (e.g., Coleman, 1981; Van Heerden and
Roberts, 1988). Allison and Neill (2002) used sediment cores and Chirp seismic data to
constrain sediment properties and define the extent of the Atchafalaya prodelta seaward
of the river mouth. That study showed that the proximal prodelta has a maximum
thickness of 2.5 m immediately seaward of Point au Fer (at the mouth of the dredged
river outlet; Figure 4-2a), where ^'°Pb accumulation rates exceeded 10 cm/yr (0.1 m/yr).
The prodelta sediment pinched out seaward of the 8 m isobath as accumulation rates
260
steadily decreased. Atchafalaya sediment was found to grade seaward from proximal,
interbedded sandy silt near Point au Fer to more distal clayey silt in water depths from 3
to 7 m. The most distal deposits, where accumulation rates were <1 cm/yr (0.01 m/yr),
contained silty clay homogenized by bioturbation that had destroyed primary bedding
fabric (Allison and Neill, 2002).
The Allison and Neill (2002) study was thus able to constrain the seaward
(southern) extent of the Atchafalaya prodelta, to identify evidence of active progradation
in the stratal geometry on the inner shelf, and to estimate accumulation rates of sediment
across much of the prodelta area. This work, complementary to that study, places limits
on the western extent of the prodelta and thus on the extent of fluvial-dominated
sedimentation on the inner shelf.
Figure 4-25 shows long-term accumulation rates calculated for the sites in this
study compared with those determined by Allison et al. (2000a) for their Sites WHl,
WH6, WLl, and MI6. As with the SML thicknesses in Figure 4-24, decadal-scale
accumulation rates generally decrease to the west away from the Atchafalaya River
outlet, with the exception of Site 01, at which some reworking has been inferred. Site
WHl (offshore of the central chenier plain, in a water depth of -18 m) yielded an
accumulation rate of 0.18 cm/yr (0.0018 m/yr), indicating more rapid accumulation than
presently occurs at Sites OBC and OMLb, which are shallower and to the west of WHl.
Accumulation rates generally decrease offshore, in a similar pattern to that seen with the
thickness of the SML (Figure 4-25).
The homogenous, soft dark mud unit that dominates sediment in the eastern cores
of this study (Cores OF and 01) is inferred to be sediment initially derived from the
Atchafalaya River. This layer, which also comprised the upper 0.74 m of Core OC, is
261
inferred to be distal sediment of the Atchafalaya prodelta. The presence of '"Cs in the
uppermost sediment of Cores OF and 01 implies a fluvial source for the sediment, though
the elevated levels of excess ^'°Pb compared to '"Cs in these cores suggest that
resuspension events and/or mixing with older sediment from offshore has affected these
sites after initial deposition (Section 4.4.1.2). This distal prodelta sediment is seen to thin
westward away from the river outlet, from >1.5 m thick in Cores OF and 01 to 0.74 m
thick in Core OC. The dominant particle size of sediment in this layer is similar at Sites
OF and 01 (containing an average of 73% clay at Site OF and 75% clay at Site 01), but
becomes markedly finer at Site OC, where the average clay content of the prodelta
sediment is 87%. Visual descriptions and X-radiograph images of prodelta sediments in
Cores OF, 01, and OC were consistent with the results of Allison and Neill (2002), which
described the most distal silty clays of the southern prodelta as heavily bioturbated and
homogenous with respect to particle size. Decadal-scale ^'°Pb accumulation rates found in
this study in Cores OF and OI are consistent with accumulation rates determined by
Allison and Neill (2002) for fine-grained sediment clays at the southern edge of the distal
Atchafalaya prodelta.
The resistant basal sand and shell layer that underlies prodelta sediment in Sites
OF, OI, and OC compares favorably with the resistant shell-hash horizon found at the
base of Atchafalaya prodelta sediment south of the river mouth by Allison and Neill
(2002). Thompson (1951) documented the presence of such sediment as the dominant
facies seaward of the Point au Fer shell reef that forms the southern margin of
Atchafalaya Bay (beginning >10 km seaward of the reef), underlying unconsolidated
modem Atchafalaya sediment.
262
The strata! geometry of the prodelta visibly changes within the eastern part of the
chenier plain inner shelf. Transect Tl shows bedding that dips gently seaward, in the
vicinity of Site OF (Figure 4-14; the disturbed seabed at the landward end of Transect Tl
is assumed to be affected by trawl marks from equipment used by shrimping and fishing
boats, which frequent this area). The lowermost acoustic reflector in Profile Tl coincides
with the bottom of prodelta mud observed in Core OF (1.55 m bsf), below which a sand
and shell layer occurred. It is noteworthy that although Transect Tl crosses an area
known to contain relict sediments of the Maringouin and Teche delta lobes, the
radiocarbon age obtained for shell material in the basal horizon of Core OF (1.56 m bsf)
yielded an age of 730-930 years BP, too young to represent the active phase of those
delta lobes (-3000-7500, e.g., McFarlan, 1961; Frazer, 1967).
Bedding in Profile T3, a transect 10 km to the west of Profile Tl, shows
sigmoidal clinoforms dipping seaward that form a discrete sedimentary package ~5 m
thick (Figure 4-15). The difference in stratigraphic configuration between Profiles Tl and
T3 suggests the presence of prodelta topset beds in Tl, and prograding foreset clinoforms
in T3. Along both Transects Tl and T3, the convex shape of the cross-shore profile is
indicative of active progradation. Convex profiles are typical of prograding areas where
river sources contain a high proportion of suspended sediment, which causes the distal
delta slope to prograde seaward more rapidly than the delta front (Coleman, 1981;
Postma, 1990, 1995). Inferred active progradation in the eastern part of this study area
(Transects Tl to T7) is supported by the long-term ^"*Pb accumulation rates calculated for
Sites OF and 01. The clinoform geometry observed in these eastern transects is similar to
that of other fine-grained fluvial dispersal systems; sigmoidal clinoforms with distinct
topset, foreset, and bottomset beds have been described in mud-dominated subaqueous
263
deltaic deposits of the Amazon (Nittrouer et al., 1986, 1995), Ganges-Brahmaputra
(Kuehl et al., 1990), and Huanghe (Alexander et al., 1991) River systems.
West of Transect T3, sigmoidal clinoforms were not observed. Bedding geometry
in Profiles T5, T7, and T9 (Figures 4-16, 4-17, and 4-18) showed sub-bottom reflectors
approximately parallel to the sea floor, with a convex cross-shore profile that suggests
active accumulation but without the clear prograding geometry of the clinoforms in
Profile T3. This may represent bottomset beds of the prodelta facies; the finer grain size
and diminished vertical thickness of the inferred Atchafalaya sediment at Site OC is
consistent with bottomset beds extending as far west as Transect Tl 1 (92.5°W). Figure 4-
26 shows the interpreted areal limits of the Atchafalaya prodelta, combining the results of
this work with those of Allison and Neill (2002).
Stratal geometry at the western margin of the prodelta could be resolved in more
detail than has been presented here by using a deeper-penetrating seismic system such as
a Chirp reflection profiler (e.g., Quinn et al., 1998; Bull et al., 1998). A Chirp system can
image stratigraphic horizons 20 to 40 m below the sea floor with decimeter-scale vertical
resolution. A Chirp instrument yielded useful information for the main body of the
prodelta during the Allison and Neill (2002) study. Limited Chirp data has been collected
on the eastern chenier plain coastal zone (Roberts et al., 2002) but the survey in which it
was used was restricted to <10 km of shore in the immediate vicinity of Freshwater
Bayou. Further use of such an instrument on the chenier plain inner shelf is a
recommended future direction of investigations in this area.
The facies transition from prodelta to relict sediment occurs between Sites OC
and OBC, coincident with the transition from convex (aggradational) to concave
(erosional) cross-shore profiles in the acoustic data. This transition occurs at longitude
264
~92.55''W, which is inferred to mark the westward extent of Atchafalaya-dominated
sedimentation on the inner shelf. Notably, this longitude approximately coincides with
the boundary between coastal areas that experience decadal-scale accretion (eastern
chenier plain) and those that experience decadal-scale shoreline retreat (central chenier
plain; see Chapter 3), illustrated in Figure 4-27. It has been shown in Chapter 3 that
coastal accretion occurs during energetic conditions in the presence of an unconsolidated,
mud-rich sea bed, from which sediment is resuspended during cold fronts and storm
events and provides sediment for mudflat growth (e.g., Huh et al., 1991; Kineke, 2001a,
b; Kineke et al., 2001). Data from the inner shelf therefore indicate that the extent of the
Atchafalaya prodelta controls the location where coastal accretion can occur by these
processes, because distal deposition of fluvial silt and clay maintains the
underconsolidated muddy substrate necessary to fuel coastal accretion (Figure 3-27).
4.4.1.3.1. Significance of the Chenier Plain Inner Shelf in the Atchafalaya River
Sedimentary System
In order to assess the proportion of the Atchafalaya River's sediment load that
accumulates on the eastern chenier plain inner shelf, the total mass of prodelta sediment
represented by these study sites has been estimated. Calculations were made using three
methods, described in detail in Appendix 4-D. The method believed to yield the most
reliable approximation of Atchafalaya-derived sediment mass in this field area assumes
that a layer of prodelta sediment 0.5 m thick has accumulated over the area covered by
transects Tl through Til in the last century. This accumulation rate is derived from
observation of the ^'°Pb profile in Core OF, which shows that the upper 0.5 m of sediment
contain excess ^'°Pb. Because the detection limit of ^"'Pb is five half-lives, or 100 years.
265
this upper 0.5 m of mud is interpreted to have accumulated within that time. Core OF
alone is used to estimate this accumulation rate because Core 01 showed evidence of
sediment reworking that had disturbed the ^'°Pb profile, and because no isotope data were
available for Core OC.
Assuming a constant thickness of 0.5 m across the area spanned by Transects Tl
through Til, where prodelta sediment has been inferred, and assuming a bulk density of
1680 kg/m\ the average bulk density of sediment in the upper 0.5 m of Core OF, the
volume of sediment considered is equivalent to 56 x 10^ metric tons, or 56 x 10^ metric
tons of accumulation per year. Allison et al. (2000a) estimated the annual sediment
discharge of the Atchafalaya River at 84 x 10*^ metric tons, based on analysis of nearly
four decades of sediment concentration and water discharge data collected by the US
Army Corps of Engineers. Of that sediment load, 17% is estimated to be sand (Allison et
al., 2000a). The remaining 83% consists of fine-grained sediment, or -70 x 10^ metric
tons annually. By this estimation, therefore, approximately 7.6% of the Atchafalaya fine-
grained sediment load is deposited annually in the inner shelf area considered (or -6.3%
of the river's total sediment load).
An additional allowance is made for sediment accumulating landward of
Transects Tl through Til, in the coastal zone where intertidal mudflats are actively
accreting (Chapters 2 and 3). To account for this near-shore accumulation cell, a
minimum thickness of 1.0 m of recent sediment is assumed (based upon the isotopic
profiles of near-shore cores discussed in Chapter 2) to deposit between the landward limit
of the acoustic transects and the high tide mark onshore. At a density of 1300 kg/m^
(consistent with near-shore core data in Chapter 2), this near-shore accumulation is
estimated to trap a sediment mass equivalent to an additional 0.6% of the annual
266
Atchafalaya fine sediment discharge. This estimate for the eastern chenier plain near-
shore region is not substantially different from the -2% calculated in Chapter 3 for the
proportion of Atchafalaya sediment that could be deposited onshore as mudflats, based
on aerial photograph analysis of mudflat area and prior field observations of mudflat
accretion due to cold fronts (Section 3.4.2.2). The combination of the coastal zone and
the distal prodelta area considered on the inner shelf, then, may be a sink for ~8 ± 2% of
the fine-grained sediment carried by the Atchafalaya River, or ~7 ± 2% of the total
sediment load. A sediment budget for the chenier plain region could be more rigorously
defined with additional isotopic and sedimentary facies information from cores collected
farther seaward.
The sedimentary system of the Atchafalaya River and its prodelta remain only
moderately constrained, however. Accumulation rates for the southeastern prodelta have
not yet been estimated, and the patchy distribution of active accumulation on Trinity and
Ship Shoals (sand-shell exposures of relict Maringouin and Teche delta lobe sediment.
Figures 4-1 and 4-2a) complicates efforts to define a regional sediment budget. Using a
contour plot of ^'"Pb accumulation rates modified from Allison and Neill (2002), an
annual accumulation of -25 x 10' metric tons/yr is estimated to occur on the portion of
the prodelta where accumulation rates have been evaluated (shown in Figure 4-28; a bulk
density of 1680 kg/m' is assumed). This figure excludes accumulation that may occur on
the shoal region, where the occurrence of modem Atchafalaya sediment is heterogeneous
and poorly defined. That mass of 25 x 10' metric tons/yr is equivalent to -30.5% of the
annual sediment load of the Atchafalaya River (Allison et al., 2000a), which is
reasonably consistent with the estimate by Gordon et al. (2(X)1) that 31% of the river's
sediment load accumulates annually in their study area (shown in Figure 4-2a).
267
An additional 28% of the river's sediment load can be accounted for as sediment
retained within Atchafalaya Bay, near the river mouth (-23 x 10^ metric tons/yr, which at
a bulk density of 1680 kg/m^ corresponds to the sediment volume of 14 x 10^ m^
estimated by Wells et al. [1984] to be added to Atchafalaya Bay annually). At present,
therefore, estimated accumulation rates in Atchafalaya Bay and on regions of the prodelta
that have been studied account for approximately 59% of the river's annual sediment
load. The remainder is assumed to be distributed among the southeastern prodelta
(southeast of Point au Fer) where accumulation rates have not been studied, the zone of
shoals, where facies distribution is spatially and temporally variable (Figure 4-28), deeper
water offshore, and westward transport by longshore currents. Of these possible sinks for
the 41% of the Atchafalaya sediment that remains unaccounted for, the majority is likely
transported to the west by the coastal current (e.g.. Wells and Roberts, 1981).
4.4.2. Relict Sediment: Central Chenier Plain Inner Shelf
In contrast to the homogenous mud in cores taken within the Atchafalaya
prodelta, the sedimentary facies observed in cores collected on the inner shelf opposite
the central chenier plain (Cores OMLb, OBC, and the lower portion of OC) displayed
highly variable composition and particle size. Individual stratigraphic horizons are not
easily correlated between cores. The radioisotope profiles of Cores OMLb and OBC
showed no appreciable '"Cs or excess ^'°Pb activity below the surface mixed layer. The
absence of these isotopes, the vertical facies heterogeneity, and the well-consolidated
nature of the sediment suggest that the sea floor in this area contains relict sediment and
is not currently undergoing long-term accumulation. Seismic transects that correspond to
this western half of the study area (from 92.55°W to 92.78°W) show concave cross-shore
268
profiles, indicating that there is presently no active accumulation building the inner shelf
in this area.
Studies of sediment composition on the eastern Texas inner shelf have reported
facies very similar to those observed in Cores OBC and OMLb. Shepard (1960), Curray
(1960), Morton and Winker (1979), and Morton (1981), among others, described surface
sediments of the Texas inner shelf as being primarily composed of relict sediment
initially deposited during Holocene sea level transgression that has been subsequently
reworked by storm events. Relict sediments there are composed of fine- to very fine-
grained sands, muds, and carbonate shell material; well-defined shell-rich horizons and
cyclic sedimentation of sands and muds are common (Morton and Winker, 1979).
4.4.2.1. Age and Source of Relict Sediment
Radiocarbon dates obtained for shell material yielded reservoir-corrected ages of
1260-1460 years BP in Core OBC (at -0.50 m bsf) and 1110-1310 years BP in Core
OMLb (at -0.41 m bsf). These ages reflect the average time at which the organisms that
produced the shells ceased to grow. While not conclusively defining the age at which the
shells were deposited at the core sites, these ages define a maximum deposition age for
sediment above the shell horizons. Constraining a minimum deposition age for sediment
above the dated shell horizons is more difficult. The lack of excess ^'°Pb implies that
deposition occurred more than -120 years ago; the much greater consolidation of clay in
these cores compared to the -250 year old basal Atchafalaya mud in Core OF suggests
that the relict clay and silt in Core OMLb is considerably older (perhaps by as much as
several centuries) than 250 yr BP. Sediment below the dated shell layers is of uncertain
age.
269
To identify a possible source for relict siliciclastic sediment offshore of the central
chenier plain, a brief review of the chronology of ancient Mississippi subdelta lobes is
necessary (see Section 4.1.2 for more detail). Since no other major sediment sources exist
on the northern Gulf coast, and assuming that the westerly coastal circulation (Curray,
1960) would have existed throughout the late Holocene, the Mississippi distributary
system is the most likely origin of this relict sediment on the central chenier plain shelf.
Six major delta lobes of the Mississippi Delta complex have developed during late
Holocene time (Figure 4-1). The timing of activity on each major lobe and sub-lobe has
been revised repeatedly following initial radiocarbon studies conducted in the 1950s. A
summary of the findings of multiple chronologic investigations is shown in Table 4-2.
Early activity of the modem (Plaquemines-Balize) lobe of the Mississippi River is
not considered to be a plausible source for the relict siliciclastic sediment on the central
chenier plain shelf. The modem main distributary course of the Mississippi first became
active around 1000 years BP (Table 4-2). Early activity on the modem (Balize) course
(which began through the smaller Plaquemines sub-lobe) does overlap with the likely
deposition time of the relict sediment. However, little to no sediment from the modem
Balize outlet apparently accumulates west of approximately 9rW (e.g., Allison et al.,
2000a), but instead accumulates on the steeply sloping shelf by the Mississippi channel
outlets and may be subsequently transported into deeper water by mass movement.
Mississippi sediment is therefore believed to exert minimal influence on chenier plain
sedimentation, and can be eliminated as a source of the rapidly deposited relict material
on the central chenier plain shelf.
The most probable source for relict siliciclastic sediment on the central chenier
plain was the Lafourche lobe of the Mississippi Delta complex (Figure 4-1). The activity
270
of this delta lobe immediately preceded development of the modem (Balize) course;
reported dates of activity vary but the most recent assessment (Tomqvist et al., 1996)
places its first activation at around 1500 yrs BP. This Lafourche lobe covered more than
11,300 km^ by -800 yrs BP, when it ceased to be a major distributary (Roberts, 1997),
although its trunk stream carried a small flow volume until 1904, when a dam was
constructed at its upstream end. The timing of activity of this Lafourche system, and its
location at the western edge of the Mississippi Delta complex, are consistent with its
providing a source for the relict sediment observed on the central chenier plain shelf.
A detailed Holocene shoreline chronology compiled by Gould and McFarlan
(1959) supports the contention of accretion on the chenier plain shelf during activity of
the Lafourche delta lobe. In what remains the only comprehensive dating study of
Louisiana's chenier ridges, these researchers obtained hundreds of radiocarbon ages on
organic material from the stranded beach deposits in chenier plain ridges and the relict
progradational mudflat zones that separate them (see Chapter 2 for a thorough description
of chenier plain development). Gould and McFarlan (1959) used these dates to show that
the chenier plain experiences rapid progradation during times when a major distributary
of the Mississippi system is active at the western edge of the delta complex. When the
locus of deposition shifts to a lobe located on the eastern side of the delta complex,
preventing much sediment from reaching the chenier plain via the coastal current,
progradation gives way to erosion on the chenier plain and coastal sediment is reworked
into coarse lag deposits that form the chenier ridges. Gould and McFarlan (1959) tied
progradation events on the chenier plain to activity on the Teche, Lafourche, and nascent
Atchafalaya Delta lobes, and erosion (chenier ridge development and formation of relict
271
shorelines) to activity on the St. Bernard and modem (Bahze-Plaquemines) lobes (Figure
4-1).
The last major progradation event apparent on the chenier plain, prior to the
initiation of mudflat growth by Atchafalaya sediment, was shown to correlate with the
timing of Lafourche lobe activity. According to that study, this pronounced shoreline
accretion occurred from 1200 to 600 yrs BP). The extensive area added to the chenier
plain during that time is shown in Figure 4-29. Given the magnitude of the rapid
progradation event documented by Gould and McFarlan (1959) for the chenier plain
coast, simultaneous accretion on the inner shelf opposite the chenier plain due to
Lafourche lobe activity (-1200-600 yrs BP), as suggested by Cores OBC and OMLb,
appears highly probable.
4.4.2.2. Development ofStratal Geometry
On multiple spatial scales, the stratigraphy observed in relict sediment offshore of
the central chenier plain differs from that observed off shore of the eastern chenier plain,
where Atchafalaya prodelta sediment was dominant. Acoustic transects (Profiles T13,
T15, T17, and T19) display seaward-dipping reflectors that are truncated by the sea floor,
a pattern notably different from the topset-foreset-bottomset clinoform stratigraphy of the
easternmost transects. Well-defined stratigraphic horizons occur within Cores OBC and
OMLb that contain abundant siliciclastic sand and carbonate shell material, unlike the
homogenous dark mud of the Atchafalaya prodelta. On millimeter to centimeter scales,
the bedding in Core OMLb is defined by silt and clay laminations with occasional sandy
interbeds. The fine-grained Atchafalaya sediment in eastern cores, in contrast, is heavily
bioturbated with only rare bedding evident. The stratigraphic architecture apparent on the
272
central chenier plain inner shelf yields information about sedimentary processes operative
during its deposition. The following sections examine the influence of storm processes
and ancient sedimentation on the Mississippi Delta complex on the stratigraphic
evolution of the chenier plain inner shelf.
4.4.2.2.1. Dissected Clinoforms
Transects T13, T15, T17, and T19 show seaward-dipping reflectors that are
truncated by the concave sea floor in cross section (Figures 4-20 through 4-23). Cores
OBC and OMLb contained layers of sand and shell hash that corresponded to the depths
at which individual reflectors appeared in the acoustic data. The geometry of these
reflectors, and their relation to the concave sea floor, are consistent with the inference of
active erosion on this area of the central chenier plain today. These reflectors are
interpreted as remnants of clinoform stratigraphy that formed during accumulation of
Lafourche lobe sediment on the chenier plain. When sigmoidal clinoforms are ablated
and downcut by an erosion surface that dips seaward more steeply than the bedding
angle, as shown in Figure 4-30, the resulting geometry strongly resembles the pattern of
acoustic reflectors seen in these western transects. Their modem geometry is interpreted
to reflect the transition from accretion to erosion that accompanied the shift from
Lafourche to modem (Balize) sedimentation on the Mississippi Delta plain.
While the Lafourche lobe was active, beginning around 1500 yrs BP (Tomqvist et
al., 1996), sediment was delivered to areas west of the delta complex, promoting
accretion of the chenier plain coast and inner shelf that began between 1500 and 1200 yrs
BP (Gould and McFarlan, 1959; Section 4.4.2.1). Rapid accumulation on this portion of
the shelf during the Lafourche phase of accretion is proposed to have generated
273
clinoforms similar to those now observed on the prograding Atchafalaya prodelta, which
would have been accompanied by a convex cross-shore profile as in other accreting areas
(Allison and Neill, 2002; Section 4.4.1.3.). Radiocarbon dates from relict mudflats on the
chenier plain indicate that coastal progradation had ceased by 600 BP, by which time the
Lafourche distributary had largely been abandoned in favor of the modem (Balize) course
that supplies little to no sediment to the chenier plain (Gould and McFarlan, 1959). It is
proposed that after cessation of Lafourche sedimentation, sigmoidal clinoforms that had
formed on the chenier plain inner shelf were gradually eroded by the action of storms and
the sediment transported away by the coastal current. This transition from accreting to
eroding conditions was reflected in the development of a concave sea floor that
represents an hiatal surface on which no long-term accumulation currently occurs.
4.4.2.2.2. Vertical Stratification: Storm Horizons?
On smaller spatial scales than the clinoforms discussed above, stratigraphy in
relict sediment of the central chenier plain cores differs from that observed in the distal
Atchafalaya sediment. While prodelta sediment (Cores OF, OI, and the upper 0.74 m of
Core OC) was composed of homogenous, heavily bioturbated mud with rare bedding
visible, relict sediment shows well-defined coarse-grained horizons interbedded with
mud. Within fine-grained layers of the relict material, millimeter-scale lamination is
apparent that is relatively undisturbed. Examples of lamination within mud (Core OMLb)
and of distinct coarse horizons (in Core OBC) are shown in Figure 4-31.
The appearance of the bedding in this relict sediment resembles that of deposits
on other continental shelves that have been described as storm horizons, and post-storm
deposition is believed to be a likely origin for these units. According to the storm-bed
274
explanation for sand-mud couplets, formation of these sedimentary packages results from
decreasing energy during a waning storm. Bottom currents induced by waves in 10 m
water depth (where these cores were collected) during cold front events are commonly
fast enough to entrain poorly consolidated silt and clay particles (>0.06 m/s; Young and
Southard, 1978; Kineke, 2001a). Seabed orbital velocities during major storms on the
northern Gulf Coast well exceed 1 m/s; during hurricanes, seabed current velocity can
exceed 2 m/s even in >40 m water depth, rapid enough to mobilize and entrain very
coarse sand and shell fragments (Murray, 1970; Forristall et al., 1977; Stone et al., 1995).
As any given storm subsides and wave orbital velocities drop, sediment that has
been suspended by storm waves settles with the coarsest particles falling fastest.
Deposition of shell hash and sand-sized particles is followed by finer silt and clay (e.g.,
Reineck and Singh, 1972). Typical storm deposits thus consist of a coarse sand/shell
layer that often contains a sharp base (representing an erosion surface) grading upward
into finer overlying mud. Deposits of this description have been observed and identified
as storm-derived units in many shallow marine environments (e.g., Hayes, 1967; Reineck
and Singh, 1972; Morton and Winker, 1979; Bourgeois, 1980; Morton, 1981, 1988;
Figueiredo et al., 1982; Dott, 1983; Bentley and Nittrouer, 1999). The occurrence of shell
and sand horizons overlain by finer units in cores such as OBC and OMLb forms a
vertical sequence similar to facies interpreted as storm beds on the eastern Texas inner
shelf (Morton and Winker, 1979; Morton, 1988).
Alternatively, the coarse shell hash horizons in relict sediment of Cores OC,
OBC, and OMLb may reflect times of reduced supply of fine-grained sediment to the
central chenier plain inner shelf. Minor quantities of shell material are found throughout
dominantly fine-grained horizons in relict and modem sediment on the western Louisiana
275
shelf. During intervals of relatively low fine-grained sediment delivery to the chenier
plain area (e.g., during activity of eastern sub-lobes within the Lafourche delta lobe),
horizons of concentrated shell material may form that later become overlain by sediment
richer in mud when fine-grained sediment delivery is resumed.
For the millimeter-scale silt/clay laminations within the fine-grained horizons of
Core OMLb (Figure 4-3lb), a storm origin may be possible but is not required. These
thin, fine-grained beds may have been deposited during pulses of elevated fluvial
discharge that brought episodically high sediment load to the chenier plain area. Similar
laminations within fine-grained sediment are visible today on the proximal Atchafalaya
prodelta (Allison and Neill, 2002), where river flood layers are deposited.
4.4.2.2.3. Preservation of Millimeter-scale Lamination
The well-preserved nature of fine-scale laminations in relict sediment of the
central chenier plain shelf is noteworthy, especially in comparison to the much more
poorly preserved fabric observed in the distal Atchafalaya prodelta. Fine-grained
sediment deposited in shallow marine environments generally contains physical
stratification when first deposited (e.g., Nittrouer et al., 1985). The degree to which
original sedimentary architecture is preserved depends upon the relative rates of
accumulation and biogenic or physical mixing at a given site (e.g.. Bourgeois, 1980;
Nittrouer and Stemberg, 1981; Dott, 1983; Nittrouer et al., 1984, 1985; Bentley and
Nittrouer, 1999; Wheatcroft, 1990). Preservation of original bedding is favored by rapid
accumulation, which buries stratigraphy below the mixed layer where bioturbation or
physical mixing diffuses the contrast between sedimentary layers (e.g., Berger and Heath,
1968; Boudreau, 1994). On typical subaqueous deltas, biogenic and physical mixing
276
activity is fairly constant in surface sediment over the entire delta area while sediment
accumulation rate decreases away from the source of fluvial input (Nittrouer et al., 1984).
Consequently, deltaic sediments show better-preserved physical stratification near the
river mouth with progressively increasing homogenization seaward until, in the most
distal deposits, very little original bedding remains. This is the case with the Atchafalaya
prodelta, as shown by Allison and Neill (2002).
If the source of the relict sediment was the Lafourche delta lobe, as discussed
above, then the preservation of fine-scale laminations on the central chenier plain shelf
suggests that the accumulation rate in this area was greater during Lafourche activity than
modem rates of Atchafalaya sedimentation on the eastern chenier plain (Sites OF, OI).
Rapid sedimentation on the central chenier plain during peak Lafourche activity (-1200
to 800 yrs BP) is supported by the rapid shoreline progradation at that time (Gould and
McFarlan, 1959). The Atchafalaya River, and associated depositional system on the
continental shelf, is not yet well-developed enough to induce sedimentation on the
eastern chenier plain shelf that is sufficiently rapid to preserve fine-scale bedding before
biogenic and physical mixing processes destroy it.
Variations in sedimentation rate are believed to be a more likely cause of the
stratigraphic preservation in Cores OBC and OMLb than a change in the intensity or
frequency of resuspension events between 1200 yrs BP and the present. If rates of
sedimentation and bioturbation on the chenier plain shelf during Lafourche activity had
been identical to modem times but with increased storm intensity, the relict stratigraphy
would be expected to contain bioturbated zones separated by undisturbed storm horizons.
Such facies geometry would result from the action of storm events that disturbed and
redeposited sediment in units thicker than the depth of biogenic mixing, coupled with
277
active bioturbation between storms (e.g., Dott and Bourgeois, 1982). Instead, relict
sediment recovered in Cores OBC and OMLb does not contain zones of clearly
recognizable bioturbation, but is characterized instead by well-preserved bedding
throughout the stratigraphy, most likely reflecting a high sedimentation rate.
During Lafourche lobe activity, accumulation of its sediment on the chenier plain
shelf may not have been directly connected to the primary delta and prodelta. Relict
Maringouin and Teche delta lobe sediments form a large shoal complex at the far western
edge of the delta (Trinity and Ship Shoals; Figures 4-1 and 4-2) that, given the rapid rates
of relative sea level rise in this area, was at least partially subaerial when Lafourche
activity began (Penland and Ramsey, 1990; Houghton, 1997). With this large shoal
complex present between the Lafourche distributary and the chenier plain, it is possible
that sedimentation on the chenier plain shelf occurred in an area of secondary
accumulation of sediment transported west by the coastal current. This inference of a
secondary depocenter not directly connected to the primary delta is analogous to the
deposition of Huanghe River sediment in a secondary locus (Shangdong peninsula
region) in addition to its primary delta (Alexander et al., 1991).
Alternatively, the shoal may have been partially submerged, with a subaerial
barrier island complex at its seaward margin (similar to the modem Chandeleur Islands,
Figure 4-1). This configuration would have allowed Lafourche sediment to be transported
west over submerged areas of the shoal toward the chenier plain. Although Lafourche
material has not been identified on Trinity-Ship Shoals by previous dating studies, the
radiocarbon date of 730-930 yrs BP for the basal shell horizon of Core OF, at the western
edge of the shoal complex, may reflect deposition in the shoal region coincident with
Lafourche lobe activity.
278
4.4.3. Future Development of the Chenier Plain
Presently, the eastern chenier plain is undergoing decadal-scale accretion in
response to growth of the Atchafalaya prodelta. An area where underconsolidated silt and
clay is accumulating on the inner shelf (the eastern transects discussed in this study,
Profiles Tl through T7) corresponds to the section of the coast where mudflat
progradation occurs due to shoreward sediment transport during cold front events. The
central chenier plain coast is currently undergoing decadal-scale shoreline retreat, as
coastal marsh is lost to relative sea level rise (Chapters 2 and 3). This area, which had
prograded rapidly during activity of the Lafourche delta lobe between 1200 and 600 yrs
BP, now experiences rates of shoreline retreat that average 6.2 m/yr (see Chapter 3).
The lack of modem long-term coastal accretion on the central chenier plain is
consistent with the lack of long-term accumulation on the adjacent inner shelf. Because
mudflats on the eastern chenier plain grow in response to the action of cold fronts
resuspending sediment on an inner shelf dominated by modem accumulation of
Atchafalaya mud, it is hypothesized that the central chenier plain may eventually
experience similar accretion as the influence of the Atchafalaya prodelta extends farther
west along the inner shelf. As this occurs, the erosion surface that forms the sea floor on
the central chenier plain shelf will become the base of the new (Atchafalaya) sedimentary
sequence, and will be an unconformity if preserved in the geologic record. As
accumulation continues on the central chenier plain inner shelf, the concave sea floor
geometry should become convex as sigmoidal clinoforms prograde. The stratal geometry
of this central chenier plain would, several centuries from now, resemble that of the
modem eastern chenier plain (as imaged in Profile T3).
279
Sedimentation rates on the chenier plain, and on the Atchafalaya prodelta in
general, will likely increase after Atchafalaya Bay is filled (Tye and Coleman, 1989); the
filling of this bay at the river's mouth will lead to sediment bypass of the present
Atchafalaya Bay depocenter and increased deposition seaward of the Point au Fer shell
reef (Figure 4-2a). Bypassing of Atchafalaya Bay will provide a greater proportion of the
river's sediment load to the inner shelf relative to the amount it receives at this time,
which in turn will increase the rate at which sediment becomes available for westward
transport to the chenier plain. It has been estimated (Wells et al., 1984) that Atchafalaya
Bay will be filled within the next 40 years.
This scenario is proposed for the development of the chenier plain if the
Atchafalaya distributary were to develop in a manner consistent with natural delta-
switching processes. However, the growth of the Atchafalaya distributary is limited by
the control structure designed to prevent capture of the main Mississippi course (Chapter
1). For this reason, the Atchafalaya delta system is not expected to develop the vast
spatial extent and widespread stratigraphic influence that the Lafourche lobe had during
its activity, at least in the near future.
4.5. Conclusions
Acoustic, geochemical, and sedimentary facies data allow resolution of the
modem westward extent of the Atchafalaya prodelta. The influence of the Atchafalaya
River on inner shelf sedimentation is presently restricted to a thin, ephemeral surface
mixed layer west of ~92.55°W. East of that boundary, century-scale accumulation of
280
Atchafalaya mud occurs as sigmoidal clinoforms prograde. These distal prodelta deposits
on the eastern chenier plain shelf are homogenized by biogenic and physical mixing, with
little original stratification preserved. Areas of coastal accretion on the eastern chenier
plain correspond to the location on the inner shelf where underconsolidated Atchafalaya
prodelta sediment is present.
Mass balance calculations indicate that the eastern chenier plain coast and inner
shelf may be a sink for ~8 ± 2% of the Atchafalaya River's fine-grained sediment
discharge, or ~7 ± 2% of the total fluvial sediment load (including fine and coarse
fractions). Calculations based on data from previous studies indicate that only -59% of
the annual Atchafalaya sediment load can be accounted for with presently defined
accumulation rates in Atchafalaya Bay and on the prodelta; further study of the
southeastern extent of the prodelta is needed to better constrain the regional sedimentary
system. West of ~92.55°W, on the central chenier plain shelf, relict sediment is exposed
on the sea floor that was originally deposited between -1200 and 600 years BP, during
activity of the Lafourche delta lobe when major coastal progradation occurred on the
chenier plain. The central chenier plain (both the coast and inner shelf) currently
experiences net erosion, a trend which may reverse in the future as the influence of
Atchafalaya sedimentation extends farther west.
Acknowledgements
Funding for ship time and gamma analyses was provided by ONR in grant #
NOOO14-98-0083 to Gail Kineke. Funding for radiocarbon dating was provided by
student grants from the GSA Foundation and AAPG. Captain Mike Lassiter of the RN
281
Eugenie and crew (Hank and Hal) provided invaluable help by operating the vessel
during two cruises in June and July 2001. Mead Allison (Tulane University) provided the
kasten coring equipment and a portable X-ray machine for use at sea. Data collection
with the Knudsen echo sounder was managed by David Velasco of Boston College; other
field help was provided by Ryan Prime of Boston College and by Kristi Rotondo of LSU.
Ryan Prime and Katie Fernandez of BC assisted with grain size and porosity analyses.
Brad Moran (University of Rhode Island) processed samples on gamma counters at URL
Dr. Daniel Hecht, chief of staff at the Animal Emergency Center, Bridgewater, MA, is
thanked for allowing me to develop X-ray film on the hospital's automatic processor.
Mike Bothner and Ellen Mecray (US Geological Survey, Woods Hole office), and Lary
Ball (WHOI) provided laboratory space for sample preparation. Allen Boudreau of Gulf
Coast Seafood is thanked for allowing our party to use their dock in Freshwater Bayou at
night during time at sea. This project has been improved significantly by discussion with
Mead Allison, Sam Bentley (LSU), David Mohrig, Rocky Geyer, Ken Buesseler, Ed
Sholkovitz, and Mike Bothner.
282
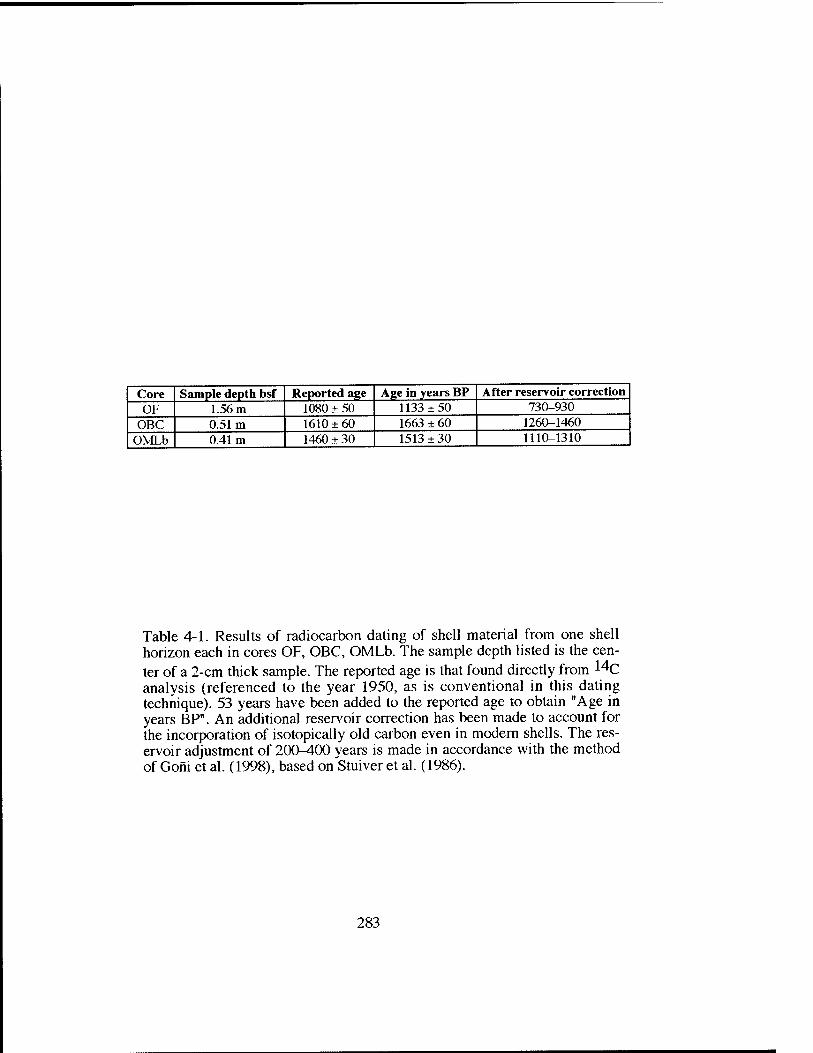
Core Sample depth bsf Reported age Age in years BP After reservoir correction OF 1.56 m 1080 ± 50 1133 ±50 730-930
OBC 0.51m 1610 ±60 1663 ± 60 1260-1460 OMLb 0.41m 1460 ±30 1513 ±30 1110-1310
Table 4-1. Results of radiocarbon dating of shell material from one shell horizon each in cores OF, OBC, OMLb. The sample depth listed is the cen- ter of a 2-cm thick sample. The reported age is that found directly from 14c analysis (referenced to the year 1950, as is conventional in this dating technique). 53 years have been added to the reported age to obtain "Age in years BP". An additional reser\'oir correction has been made to account for the incorporation of isotopically old carbon even in modem shells. The res- ervoir adjustment of 200-400 years is made in accordance with the method of Gofii et al. (1998), based on Stuiver et al. (1986).
283
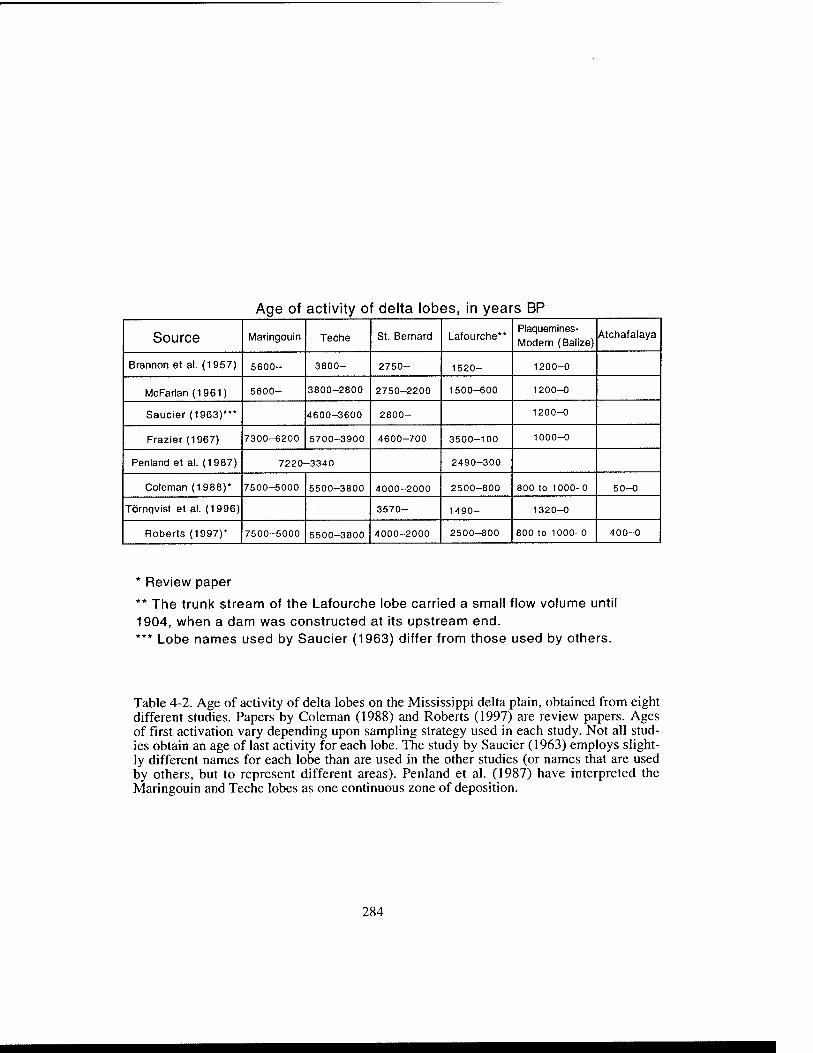
Age of activity of delta lobes, in years BP
Source Marlngouin Teche St. Bernard Lafourche** Plaquemlnes- Modern (Balize)
Atchafalaya
Brannon et al. (1957) 5600- 3800- 2750- 1520- 1200-O
McFarlan(1961) 5600- 3800-2800 2750-2200 1500-600 1200-0
Saucier (1963)*** 4600-3600 2800- 1200-0
Frazier (1967) 7300-6200 5700-3900 4600-700 3500-100 1000-0
Penlandel al. (1987) 7220-3340 2490-300
Coleman (1988)* 7500-5000 5500-3800 4000-2000 2500-800 800 to 1000-0 50-0
Tornqvist et al. (1996) 3570- 1490- 1320-0
Roberts (1997)* 7500-5000 5500-3800 4000-2000 2500-800 800 to 1000-0 400-0
* Review paper
** Tine trunk stream of the Lafourche lobe carried a small flow volume until 1904, when a dam was constructed at its upstream end. *** Lobe names used by Saucier (1963) differ from those used by others.
Table 4-2. Age of activity of delta lobes on the Mississippi delta plain, obtained from eight different studies. Papers by Coleman (1988) and Roberts (1997) are review papers. Ages of first activation vary depending upon sampling strategy used in each study. Not all stud- ies obtain an age of last activity for each lobe. The study by Saucier (1963) employs slight- ly different names for each lobe than are used in the other studies (or names that are used by others, but to represent different areas). Penland et al. (1987) have interpreted the Maringouin and Teche lobes as one continuous zone of deposition.
284
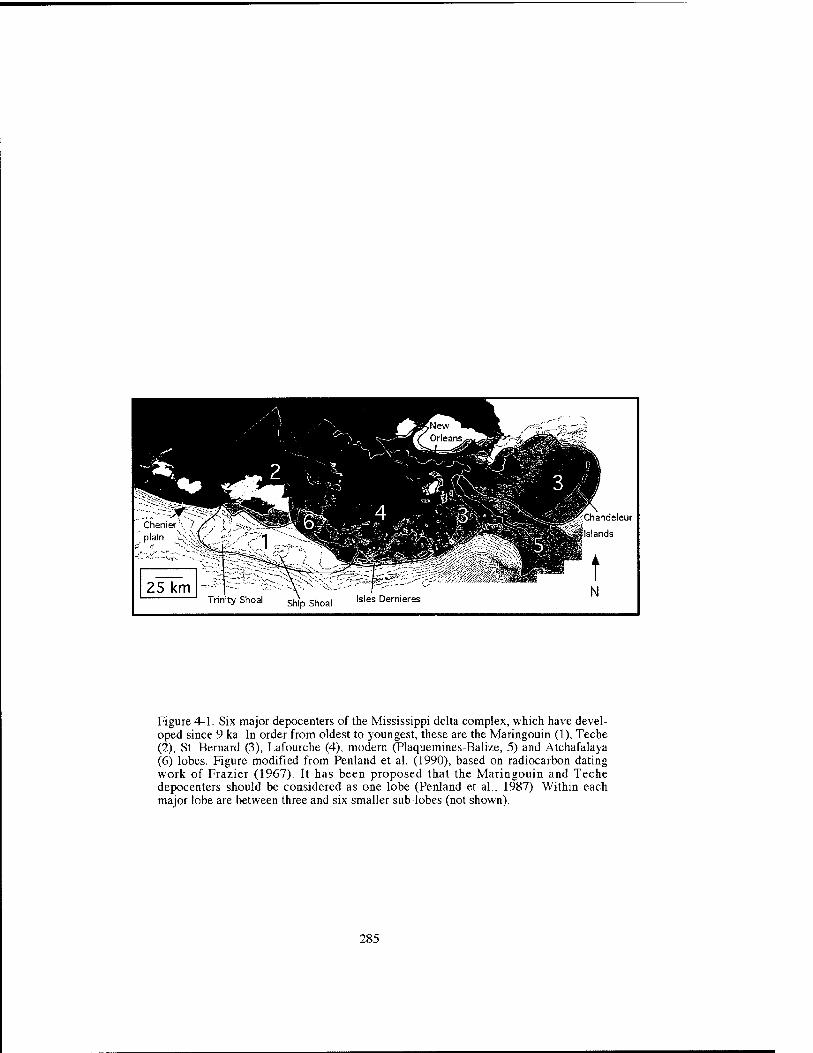
Figure 4-1. Six major depocenters of the Mississippi delta complex, which have devel- oped since 9 ka. In order from oldest to youngest, these are the Maringouin (1), Teche (2), St. Bernard (3), Ixifourche (4), modem (Plaquemines-Bali/.e, 5) and .Alchafalaya (6) lobes. Figure modified from Penland et al. (1990), based on radiocarbon dating work of Frazier (1967). It has been proposed that the Maringouin and Teche depocenters should be considered as one lobe (Penland et al., 1987). Within each major lobe are between three and six smaller sub-lobes (not shown).
285
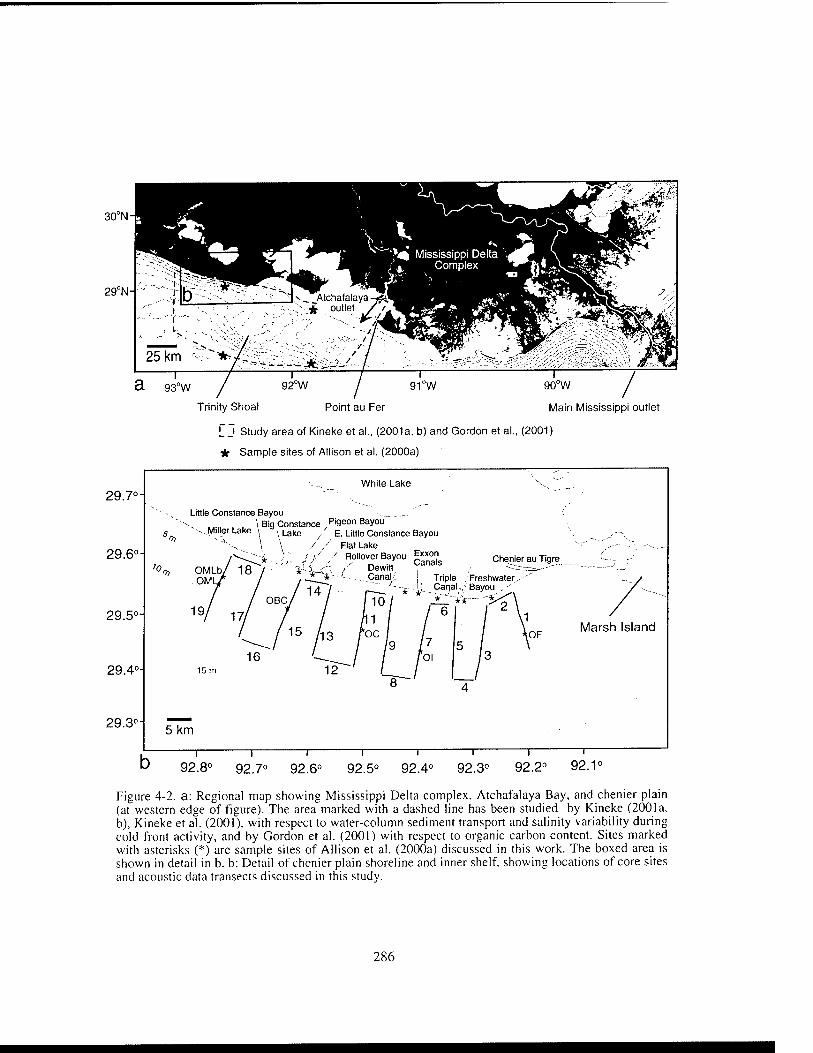
30°N
29°N- -
gs'w / 92°w / grw 90°w /
Trinity Shoal Point au Per Main Mississippi outlet
L J Study area of Kineke et al., (2001a, b) and Gordon et al., (2001)
* Sample sites of Allison et al. (2000a)
29.7°
29.6°
29.5°
29.4°-
29.3°-
'0
White Lake
Little Constance Bayou _ _ . ., I Big Constance Pigeo" Bayou
5^ --..Miller Lake \ , igke .' E. Little Constance Bayou \ \ //■' Flat Lake
- i , "^ / ;/ / Rollover Bayou 1^"°? , ^„^* •'■',-■ </ .' r^ J Canals
OMLb/ 18 / V-i^V-: I Dewitt OM!
■ 14
'Tl
15m
Chenier au Tigre
Canals j Triple , Freslnwater^ '" j. .n Canal,, Bayou ,'
Marsh Island
5 km
92.8° 92.7° 92.6° 92.5° 92.4° 92.3° 92.2° 92.1°
Figure 4-2. a: Regional map showing Mississippi Delta complex. Atchafalaya Bay, and chenier plain (at western edge of figure). The area marked with a dashed line has been studied by Kineke (2001a, b), Kineke et al. (2001), with respect to water-column sediment transport and salinity variability during cold front activity, and by Gordon et al. (2001) with respect to organic carbon content. Sites marked with asterisks (*) are sample sites of Allison et al. (2000a) discussed in this work. The boxed area is shown in detail in b. b: Detail of chenier plain shoreline and inner shelf, showing locations of core sites and acoustic data transects discussed in this study.
286
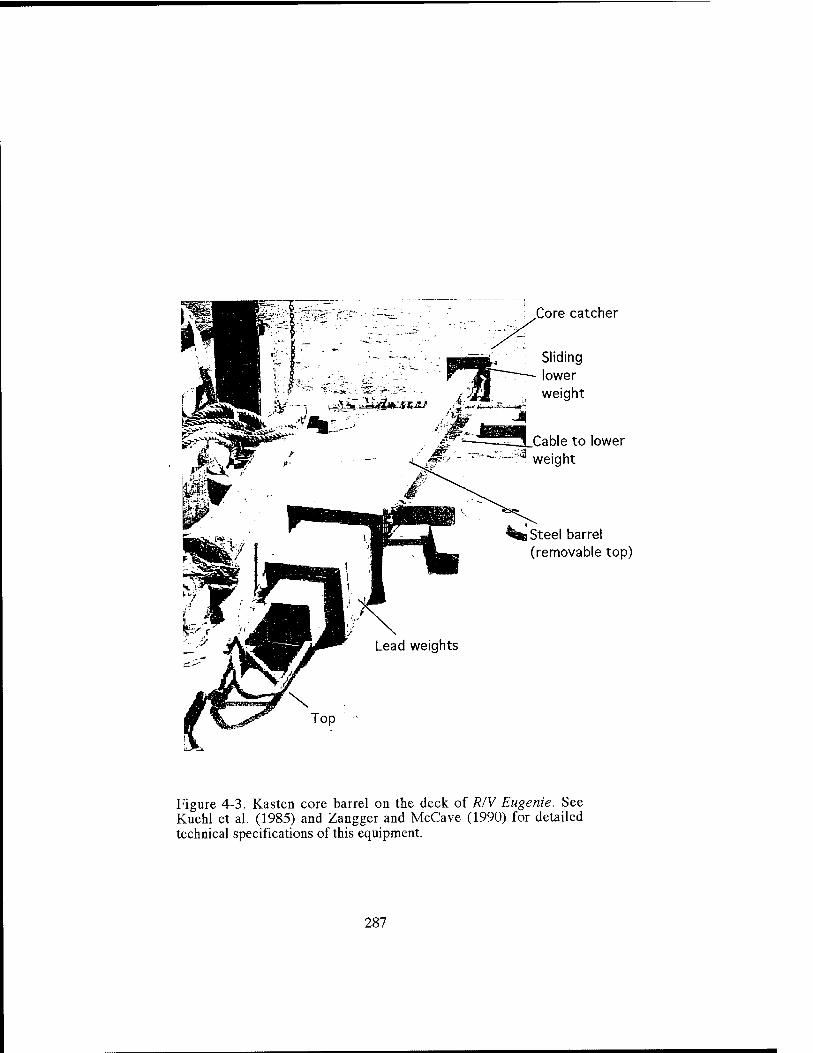
/ <#^ weight
Core catcher
Sliding lower
Lead weights
Cable to lower weight
Steel barrel (removable top)
Figure 4-3. Kasten core barrel on the deck of R/V Eugenie. See Kuehl et al. (1985) and Zangger and McCave (1990) for detailed technical specifications of this equipment.
287
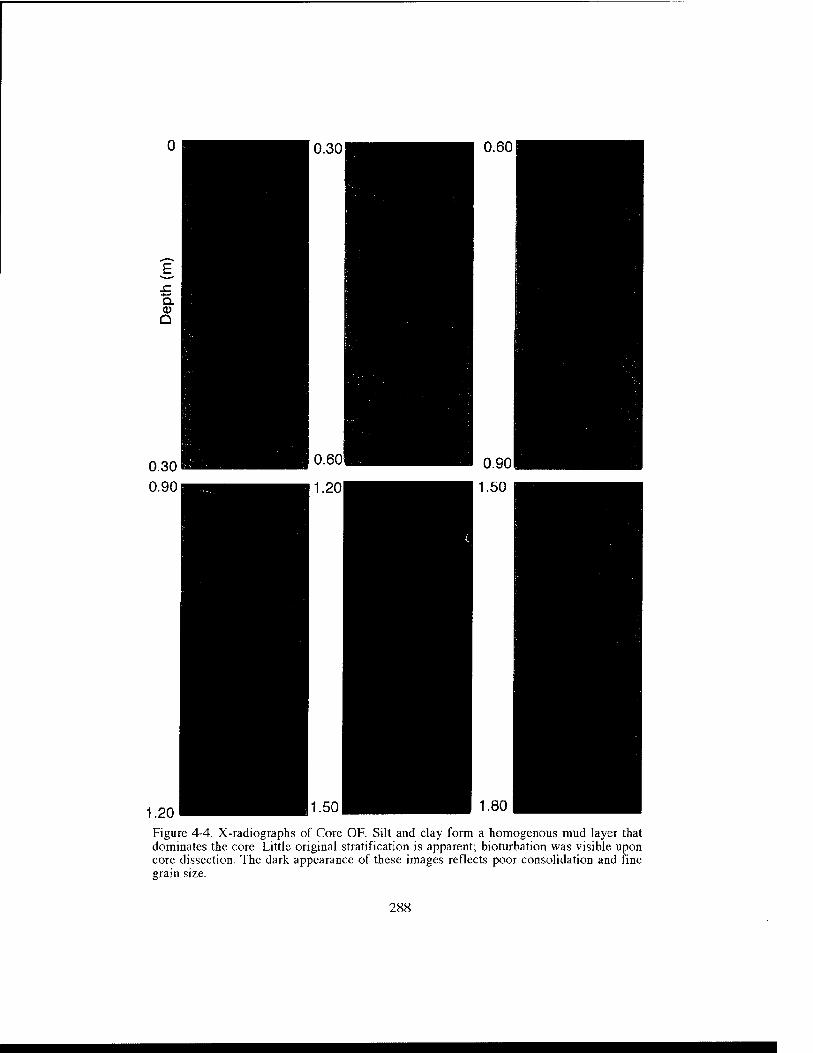
1.20 Figure 4-4. X-radiographs of Core OF. Silt and clay form a homogenous mud layer that dominates the core. Little original stratification is apparent; bioturbation was visible upon core dissection. The dark appearance of these images reflects poor consolidation and fine erain size.
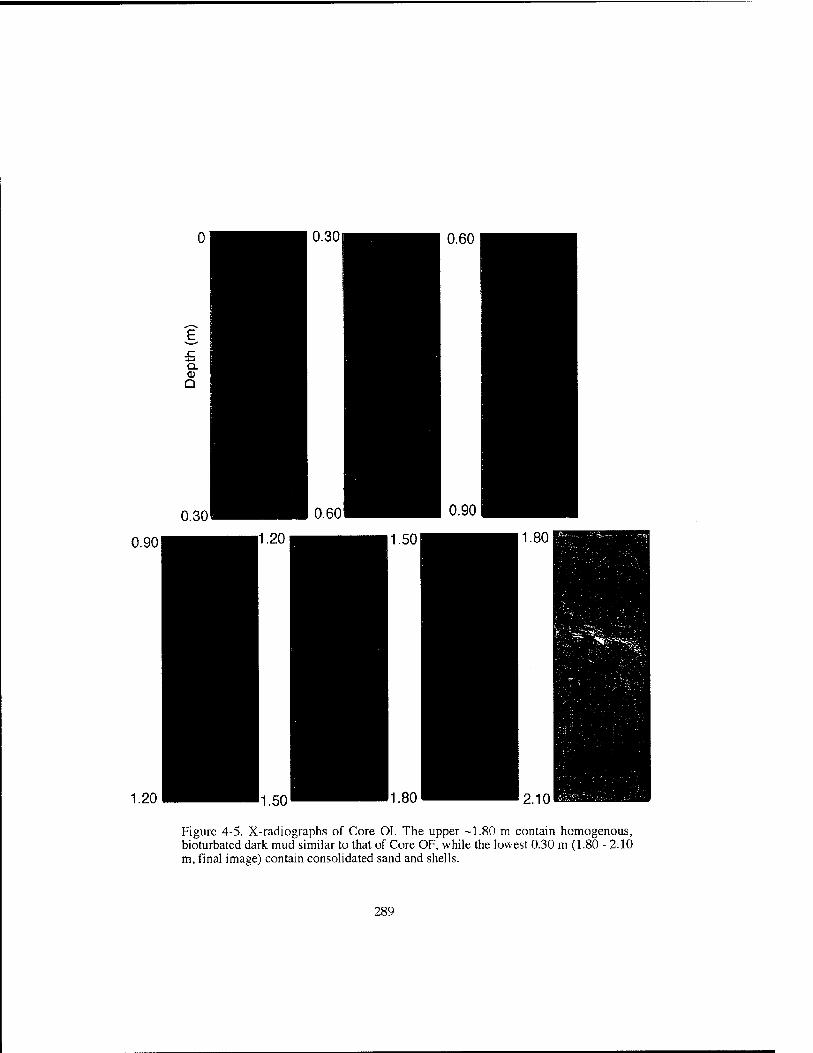
0.90
1.20
Figure 4-5. X-radiographs of Core OI. The upper -1.80 m contain homogenous, bioturbated dark mud similar to that of Core OF, while the lowest 0.30 m (1.80 - 2.10 m, final image) contain consolidated sand and shells.
289
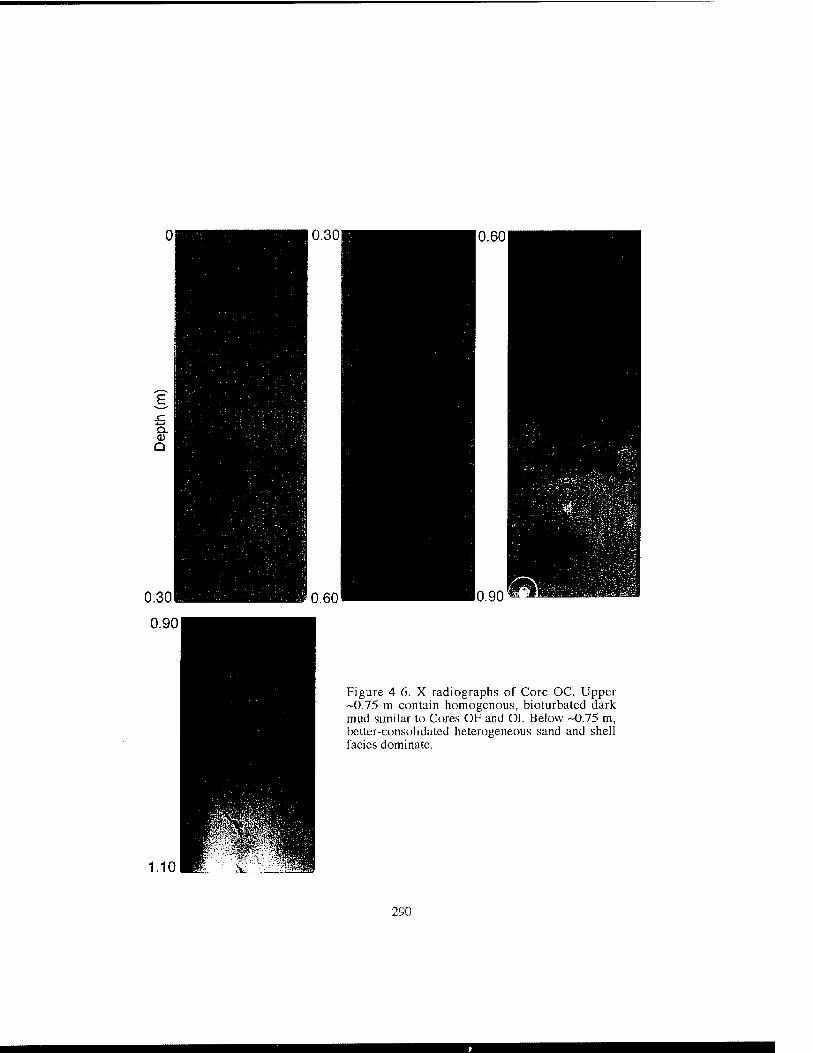
0.30
0.60
0.60
0.90
Figure 4 6. X-radiographs of Core OC. Upper -0.75 m contain homogenous, bioturbated dark mud similar to Cores OF and Ol. Below ~0.75 m, belter-consolidated heterogeneous sand and shell facics dominate.
290
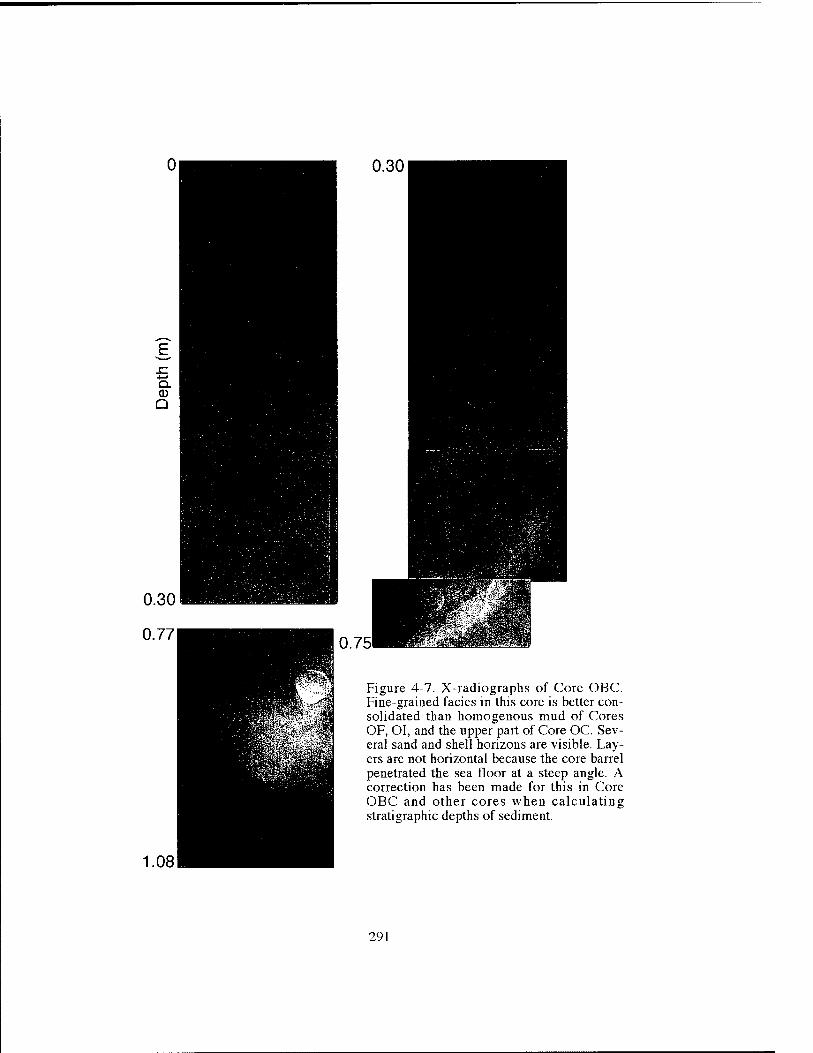
0.30
0.75
Figure 4-7. X-radiographs of Core OBC. Fine-grained facies in this core is better con- solidated than homogenous mud of Cores OF, OI, and the upper part of Core OC. Sev- eral sand and shell horizons are visible. Lay- ers are not horizontal because the core barrel penetrated the sea floor at a steep angle. A correction has been made for this in Core OBC and other cores when calculating stratigraphic depths of sediment.
291
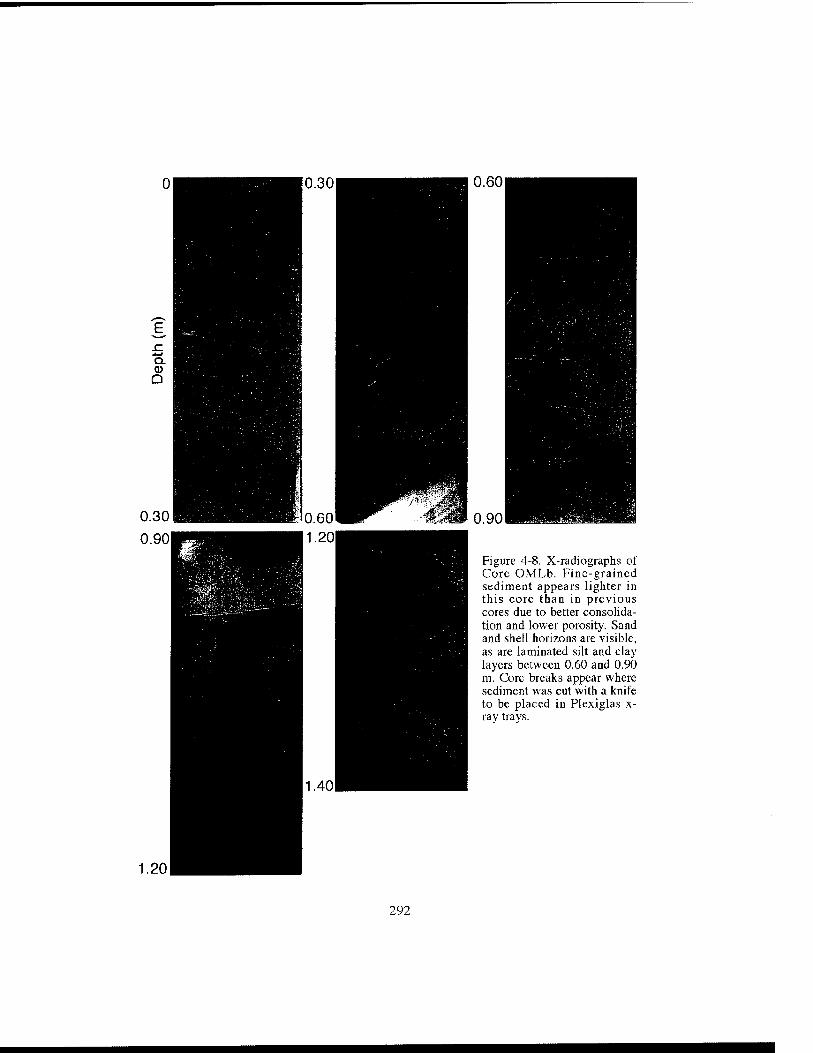
0.60
0.90
Figure 4-8. X-radiographs of Core OMLb. Fine-grained sediment appears lighter in this core than in previous cores due to better consolida- tion and lower porosity. Sand and shell horizons are visible, as are laminated silt and clay layers between 0.60 and 0.90 m. Core breaks appear where sediment was cut with a knife to be placed in Plexiglas x- rav travs.
1.20
292
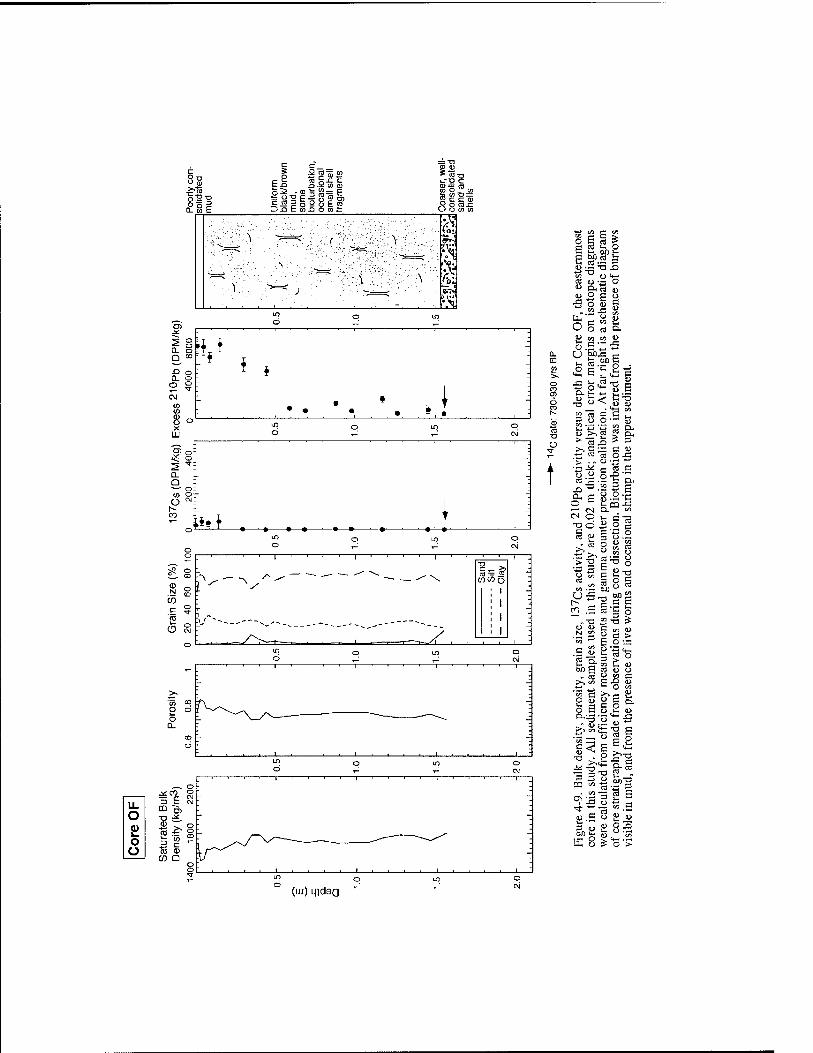
o o
a>zs xz c = E
OJ
= T3
Q ; flJ . w o •a m"■w_ g c c <u O 8 CO tn
0. m
i^ D. Q '— I
o ' CO
- li ll
CD N
c 'ra CD
. 111111 1 1 i 1 1 • 1 1 1 1 j
"""""^:""-..... >
1 .
1
o CO
o
O
O (M
C c 0
1 1 1 1 1 1 1 1
.
55 c c > O g cd £
i_i OX) J-"
«j := "O ^ en o ^♦-' ffl U-- O
u o f: o ■S o 53 s!
- 23 •= tL, S a W (« cfl 4) 2 -- O .B '^ ■!-.
j^ E3.£Pg . o c >- c ti
3 O O •-' S 2'i3-s a Q.
>i3i ^ 3 £-,«•- g J> .ti ™ ca O J3
Qj CO
.£ 1=
o "^^
T3 O £
^ " I t/; CC 03 O
O > -o 3 "^ •■33 = 0^
" »:, 5 8 § U£T3 M|
«■§ O ^.S
N m d >
g b „ E
fH ^ <1> ■
Dfl P rt 4J O . rt <i^ « d
■*-« — O c/)
O [=! <U ,1- CL> ^-•■3 -5 '^^ 3
u S '^ E ij 1,2 2 8 .-e
tL. O ? O >
(LU) Llldsa
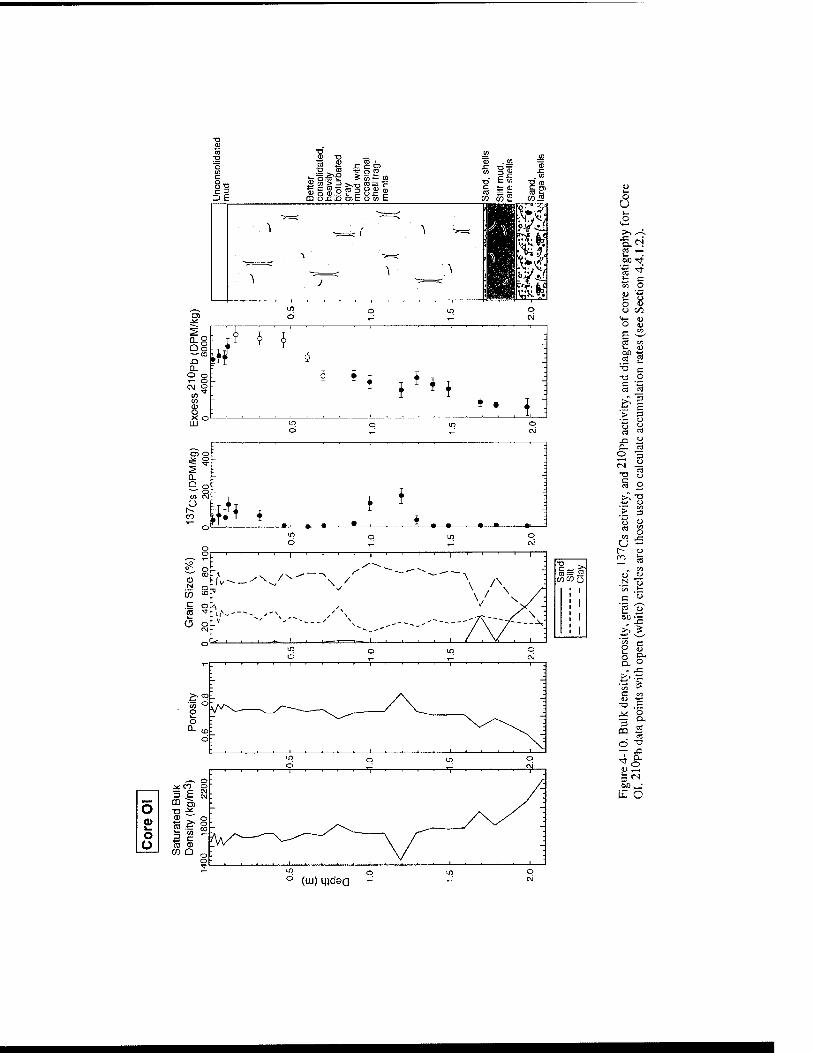
a> o o
51
O -D — ^ 3 jr ci -— >>J3 > — >
^ cn > :D >,T3 CD z ;sB§.os|8' CD O.C.Q CTE O ^E CO CO g
T- ^ - ' 1 in 6 q ''^ o
Qo
»*' ^ ^ •^
Q.
OJ o
9 - -
i * . {*M
* • J, : a> o : ■s ^ ". > ■
Q. - - D o ;
* . .
U3 CM
O CO ^y i
■ • ■■ m • • *
-—•—• ^
0) N
(73 c
2 5
1 ' ' ' 1 ' 1 1 1 1 ' ' ' ■ I.I 1 .
._-/\ ̂ /^-'~ "^
^ -'~^~_ —
~\/v. /" ^ y. xT -
■ V
■— " ^ ^ ^^'^^^^ _/ \ ^ --. ''""-- _ - - ''/\~"~ ~" 7*^ -
-h. 1 _...- _fc--T h-^ 1 ■ 1 ■
o u
& CN
2 00
^ -*
ffl ■*
to § QJ
r) U o C/2
■*- 11) u
F w
rn w ftf <5j li! •a C •n o c "2 <T1 m >-. 3
E > =! ^ ^ JD aj
o- c« o 3
(N O
D
fe 2 >> ■a
> OJ
C3 i^ p.
I; r- OJ ro fe
C/3 (1) OJ N
(/I >- C o
<u ou
j:
p^ ■«
s n c
Cl- „ x: ^ Vi
■|
(Z
-a V o
cS
o -a ■^- X2
4 a. ii;
3 N
00 K-:
E O
(oi) Mjdea -
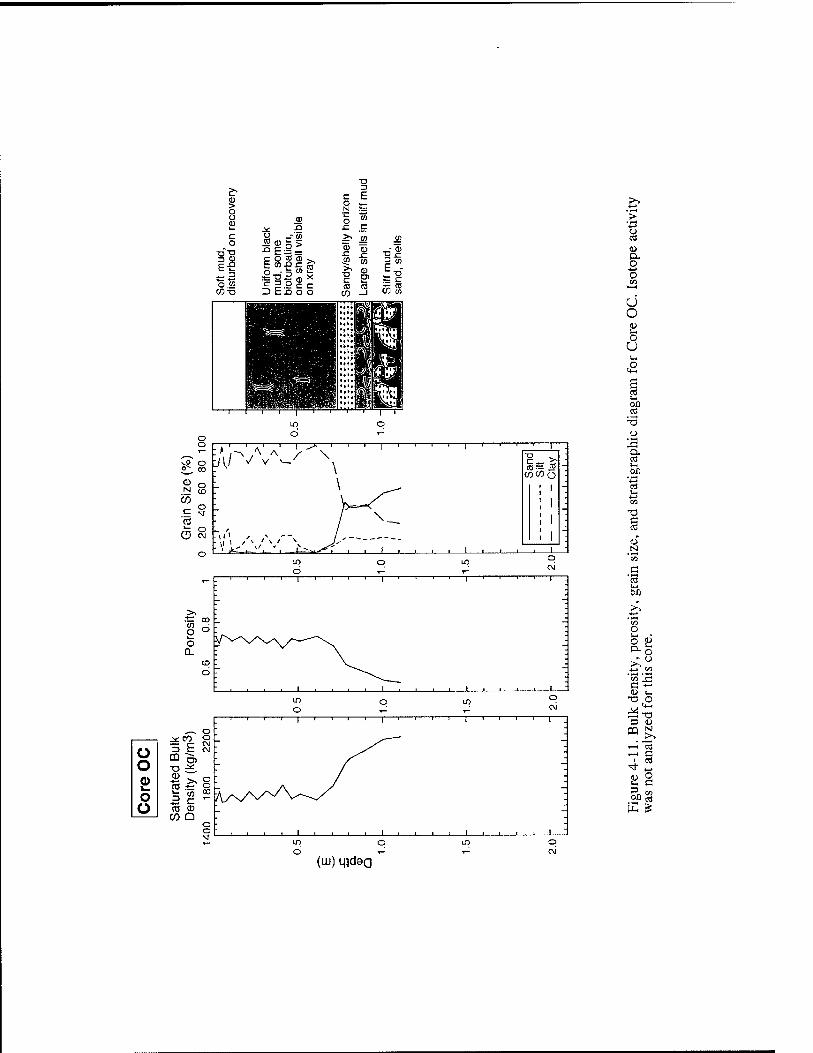
o o 0) o o
o o
^ o m
N o (n o (_ \r m O o
~t 1 1 1 r 1 r 1 ] 1——1 r-
^ ' -1— L j 1 i_
UO O LO ^ O
CNJ 1 1 1 1 1 III''
: >, . .t: CD - So ; O _ 0. :
CD v__^^ : O
1 1 1 1 1
:
'> O ca u a o
O O
(L>
O U
e
o 2 a. •A
c CC
N
00
o « p- o
f) >. Vi ,r! c ■*-•
a> Uw T1 o ^ ,s»S -o 3 (U
PQ N
,__, CD 1—1
1 ctl ^ J_,
<ii q iH a 3 01 m m ^
(Lu) Hideo
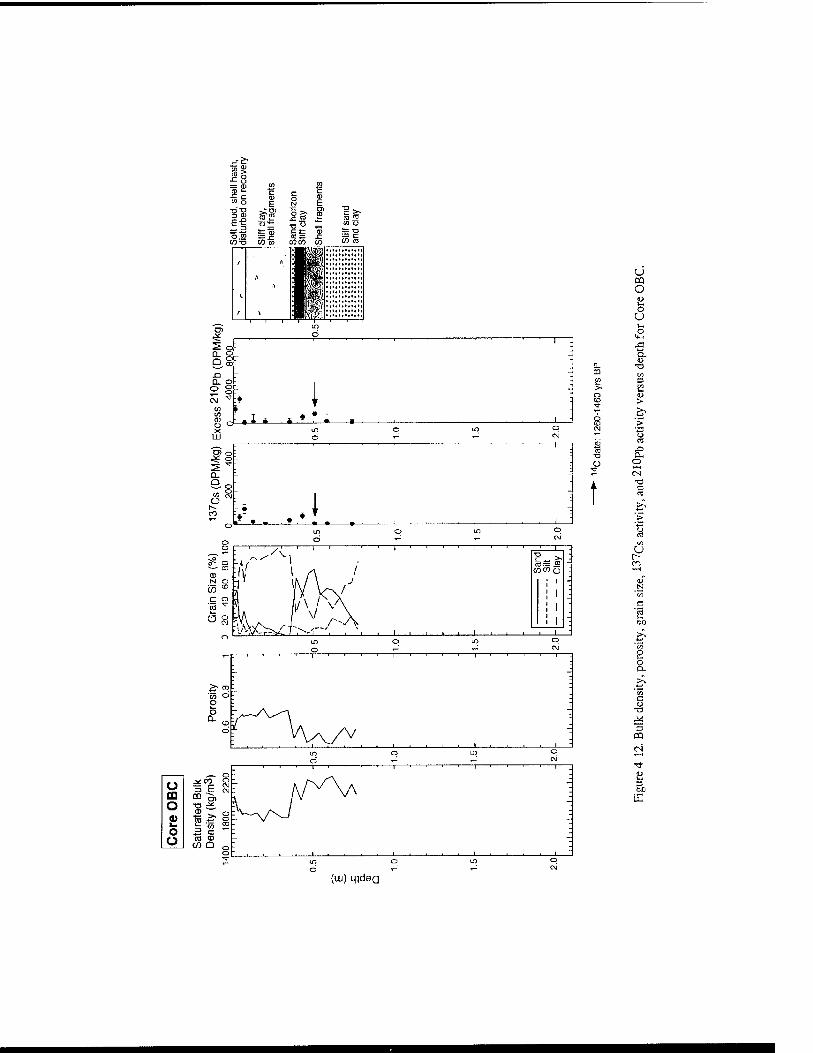
E-e
c CD E si t-
§> « O
:t= a> = s= (D 3= "O
CO CO /J(/i w
O ^ CO =3 E m CD O) o
CD 7S^ '- « O a c o (0 <D
CO Q
u DQ o <o o u V- o ^ CL o
Q. •o m t« f" 3 >s S2 o o
CO > >,
to > CM '.—1
CS
ffi ^ ■a CL,
o r- (N
i •o
CO
o
c <u
OQ
Tf !"
(LU) mdea
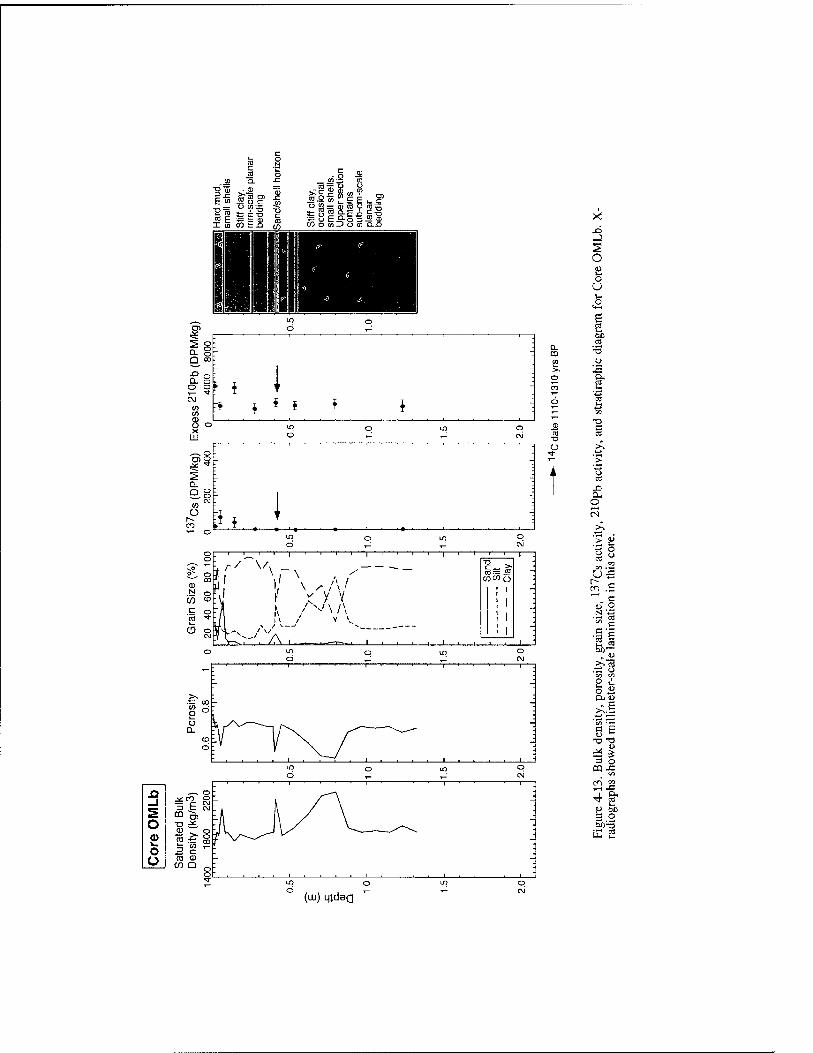
^ -^- ^ tu O]
•o ^
O)
=;: in ;_ J
Q CO -
fg ? ? i i ' r ^
to -* i * * t * ^ to
a. CD
O E o U
e e
"■3
03
111
D
O CO i^ i
o
13 _l
o
rk m ^ CVJ
o "S — £ ro.^ § o 3 c ' o
o
O O
u x: I-- in
r (I) o N to C3
13 ■=3 E bf '
m >-.'c5 .^ u EW o s lU in. o >^ B
!1) fc ■o -o J^
V
3 o m JZ
r*^, c«
4 1;^ '^O
3 o 00 T3
(uj) Ljjdaa
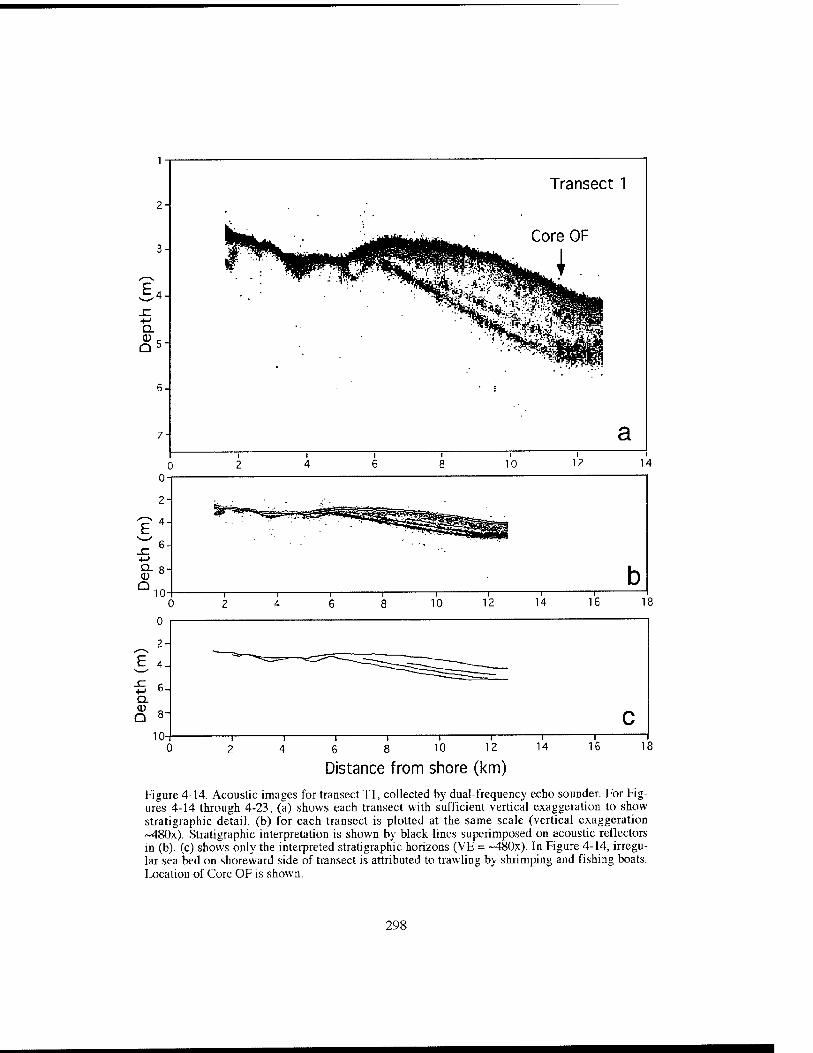
2-
3-
Q.
a 5
Transect 1
a
Distance from shore (km) Hgure 4-14. Acoustic images for transect 11, collected by dual-frequency echo sounder. For Fig- ures 4-14 through 4-23, (a) shows each transect with sufficient vertical exaggeration to show stratigraphic detail, (b) for each transect is plotted at the same scale (vertical exaggeration ~480x). Stratigraphic interpretation is shown by black lines superimposed on acoustic reflectors in (b). (c) shows only the interpreted stratigraphic horizons (VE = ~480x). In Figure 4-14, irregu- lar sea bed on shoreward side of transect is attributed to trawling by shrimping and fishing boats. la)cation of Core OF is shown.
298
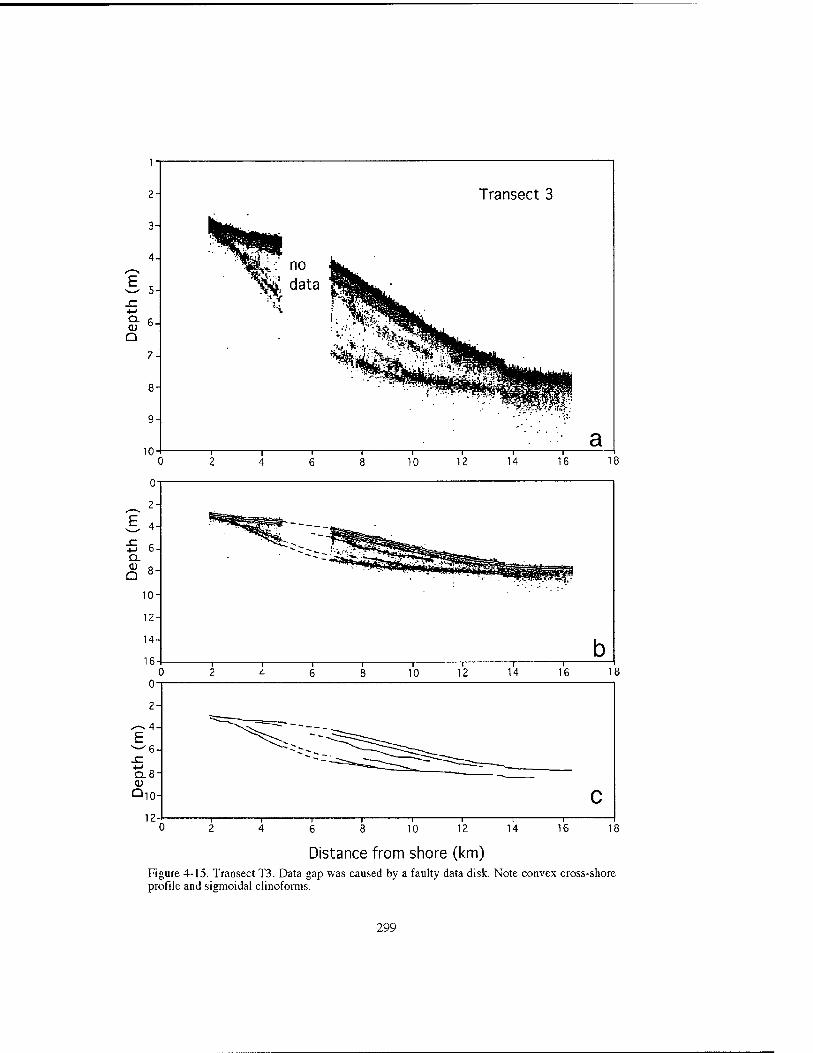
Distance from shore (km) Figure 4-15. Transect T3. Data gap was caused by a faulty data disk. Note convex cross- profile and sigmoidal clinofoiTns.
shore
299
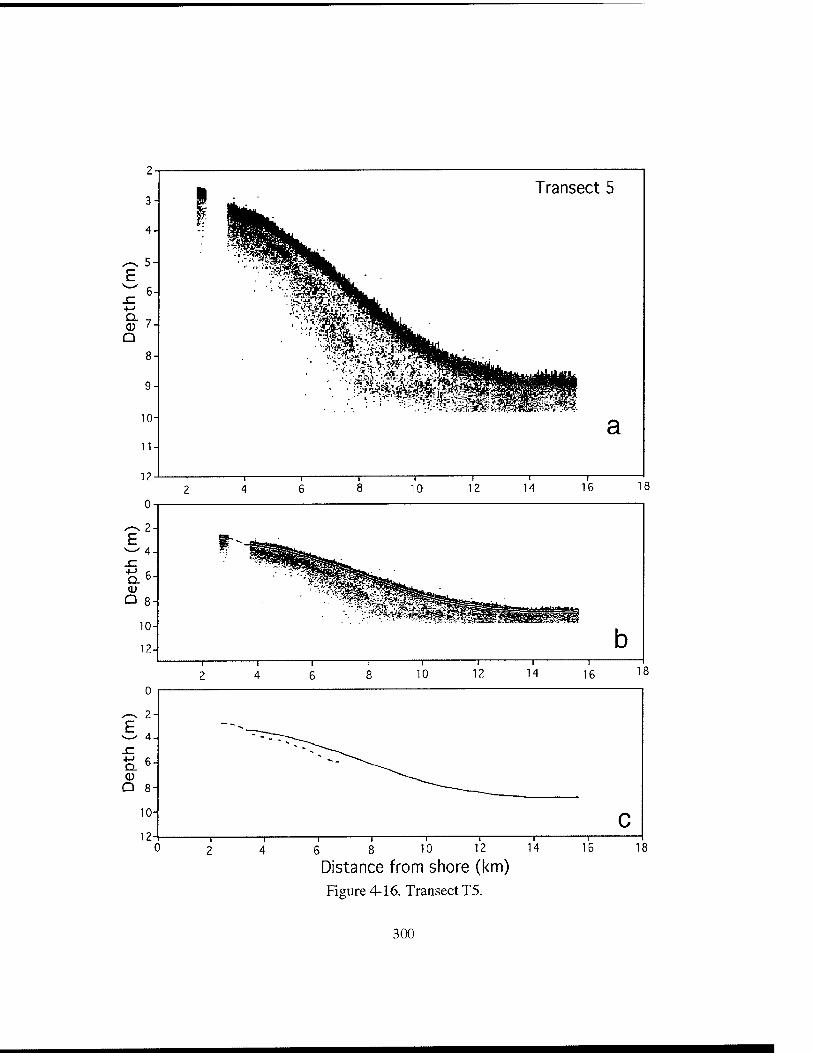
6 8 10 12 14
Distance from shore (km) Figure 4-16. Transect T5.
300
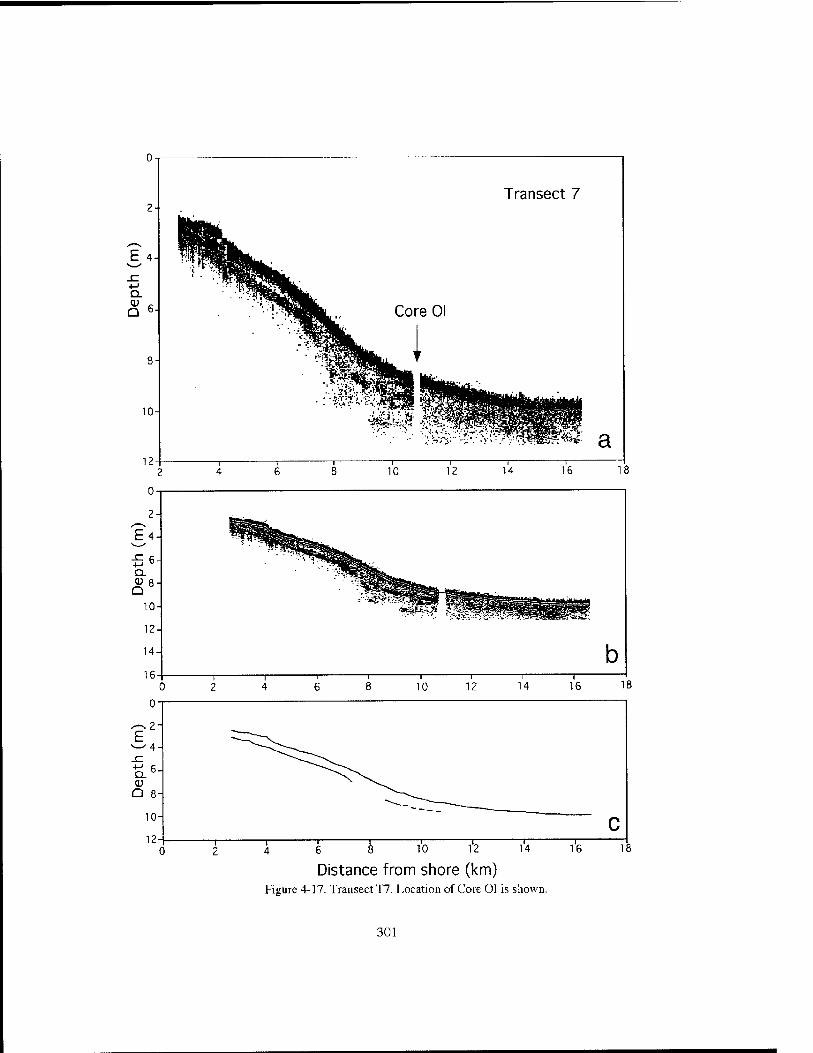
Transect 7
Core 01
Distance from shore (km) Figure 4-17.'] rausect'17. Location of Core 01 is shown.
301
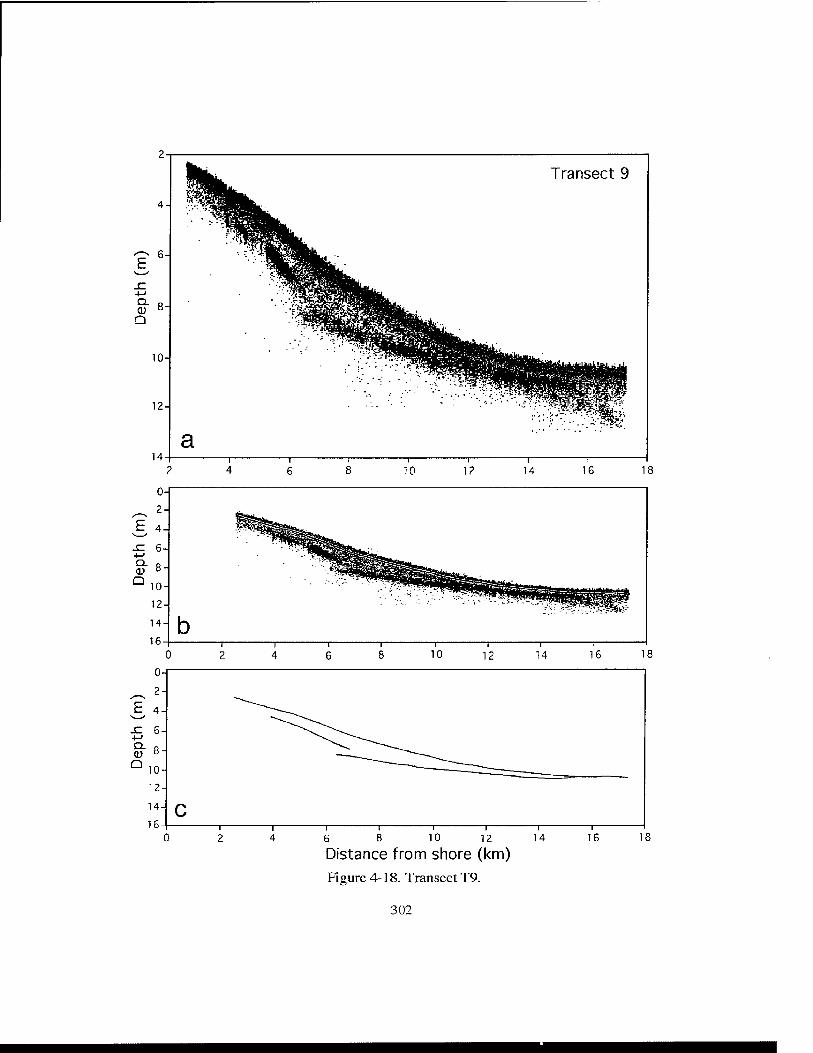
10 12
Distance from shore (km) Figure 4-18. Transect T9.
T 14
302
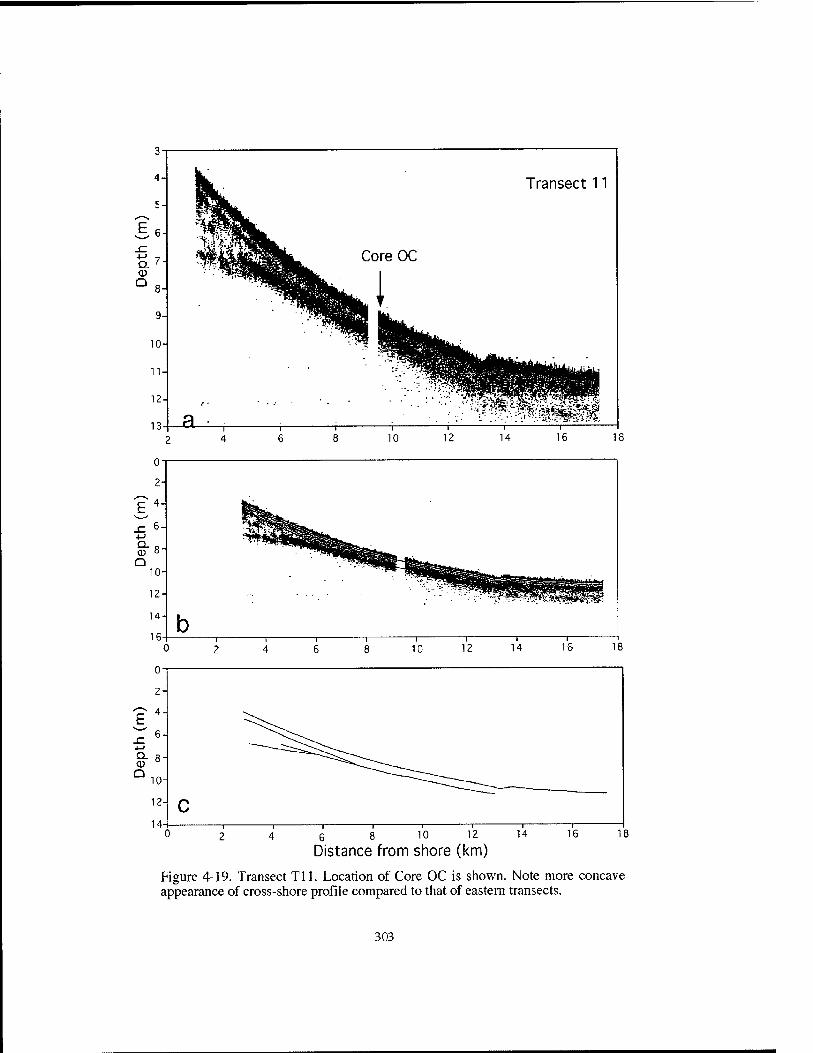
3'
4-
5-
6-
^8
9-
10
11-
12-
13
Transect 11
£L
Core OC
■■-- . •-■ ■'>
^ -; ^'i;?'^-^;^;^^^^^
—1—
10 —I—
12 14 16 18
6 8 10 12 14
Distance from shore (km) 16 18
Figure 4-19. Transect Til. Location of Core OC is shown. Note more concave appearance of cross-shore profile compared to that of eastern transects.
303
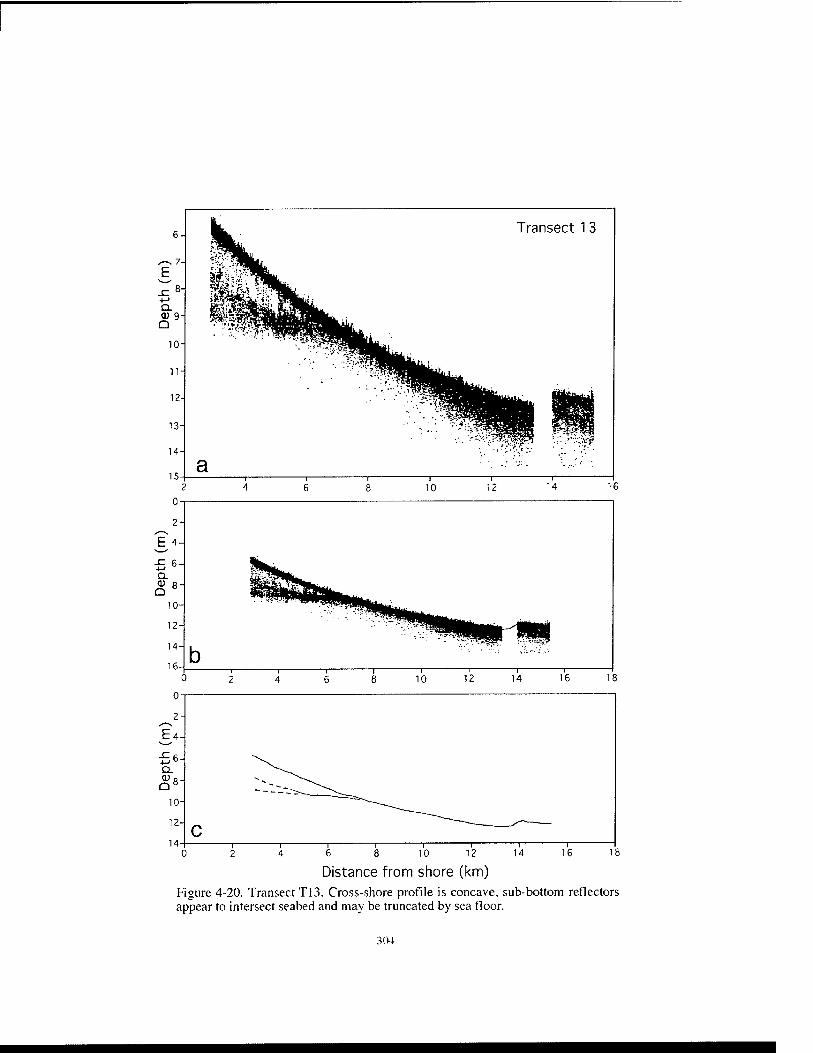
Distance from shore (km) Figure 4-20. Transect T13. Cross-shore profile is concave, sub-bottom reflectors appear to intersect seabed and may be truncated by sea floor.
MU
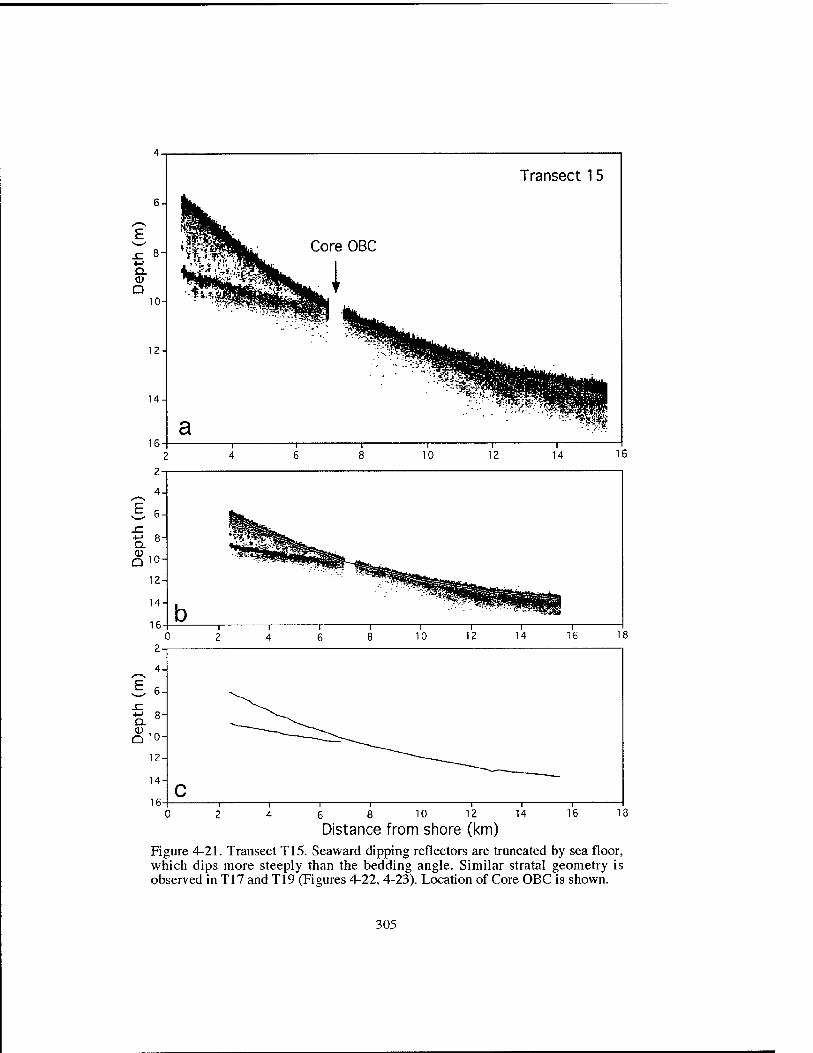
8-
Q 10-
12
14
16
Transect 15
Core OBC
—1— 14 16
6 8 10 12 14
Distance from shore (km) 16
Figure 4-21. Transect T15. Seaward dipping reflectors are truncated by sea floor, which dips more steeply than the bedding angle. Similar stratal geometry is observed in T17 and T19 (Figures 4-22, 4-23). Location of Core OBC is shown.
305
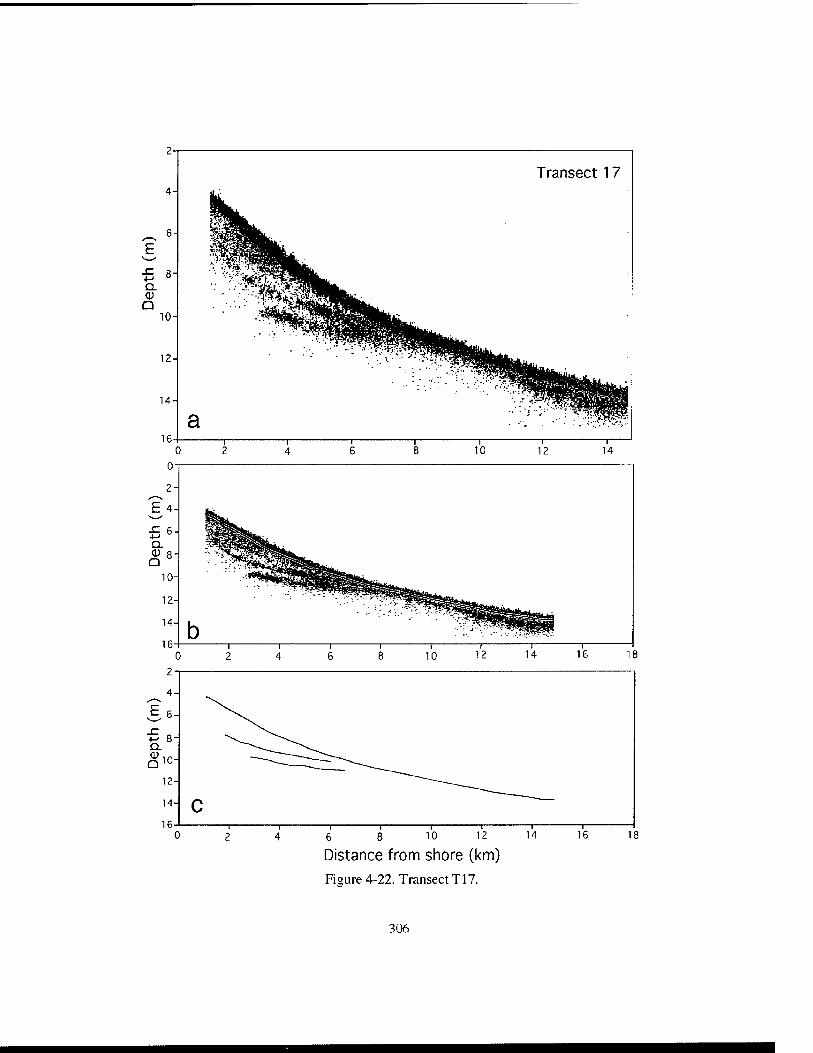
Transect 17
6 8 10 12
Distance from shore (km)
Figure 4-22. Transect T17.
3C)6
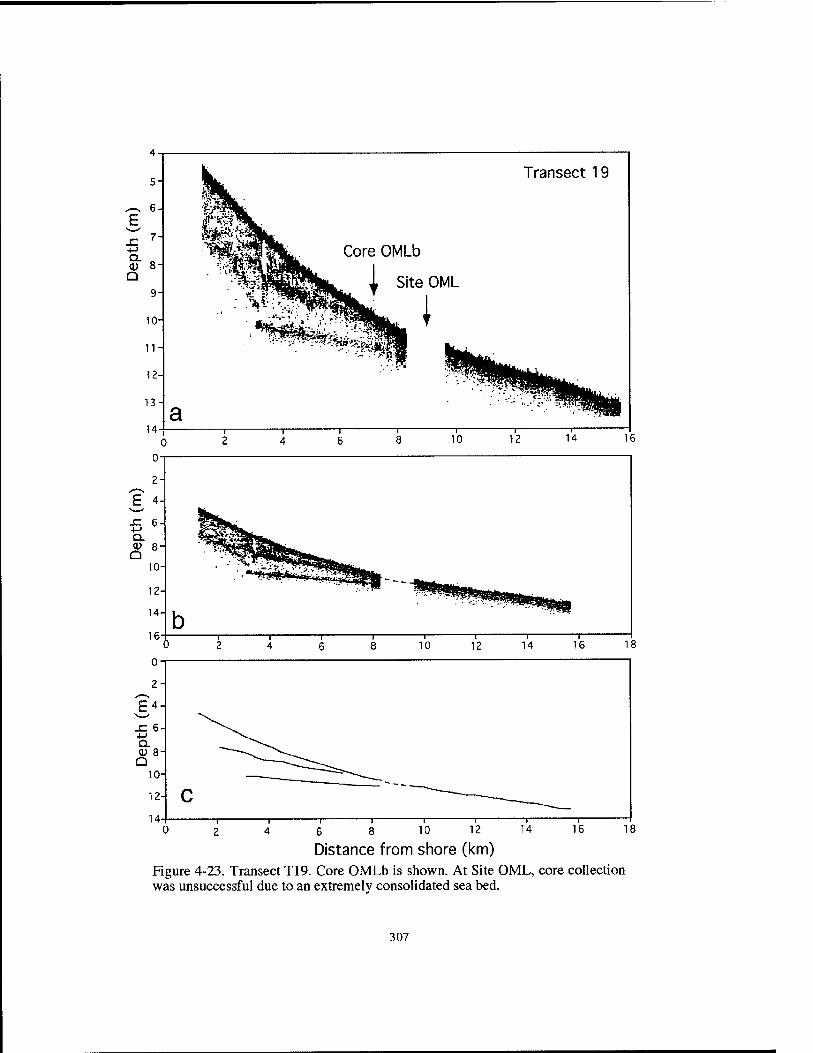
Transect 19
0 2 4 6 8 10 12 14 16 18
Distance from shore (km) Figure 4-23. Transect T19. Core OMLb is shown. At Site OML, core collection was unsuccessful due to an extremely consolidated sea bed.
307
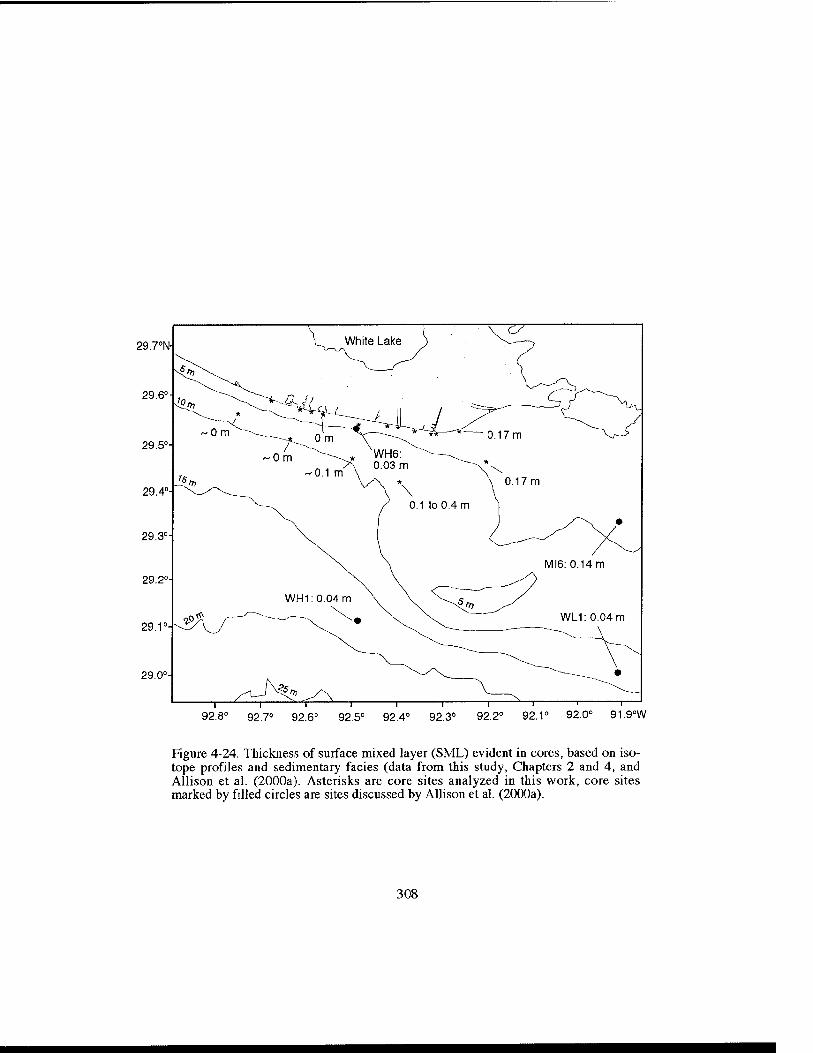
ag.yN-
29.6°
29.5°
29.4°-
29,3°-
29.2°
29.1°-
29.0°
1 ' 1 "1 1 1 1 1 —I 1 r- 92.8° 92.7° 92.6° 92,5° 92.4° 92.3° 92.2° 92.1° 92.0° 91.9°W
Figure 4-24. Thickness of surface mixed layer (SML) evident in cores, based on iso- tope profiles and sedimentary facies (data from this study, Chapters 2 and 4, and Allison et al. (2000a). Asterisks are core sites analyzed in this work, core sites marked by filled circles are sites discussed by Allison et al. (2(X)0a).
308
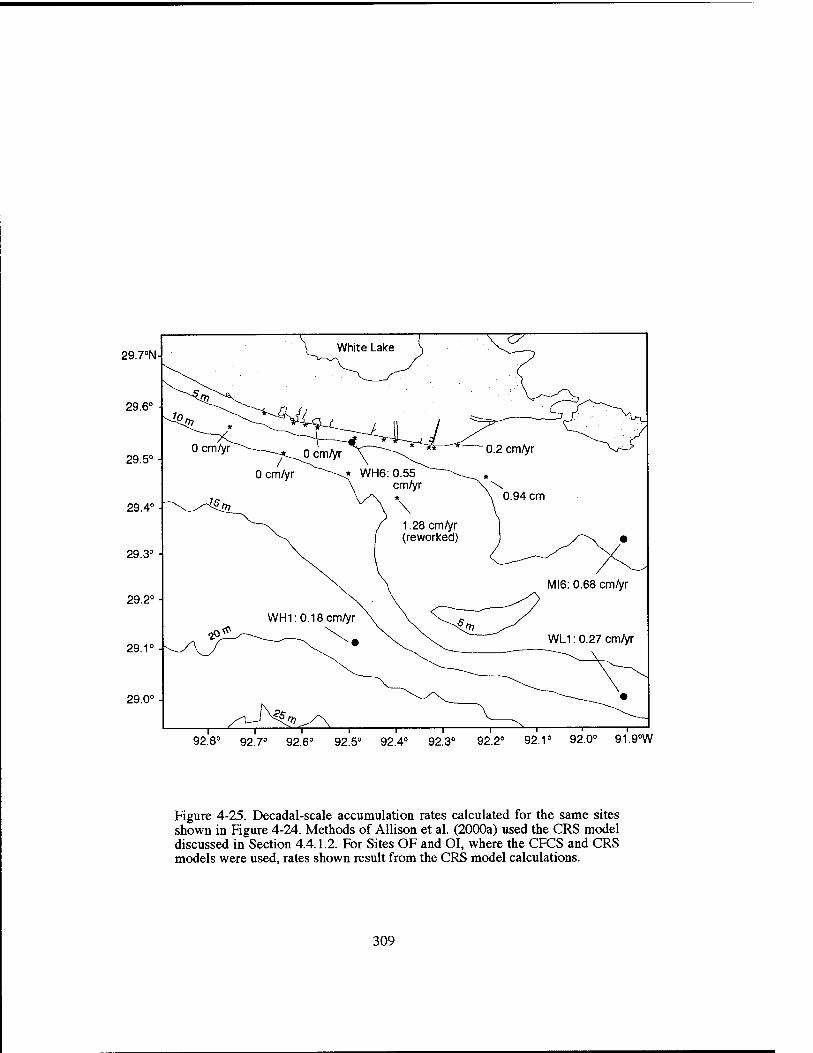
29.7='N
29.6°
29.5°
29.4°
29.3° ■
29.2°
29.1° -
29.0°
_l . 1 , 1 , ,
92.8° 92.7° 92.6° 92.5° 92.4° 92.3° 92.2° 92,1° 92.0° 91.9°W
Figure 4-25. Decadal-scale accumulation rates calculated for the same sites shown in Figure 4-24. Methods of Allison et al. (2000a) used the CRS model discussed in Section 4.4.1.2. For Sites OF and OI, where the CFCS and CRS models were used, rates shown result from the CRS model calculations.
309
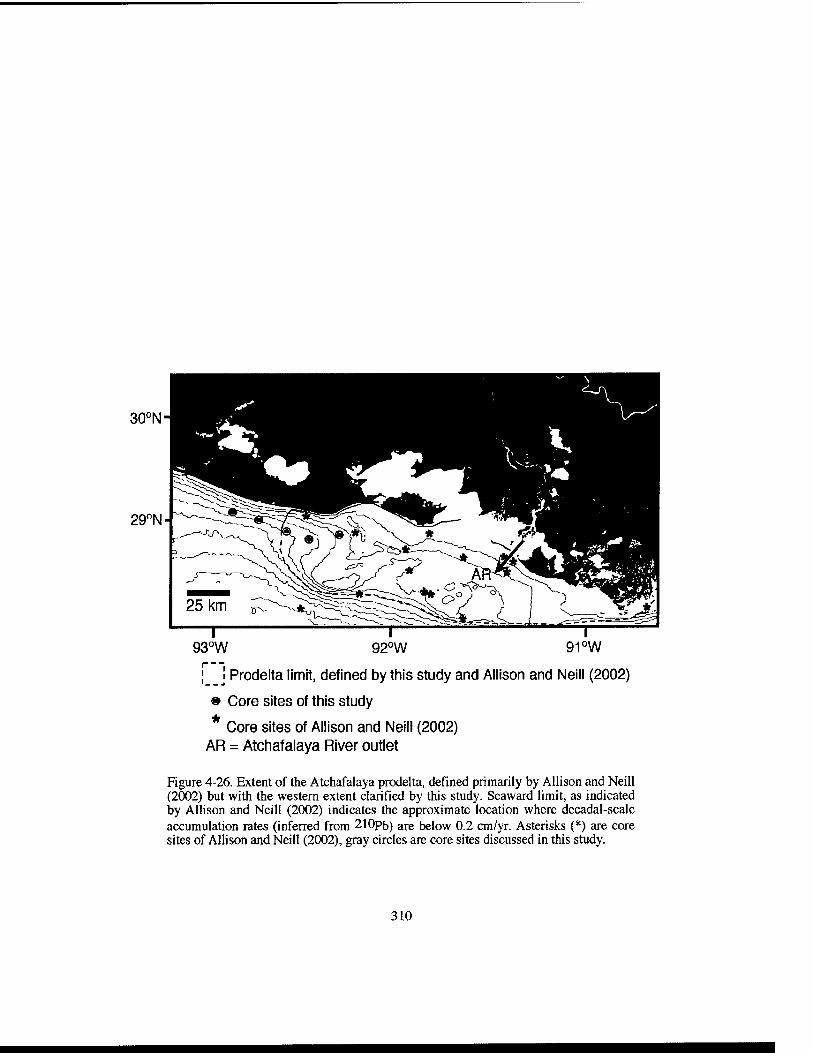
30°N
29°N-
T 1 r 93°W 92°W 91 °W
j_ j Prodelta limit, defined by this study and Allison and Neill (2002)
® Core sites of tfiis study
* Core sites of Allison and Neill (2002) AR = Atchafalaya River outlet
Figure 4-26. Extent of the Atchafalaya prodelta, defined primarily by Allison and Neill (2002) but with the western extent clarified by this study. Seaward limit, as indicated by Allison and Neill (2002) indicates the approximate location where dccadal-scalc accumulation rates (inferred from 210pb) are below 0.2 cm/yr. Asterisks (*) are core sites of Allison and Neill (2002), gray circles are core sites discussed in this study.
310
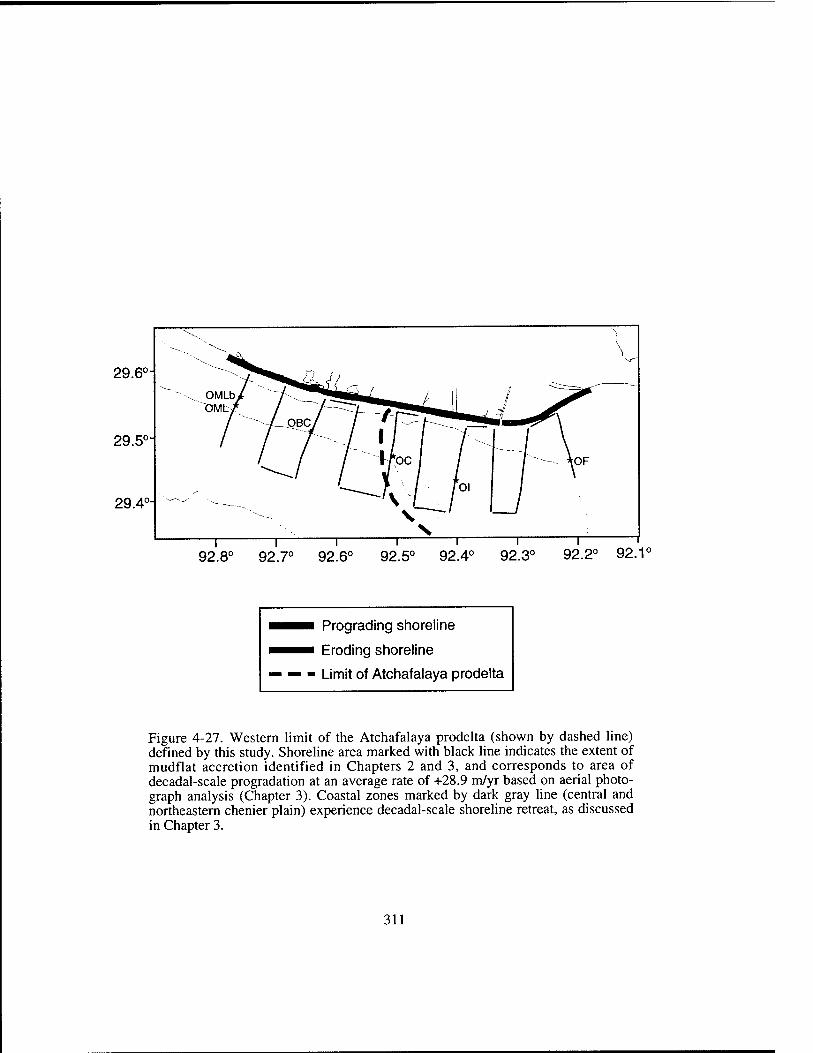
29.6°-
29.5°
29.4°
1 i 1 1 r 92.8° 92.7° 92.6° 92.5° 92.4° 92.3°
1 f 92.2° 92.1°
■ Prograding shoreline
■ Eroding shoreline
- Limit of Atchafalaya prodelta
Figure 4-27. Western limit of the Atchafalaya prodelta (shown by dashed line) defined by this study. Shoreline area marked with black line indicates the extent of mudflat accretion identified in Chapters 2 and 3, and corresponds to area of decadal-scale progradation at an average rate of +28.9 m/yr based on aerial photo- graph analysis (Chapter 3). Coastal zones marked by dark gray line (central and northeastern chenier plain) experience decadal-scale shoreline retreat, as discussed in Chapter 3.
311
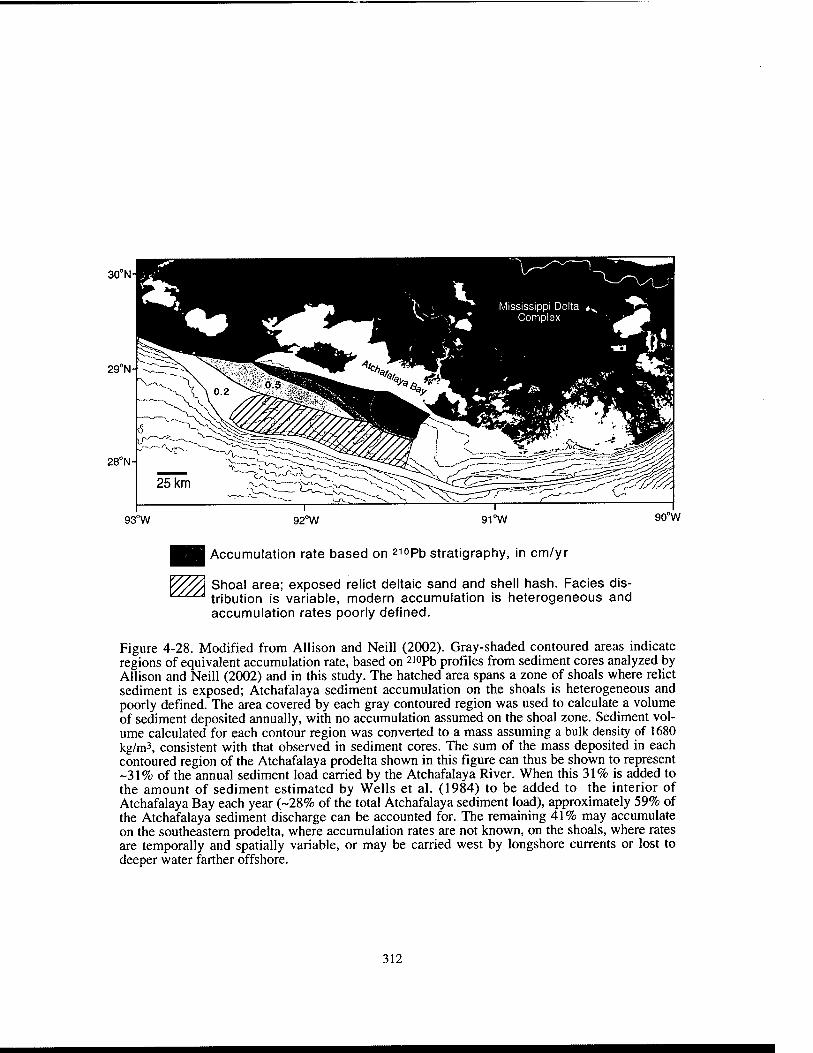
30°N
29°N
28°N
93°W 92°W 91 "W 90°W
Accumulation rate based on 2iopb stratigraphy, in cm/yr
^^ Shoal area; exposed relict deltaic sand and shell hash. Facies dis- ^^^ tribution is variable, modern accumulation is heterogeneous and
accumulation rates poorly defined.
Figure 4-28. Modified from Allison and Neill (2002). Gray-shaded contoured areas indicate regions of equivalent accumulation rate, based on 2iopb profiles from sediment cores analyzed by Allison and Neill (2002) and in this study. The hatched area spans a zone of shoals where relict sediment is exposed; Atchafalaya sediment accumulation on the shoals is heterogeneous and poorly defined. The area covered by each gray contoured region was used to calculate a volume of sediment deposited annually, with no accumulation assumed on the shoal zone. Sediment vol- ume calculated for each contour region was converted to a mass assuming a bulk density of 1680 kg/m3, consistent with that observed in sediment cores. The sum of the mass deposited in each contoured region of the Atchafalaya prodelta shown in this figure can thus be shown to represent -31% of the annual sediment load carried by the Atchafalaya River. When this 31% is added to the amount of sediment estimated by Wells et al. (1984) to be added to the interior of Atchafalaya Bay each year (-28% of the total Atchafalaya sediment load), approximately 59% of the Atchafalaya sediment discharge can be accounted for. The remaining 41% may accumulate on the southeastern prodelta, where accumulation rates are not known, on the shoals, where rates are temporally and spatially variable, or may be carried west by longshore currents or lost to deeper water farther offshore.
312
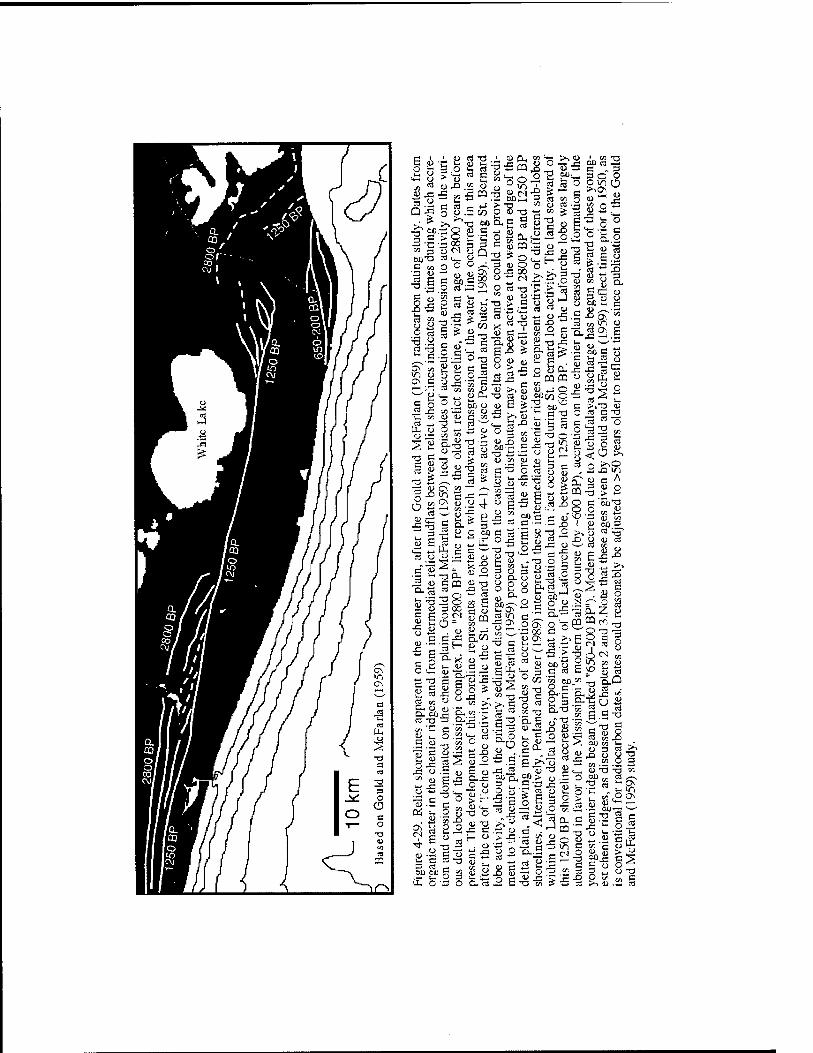
I I 01
S5 u,
1) J3 ■ ii: ■:2 C ra r-" ■*-*
5 » n ^ _ .2 o u ° v=l A x; Da -a <u c-1 -S
O^
00^3 C to
<u -a
■5 00 ■3<M
o o
is ?2 ^ en ^ CI: —1
- O J=! 00
1^ o o
3 O O
c3 ;^ ^
s« s ti c ■«
UN o ^^ CO
eg c o
IT) ON
■» £ 2i o ^ '-* c
C8 o 1) i^ « ID t> c —
8 5^ 2i
« "5 <U
" o
I- a<.2 6.2
3
U O
.c i^ gr'So
K^ S^
t- CO
au o
"3 <D
0) (D
S-2iS, „ d CL, T3
^■2 ex «
O o
^^.
C^ -C -C .5 "^ capn ^ S;>C 2i
<u (U .S u
CO o c p.
B S:
-a S
2 ?5 " oS o
■ C. <a Si
c3 T3 -B
■g -5 c ■.§ t-t—H Tl
a^o^o
^ CO ■= "
n te IS i^ -S -3 9->
2 5 M
T* to "3 5i
3 C =' O
ii CQ -T3 ID
j3 in c A
»- (- ^
=1,2 >^ :5 d"4> - •I --OD-
" P ai C CO u.
_ <u
'^ y'^l'^-'S O (D _0
C CQ <U T3
3 P
"■£ CD .3
^ s
3 00 3 O u CO
o
|g.3
2 c
.3 3 3 .is -4-^ X
1^ --J
C* 3 5 "1 ^ y 0) c« ^ ": „s .- <u Si
cs.c 3 3|S o
ID a ^ Si o 3
ID
u ON cs in
CO -^
^ 3 *j C3
csl 3 O
,2-a-^^s^
K« -3 0- Z ^ o 'T S." ^' •«
__, per ^ ^
y - - -.S "^ 3 oc!
3 ^ O O^.
■■3 00
br7^-S
ID
rt « ^ ^ I/? >'
cs T3 t3 0-_g .>
CO ,
, -c
ID
|2
<~^ CO CO ID
CO XI
S 3,&-gu^
0)
■^ •— X> CO 3 <U L3
c3
ID '.<,
o ^
0) .
w •<r' 3 ■M >< ID
'O
3 a; oii o -S 3
o,
0\ jJ ID T3 O
P 5 J= 3
<^ " 5 1- .-
■ ;ii 3 O ID
■3 "O
cti y
E ■ ip
XI ^
00 CO 1- ^
ID
£3
SU CO
3 u 3 -O
3 VI O 3 _ >_
■3 O O. :3
.ti a> > -3
. o 'a
22^
ca ID
S g x;
So
S x: 3 ,0 CO '—.
■^ CL c
.3 c; 5i -5 in 3
g:2 § p oiS
iS - x; c ^ x: Ex) s:*
°?-3 S U
>-i ID
O XI
.2 §
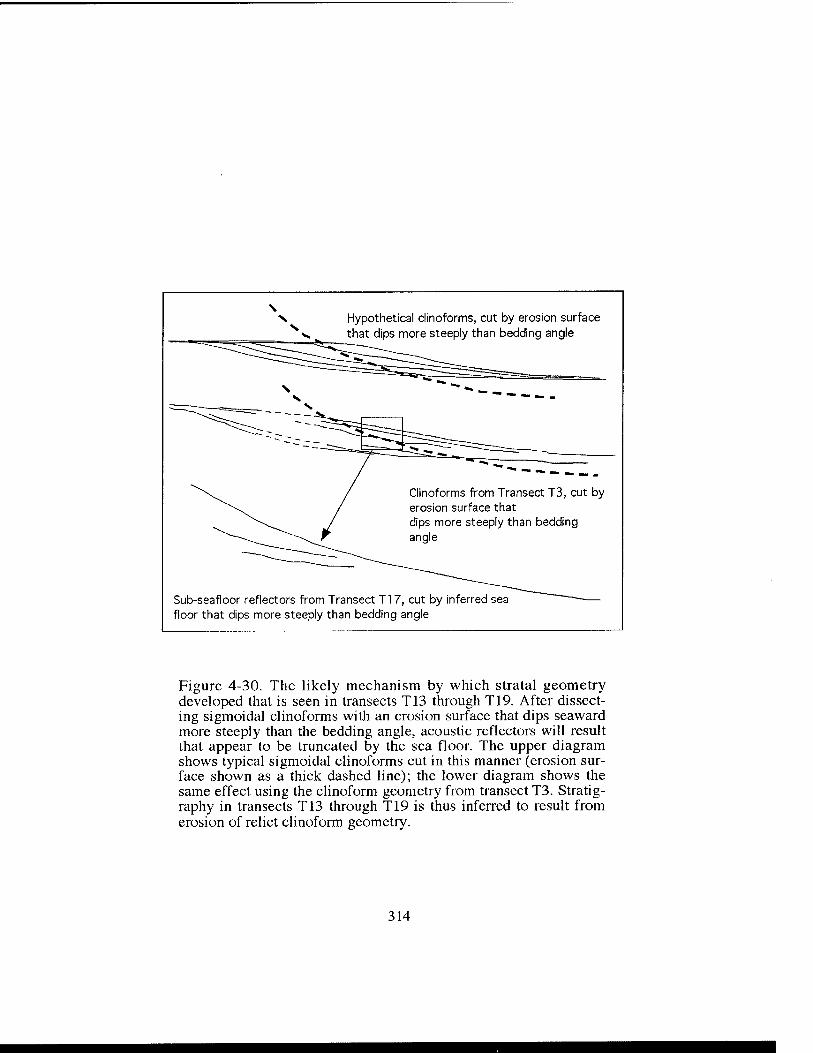
Hypothetical clinoforms, cut by erosion surface that dips more steeply than bedding angle
Sub-seafloor reflectors from Transect Tl 7, cut by inferred sea floor that dips more steeply than bedding angle
Figure 4-30. The likely mechanism by which stratal geometry developed that is seen in transects T13 through T19. After dissect- ing sigmoidal clinoforms with an erosion surface that dips seaward more steeply than the bedding angle, acoustic reflectors will result that appear to be truncated by the sea floor. The upper diagram shows typical sigmoidal clinoforms cut in this manner (erosion sur- face shown as a thick dashed line); the lower diagram shows the same effect using the clinoform geometry from transect T3. Stratig- raphy in transects T13 through T19 is thus inferred to result from erosion of relict clinoform geometry.
314
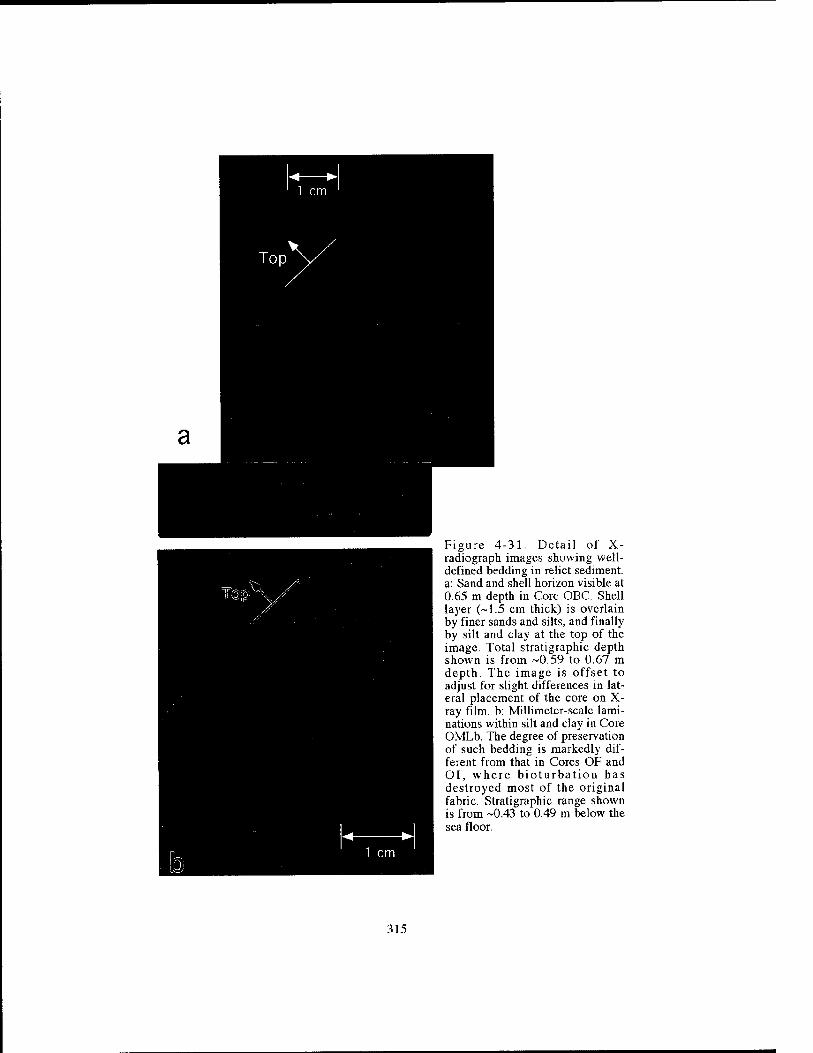
Figure 4-31. Detail of X- radiograph images showing well- defined bedding in relict sediment, a: Sand and shell horizon visible at 0 65 m depth in Core OBC. Shell layer (~1.5 cm thick) is overlain by finer sands and silts, and finally by silt and clay at the top of the image. Total stratigraphic depth shown is from ~0.59 to 0.67 m depth. The image is offset to adjust for slight differences in lat- eral placement of the core on X- ray film, b: Millimctcr-.scalc lami- nations within silt and clay in Core OMLb. The degree of preservation of such bedding is markedly dif- ferent from that in Cores OF and OI, where bioturbation has destroyed most of the original fabric. Stratigraphic range shown is from ~0.43 to 0.49 m below the sea floor.
315
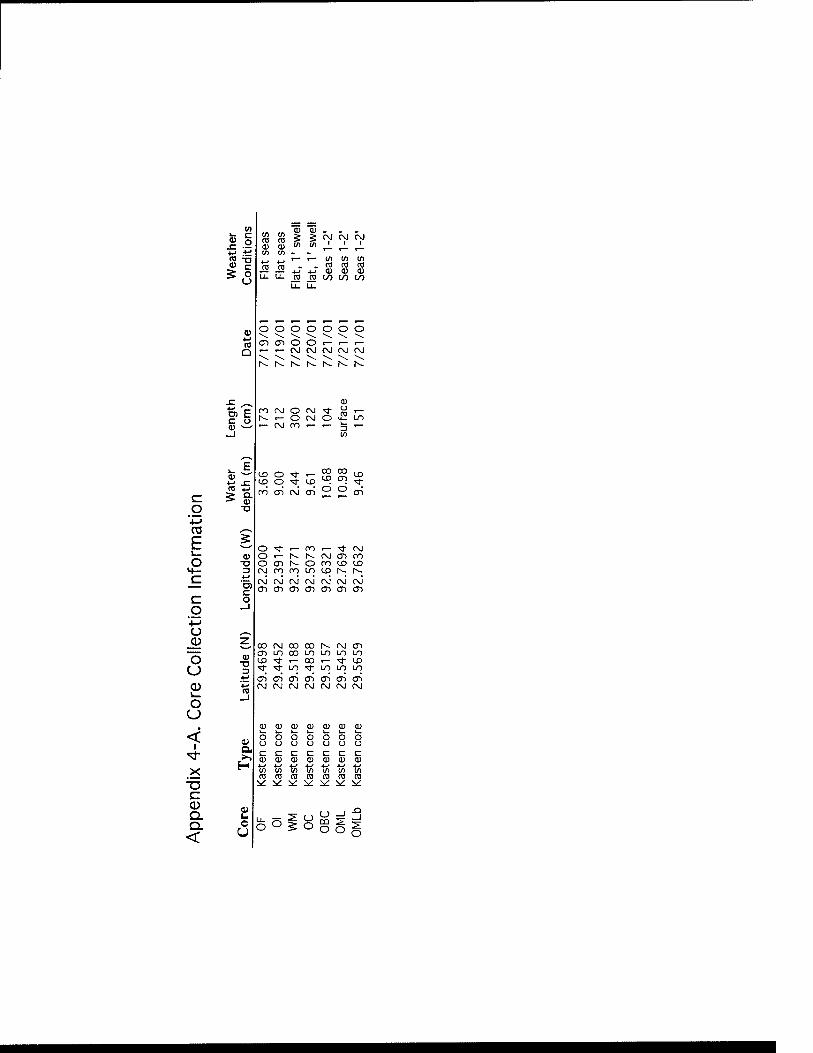
ra E c u
ni ■^-' c > Q.
>■ 0) o T3
■M m ^-^ E 5
o ID
M- 3
r +-* D) C c o
o _J
■M o ,—, Cl) z "^-^ o <u
c; 3 4-'
<D 4-» v_ _J U U
< 0)
^ X H
■o c CD Q. 2: O o
< U
CO
(U 0) (\J CM Fvj
OJ 0) CO (/) ^ ^ ^ (0 fn (n tt % CO 0)
CO 0)
CO 0)
CO Li.
C/) C/) I/)
o o O o O o O \ ^ ^ \ ^ \ CD CD o C5 1—
t— 1— CM CM CV C\J 00 ■\ \ \ \ \ \ ■^
r- h- s- N- N-
0
N.
ro CNJ o (NJ ^ u CO
,— h- I— o C~vJ O Ln
C\J ro 3
ID o 'd- 00 c^
CX3 (D c^
(.O c-> \f CO M- ro CD C\J CD O O CD
O ■'^ r- OO .— ■* C>0 o ■— r-- r^ CM CD ro O (D r^ O 00 CD cx> c\j 00 on Ln tD h-. N- cv ovi rJ CNJ oO c\j oJ CD CD CD CD CD CT) CD
CXD (NJ 00 00 r^ CM CD CD Ln CO Ln Ln Ln Ln LD ■^ .— 00 t— -s)- LD •^ ■^ Lo ^ Ln Ln Ln CD CD CD CD CD CD CD OvJ CM CVJ CM CVJ CM OJ
Q) 03 Q) 0} o ay Qi L_ l_ k- k- ^ ;_ L_
o o o o o o o u u u u u u u c c c: c c c cz d) d) Q) CD (U dJ OJ
■»-' +-» ^J 4-" 4-' ■»-' +." en en en en en c/) en CO CO CO CO CO CO CO ^ :i^ ^ ^ ^ )^ ^
65|8ig
Appendix 4-B.
Sediment Properties of Cores
317
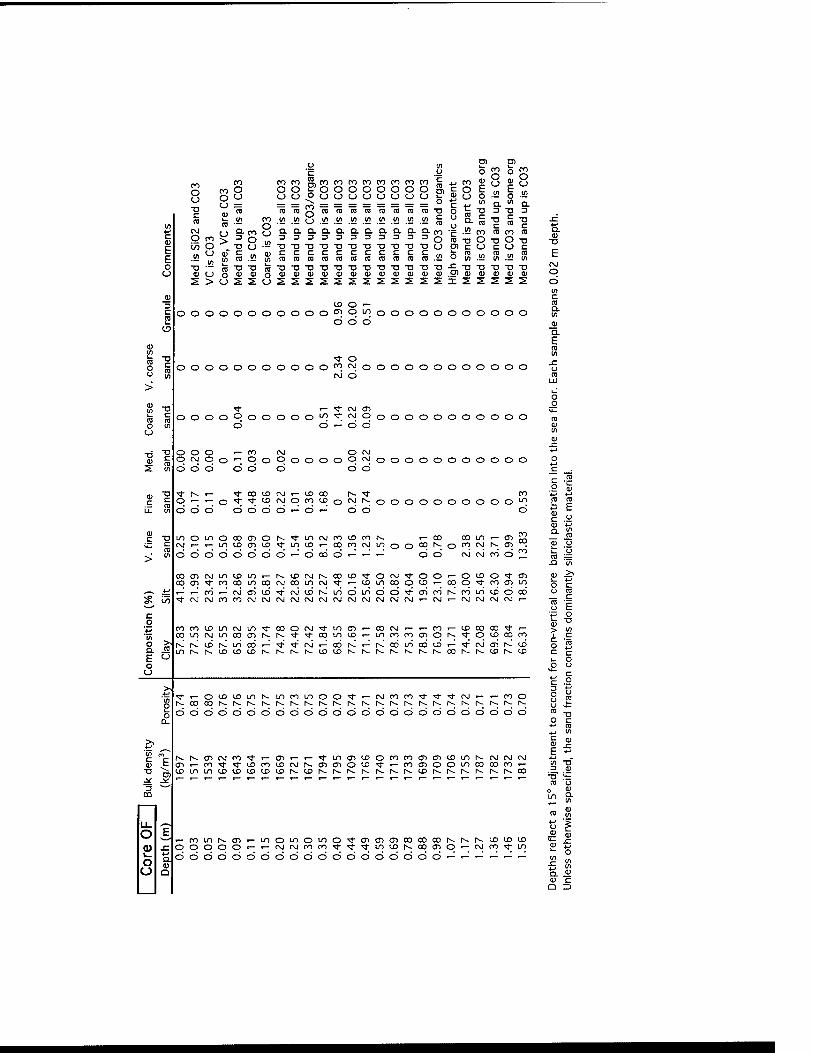
CO O u T3
O
(V
^ 00
c E ■^ ?T, ^ J>i 3 ^-' m
LL O _fc a) SI k <-' o u. u Q
CO CO O O U u =
CO CO O O
S, CO (O CO CO CO 2^0 O O O O O CJ O O (_) o
CO CO o o *J CO «
(D 9- CO = o CO ^ w
'-' <" 5 in I/)
CO o o
O
CQ CO CO (0 CO
en w (/) m en ra ra vi 01 " O
.ci.Q.a.Q.Q.aaQ.a. 33D333333
■OTIT3T3TJT3TJTJT3-D cccccccccc (oraranraracorarara ■OT3TJTJT3T3T!TJT3TI
(/)
CO O
Q. ro = O -go (0
T! T3 <U 0)
o ra o in
X s
ra °s O .!2 <" Q.
T3 3
Si CO ra O -D (_> c
TJ T3 T3 "O 0) 0) a) <U
CO ra
9. -o
00000000000 o >- O 10 00000000000
"t o ooooooooooo'^'^oooooooooooo
rj o
ooooOooooo'^^'^oooooooooooo CD CD .- CD d
000 O (M O o odd d d
I— CO t- o OOoOOOOCMoOOOOOOOOOO
d do
O"-"— o'*'^'^'^OCOtDoCSJh-o odd d di d d r-^ d '-^ d d
LD O LO O CD CD O ro r- r- 10 CD cn ID d d d d d d d
^ Ln CM CO ID CO Lo CD ^ 00 ro rd
O.-O00O>-'->-
CX3C71(MLn<DLn.-[v.CDCSlh~00C0':rOC\J'^OO'-OtDO^CT1 cxJcn^cooOLDcocMOOincsjM-'— iDiocxJOcDi— ooo'^cooiLn
.-^r-^co«— oJcT^cD^'rJcDr^LodLndd'^cj^cor^coLocDdoo ':^c^JCMco^oc^JC^JC^JC\JCMC^JC^JOsJc^Jc^Jc^Jc\I^— CNJ<— c\jc\jc\jc\]»—
"^i— ocDtDinr-^iocomoO'S-'— cNjcoco^^^cNjt— .— coo
ddddddddddddddddddddddddd
N.r^(T>CMCOM->-CD.-^'<J-Lnc7)CD en-— CO^^CDCOCDCMN-CDCnOID lDLOLniDtDU3CDCDh-lDr--r-~h~r^
OcococncjicDinr^cvjcNJCM '*■■— coCTioouocnooco-— t^r^h-iDr^i^t^i^^h-r^oo
cotnrs-cD'— L/iOLooLO OOOOO'-'-csjc-vicoco
ddddddddddddddddddd
O'^CTicnoicooocor^h-r^cDCDtD ■^■i}-'<tu->cDi--oocnO'-cMco'5j-Ln
a. -D
C\J O d i/> c CO a
Q.
zz 0 <1) 4-' 4_j
0 0 0 0 0 0 0 0 0 in f" E 0
0 4_,
C OJ 4-'
^ 00 CO in ^ CJ) CO 00
CL CO
0 0 00 r^ 0 CO CM h~ en 0 0 CM CM CO 0 co
F c 0 t 0 -a
(O CO CD LD CM LO ■<<• 0C3 0 CM ^ en en 1— a) CM 1— t— m 1— CD 00 00 ^ I—
'in 0 CO
00 CM
16 00 LO CO
N.
CM
00 LO
oti CD *"; 10 CO
00
CO
in 00 q CD
r^ CL) CM
Ci)
d 00 CO
CD c 0
c 'co
a. LO t^ 1^ to CD to 1^ t^ r^ I^ CO CO r^ r^ r^ r^ r^ [^ 1^ <x> r-- 1^ U) t^ CD c H u y- 0
0 u 0
4-» c
c r
t ■M
(/) -n <u
■Jn in a Q
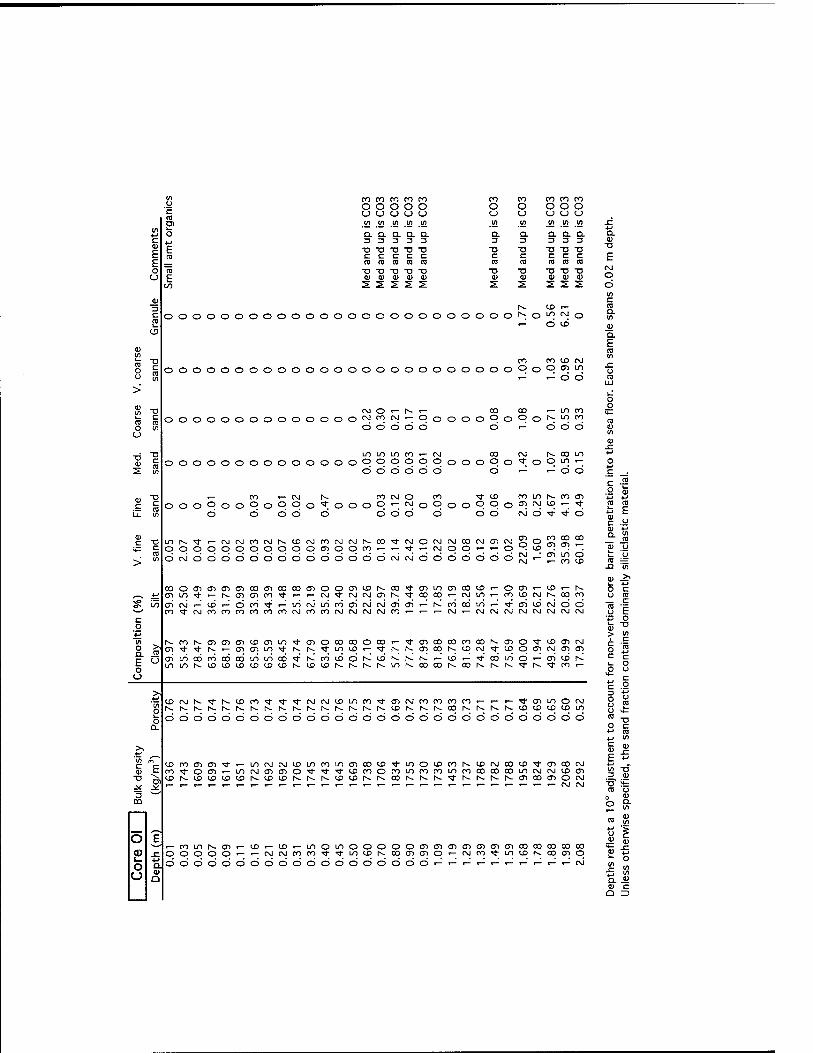
o o
re m
1/) 4-' o c
E E ra b o ra o F (/) <u D
# (7)
Q. i5 E " o o
in m
S E
O <D
O
m O
CO O
CO O o
CO O u
CO O
(A w (/) en in
Q. 3
a. 3 3
Q. 3
a 3
-a c
T5 c
T3
CO CO ra CO CO TJ T3 T3 T3 -D <U 0} <jj dj 0
oooooooooooooooooooo
CO CO CO CO CO O O C) C> C5 <~> O u U U in in in m in ^
•M Q. D. Q. a CL Q. 3 3 3 3 3 4)
TJ T) T3 ■n TJ TJ c C c C. C b ra ra ra ra ra TJ T3 T3 TI TJ O <U <u 0) V <U S s ^ >. :^ o
(O ro to cvj oooooooooooooooooooooooooPop<^"l
■- ■- o o
cvJO'-^-'— 00 00 ^inro oooooooooooooo<^'^'^'-°ooooOoOof~-'^oo
oddcDcD o ■- ooo
LOLnLOtOT— tsj 00 CM r-^ooin ooooooooooooooooooooooooo^ooior-
<5 cS d d (5 d d ■- •- d d
•— CO ■—CM K cocvjo CO ^iD coini^roCT) oooOoo9ooqo'^ooo9^t^o9ooP9o<^'^'^'-:'^
d d d d d ddd d d d ojo^'>*-o
LD [^ ^ r— CM CM o o o o o o
COCMr^irsCMmOOCMr^CO'Sj-CMOCMlMCOCMlDCM 000000100tOr-->-'rt-r-CMOO'-;'-^CD
ddddddddddddddcMoJddddddd
to 00 CO en CD .-
cri i/S d '— m is>
oooaicr>cncriCDiT)OooO(DOOiriu3t^co^OTmeTiooiD^ocr)>— tDr-h- iT>m^t— r^<T)CTirOTfr-i— (M^cocMcni^^oooo*— cMm»— cotDCMN-ooco dcM.--^ii'-^dco"^^incMi/JrocricM(M<jid'--^N^coodLn"—'d^d<j3(Nidd OO^rOrOCOCOrOrOrO(MCOCOCMCMCMCNJCO»— I— t— CMi— CMCMCMINJCMCMCMCM
t^cor^cncncniDCTim^inooooooooi— '^<j)oooorooot^<r>0'S-ix><r)iNj cD^^r^t— iT>cr>Lr>'^r^h^^Lnix>»— -^r^f^OTOot^tDcM^tDOcniNJCDiTj cT^LnccJroodo6uSLoo6^r^rotDdr^t£JN^i^N^'— d»— ^'coLod'— cTJixJr^ LOLnh~iDistDtDtDiDt-^u)tDt^i^r^^~uor---oooor^oor-h~i-^':ri~^^tot—
iccsjr^'iri^iDro'it^^tMOJtDLnrO'^cDiMtorocoto
dddddddddddddddddddddddddddddd .— r-r-^CILDOCM r--t--h-.iDU5ioioLn
lOromeji'J-i— LntMCMioiocOLnCT^ootD^LnoiDcor--.icrjooiXJ'l-iDcorM to<^O0ii— m(\j<j)ij>OM-'4-';ftDcootoLn(oromrooocooOLn(\icMtOCT^ tDi^u5iDtDtDh-tDiDr--t^r^iX)tDr^i^oor^r---r----*r^rv.r^r~-cncoejiotM r-.-r-.-.-^,-^r-t->-.-r-.-.-.-.-.-r-.— .->-r-t-.-r-r-r-CSI(\J
t— toior^cj).— ic.— to-— 1/1 OOOOO"— >— cMcviroco
ddddddddddddddddddd O LO o o o ■sr 'j- lo to [^
OOlD(TJ<71lTl<Dcr>(7)OOOOOOOOCO ooaiiDO'-rvjco^i/iiDr--ooa)0
a. E ra
._ o V t-t +-» ra ra
F r o
::= J2 in
tl> >> o c t) ro c ra u F o
TJ ■>
C o ra r
1_ o o o 4-/
c o o o
o ra ra
TJ o r ni
'M tf) C n) .c F 4-' j-j in ■n 3 (i>
TJ ra o d S-
t in D. JJ
Q =>
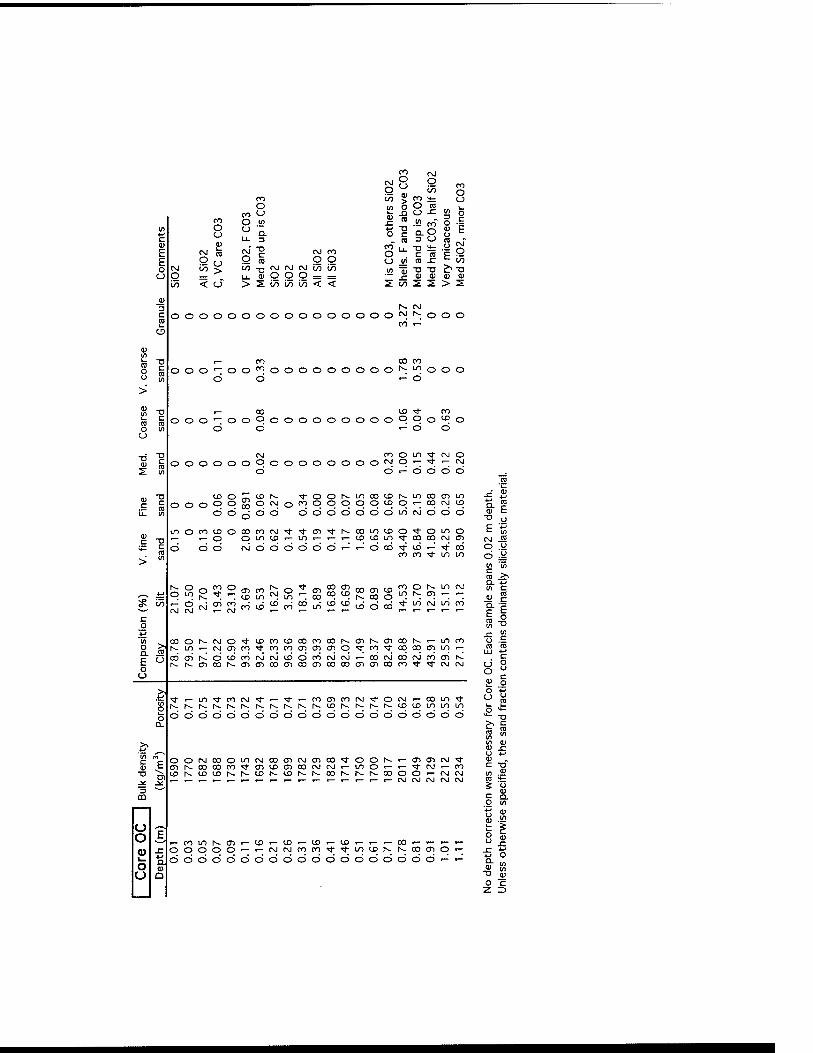
CO O O O
In m O
to to > O
ro 14- o O V) O ro
CO
O C_)
CO
O _y) 0) x:
J3 ro CJ
.so co^ V) 3 o
o c
in o Q.
4-» O
T3 Q. O 0)
o 'E C U- 3 ra 3 u ro E E o
O a; ro O >
cvT O
TJ c to
ISJ
O to O
to" O
U-
jn •D C ro
4-
to s:
o E
CM
O 00
CSJ in in ■D CM CM CM in lo l/> "5 T3 T3 ^ TJ u O u. ID o o O — — 0) 11) 0) <U
in < o" > S in to i/) < < s lyo S s > S
3 h- CM
c o o o o o o o O o O o o o o o o CM h- o o o 2 CO i-~
o
o (/) ra o
•a r— to 00 to c (/I
o o o »— o o CO o o O o o o o o o N; in O o o o d d •- d > 0) 10 T3
^ 00 IX) * CO c in
o o o »— o o o o o o o o o o o o q o o ID o O d d »— d d U
(U
13 CM CO o in '* CM o C ro in
o o o o o o O o o o o o o o o 00 q »— ■^ •— CM
s d d •~ d d d d
a) T3 IX> o CT1 00
IC t-- ■* o o rv. in 00 ID r^ lO CO en in c ro i/i
o o o o o o CM o to o o o o o IX) o »— oo CM ID
LL. d d d d d d d d d d d d LO CM d d d
LO o ro ID o oo CO CM ^ ^ CT) <^ r^ CO in IX) o ■<1- o in o
i*-
t3 o o LO IX) in «— CD ID LO ^ CO oo CM en C d d d INJ d d d d d d r^ r—' d 00 11-' d (-^ ■^ CO 03 in
to ro ■* in m >
1 4-* q o
lO o rv.
(O o IX)
CO LO
CM o ID
^ 00
00 00 IX>
00 01 C<3
IX) q CO LD
O q
in CM
Cn t— d c\i d CO CO d ID
CO 00 LO
d d d d 00 ■<t uS Cvj LO CO
c o
'in
rvj C\J '" CM "" ^ ^ ■"
00 o r-- rj o 'f IX> ro ID 00 CO CO 1^ en N. en CO r^ in CO o a. E o u
ro t^ in tsj en co ■=); ro to tn en 01 q ■^ CO ^ 00 CO q uo »— D CO cri f^ d U3 to IN! CM ID d CO INJ CM r-^ 00 CM 00 CM CO oi 1^
r-- r^ en CO r^ in CD 00 CD 00 IT) CO oo in <n 00 CO 't >«• IM IM
> +^ ■^ r— in ■* to t\j ■=r r— ■^ r— ro CT) CO CM ^ o CM I— 00 m ■*
in o 1^ r^ t-~ t-^ t-~ t^ r^ 1^ t^ I^ h- IX) r^ r^ r^ r^ tD ID in in m
£ d d d d d d d d d d d d d d d d d d d d d
>> 'in
,,—^ "E o o CM 00 o tn Cvj 00 CT) IM en 00 ^ o o h~ I— <n O) CM ■^
0) CD r-- CO CO CO ■* CT) ID CD 00 CM INJ LO o t— t— M- CM T— CO T3
D) to h- UJ IX) r-- t^ ID 1^ ID r^ r-. 00 r-- h^ t-^ OO o o 1— tM CM
^ »— »— »— »— r— »— CM CM tM tM CM
3 m
O ? o _ ro bO h- CJ) ^_
<S> ^ ID ,_ 1X1 ,_ ID , ,_ , CO , f^ ,_ ^
9) ^ o o o o o t— t~~ tSJ CM CO CO ■<1- •* 1/1 tn r^ K 00 01 q r—
O a d d d d d d d d d d d d d d d d d d d •- •-
O O
j£ 0)
^f 0) E T) o
^ in CM i5 O .U d :y in 'in
ro ^ m c
E E in "
JZ « o .£ ro ro
UJ 4-^
ys S! o o '^
ro in in in 0)
0) . C TJ
r- r- r- U <u x: 4J o
TO qj
O "c z n
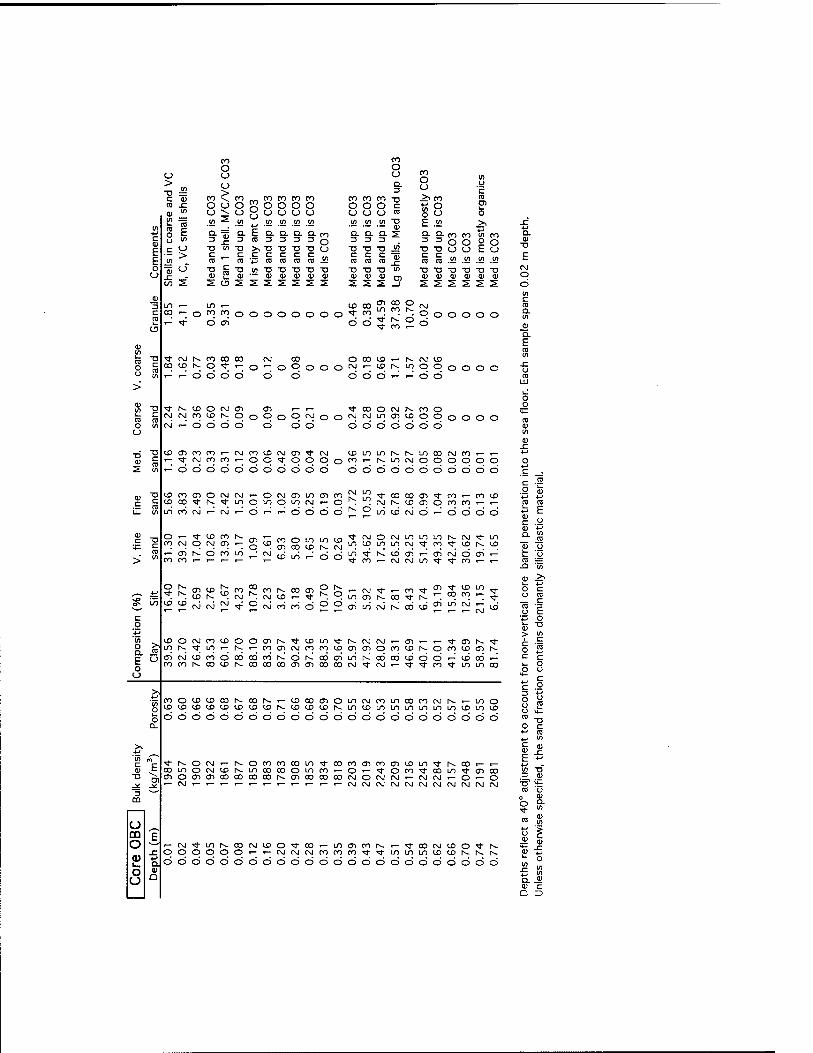
o
C T3
o ^ E <-> o u
T3
J^ ^ D ^-^
CD
o m "F" O
r a> •M i- UH o u
1) Q
CO
O U O > o ■D ~, > C <u CO \ ra ^ O O <u tj ::i
CO o o CO
O o 4-*
CO
O O
CO
O CO
O CO
O o
.!2 .w .52 .52 .!2 a. 3
fc ra a. 3 3 3 3
CO CO O O o o
> 13 (/) c „ TO
T3 >, TI C C C
T3 TJ TD C C C
a a. 3 3
ra ra ra cQ
— <u XI T3 -o -a <u V V V S S S ^
(O O o a 3
CO "□ O c C_) ra in TI
— (U
§2 T3 jd S "Si ra _c
-p in CD
(O O O ^ CO
o u E .<!> 9- 9- CO CO =■=00
"D T3 t_> tj
C ra D) i_ o 2^ 4-* 01 CO o O E tj
S S S Jj
ra ra XI XI
<u V
_(/) jn (n _tn
XI XI XI XI 0) (1) (1) <u
LO ^ 00 .- OCOCOOOOQOOQQTJ-CO
(3 oi do 9 o o o o o
■^CSJh-COOOCD CM <» O CJDlDh-O'^'-O'-OOOOO'^ ^■-'dddd d d ddd
CO U5 .- h- CM Ci> .-ciir^Looooooo
"-^ ■-■ d d
'tr^tDOcMcn en .-.- 'S-coocs]|--coo (SICMC0U3t^OoC3oC)<^OO^'^'J^''^"^OOoOOO cvj ^'dddd d dd ddddddd
tDCTicocoT— cvjcoiDtvjcD^csj u)Lnior«-r--Ln(X3cMco>— .— t-|^rvJC0C0r-OO'^OOOo<^'~l^'J^'^OOOOOO r-^ddddddddddd ddddddddddd
(^ro(no(Nicsjr-ocMcr)Ln<Tico{NK3Tj-co(X3cn'<i-co.-coiD u3oO'*-r^^Lriouioi/oc\jr-o.:(Mr-^iDc7)0(OcO'— ■—
LOCOrd^C\J^O'-'-0000 LO <X> CM O ■- O
o .- (O (SJ
■^ to CO t^ O OJ <7> ■—
--^ (ji N! d CO CO
CO LO
CO o tn LO to en 00 <x> r^ CM
^ rvi O CM lo LO in LO ;£> LD LD CM "^ CO
^)ll^'-\z^^'-oc:> iO'^h~cx>c7)'-e7)(sJOcr>'- ^co<— cMrjLo^^rot— ,—
O 1^
to to <T)iflr^co?°ror^oo(Ti tOh-.CM'^CMCOr-'^
CMCMj^':f'2'^'f^t^d22
o r^ t^ o .- CM ■<1- r-
LO en CO ^ ff> ■^ ID in
.- 00 ro
<D in CM 1^ CO <xi 00 ^ r^ "^ "^ "! "^ ?
^ en LO CM .— I— ■— ■— CM to
u>0(McoeDOOcnr^^tOLO^l^ Lor--^LOi—_N.r-rocncMco(oci>en dcMcDrododo6oor-Jdi~~^odaiio COCOI^COtDI^OOOOOOCDCTICOOOCM
cMcNji— crj»— t— ^enh-^ enocotor^ocotoenr^ N^cciooccdd'-^doD.-' ^CM.— -^^CO^LOLOOO
COOtOlDODr--.OOK'— iDcocno IX>C£>tOtDtDeDtDCDr~-lD<i)<Xlt^
ooocioociooooocicicioociciocicicio
uirvJcoinoocooJi-^t— LOO LOLDLOLnLOLnLOLncriLOLD
^^-OCMr-r^OrocoooiO'^cococTicocnLOLn^r^oDr-t— ooLoocMcci^Looocooiorot— O"— ^oco^oOLo^cr>oo cnoencnoocoooooi^cDoooooocMOc\jcM»-(M(Mi— O"— o ■— CMt— <— I— •— ^T-T— ■— r- t— 1— CMCMCMCMCMCMCMCMCMCMCM
t— CM'd-L0r--00CMlX)OM-00'— LOC71COr--t— Tj-OOCMlDOM-h- OOOCDOO'-;'— CMCMCMOOrOCO^^lOLOmCDlDr^t^N-
oocioooociciciciciociociciciciociocio
Q. E re
d d d 4-» <U c 0)
E
CM ■* LO Q. m l£l t^ LD
E o XI
2 ii
' t^ o *-* o
f ro
XI o r
4-> re 4-* V)
01 (U c~
i- ■M
01 -n (1)
Tl' u- ra C) . (U o Q.
■^ ra 0)
4-t o
(11
« V)
4-> in in
a. 0) c O U
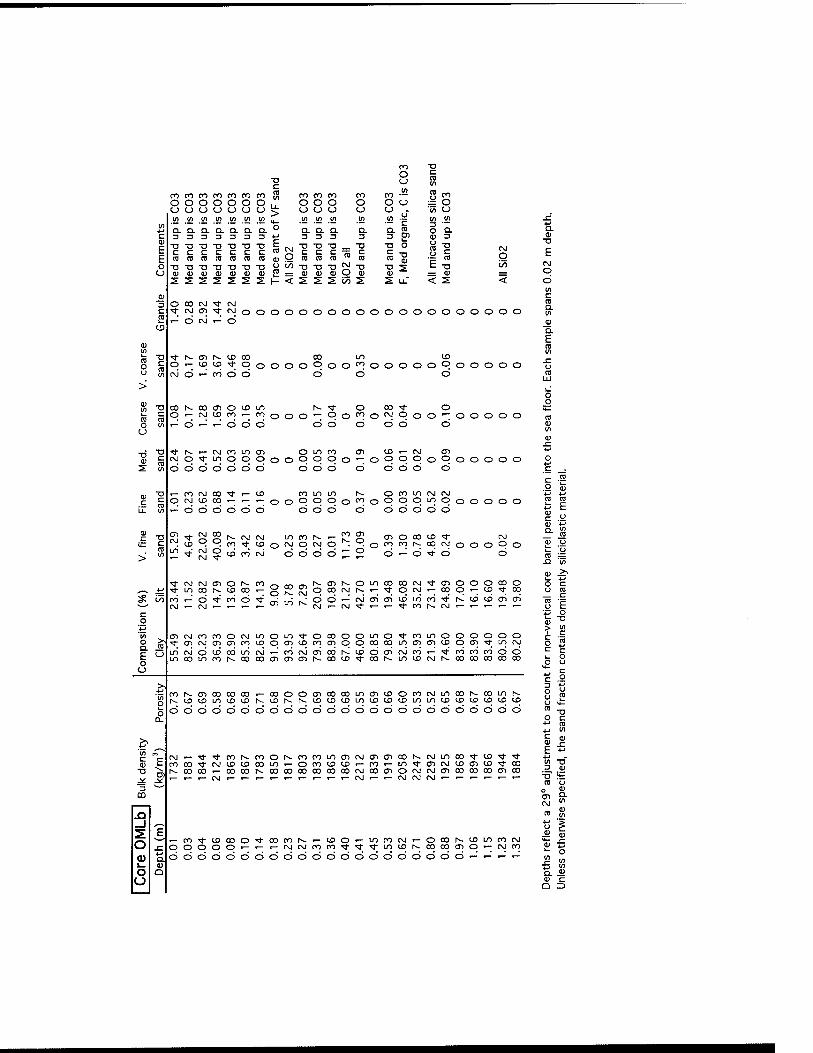
o U
c
n ro E tJ O O
S E
o o i- o o
CO ■D n s T3
C .2 ro m ro ro ro ro ro ro oo CO ro ro .O ro
O O O O O O n Ll- >
n O O O C) u O O O C_) u c_) t_) U o o o u U V) u m .2 .2 .in .i2 .S2 .2 .S2 .52 _(/) VI .en !9 .(n
T3 -n c c ra ra -D T3 (U 1)
a. D. Q. Q. 3 3 3 3
T3 -D T3 TJ c c c c CO ra ra ra
•D T3 T3 TJ OJ 1) (U <U S 2 2 S
Q. °
c to
TJ
T3 T3 -O _ C C C -=
2 = 0) 0 1- < s s s
0) O in
o. a. CQ
3 3 fcl' TJ TJ O C CO
C (0 T3
TJ T3 "?• Q> 0)
s ^ ._ n t TJ = V < 2
Q i/)
CO CM OJ O) CD CM
oooooooooooooooooooo
O'-lDtD'^-OoOOOOOO'^O cMdr-^cncDd d d
ooooOoooo o
CO r^ 00 <Ti o ID in O ■— tsj CD ro T- CO T^ d '-^ '^ o d d
t^ rf O 00 ■*• o o'~oo'^of^ooo'-:ooooo
d d d d d d
^t^r-cMroLO(T) oinco en lOt— CM <TI CMO^LnOOOoOOppO'~:Op(DOoC>00000 d d d d d d d d d d d d d d d
r- ro CM 00 ^ •— CD OrjiDoo^.-.— O ^ d d d d d d
rj 00 o o
^ ^
r-- CM CM ro tj- CD o
O • • ■ CD ro ro
o ro O
in O
in o o ro o
o o
ro o
m o
CM in
CM o
o O o o o o o O o
in CM
ro O CM o
ro CD q o CD CO
o ro
00 CD oo CM
O O o o *" d o — o ■5f O
o o o o o
o o o 9 o o
LnoOOOCM-^CDOOOCOO '-'^OCM"— OOO"— CD'*OD
'^CMCM<DOr^CO_,_,_,r^(Tll^O Tt-LncoN.cDoo.-g^°jqoqror^ ro^'d'*'rod'*^,r;,v'dd'-'cMCTioSiDinro'<t'N-'iDcD<TJ<ji rd.-(Sj.-^.-.-"''"'^cM.-rj^.-^^ror^cM.-.-r-r-,-
oicMroroorvjinOLO'l-oooooinO'^roLnoOOOOO ^aicMcT)CnrocDOcT)<-Droo^oooocoinc7)CDCDq(Ti'5fincM LocMdcDCDinrj.—'ooc\JcjiocJtv!cDdCTitMrO'-^M-rororodd Lnooinror^oococT)<D(DN.oocD^oor^incD(\ji^ooooooooco
r^ 01 00 CO 00 t— CD ID in CD CD r^
OOcDcocOLnCT>iDOrocMinoor^oDLnr-~ N-^-CDCDCDLnCDCDCDinLncDCDCDCDCDCD
OOOOOOOOOOOOOOOOOOOOOOOOO
csjr-^^ror^roor^roroLn(TicMC7)Oiooh~.roinoO'<i-iD^'4- rooo^cMCDCDOOLn"— orocDCDr-ro<— in^cncMCDcDCD-^oo h-OOOO"— OOOOh-ODOOOOCDOOOOCMOOCnOCMCMCTlOOOOOOCDCO ,— f— 1— CMr- t— I— 1— ■— r-t— r-r-CSJ-— ■— CMrOCM-— ■— ■— ■— ■— r-
r-ro^cDoooM-ooror— ■— CDO"— LnrocMt— oooh-cDinrocM OOOOO"— >— ■— cMrMroro^'f'<tincDt^oooocT) ddddddddddddddddddd
O •- CM ro d r-' ^ ^' ^
a. V
TJ
CM o
c CO a. 1/1
_3) a E
D. (n CO
<1) () t- u ra
SJI in
<l> >, O c c> m
CT
o F t o
T!
TJ C ro
E t= in T1 3 <l) CJ ra CJ
0) m Q. ro ro 01
in
o 1 r o
in
Appendix 4-C.
Shore-Parallel Acoustic Transects
323
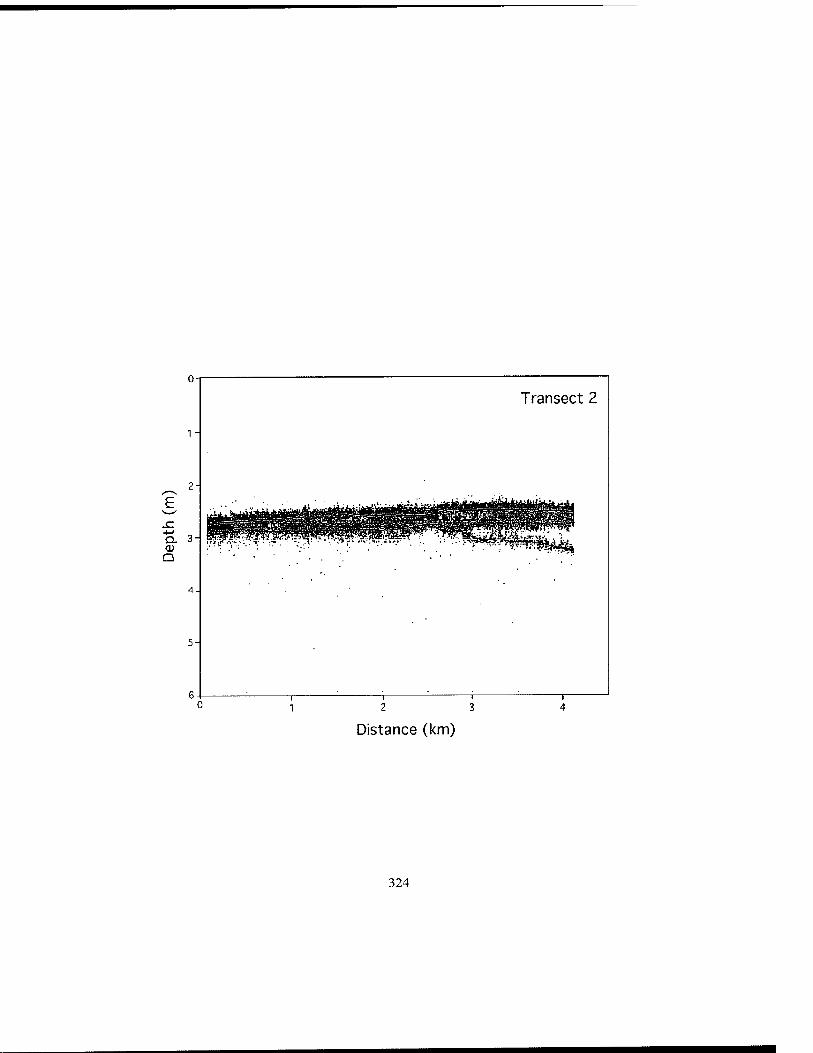
2 3
Distance (km)
324
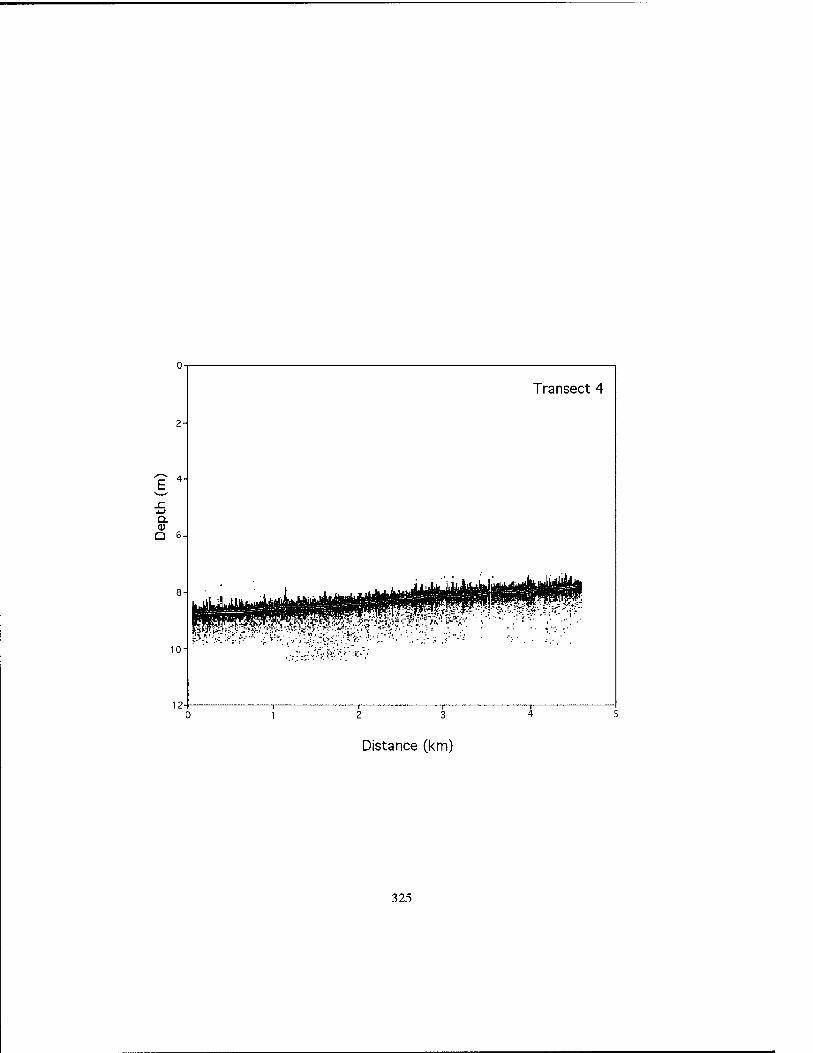
2-
Q.
Q 6
10
12
^5Wi^->;?...v J->*...;j%v- ■-''','.=^„'/:f:--Ki;;'-'^ ■•'■','". '■ ■ '■■■'■ ■■
Transect 4
Distance (km)
325
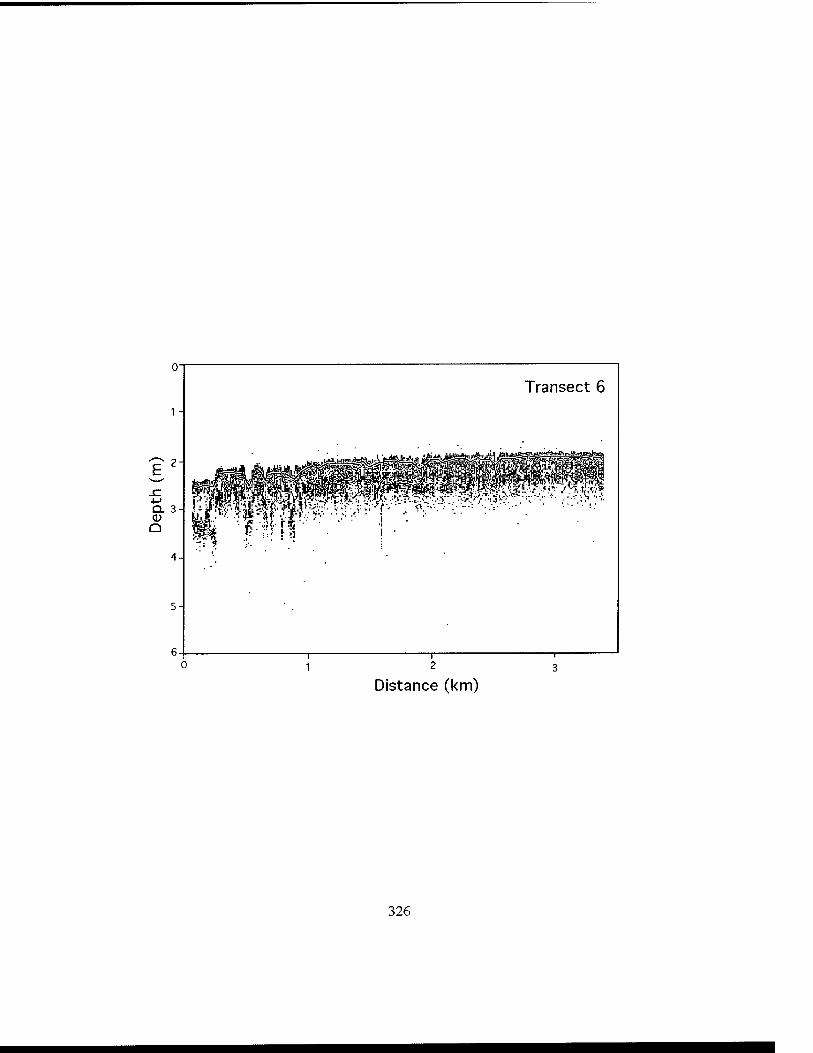
Transect 6
5-
Distance (km)
326
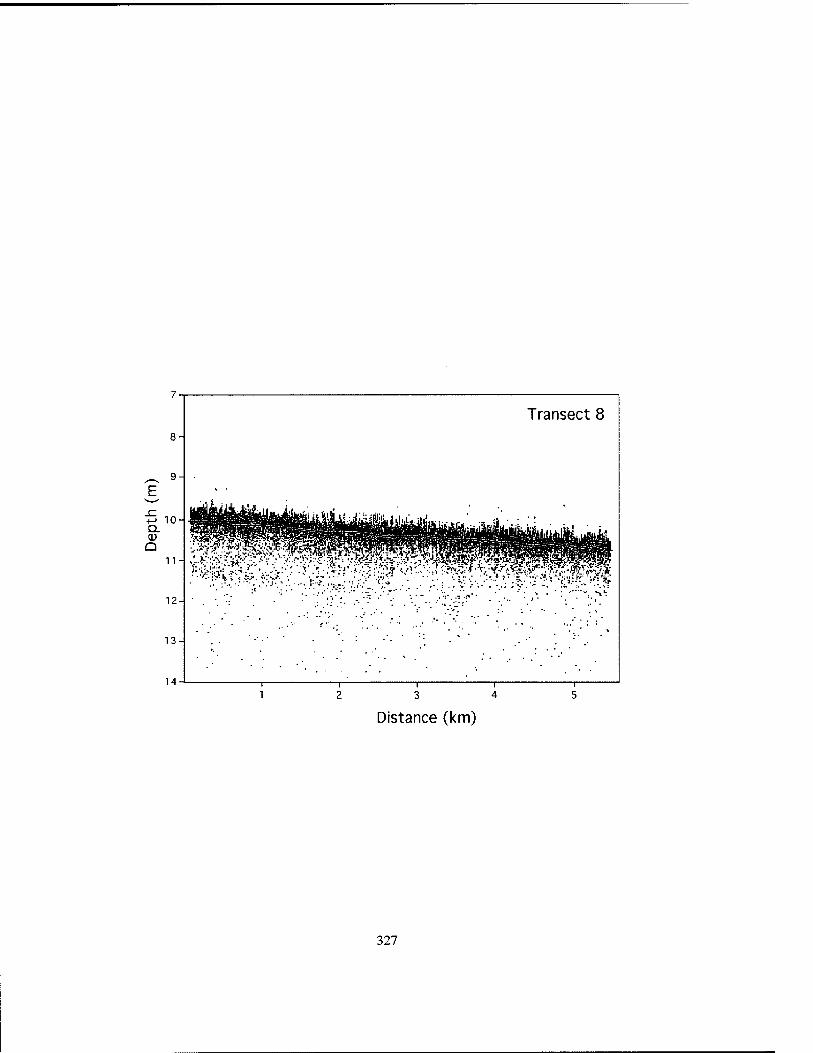
Transect 8
Q. CD Q
10-
11- 5:-L>i^:^..':'-.. :>:•■'■;j■.■^.;i^i■
^2-
13-
14-
Distance (km)
327
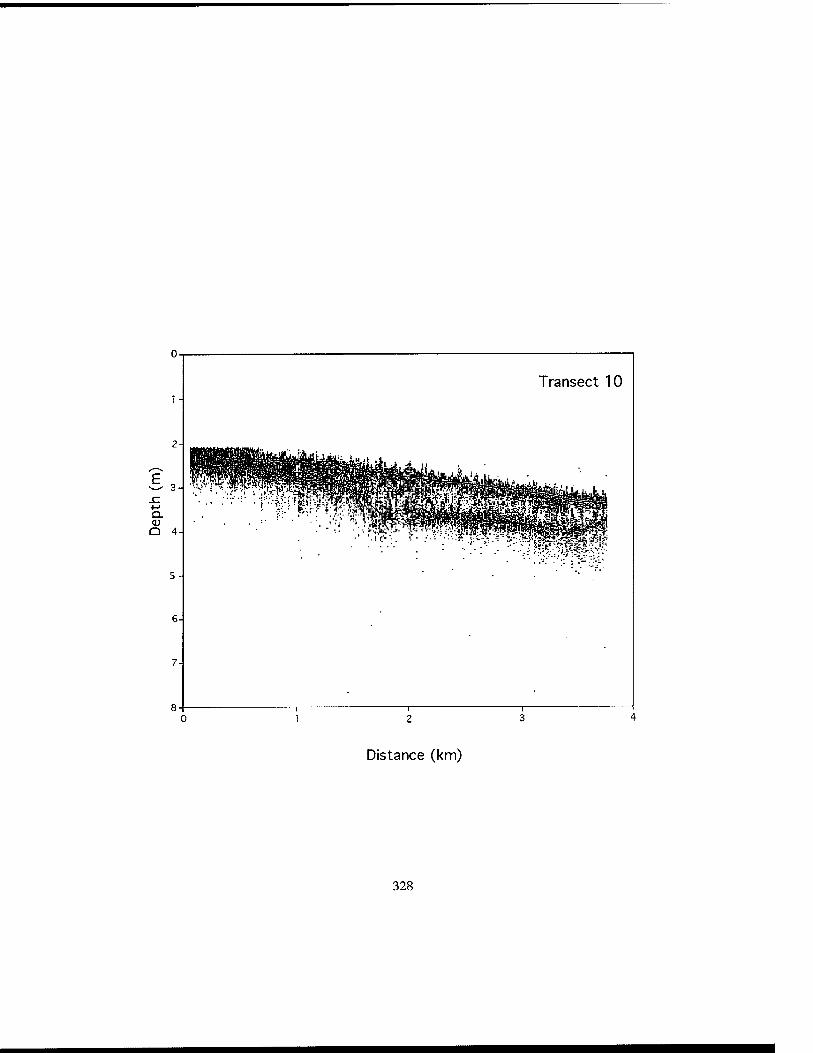
Transect 10
7-
Distance (km)
328
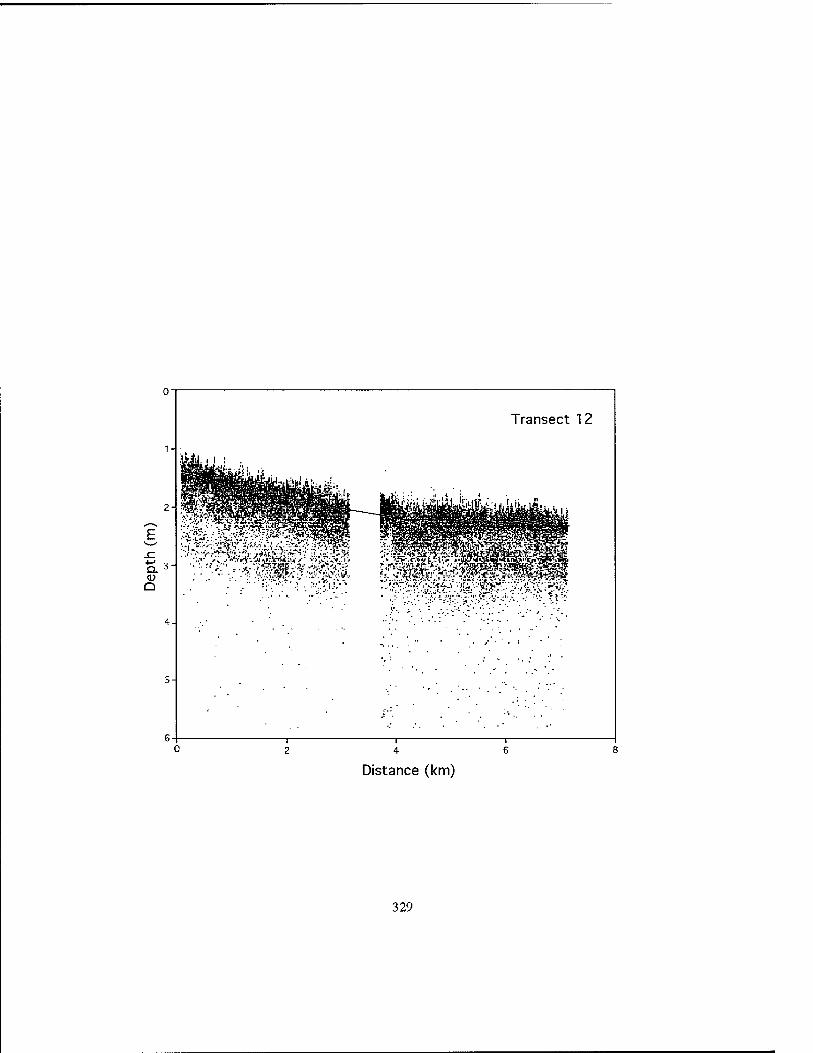
Transect 12
2-
SZ ■'-' -i ■
I. f»:Vv- -i-' ".'■'■v- ■*> ■■•■
S-
Distance (km)
329
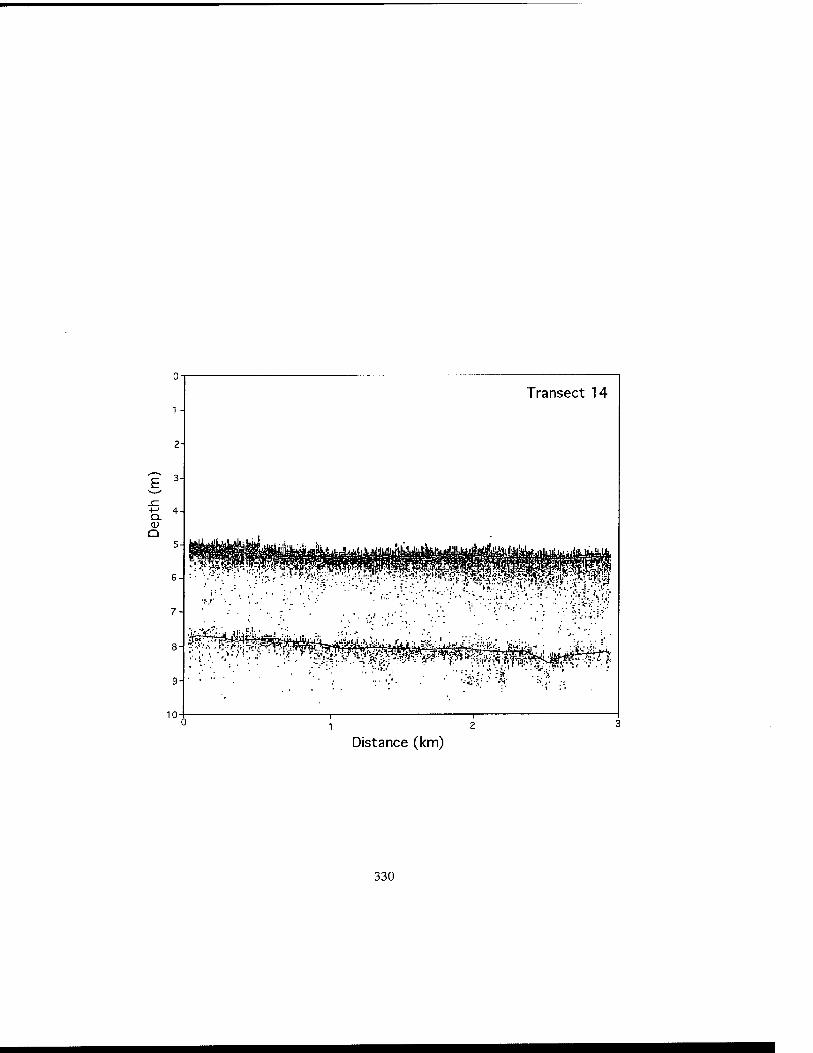
1 -
■M o. Q
4-
9-
10-
Transect 14
• ■'• y-S-r ■ ■ -^j.'!:■..■.■ ■■■■■■^■■- ■ ■■:■■■■/■ ■^■'f*/'^^
■Ji-^!^!Giii .i!i^''b,.',^j ■"■■■■ - .• :■■ :•'■•'. <" ' ■ •"•". ...•• •■ ■^."'■:
Distance (km)
330
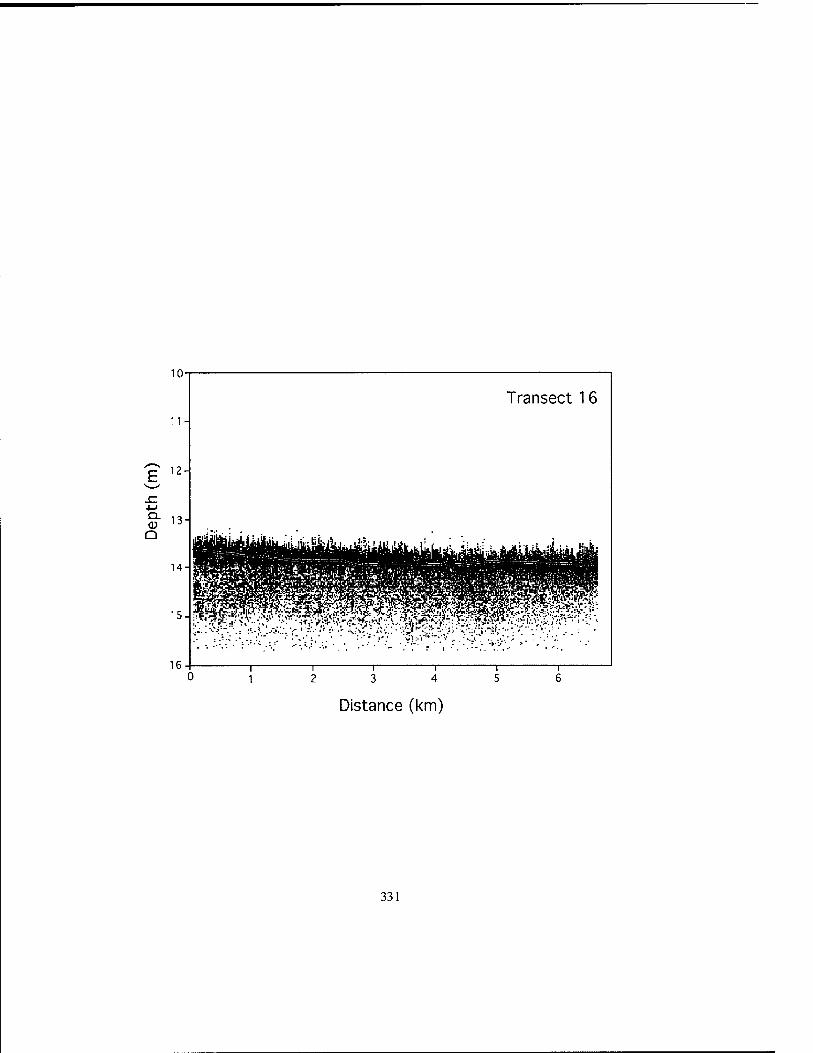
10-
12-
Transect 16
13-
14-
15-n" ,■■ ■ ■iTrV^Ti-'i>'-,'.?;?*f;=;-,'-;.\.;^Jt;e?;r^.>T-; .^
16- 2 3 4
Distance (km)
331
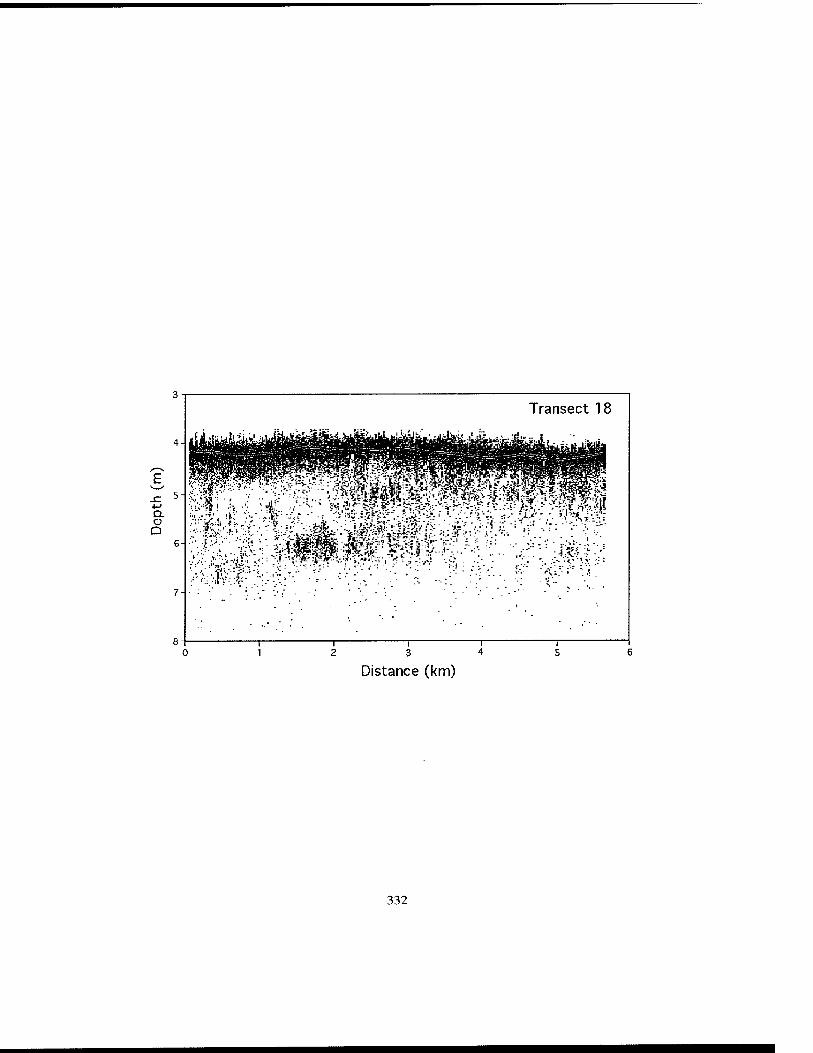
Transect 18
Q.
a
-^./i¥::r':^:;-:v:-'^ v.
2 3 4
Distance (km)
332
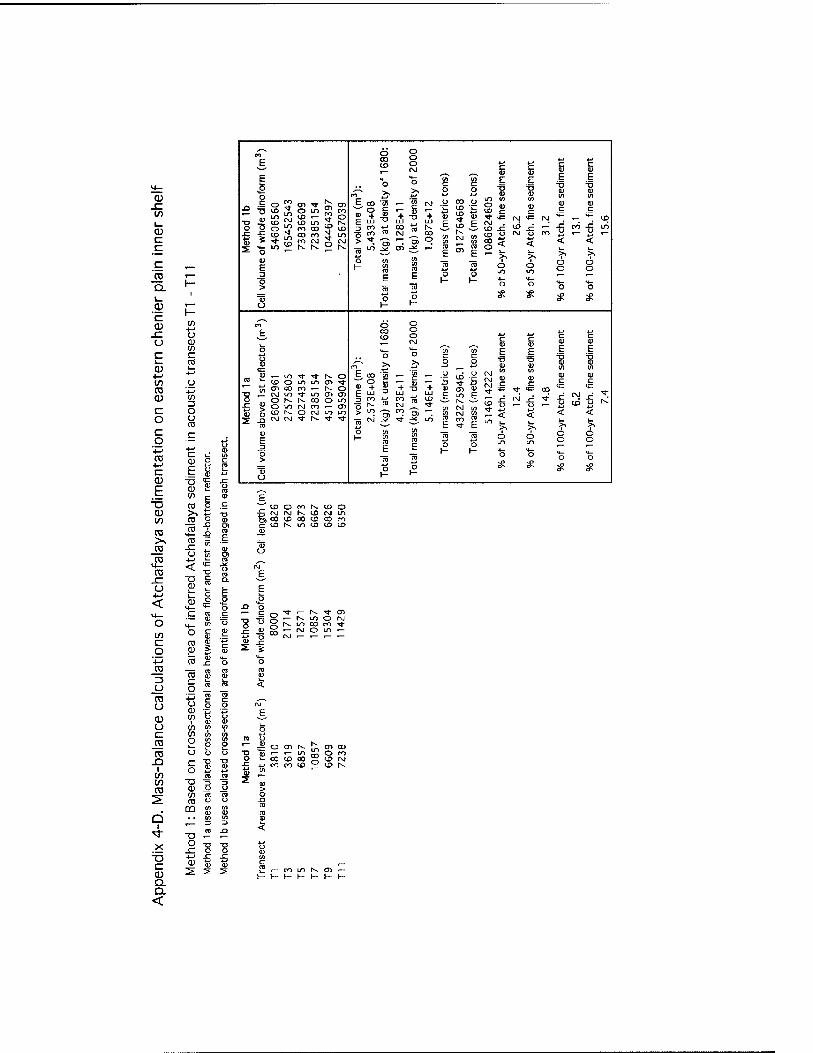
a; 10 L. a> c _c c is Q.
'c CD
c cu
■M 10 ro
o c .2 ■= tf TO
0)
T5 CD to TO
O u
c B 2
ro o
o
sis m _^ OT -a-
tCi >o ■— T3 Ji ID 5)J ID m O o o 2 n 00 € -5 ID 5; CO ro
^ >i- 10 2 t^ r^.
CO
> ^ 75 ""
^ •:
s -s
r- in (D O 01 CO CM tn o i«~ O LO ID r-.
^ ■* h- O m m (r> -^ ro r- r^ o ■«i- in (7> ^ 1^ 00 O 10 rj m .— cr> O rj m m -3- r^ -a- "3-
o
o
T? LLI 4-1 00 ™ CM
^ ■" CM
111 III
o> jj^ a> ;;^ T—
E r- U>
E F E E
"g ^ ■a ■u
<u
0 <u (D £ c. c
(U c
* :c t^ (M <0
(D ^ to r^ ■5 ^i 10 ID " 0 1—
S5 5 < < ■" :>^ >, >, ^^
0 to
0 10
0 0
0 0
0 0 0 0 * s; # #
o o o
C o
r +
LJJ TJ +
UJ ■*-•
rv. fNI in m OJ
CO ^
0) E
T! _ — <U
^ g ^ 0) ^ -M /vr C
c
E
c
E
0)
n\ ' (n fv I m ^ T^ T^ ^^
E
c
tn
CO ™ ^ E
I O in •4- O
U
< CD
<
o
to tJ
5 o
^ CD O (^ f^ ^D O :b fM CM s. tD (M m O) CO (D 00 CD CO m C CD r^ lO CD CD CD
^j O
ro o
■M
<
10 c o 4-'
13 U TO
■a
2 £
"7M CO ro cu
or.- u 0)
0
CD (/) '!> U V) in
c Ifl m ro u
0
TO u 0
1 c 0 "S
1/5 re (O u -j
ro <y 0
S in CD
re CJ
d QQ
^ T) CO
X 0 ..c ^ 13
0) 2
D. D. <
•<*•.— N. Tj- <y) •— f^ 10 O fM r^ in CO CO ':}■ ■— (\j o m -—
S 5
!i^ V ^
b ■n C^O ai IT) IT)
CO 0
0 CD ro
0 5: CO i£> 00 (£> rvi
re 3 1
jJ CO
0)
CO IV «X) 1^
> re 0
1^ r- ro LO I- H- H- I-
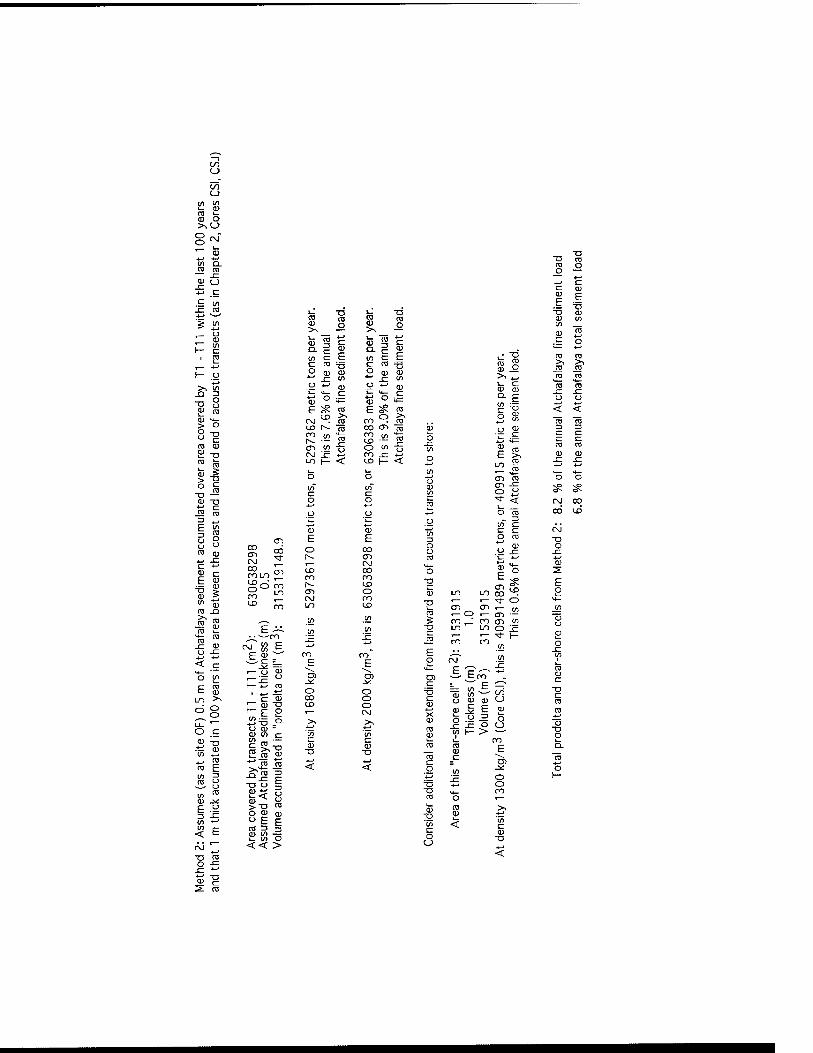
(/I O
c7i u
in tn
m m (> >.U o o rvj
0}
(n n ro m J:;
(U ( ) 4-* c
x: 4-'
ro s—' 1- ro T3 ro
1_ T3 ro <: trt <l> o 0) o ■4—' >^ >,
K tn a.
ro 4-^
(I) E
<D Q. c
4-'
(D E 1 ro V) c (n c
j-* o ro T3 o
ro t3 H .o CD
tn 0) x: in
>, t/i o *-> 0) o 4-' H)
1 3 O o ro
^4—
o ro
4-'
E O
ro 0) ~o CM
(XI ro CO o i2
§ o ro 0)
U3 r-^ ro CO <7i ro a;
on tn
en "ro no
O .<5 1
T3 OJ jz 4-* CO x; ro ro LO 1— < IX) 1- <
> o o o _ro CO tn' -o c c OJ "O o o 4-' c 4-' 4-' ro ro o ,o 3 E ro CD 0) 13 o o
0) x: c 0)
<D E E u ro c 0) E
CO CT) C\J CO roLD
go ro
CO
CT!
m
o
to CO
CO C31 OJ 00 en tXi
5! 1 LO CNJ
o tn t^ ro -D
_ro ro
CO CD ..1^,
cn C/1
.tn
tn
ro ro
E s;
ro E^
Jc: 'sz
o 4_» 4-/ CO <n" < _c E_ E E H— '— o tti ■---
o (/) P5 o C7) s
E ro cu
ro 4-' O o
LO >^ C <u CO o o o
? o "O (^ o o ^^ o OJ
O ,c 0) c«
D-
'en 4^ 'co
4-'
CA ^
S ro T3 cu
T3 CD
4-> ro ro E ■^ro
4-* 4-' < 4->
< en re
=3 O o
3 E
8 v> ro 2?< O) ^ 0) E =5
o >T3 ro 4-*
O CD
" E E < E ro 3
S: in << 3 o >
cu en c:
o CJ
c
ro
E o
ro Cl)
o ro o
>^ 4-' i„. «- (U <1) u. F in T3 o tn
11 <u 4-» M—
F 5, U^
ro 01 ro o-i -C o 4-- < I—
o m -1
tn c c: I n m
x:
in LO oo "? ^ o
^— v_^ I— (T) — ro ■ cn tn en LO LO o IE
en CD >- o
ro '^ h-
E-P'-t ~— ^o->
o OJ tu (-J
^ -c o CJ in I— > ~—
X! T3
'in c o tj
ro 0) c
ra IP
E -^
O O ro
"n o n; (U in tn cu ro
CJ
m ro >i >, ro CT:
m ro ro ro ^ x:
< <
o o ^ ^ OJ CO
CO U3
oj
o x; *-• Q)
E o
<1)
o
T3 c ro ro
"a; ■D o D.
15 4-" o H-
Xi o
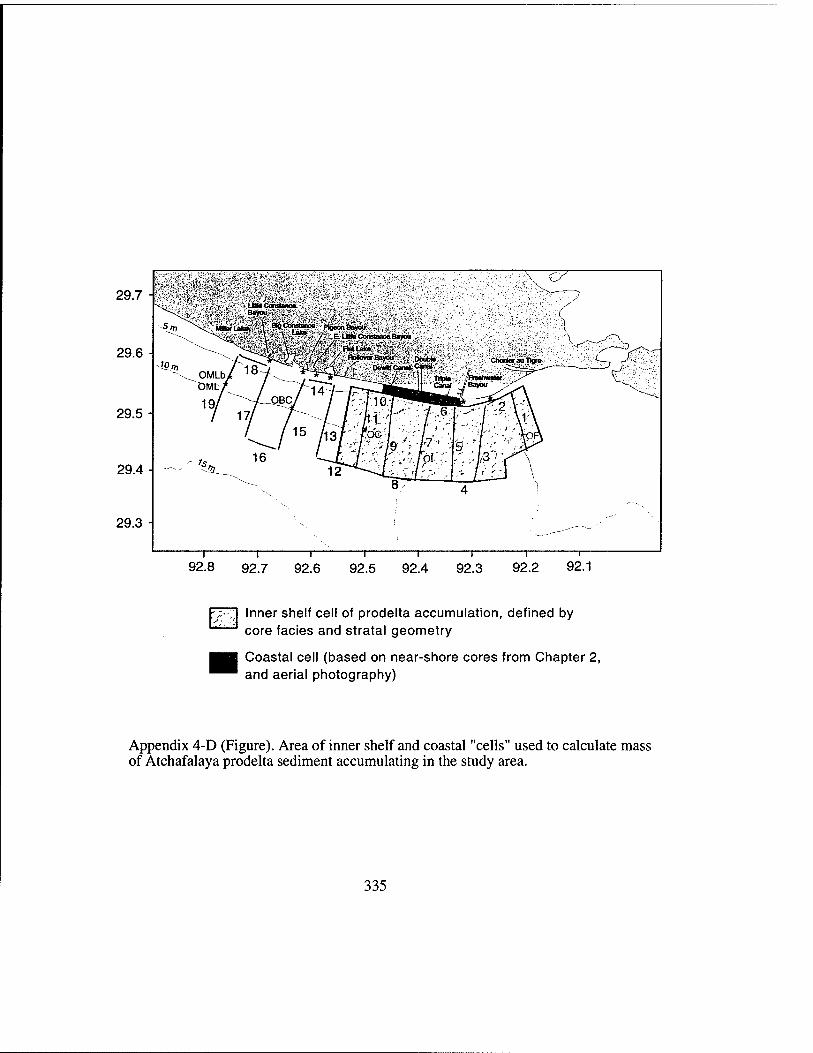
29.7
29.6
29.5
29.4
29.3
—I 1 1 1 1 1 1 1—
92.8 92.7 92.6 92.5 92.4 92.3 92.2 92.1
Inner shelf cell of prodelta accumulation, defined by core facies and stratal geometry
Coastal cell (based on near-shore cores from Chapter 2, and aerial photography)
Appendix 4-D (Figure). Area of inner shelf and coastal "cells" used to calculate mass of Atchafalaya prodelta sediment accumulating in the study area.
335
336
Chapter 5. Summary
This study has examined the evolution of a mud-dominated near-shore
sedimentary system on multiple time scales. Evidence has been presented for shoreline
accretion associated with energetic conditions during winter cold fronts and larger storms
that arise from tropical depressions. The identification of energetic events as agents of
coastal accretion is a phenomenon that has received little attention in the literature, and
that stands in contrast to the traditional assumption that low-energy conditions are
required for deposition of silt and clay-sized particles. An accretional response to
energetic conditions has not been widely documented on muddy coasts worldwide, and is
still not thoroughly understood. Mudflat growth under energetic conditions appears to
depend upon the presence of an unconsolidated, mud-rich sea bed in the immediate
vicinity of the coast. To maintain such an unconsolidated sea floor, close proximity to a
fluvial source that supplies abundant fine-grained sediment is presumed to be required.
An additional factor contributing to accretion during energetic events is a dominant
onshore wind direction, needed to generate waves that resuspended sediment and
transport it toward the coast. Conditions are most conducive to mudflat accretion if the
337
timing of high fine-grained sediment dehvery coincides with a season in which the
dominant wind direction blows toward shore. A low tidal range facilitates stabilization of
accreted material by allowing sediment to remain near its fluvial source and near the site
of its initial deposition; if the tidal range is large, strong tidal currents resuspend recently
deposited sediment and advect it away from a new mud bank.
Regarding conclusions specific to southwestern Louisiana, this investigation of
the distal Atchafalaya prodelta seaward of the chenier plain coast has yielded new
information about the present influence of the Atchafalaya River on sedimentation on the
inner continental shelf. The westward extent of the Atchafalaya prodelta was identified
on the chenier plain inner shelf. Unconsolidated prodelta sediment on the inner shelf was
found to correspond to the location of prograding mudflat zones on the eastern chenier
plain coast. The chenier plain shoreline, which has previously been shown to prograde
and retreat in response to delta switching processes on the Mississippi Delta complex, is
now undergoing limited accretion in response to the delivery of sediment by the
Atchafalaya River. Fluvial sediment is resuspended from the inner shelf and transferred
to coastal mudflats by wave and current response to cold front passage, and occasionally
to tropical storms and hurricanes, as described above.
Rates of shoreline migration along the chenier plain were evaluated. It was
determined through field study and examination of aerial photographs that the location of
mudflat accretion is currently more areally restricted than had been documented in past
decades, a trend attributed to decreased sediment load on the Mississippi River system
over the past -70 years.
This research was initially designed to test two hypotheses, and the conclusions
provide new information necessary to address the problems originally posed. The first
338
hypothesis, based on the work of O. K. Huh, H. H. Roberts, and J. T. Wells, stated that
the Atchafalaya River is responsible for widespread coastal accretion on the chenier
plain, to such an extent that "the [statewide] erosional trend is reversing and the western
half of the state is receiving a new pulse of sediment" (Wells and Roberts, 1981). The
occurrence of mudflat growth on the eastern chenier plain was indeed documented during
this investigation, and rates of shoreline progradation there were found to be on the order
of tens of meters per year. The source of sediment fueling this mudflat growth is likely to
be the Atchafalaya River, given the coincident locations of the prodelta sediment on the
inner shelf and the zone of coastal accretion. This study found that natural mudflat
progradation on the eastern chenier plain is accelerated, on short time scales, by the
strategic deposition of dredged sediment. Although the coast of western Louisiana does
receive sediment from the Atchafalaya River, recent coastal accretion was found to affect
a shorter stretch of shoreline than had been documented during the 19* and early 20"'
centuries. The northeastern chenier plain, which had undergone rapid progradation during
the 1800s and early 1900s, is now in a state of shoreline retreat. This transition from
accretion to erosion on that shoreline is believed to be related to decreased load on the
Mississippi-Atchafalaya river system due to soil conservation practices within the large
Midwestern drainage basin, and the construction of dams and reservoirs that trap
sediment on many tributaries of the Mississippi River. Localization of mudflat growth on
the eastern chenier plain is believed to occur due to complex interaction between the
westward coastal current and inner shelf bathymetry.
The second hypothesis, based on earlier work such as Wells and Roberts (1981)
and Rine and Ginsburg (1985), proposed that extensive coastal accretion can occur under
high-energy conditions. This was found to be true on the Louisiana chenier plain, and is
339
believed to be related to the presence of an abundant supply of fine-grained sediment that
maintains an unconsolidated muddy sea floor immediately offshore. This result invites
additional field research to more fully investigate the response of such an environment to
energetic conditions. The dissipation of wave energy into a muddy, unconsolidated sea
bed is a topic in which more study is certainly proscribed, in the hope that mechanisms
responsible for attenuation of wave energy into a mud substrate can be more thoroughly
quantified and predicted. This study has proposed a mechanism by which sediment is
deposited on a mudflat, using data from previous work (Kemp, 1986) to quantify a
relationship between sediment concentration, yield strength, and the critical thickness
necessary for a new mud deposit to remain stable on a sloping surface. Further field study
of newly deposited sediment, involving in situ measurements of sediment concentration,
would clarify the mechanism by which sediment deposition occurs. Understanding the
dynamics of such a system has extensive applications for sedimentary research, as well as
for coastal management tactics on a mud-dominated shoreline.
Third, in a matter of regional interest, the present influence of the Atchafalaya
River on inner shelf sedimentation was undertaken as a subject of study. Accumulation
rates within distal prodelta sediment that accumulates on the chenier plain inner shelf
have been quantified, and the location of an actively prograding clinoform has been
documented. The distal prodelta area considered in this study is estimated to be a sink for
approximately 8 ± 2% of the fine-grained sediment load carried annually by the
Atchafalaya River (~7 ± 2% of the total sediment load). Mass balance calculations using
data from previous studies on the Atchafalaya prodelta and in Atchafalaya Bay indicate
that -59% of the river's annual sediment load can be accounted for with the accumulation
rates that have been documented to date.
340
Future progradation of the central chenier plain coast is anticipated as the
Atchafalaya prodelta continues to spread westward. The zone of coastal mudflat accretion
should expand westward as the prodelta sediment similarly extends west, providing a
mud-rich unconsolidated sea bed from which sediment can be resuspended and advected
toward shore during cold front events and occasional large storms. The anthropogenic
control of the Atchafalaya sedimentary system, however, is likely to limit the present and
future capability of this fluvial source to cause additional accretion on the chenier plain
coast and inner shelf.
Recommendations for future work in this area include the collection of additional
cores and seismic data on the distal Atchafalaya prodelta. Examination of core
stratigraphy combined with Chirp acoustic data, which penetrates tens of meters below
the sea floor, would allow more detailed resolution of stratal development. Such
information could provide the basis for modeling studies of earlier depocenter migration
within the Mississippi Delta complex. Additional investigation of the behavior of mud-
dominated coastal systems during energetic conditions could focus on geographic areas
that have been poorly documented to date; example of such systems are the prograding
deltaic deposits of the Mekong and Irrawaddy Rivers, on the coasts of
Vietnam/Kampuchea and Myanmar (Burma), respectively.
More detailed field study of mud-dominated shorelines could clarify the role of
energetic events in coastal geomorphic development. Future field study of wave
attenuation over a mud-rich sea bed, with emphasis on the prediction of wave energy
over varying thickness and concentration of muddy boundary layers on the sea floor,
would allow testing of existing theory and predictive models for the influence of a mud
substrate on wave energy. The comparison of quantitative field investigations with
341

models would provide a valuable advancement to our understanding of such systems, and
is indicated as a future direction of research in mud-dominated coastal environments.
342
References
Adams, R. D., Banas, P. J., Baumann, R. H., Blackman, J. H. and Mclntire, B. W. G.
1978. Shoreline erosion in coastal Louisiana: Inventory and assessment. Final report
to Louisiana Department of Transportation and Development, 139 pages.
Adams, C. E. Jr., Wells, J. T. and Coleman, J. M. 1982. Sediment transport on the central
Louisiana continental shelf: implications for the developing Atchafalaya River delta.
Contributions in Marine Science 25, 133 - 148. Alexander, C. A., DeMaster, D. J. and Nittrouer, C. A. 1991. Sediment accumulation in a
modem epicontinental-shelf setting: the Yellow Sea. Marine Geology 98, 51 - 72.
Allen, J. R. L. and Friend, P. F. 1968. Deposition of the Catskill facies, Appalachian
region: with notes on some other Old Red Sandstone basins. Geological Society of
America Special Paper 106, 21 - 74. Allen, G. P. 1971. Relationship between grain size parameter distribution and current
patterns in the Gironde estuary. Journal of Sedimentary Petrology 41, 74 - 78.
Alien, G. P., Sauzay, G., Castaing, P. and Jouanneau, J. M. 1977. Transport and
deposition of suspended sediment in the Gironde estuary, France. In: Wiley, M. (ed.)
Estuarine Processes, Volume IL New York: Academic Press, 63 - 81. Allison, M. A., Nittrouer, C. A. and Faria Jr., L. E. C. 1995a. Rates and mechanisms of
shoreface progradation and retreat downdrift of the Amazon river mouth. Marine
Geology 125, 313-392. Allison, M. A., Nittrouer, C. A. and Kineke, G. C. 1995b. Seasonal sediment storage on
mudflats adjacent to the Amazon River. Marine Geology 125, 303 - 328.
Allison, M. A., Kuehl, S. A., Martin, T. C. and Hassan, A. 1998. Importance of flood- plain sedimentation for river sediment budgets and terrigenous input to the oceans: insights from the Brahmaputra-Jamuna River. Geology 26, 175 - 178.
Allison, M. A., Kineke, G. C., Gordon, E. S. and Goni, M. A. 2000a. Development and reworking of a seasonal flood deposit on the inner continental shelf off the
Atchafalaya River. Continental Shelf Research 20, 2267-2294.
Allison, M. A, Lee, M. T., Ogston, A. S., and Aller, R. C. 2000b. Origin of mudbanks
along the northeast coast of South America. Marine Geology 163, 241 - 256. Allison, M. A. and Neill, C. F. 2002. Accumulation rates and stratigraphic character of
the modem Atchafalaya River prodelta, Louisiana. Transactions - Gulf Coast
Association of Geological Societies 52, 1031 - 1040. Allison, M. A. and Lee, M. T. Sediment exchange between Amazon mudbanks and
fringing mangroves in French Guiana. Marine Geology Special Volume, in press.
343
Amos, C. L., Sutherland, T. F., Cloutier, D. and Patterson, S. 2000. Corrasion of a
remoulded cohesive bed by saltating littorinid shells. Continental Shelf Research 20,
1291-1315. Anderson, F. E., Black, L., Watling, L. E., Mook, W. and Mayer, L. M. 1981. A temporal
and spatial study of mudflat erosion and deposition. Journal of Sedimentary
Petrology 51,129-736. Anderson, F. E. and Mayer, L. M. 1984. Seasonal and spatial variability of particulate
matter of a muddy intertidal flood front. Sedimentology 31, 383 - 394.
Anthony, E. J. 1989. Chenier plain development in northern Sierra Leone, West Africa.
Marine Geology 90, 297 - 309. Appleby, P. G. and Oldfield, F. 1978. The calculation of lead-210 dates assuming a
constant rate of supply of unsupported "'"Pb to the sediment. Catena 5,1-8. Aubrey, D. G. 1979. Seasonal patterns of onshore/offshore sediment movement. Journal
of Geophysical Research 84, 6347 - 6354. Augustinus, P. G. E. F. 1989. Cheniers and chenier plains: a general introduction. Marine
Geology 90,219-229. Augustinus, P. G. E. F., Hazelhoff, L. and Kroon, A. 1989. The chenier coast of
Suriname: modem and geological development. Marine Geology 90, 269 - 281. Baba, M. and Nayak, S. R. 2002. Muddy coasts of India. In: Healy, T., Wang, Y. and
Healy, J.-A. (eds.) Muddy coasts of the world: processes, deposits, and function.
Elsevier Science, 375 - 390. Bao, C. and Healy, T. 2002. Typhoon storm surge and some effects on muddy coasts. In:
Healy, T., Wang, Y. and Healy, J.-A. (eds.) Muddy coasts of the worid: processes,
deposits, and function. Elsevier Science, 263 - 278. Barry, R. G. and Perry, A. H. 1973. Synoptic Climatology: Methods and Applications.
London: Methuen and Co. Ltd., 555 pages. Barry, R. G. and Carleton, A. M. 2001. Synoptic and Dynamic Climatology. London:
Routledge, 620 pages. Baskaran, M. and Santschi, P. H. 2002. Particulate and dissolved -'°Pb activities in the
shelf and slope regions of the Gulf of Mexico waters. Continental Shelf Research 22, 1493-1510.
Beall, A. O. Jr. 1968. Sedimentary processes operative along the western Louisiana shoreline. Journal of Sedimentary Petrology 38, 869-877.
Bearman, G. (ed.) 1989. Waves, tides, and shallow-water processes. Open University
course team. Oxford: Pergamon Press, 187 pages.
344
Bentley, S. J. and Nittrouer, C. A. 1999. Physical and biological influences on the
formation of sedimentary fabric in an oxygen-restricted depositional environment:
Eckenforde Bay, southwestern Baltic Sea. Palaios 14, 585 - 600.
Berger, W. H. and Heath, G. R. 1968. Vertical mixing in pelagic sediments. Journal of
Marine Research 26, 134 - 143. Boggs, S. Jr. 1995. Principles of sedimentology and stratigraphy. New Jersey: Prentice
Hall, second edition, 774 pages. Boudreau, B. P. 1994. Is burial velocity a master parameter for bioturbation? Geochimica
et Cosmochimica Acta 58, 1243 - 1249. Bourgeois, J. 1980. A transgressive shelf sequence exhibiting hummocky stratification:
the Cape Sebastian sandstone (upper Cretaceous), southwestern Oregon. Journal of
Sedimentary Petrology 50, 681 - 702. Brannon, H. R. Jr., Simons, L. H., Perry, D., Daughtry, A. C. and McFarlan, E. Jr. 1957.
Humble oil company radiocarbon dates II. Science 125, 919 - 923. Bruun, P. 1983. Review of conditions for uses of the Bruun Rule of erosion. Coastal
Engineering 7, 777 - 789. Boyd, R. and Penland, S. 1981. Washover of deltaic barriers on the Louisiana coast.
Transactions - Gulf Coast Association of Geological Societies 31, 243 - 248.
Buesseler, K. O., Livingston, H. D., Honjo, S., Hay, B. J., Konuk, T. and Kempe, S.
1990. Scavenging and particle deposition in the southwestern Black Sea; evidence
from Chernobyl radiotracers. Deep-Sea Research Part A 37, 413 - 430. Buesseler, K. and Benitez, C. 1994. Determination of mass accumulation rates and
sediment radionuclide inventories in the deep Black Sea. Deep-Sea Research Part I
41, 1605-1615. Bull, J. M., Quinn, R. and Dix, J. K. 1998. Reflection coefficient calculation from marine
high-resolution seismic reflection (Chirp) data and application to an archeologica!
case study. Marine Geophysical Researches 20, 1-11. Burt, N., Parker, R. and Watts, J. (eds.) 1997. Cohesive Sediments. John Wiley and Sons,
474 pages. Byrne, J. V., LeRoy, D. O. and Riley, C. M. 1959. The chenier plain and its stratigraphy,
southwestern Louisiana. Transactions - Gulf Coast Association of Geological
Societies 9, 237 - 260. Cahoon, D. R., Reed, D. J., Day, J. W. Jr., Steyer, G. D., Boumans, R. M., Lynch, J. C,
McNally, D. and Latif, N. 1995. The influence of Hurricane Andrew on sediment distribution in Louisiana coastal marshes. Journal of Coastal Research Special Issue
21,280-294.
345
Chapman, V. J. 1974. Salt marshes and salt deserts of the world (2""^ edition). Cramer,
Lehre, 392 pages. Chuang, W.-S. and Wiseman, W. J. 1983. Coastal sea level response to frontal passages
on the Louisiana-Texas shelf. Journal of Geophysical Research 88, 2615-2620.
Clarke, D. J. and Eliot, I. G. 1988. Low-frequency variations in the seasonal intensity of
coastal weather systems and sediment movement on the beachface of a sandy beach.
Marine Geology 79, 23 - 40.
Coakley, J. P. and Syvitski, J. P. M. 1991. SediGraph technique. In: Syvitski, J. P. M.
(ed). Principles, methods, and application of particle size analysis. Cambridge
University Press, 368 pages. Coates, G. F. and Hulse, C. A. 1985. A comparison of four methods of size analysis of
fine-grained sediments. New Zealand Journal of Geology and Geophysics 28, 369 -
380. Cochrane, J. D. and Kelley, F. J. 1986. Low-frequency circulation on the Texas-
Louisiana continental shelf. Journal of Geophysical Research 91, 10,645 - 10,659. Coleman, J. M. and Gagliano, S. M. 1964. Cyclic sedimentation in the Mississippi River
deltaic plain. Transactions - Gulf Coast Association of Geological Societies 14, 67 -
80. Coleman, J. M. and Gagliano, S. M. 1965. Sedimentary structures: Mississippi River
deltaic plain. In: Primary sedimentary structures and their hydrodynamic
interpretation. SEPM Special Publication 12, 133 - 148. Coleman, J. M. 1966. Recent coastal sedimentation: central Louisiana coast. Technical
Report No. 17, Coastal Studies Institute, Louisiana State University. Baton Rouge,
LA, 73 pages. Coleman, J. M. 1981. Deltas: processes of deposition and models for exploration.
Minneapolis, Minnesota: Burgess Publishing Company, 124 pages. Coleman, J. M. 1988. Dynamic changes and processes in the Mississippi River delta.
Geological Society of America Bulletin 100, 999-1015. Crozaz, G., Picciotto, E. and De Breuck, W. 1964. Antarctic snow chronology with -'"Pb.
Journal of Geophysical Research 69, 2597 - 2604. Curray, J. R. 1960. Sediments and history of Holocene transgression, continental shelf,
northwest Gulf of Mexico. In: Shepard, F. P., Phleger, F. B. and Van Andel, T. H.
(eds). Recent sediments, northwest Gulf of Mexico. Tulsa, Oklahoma: American
Association of Petroleum Geologists, 221 -226.
Daniel, J. R. K. 1989. The chenier plain coastal system of Guyana. Marine Geology 90,
283-287.
346
DeAngelis, R. M. and Nelson, E. R. 1969. Summary of Hurricane Camille, 1969. U.S.
Department of Commerce, ESSA Climatological Data, National Summary, Vol. 20, No. 8, http://www.mathstat.usouthal.edu/~lynn/hurricanes/camille.htmI.
Deamaley, M. P., Roberts, W., Jones, S., Leurer, K. C, Lintem, D. G., Merckelbach, L.
M., Sills, G. C., Toorman, E. A. and Winterwerp, J. C. 2002. Measurement and
modeling of the properties of cohesive sediment transport. In: Winterwerp, J. C. and
Kranenburg, C. (eds.) Fine sediment dynamics in the marine environment.
Amsterdam: Elsevier Press, 57 - 73. De Haas, H. and Eisma, D. 1993. Suspended-sediment transport in the Dollard Estuary.
Netherlands Journal of Sea Research 31, 37 - 42.
DeLaune, R. D., Baumann, R. H. and Gosselink, J. G. 1983. Relationships among vertical
accretion, coastal submergence, and erosion in a Louisiana Gulf Coast marsh. Journal
of Sedimentary Petrology 53, 147 - 157. Delft Hydraulics Laboratory. 1962. Demerara coastal investigation. Report on siltation of
Demerara bar channel and coastal erosion in British Guiana. Delft, 240 pages. DeMaster, D. J., Kuehl, S. A. and Nittrouer, C. A. 1986. Effects of suspended sediments
on geochemical processes near the mouth of the Amazon River; examination of
biological silica uptake and the fate of particle-reactive elements. Continental Shelf
Research 6, 107 - 125. Dingier, J. R. and Reiss, T. 1995. Beach erosion on Trinity Island, Louisiana, caused by
Hurricane Andrew. Journal of Coastal Research Special Issue 21, 254 - 264. Donnelly, J. P., Bryant, S. S., Butler, J., Dowling, J., Fan, L., Hausmann, N., Newby, P.,
Shuman, B., Stem, J., Westover, K. and Webb, T. III. 2001. 700 yr sedimentary
record of intense hurricane landfalls in southern New England. Geological Society of
American Bulletin 113, 714 - 727. Dott, R. H. Jr. and Bourgeois, J. 1982. Hummocky stratification: significance of its
variable bedding sequences. Geological Society of America Bulletin 93, 663 - 680. Dott, R. H. Jr. 1983. 1982 SEPM presidential address: Episodic sedimentation - how
normal is average? How rare is rare? Does it matter? Journal of Sedimentary
Petrology 53, 5 - 23. Drury, S. 2001. Image Interpretation in Geology. Blackwell Science, 290 pages.
Duursma, E. K. and Gross, M. G. 1971. Marine sediments and radioactivity. In: Radioactivity in the marine environment. Panel on Radioactivity in the Marine
Environment of the Committee on Oceanography, National Research Council.
Washington, D.C.: National Academy of Sciences, 147 - 160.
347
Einstein, H. A. 1941. The viscosity of highly concentrated underflows and its influence
on mixing. Transactions of the American Geophysical Union, Hydrology Section,
597 - 603. Einstein, H. A. and Krone, R. B. 1962. Experiments to determine modes of cohesive
sediment transport in salt water. Journal of Geophysical Research 67, 1451 - 1461. Eisma, D. and Van der Marel, H. W. 1971. Marine muds along the Guiana coast and their
origin from the Amazon basin. Contributions to Mineralogy and Petrology 31, 321 -
334. Eisma, D., Augustinus, P. G. E. F. and Alexander, C. R. 1991. Recent and subrecent
changes in the dispersal of Amazon mud. Netherlands Journal of Sea Research 28,
181-192. Eliot, I. G. and Clarke, D. J. 1988. Semi-diurnal variation in beachface aggradation and
degradation. Marine Geology 79, 1 - 22. Emery, K. O. 1968. Relict sediments on continental shelves of the world. American
Association of Petroleum Geologists Bulletin 52, 445 - 464. Faas, R. W., Christian, H. A., Dabom, G. R. and Brylinsky, M. 1993. Biological control
of mass properties of surficial sediments: an example from Starr's Point tidal flat, Minas Basin, Bay of Fundy. In: Mehta, A. J. (ed.) Nearshore and Estuarine Cohesive Sediment Transport. Coastal and Estuarine Studies Series 42. Washington, D. C:
American Geophysical Union, 360 - 377. Fairbanks, R. G. 1989. A 17,000-year glacio-eustatic sea level record: influence of glacial
melting rates on the Younger Dryas event and deep-ocean circulation. Nature 342,
637 - 642. Femandez-Partagas, J. and Mooers, C. N. K. 1975. A subsynoptic study of winter cold
fronts in Florida. Monthly Weather Review 103, 742 - 744. Figueiredo, A. G. Jr., Sanders, J. E. and Swift, D. J. P. 1982. Storm-graded layers on
inner continental shelves: examples from southern Brazil and the Atlantic coast of the
central United States. Sedimentary Geology 31, 171 - 190.
Fisk, H. N. 1944. Geological investigation of the alluvial valley of the lower Mississippi River. U. S. Army Corps of Engineers, Mississippi River Commission, Vicksburg,
Mississippi. Fisk, H. N. and McFarian, E. Jr. 1955. Late Quaternary deltaic deposits of the Mississippi
River- local sedimentation and basin tectonics. In: Poldervaart, A. (ed.) Crust of the earth, a symposium. Geological Society of America Special Paper 62, 279 - 302.
348
Flemming, B. W. 2002. Geographic distribution of muddy coasts. In: Healy, T., Wang,
Y. and Healy, J.-A. (eds.) Muddy coasts of the world: processes, deposits, and
function. Elsevier Science, 99-201. Forristall, G. Z., Hamilton, R. C. and Cardone, V. J. 1977. Continental shelf currents in
tropical storm Delia: observations and theory. Journal of Physical Oceanography 7,
532 - 546. Frazier, D. E. 1967. Recent deposits of the Mississippi River, their development and
chronology. Transactions - Gulf Coast Association of Geological Societies 17, 287 -
315. Friedrichs, C. T. and Aubrey, D. G. 1996. Uniform bottom shear stress and equilibrium
hyposometry [sic] of intertidal flats. In: Mixing in estuaries and coastal seas.
American Geophysical Union: Coastal and Estuarine Studies 50, 405 - 429. Gaggler, H., Von Gunten, H. R. and Nyffeler, V. 1976. Determination of "'"Pb in lake
sediments and air samples by direct gamma-ray measurement. Earth and Planetary
Science Letters 33, 119 - 121. Gagliano, S. M. and van Beek, J. L. 1970. Geologic and geomorphic aspects of deltaic
processes, Mississippi delta system. Hydrologic and geologic studies of coastal
Louisiana, Report No. 1, Louisiana State University Coastal Studies Institute and
Department of Marine Sciences, 140 pages.
Gagliano, S. M., Meyer-Amdt, K. J. and Wicker, K. M. 1981. Land loss in the
Mississippi River deltaic plain. Transactions - Gulf Coast Association of Geological
Societies 3\, 295-300. Geyer, W. R. 1995. Tide-induced mixing in the Amazon frontal zone. Journal of
Geophysical Research 100, 23-41. Geyer, W. R., Hill, P. S. and Kineke, G. C. The transport and dispersal of sediment by
buoyant coastal flows. Continental Shelf Research, in press. Glaczier, R. 1998. The history of Gulf Coast hurricanes. In: Klein, L.A., Landry, M. and
Seward, J. E. (eds.) Marine resources and history of the Mississippi Gulf Coast,
Volume n, Mississippi Dept. of Marine Resources and NOAA, 317 - 323. Goiii, M. A., Ruttenburg, K. C. and Eglinton, T. L 1998. A reassessment of the sources
and importance of land-derived organic matter in surface sediments from the Gulf of
Mexico. Geochimica et Cosmochimica Acta 62, 3055 - 3075. Goodbred, S. L. Jr. and Kuehl, S. A. 1998. Floodplain processes in the Bengal Basin and
storage of Ganges-Brahmaputra river sediment: an accretion study using '""Cs and
"'"Pb geochronology. Sedimentary Geology 121, 239 - 258.
349
Goodbred, S. L. Jr. and Kuehl, S. A. 1999. Holocene and modem sediment budgets for
the Ganges-Brahmaputra river system: Evidence for highstand dispersal to flood-
plain, shelf, and deep-sea depocenters. Geology 27, 559 - 562. Gopinathan, C. K. and Qasim, S. Z. 1974. Mud banks of Kerala - their formation and
characteristics. India Journal of Marine Science 3, 105 - 114. Gordon, E. S., Goni, M. A., Roberts, Q. N., Kineke, G. C. and Allison, M. A. 2001.
Organic matter distribution and accumulation on the inner Louisiana shelf west of the
Atchafalaya River. Continental Shelf Research!], 1691 - 1721.
Gorsline, D. S. 1985. Introduction to a symposium on fine-grained sedimentology. Geo-
Marine Letters 4, 133 - 138. Gould, H. R. and McFarlan, E. Jr. 1959. Geologic history of the chenier plain,
southwestern Louisiana. Transactions - Gulf Coast Association of Geological
Societies 9, 26\-274. Greensmith, J. T. and Tucker, E. V. 1969. The origin of Holocene shell deposits in the
chenier plain facies of Essex (Great Britain). Marine Geology 7, 403 - 425. Grymes, J. M. III. Louisiana state climatologist, Louisiana Office of State Climatology.
Unpublished synopfic climatology data from Lake Charles weather station, 1981 -
2001. Guntenspergen, G. R., Cahoon, D. R., Grace, J., Steyer, G. D., Foumet, S., Townson, M.
A. and Foote, A. L. 1995. Disturbance and recovery of the Louisiana coastal marsh landscape from the impacts of Hurricane Andrew. Journal of Coastal Research
Special Issue 21, 324-339. Hackett, C. W. 1931. Pichardo's treatise on the limits of Louisiana and Texas. University
of Texas press, Austin, Texas, Volume 1, 630 pages. Reference in: Morgan, J. P., Nichols, L. G. and Wright, M. 1958. Morphologic effects of Hurricane Audrey. Technical Report 10, Coastal Studies Institute, Louisiana State University, Baton
Rouge, LA, 53 pages. Han, M. K., Wu, L. and Liu, Y. F. 1996. Coastal zone management issues in the North
China Plain caused by sea level rise and anthropologic actions. Proceedings of the MAFF 31" conference of River and Coastal Engineers, July 3-5, 1996. U. K.
Ministry of Agriculture, Fisheries and Food, 7.3.1. - 7.3.15.
Han, M. K., Wu, L., Liu, Y. F. and Mimura, N. 1997. Impacts of sea-level rise and
human activities on the evolution of the Pearl River delta. South China. In:
Flemming, B. W., Delafontaine, M. T. and Liebezeit, G. (eds.) Muddy coast
dynamics and resource management. Elsevier Science, 237 - 246.
350
Han, M. 2002. Human influences on muddy coasts. In: Healy, T., Wang, Y. and Healy,
J.-A. (eds.) Muddy coasts of the world: processes, deposits, and function. Elsevier
Science, 293-317. Hayes, M. O. 1967. Hurricanes as geologic agents: case studies of hurricanes Caria, 1961
and Cindy, 1963. University of Texas, Austin, Bureau of Economic Geology: Report
of Investigations 61, 1 - 50. Higgins, E. E. 2002. Effects of a muddy coast on wave attenuation: Gulf of Mexico,
Louisiana. Chestnut Hill, MA: M. S. Thesis, Boston College, 55 pages. Holmes, C. W. 1985. Natural radioisotope ^'"Pb as an indicator of origin of fine-grained
sediment. Geo-Marine Letters 4, 203 - 206. Houghton, J. 1997. Global warming, the complete briefing. Cambridge University Press
(second edition), 251 pages. Houwing, E.-J. 2000. Morphodynamic development of intertidal mudflats: consequences
for the extension of the pioneer zone. Continental Shelf Research 20, 1735 - 1748. Hoyt, J. H. 1969. Chenier versus barrier genetic and stratigraphic distinction. American
Association of Petroleum Geologists Bulletin 53, 299-306.
Huh, O. K., Roberts, H. H., Rouse, L. J. and Rickman, D. A. 1991. Fine grain sediment transport and deposition in the Atchafalaya and chenier plain sedimentary system.
Coastal Sediments '91, 817-830. Huh, O. K., Walker, N. D. and Moeller, C. 2001. Sedimentation along the eastern chenier
plain coast: down drift impact of a delta complex shift. Journal of Coastal Research
17,72-81. Huus, K. 1999. The Yellow River's desperate plight. MSNBC, NBC News,
http ://w w w .msnbc .com/ne ws/320005 .asp?cp 1 = 1. Hydraulics Research Station. 1979. Port of Brisbane siltation study, fifth report:
properties of Brisbane mud. Wallingford, U.K.: Report EX860, 18 pages. Hyne, N. J., Laidig, L. W. and Cooper, W. A. 1979. Prodelta sedimentation on a
lacustrine delta by clay mineral flocculation. Journal of Sedimentary Petrology 49,
1209-1216. Inman, D. L. and Filloux, J. 1960. Beach cycles related to tide and local wind wave
regime. Journal of Geology 63, 225 - 231. Jaeger, J. M. and Nittrouer, C. A. 1995. Tidal controls on the formation of fine-scale
sedimentary strata near the Amazon mouth. Marine Geology 125, 259 - 281. Janssen-Stelder, B. 2000. The effect of different hydrodynamic conditions on the
morphodynamics of a tidal mudflat in the Dutch Wadden Sea. Continental Shelf
ResearchlQ, 1461-1478.
351
Joshi, S. R. 1987. Nondestructive determination of Lead-210 and Radium-226 in
sediments by direct photon analysis. Journal of Radioanalytical and Nuclear
Chemistry 116, 169-212.
Ke, X. 2002. Tidal dynamics in two contrasting muddy coastal environments - Jiangsu
and The Wash. In: Healy, T., Wang, Y. and Healy, J.-A. (eds.) Muddy coasts of the
world: processes, deposits, and function. Elsevier Science, 441 - 461.
Ke, X. and Collins, M. 2002. Saltmarshes in the West Solent (southern England): their
morphodynamics and evolution. In: Healy, T., Wang, Y. and Healy, J.-A. (eds.)
Muddy coasts of the world: processes, deposits, and function. Elsevier Science, 411 -
440.
Kemp, G. P. 1986. Mud deposition at the shoreface: wave and sediment dynamics on the
chenier plain of Louisiana. Baton Rouge, Louisiana: Louisiana State University,
Ph.D. dissertation, 146 pages.
Keown, M. P., Dardeau, E. A. Jr. and Causey, E. M. 1986. Historic trends in the sediment
flow regime of the Mississippi River. Water Resources Research 22, 1555 - 1564. Kesel, R. H. 1988. The decline in the suspended load of the lower Mississippi River and
its influence on adjacent wetlands. Environmental Geology and Water Science 11,
271-281. Kineke, G. C. and Stemberg, R. W. 1995. Distribution of fluid muds on the Amazon
continental shelf. Marine Geology 125, 193 - 233.
Kineke, G. C, Stemberg, R. W., Trowbridge, J. H. and Geyer, W. R. 1996. Fluid-mud
processes on the Amazon continental shelf. Continental Shelf Research 16, 667 -
696. Kineke, G. C. 2001a. The role of fluid mud in sediment transport processes along a
muddy coast. Report to the Office of Naval Research, Grant NOOO14-98-0083, Fiscal
Year 2001: http://www.onr.navy.mil/sci_tech/ocean/reports/docs/cd/01/cdkine01.pdf
Kineke, G. C. 2001b. Fine-sediment dispersal and accumulation on the shallow Louisiana
shelf. Eos, Transactions of the American Geophysical Union 82 (47), Fall Meeting
Supplement, Abstract OS22B-03.
Kineke, G. C, Hart, K. A., Velasco, D. W. and Allison, M. A. 2001. The role of short time-scale resuspension events in dispersal of Atchafalaya River sediment on the
shallow shelf. Gulf of Mexico (Poster): American Geophysical Union Chapman
Conference on the Formation of Strata on Continental Margins, Ponce, Puerto Rico. Kirby, R. and Parker, W. R. 1983. Distribution and behavior of fine sediment in the
Severn Estuary and Inner Bristol Channel, U. K. Canadian Journal of Fisheries and
Aquatic Science 40 (Supplement 1), 83 - 95.
352
Kirby, R., Bleakley, R. J., Weatherup, S. T. C, Raven, P. J. and Donaldson, N. D. 1993.
Effect of episodic events on tidal mud flat stability, Ardmillan Bay, Strangford
Lough, Northern Ireland. In: Mehta, A. J. (ed.) Nearshore and Estuarine Cohesive
Sediment Transport. Coastal and Estuarine Studies Series 42. Washington, D. C:
American Geophysical Union, 378 - 392. Kirby, R. 2000. Practical implications of tidal flat shape. Continental Shelf Research 20,
1061 - 1077. Kirby, R. 2002. Distinguishing accretion from erosion-dominated muddy coasts. In:
Healy, T., Wang, Y. and Healy, J.-A. (eds.) Muddy coasts of the world: processes,
deposits, and function. Elsevier Science, 61 - 81.
Knudsen Engineering, Ltd. 1996. Knudsen 320B Series Blackbox Echosounder
Operator's Manual. Perth, Ontario, Knudsen Engineering, Ltd. Kolb, C. R. and Van Lopik, J. R. 1958. Geology of the Mississippi River deltaic plain,
southeastern Louisiana. U. S. Army Corps of Engineers Waterways Experiment
Station, Vicksburg, Mississippi, Technical Report 3-483. Komar, P. D. and Miller, M. C. 1975. On the comparison between the threshold of
sediment motion under waves and unidirectional currents with a discussion of the practical evaluation of the threshold. Journal of Sedimentary Petrology 45, 362 - 367.
Komar, P. D. 1998. Beach processes and sedimentation. Prentice Hall, 544 pages.
Kranck, K., Petticrew, E., Milligan, T. G. and Droppo, L G. 1993. In situ particle size distributions resulting from flocculation of suspended sediment. In: Mehta, A. J. (ed). Nearshore and estuarine cohesive sediment transport. Washington, D.C.: American
Geophysical Union, Coastal and Estuarine Studies Series 42, 60 - 74. Krone, R. B. 1962. Flume studies of the transport of sediment in estuarial shoaling
processes. Hydraulic Engineering and Sanitary Engineering Research Laboratory,
University of California, Berkeley. Prepared for the US Army Corps of Engineers,
San Francisco District, 110 pages. Krone, R. B. 1963. A study of rheologic properties of estuarial sediments. Technical
Bulletin 7, Commission on Tidal Hydraulics, US Army Corps of Engineers, 91 pages.
Kuehl, S. A., Nittrouer, C. A., DeMaster, D. J. and Curtin, T. B. 1985. A long, square- barrel gravity corer for sedimentological and geochemical investigation of fine-
grained sediments. Marine Geology 62, 365 - 370. Kuehl, S. A., Nittrouer, C. A. and DeMaster, D. J. 1988. Microfabric study of fine-
grained sediments: observations from the Amazon subaqueous delta. Journal of
Sedimentary Petrology 5%, X'^-'^^-
353
Kuehl, S. A., Hariu, T. M. and Moore, W. S. 1990. Shelf sedimentation off the Ganges-
Brahmaputra river system: evidence for sediment bypassing to the Bengal Fan.
Geology \7, 1132-1135. Kuehl, S. A., Pacioni, T. D. and Rine, J. M. 1995. Seabed dynamics of the inner Amazon
continental shelf: temporal and spatial variability of surficial strata. Marine Geology
125,283-302.
Kuehl, S. A., Levy, B. M., Moore, W. S. and Allison, M. A. 1997. Subaqueous delta of
the Ganges-Brahmaputra system. Marine Geology 144, 81 -96.
Kuijpers, A., Dennegard, B., Albinsson, Y. and Jensen, A. 1993. Sediment transport
pathways in the Skaggerak and Kattegat as indicated by sediment Chernobyl activity
and heavy metal concentrations. Marine Geology 111, 231 - 244. Larsen, R. J. and Marx, M. L. 1986. An introduction to mathematical statistics and its
applications. New Jersey: Prentice Hall, 630 pages. Lee, S.-C. and Mehta, A. J. 1997. Problems in characterizing dynamics of mud-shore
profiles. Journal of Hydraulic Engineering 123, 351 - 361. Lee, H. J. and Chough, S. K. 1987. Technical note - bulk density, void ratio, and porosity
determined from average grain density and water content: an evaluation of errors.
Marine Geotechnology 7, 53 - 62. Lee, H. J. and Chu, Y. S. 2001. Origin of inner-shelf mud deposit in the southeastern
Yellow Sea: Huksan mud belt. Journal of Sedimentary Research 71, 144 - 154. Levin, D. R. 1991. Transgressions and regressions in the Barataria bight region of coastal
Louisiana. Tranasctions - Gulf Coast Association of Geological Societies 41, 408 -
431. Li, G., Wei, H., Yue, S., Cheng, Y. and Han, Y. 1998. Sedimentation in the Yellow
River delta, part II: suspended sediment dispersal and deposition on the subaqueous
delta. Marine Geology 149, 113 - 131. Li, Y. and Mehta, A. J. 1998. Assessment of hindered settling of fluid mudlike
suspensions. Journal of Hydraulic Engineering 124, 176- 178.
Livingston, H. D. and Bowen, V. T. 1979. Pu and '"Cs in coastal sediments. Earth and Planetary Science Letters 43, 29 - 45.
Louisiana Geological Survey. 1984. Coastal Geology Map Series No. 1, Aerial videotape survey of the chenier plain coast. Louisiana State University, Baton Rouge, Louisiana.
Louisiana Geological Survey. 1985a. Coastal Geology Map Series No. 3, Aerial videotape survey of Hurricane Danny impact zone. Louisiana State University, Baton
Rouge, Louisiana.
354
Louisiana Geological Survey. 1985b. Coastal Geology Map Series No. 5, Aerial
videotape survey of Hurricane Juan impact zone. Louisiana State University, Baton Rouge, Louisiana.
Louisiana Geological Survey. 1986. Coastal Geology Map Series No. 6, Aerial videotape
survey of the chenier plain coast. Louisiana State University, Baton Rouge, Louisiana.
Louisiana Geological Survey. 1989. Coastal Geology Map Series No. 10. Aerial
videotape survey of the chenier plain coast. Louisiana State University, Baton Rouge, Louisiana.
Louisiana Geological Survey. 1991. Coastal Geology Map Series No. 12, Aerial
videotape survey of the chenier plain coast. Louisiana State University, Baton Rouge, Louisiana.
Louisiana Geological Survey. 1992. Coastal Geology Map Series No. 14, Aerial
videotape survey of Hurricane Andrew impact zone. Louisiana State University, Baton Rouge, Louisiana.
Louisiana Geological Survey. 2001. Coastal Geology Map Series No. 25, Aerial
videotape survey of Tropical Storm Allison impact zone. Louisiana State University, Baton Rouge, Louisiana.
Louisiana State University. 1998. Aerial photographs on Atlas Geographic Information
Systems web server: http://www.atlas.lsu.edu.
Madsen, O. S. and Grant, W. D. 1975. The threshold of sediment movement under
oscillatory waves; a discussion. Journal of Sedimentary Petrology 45, 360 - 361.
Mai, S. and Bartholoma, A. 1997. The missing mud flats of the Wadden Sea: a reconstruction of sediments and accommodation space lost in the wake of land reclamation. In: Flemming, B. W., Delafontaine, M. T. and Liebezeit, G. (eds).
Muddy coast dynamics and resource management. Elsevier Science, 257 - 272. Mallik, T. K., Mukherji, K. K. and Ramachandran, K. K. 1988. Sedimentology of the
Kerala mud banks (fluid muds?). Marine Geology 80, 99 - 118.
Mann, C. J. and Thomas, W. A. 1968. The ancient Mississippi River. Transactions - Gulf Coast Association of Geological Societies 18, 187-204.
Mathew, J. and Baba, M. 1995. Mudbanks of the southwest coast of India II: Wave-mud
mteracUons. Journal of Coastal Research 11, 179- 187. McAnally, W. H. and Mehta, A. J. (eds.) 2001. Coastal and Estuarine Fine Sediment
Processes. Amsterdam: Elsevier Press, 507 pages.
355
McCave, I. N. 1984. Erosion, transport and deposition of fine-grained marine sediments.
In: Stow, D. A. V. and Piper, D. J. W. (eds.) Fine-graind sediments: deep-water
processes and facies. Geological Society Special Publication 15, 35 - 69. McCave, I. N. and Syvitski, J. P. M. 1991. Principles and methods of geological particle
size analysis. In: Syvitski, J. P. M. (ed). Principles, methods, and application of
particle size analysis. Cambridge University Press, 368 pages. McFarlan, E. Jr. 1961. Radiocarbon dating of late Quaternary deposits, south Louisiana.
Geological Society of America Bulletin 72, 129 - 158. McGowan, J. H., Groat, C. G., Brown, L. F. Jr., Fisher, W. L. and Scott, A. J. 1970.
Effects of Hurricane Celia: a focus on environmental geologic problems of the Texas
coastal zone. Bureau of Economic Geology, Geologic Circular 70-3. Austin:
University of Texas press, 35 pages. Meade, R. H. (ed.) 1995. Contaminants in the Mississippi River, 1987 - 1992. U. S.
Geological Survey Circular 1133. Denver: United States Government Printing Office,
140 pages. Mehta, A. J. 1988. Laboratory studies on cohesive sediment deposition and erosion. In:
Dronkers, J. and van Leussen, W. Physical Processes in Estuaries. New York:
Springer Veriag, 488 - 502. Mehta, A. J. (ed.) 1986. Estuarine Cohesive Sediment Dynamics, Ed. Beriin: Springer-
Veriag, 473 pages. Mehta, A. J. and Hayter, E. J. 1989. High Concentration Cohesive Sediment Transport.
Journal of Coastal Research Special Issue 5, 230 pages. Mehta, A. J. (ed.) 1993. Nearshore and estuarine cohesive sediment transport.
Washington, D.C.: American Geophysical Union, Coastal and Estuarine Studies
Series 42, 581 pages. Mehta, A. J., Lee, S.-C. and Li, Y. 1994. Fluid mud and water waves: a brief review of
interactive processes and simple modeling approaches. Vicksburg, MS: US Army Corps of Engineers, Contract report DRP-94-4, 79 pages.
Mehta, A. J. 2002. Mudshore dynamics and controls. In: Healy, T., Wang, Y. and Healy, J.-A. (eds.) Muddy coasts of the world: processes, deposits, and function. Elsevier
Science, 19-60. Merckelbach, L. M., Kranenburg, C. and Winterwerp, J. C. 2002. Strength modeling of
consolidating mud beds. In: Winterwerp, J. C. and Kranenburg, C. (eds.) Fine sediment dynamics in the marine environment. Amsterdam: Elsevier Press, 359 -
373.
356
Michels, K. H., Kudrass, H. R., Hubscher, C, Suckow, A. and Wiedicke, M. 1998. The
submarine delta of the Ganges-Brahmaputra: cyclone-dominated sedimentation
patterns. Marine Geology 149, 133 - 154. Micromeritics, Inc. 2001. SediGraph 5100 Operator's Manual. Norcross, Georgia:
Micromeretics, Inc. Miller, K. M. and Heit, M. 1986. A time resolution methodology for assessing the quality
of lake sediment cores that are dated by '"Cs. Limnology and Oceanography 31,
1292-1300. Milliman, J. D. and Meade, R. H. 1983. World-wide delivery of river sediment to the
ocean. Journal of Geology 91, 1 - 21. Mobbs, P. M. 1981. Clay mineralogy of deltaic sediments, Atchafalaya River, Louisiana.
Baton Rouge, Louisiana: Louisiana State University, M. S. Thesis, 70 pages. Moeller, C. C., Huh, O. K., Roberts, H. H., Gumley, L. E. and Menzel, W. P. 1993.
Response of Louisiana coastal environments to a cold front passage. Journal of
Coastal Research 9, 434-447. Montaigne, F. 2002. Water Pressure. National Geographic, September 2002, 2 - 32.
Morgan, J. P., Van Lopik, J. R. and Nichols, L. G. 1953. Occurrence and development of mudflats along the western Louisiana coast. Technical Report No. 2, Coastal Studies
Institute, Louisiana State University. Baton Rouge, LA, 34 pages.
Morgan, J. P. and Larimore, P. B. 1957. Changes in the Louisiana shoreline. Transactions - Gulf Coast Association of Geological Societies 7, 303-310.
Morgan, J. P., Nichols, L. G., and Wright, M. 1958. Morphologic effects of Hurricane
Audrey. Technical Report 10, Coastal Studies Institute, Louisiana State University,
Baton Rouge. Morgan, J. P. 1963. Louisiana's changing shoreline. In: Slovenko, R. (ed.) Oil and gas
operations: Legal considerations in the tidelands and on land. Baton Rouge, Louisiana: United States Gulf Coastal Studies Technical Report 16, Part D.
Morton, R. A. 1981. Formation of storm deposits by wind-forced currents in the Gulf of
Mexico and the North Sea. International Association of Sedimentologists Special
Publication 5, 385 - 396. Morton, R. A. 1988. Nearshore response to great storms. In: Clifton, H. E. (ed.)
Sedimentologic consequences of convulsive geologic events. Geological Society of
America Special Paper 229, 7 - 22. Morton, R. A. and Winker, C. D. 1979. Distribution and significance of coarse biogenic
and clastic deposits on the Texas inner shelf. Transactions - Gulf Coast Association
of Geological Societies 29, 306 - 320.
357
Mossa, J. 1996. Sediment dynamics in the lowermost Mississippi River. Engineering
Geology 45, 457-419. Mossa, J. and Roberts, H. H. 1990. Synergism of riverine and winter storm-related
sediment transport processes in Louisiana's coastal wetlands. Transactions - Gulf
Coast Association of Geological Societies 40, 635 - 642. Muller, R. A. 1977. A synoptic climatology for environmental baseline analysis: New
Orleans. Journal of Applied Meterology 16, 20 - 33. Muller, R. A. and Wax, C. L. 1977. A comparative synoptic climatic baseline for coastal
Louisiana. Geoscience and Man 18, 121 - 129. Muller, R. A. and Wills, J. E. 1983. New Orleans weather 1961 - 1980: A climatology by
means of synoptic weather types. Louisiana State University School of Geoscience
Miscellaneous Publications, 83-1, 70 pages. Murray, S. P. 1970. Bottom currents near the coast during hurricane Camille. Journal of
Geophysical Research 75, 4579 - 4582. Nair, R. R. 1976. Unique mud banks, Kerala, southwest India. American Association of
Petroleum Geologists Bulletin 60, 616 - 621. National Aeronautics and Space Administration. 2001. ER-2-based Airborne Sensor
Facility aerial photography program, NASA Ames Research Center, Moffett Field,
California. National Data Buoy Center. 2002. http://www.ndbc.noaa.gov. National Hurricane Center. 2002. National Hurricane Center and Tropical Prediction
Center of the National Weather Service, National Oceanic and Atmospheric
Association, http://www.nhc.noaa.gov. Nemec, W. 1995. The dynamics of deltaic suspension plumes. In: Oti, M. N. and Postma,
G. (eds.) Geology of deltas. Rotterdam, Netherlands: A. A. Balkema, 31-93.
Nguyen, V. L., Ta, T. K. O. and Tateishi, M. 2000. Late Holocene depositional environments and coastal evolution of the Mekong River Delta, southern Vietnam.
Journal of Asian Earth Sciences 18, 427 - 439. Niederoda, A. W., Swift, D. J. P., Hopkins, T. S. and Chen-Mean Ma. 1984. Shoreface
morphodynamics on wave-dominated coasts. Marine Geology 60, 331 - 354. Nittrouer, C. A. 1978. The process of detrital sediment accumulation in a continental
shelf environment: an examination of the Washington shelf. Seattle, Washington:
University of Washington, Ph.D. dissertation, 243 pages. Nittrouer, C. A., Stemberg, R. W., Carpenter, R. and Bennett, J. T. 1979. The use of Pb-
210 geochronology as a sedimentary tool: application to the Washington continental
shelf. Marine Geology 31, 297 - 316.
358
Nittrouer, C. A. and Stemberg, R. W. 1981. The formation of sedimentary strata in an
allochthonous shelf environment: the Washington continental shelf. Marine Geology
42,201-232. Nittrouer, C. A., DeMaster, D. J. and McKee, B. A. 1984. Fine-scale stratigraphy in
proximal and distal deposits of sediment dispersal systems in the East China Sea.
Marine Geology 61, 13 - 24. Nittrouer, C. A., DeMaster, D. J., Kuehl, S. A., McKee, B. A. and Thorbjamarson, K. W.
1985. Some questions and answers about the accumulation of fine-grained sediment
in continental margin environments. Geo-Marine Letters 4, 211 - 213.
Nittrouer, C. A., Kuehl, S. A., DeMaster, D. J., Kowsmann, R. O. 1986. The deltaic
nature of Amazon shelf sedimentation. Geological Society of America Bulletin 97,
444 - 458. Nittrouer, C. A., Kuehl, S. A., Stemberg, R. W., Figueiredo A. G. Jr. and Faria, L. E. C.
1995. An introduction to the geological significance of sediment transport and accumulation on the Amazon continental shelf. Marine Geology 125, 177 - 192.
Nittrouer, C. A. and DeMaster, D. J. 1996. The Amazon shelf setting: tropical, energetic,
and influenced by a large river. Continental Shelf Research 16, 553 - 573. Noller, J. S. 2000. Lead-210 Geochronology. In: Quaternary Geochronology: Methods
and Applications. American Geophysical Union Reference Shelf 4, 115 - 120.
Nummedal, D. S., Penland, S., Gerdes, R., Schramm, W., Kahn, J. and Roberts, H. 1980.
Geologic response to hurricane impacts on low-profile Gulf Coast barriers.
Transactions - Gulf Coast Association of Geological Societies 30, 183 - 190.
Oliver, J. P., Hicken, G. K. and Orr, C. 1971. Rapid, automatic particle-size analysis in
the subsieve range. Powder Technology 4, 257 - 263. Otvos, E. G. and Price, W. A. 1979. Problems of chenier genesis and terminology - an
overview. Marine Geology 31, 252 - 263. Owen, M. W. 1970. A detailed study of the settling velocities of an estuary mud.
Hydraulic Research Station, Wallingford, U.K.: Report INT 78, 25 pages. Penland, S. and Boyd, R. 1981. Shoreline changes on the Louisiana barrier coast. IEEE
[Institute of Electrical and Electronics Engineers] Oceans 81, 209 - 219. Penland, S., Suter, J. R. and McBride, R. A. 1987. Delta plain development and sea level
history in the Terrebonne coastal region, Louisiana. Coastal Sediments '87, 1689 -
1705. Penland, S., and Suter, J. R. 1989. The geomorphology of the Mississippi River chenier
Plain. Marine Geology 90, 231-258.
359
Penland, S., Suter, J. R., Sallenger Jr., A. H., Williams, S. J., McBride, R. A., Westphal,
K. E., Reimer, P. D. and Jaffe, B. E. 1989. Morphodynamic signature of the 1985
hurricane impacts on the northern Gulf of Mexico. Coastal Zone '89, Proceedings of the Sixth Symposium on Coastal and Ocean Management 6, 4220-4234.
Penland, S. and Ramsey, K. E. 1990. Relative sea-level rise in Louisiana and the Gulf of
Mexico: 1908-1988. Journal of Coastal Research 6, 323 - 342.
Penland, S., Roberts, H. H., Williams, S. J., Sallenger, A. H. Jr., Cahoon, D. R., Davis, D.
W. and Groat, C. G. 1990. Coastal land loss in Louisiana. Transactions - Gulf Coast
Association of Geological Societies 40, 685 - 699. Penland, S., Wayne, L., Bntsch, L. D., Williams, S. J., Beall, A. D. and Butterworth, V.
C. 2000. Process classification of coastal land loss between 1932 and 1990 in the Mississippi River delta plain, southeastern Louisiana. Reston, Virginia: U.S.
Geological Survey Open File Report, OFR-00-418. Postma, H. 1961. Transport and accumulation of suspended matter in the Dutch Wadden
Sea. Netherlands Journal of Sea Research 1, 148 - 190. Postma, G. 1990. Depositional architecture and facies of river and fan deltas: a synthesis.
In: Colelia, A. and Prior, D. B. (eds). International Association of Sedimentologists
Special Publication 10, 13-27. Postma, G. 1995. Causes of architectural variation in deltas. In: Oti, M. N. and Postma,
G. (eds). Geology of deltas. Rotterdam, Netheriands: A. A. Balkema, 3-16.
Prochnow, J., Schweim, C. and Koengeter, J. 2002. Simulation of biogenic sediment stabilisation by heterotrophic bacteria in an annular flume. In: Winterwerp, J. C. and Kranenburg, C. (eds.) Fine sediment dynamics in the marine environment.
Amsterdam: Elsevier Press, 393 - 403. Prost, M. T. 1989. Coastal dynamics and chenier sands in French Guiana. Marine
Geology 90, 259 - 267. Qinshang, Y., Shiyuan, X. and Xusheng, S. 1989. Holocene cheniers in the Yangtze
delta, China. Marine Geology 90, 337 - 343. Quinn, R., Bull, J. M. and Dix, J. K. 1998. Optimal processing of marine high-resolution
seismic reflection (Chirp) data. Marine Geophysical Researches 20, 13 - 20. Redfield, W. C. 1846. On three several hurricanes of the American seas and their
relations to the Northers, so called, of the Gulf of Mexico and the Bay of Honduras with charts illustrating the same. American Journal of Science and the Arts, Second Series, 1, (2), 153 - 169. Citation in: Morgan et al., 1958 (see reference above).
Reineck, H. E. and Singh, L B. 1972. Genesis of laminated sand and graded rhythmites in
storm-sand layers of shelf mud. Sedimentology 18, 123 - 128.
360
Rejmanek, M., Sasser, C. E. and Peterson, G. W. 1988. Hurricane-induced sediment
deposition in a Gulf Coast marsh. Estuarine, Coastal, and Shelf Science 27, 217 -
222. Ren, M. E. Zhang, R. S., Yang, J. H. and Zhang, D. C. 1983. The effect of storm surges
on the muddy coast with reference to the Jiangsu Province (in Chinese with an
English abstract). Marine Geology and Quaternary Geology 3, 1 - 24.
Richard, G. A. 1978. Seasonal and environmental variations in sediment accretion in a
Long Island salt marsh. Estuaries 1, 29 - 35. Rine, J. M. and Ginsburg, R. N. 1985. Depositional facies of a mud shoreface in
Suriname, South America: a mud analogue to sandy, shallow-marine deposits.
Journal of Sedimentary Petrology 55, 633 - 652. Roberts, H. H., Adams, R. D. and Cunningham, R. H. 1980. Evolution of sand-dominant
subaerial phase, Atchafalaya delta, Louisiana. American Association of Petroleum
Geologists Bulletin 64, 264 - 279. Roberts, H. H., Huh, O. K., Hsu, S. A., Rouse, L. J., Jr. and Rickman, D. A. 1987. Impact
of cold-front passages on geomorphic evolution and sediment dynamics of the
complex Louisiana coast. Coastal Sediments '87, 1950-1963. Roberts, H. H., Huh, O. K., Hsu, S. A., Rouse, L. J., Jr. and Rickman, D. A. 1989. Winter
storm impacts on the chenier plain coast of southwestern Louisiana. Transactions -
Gulf Coast Association of Geological Societies 39, 515-522. Roberts, H. H. 1997. Dynamic changes of the Holocene Mississippi River delta plain: the
delta cycle. Journal of Coastal Research 13, 605 - 627. Roberts, H. H., Walker, N., Cunningham, R., Kemp, G. P. and Majersky, S. 1997.
Evolution of sedimentary architecture and surface morphology: Atchafalaya and Wax
Lake deltas, Louisiana (1973-1994). Transactions - Gulf Coast Association of
Geological Societies 47, 477 - 484. Roberts, H. H., Bentley, S., Coleman, J. M., Hsu, S. A., Huh, O. K., Rotondo, K., Inoue,
M., Rouse, L .J. Jr., Sheremet, A., Stone, G., Walker, N., Welsh, S. and Wiseman, W.
J. Jr. 2002. Geological framework and sedimentology of recent mud deposition on the eastern chenier plain coast and adjacent inner shelf, western Louisiana. Transactions
- Gulf Coast Association of Geological Societies 52, 849-859.
Ross, M. A. and Mehta, A. J. 1989. On the mechanics of lutoclines and fluid mud.
Journal of Coastal Research Special Issue 5, 51 - 62. Rotondo, K. A. and Bentley, S. J. 2002. Fluid mud sedimentation on the innermost
western Louisiana shelf. Eos Trans. AGU, 83(4), Ocean Sci. Meet. Suppl., Abstract
OSllG-890.
361
Rouse Jr., L. J., Roberts, H. H. and Cunningham, R. H. W. 1978. Satellite observation of
the subaerial growth of the Atchafalaya Delta, Louisiana. Geology 6, 405-408. Russell, R. J. and Howe H. V. 1935. Cheniers of southwestern Louisiana. Geographical
Review 25, 449-461. Saito, Y., Wei, H., Zhou, Y., Nishimura, A., Sato, Y. and Yokota, S. 2000. Delta
progradation and chenier formation in the Huanghe (Yellow River) delta, China.
Journal of Asian Earth Sciences 18, 489 - 497.
Saito, Y., Yang, Z. and Hori, K. 2001. The Huanghe (Yellow River) and Changjiang
(Yangtze River) deltas: a review on their characteristics, evolution and sediment
discharge during the Holocene. Geomorphology 41, 219 - 231.
Saito, Y., Ta, T. K. O., Nguyen, V. L., Tateishi, M., Kobayashi, L and Tanabe, S. 2002.
Late Holocene delta evolution of the Mekong River, southern Vietnam. American
Geophysical Union Chapman Conference on Continent-Ocean Interactions within the
East Asian Marginal Seas, San Diego, California, November 2002. Saucier, R. T. 1963. Recent geomorphic history of the Ponchartrain Basin. Louisiana
State University, Coastal Studies Series 9, 114 pages. Saucier, R. T. 1994. Geomorphology and quaternary geologic history of the Lower
Mississippi Valley. Mississippi River Commission, Vicksburg, MS, 364 pages. Schlemon, R. J. 1975. Subaqueous delta formation - Atchafalaya Bay, Louisiana. In:
Broussard, M. L. (ed.) Deltas. Houston, Texas: Houston Geological Society, 209 -
221. Scrudato, R. J. and Estes, E. L. 1976. Clay-lead sorption relations. Environmental
Geology], 167-170. Scruton, P. C. 1960. Delta building and the deltaic sequence. In: Shepard, F. P., Phleger,
P. B. and Van Andel, T. H. (eds). Recent sediments, northwest Gulf of Mexico.
Tulsa, Oklahoma: American Association of Petroleum Geologists, 82 - 102.
Shepard, F. P., Phleger, F. B. and Van Andel, T. H. (eds). 1960. Recent sediments, northwest Gulf of Mexico. Tulsa, Oklahoma: American Association of Petroleum
Geologists, 394 pages. Shepard, F. P. 1960. Mississippi delta: marginal environments, sediments, and growth.
In: Shepard, F. P., Phleger, F. B. and Van Andel, T. H. (eds). Recent sediments, northwest Gulf of Mexico. Tulsa, Oklahoma: American Association of Petroleum
Geologists, 56-81. Sheremet, A. and Stone, G. W. 2001. Observations of nearshore storm waves in the Gulf
of Mexico. Eos, Transactions of the American Geophysical Union 82 (47), Fall
Meeting Supplement, Abstract OS31B-0415.
362
Shi, Z. and Chen, J. Y. 1996. Morphodynamics and sediment dynamics on intertidal
mudflats in China (1961 - 1994). Continental Shelf Research 16, 1909 - 1926. Sholkovitz, E. R., Cochran, J. K. and Carey, A. E. 1983. Laboratory studies of the
diagenesis and mobility of -■''^■'''"Pu and '"Cs in nearshore sediments. Geochimica et
Cosmochimica Acta 41, 1369- 1379. Sholkovitz, E. R. and Mann, D. R. 1984. The pore water chemistry of ^^^.^wp^ ^^d '"Cs in
sediments of Buzzards Bay, Massachusetts. Geochimica et Cosmochimica Acta 48,
1107-1114. Short, A. D. 1989. Chenier research on the Australian coast. Marine Geology 90, 345 -
351. Shuisky, Y. D. 1989. Approaches to the study of cheniers along the coastline of the
Soviet Union. Marine Geology 90, 289 - 296. Simpson, R. H. and Riehl, H. 1981. The hurricane and its impact. Baton Rouge:
Louisiana State University Press, 398 pages. Singer, J. K. 1986. Results of an intercalibration experiment: an evaluation of the
reproducibility of data generated from instruments used in textural analyses. Rice
University Sedimentology Report, 60 pages. Singer, J. K., Anderson, J. B., Ledbetter, M. T., Jones, K. P. N., McCave, L N. and
Wright, R. 1988. An assessment of analytical techniques for the size analysis of fine-
grained sediments. Journal of Sedimentary Petrology 58, 534 - 543. Smith, J. N. and Walton, A. 1980. Sediment accumulation rates and geochronologies
measured in the Sanguenay fjord using Pb-210 dating method. Geochimica et
Cosmochimica Acta 44, 225 - 240. Smith, J. N. and Ellis, K. M. 1982. Transport mechanism for Pb-210, Cs-137 and Pu
fallout radionuclides through fluvial-marine systems. Geochimica et Cosmochimica
Acta 46, 94] -954. Sommerfield, C. K., Nittrouer, C. A. and Figueiredo, A. G. 1995. Stratigraphic evidence
of changes in Amazon shelf sedimentation during the late Holocene. Marine Geology
125,351-371. Stein, R. 1985. Rapid grain-size analyses of clay and silt fraction by SediGraph 5000D:
Comparison with Coulter Counter and Atterberg methods. Journal of Sedimentary
Petrology 55, 590 - 593. Stone, G. W. and Finkl, C. W. (eds.) 1995. Impact of Hurricane Andrew on the coastal
zones of Florida and Louisiana; 22 - 26 August 1992. Journal of Coastal Research
Special Issue 21, 1 -5.
363
Stone, G. W., Xu, J. P. and Zhang, X. 1995. Estimation of the wave field during
Hurricane Andrew and morphological change along the Louisiana coast. Journal of
Coastal Research Special Issue 21, 234 - 253. Stone, G. W., Grymes, J. M. Ill, Dingier, J. R. and Pepper, D. A. 1997. Overview and
significance of hurricanes on the Louisiana coast, U.S.A. Journal of Coastal
Research 13, 656 - 669. Stuiver, M., Pearson, G. W. and Braziunas, T. 1986. Radiocarbon age calibration of
marine samples back to 9000 cal yr BP. Radiocarbon 28, 980 - 1021. Sutton, R. G. and Ramsayer, G. R. 1975. Association of lithologies and sedimentary
structures in marine deltaic environments. Journal of Sedimentary Petrology 45, 799
-807. Syvitski, J. P. M., Asprey, K. W., Clattenburg, D. A. and Hodge, G. D. 1985. The
prodelta environment of a fjord: suspended particle dynamics. Sedimentology 32, 83 -
107. Syvitski, J. P. M., Smith, J. N., Calabrese, E. A. and Boudreau, B. P. 1988. Basin
sedimentation and the growth of prograding deltas. Journal of Geophysical Research
93,6895 - 6908. Ta, T. K. O., Nguyen, V. L., Tateishi, M., Kobayashi, I., Saito, Y. and Nakamura, T.
2002. Sediment facies and Late Holocene progradation of the Mekong River Delta in
Bentre Province, southern Vietnam: an example of evolution from a tide-dominated
to a tide- and wave-dominated delta. Sedimentary Geology 152, 313 - 325. Tannehill, I. R. 1938. Hurricanes, their nature and history. Princeton University Press,
Princeton, New Jersey, 257 pages. Thompson, W. C. 1951. Oceanographic analysis of Atchafalaya Bay, Louisiana and
adjacent continental shelf areas marine pipeline problems. Texas A&M Research
Foundation, Department of Oceanography 2 (25), 31 pages. Thompson, C. E. L. and Amos, C. L. 2002. The impact of mobile disarticulated shells of
Cerastoderma edulis on the abrasion of a cohesive substrate. Estuaries 25, 204-214.
Tomqvist, T. E., Kidder, T. R., Autin, W. J., van der Borg, K., de Jong, A. F. M., Klerks, C. J. W., Snijders, E. M. A., Storms, J. E. P., van Dam, R. L. and Wiemann, M. C. 1996. A revised chronology for Mississippi River subdeltas. Science 273, 1693 -
1696. Trowbridge, A. C. 1930. Building of Mississippi delta. American Association of
Petroleum Geologists Bulletin 14, 867 - 901. Trowbridge, J. H. and Kineke, G. C. 1994. Structure and dynamics of fluid muds on the
Amazon continental shelf. Journal of Geophysical Research 99, 865 - 874.
364
Turekian, K. K. 1977. The fate of metals in the oceans. Ceochimica et Cosmochimica
Ada 41, 1139-1144. Tye, R. S. and Coleman, J. M. 1989. Evolution of Atchafalaya lacustrine deltas, south-
central Louisiana. Sedimentary Geology 65, 95 - 112.
United States Army Corps of Engineers. 1971. National shoreline study: inventory report
- lower Mississippi region. New Orleans District, New Orieans, Louisiana, 57 pages.
United States Army Corps of Engineers. 2002a. Summary and description of Atchafalaya
River discharge regulation through the Old River Control Structure. http://www.mvn.usace.anny.mil/pao/oldriver/oldriver.htm.
United States Army Corps of Engineers. 2002b. Water discharge and sediment flux data
for the Atchafalaya River at Morgan City, Louisiana, and Simmesport, Louisiana. http://www.mvn.usace.army.mil/eng/edhd/watercon.htm.
United States Geological Survey. 1990. EROS [Earth Resources Observation Systems]
Data Center, Sioux Falls, South Dakota. United States Geological Survey. 2001. Declassified Corona satellite images, purchased
through EROS [Earth Resources Observation Systems] Data Center, Sioux Falls,
South Dakota. United States Naval Oceanographic Office. 1958. American Practical Navigator
(Bowditch), Revised edition, Washington, D. C, H. O. Publication No. 9., p. 1069.
Van de Voorde, N. E. and Dinnel, S. P. 1998. Observed directional wave spectra during a
frontal passage. Journal of Coastal Research 14, 337 - 346. Van Heerden, I. L. and Roberts, H. H. 1980. The Atchafalaya Delta—Louisiana's New
Prograding Coast. Transactions - Gulf Coast Association of Geological Societies 30,
497-506. Van Heerden, L L. and Roberts, H. H. 1988. Facies development of the Atchafalaya
delta, Louisiana: a modem bayhead delta. American Association of Petroleum
Geologists Bulletin 72, 439 - 453. Van Lopik, J. R. 1956. Recent geology and geomorphic history of central coastal
Louisiana. Technical Report 7, Coastal Studies Institute, Louisiana State University,
Baton Rouge. Vann, J. H. 1969. Landforms, vegetation and sea level change along the Guiana coast of
South America. Buffalo Technical Report 3, State University College (SUNY
Buffalo), 128 pages. Velasco, D. W. 2003. Shallow stratigraphy observations using electrical resistivity and
dual-frequency echo sounding methods. M. S. Thesis, Boston College.
365
Vinzon, S. B. and Mehta, A. J. 1998. Mechanism for formation of lutoclines by waves.
Journal of Waterway, Port, Coastal and Ocean Engineering 124, 147- 149.
Walker, N. D. 2001. Tropical storm and hurricane wind effects on water level, salinity, and sediment transport in the river-influenced Atchafalaya-Vermilion Bay system,
Louisiana, U. S. A. Estuaries 24, 498 - 508. Walker, N. D. and Hammack, A. B. 2000. Impacts of winter storms on circulation and
sediment transport: Atchafalaya-Vermilion Bay region, Louisiana, U. S. A. Journal of
Coastal Research 16, 996 - 1010. Walker, R. G. and Harms, J. C. 1971. The "Catskill Delta": a prograding muddy
shoreline in central Pennsylvania. Journal of Geology 79, 381 - 399.
Walker, R. G. and Harms, J. C. 1976. Shorelines of weak tidal activity: Upper Devonian
Catskill Formation, central Pennsylvania. In: Ginsburg, R. N. (ed.) Tidal Deposits.
New York: Springer-Verlag, 103 - 108. Wang, Y. and Aubrey, D. G. 1987. The characteristics of the China coastline. Continental
Shelf Research 7, 329 - 349. Wang, Y. and Ke, X. 1989. Cheniers on the east coastal plain of China. Marine Geology
90,337-343. Wang, Y., Healy, T., and members of the Scientific Committee on Oceanic Research
Working Group No. 106: Augustinus, P., Baba, M., Bao, C, Flemming, B., Fortes,
M., Han, M., Marone, E., Mehta, A., Ke, X., Kirby, R., Kjerfve, B., Schaefer-Novelli, Y. and Wolanski, E. 2002a. Research issues of muddy coasts. In: Healy, T., Wang, Y.
and Healy, J.-A. (eds.) Muddy coasts of the world: processes, deposits, and function.
Elsevier Science, 1 - 8. Wang, Y., Healy, T., and members of the Scientific Committee on Oceanic Research
Working Group No. 106: Augustinus, P., Baba, M., Bao, C, Flemming, B., Fortes, M., Han, M., Marone, E., Mehta, A., Ke, X., Kirby, R., Kjerfve, B., Schaefer-Novelli, Y. and Wolanski, E. 2002b. Definition, properties, and classification of muddy coasts. In: Healy, T., Wang, Y. and Healy, J.-A. (eds.) Muddy coasts of the world: processes,
deposits, and function. Elsevier Science, 9-18. Wang, Y., Zhu, D. and Wu, X. 2002c. Tidal flats and associated muddy coast of China.
In: Healy, T., Wang, Y. and Healy, J.-A. (eds.) Muddy coasts of the world: processes,
deposits, and function. Elsevier Science, 319 - 345. Welch, N. H., Allen, P. B. and Galindo, D. J. 1979. Particle-size analysis by pipette and
SediGraph. Journal of Environmental Quality 8, 543 - 546.
366
Wells, J. T. and Coleman, J. M. 1981a. Physical processes and fine-grained sediment
dynamics, coast of Surinam, South America. Journal of Sedimentary Petrology 51,
1053-1068. Wells, J. T. and Coleman, J. M. 1981b. Periodic mudflat progradation, northeastern coast
of South America: a hypothesis. Journal of Sedimentary Petrology 5\, 1069 - 1075.
Wells, J. T. and Kemp, G. P., 1981. Atchafalaya mud stream and recent mudflat
progradation: Lousiana chenier plain. Transactions - Gulf Coast Association of
Geological Societies 31, 39 - 46. Wells, J. T. and Roberts, H. H. 1981. Fluid mud dynamics and shoreline stabilization:
Louisiana chenier plain. Proceedings of the Coastal Engineering Conference 17, 1382
-1401. Wells, J. T. 1983. Dynamics of coastal fluid muds in low-, moderate-, and high-tide range
environments. Canadian Journal of Fisheries and Aquatic Science 40, 130 - 132. Wells, J. T., Chinburg, S. J. and Coleman, J. M. 1984. The Atchafalaya River delta.
Report 4: Generic analysis of delta development. Vicksburg, MS: US Army Corps of
Engineers, Technical Report HL 82-15. Wells, J. T., Park, Y. A. and Choi, J. H. 1985. Storm-induced fine-sediment transport,
west coast of South Korea. Geo-Marine Letters 4, 177 - 180. Wells, J. T. 1988. Distribution of suspended sediment in the Korea Strait and
Southeastern Yellow Sea: onset of Winter monsoons. Marine Geology 83, 272-284.
Wells, J. T., Adams, C. E., Park, Y. A. and Frankenberg, E. W. 1990. Morphology, sedimentology, and tidal channel processes on a high-tide-range mudflat, west coast
of Korea. Marine Geology 95, 111 - 130. Westphal, K. A., Matteson, W. H. and McBride, R. A., 1991. Historical shoreline change
in the northern Gulf of Mexico. Louisiana Geological Survey: Coastal Erosion
Subcommittee of the U. S. Environmental Protection Agency, Gulf of Mexico
Program. Wheatcroft, R. A. 1990. Preservation potential of sedimentary event layers. Geology 18,
843 - 845. Whitehouse, R. J. S., Bassoullet, P., Dyer, K. R., Mitchener, H. J. and Roberts, W. 2000.
The influence of bedforms on flow and sediment transport over intertidal mudflats.
Continental Shelf Research 20, 1099 - 1124. Widdows, J., Brown, S., Brinsley, M. D., Salkeld, P. N. and Elliott, M. 2000. Temporal
changes in intertidal sediment erodability: influence of biological and climatic
factors. Continental Shelf Research 20, 1275 - 1289.
367
Williams, S. J., (ed). 1994. Processes of coastal wetlands loss in Louisiana. Reston,
Virginia: U.S. Geological Survey Open File Report, OFR-94-0275.
Winterwerp, J. C. and Kranenburg, C. (eds.) 2002. Fine Sediment Dynamics in the
Marine Environment. Amsterdam: Elsevier Press, 713 pages.
Wolanski, E., Spagnol, S. and Lim, E. B. 2002. Fine sediment dynamics in the mangrove-
fringed, muddy coastal zone. In: Healy, T., Wang, Y. and Healy, J.-A. (eds.) Muddy
coasts of the world: processes, deposits, and function. Elsevier Science, 279 - 292.
Woodroffe, C. D., Curtis, R. J. and McLean, R. F. 1983. Development of a chenier plain.
Firth of Thames, New Zealand. Marine Geology 53, 1 - 22. Woodrow, D. L. 1985. Paleogeography, paleoclimate, and sedimentary processes of the
Late Devonian Catskill Delta. In: Woodrow, D. L. and Sevon, W. D. (eds.) The
Catskill Delta. Geological Society of America Special Paper 201, 51 - 63. Wright, L. D., Swaye, F. J. and Coleman, J. M. 1970. Effects of Hurricane Camille on the
landscape of the Breton-Chandeleur island chain and the eastern portion of the lower Mississippi delta. Louisiana State University Coastal Studies Bulletin (February
1970), 13-32. Wright, L. D. and Coleman, J. M. 1973. Geomorphic coast variability, northwestern
Australia. Coastal Studies Bulletin 7, 35 - 64. Wright, L. D. and Short, A. 1984. Morphodynamic variability of beaches and surf zones,
a synthesis. Marine Geology 56, 92 - 118. Wright, L. D., Wiseman, W. J. Jr., Yang, Z.-S., Bomhold, B. D., Keller, G. H., Prior, D.
B. and Suhayda, J. N. 1990. Processes of marine dispersal and deposition of suspended silts off the modem mouth of the Huanghe (Yellow River). Continental
Shelf Research 10, 1 -40. Wright, L. D., Boon, J. D., Kim, S. C. and List, J. H. 1991. Modes of cross-shore
sediment transport on the shoreface of the Middle Atlantic Bight. Marine Geology 96,
19-51. Wright, L. D. and Nittrouer, C. A. 1995. Dispersal of river sediments in coastal seas: six
contrasting cases. Estuaries 18, 494 - 508. Xitao, Z. 1986. Development of cheniers in China and their significance to coastline
shift. In: Gardiner, V. (ed.) International Geomorphology. Wiley, London: 1253 -
1268. Xitao, Z. 1989. Cheniers in China: an overview. Marine Geology 90, 311 - 320. Yeo, R. K. and Risk, M. J. 1979. Intertidal catastrophes: effects of storms and hurricanes
on intertidal benthos of the Minas Basin, Bay of Fundy. J. Fish. Res. Board Canada
36, 667 - 669.
368
Young, R. N. and Southard, J. B. 1978. Erosion of fine-grained marine sediments: sea-
floor and laboratory experiments. Geological Society of America Bulletin 89, 663 -
672. Zangger, E. and McCave, I. N. 1990. A redesigned kasten core barrel and sampling
technique. Marine Geology 94, 165 - 171.
369

Document Library
Distribution List for Technical Report Excliange -August 2002
University of California, San Diego SIO Library 0175C 9500 Gilman Drive La Jolla.CA 92093-0175
Hancocl< Library of Biology & Oceanography Alan Hancock Laboratory University of Southern California University Park Los Angeles, CA 90089-0371
Gifts & Exchanges Library Bedford Institute of Oceanography P.O. Box 1006 Dartmouth, NS B2Y 4 A2 CANADA
NOAA/EDIS Miami Library Center 4301 Rickenbacker Causeway Miami, FL 33149
Research Library U.S. Army Corps of Engineers Watenways Experiment Station 3909 Halls Ferry Road Vicksburg, MS 39180-6199
Institute of Geophysics University of Hawaii Library Room 252 2525 Correa Road Honolulu, HI 96822
Marine Resources Information Center Building E38-320 MIT Cambridge, MA 02139
Library Lamont-Doherty Geological Observatory Columbia University Palisades, NY 10964
Library Serials Department Oregon State University Corvallis, OR 97331
Pell Marine Science Library University of Rhode Island Narragansett Bay Campus Narragansett, Rl 02882
Working Collection Texas A&M University Dept. of Oceanography College Station, TX 77843
Fisheries-Oceanography Library 151 Oceanography Teaching BIdg. University of Washington Seattle, WA 98195
Library R.S.M.A.S. University of Miami 4600 Rickenbacker Causeway Miami, FL 33149
Maury Oceanographic Library Naval Oceanographic Office Building 1003 South 1002 Balch Blvd. Stennis Space Center, MS 39522-5001
Library Institute of Ocean Sciences P.O. Box 6000 Sidney, B.C. V8L 4B2 CANADA
National Oceanographic Library Southampton Oceanography Centre European Way Southampton SOI 4 3ZH UK
The Librarian CSIRO Marine Laboratories G.P.O. Box 1538 Hobart, Tasmania AUSTRALIA 7001
Library Proudman Oceanographic Laboratory Bidston Observatory Birkenhead Merseyside L43 7 RA UK
IFREMER Centre de Brest Service Documentation-Publications BP 70 29280 PLOUZANE FRANCE

50272-101
REPORT DOCUMENTATION PAGE
1. REPORT NO.
MIT/WHOI 2003-08 3. Recipient's Accession No.
4. Titie and Subtitle
Fine-Grained Sedimentation on the Chenier Plain Coast and Inner Continental Shelf, Northern Gulf of Mexico
5. Report Date June 2003
7. Author(s) Amy Elizabeth Draut 8. Performing Organization Rept. No.
9. Performing Organization Name and Address
MITAVHOI Joint Program in Oceanography/Applied Ocean Science & Engineering
10. Project/Tasi</Worl< Unit No.
MITAVHOI 2003-08 11. Contract(C) or Grant(G) No.
,c) NOOO14-98-0083 6873-01
(G)
12. Sponsoring Organization Name and Address
Office of Naval Research American Association of Petroleum Geologists Geological Society of America Clare Boothe Luce Foundation
13. Type of Report & Period Covered
Ph.D. Thesis
14.
15. Supplementary Notes
This thesis should be cited as: Amy Elizabeth Draut, 2003. Fine-Grained Sedimentation on the Chenier Plain Coast and Inner Continental Shelf, Northern Gulf of Mexico. Ph.D. Thesis. MITAVHOI, 2003-08.
16. Abstract (Limit: 200 words)
This thesis examines the evolution of a mud-dominated coastal sedimentary system on multiple time scales. Fine-grained systems exhibit different properties and behavior from sandy coasts, and have received relatively little research attention to date. Evidence is presented for shoreline accretion under energetic conditions associated with storms and winter cold fronts. The identification of energetic events as agents of coastal accretion stands in contrast to the traditional assumption that low-energy conditions are required for deposition of fine-grained sediment. Mudflat accretion is proposed to depend upon the presence of an unconsolidated mud sea floor immediately offshore, proximity to a fluvial sediment source, onshore winds, which generate waves that resuspend sediment and advect it shoreward, and a low tidal range.
This study constrains the present influence of the Atchafalaya River on stratigraphic evolution of the inner continental shelf in western Louisiana. Sedimentary and acoustic data are used to identify the western limit of the distal Atchafalaya prodelta and to estimate the proportion of Atchafalaya River sediment that accumulates on the inner shelf seaward of Louisiana's chenier plain coast. The results demonstrate a link between sedimentary facies distribution on the inner shelf and patterns of accretion and shoreline retreat on the chenier plain coast.
17. Document Analysis a. Descriptors
coastal processes sedimentology sediment transport
b. Idenlifiers/Open-Ended Terms
c. COSATI Field/Group
18. Availability Statement
Approved for publication; distribution unlimited.
19. Security Class (Tliis Report)
UNCLASSIFIED 20. Security Class (This Page)
21. No. of Pages
369 22. Price
(SeeANSI-Z39.18) See Instructions on Reverse OPTIONAL FORM 272 (4-77) (Formerly NTIS-35) Department of Commerce