IPM module 3
Week 2 – Critical thinking in the form of a critique:
Notes, examples and language
In order to be able to critique a text you have to be sufficiently familiar with the topic. Since
the only topic I am familiar with in sufficient depth is mathematics I will show two examples
texts, one based on mathematics and one based on statistics.
Example 1: Solving a quadratic equation
Question: Find the roots of �� − 2� + 3 = 0.
Solution: Using the quadratic formula we have
� = 2 ± �−2�� − 4�1��3�2 .
Hence � = −3 or � = +1. (providing we have real roots)
Critical thinking (in the form of a critique):
1st half: comparing benefits of using the quadratic formula against factorisation (a general
comment)
Although this formula always works to give the real roots of a quadratic its use can be quite
laborious. A more efficient way in this particular case could have been to factorise by sight.
This would then be taking advantage of the factor theorem of algebra.
2nd half: detail - describes specific problems when using factorisation
Note that, although factorisation always works in theory, in practice we usually want the
coefficients of the quadratic to be simple enough for us to perform the mental arithmetic
required.
Example 2: On mathematics: Finding the max and min of a function using calculus
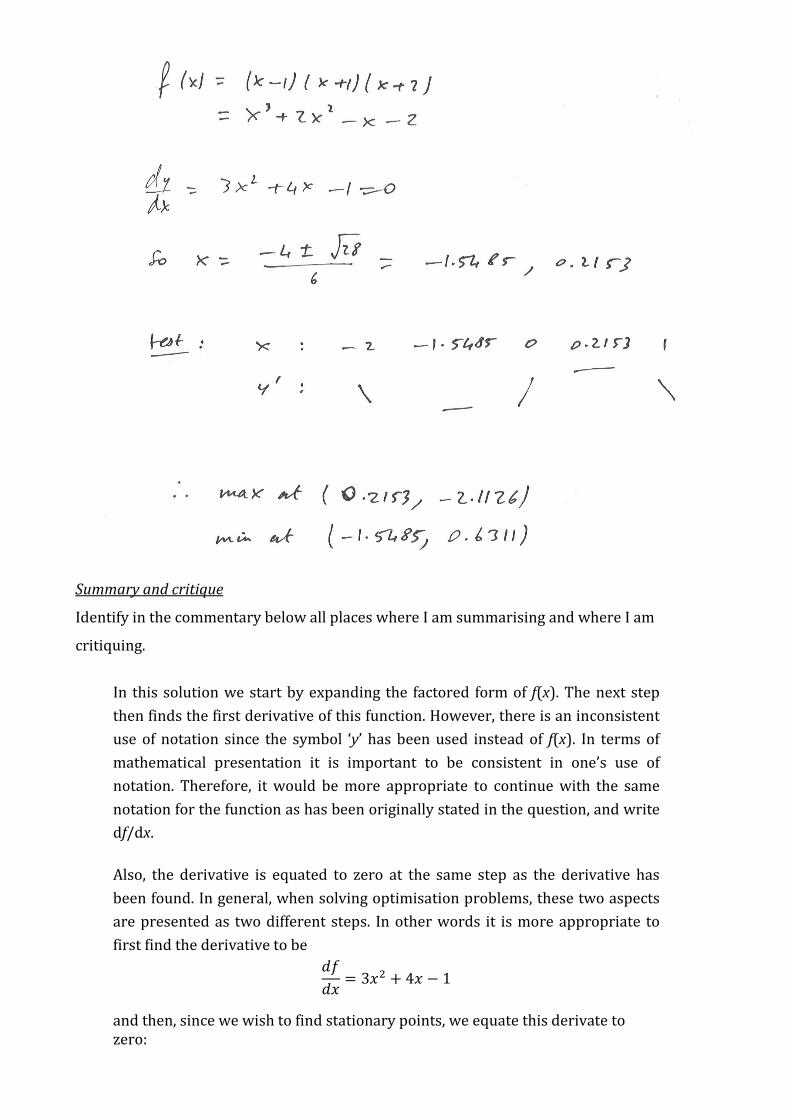
Question: Find and classify all the turning points of the function f(x) = (x – 1)(x + 1)(x + 2).
Solution
Summary and critique
Identify in the commentary below all places where I am summarising and where I am
critiquing.
In this solution we start by expanding the factored form of f(x). The next step
then finds the first derivative of this function. However, there is an inconsistent
use of notation since the symbol ‘y’ has been used instead of f(x). In terms of
mathematical presentation it is important to be consistent in one’s use of
notation. Therefore, it would be more appropriate to continue with the same
notation for the function as has been originally stated in the question, and write
df/dx.
Also, the derivative is equated to zero at the same step as the derivative has
been found. In general, when solving optimisation problems, these two aspects
are presented as two different steps. In other words it is more appropriate to
first find the derivative to be
���� = 3�� + 4� − 1
and then, since we wish to find stationary points, we equate this derivate to
zero:

3�� + 4� − 1 = 0
The next step involves simply solving this quadratic, from which we get the x
ordinate of the stationary points.
After this comes the usual test for classifying stationary points. In this case the
first derivative test has been used, but equally the second derivative test could
have been used. Both tests have their advantages and disadvantages, namely
that the second derivative test can sometimes be quicker, but may fail to give a
valid answer in certain cases. The first derivative test will always work, but can
take longer to apply, particularly if there are many turning point to have to test.
The last two steps of the solution classify the stationary points as well as giving
their coordinates.
There is, however, a missing part to the solution. The question asked for all turning points of
the function, and this solution has only presented three of the turning points (specifically the
three that are called stationary points). It does not present the solution to the other two
turning points which exists on this function, namely the point of inflection which exists
between the maximum point and the minimum point. This is a serious omission in the
presentation of a mathematical solution, and would need to be corrected before it could be
considered a complete solution to the problem.
Example 3: A text on logarithms
The following text is taken from “Making Sense of Logarithms as Counting Divisions”, Christof
Weber, The Mathematics Teacher, Vol. 112, No. 5 (March 2019), pp. 374-380.
“Students’ difficulties understanding the meaning of logarithms could stem in part
from differences between teachers’ and students’ views of them. Effective teaching
does not mean providing only the explanations that make sense for experts, but
also introducing conceptualizations that make sense from the point of view of
learners. This requires not only common mathematical knowledge but also a kind
of mathematical knowledge that is specific to the task of teaching (or specialized
content knowledge; Ball, Hill, and Bass 2005). For the teaching of logarithms, this
means that it is not enough for teachers to know the exponential definition
“log� � = � if and only if �� = �.
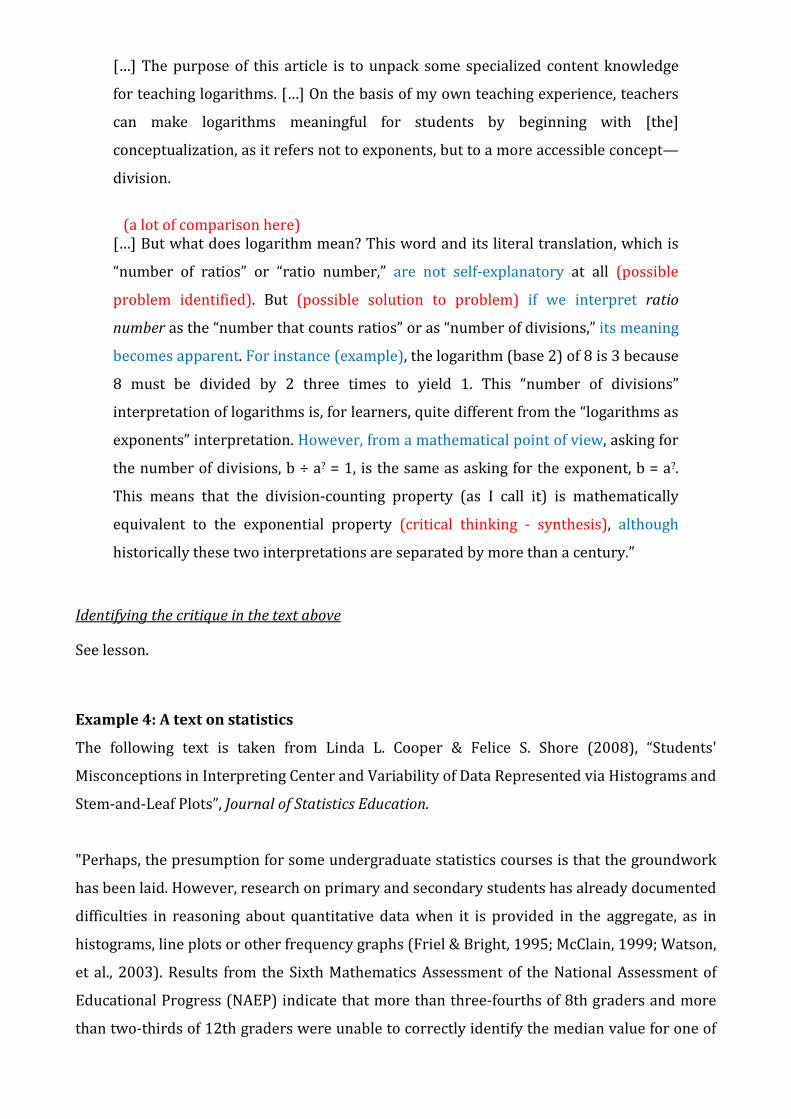
[…] The purpose of this article is to unpack some specialized content knowledge
for teaching logarithms. […] On the basis of my own teaching experience, teachers
can make logarithms meaningful for students by beginning with [the]
conceptualization, as it refers not to exponents, but to a more accessible concept—
division.
(a lot of comparison here)
[…] But what does logarithm mean? This word and its literal translation, which is
“number of ratios” or “ratio number,” are not self-explanatory at all (possible
problem identified). But (possible solution to problem) if we interpret ratio
number as the “number that counts ratios” or as “number of divisions,” its meaning
becomes apparent. For instance (example), the logarithm (base 2) of 8 is 3 because
8 must be divided by 2 three times to yield 1. This “number of divisions”
interpretation of logarithms is, for learners, quite different from the “logarithms as
exponents” interpretation. However, from a mathematical point of view, asking for
the number of divisions, b ÷ a? = 1, is the same as asking for the exponent, b = a?.
This means that the division-counting property (as I call it) is mathematically
equivalent to the exponential property (critical thinking - synthesis), although
historically these two interpretations are separated by more than a century.”
Identifying the critique in the text above
See lesson.
Example 4: A text on statistics
The following text is taken from Linda L. Cooper & Felice S. Shore (2008), “Students'
Misconceptions in Interpreting Center and Variability of Data Represented via Histograms and
Stem-and-Leaf Plots”, Journal of Statistics Education.
"Perhaps, the presumption for some undergraduate statistics courses is that the groundwork
has been laid. However, research on primary and secondary students has already documented
difficulties in reasoning about quantitative data when it is provided in the aggregate, as in
histograms, line plots or other frequency graphs (Friel & Bright, 1995; McClain, 1999; Watson,
et al., 2003). Results from the Sixth Mathematics Assessment of the National Assessment of
Educational Progress (NAEP) indicate that more than three-fourths of 8th graders and more
than two-thirds of 12th graders were unable to correctly identify the median value for one of

the variables shown in a scatter plot (Zawojewski & Heckman, 1997), though the authors
were unable to conclude whether the difficulty stemmed from the graphical representation or
a misunderstanding of median.
[...] Taken together, the existing body of research indicates that students entering college may
have only a superficial understanding of center and variability, and are likely to have
particular difficulty extracting information about those features when data are presented in
graphical form. Our concern is that as students in introductory college courses move beyond
descriptive statistics, collectively little attention from precollege and college courses has been
focused upon making connections between measures of center and variability and graphical
representations."
Identifying the critique in the text above
See lesson.
The language/discourse of critical thinking (/critique)
The examples above on presenting critical thinking (as critiques of the topics) involved
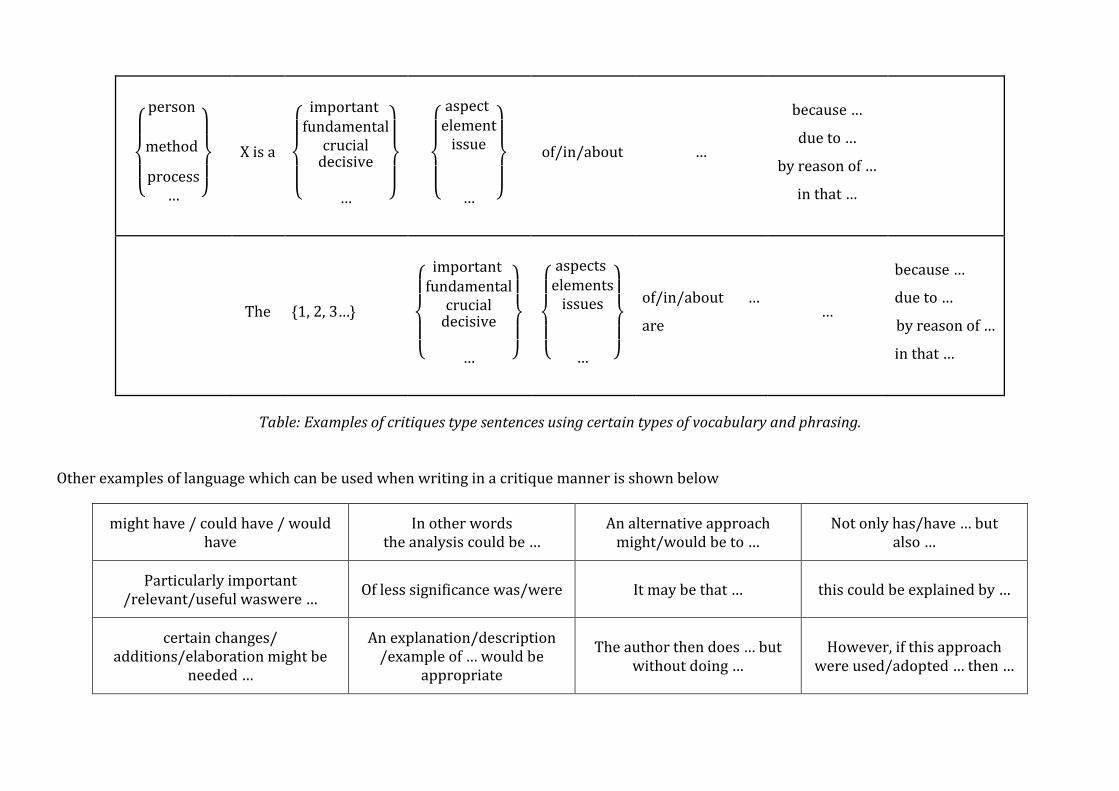
certain types of vocabulary, phrasing and sentence building. The way in which this vocabulary
and phrasing can be built is iluustrated in the table on the next page.
The aim of this table is to show you examples on an underlying principle of what constitutes
critique language and description. This underlying principle is what you should aim to learn
and understand. Then you will know how to write in a critical manner, and you will only need
to learn individual vocabulary, terminology, and phrasing in order to express your own
criticality.
For example, given the following from example 1
• Effective teaching does not mean providing only the explanations that make sense for
experts, but also introducing conceptualizations that make sense from the point of
view of learners.
We can rewrite this as illustrated below whilst retaining the features and essence of a critique
• Beyond using teaching simply to impart the standard meaning of logarithm, it is
important to support learners in developing their own understanding of the concept of
logarithms,
or
• An important element in learning about logarithms is the way in which learners make
sense of this in their own way. This is something which is not considered in the
standard way of teaching logarithms whereby only the expert definition is given.
Similarly, given the following from example 2
• However, research on primary and secondary students has already documented
difficulties in reasoning about quantitative data when it is provided in the aggregate, as
in histograms, line plots or other frequency graphs (Friel & Bright, 1995; McClain,
1999; Watson, et al., 2003). Taken together, the existing body of research indicates that
students entering college may have only a superficial understanding of center and
variability, and are likely to have particular difficulty extracting information about
those features when data are presented in graphical form.

We can rewrite this as illustrated below whilst retaining the features and essence of a critique
• Previous assumptions about college students’ understanding of measures of center and
variability have proved incorrect. It has been shown that such students seem to have
little understanding of these statistics. As a result, they have difficulty identifying such
measures when data are presented in graphical form. Specific research by Friel &
Bright, 1995; McClain, 1999; and Watson, et al., 2003 has found that primary and
secondary students have difficulties in reasoning about quantitative data when such
data is presented in aggregate form, as in histograms, line plots or other frequency
graphs.
or
• The ability to understand measures of center and variability can be seen in the way
students recognise, or not, such features in data presented in aggregate form, as in
histograms, line plots or other frequency graphs. However, the assumption that
students enter college with an adequate understanding of these features has been
shown not to be the case. For example, research by Friel & Bright, 1995; McClain, 1999;
and Watson, et al., 2003 has found that primary and secondary students have
difficulties in reasoning about measures of center and variability.
Below is a random critique using key vocabulary and phrasing in order to illustrate the
critique-ness of the critique below. Bear in mind that the example below is extreme, but it is
designed to highlight the nature of critique-ness:
This method is sufficiently inaccurate as to be flawed and unsuccessful because of
its limited use in the relatively narrow domain, and its irrelevant use of an
unscientific model.
⎩⎪⎨⎪⎧
person
method
process… ⎭⎪⎬⎪⎫
X is a
⎩⎪⎨⎪⎧
important
fundamental
crucialdecisive
… ⎭⎪⎬⎪⎫
⎩⎪⎨⎪⎧
aspect
element
issue
… ⎭⎪⎬⎪⎫
of/in/about …
because …
due to …
by reason of …
in that …
The {1, 2, 3…}
⎩⎪⎨⎪⎧
important
fundamental
crucialdecisive
… ⎭⎪⎬⎪⎫
⎩⎪⎨⎪⎧
aspects
elements
issues
… ⎭⎪⎬⎪⎫
of/in/about …
are …
because …
due to …
by reason of …
in that …
Table: Examples of critiques type sentences using certain types of vocabulary and phrasing.
Other examples of language which can be used when writing in a critique manner is shown below
might have / could have / would
have
In other words
the analysis could be …
An alternative approach
might/would be to …
Not only has/have … but
also …
Particularly important
/relevant/useful waswere … Of less significance was/were It may be that … this could be explained by …
certain changes/
additions/elaboration might be
needed …
An explanation/description
/example of … would be
appropriate
The author then does … but
without doing …
However, if this approach
were used/adopted … then …
There are many resources for helping you learn to write academic and technical English.
Some of these can be found at
• http://www.opentextbooks.org.hk/zh-hant/ditatopic/4220
• http://www.phrasebank.manchester.ac.uk/
• https://www.ref-n-write.com/trial/academic-phrasebank/
• www.springer.com › document › Free+Download+-+Useful+Phrases
• nnkt.ueh.edu.vn › uploads › 2019/06 › Academiv-Phrase-Bank
but be careful about how you use these in order not to end up plagiarising.
Some criteria for developing a critical thinking (/critique)
Apart from the aspects of critique used in example 1 and example 2 above, other aspects
include:
• Comparing and contrasting: Look for similarities and differences between what
different authors have said or done.
Examples
1) Between the logarithm function and the exponential function, the most common
approach is to define the logarithm first (as an integral) and then define the
expoential as the inverse of the logarithm. However, such an approach requires
the student to first learn calculus before they can use these two functions, thus
leaving the use of these function quite late in the student’s learning.
On the other hand the exponential function can be introduced after the binomial
theorem, which is part of algebra, and comes much earlier in the student’s
learning.
2) Although both the mean and the median are both aimed at finding the average
vakue of the data, a major difference can be observed between the two
measures, namely that the former is sensitive to outliers whereas the latter is
not.”
There are two points to note here:
i) firstly, note the language of “similarity and difference”.

ii) secondly, look for synonyms and antonyms of such language (see the sources
you have been told about in other classes, as well as a thesaurus, as well as
online phrasebanks)
• Commenting on the methodology used: How has the author collected the data? How
have they analysed the data? What methods are they using to analyse the data?
Examples
1) Descriptive statistics can only be used to categorise and summarise the data collected.
It cannot be used to infer or generalise anything about the larger set of data from
which your data comes from. However, descriptive statistics does allows us to see an
overall pattern or trend (such as by the use of graphs).
2) Inferential statistics allows us to make generalisations and inference. In this way we
can take a sample, study it and reasonably extrapolate or infer the behaviour of the
population from which the sample came. There is, however, a disadvantage to
inferential statistics in that the analyses and results are never accurate. There will
always be errors in the final results, and the conclusions based on these results will
only be approximate.
• Identifying flaws or weaknesses and strengths and positive: Look for problems,
limitations, assumptions, etc in theories, arguments, methods, practice, etc.
Examples
1) “In his use of the mean Smith (1990) has failed to take into account the aspect of
outliers in his data. As a result of this his calculation for the mean is not as
representative of the middle as it could be. One way of overcoming this flaw
could be to …”
2) “However, Jones (1995) does not assess the effect of ignoring the outliers in his
data when calculating the line of best fit.”
3) “The use of the z-test on this data has the limitation that it can only be applied
to data which is (approximately) normally distributed.”

• Offer constructive suggestions: Offer suggestion for correction, improvements, etc.
Examples
1) “A much more accurate trend curve could have been developed if the author
had used an exponential fit instead of the linear fit to his data.”
2) “It would have been useful for the author to calculate two lines of best fit: one
containing the outlying data, and one ignoring the outlying data. In this way a
comparison could have been made between the two best-fit lines in order to …”
3) “Given that the data used is skewed, a more appropriate test would have been
the chi-squared test. This would then have allowed ...”
These are only four aspects of what can be considered for a critique. By reading widely you
will come to see other aspect which can be considered.
So how can critical thinking (/critique) be defined?
At its simplest level, a critique is an opinion about the author’s work. But it is not just any
opinion. It is a form of opinion which is a reflective and detailed evaluation or assessment of
the significance, assumptions, flaws, etc. of the author’s work. A critique therefore requires a
particular way of thinking. By looking at as many examples as possible we can come to see a
critique as:
• asking about links between ideas,
• asking about the importance and relevance of arguments and ideas,
• asking whether or not things could have been improved, changed, done differently,
etc…,
• asking whether or not any limitations or assumptions or hypotheses or inferences
were made,
• asking about any consequences, side effects or unseen reactions as a result of the work
done by the auhor,
• asking about errors, inconsistencies, conflicting evidence, gaps, etc. in the research,
• asking about the strengths and/or weaknesses in the research,
• … in other words, asking questions of the work (literature review, data collection and
analysis, results, discussion, conclusions) done by the author;

Finally, a critique (as a form of critical thinking) is seen to be a critique by the use of a
particular type of vocabulary (nouns, adjectives, synonyms, etc.), constructed via phrasing and
sentences and paragraphs in a particular way.
So we might say that
Critique = critique language (vocabulary and phrasing)
+ a close, reflective reading of the text
in order to identify what could be done differently
based on what was already done, how it was done, why it was done.
What can we critique?
Anything can be critiqued:
• The literature;
• Someone’s interpretation of the literature;
• The design of the experiment;
• The data collection methods;
• The analysis of the data;
• The theoretical framework/model/methodology used;
• Any assumptions made;
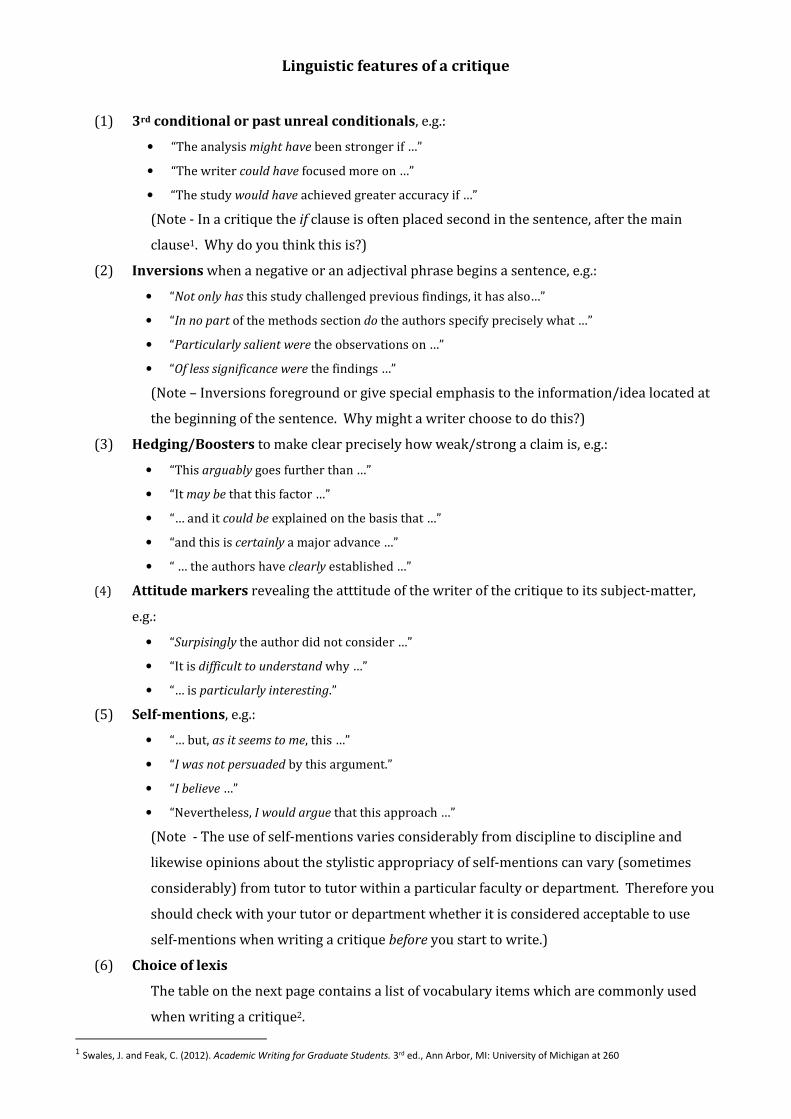
Linguistic features of a critique
(1) 3rd conditional or past unreal conditionals, e.g.:
• “The analysis might have been stronger if …”
• “The writer could have focused more on …”
• “The study would have achieved greater accuracy if …”
(Note - In a critique the if clause is often placed second in the sentence, after the main
clause1. Why do you think this is?)
(2) Inversions when a negative or an adjectival phrase begins a sentence, e.g.:
• “Not only has this study challenged previous findings, it has also…”
• “In no part of the methods section do the authors specify precisely what …”
• “Particularly salient were the observations on …”
• “Of less significance were the findings …”
(Note – Inversions foreground or give special emphasis to the information/idea located at
the beginning of the sentence. Why might a writer choose to do this?)
(3) Hedging/Boosters to make clear precisely how weak/strong a claim is, e.g.:
• “This arguably goes further than …”
• “It may be that this factor …”
• “… and it could be explained on the basis that …”
• “and this is certainly a major advance …”
• “ … the authors have clearly established …”
(4) Attitude markers revealing the atttitude of the writer of the critique to its subject-matter,
e.g.:
• “Surpisingly the author did not consider …”
• “It is difficult to understand why …”
• “… is particularly interesting.”
(5) Self-mentions, e.g.:
• “… but, as it seems to me, this …”
• “I was not persuaded by this argument.”
• “I believe …”
• “Nevertheless, I would argue that this approach …”
(Note - The use of self-mentions varies considerably from discipline to discipline and
likewise opinions about the stylistic appropriacy of self-mentions can vary (sometimes
considerably) from tutor to tutor within a particular faculty or department. Therefore you
should check with your tutor or department whether it is considered acceptable to use
self-mentions when writing a critique before you start to write.)
(6) Choice of lexis
The table on the next page contains a list of vocabulary items which are commonly used
when writing a critique2.
1 Swales, J. and Feak, C. (2012). Academic Writing for Graduate Students. 3rd ed., Ann Arbor, MI: University of Michigan at 260
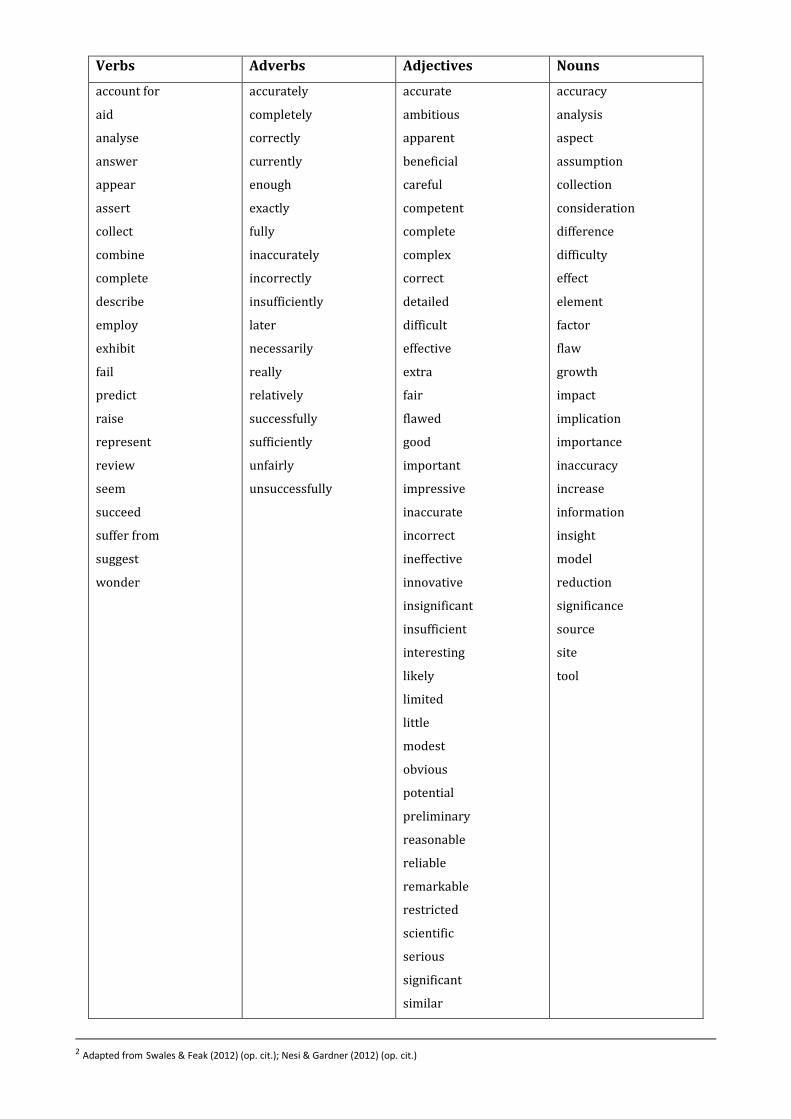
Verbs Adverbs Adjectives Nouns
account for
aid
analyse
answer
appear
assert
collect
combine
complete
describe
employ
exhibit
fail
predict
raise
represent
review
seem
succeed
suffer from
suggest
wonder
accurately
completely
correctly
currently
enough
exactly
fully
inaccurately
incorrectly
insufficiently
later
necessarily
really
relatively
successfully
sufficiently
unfairly
unsuccessfully
accurate
ambitious
apparent
beneficial
careful
competent
complete
complex
correct
detailed
difficult
effective
extra
fair
flawed
good
important
impressive
inaccurate
incorrect
ineffective
innovative
insignificant
insufficient
interesting
likely
limited
little
modest
obvious
potential
preliminary
reasonable
reliable
remarkable
restricted
scientific
serious
significant
similar
accuracy
analysis
aspect
assumption
collection
consideration
difference
difficulty
effect
element
factor
flaw
growth
impact
implication
importance
inaccuracy
increase
information
insight
model
reduction
significance
source
site
tool
2 Adapted from Swales & Feak (2012) (op. cit.); Nesi & Gardner (2012) (op. cit.)

Verbs Adverbs Adjectives Nouns
simple
small
successful
sufficient
suitable
unfair
unimportant
unlikely
unreasonable
unreliable
unsatisfactory
unscientific
unsuccessful
unusual
useful
==================================================
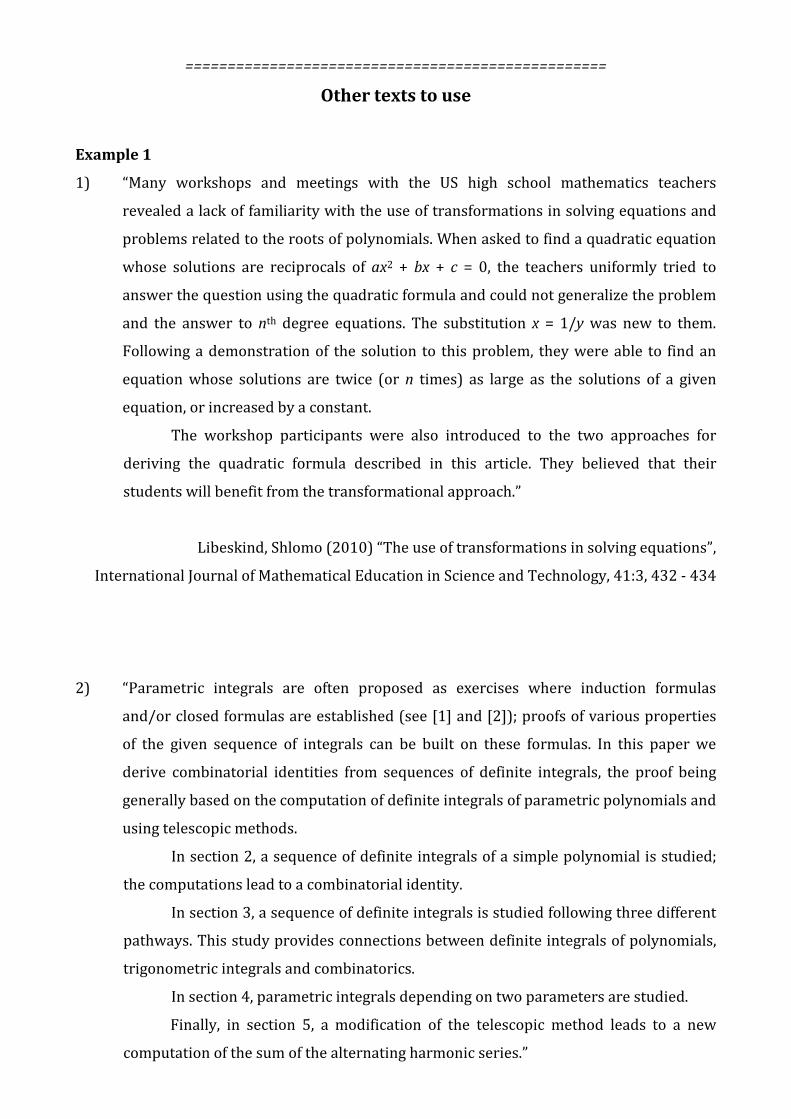
Other texts to use
Example 1
1) “Many workshops and meetings with the US high school mathematics teachers
revealed a lack of familiarity with the use of transformations in solving equations and
problems related to the roots of polynomials. When asked to find a quadratic equation
whose solutions are reciprocals of ax2 + bx + c = 0, the teachers uniformly tried to
answer the question using the quadratic formula and could not generalize the problem
and the answer to nth degree equations. The substitution x = 1/y was new to them.
Following a demonstration of the solution to this problem, they were able to find an
equation whose solutions are twice (or n times) as large as the solutions of a given
equation, or increased by a constant.
The workshop participants were also introduced to the two approaches for
deriving the quadratic formula described in this article. They believed that their
students will benefit from the transformational approach.”
Libeskind, Shlomo (2010) “The use of transformations in solving equations”,
International Journal of Mathematical Education in Science and Technology, 41:3, 432 - 434
2) “Parametric integrals are often proposed as exercises where induction formulas
and/or closed formulas are established (see [1] and [2]); proofs of various properties
of the given sequence of integrals can be built on these formulas. In this paper we
derive combinatorial identities from sequences of definite integrals, the proof being
generally based on the computation of definite integrals of parametric polynomials and
using telescopic methods.
In section 2, a sequence of definite integrals of a simple polynomial is studied;
the computations lead to a combinatorial identity.
In section 3, a sequence of definite integrals is studied following three different
pathways. This study provides connections between definite integrals of polynomials,
trigonometric integrals and combinatorics.
In section 4, parametric integrals depending on two parameters are studied.
Finally, in section 5, a modification of the telescopic method leads to a new
computation of the sum of the alternating harmonic series.”
Dana-Picard, T.(2007) “Sequences of definite integrals”,
International Journal of Mathematical Education in Science and Technology, 38:3, 393 - 401
3) “In this note we present a method in which we develop an analytic solution for certain
classes of second-order differential equations with variable coefficients. By the use of
transformations and by repeated iterated integration, we obtain a desired solution.
This represents an alternative way to obtain a solution to such methods as classic
power series techniques and other approaches (see, for example, Ince [1], where the
author uses successive approximations). It is, at times, more involved than traditional
methods.”
Wilmer III, A. and Costa, G. B.(2008)
“Solving second-order differential equations with variable coefficients”,
International Journal of Mathematical Education in Science and Technology, 39:2, 238 - 243,
1) Original text
“Many workshops and meetings with the US high school mathematics teachers
revealed a lack of familiarity with the use of transformations in solving equations and
problems related to the roots of polynomials. When asked to find a quadratic equation
whose solutions are reciprocals of ax2 + bx + c = 0, the teachers uniformly tried to
answer the question using the quadratic formula and could not generalize the problem
and the answer to nth degree equations. The substitution x = 1/y was new to them.
Following a demonstration of the solution to this problem, they were able to find an
equation whose solutions are twice (or n times) as large as the solutions of a given
equation, or increased by a constant.[…]”
version 1
“Many meetings with high school mathematics teachers revealed a lack of familiarity
with the use of transformations and problems related to polynomials. When asked to
find a equation whose solutions are reciprocals of ax2 + bx + c = 0, the teachers
uniformly tried to answer the question using the formula and could not generalize the
problem and the answer. Using x = 1/y was new to them. Following a demonstration,
they were able to find an equation whose solutions are twice as large as the solutions
of a given equation, or increased by a constant.[…]”
version 2
“Many workshops and meetings with the US high school mathematics teachers showed
that these teachers were not familiar in solving equations with the use of
transformations. Neither were they familiar with using transformations involving
problems where you have to find roots of polynomials. When asked to find a quadratic
equation ax2 + bx + c = 0 whose solutions are reciprocals of this equation, the teachers
uniformly tried to answer the question using the quadratic formula, and the
generalization to nth degree equations was beyond them. The substitution x = 1/y was
new to them. The solution to this problem was demonstrated to them, after which they
were able to find an equation whose solutions are twice (or n times) as large as the
solutions of a given equation, or increased by a constant.[…]”
Version 3
“Many workshops and meetings with the US high school mathematics teachers
revealed a lack of familiarity with the use of a technique which allows them to simplify
difficult equations into simpler ones, specifically when it comes to finding values of x
which makes those equations equal to zero. When asked to find an equation of degree
2 whose solutions are reciprocals of that equation, the teachers uniformly tried to
answer the question using the formula for finding the roots of a quadratic equation,
and could not generalize the problem and the answer to equations of degree n. The
substitution x = 1/y was new to them. Following a demonstration of the solution to this
problem, they were able to find an equation where the roots are twice (or n times) as
large as the roots of a given equation, or increased by a constant.[…]”
==========================================
Appendix
Example 1: On means, medians and modes in statistics
An example of critique
In analysing the data author A has used the mean as his measure of central tendency,
explaining that the advantage of this is that, because all data values are used in finding the
mean, taking the mean for different samples of a population tends to give similar results. This
indicates that the mean is robust, i.e. it resists very well any fluctuations between different
samples.
However, the problem with using the mean is that it is sensitive to outliers. The further the
outliers(s) the more it will affect the mean, resulting in a value of the mean which is not
representative of the “middle” of majority of the data.
For example, the mean salary from £1200, £1000, £900, £1100, and £4000 is £1640. But it is
clear that £1640 is not representative as an average of the majority of the salaries. And the
reason we have such a high average is due to the single value of £4000. So one single value can
significantly skew the value of the mean away from the most representative average.
It may be that the data the author used had no outliers or was not sensitive to outliers.
However, this is not addressed, nor is any other reason for omitting the problems of the use of
the mean as a measure of central tendency.
In terms of measuring central tendency, author B has used the median. In his paper
author B states that this has the advantage of overcoming the problem caused by outliers
when using the mean. He then goes onto to say that the disadvantage of the using the median
as a measure of central tendency is that, because the median is not calculated arithmetically
(and therefore does not use each data value) it is easily affected by the type of sample we take
from the population.
However, author A mentions “Author B does not elaborate on how or why the use of the
median overcomes the problems caused by the use of the mean”. For example, there is no
explanation of the fact that the reason the median is totally immune to the effect of outliers is
because it is based on finding the value which lies exactly in the middle of the data set, once
this has been arranged into ascending order.
According to author A, the simple example of using the salaries would suffice to illustrate this
point, namely we would firstly arrange these in ascending order to be £900, £1000, £1100,
£1200, £4000, and then we would choose the middle value. In this case the middle value is
£1100, which is much more representative of the general average, and is not affected by the
single high value of £4000.
Furthermore, both papers use only one measure of central tendency when analysing their
data. It seems that their research would have benefited from using both measures as well as
an analysis of the difference between these two measures as used on their respective data
sets. This could then have provided answers to which types of data are more suited to using
the mean and which are more suited to using the median.
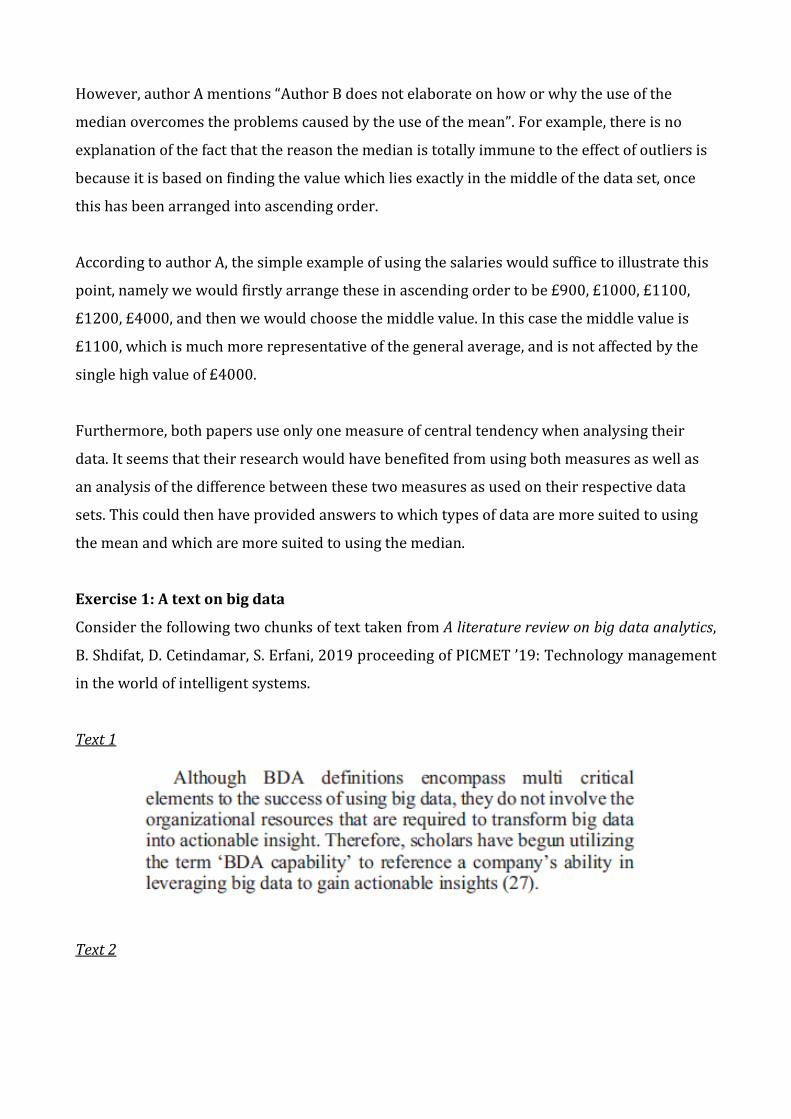
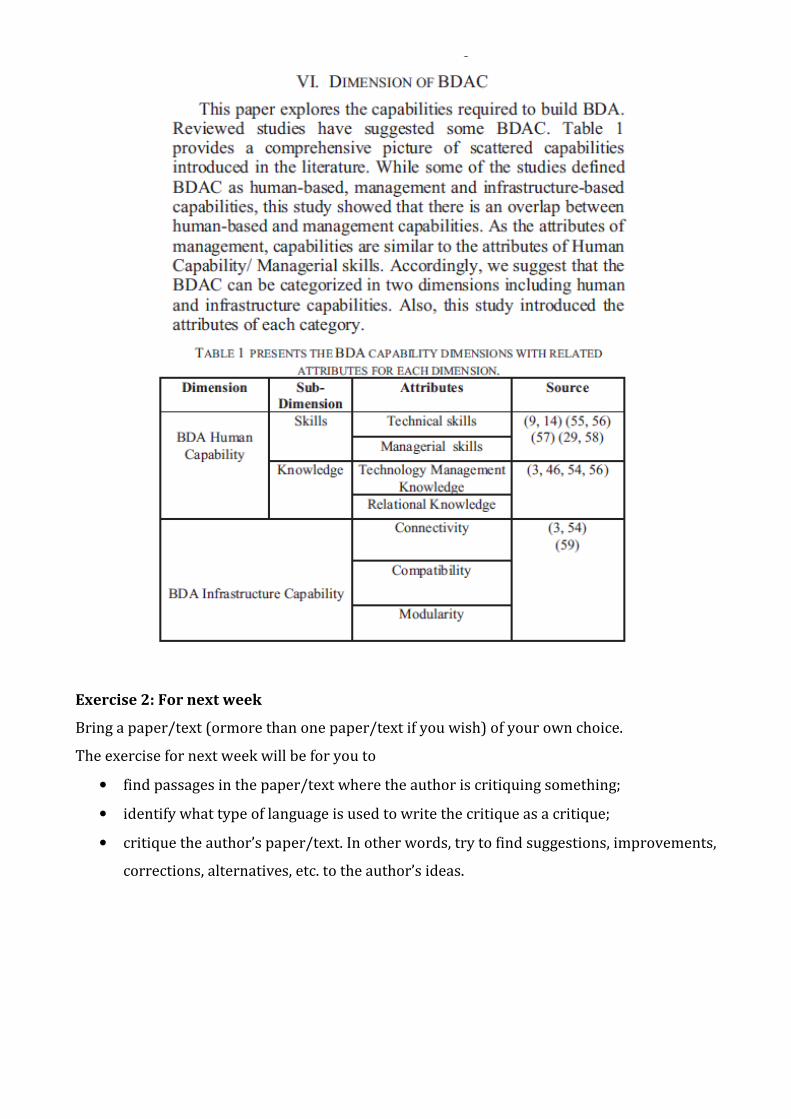
Exercise 1: A text on big data
Consider the following two chunks of text taken from A literature review on big data analytics,
B. Shdifat, D. Cetindamar, S. Erfani, 2019 proceeding of PICMET ’19: Technology management
in the world of intelligent systems.
Text 1
Text 2
Exercise 2: For next week
Bring a paper/text (ormore than one paper/text if you wish) of your own choice.
The exercise for next week will be for you to
• find passages in the paper/text where the author is critiquing something;
• identify what type of language is used to write the critique as a critique;
• critique the author’s paper/text. In other words, try to find suggestions, improvements,
corrections, alternatives, etc. to the author’s ideas.
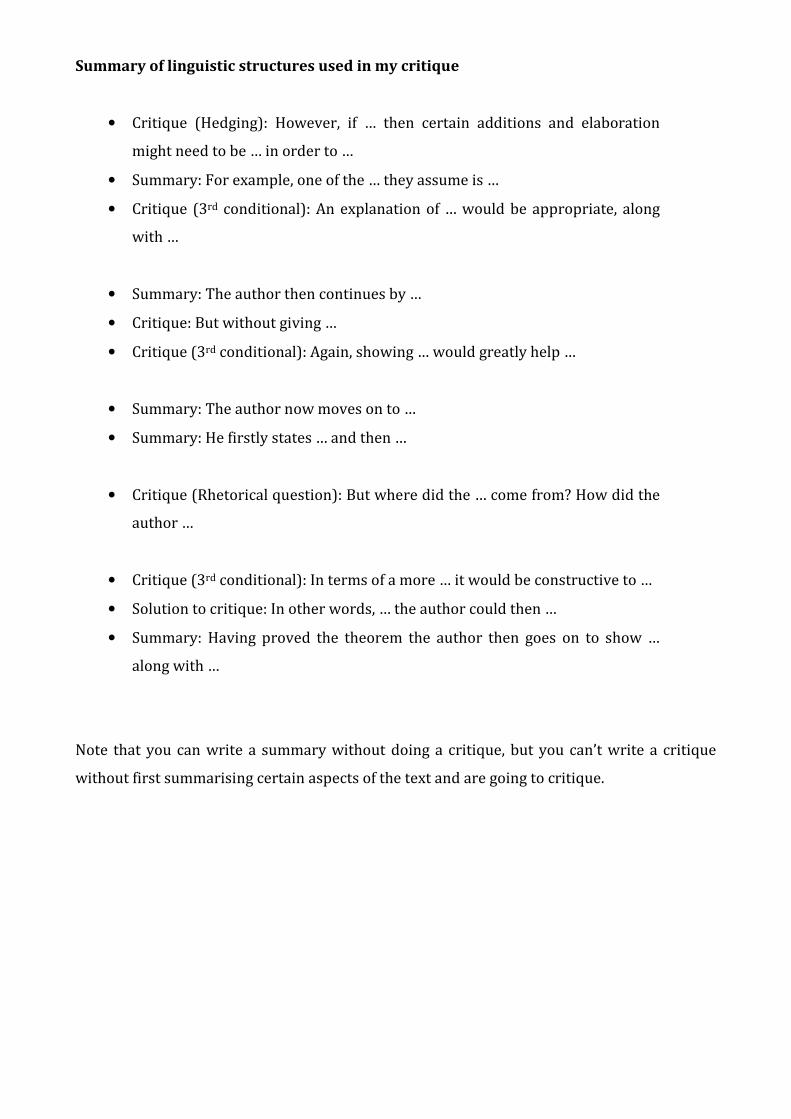
Summary of linguistic structures used in my critique
• Critique (Hedging): However, if … then certain additions and elaboration
might need to be … in order to …
• Summary: For example, one of the … they assume is …
• Critique (3rd conditional): An explanation of … would be appropriate, along
with …
• Summary: The author then continues by …
• Critique: But without giving …
• Critique (3rd conditional): Again, showing … would greatly help …
• Summary: The author now moves on to …
• Summary: He firstly states … and then …
• Critique (Rhetorical question): But where did the … come from? How did the
author …
• Critique (3rd conditional): In terms of a more … it would be constructive to …
• Solution to critique: In other words, … the author could then …
• Summary: Having proved the theorem the author then goes on to show …
along with …
Note that you can write a summary without doing a critique, but you can’t write a critique
without first summarising certain aspects of the text and are going to critique.