


Climate Change 2007: IPCC Fourth Assessment Report
Climate Change is Real
and Here!
Lučka Kajfež Bogataj
University of Ljubljana IPCC WG2 vicechair through AR4

The 21st Century changes
Four distinctive characteristics:
• They are cumulative
• The effects are irreversible
• Large time lags – today’s actions are
tomorrow’s problems
• They are global
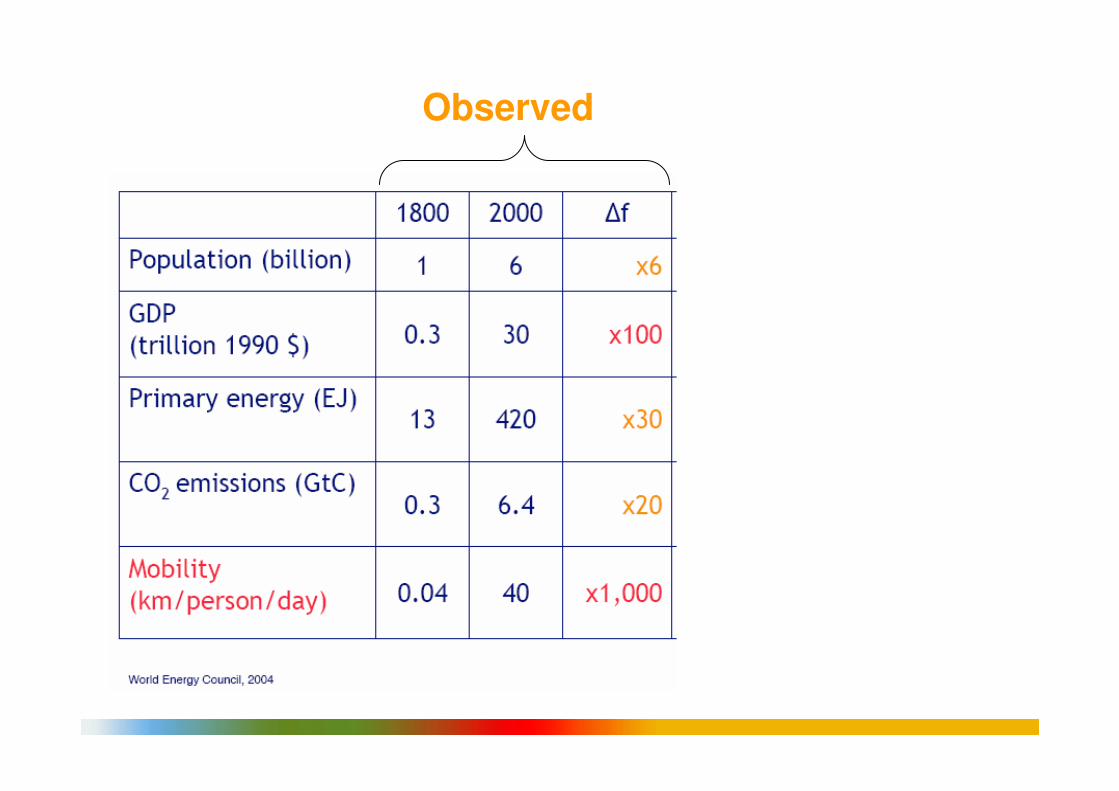
Observed

Raupach et al 2007, PNAS
World
0.5
0.6
0.7
0.8
0.9
1
1.1
1.2
1.3
1.4
1.5
1980 1985 1990 1995 2000 2005
Fac
tor (relative to 199
0)
Emissions
Population
Wealth = per capita GDP
Drivers of Anthropogenic Emissions
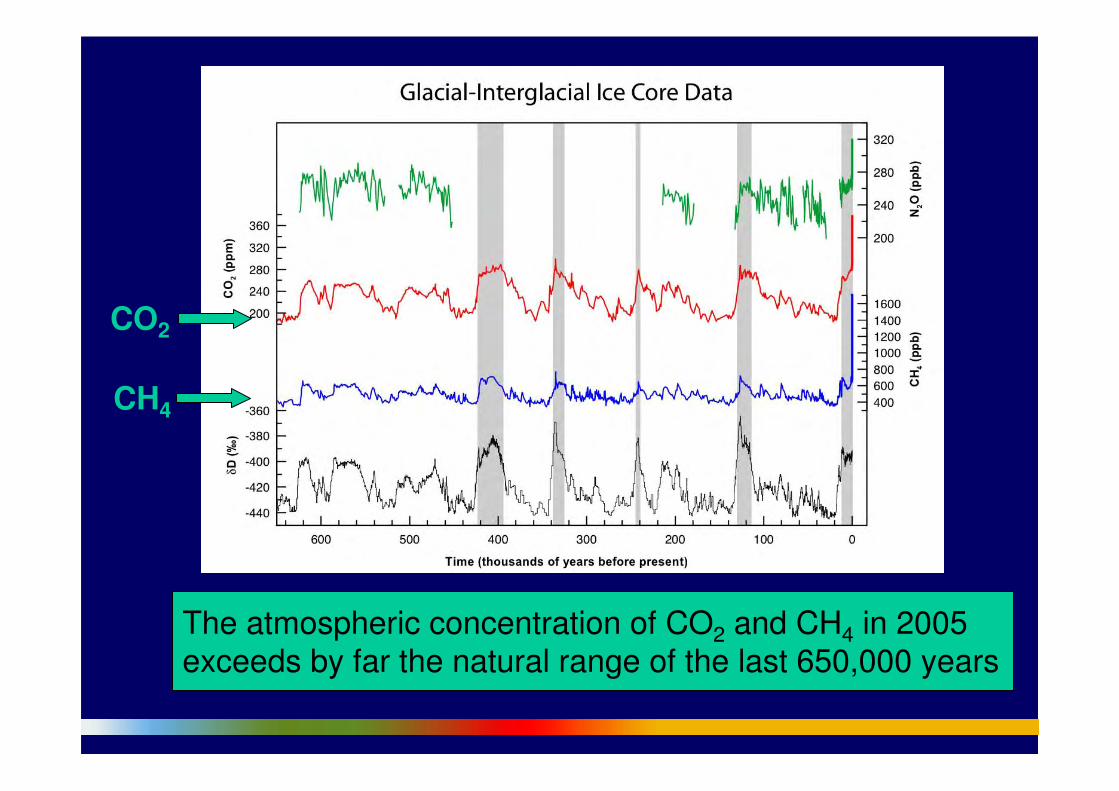
The atmospheric concentration of CO2 and CH4 in 2005 exceeds by far the natural range of the last 650,000 years
CO2
CH4

Direct Observations of Recent Climate Change
Gobal mean
temperature
Global average
sea level
Northern hemisphere
Snow cover
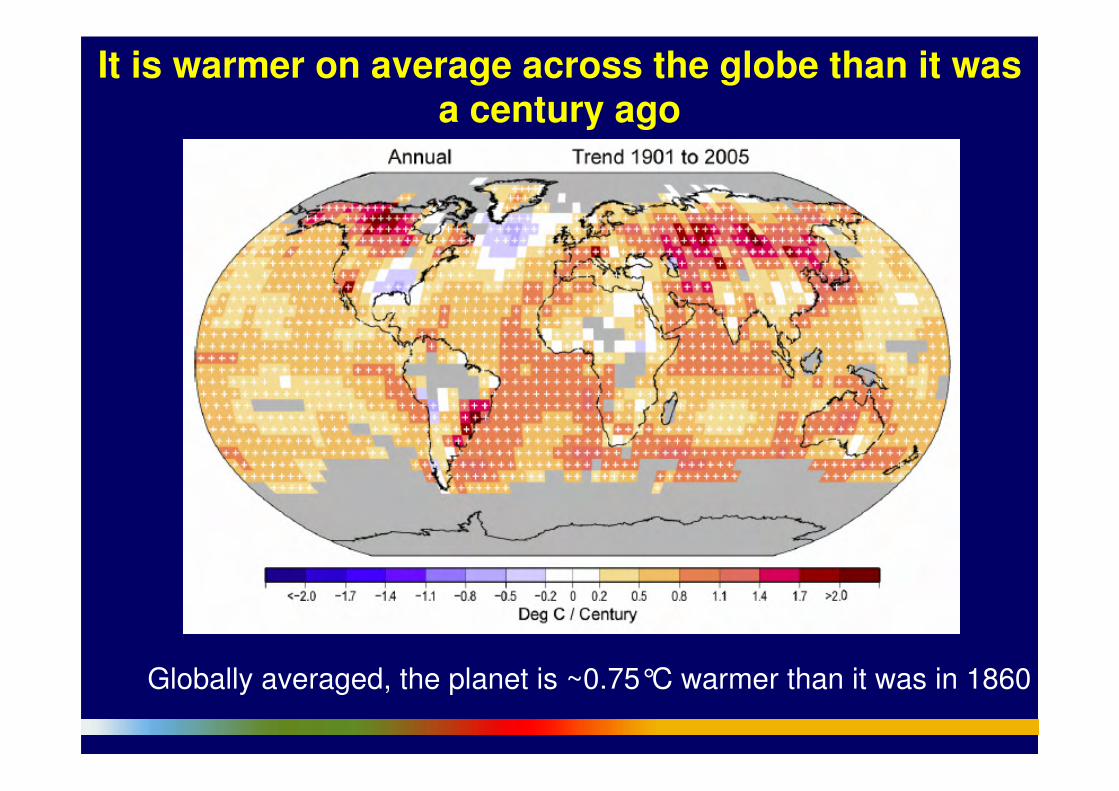
It is warmer on average across the globe than it was a century ago
Globally averaged, the planet is ~0.75°C warmer than it was in 1860
8
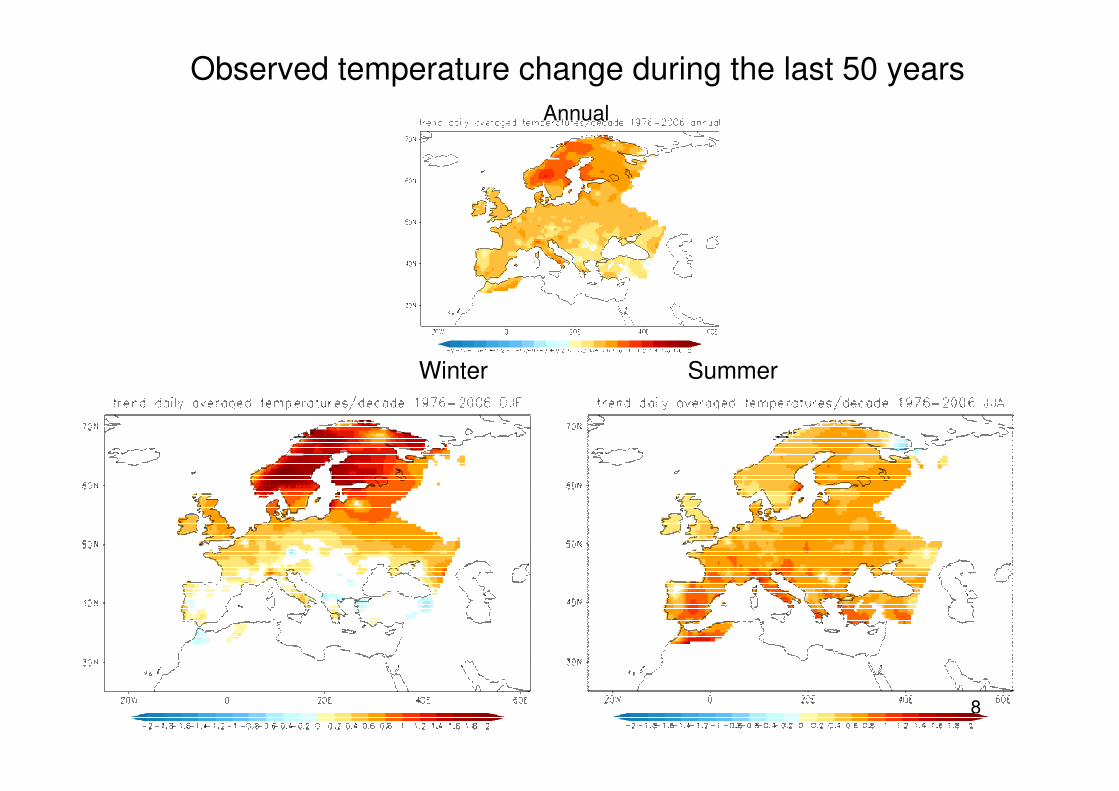
Observed temperature change during the last 50 years
Annual
Winter Summer
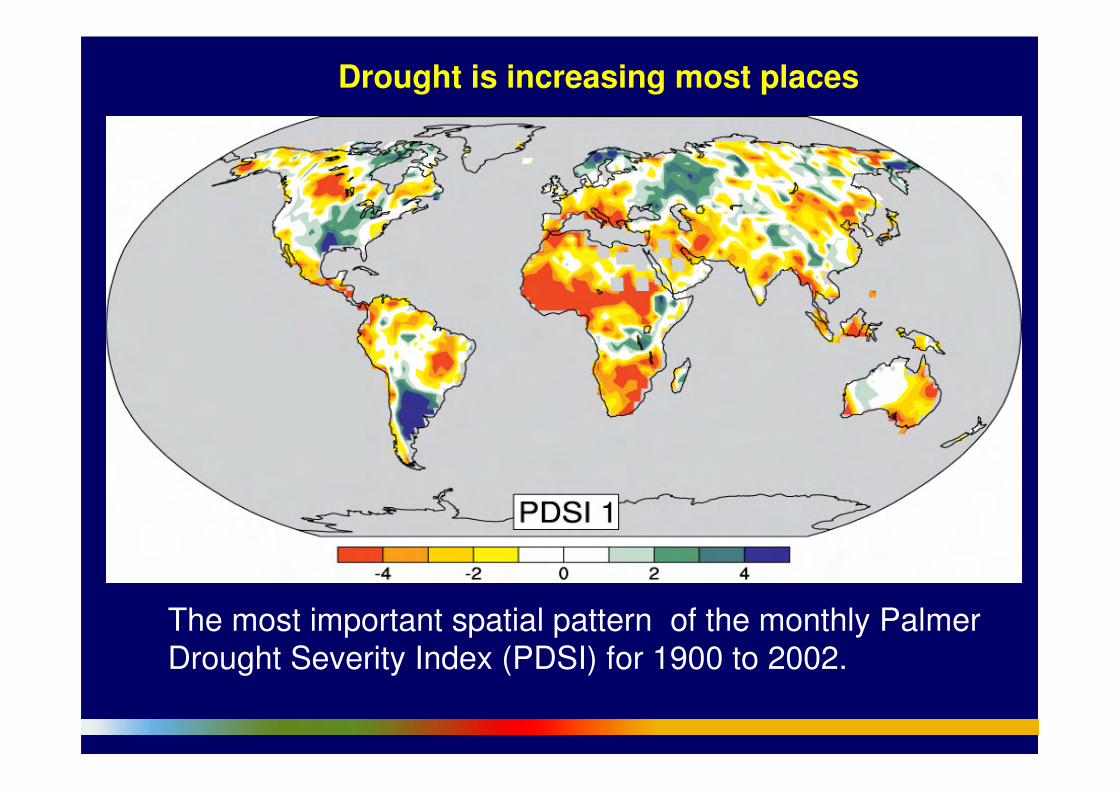
The most important spatial pattern of the monthly Palmer Drought Severity Index (PDSI) for 1900 to 2002.
Drought is increasing most places
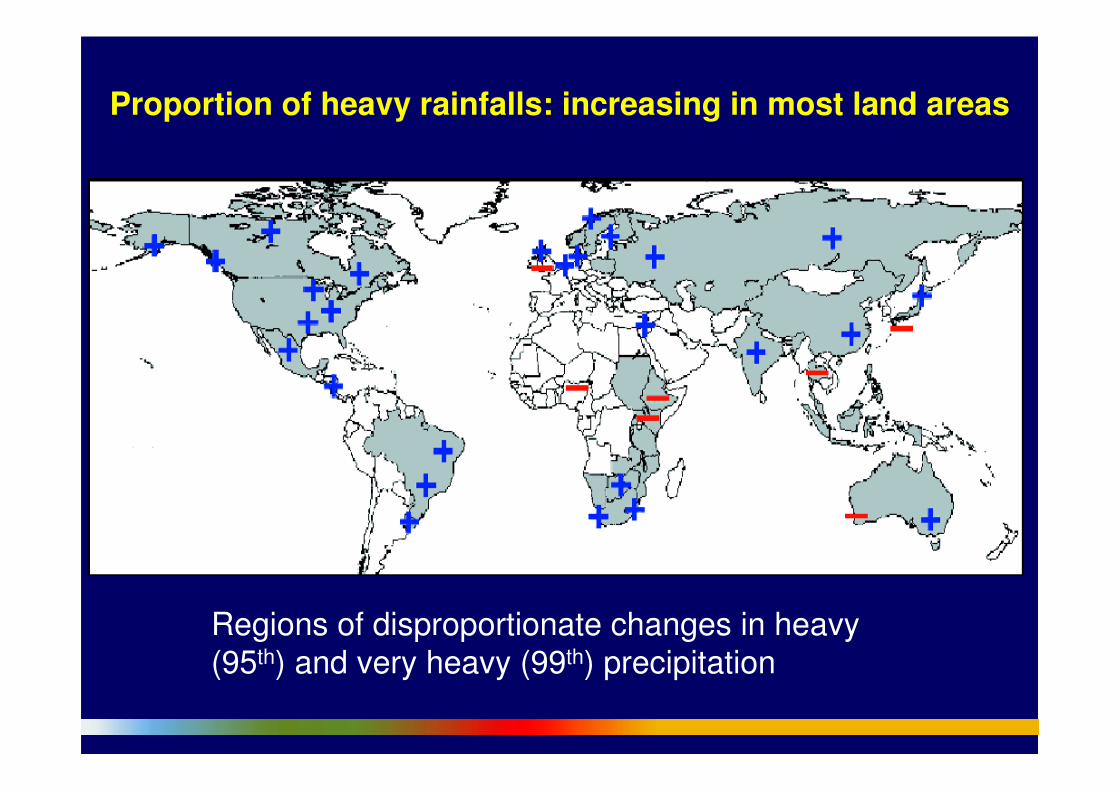
Regions of disproportionate changes in heavy (95th) and very heavy (99th) precipitation
Proportion of heavy rainfalls: increasing in most land areas
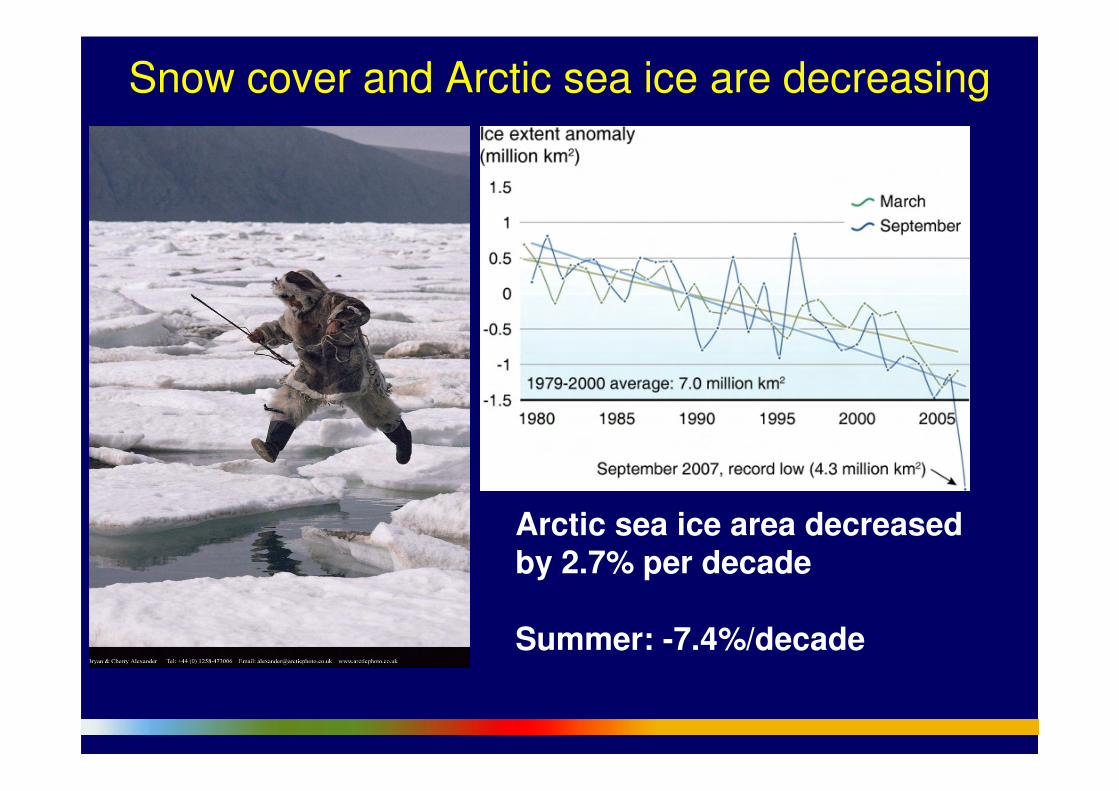
Snow cover and Arctic sea ice are decreasing
Arctic sea ice area decreased by 2.7% per decade
Summer: -7.4%/decade
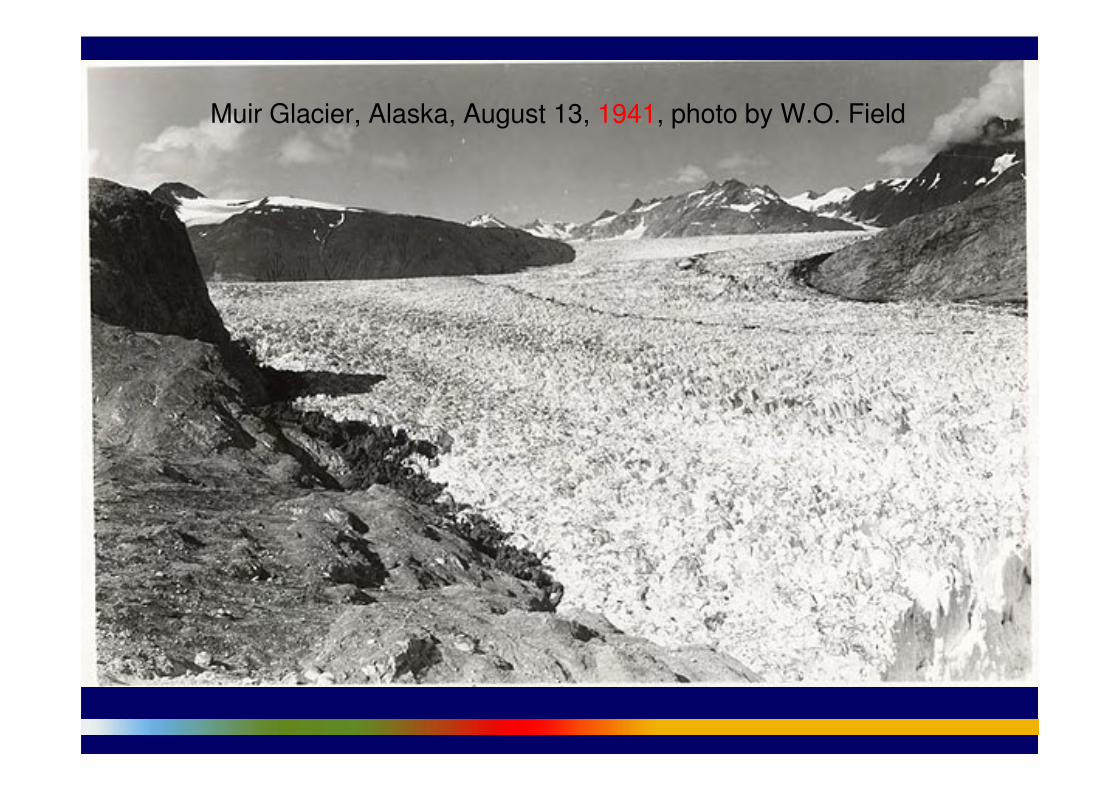
Muir Glacier, Alaska, August 13, 1941, photo by W.O. Field

Muir Glacier, Alaska, August 31, 2004, photo by B.F. Molnia
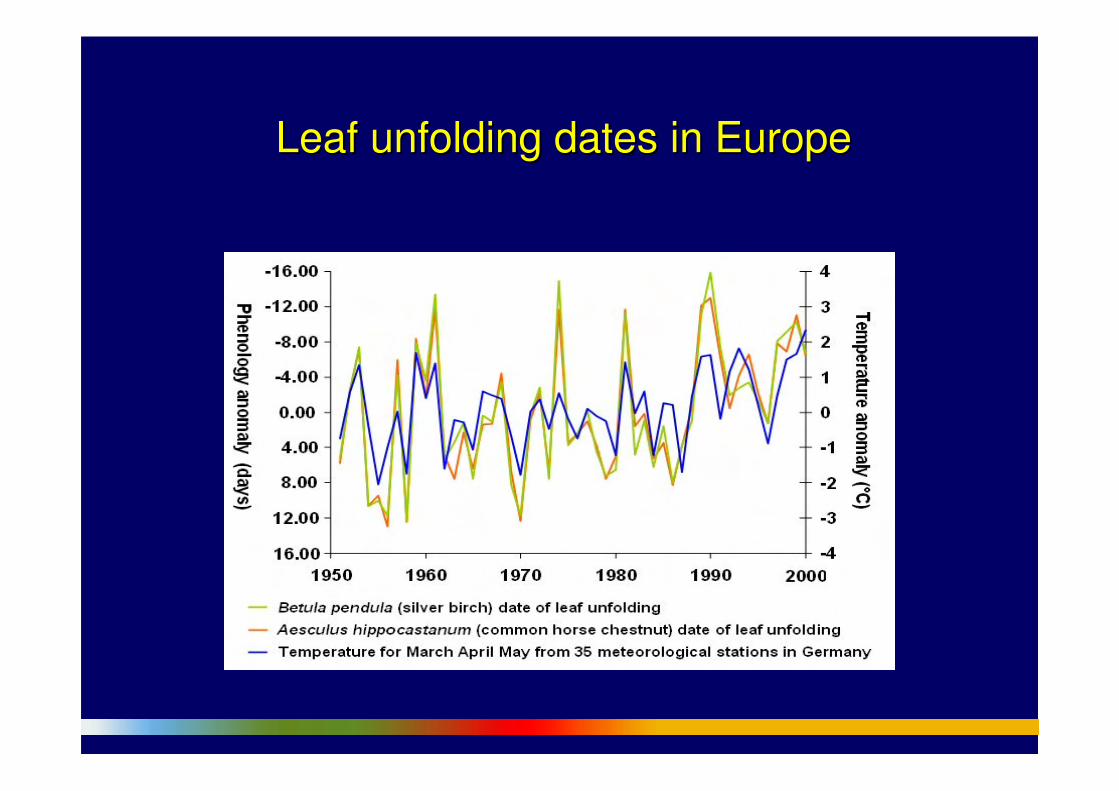
Leaf unfolding dates in EuropeLeaf unfolding dates in Europe
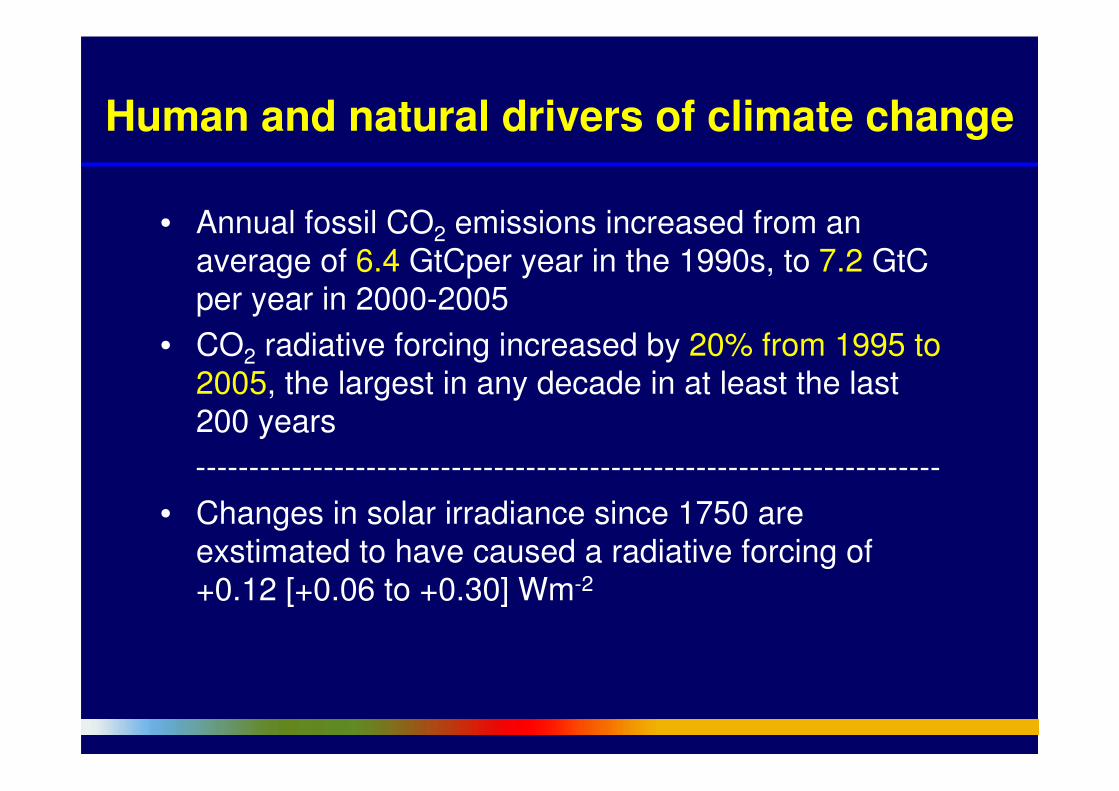
Human and natural drivers of climate change
• Annual fossil CO2 emissions increased from an
average of 6.4 GtCper year in the 1990s, to 7.2 GtCper year in 2000-2005
• CO2 radiative forcing increased by 20% from 1995 to 2005, the largest in any decade in at least the last
200 years
----------------------------------------------------------------------
• Changes in solar irradiance since 1750 are
exstimated to have caused a radiative forcing of +0.12 [+0.06 to +0.30] Wm-2

GlobalGlobal--average radiative forcing estimatesaverage radiative forcing estimates

Observed
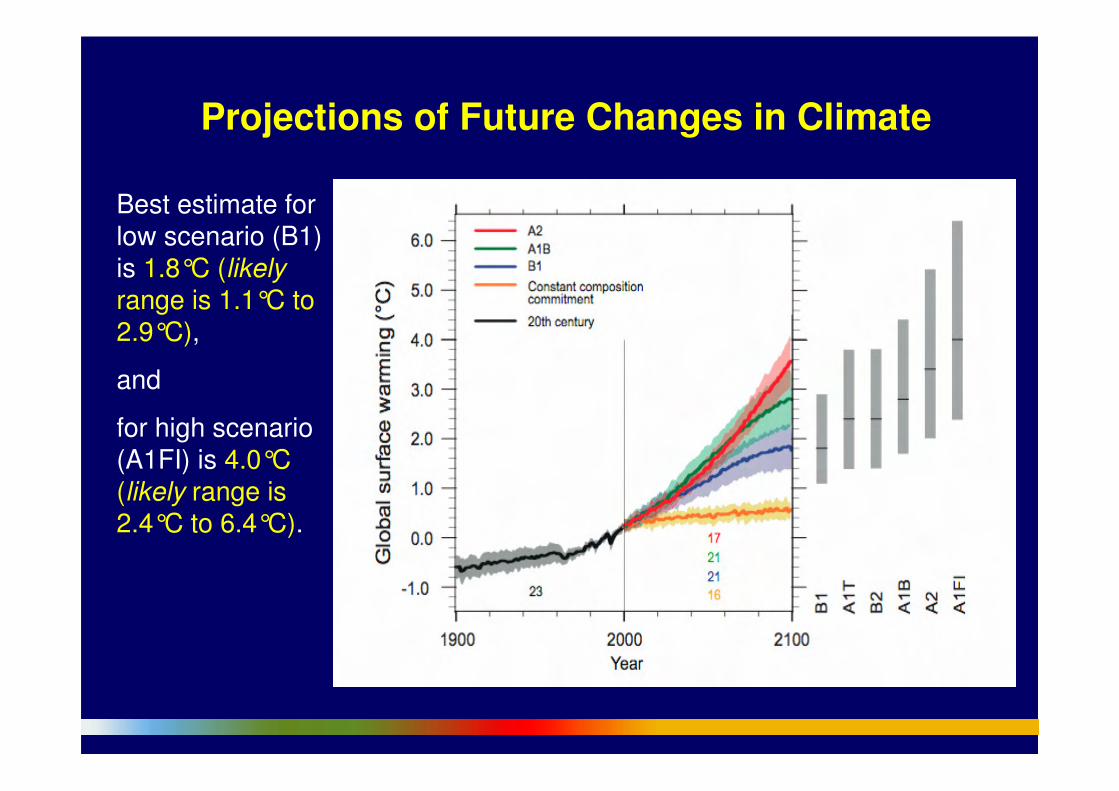
Projections of Future Changes in Climate
Best estimate for low scenario (B1) is 1.8°C (likely
range is 1.1°C to 2.9°C),
and
for high scenario (A1FI) is 4.0°C (likely range is 2.4°C to 6.4°C).
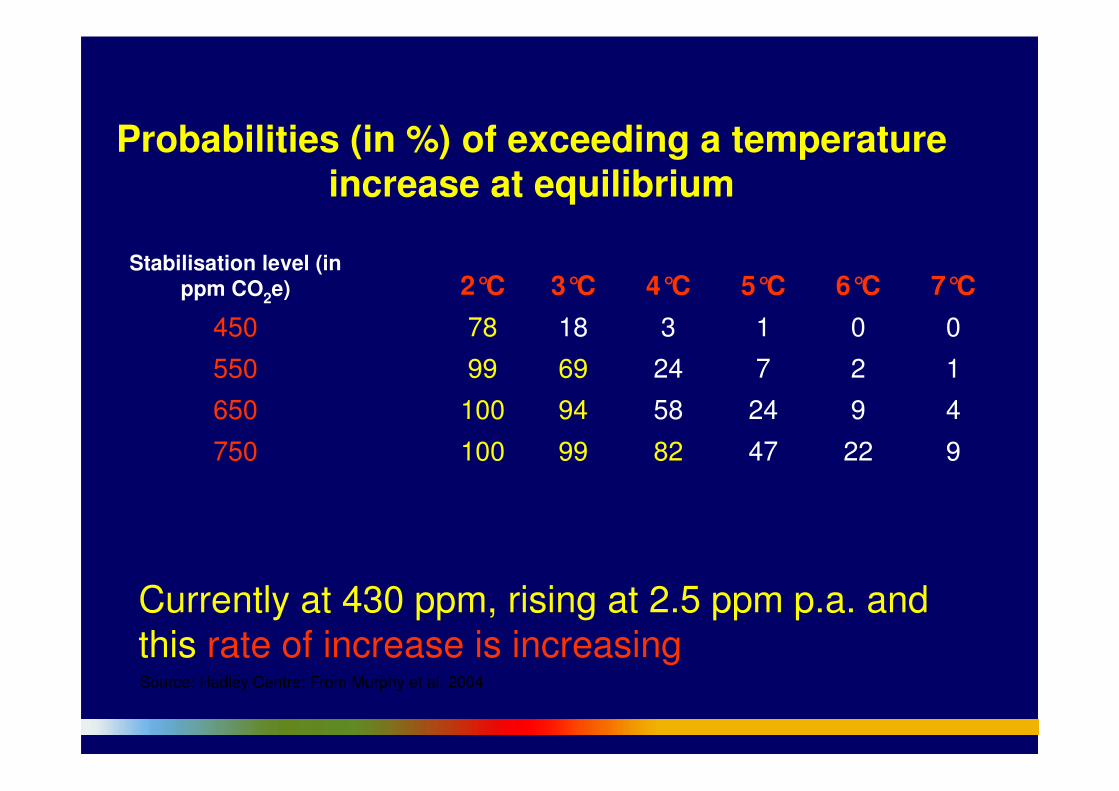
Currently at 430 ppm, rising at 2.5 ppm p.a. and
this rate of increase is increasing
Probabilities (in %) of exceeding a temperature
increase at equilibrium
Source: Hadley Centre: From Murphy et al. 2004
127246999550
49245894100650
922478299100750
00131878450
7°C6°C5°C4°C3°C2°CStabilisation level (in
ppm CO2e)
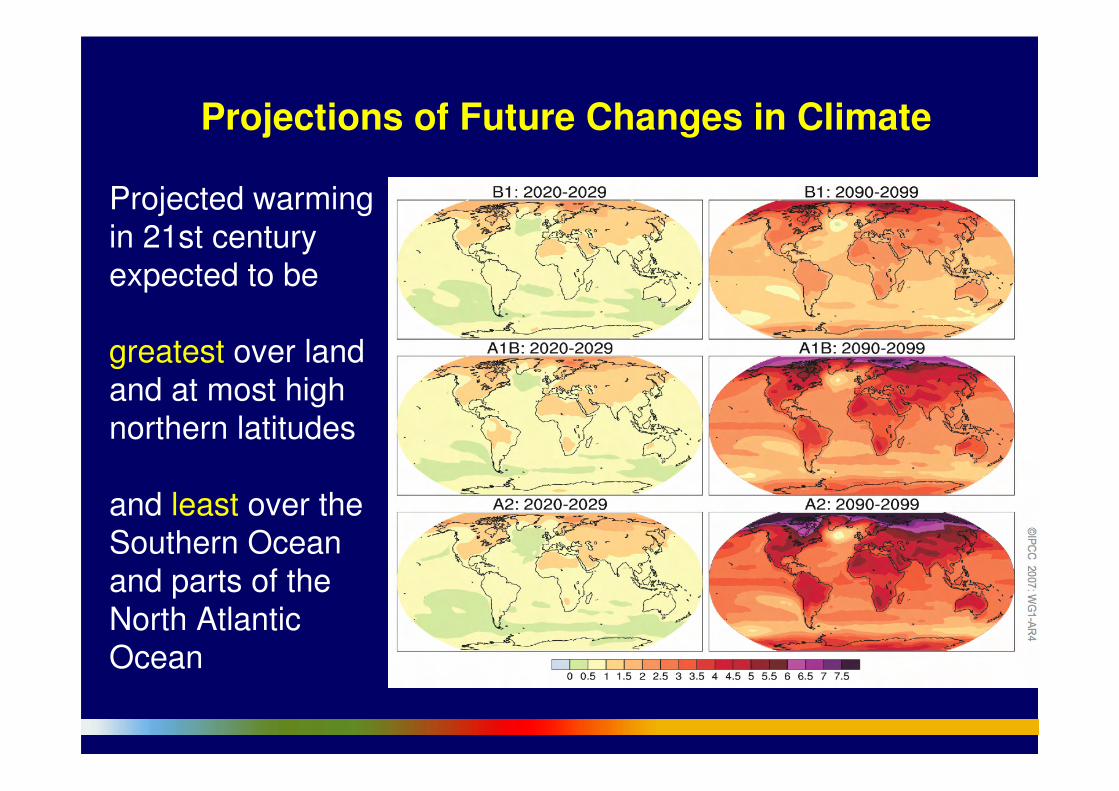
Projected warming
in 21st century expected to be
greatest over land
and at most high
northern latitudes
and least over the Southern Ocean
and parts of the
North Atlantic Ocean
Projections of Future Changes in Climate
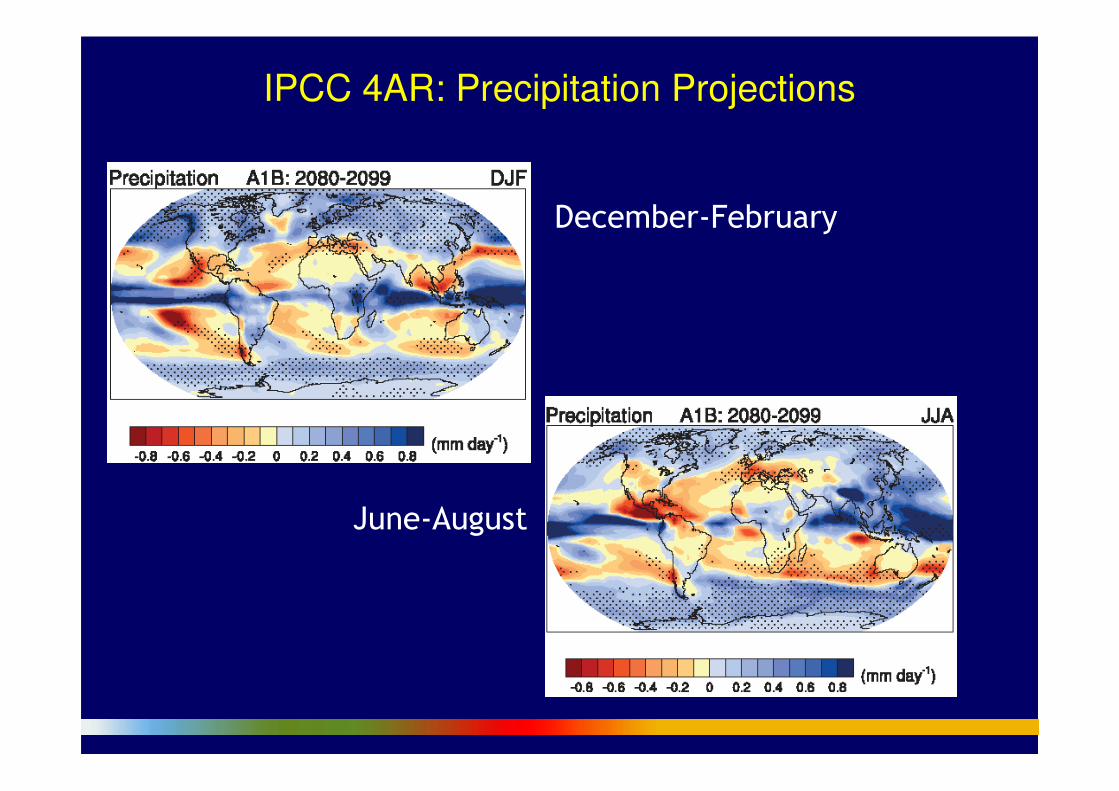
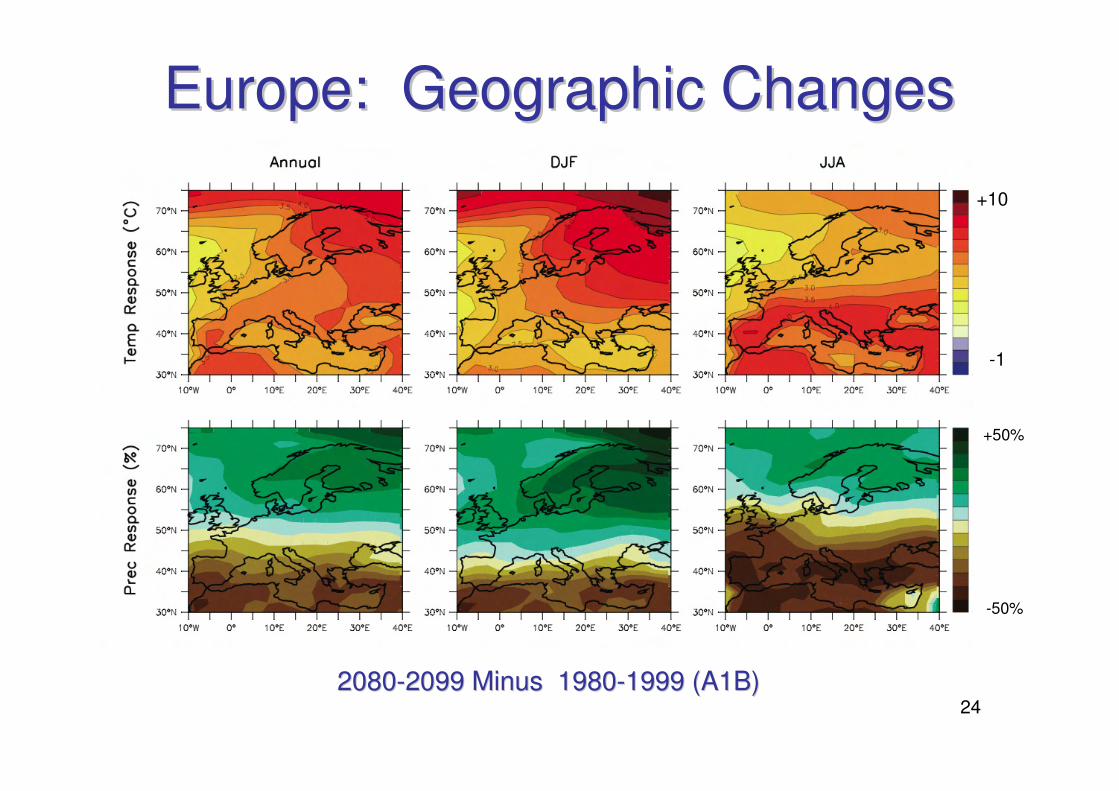
IPCC 4AR: Precipitation Projections
December-February
June-August
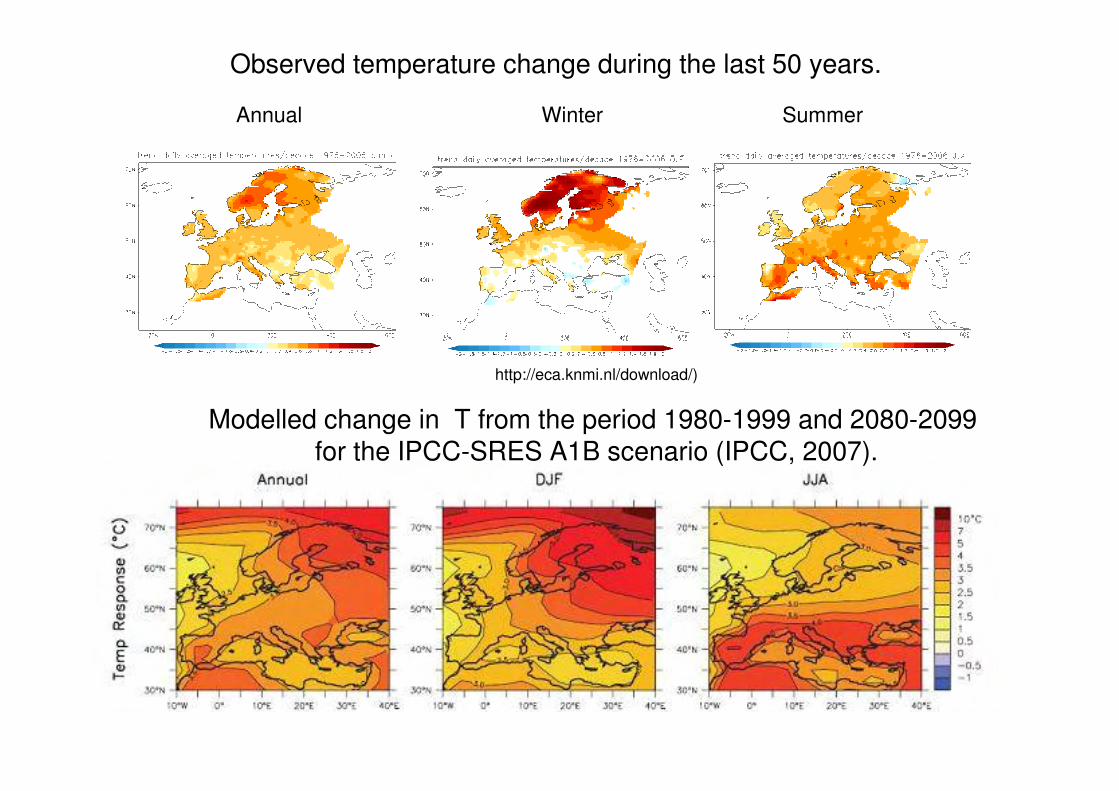
Observed temperature change during the last 50 years.
Annual Winter Summer
http://eca.knmi.nl/download/)
Modelled change in T from the period 1980-1999 and 2080-2099 for the IPCC-SRES A1B scenario (IPCC, 2007).
24
Europe: Geographic ChangesEurope: Geographic Changes
+10
-1
+50%
-50%
20802080--20992099 Minus Minus 19801980--19991999 (A1B)(A1B)

Projections of Future Changes in Climate
Best estimate for low scenario (B1) is 1.8°C (likely
range is 1.1°C to 2.9°C),
and
for high scenario (A1FI) is 4.0°C (likely range is 2.4°C to 6.4°C).
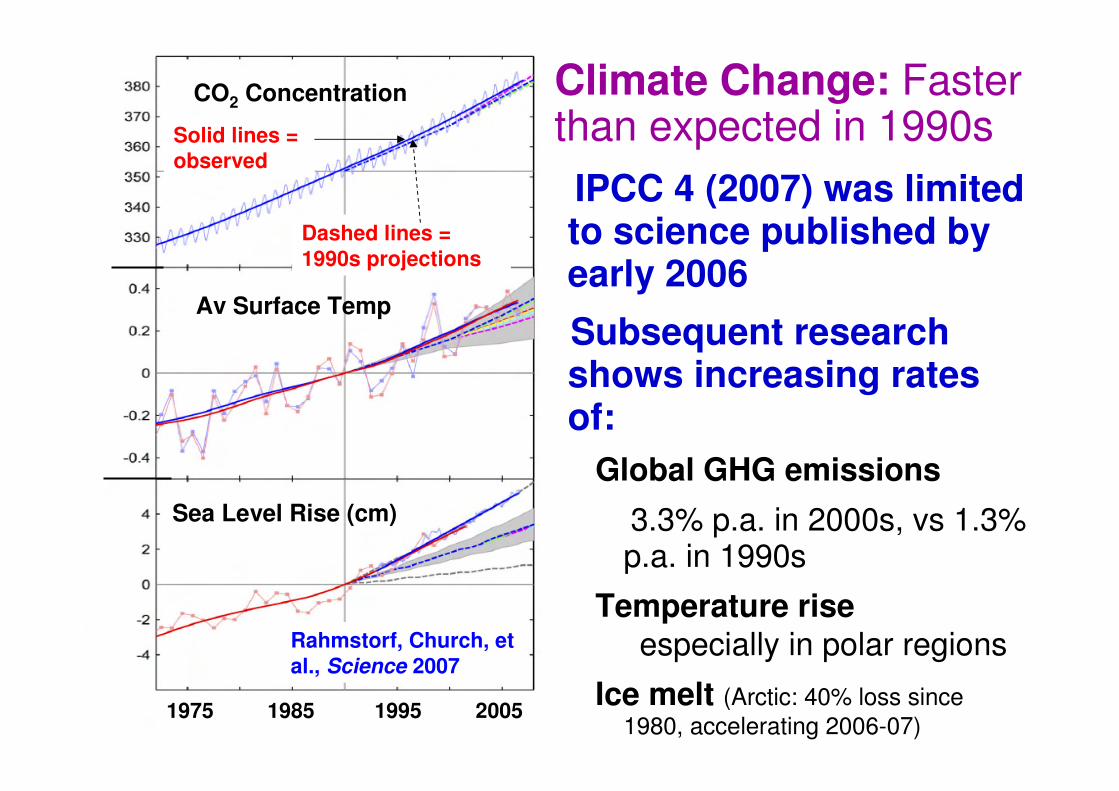
Climate Change: Faster than expected in 1990s
IPCC 4 (2007) was limited to science published by early 2006
Subsequent research shows increasing rates of:
Global GHG emissions
3.3% p.a. in 2000s, vs 1.3% p.a. in 1990s
Temperature rise
especially in polar regions
Ice melt (Arctic: 40% loss since
1980, accelerating 2006-07)
CO2 Concentration
Av Surface Temp
Sea Level Rise (cm)
Dashed lines =
1990s projections
Rahmstorf, Church, et
al., Science 2007
Solid lines =
observed
1975 1985 1995 2005
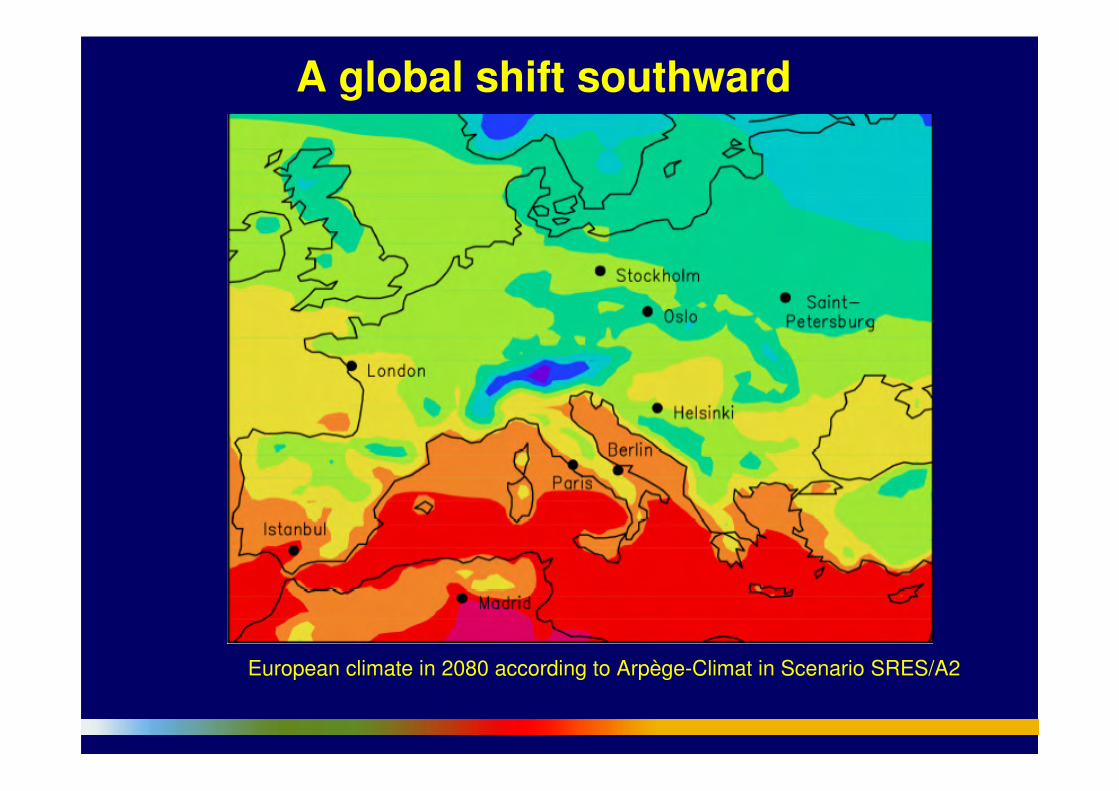
A global shift southward
European climate in 2080 according to Arpège-Climat in Scenario SRES/A2
SUMMARY
• CO2 conc. = unprecedented in the last 650,000 years
• Warming of the climate system = unequivocal
• Most of the global warming of the past half-century
is due to increases in greenhouse gases
• Already committed to more warming (next few
decades), with choices affecting the longer term
more and more.
• Future climate changes include: more extremes,
wetter in high latitudes, drier in subtropics.
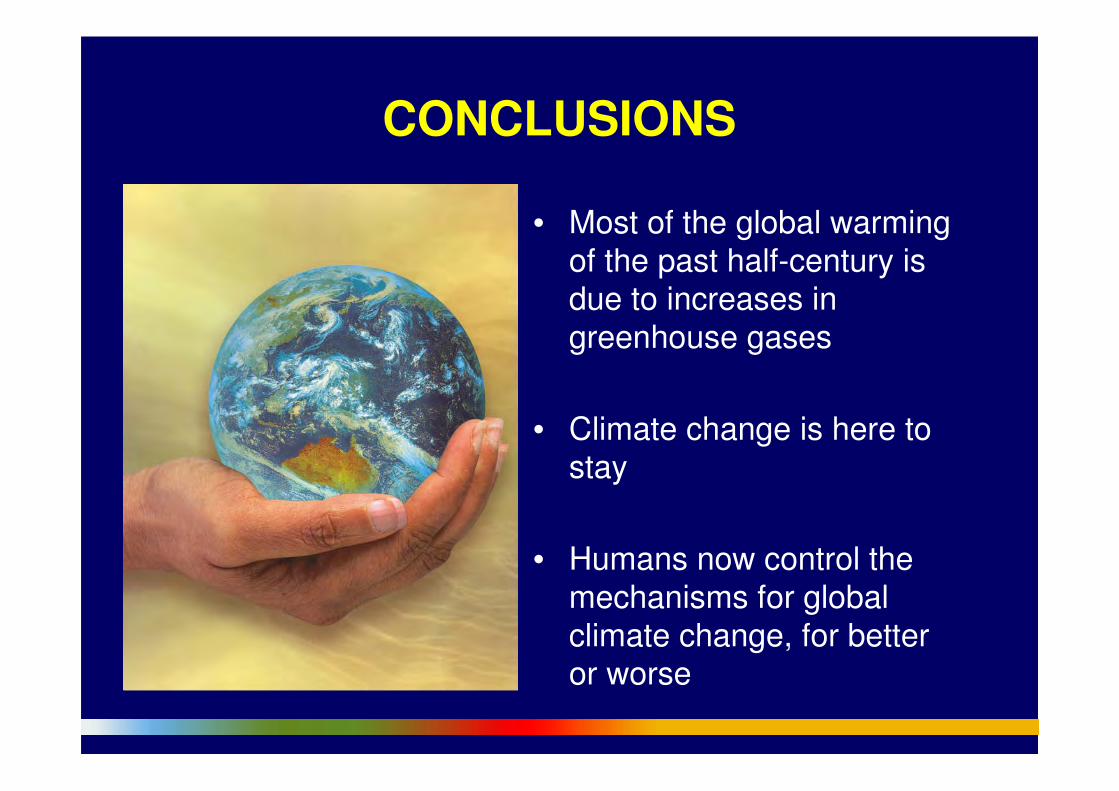
CONCLUSIONS
• Most of the global warming
of the past half-century is due to increases in
greenhouse gases
• Climate change is here to stay
• Humans now control the
mechanisms for global
climate change, for betteror worse


![Interpretive sign on the refuge...Intergovernmental Panel on Climate Change (IPCC). 2007. IPCC Fourth Assessment Report: Climate Change 2007. Geneva, Switzerland. 104 pp. [Online]](https://static.cupdf.com/doc/110x72/5ff962462284725c33048434/interpretive-sign-on-the-refuge-intergovernmental-panel-on-climate-change-ipcc.jpg)
