Washington Heights BIDin
partnershipwith
Commercial District Needs Assessment
INWOODMANHATTAN
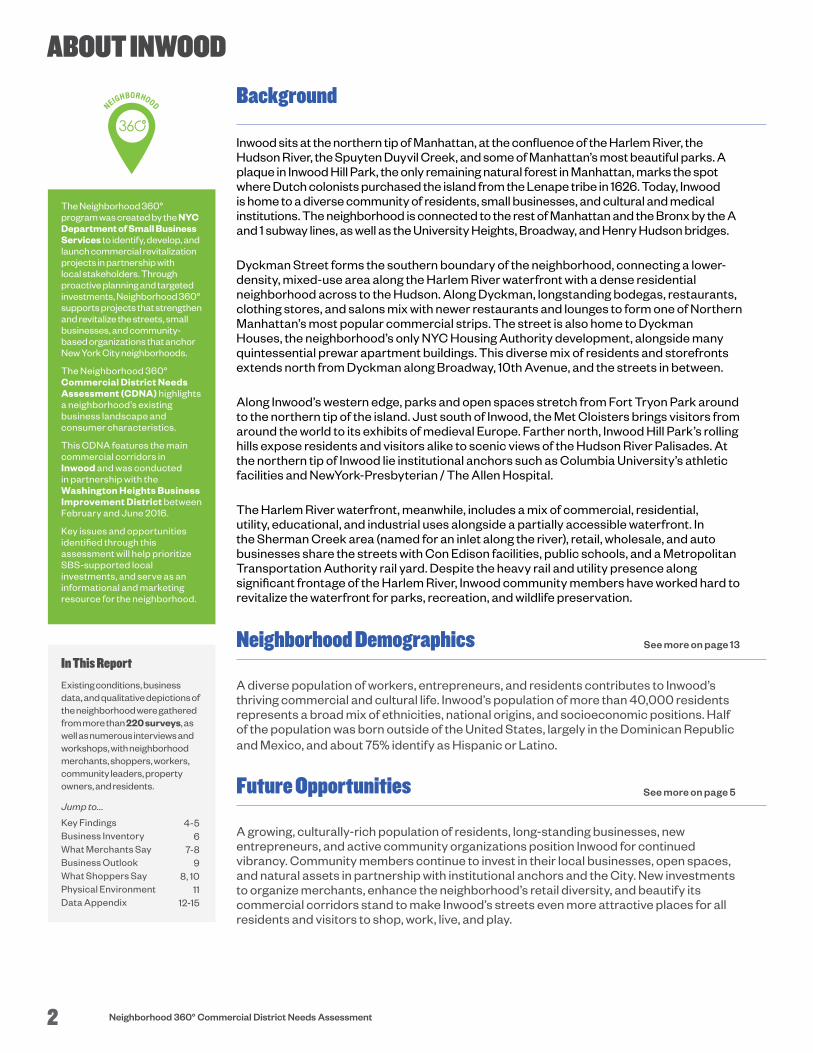
Background
Inwood sits at the northern tip of Manhattan, at the confluence of the Harlem River, the Hudson River, the Spuyten Duyvil Creek, and some of Manhattan’s most beautiful parks. A plaque in Inwood Hill Park, the only remaining natural forest in Manhattan, marks the spot where Dutch colonists purchased the island from the Lenape tribe in 1626. Today, Inwood is home to a diverse community of residents, small businesses, and cultural and medical institutions. The neighborhood is connected to the rest of Manhattan and the Bronx by the A and 1 subway lines, as well as the University Heights, Broadway, and Henry Hudson bridges.
Dyckman Street forms the southern boundary of the neighborhood, connecting a lower-density, mixed-use area along the Harlem River waterfront with a dense residential neighborhood across to the Hudson. Along Dyckman, longstanding bodegas, restaurants, clothing stores, and salons mix with newer restaurants and lounges to form one of Northern Manhattan’s most popular commercial strips. The street is also home to Dyckman Houses, the neighborhood’s only NYC Housing Authority development, alongside many quintessential prewar apartment buildings. This diverse mix of residents and storefronts extends north from Dyckman along Broadway, 10th Avenue, and the streets in between.
Along Inwood’s western edge, parks and open spaces stretch from Fort Tryon Park around to the northern tip of the island. Just south of Inwood, the Met Cloisters brings visitors from around the world to its exhibits of medieval Europe. Farther north, Inwood Hill Park’s rolling hills expose residents and visitors alike to scenic views of the Hudson River Palisades. At the northern tip of Inwood lie institutional anchors such as Columbia University’s athletic facilities and NewYork-Presbyterian / The Allen Hospital.
The Harlem River waterfront, meanwhile, includes a mix of commercial, residential, utility, educational, and industrial uses alongside a partially accessible waterfront. In the Sherman Creek area (named for an inlet along the river), retail, wholesale, and auto businesses share the streets with Con Edison facilities, public schools, and a Metropolitan Transportation Authority rail yard. Despite the heavy rail and utility presence along significant frontage of the Harlem River, Inwood community members have worked hard to revitalize the waterfront for parks, recreation, and wildlife preservation.
Neighborhood Demographics
A diverse population of workers, entrepreneurs, and residents contributes to Inwood’s thriving commercial and cultural life. Inwood’s population of more than 40,000 residents represents a broad mix of ethnicities, national origins, and socioeconomic positions. Half of the population was born outside of the United States, largely in the Dominican Republic and Mexico, and about 75% identify as Hispanic or Latino.
Future Opportunities
A growing, culturally-rich population of residents, long-standing businesses, new entrepreneurs, and active community organizations position Inwood for continued vibrancy. Community members continue to invest in their local businesses, open spaces, and natural assets in partnership with institutional anchors and the City. New investments to organize merchants, enhance the neighborhood’s retail diversity, and beautify its commercial corridors stand to make Inwood’s streets even more attractive places for all residents and visitors to shop, work, live, and play.
ABOUT INWOOD
The Neighborhood 360° program was created by the NYC Department of Small Business Services to identify, develop, and launch commercial revitalization projects in partnership with local stakeholders. Through proactive planning and targeted investments, Neighborhood 360° supports projects that strengthen and revitalize the streets, small businesses, and community-based organizations that anchor New York City neighborhoods.
The Neighborhood 360° Commercial District Needs Assessment (CDNA) highlights a neighborhood’s existing business landscape and consumer characteristics.
This CDNA features the main commercial corridors in Inwood and was conducted in partnership with the Washington Heights Business Improvement District between February and June 2016.
Key issues and opportunities identified through this assessment will help prioritize SBS-supported local investments, and serve as an informational and marketing resource for the neighborhood.
In This Report
Existing conditions, business data, and qualitative depictions of the neighborhood were gathered from more than 220 surveys, as well as numerous interviews and workshops, with neighborhood merchants, shoppers, workers, community leaders, property owners, and residents.
Jump to...
Key FindingsBusiness InventoryWhat Merchants SayBusiness Outlook What Shoppers SayPhysical EnvironmentData Appendix
4-56
7-89
8, 1011
12-15
See more on page 13
See more on page 5
2 Neighborhood 360° Commercial District Needs Assessment

Inwood Commercial Corridors
Public Facilities
Arts & Culture Destinations
Co-Working SpacesNYCHA Dyckman Houses
NEIGHBORHOOD CONTEXT
Merchant & Business Groups
Inwood
Washington Heights Business Improvement District
Northern Manhattan Improvement Corporation
Sherman Creek Business Owners
National Supermarket Association
Northern Manhattan Restaurant and Lounge Association
Community League of the Heights
Washington Heights and Inwood Development Corporation
Chamber of Commerce of Washington Heights and Inwood
#WHIN and Dine Uptown Retaurant Week
Dyckman Basketball Tournament
Inwood Film Festival
Medieval Festival at Fort Tryon Park
Uptown Arts Stroll
Neighborhood Events
Current and Planned Developments
Notable Places
1
Columbia University Baker Athletics Complex
Inwood Hill Park
2
Dyckman Farmhouse
2
3
The MetCloisters
DyckmanFarmhouse
1
4
A
10 A
V
BROADWAY
9 AV
MAJOR D
EEGAN EXPY
NAGLE AV
HENR
Y HU
DSO
N PA
RKW
AY
DYCKMAN ST
W 187 ST
W 218 ST
SHERMAN AV POST AV
AUDU
BON
AV
WAD
SWOR
TH A
VST
NIC
HOLA
S AV
HILLSIDE AV
W 183 ST
UNIV
ERSI
TY A
V
BROADWAY
BRIDGE
W 228 ST
9 AV
W 207 ST
UNIVERSITYHEIGHTSBRIDGE
10 A
V
W 215 ST
HENRY
HUDSON
BRIDGE
SEAMAN AV
W FORDHAM RD
Inwood Hill Park
FortTryonPark
Highbridge Park
Harle
m R
iver
Spuyten Duyvil Creek
Huds
on R
iver
MTA 207th StRail Yard
NYCHADyckmanHouses
Dyckman Playground
Muscota Marsh
Isham Park
Sherman Creek Park
InwoodLibrary
CUNY in the Heights
NewYork-Presbyterian / The Allen HospitalColumbia University Baker Athletics Complex 1
5030Broadway
3
The Met Cloisters
Broadway Bridge
0 0.35 Miles0.175
3Inwood
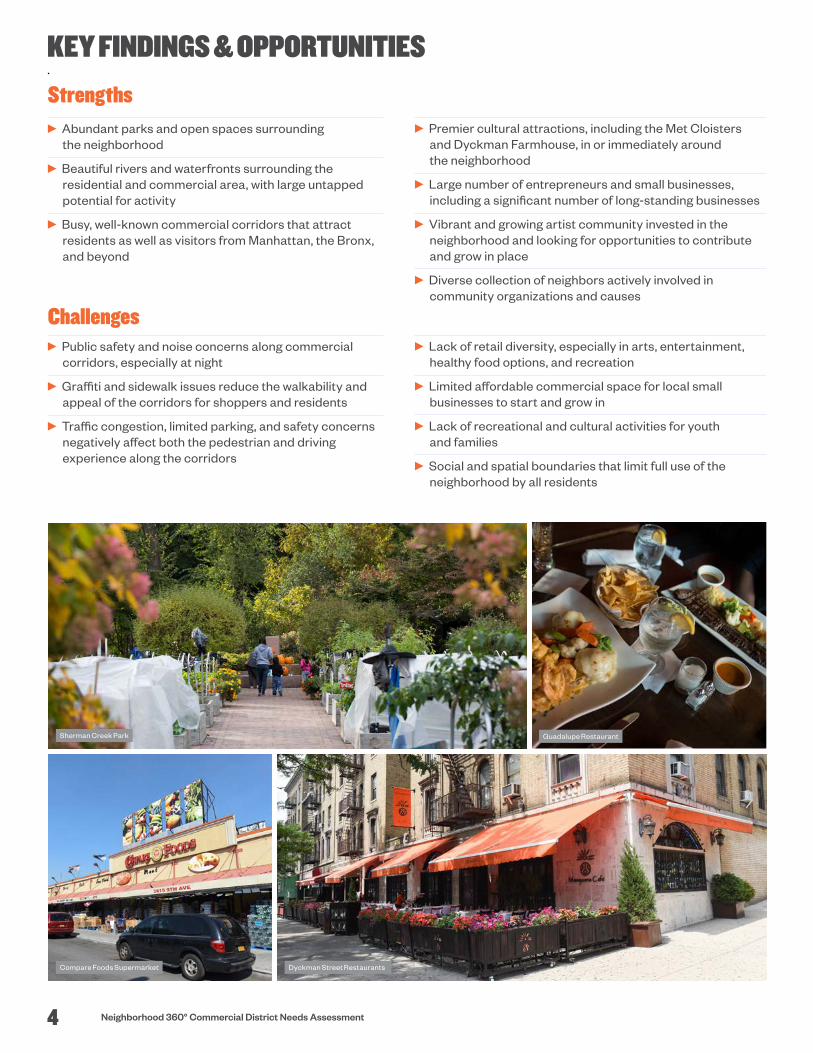
Strengths Abundant parks and open spaces surrounding
the neighborhood
Beautiful rivers and waterfronts surrounding the residential and commercial area, with large untapped potential for activity
Busy, well-known commercial corridors that attract residents as well as visitors from Manhattan, the Bronx, and beyond
Premier cultural attractions, including the Met Cloisters and Dyckman Farmhouse, in or immediately around the neighborhood
Large number of entrepreneurs and small businesses, including a significant number of long-standing businesses
Vibrant and growing artist community invested in the neighborhood and looking for opportunities to contribute and grow in place
Diverse collection of neighbors actively involved in community organizations and causes
Challenges Public safety and noise concerns along commercial
corridors, especially at night
Graffiti and sidewalk issues reduce the walkability and appeal of the corridors for shoppers and residents
Traffic congestion, limited parking, and safety concerns negatively affect both the pedestrian and driving experience along the corridors
Lack of retail diversity, especially in arts, entertainment, healthy food options, and recreation
Limited affordable commercial space for local small businesses to start and grow in
Lack of recreational and cultural activities for youth and families
Social and spatial boundaries that limit full use of the neighborhood by all residents
Sherman Creek Park Guadalupe Restaurant
Compare Foods Supermarket Dyckman Street Restaurants
KEY FINDINGS & OPPORTUNITIES
Neighborhood 360° Commercial District Needs Assessment4

Opportunities Activate Inwood’s parks, sidewalks, and vacant
storefronts with diverse cultural and arts attractions
Attract new businesses to vacant storefronts that meet the neighborhood’s demand for healthy food, family-friendly restaurants, arts, and entertainment
Bring the natural beauty of Inwood’s parklands into its commercial district by beautifying the streets and expanding family-friendly outdoor activities in open spaces
Invest in sanitation services to address litter and graffiti and make Inwood’s commercial corridors more inviting to residents and visitors alike
Connect more local business owners to business support services that help them attract customers and thrive in place
Leverage Inwood’s growing artist community to support local business through public art initiatives
Support local small business owners’ efforts to organize, promote, and advocate collectively, including exploring the feasibility of a Business Improvement District (BID)
Enhance lighting on key commercial streets to address safety concerns
Market Inwood’s diverse array of restaurants and retailers with a unified, bilingual website, advertising, and social media strategy
Patacon Pisao Food Truck Good Shepherd Church
215th Street 1 Train Station Characteristic Prewar, Mixed-Use Housing
What’s Next?To address these key findings and opportunities, Neighborhood 360° Grants will be made available by SBS to not-for-profit organizations.
For more information, visit: nyc.gov/neighborhood360
5Inwood
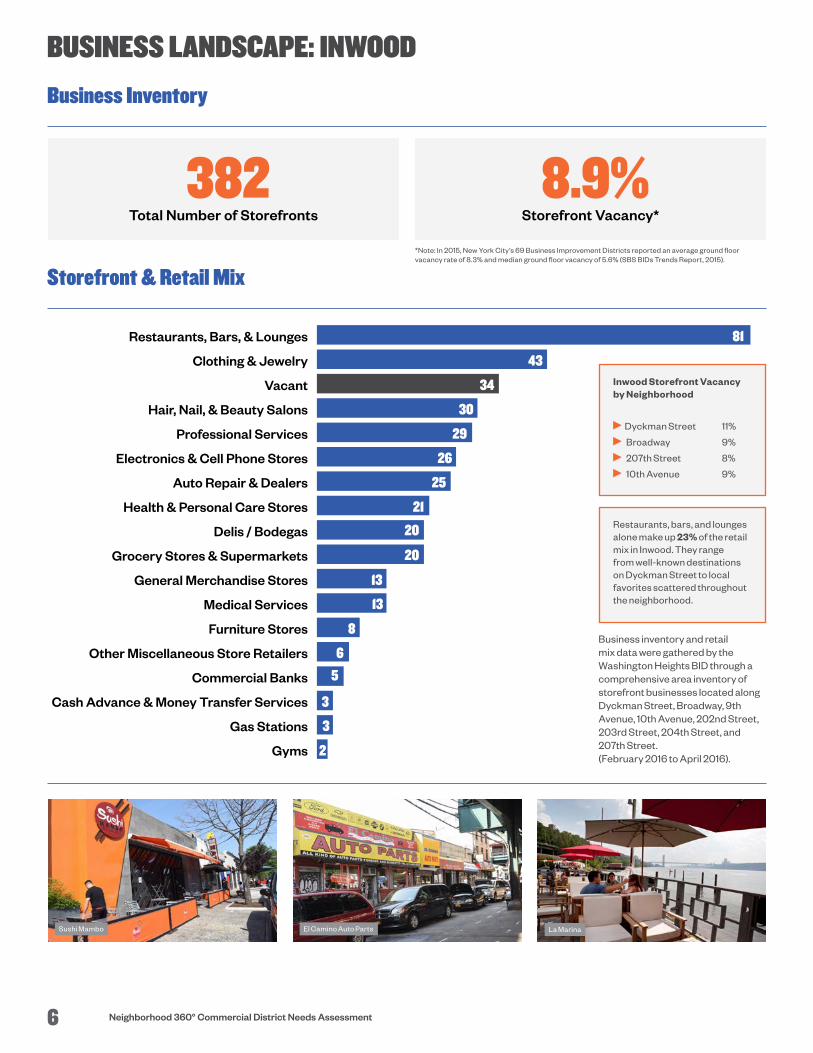
8.9%Storefront Vacancy*
382Total Number of Storefronts
BUSINESS LANDSCAPE: INWOOD
Business Inventory
Storefront & Retail Mix
El Camino Auto Parts La MarinaSushi Mambo
Gyms
Gas Stations
Cash Advance & Money Transfer Services
Commercial Banks
Other Miscellaneous Store Retailers
Furniture Stores
Medical Services
General Merchandise Stores
Grocery Stores & Supermarkets
Delis / Bodegas
Health & Personal Care Stores
Auto Repair & Dealers
Electronics & Cell Phone Stores
Professional Services
Hair, Nail, & Beauty Salons
Vacant
Clothing & Jewelry
Restaurants, Bars, & Lounges
34
81
43
30
29
26
25
21
20
20
13
13
3
3
2
8
6
5
2
Restaurants, bars, and lounges alone make up 23% of the retail mix in Inwood. They range from well-known destinations on Dyckman Street to local favorites scattered throughout the neighborhood.
Inwood Storefront Vacancy by Neighborhood
Dyckman Street 11%
Broadway 9%
207th Street 8%
10th Avenue 9%
Business inventory and retail mix data were gathered by the Washington Heights BID through a comprehensive area inventory of storefront businesses located along Dyckman Street, Broadway, 9th Avenue, 10th Avenue, 202nd Street, 203rd Street, 204th Street, and 207th Street. (February 2016 to April 2016).
*Note: In 2015, New York City’s 69 Business Improvement Districts reported an average ground floor vacancy rate of 8.3% and median ground floor vacancy of 5.6% (SBS BIDs Trends Report, 2015).
6 Neighborhood 360° Commercial District Needs Assessment

What kinds of resources would help you grow your business?
Marketing support 51%
Financing 31%
Space / storefront improvements 24%
New equipment 18%
Legal / lease support 14%
Source: Based on 171 merchant surveys conducted by the Washington Heights BID in Spring 2016.
What We’ve Heard from Inwood Merchants
How many years have you been in business here?
Do you own or rent your property?
94%Rent
3%Own
3%No Response
Over the past year, has your business improved, stayed the same, or decreased?
27%Improved
44%Stayed the Same
22%Decreased
7%N/A or No Responsese
How many employees do you have?
0
10
20
30
40
50
21+11-206-103-50-2
25%
14%
24%21%
16%
Years in Business
Bus
ines
ses
Total Employees
Bus
ines
ses
0
5
10
15
20
16+11-156-103-51-2
32%37%
17%
4%
10%
How affordable is your commercial rent?
Affordable 11%
Moderately affordable 12%
Barely affordable 53%
No response 24%
What changes need to occur in the Inwood commercial district to help your business grow?
More parking enforcement and availability
Increased sanitation services
Additional landscaping to beautify the corridors
Improve storefront conditions
Public safety enhancements, especially lighting
11Mean
8Median
1Mode
34 businesses, about a fifth of total respondents, have been in Inwood for 20 or more years
% Merchants
% Merchants % Merchants
78%
42%
42%
29% 26%
7Inwood
BUSINESS LANDSCAPE: INWOOD
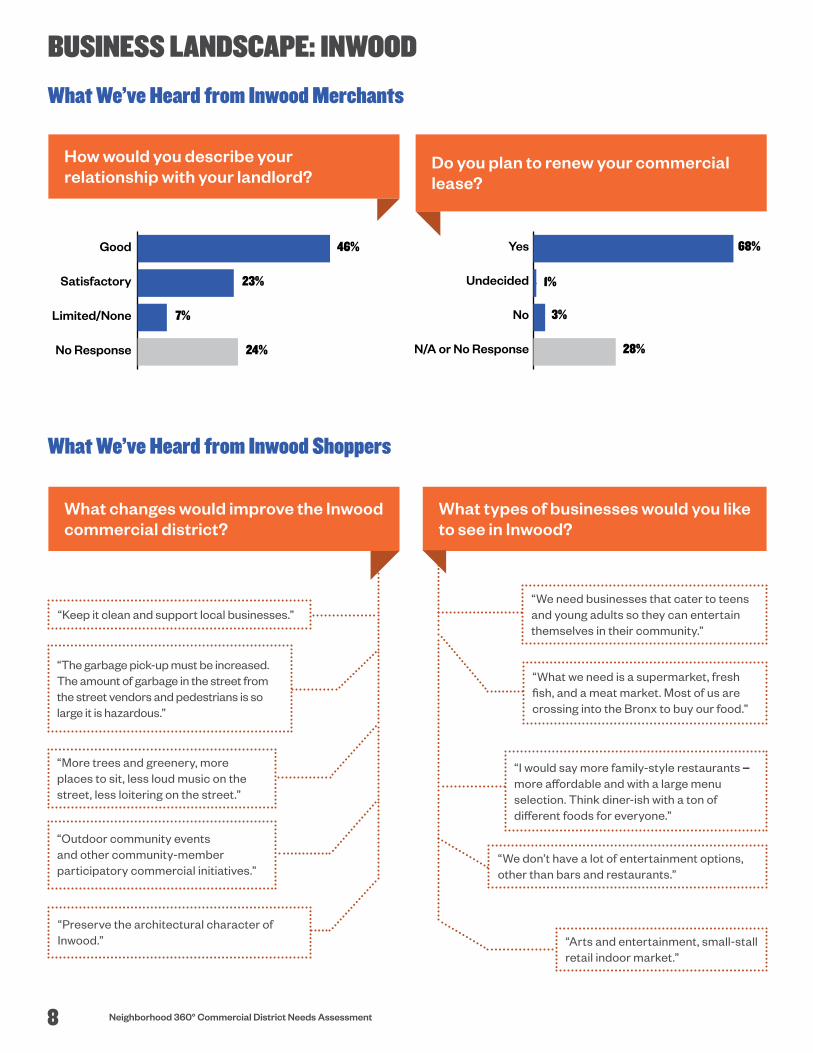
What We’ve Heard from Inwood Merchants
What We’ve Heard from Inwood Shoppers
“Keep it clean and support local businesses.”
“The garbage pick-up must be increased. The amount of garbage in the street from the street vendors and pedestrians is so large it is hazardous.”
“Outdoor community events and other community-member participatory commercial initiatives.”
“Preserve the architectural character of Inwood.”
“More trees and greenery, more places to sit, less loud music on the street, less loitering on the street.”
How would you describe your relationship with your landlord?
What changes would improve the Inwood commercial district?
Do you plan to renew your commercial lease?
“We need businesses that cater to teens and young adults so they can entertain themselves in their community.”
What types of businesses would you like to see in Inwood?
“I would say more family-style restaurants – more affordable and with a large menu selection. Think diner-ish with a ton of different foods for everyone.”
“We don’t have a lot of entertainment options, other than bars and restaurants.”
“Arts and entertainment, small-stall retail indoor market.”
“What we need is a supermarket, fresh fish, and a meat market. Most of us are crossing into the Bronx to buy our food.”
No Response
Limited/None
Satisfactory
Good 46%
23%
7%
24% N/A or No Response
No
Undecided
Yes 68%
1%
3%
28%
8 Neighborhood 360° Commercial District Needs Assessment

$34.7M
$23.6M
$22.0M
$21.6M
$14.5M
$14.2M
$10.4M
$7.2M
$7.0M
$5.5M
$4.8M
$3.5M
$2.6M
$2.3M
$2.1M
$2.0M
$800,000
$600,000
$200,000
-$1.9M
-$2.0M
-$5.4M
-$6.9M
-$9.3M
-$13.1M
-$16.0MDepartment Stores (Excluding Leased Departments)
Health & Personal Care Stores
Beer, Wine, & Liquor Stores
Clothing Stores
Full-Service Restaurants
Limited-Service Eating Places
Drinking Places (Alcoholic Beverages)
Book, Periodical, & Music Stores
Shoe Stores
Florists
Used Merchandise Stores
Special Food Services
Lawn / Garden Equipment & Supply Stores
Office Supplies, Stationery, & Gift Stores
Furniture Stores
Jewelry, Luggage, & Leather Goods Stores
Home Furnishings Stores
Specialty Food Stores
Auto Parts, Accessories, & Tire Stores
Sporting Goods, Hobby, & Musical Instrument Stores
Other Miscellaneous Store Retailers
Building Material & Supplies Dealers
Gasoline Stations
Electronics & Appliance Stores
Other General Merchandise Stores
Grocery Stores
BUSINESS OUTLOOK
Retail Leakage & Surplus
Local businesses make
$457.5Meach year in retail sales
Every year,
$221.5Mis spent outside
the neighborhood
Residents spend
$679.0Meach year in
goods and services
Retail leakage and surplus is the difference between estimated spending by local residents on retail goods and estimated sales by local retail businesses. Retail leakage occurs when consumer demand exceeds retail supply in a designated trade area. On the chart, a positive value indicates leakage of retail sales and represents net consumer spending that is being captured by retailers outside of the trade area. Retail surplus occurs when retail supply exceeds consumer demand in a designated trade area. On the chart, a negative value indicates a surplus of retail sales and may signify a market where retailers are drawing customers from outside the trade area.
LeakageSurplus $0
Inwood Retail Opportunity
Source: ESRI and Infogroup, August 2016.
9Inwood

Inwood Manhattan NYC
74% 34% 29% Inwood Manhattan NYC
161% 133% 105%
How often do you go shopping in Inwood?
What additional types of businesses would you like to see in Inwood?
Full-service restaurants
Supermarkets, grocery stores
Arts and entertainment
Bookstores
Greater variety of clothing, accessories
Children’s activities, recreation
Hardware stores
Cafes, coffee shops, bakeries
What types of businesses do you typically visit in Inwood?
Restaurants, bars
Supermarkets, grocery stores
Pharmacies
Bodegas, delis
Coffee shops, cafes
Pet shops
Business Trends
How safe do you feel shopping in Inwood at night?
What We’ve Heard from Shoppers
Twice daily
Daily
2 to 4 times a week
Once a week
Not regularly
Very safe
Somewhat safe
Not very safe
Not at all safe
N/A or No response
22%
22%
37%
13%
6%
19%
59%
6%
6%
10%
Source: Based on 51 consumer surveys conducted by the Washington Heights BID in Spring 2016.
Source: Division of Tax Policy, NYC Department of Finance.
BUSINESS OUTLOOK
Change in Total Business Sales, 2008-2015 Change in Median Sales by Business, 2008-2015
0
$10K
$20K
$30K
$40K
$50K
$60K
$70K
$80K
$28,
973
$29,
951
$38,
842
$38,
053
$40,
247
$50,
269
$75,
558
$60,
746
2009 2010 2011 2012 2013 2014 201520080
$30M
$60M
$90M
$120M
$150M
$76,
554,
997
$82,
014,
503
$92,
991,9
80
$95,
814,
988
$114
,405
,409
$126
,939
,764
$133
,394
,688
$130
,000
,381
2009 2010 2011 2012 2013 2014 20152008
Inwood Median Sales by BusinessInwood Total Business Sales
Year Year
Sal
es V
olum
e
Sal
es V
olum
e
37%
33%
29%
14%
14%
12%
12%
10%
71%
67%
29%
18%
12%
12%
% Shoppers % Shoppers
10 Neighborhood 360° Commercial District Needs Assessment

Streetscape Observations
MTA Rail Yard 10th Avenue Frontage
The 8.9% storefront vacancy rate disrupts the continuity of Inwood’s corridors and reduces lighting and perceptions of safety.
An analysis of all 348 occupied storefronts along Inwood’s commercial corridors found that 19% are in poor condition, 39% are in average condition, and 42% are in good or excellent condition.
The elevated 1 train along 10th Avenue and the adjacent MTA rail yard create challenges for lighting, pedestrian and traffic safety, and street beautification.
With some exceptions, Inwood’s corridors lack amenities like street furniture, public art, and signage.
Dyckman Street has the highest concentration of good or excellent storefront conditions, which include both new and long-standing small businesses.
207th Street contains some of the poorest storefront conditions in the neighborhood, an issue among older and newer businesses alike.
An inventory of sidewalk conditions on the corridors found 223 incidents of cracking, missing pavement, and other hazardous conditions, including 38 incidents on one block of Dyckman between Sherman and Broadway.
66 incidents of graffiti were also identified, including 30 incidents on the two blocks of 207th between Broadway and Sherman.
An inventory of crosswalk conditions found 67 instances of potholes or missing / hard-to-see crosswalk lines, including 16 incidents on 9th Avenue between 204th and 207th.
117 incidents of missing or broken tree pit guards were identified on the corridors, including 10 on 204th Street between 9th and 10th Avenues.
PHYSICAL ENVIRONMENT
Storefront Conditions
207th Street Storefronts
Lack of Corridor Landscaping
Graffiti, Litter, and Vacancy Issues10
AV
9 AV
NAGLE AV
W 207 ST
SEAMAN AV
DYCKMAN ST
SHERMAN AV
POST AV
PAYSON AV
ISHAM ST
VERMILYEA AV
ACADEMY ST
HILLSIDE AV
ARDEN ST
PARK TE W
THAYER ST
COOPER ST
W 206 ST
W 211 ST
W 204 ST
SICKLES ST
W 202 ST
W 212 ST
W 203 ST
W 205 ST
W 213 ST
W 214 ST
W 204 ST
BROADWAY
1
2
3
4
56
5 - Excellent
4
3
2
1 - Below Average
Vacant Lots
Vacant Storefronts
1
2
3
4
5
6
Note: Colors on the storefront conditions map represent a block-by-block average of storefront scores.
0.15 Miles0
% Shoppers
11Inwood

10 A
V
BROADWAY
9 AV
MAJ
OR
DEEG
AN E
XPY
NAGLE AV
HENR
Y HU
DSO
N PA
RKW
AY
SEAMAN AV
DYCKMAN ST
W 187 ST
W 218 ST
SHERMAN AV POST AV
AUDU
BON
AV
W 230 ST
AMST
ERDA
M A
VWAD
SWOR
TH A
V
ST N
ICHO
LAS
AV
JOHNSO
N AV
HILLSIDE AV
W 183 ST
UNIV
ERSI
TY A
V
BROADWAY
BRIDGE
W 228 ST
9 AV
W 207 ST
UNIVERSITYHEIGHTSBRIDGE
10 A
V
W FORDHAM RD
W 215 ST
BRO
ADW
AY
HENRY
HUDSON
BRIDGESE
DG
WIC
K
AV
Harle
m R
iver
Huds
on R
iver Spuyten Duyvil Creek
Inwood Hill Park
FortTryonPark
Highbridge Park
IshamPark
Study Area Boundaries
DATA APPENDIX
0 0.35 Miles
Assessed Commercial Corridors
Primary data on Inwood storefront businesses presented on pg. 6-7 was gathered along the following corridors:
Dyckman St.: Payson Ave. to Nagle Ave.
207th St.: Broadway to 10th Ave.
Broadway: Dyckman St. to 207th St.
10th Ave.: 204th St. to 216th St.
9th Ave.: 204th St. to 207th St.
202nd St. to 204th St.: 9th Ave. to 10th Ave.
Inwood Context Area
Demographic and employment data from pg. 12-13 corresponds with the Inwood neighborhood context area.
Trade Area
Retail leakage, surplus, and retail opportunity data on pg. 9 corresponds with the 0.25-mile trade area surrounding Inwood’s commercial district.
Population Density (per square mile)
46,493 Inwood
Manhattan
New York City
69,803
27,027
Total Population
40,715 Inwood
Manhattan
New York City
1,605,272
8,268,999
Average Household Size
2.8 Inwood
Manhattan
New York City
2.1
2.6
Area Demographics
Commuting Patterns
Car Ownership
25% Inwood
Manhattan
New York City
22%
45%
3,791 Work in Inwood, live elsewhere
467 Live & Work in Inwood
15,016 Live in Inwood, work elsewhere
3,791 15,016467Work Live
12 Neighborhood 360° Commercial District Needs Assessment

Foreign-Born Population
50% Inwood
Manhattan
New York City
29%
37%
Median Age
36.5 Inwood
Manhattan
New York City
36.5
35.6
Local Residents’ Employment Jobs Located in Inwood
Race / Background Inwood MN NYC Inwood MN NYC
Inwood MN NYC
Under 5 Years
5–14 Years
15–24 Years
25–44 Years
45–64 Years
65+ Years
Population Age
6%
11%
13%
34%
26%
10%
5%
7%
13%
37%
24%
14%
7%
11%
14%
31%
25%
12%
Educational Attainment
12th Grade or Less, No Diploma
High School Graduate
Some College, No Degree
Associate’s Degree
Bachelor’s Degree
Graduate or Professional Degree
29%
20%
14%
5%
19%
13%
14%
13%
11%
3%
31%
28%
20%
25%
15%
6%
20%
14%
Income
Median Household Income
$40,395 Inwood
Manhattan
New York City
$69,659
$52,259
Pop. Below Poverty Line
26% Inwood
Manhattan
New York City
18%
20%
Employment
Unemployment*
16.1% Inwood
Manhattan
New York City
8.8%
10.6%
Population in Labor Force
70% Inwood
Manhattan
New York City
67%
63%
DATA APPENDIX
Local Jobs and Employment
Sources: US Census Bureau, 2009-2013 American Community Survey and 2014 OntheMap Application.
Area Demographics
*Note: The unemployment rate for Manhattan is at 4.4% and for New York City is at 5.1%, as of June 2016 (NYSDOL); updated neighborhood-level data for Inwood is not available.
Hispanic or Latino (of any race)
White alone
Black or African American alone
Asian alone
Native Hawaiian and Other Pacific Islander
American Indian and Alaska Native alone
Some other race alone
Two or more races
75%
16%
5%
2%
0%
0%
0%
2%
26%
48%
13%
11%
0%
0%
0%
2%
29%
33%
23%
13%
0%
0%
1%
1%
Educational Services, Health Care, Social Assistance
Accommodation, Food Services, Arts, Entertainment
Retail Trade
Professional, Scientific, & Technical Services
Other
Finance, Insurance, Real Estate
Manufacturing
Transportation, Warehousing, Utilities
Information
Public Administration
Construction
Educational Services, Health Care, Social Assistance
Retail Trade
Information
Accommodation, Food Services, Arts, Entertainment
Other
Professional, Scientific, & Technical Services
Finance, Insurance, Real Estate
Construction
Transportation, Warehousing, Utilities
Public Administration
Manufacturing
26%
16%
14%
10%
9%
6%
6%
5%
3%
3%
2%
31%
20%
11%
10%
10%
8%
8%
1%
1%
0%
0%
13Inwood

Bus Routes
4 Total MTA Bus Routes
1 Select Bus Service (SBS) Route Bx12
Average Weekday Subway Ridership (2015)
9,317 Inwood - 207 St. Station
7,233 Dyckman St. Station
6,831 Dyckman St. Station
6,541 207 St. Station
2,012 215 St. Station
MTA Annual Bus Ridership (2015)
16M Bx12 SBS
5M M100
4M Bx7
204,173 Bx20
Vehicular Traffic
94,288 Average daily vehicles at Henry Hudson Parkway
36,917 Average daily vehicles at the University Heights Bridge
31,139 Average daily vehicles on Broadway between W 218th Street and Dyckman Street
24,928 Average daily vehicles on 10th Avenue between Dyckman Street and Broadway
11,709 Average daily vehicles on W 207th Street between Broadway and 10th Avenue
10,853 Average daily vehicles on Dyckman Street between Nagle Avenue and 10th Avenue
A
A
1
1
1
Inwood Transportation
Bus Routes
Inwood Transportation
Bicycle Lanes Metro-North Railroad
DATA APPENDIX
HighbridgePark
!
!
!
!
!
!
!
!
BX20
BX7
BX20
BX
7
BX 7M
100
M10
0
M10
0
BX12SBS
BX9
BX M1
BX M1
M10
1
M 4
1
A
10 A
V
BROADWAY
9 AV
SED
GW
ICK
AV
CEDAR A
V
NAGLE AV
W 207 ST
SEAMAN AV
DYCKMAN ST
W 218 ST
SHERMAN AVPOST AV
HENR
Y HU
DSO
N PA
RKW
AY
PAYSON AV
ISHAM ST
JOHNSO
N AV
W 188 ST
HILLSIDE AV
AUDU
BON
AV
W 215 ST
TIBBETT AV
WAD
SWOR
TH A
VST
NIC
HOLA
S AV
HARL
EM R
IVER
DRI
VE
W 225 ST
W 211 ST
W 204 ST
W 201 ST
W 227 ST
FT T
RYON P
L
HENRY
HUDSON
BRIDGE
NETHERLA
ND AV
RIVERDALE AV
W 183 ST
BROADWAYBRID
GE
W 215 ST
W 189 ST
9 AV
MAJOR DEEGAN EXPY
UNIVERSITY HEIGHTSBRIDGE
Metro-North Railroad
Met
ro-N
orth
Rai
lroad
Inwood Hill Park
FortTryonPark
Huds
on R
iver
Harle
m R
iver
Spuyten Duyvil Creek
MTA 207th StRail Yard
NYC Subway
!
0.2 Miles0
14 Neighborhood 360° Commercial District Needs Assessment

Existing Plans & Studies Sherman Creek Waterfront Esplanade Master Plan, NYC Economic Development Corporation, 2011.
Washington Heights-Inwood Planning & Land Use Study, Manhattan Community Board 12 and City College, 2008.
Sherman Creek Planning Study, NYC Department of City Planning, 2007.
SourcesESRI and Infogroup, Inc. August 2016 ESRI Retail MarketPlace Profile.
Infogroup, Inc. 2016. From ReferenceUSA database.
Metropolitan Transportation Authority. 2015. Average Weekday Subway Ridership and Annual Bus Ridership.
NYC Department of Finance, Division of Tax Policy, using sales tax data from NYS Department of Taxation and Finance. Business sales are reported by tax year, which runs from March 1st to February 28th. Sales data are compiled from sales tax returns, which are rolled up by tax filer within a year, excluding returns with negative sales amounts. For each year, each tax filer is reported according to the address listed on their latest return. Large outliers were removed.
NYS Department of Labor. June 2016. Unemployment Rate Rankings by County.
NYS Department of Transportation. 2014. Annual Average Daily Traffic, using Traffic Data Viewer.
U.S. Census Bureau, 2009-2013 American Community Survey. Manhattan Census Tracts 291, 293, 295, 297, 299, 303, 307.
U.S. Census Bureau. 2014. OnTheMap Application. Longitudinal-Employer Household Dynamics Program (LEHD). Commuting Pattern data is representative of LEHD Origin-Destination Employment Statistics for the second quarter of 2014. LEHD data is based on different administrative sources, primarily Unemployment Insurance (UI) earnings data and the Quarterly Census of Employment and Wages (QCEW), and other censuses/surveys. In this context, only the highest paying job that is held over two consecutive quarters by an individual worker is counted toward worker flows into, out of, and within the context area.
Photo Credits: © Flickr: Charley Lhasa / CC BY, Alejandro A Castro / CC BY; NYC Economic Development Corporation; NYC & Company: Christopher Postlewaite, Julienne Schaer, Marley White; NYC Department of Parks & Recreation; New York Restoration Project: Anna Yatskevich.
Explora!, Neighborhood Challenge marketing grant of $50,000 awarded to the Washington Heights BID, 2013.
Recent SBS Investments in the Neighborhood
15Inwood

We would like to recognize and thank the following individuals and organizations for their contributions to the development of the Inwood Commercial District Needs Assessment:
Manhattan Borough President Gale BrewerNYC Council Member Ydanis RodriguezManhattan Community Board 12Washington Heights Business Improvement District (BID)Inwood NYC Stakeholder Working GroupFriends of Sherman Creek ConservancyCommunity League of the Heights (CLOTH)Northern Manhattan Improvement Corporation (NMIC)Sherman Creek Business OwnersWashington Heights and Inwood Development CorporationNew York Restoration ProjectFriends of Inwood Hill ParkLocal Initiatives Support Corporation (LISC)Inwood MerchantsInwood Shoppers and Residents
The NYC Department of Small Business Services helps unlock economic potential and create economic security for all New Yorkers by connecting New Yorkers to good jobs, creating stronger businesses, and building a fairer economy in neighborhoods across the five boroughs.
ACKNOWLEDGMENTS
ABOUT SBS
nyc.gov/neighborhood360