
October 27, 2016 Page 1
INVESTOR PRESENTATION
Q3-2016 RESULTS
OCTOBER 27, 2016

October 27, 2016 Page 2
Safe Harbor Statement
This presentation contains statements about management's future expectations, plans and prospects of our
business that constitute forward-looking statements, which are found in various places throughout the press
release, including, but not limited to, statements relating to expectations of orders, net sales, product shipments,
backlog, expenses, timing of purchases of assembly equipment by customers, gross margins, operating results
and capital expenditures. The use of words such as “anticipate”, “estimate”, “expect”, “can”, “intend”, “believes”,
“may”, “plan”, “predict”, “project”, “forecast”, “will”, “would”, and similar expressions are intended to identify
forward looking statements, although not all forward looking statements contain these identifying words. The
financial guidance set forth under the heading “Outlook” contains such forward looking statements. While these
forward looking statements represent our judgments and expectations concerning the development of our
business, a number of risks, uncertainties and other important factors could cause actual developments and
results to differ materially from those contained in forward looking statements, including any inability to maintain
continued demand for our products; failure of anticipated orders to materialize or postponement or cancellation of
orders, generally without charges; the volatility in the demand for semiconductors and our products and services;
failure to adequately decrease costs and expenses as revenues decline; loss of significant
customers; lengthening of the sales cycle; acts of terrorism and violence; inability to forecast demand and
inventory levels for our products; the integrity of product pricing and protection of our intellectual property in
foreign jurisdictions; risks, such as changes in trade regulations, currency fluctuations, political instability and war,
associated with substantial foreign customers, suppliers and foreign manufacturing operations; potential instability
in foreign capital markets; the risk of failure to successfully manage our diverse operations; those additional risk
factors set forth in Besi's annual report for the year ended December 31, 2015; any inability to attract and retain
skilled personnel; and other key factors that could adversely affect our businesses and financial performance
contained in our filings and reports, including our statutory consolidated statements. We expressly disclaim
any obligation to update or alter our forward-looking statements whether as a result of new information, future
events or otherwise.
October 27, 2016 Page 3
Table of Contents
I. Key Highlights
II. Financial Review
III. Strategic Highlights
IV. Outlook

October 27, 2016 Page 4
I. KEY HIGHLIGHTS
October 27, 2016 Page 5
Key Financial Highlights
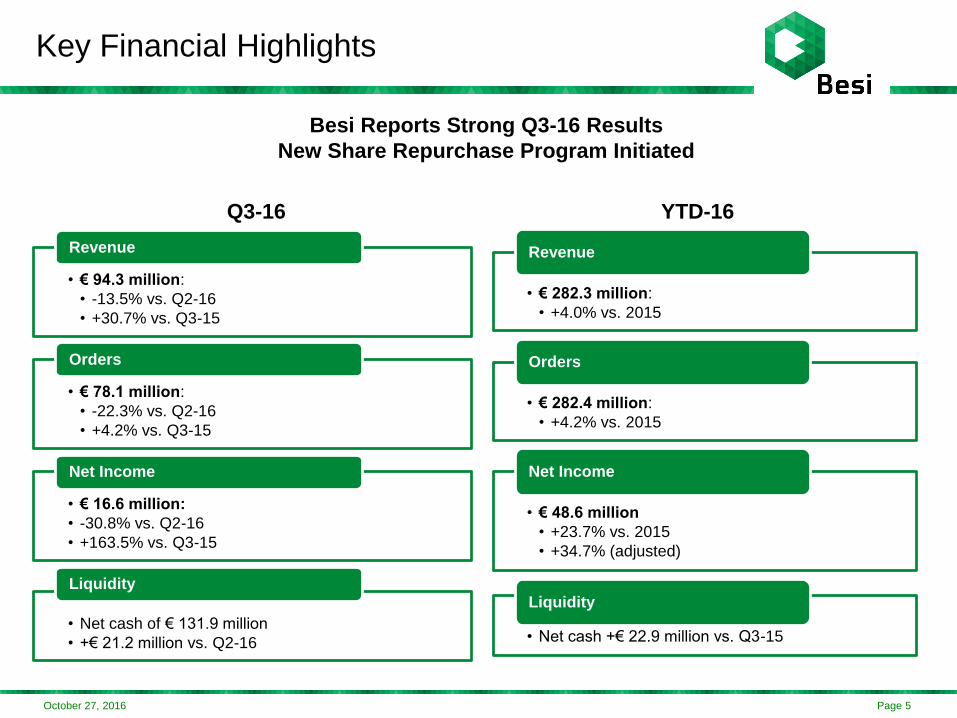
Besi Reports Strong Q3-16 Results
New Share Repurchase Program Initiated
• € 94.3 million:
• -13.5% vs. Q2-16
• +30.7% vs. Q3-15
Revenue
• € 78.1 million:
• -22.3% vs. Q2-16
• +4.2% vs. Q3-15
Orders
• € 16.6 million:
• -30.8% vs. Q2-16
• +163.5% vs. Q3-15
Net Income
• Net cash of € 131.9 million
• +€ 21.2 million vs. Q2-16
Liquidity
• € 282.3 million:
• +4.0% vs. 2015
Revenue
• € 282.4 million:
• +4.2% vs. 2015
Orders
• € 48.6 million
• +23.7% vs. 2015
• +34.7% (adjusted)
Net Income
• Net cash +€ 22.9 million vs. Q3-15
Liquidity
Q3-16 YTD-16
October 27, 2016 Page 6
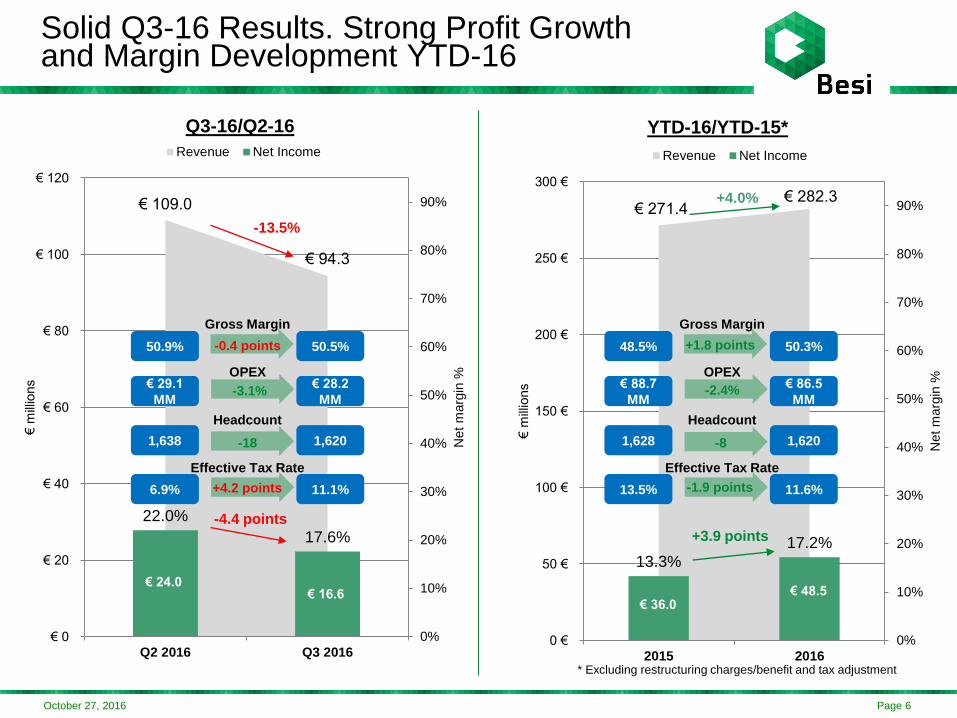
€ 109.0
€ 94.3
22.0%
17.6%
0%
10%
20%
30%
40%
50%
60%
70%
80%
90%
€ 0
€ 20
€ 40
€ 60
€ 80
€ 100
€ 120
Q2 2016 Q3 2016
Net
marg
in %
€ m
illio
ns
Revenue Net Income
Gross Margin
OPEX
Headcount
Effective Tax Rate
6.9% 11.1%
1,638 1,620
€ 29.1
MM
€ 28.2
MM
-18
+4.2 points
-3.1%
50.9% 50.5%
-13.5%
-4.4 points
Q3-16/Q2-16 YTD-16/YTD-15*
-0.4 points
€ 16.6
€ 271.4 € 282.3
13.3%
17.2%
0%
10%
20%
30%
40%
50%
60%
70%
80%
90%
0 €
50 €
100 €
150 €
200 €
250 €
300 €
2015 2016
Net
marg
in %
€ m
illio
ns
Revenue Net Income
Gross Margin
OPEX
Headcount
Effective Tax Rate
13.5% 11.6%
1,628 1,620
€ 88.7
MM
€ 86.5
MM
48.5% 50.3%
-8
-1.9 points
-2.4%
+1.8 points
+4.0%
+3.9 points
€ 48.5€ 36.0
Solid Q3-16 Results. Strong Profit Growthand Margin Development YTD-16
€ 24.0
* Excluding restructuring charges/benefit and tax adjustment

October 27, 2016 Page 7
II. FINANCIAL REVIEW
October 27, 2016 Page 8
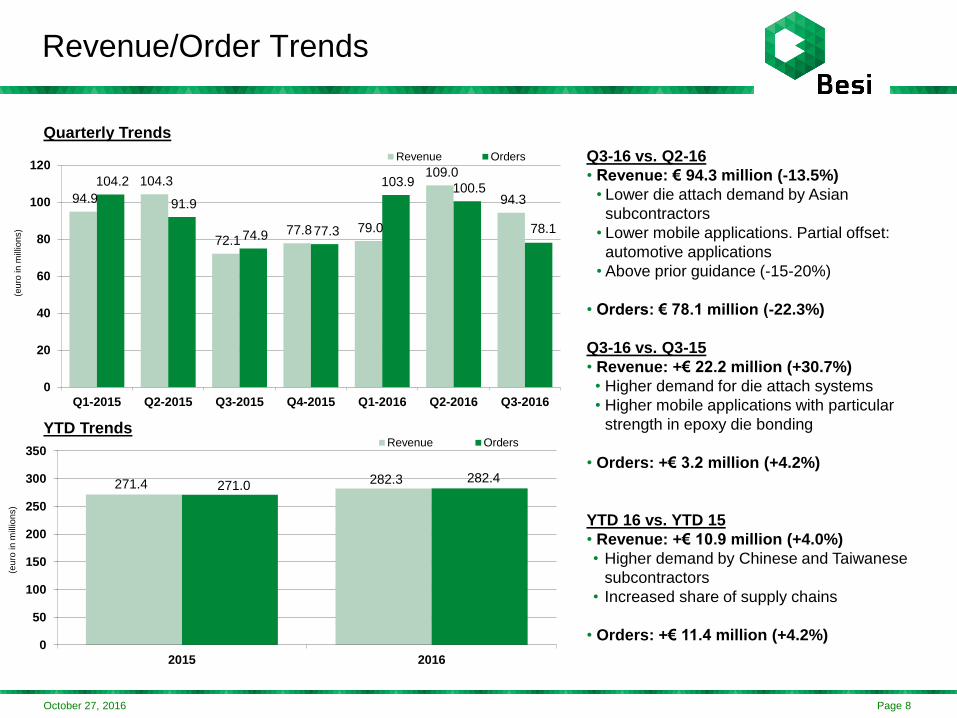
Revenue/Order Trends
94.9
104.3
72.1 77.8 79.0
109.0
94.3
104.2
91.9
74.9 77.3
103.9 100.5
78.1
0
20
40
60
80
100
120
Q1-2015 Q2-2015 Q3-2015 Q4-2015 Q1-2016 Q2-2016 Q3-2016
(eu
ro in
mill
ion
s)
Revenue Orders Q3-16 vs. Q2-16
• Revenue: € 94.3 million (-13.5%)
• Lower die attach demand by Asian
subcontractors
• Lower mobile applications. Partial offset:
automotive applications
• Above prior guidance (-15-20%)
• Orders: € 78.1 million (-22.3%)
Q3-16 vs. Q3-15
• Revenue: +€ 22.2 million (+30.7%)
• Higher demand for die attach systems
• Higher mobile applications with particular
strength in epoxy die bonding
• Orders: +€ 3.2 million (+4.2%)
YTD 16 vs. YTD 15
• Revenue: +€ 10.9 million (+4.0%)
• Higher demand by Chinese and Taiwanese
subcontractors
• Increased share of supply chains
• Orders: +€ 11.4 million (+4.2%)
Quarterly Trends
YTD Trends
271.4 282.3 271.0
282.4
0
50
100
150
200
250
300
350
2015 2016
(eu
ro in
mill
ion
s)
Revenue Orders
October 27, 2016 Page 9
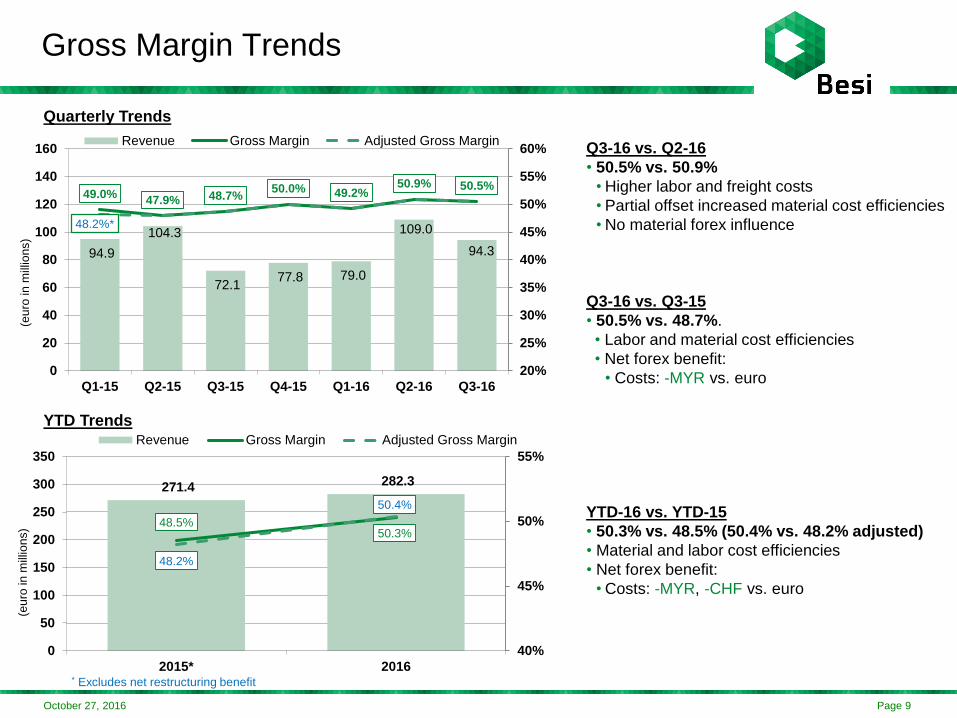
Gross Margin Trends
94.9
104.3
72.1 77.8 79.0
109.0
94.3
49.0%47.9% 48.7%
50.0% 49.2%50.9% 50.5%
48.2%*
20%
25%
30%
35%
40%
45%
50%
55%
60%
0
20
40
60
80
100
120
140
160
Q1-15 Q2-15 Q3-15 Q4-15 Q1-16 Q2-16 Q3-16
(eu
ro in
mill
ion
s)
Revenue Gross Margin Adjusted Gross Margin
* Excludes net restructuring benefit
Q3-16 vs. Q2-16
• 50.5% vs. 50.9%
• Higher labor and freight costs
• Partial offset increased material cost efficiencies
• No material forex influence
Q3-16 vs. Q3-15
• 50.5% vs. 48.7%.
• Labor and material cost efficiencies
• Net forex benefit:
• Costs: -MYR vs. euro
YTD-16 vs. YTD-15
• 50.3% vs. 48.5% (50.4% vs. 48.2% adjusted)
• Material and labor cost efficiencies
• Net forex benefit:
• Costs: -MYR, -CHF vs. euro
Quarterly Trends
271.4 282.3
48.5%50.3%
48.2%
50.4%
40%
45%
50%
55%
0
50
100
150
200
250
300
350
2015* 2016
(eu
ro in
mill
ion
s)
Revenue Gross Margin Adjusted Gross Margin
YTD Trends
October 27, 2016 Page 10
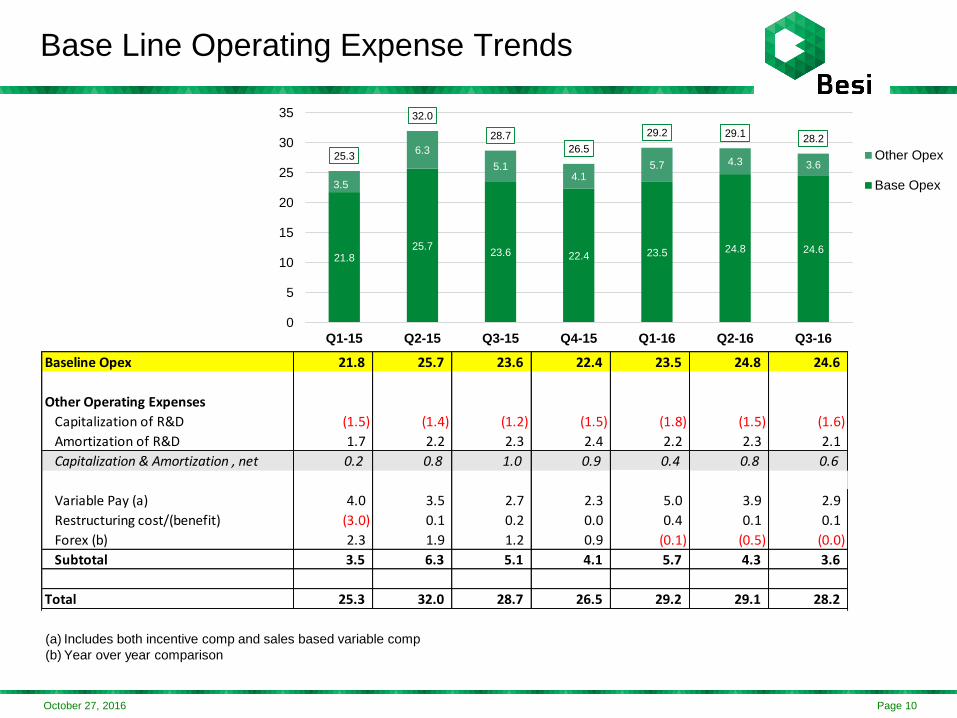
Base Line Operating Expense Trends
21.8 25.7
23.6 22.4 23.5 24.8 24.6
3.5
6.3
5.1 4.1
5.7 4.3 3.6 25.3
32.0
28.7
26.5
29.2 29.1 28.2
0
5
10
15
20
25
30
35
Q1-15 Q2-15 Q3-15 Q4-15 Q1-16 Q2-16 Q3-16
Other Opex
Base Opex
Baseline Opex 21.8 25.7 23.6 22.4 23.5 24.8 24.6
Other Operating Expenses
Capitalization of R&D (1.5) (1.4) (1.2) (1.5) (1.8) (1.5) (1.6)
Amortization of R&D 1.7 2.2 2.3 2.4 2.2 2.3 2.1
Capitalization & Amortization , net 0.2 0.8 1.0 0.9 0.4 0.8 0.6
Variable Pay (a) 4.0 3.5 2.7 2.3 5.0 3.9 2.9
Restructuring cost/(benefit) (3.0) 0.1 0.2 0.0 0.4 0.1 0.1
Forex (b) 2.3 1.9 1.2 0.9 (0.1) (0.5) (0.0)
Subtotal 3.5 6.3 5.1 4.1 5.7 4.3 3.6
Total 25.3 32.0 28.7 26.5 29.2 29.1 28.2
(a) Includes both incentive comp and sales based variable comp
(b) Year over year comparison
October 27, 2016 Page 11
€ 14.2 € 15.3
€ 6.5
€ 10.9€ 8.7
€ 23.1
€ 16.7
€ 3.3 € 0.2
(€ 0.2)(€ 1.2) (€ 0.7)
€ 0.9
(€ 0.1)
€ 17.5 € 15.5
€ 6.3
€ 9.7€ 8.0
€ 24.0
€ 16.6
15.0% 14.6%
9.0%
14.0%
11.0%
21.2%
17.7%
-5%
0%
5%
10%
15%
20%
25%
30%
35%
40%
(3)
0
3
6
9
12
15
18
21
24
27
Q1-15 Q2-15 Q3-15 Q4-15 Q1-16 Q2-16 Q3-16
(euro
in m
illio
ns)
Adjusted Net Income Adjustments Adjusted Net Margin
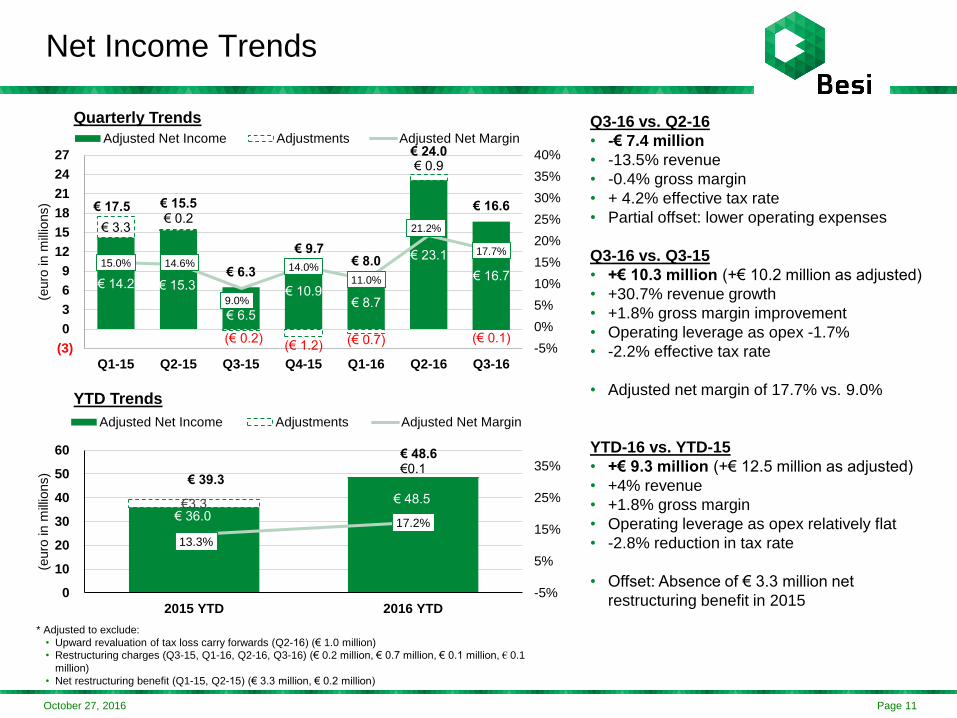
Net Income Trends
Q3-16 vs. Q2-16
• -€ 7.4 million
• -13.5% revenue
• -0.4% gross margin
• + 4.2% effective tax rate
• Partial offset: lower operating expenses
Q3-16 vs. Q3-15
• +€ 10.3 million (+€ 10.2 million as adjusted)
• +30.7% revenue growth
• +1.8% gross margin improvement
• Operating leverage as opex -1.7%
• -2.2% effective tax rate
• Adjusted net margin of 17.7% vs. 9.0%
YTD-16 vs. YTD-15
• +€ 9.3 million (+€ 12.5 million as adjusted)
• +4% revenue
• +1.8% gross margin
• Operating leverage as opex relatively flat
• -2.8% reduction in tax rate
• Offset: Absence of € 3.3 million net
restructuring benefit in 2015
Quarterly Trends
YTD Trends
€ 36.0
€ 48.5€3.3
€0.1€ 39.3
€ 48.6
13.3%
17.2%
-5%
5%
15%
25%
35%
0
10
20
30
40
50
60
2015 YTD 2016 YTD
(euro
in m
illio
ns)
Adjusted Net Income Adjustments Adjusted Net Margin
* Adjusted to exclude:
• Upward revaluation of tax loss carry forwards (Q2-16) (€ 1.0 million)
• Restructuring charges (Q3-15, Q1-16, Q2-16, Q3-16) (€ 0.2 million, € 0.7 million, € 0.1 million, € 0.1
million)
• Net restructuring benefit (Q1-15, Q2-15) (€ 3.3 million, € 0.2 million)
October 27, 2016 Page 12
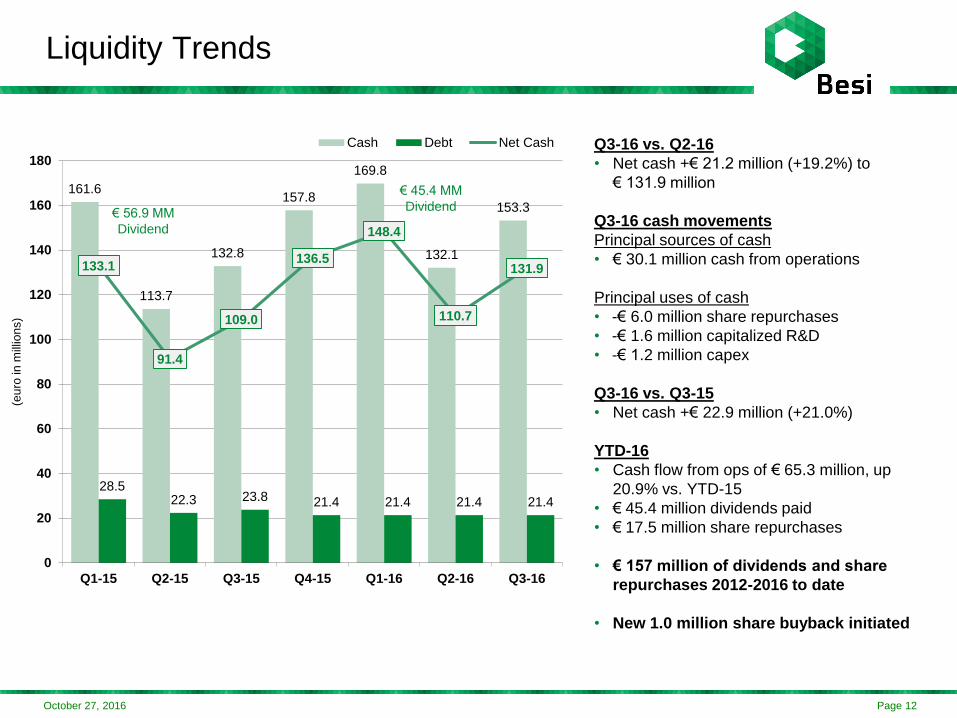
Liquidity Trends
Q3-16 vs. Q2-16
• Net cash +€ 21.2 million (+19.2%) to
€ 131.9 million
Q3-16 cash movements
Principal sources of cash
• € 30.1 million cash from operations
Principal uses of cash
• -€ 6.0 million share repurchases
• -€ 1.6 million capitalized R&D
• -€ 1.2 million capex
Q3-16 vs. Q3-15
• Net cash +€ 22.9 million (+21.0%)
YTD-16
• Cash flow from ops of € 65.3 million, up
20.9% vs. YTD-15
• € 45.4 million dividends paid
• € 17.5 million share repurchases
• € 157 million of dividends and share
repurchases 2012-2016 to date
• New 1.0 million share buyback initiated
161.6
113.7
132.8
157.8
169.8
132.1
153.3
28.5 22.3 23.8 21.4 21.4 21.4 21.4
133.1
91.4
109.0
136.5
148.4
110.7
131.9
0
20
40
60
80
100
120
140
160
180
Q1-15 Q2-15 Q3-15 Q4-15 Q1-16 Q2-16 Q3-16
(eu
ro in
mill
ion
s)
Cash Debt Net Cash
€ 56.9 MM
Dividend
€ 45.4 MM
Dividend

October 27, 2016 Page 13
III. STRATEGIC HIGHLIGHTS
October 27, 2016 Page 14
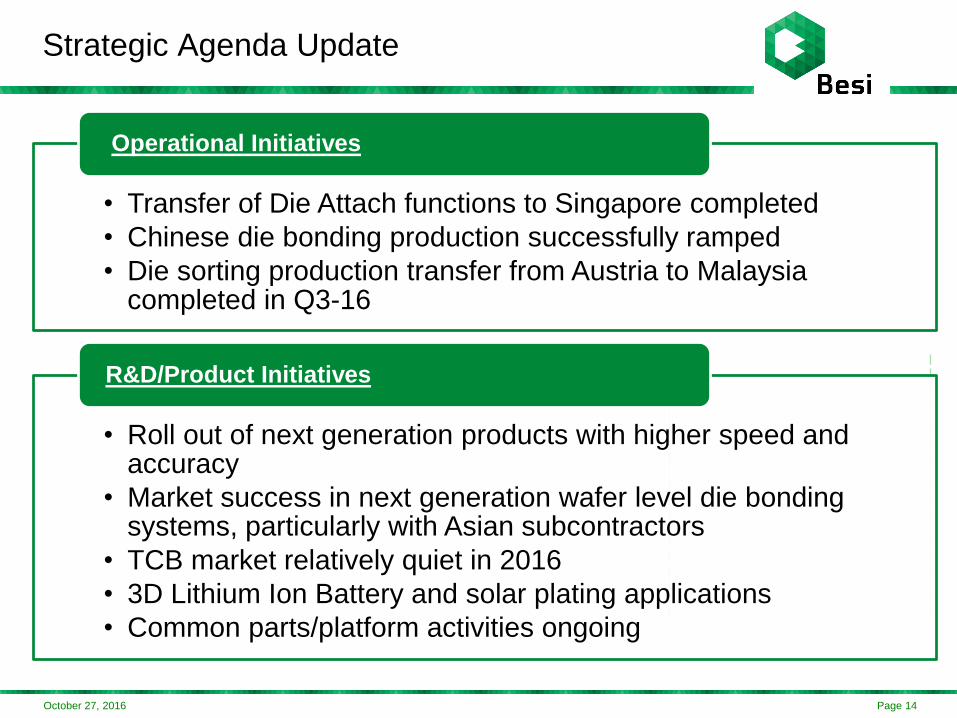
Strategic Agenda Update
• Transfer of Die Attach functions to Singapore completed
• Chinese die bonding production successfully ramped
• Die sorting production transfer from Austria to Malaysia completed in Q3-16
Operational Initiatives
• Roll out of next generation products with higher speed and accuracy
• Market success in next generation wafer level die bonding systems, particularly with Asian subcontractors
• TCB market relatively quiet in 2016
• 3D Lithium Ion Battery and solar plating applications
• Common parts/platform activities ongoing
R&D/Product Initiatives

October 27, 2016 Page 15
IV. OUTLOOK
October 27, 2016 Page 16
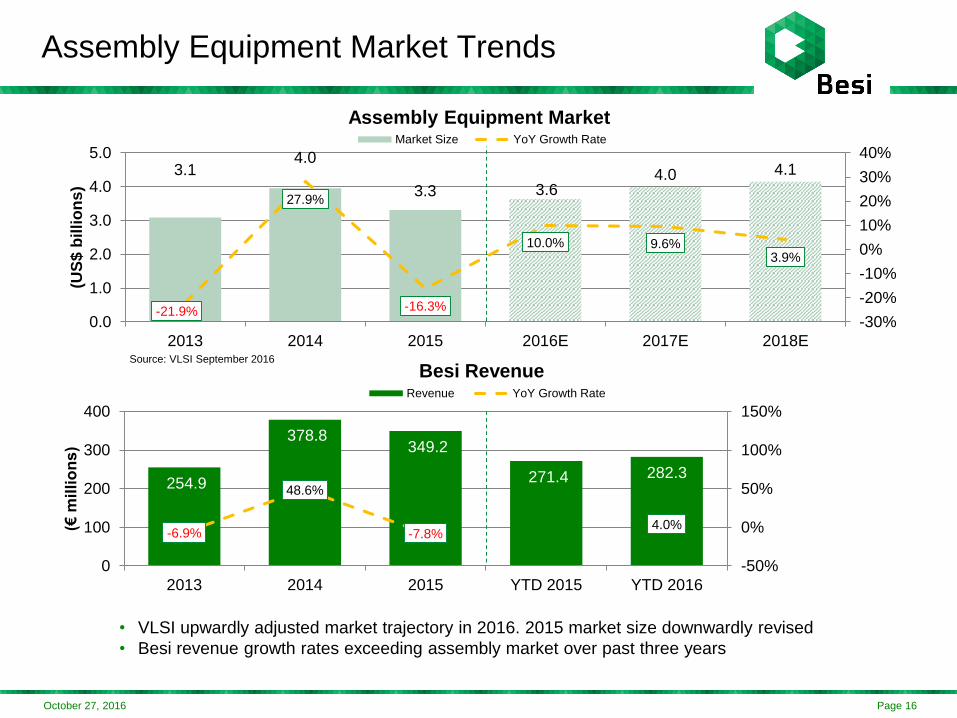
Assembly Equipment Market Trends
• VLSI upwardly adjusted market trajectory in 2016. 2015 market size downwardly revised
• Besi revenue growth rates exceeding assembly market over past three years
3.14.0
3.3 3.64.0 4.1
-21.9%
27.9%
-16.3%
10.0% 9.6%3.9%
-30%
-20%
-10%
0%
10%
20%
30%
40%
0.0
1.0
2.0
3.0
4.0
5.0
2013 2014 2015 2016E 2017E 2018E
(US
$ b
illi
on
s)
Assembly Equipment MarketMarket Size YoY Growth Rate
254.9
378.8 349.2
271.4 282.3
-6.9%
48.6%
-7.8%4.0%
-50%
0%
50%
100%
150%
0
100
200
300
400
2013 2014 2015 YTD 2015 YTD 2016
(€ m
illi
on
s)
Besi RevenueRevenue YoY Growth Rate
Source: VLSI September 2016
October 27, 2016 Page 17
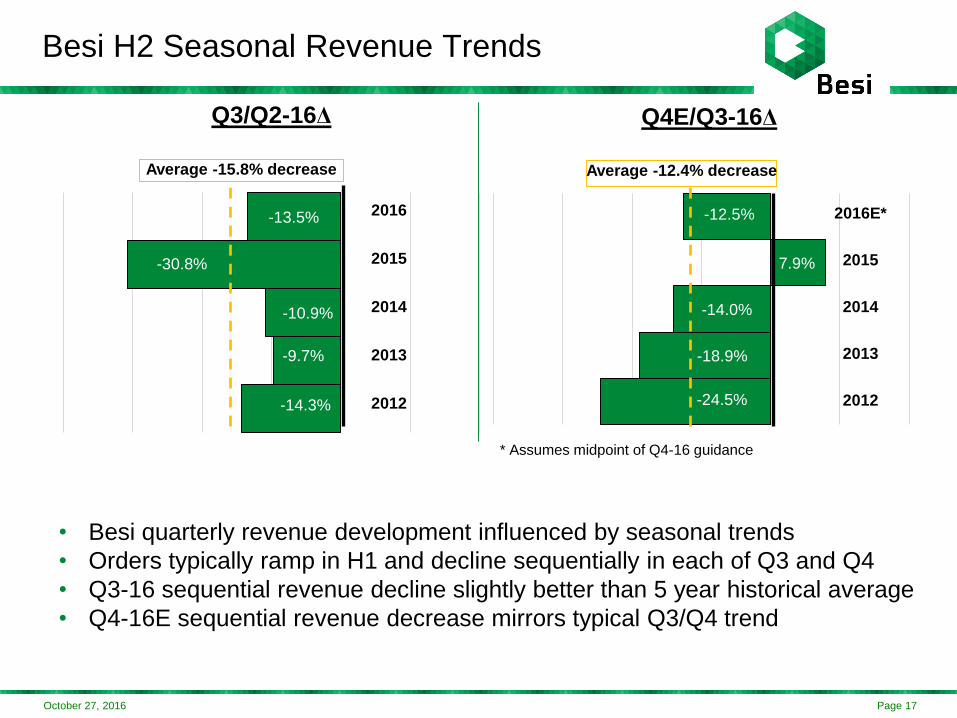
-14.3%
-9.7%
-10.9%
-30.8%
-13.5%
Q3/Q2-16Δ
-24.5%
-18.9%
-14.0%
7.9%
-12.5%
Q4E/Q3-16Δ
Average -12.4% decrease
Besi H2 Seasonal Revenue Trends
• Besi quarterly revenue development influenced by seasonal trends
• Orders typically ramp in H1 and decline sequentially in each of Q3 and Q4
• Q3-16 sequential revenue decline slightly better than 5 year historical average
• Q4-16E sequential revenue decrease mirrors typical Q3/Q4 trend
Average -15.8% decrease
2016E*
2015
2014
2013
2012
2016
2015
2014
2013
2012
* Assumes midpoint of Q4-16 guidance
October 27, 2016 Page 18
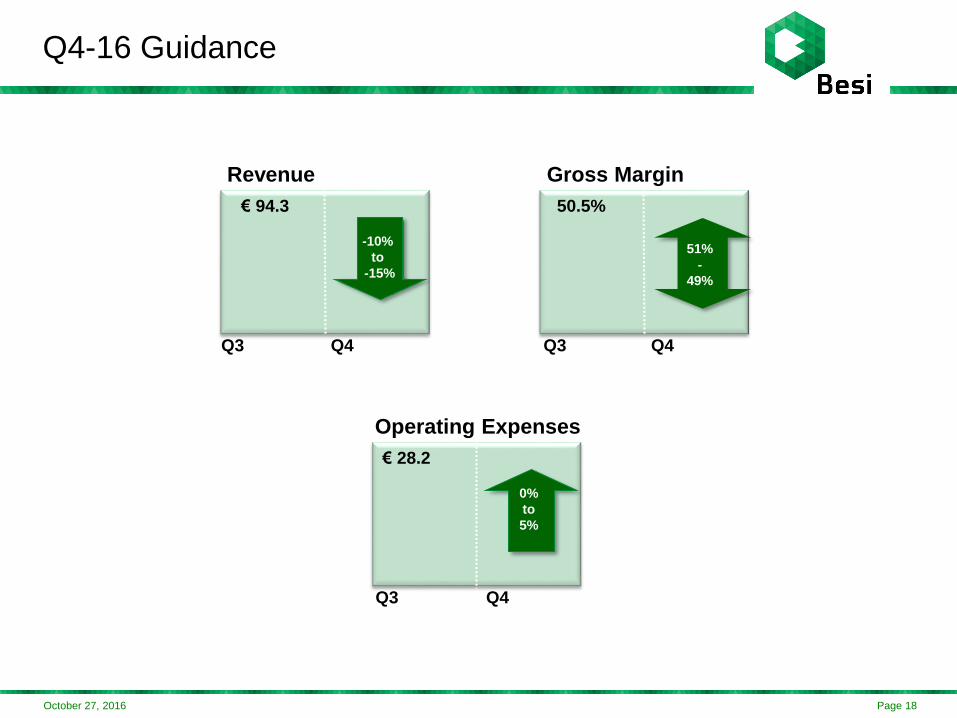
Q4-16 Guidance
Revenue Gross Margin
Operating Expenses
Q3 Q4 Q3 Q4
Q3 Q4
€ 94.3 50.5%
€ 28.2
51%
-
49%
-10%
to
-15%
0%
to
5%

October 27, 2016 Page 19
Financial Calendar
3-Nov-16 Roadshow New York, organized by KeplerCheuvreux
15-Nov-16 Roadshow Barcelona, organized by NIBC Markets
16-Nov-16 Morgan Stanley TMT Conference, Barcelona
24-Nov-16 Benelux Conference Kempen, London
8-Dec-16 ING Benelux Conference, New York
10/12-Jan-17 Needham Conference, New York