Investor Presentation
January 2018
“Full cycle, fully engaged”
Ken Woolner, P.Eng.President & CEO
ADVISORY REGARDING FORWARD‐LOOKING STATEMENTS
2
This presentation contains certain forward‐looking information and statements with respect to Velvet Energy Ltd. (“Velvet” or the “Company”), includingexpectations, beliefs, plans, goals, objectives, assumptions, information and statements about future events, conditions, results of operations,performance, Velvet’s planned capital expenditure program and the nature of the expenditures, drilling plans, expected drilling and completion costs,expected average production, the expected splits among crude oil, NGLs and natural gas, forecasted commodity prices and factors affecting natural gasprices, forecasted general and administrative expenses, interest expenses, revenue, operating income, operating netbacks, funds from operations andyear‐end bank debt, management’s assessment of future potential, including years of drilling inventory and expectations with respect to natural gasdemand and supply in North America.. These forward‐looking statements are based on assumptions and are subject to numerous risks and uncertainties,certain of which are beyond the Company’s control, including the impact of general economic conditions; industry conditions; volatility of commodityprices; currency exchange rates; imprecision of reserve estimates; environmental risks; competition from other explorers; stock market volatility; oil andnatural gas development and transportation; actions by governmental authorities, including changes in government regulation, royalties and taxation;dependence upon compressors, gathering lines, pipelines and other facilities, certain of which the Company does not control; shortage or lack ofavailable of pipeline capacity or other transportation facilities; weather conditions, natural disasters and fires; and ability to access sufficient capital. Wecaution that the foregoing list of risks and uncertainties is not exhaustive. The use of any of the words “anticipate”, “continue”, “estimate”, “expect”,“may”, “will”, “should”, “believe”, “plans”, and similar expressions are intended to identify forward‐looking information or statements
Statements relating to “reserves” or “resources” are deemed to be forward‐looking statements as they involve the implied assessment, based on currentestimates and assumptions that the reserves and resources can be profitably produced in the future. Readers are cautioned that disclosure of any welltest results is not necessarily indicative of long‐term performance.
Velvet’s actual results, performance or achievement could differ materially from those expressed or implied by these forward‐looking statements. Noassurance can be given that any events anticipated herein will transpire or occur and such forward‐looking statements included in this presentationshould not be unduly relied upon.
In addition, the reader is cautioned that historical results are not necessarily indicative of future performance. The forward‐looking statementscontained herein are made as of the date of this presentation and the Company does not intend, and does not assume any obligation, to update orrevise any forward‐looking statements, whether as a result of new information, future events or otherwise, unless expressly required by applicablesecurities laws.
Certain information set out herein may be considered as “financial outlook” within the meaning of applicable securities laws. The purpose of thisfinancial outlook is to provide readers with disclosure regarding Velvet’s reasonable expectations as to the anticipated results of its proposed businessactivities for the periods indicated. Readers are cautioned that the financial outlook may not be appropriate for other purposes.
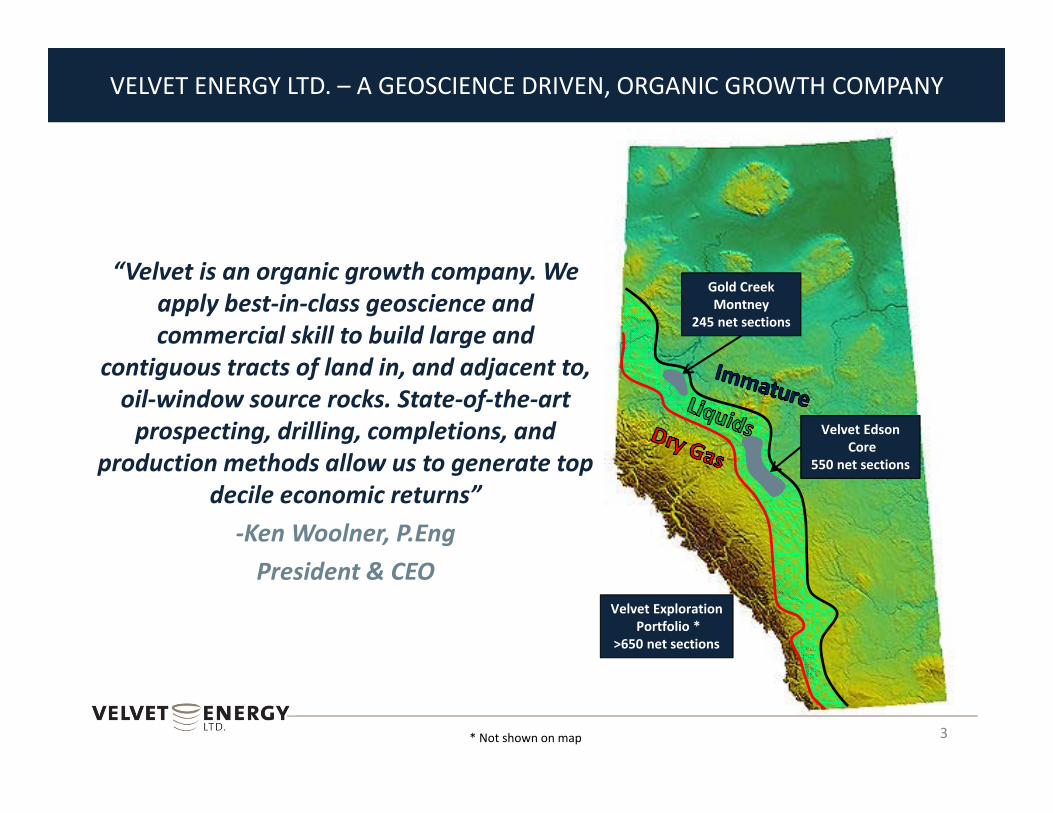
VELVET ENERGY LTD. – A GEOSCIENCE DRIVEN, ORGANIC GROWTH COMPANY
3
“Velvet is an organic growth company. We apply best‐in‐class geoscience and commercial skill to build large and
contiguous tracts of land in, and adjacent to, oil‐window source rocks. State‐of‐the‐art prospecting, drilling, completions, and
production methods allow us to generate top decile economic returns”
‐Ken Woolner, P.EngPresident & CEO
Velvet EdsonCore
550 net sections
Gold CreekMontney
245 net sections
Velvet ExplorationPortfolio *
>650 net sections
* Not shown on map
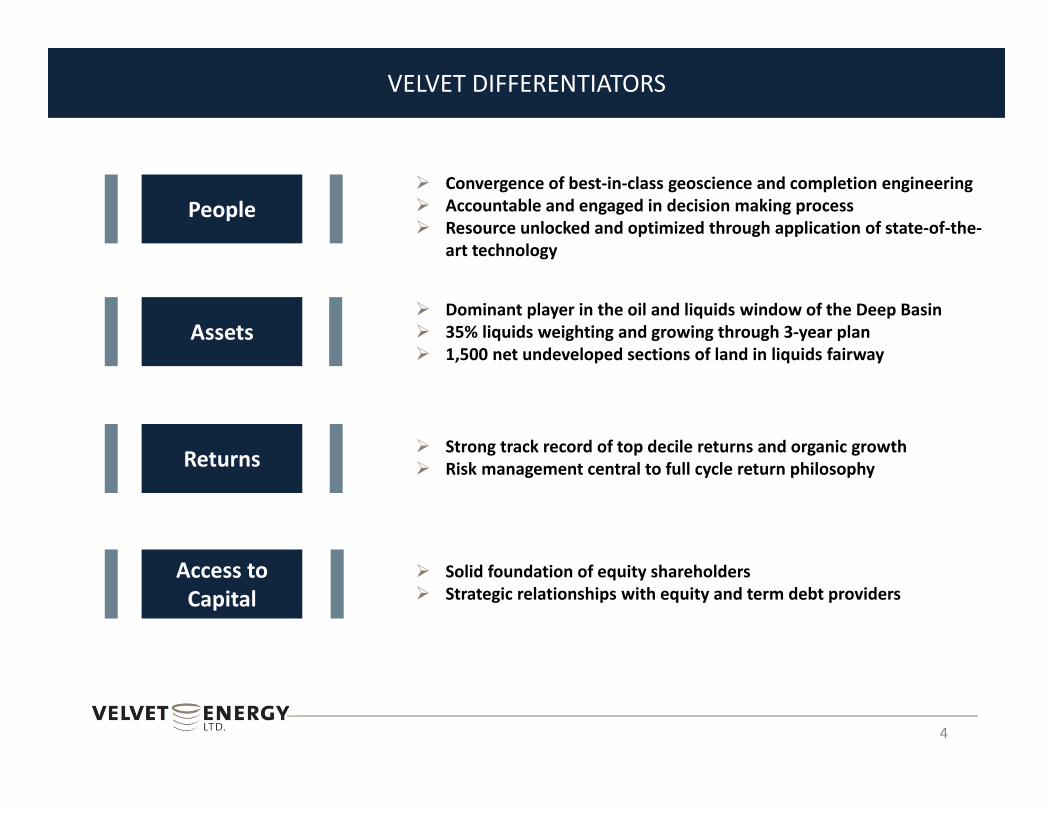
VELVET DIFFERENTIATORS
4
Convergence of best‐in‐class geoscience and completion engineering Accountable and engaged in decision making process Resource unlocked and optimized through application of state‐of‐the‐
art technology
People
Assets
Returns
Access to Capital
Dominant player in the oil and liquids window of the Deep Basin 35% liquids weighting and growing through 3‐year plan 1,500 net undeveloped sections of land in liquids fairway
Strong track record of top decile returns and organic growth Risk management central to full cycle return philosophy
Solid foundation of equity shareholders Strategic relationships with equity and term debt providers
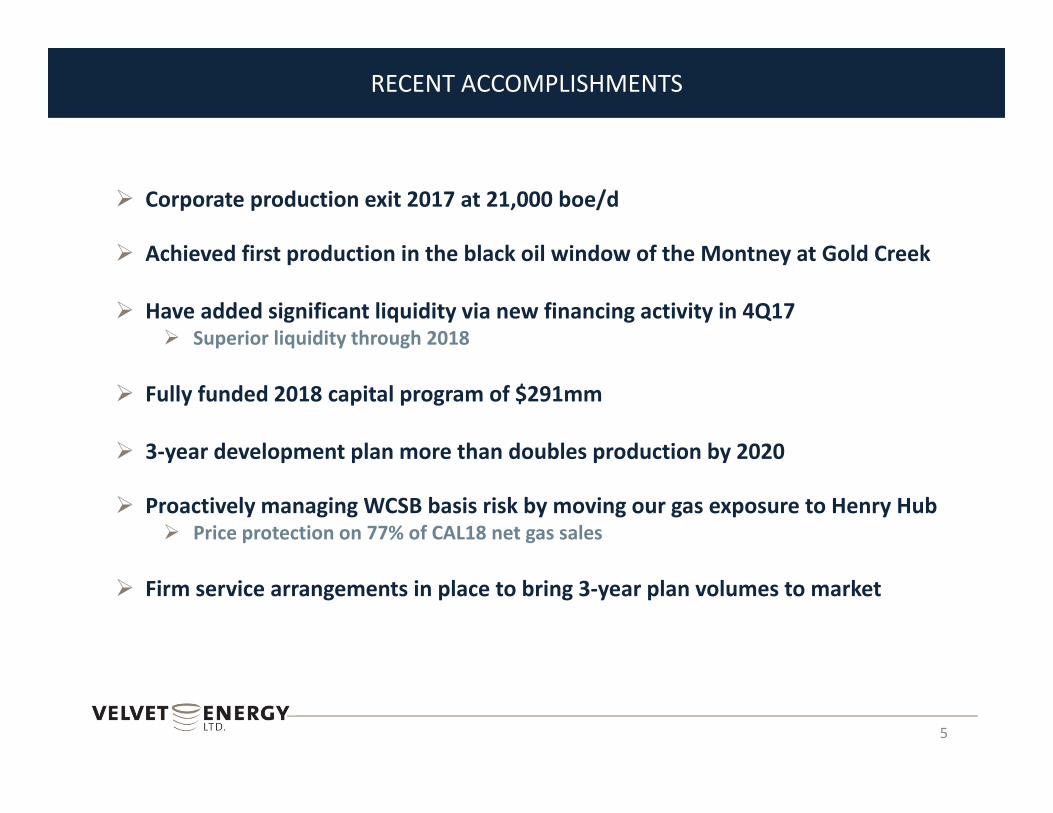
RECENT ACCOMPLISHMENTS
5
Corporate production exit 2017 at 21,000 boe/d
Achieved first production in the black oil window of the Montney at Gold Creek
Have added significant liquidity via new financing activity in 4Q17 Superior liquidity through 2018
Fully funded 2018 capital program of $291mm
3‐year development plan more than doubles production by 2020
Proactively managing WCSB basis risk by moving our gas exposure to Henry Hub Price protection on 77% of CAL18 net gas sales
Firm service arrangements in place to bring 3‐year plan volumes to market
MANAGEMENT & DIRECTORS
6
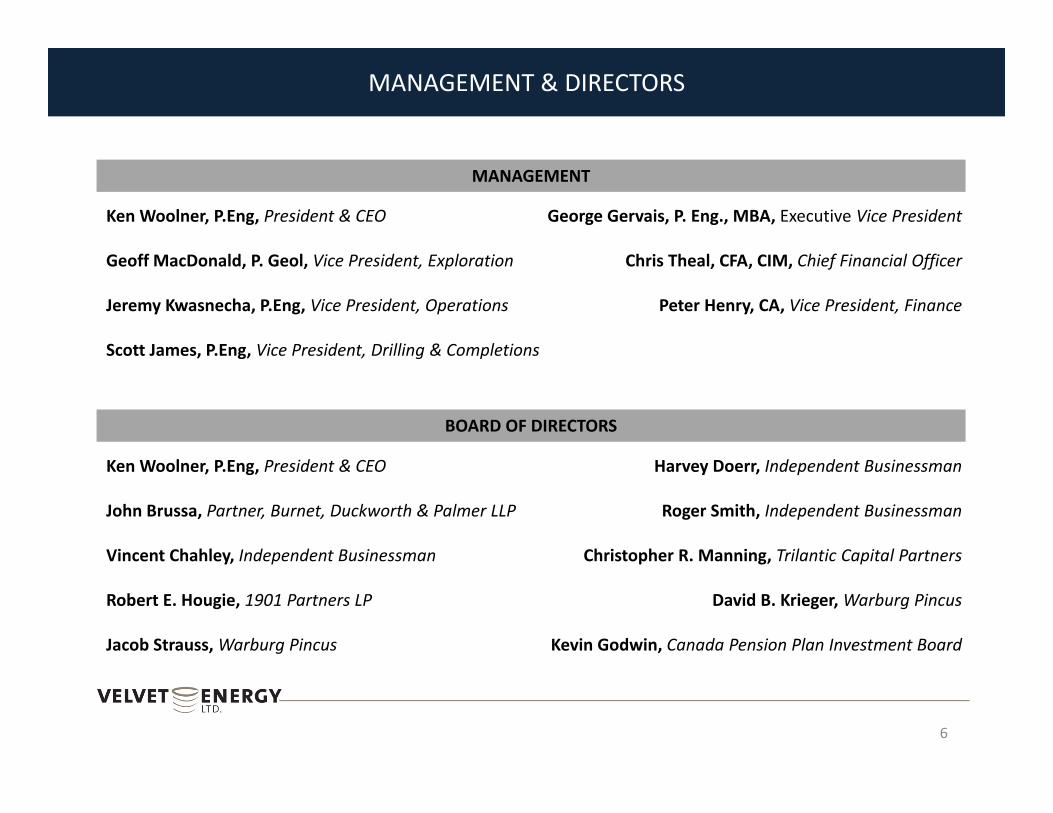
Ken Woolner, P.Eng, President & CEO
Geoff MacDonald, P. Geol, Vice President, Exploration
Jeremy Kwasnecha, P.Eng, Vice President, Operations
Scott James, P.Eng, Vice President, Drilling & Completions
George Gervais, P. Eng., MBA, Executive Vice President
Chris Theal, CFA, CIM, Chief Financial Officer
Peter Henry, CA, Vice President, Finance
Ken Woolner, P.Eng, President & CEO
John Brussa, Partner, Burnet, Duckworth & Palmer LLP
Vincent Chahley, Independent Businessman
Robert E. Hougie, 1901 Partners LP
Jacob Strauss, Warburg Pincus
Harvey Doerr, Independent Businessman
Roger Smith, Independent Businessman
Christopher R. Manning, Trilantic Capital Partners
David B. Krieger, Warburg Pincus
Kevin Godwin, Canada Pension Plan Investment Board
MANAGEMENT
BOARD OF DIRECTORS
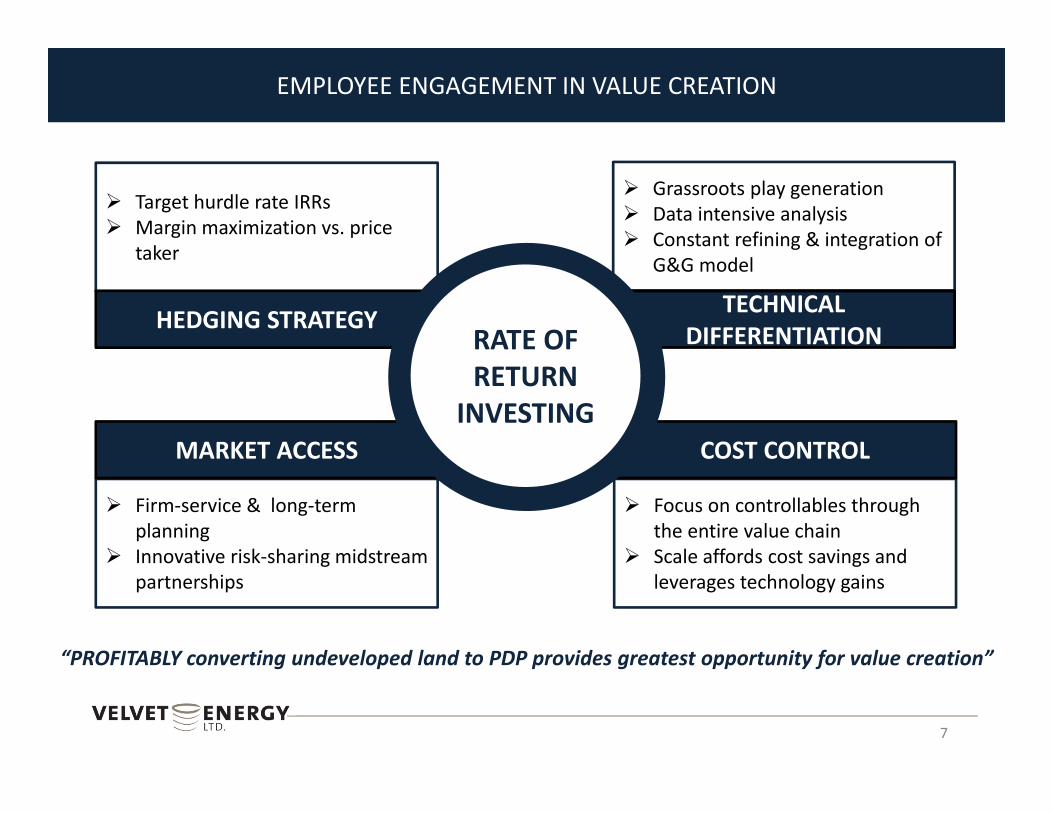
Firm‐service & long‐term planning
Innovative risk‐sharing midstream partnerships
Focus on controllables through the entire value chain
Scale affords cost savings and leverages technology gains
Grassroots play generation Data intensive analysis Constant refining & integration of
G&G model
Target hurdle rate IRRs Margin maximization vs. price
taker
EMPLOYEE ENGAGEMENT IN VALUE CREATION
7
“PROFITABLY converting undeveloped land to PDP provides greatest opportunity for value creation”
TECHNICAL DIFFERENTIATION
MARKET ACCESS COST CONTROL
HEDGING STRATEGYRATE OF RETURN
INVESTING
10.0%
12.0%
14.0%
16.0%
18.0%
20.0%
22.0%
24.0%
‐ 10.00 20.00 30.00 40.00 50.00 60.00 70.00 80.00 90.00 100.00
CFRO
I (%)
Average Annual WTI Oil Price (US$/bbl)
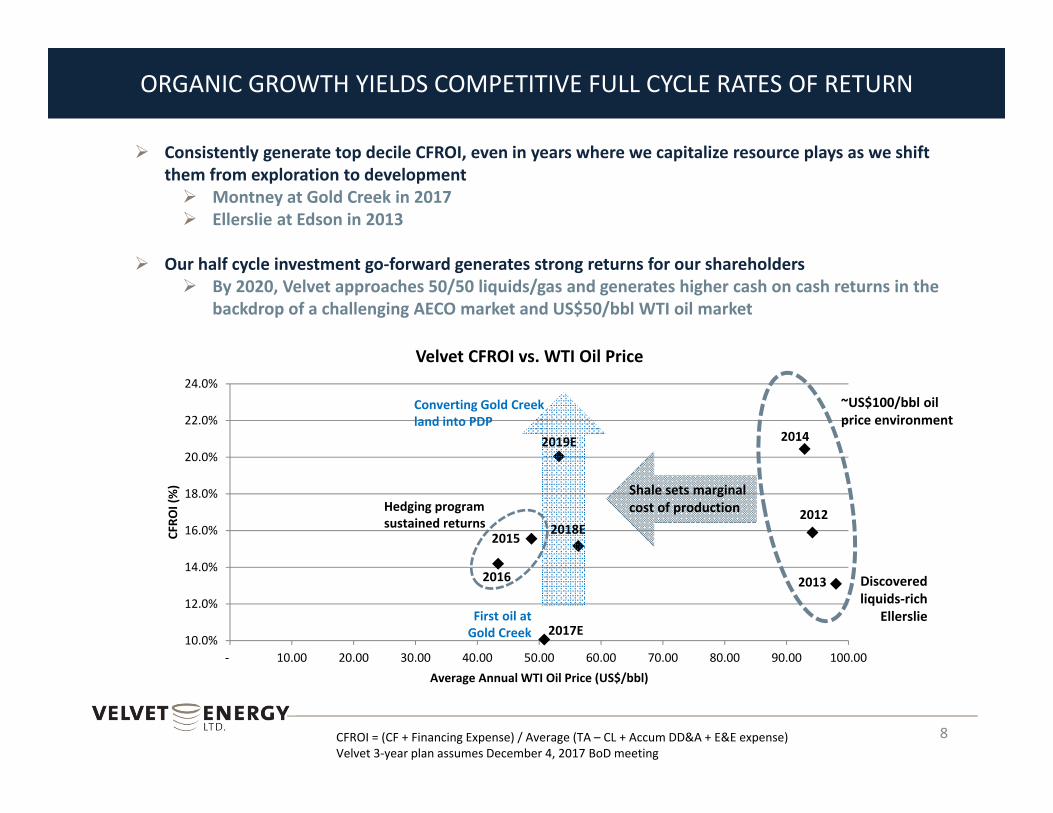
Velvet CFROI vs. WTI Oil Price
ORGANIC GROWTH YIELDS COMPETITIVE FULL CYCLE RATES OF RETURN
8
Consistently generate top decile CFROI, even in years where we capitalize resource plays as we shift them from exploration to development Montney at Gold Creek in 2017 Ellerslie at Edson in 2013
Our half cycle investment go‐forward generates strong returns for our shareholders By 2020, Velvet approaches 50/50 liquids/gas and generates higher cash on cash returns in the
backdrop of a challenging AECO market and US$50/bbl WTI oil market
2014
2012
20132016
2019E
2018E2015
2017E
~US$100/bbl oil price environment
CFROI = (CF + Financing Expense) / Average (TA – CL + Accum DD&A + E&E expense)Velvet 3‐year plan assumes December 4, 2017 BoD meeting
Shale sets marginalcost of productionHedging program
sustained returns
Converting Gold Creekland into PDP
Discovered liquids‐rich
EllerslieFirst oil at Gold Creek
TRACK RECORD OF ORGANIC GROWTH
9
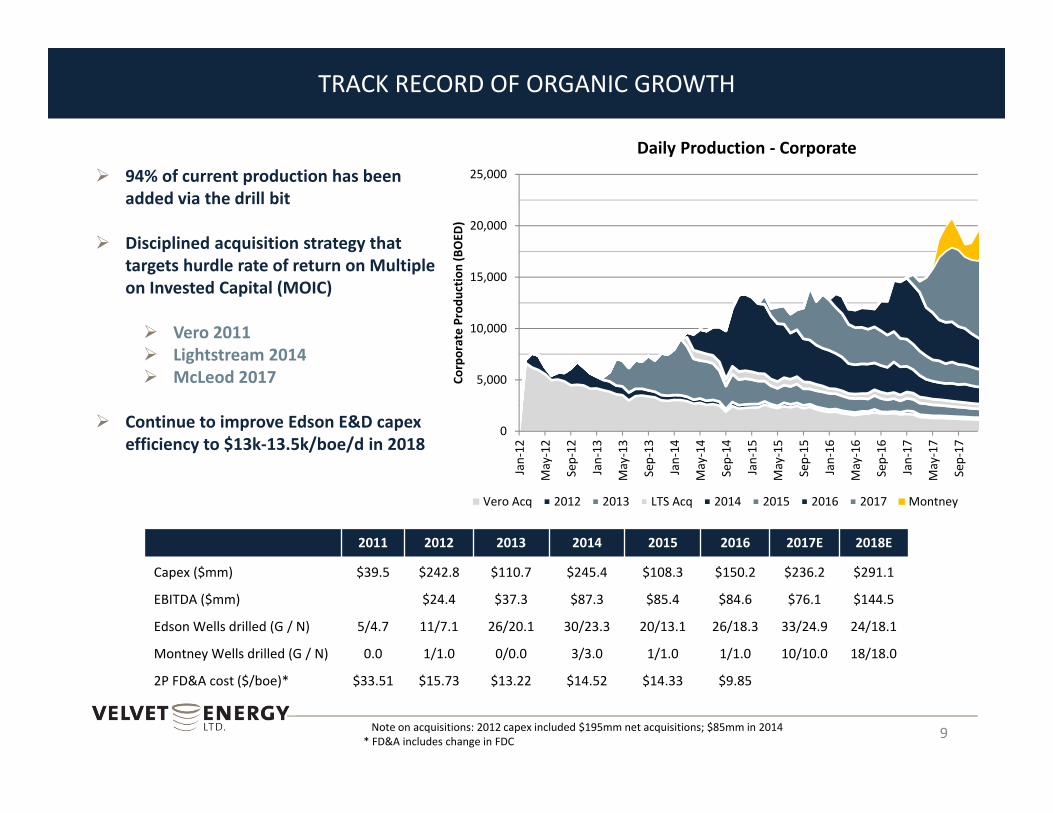
94% of current production has been added via the drill bit
Disciplined acquisition strategy that targets hurdle rate of return on Multiple on Invested Capital (MOIC)
Vero 2011 Lightstream 2014 McLeod 2017
Continue to improve Edson E&D capex efficiency to $13k‐13.5k/boe/d in 2018
Daily Production ‐ Corporate
2011 2012 2013 2014 2015 2016 2017E 2018E
Capex ($mm) $39.5 $242.8 $110.7 $245.4 $108.3 $150.2 $236.2 $291.1
EBITDA ($mm) $24.4 $37.3 $87.3 $85.4 $84.6 $76.1 $144.5
Edson Wells drilled (G / N) 5/4.7 11/7.1 26/20.1 30/23.3 20/13.1 26/18.3 33/24.9 24/18.1
Montney Wells drilled (G / N) 0.0 1/1.0 0/0.0 3/3.0 1/1.0 1/1.0 10/10.0 18/18.0
2P FD&A cost ($/boe)* $33.51 $15.73 $13.22 $14.52 $14.33 $9.85
Note on acquisitions: 2012 capex included $195mm net acquisitions; $85mm in 2014* FD&A includes change in FDC
0
5,000
10,000
15,000
20,000
25,000
Jan‐12
May‐12
Sep‐12
Jan‐13
May‐13
Sep‐13
Jan‐14
May‐14
Sep‐14
Jan‐15
May‐15
Sep‐15
Jan‐16
May‐16
Sep‐16
Jan‐17
May‐17
Sep‐17
Corporate Prod
uctio
n (BOED
)
Vero Acq 2012 2013 LTS Acq 2014 2015 2016 2017 Montney
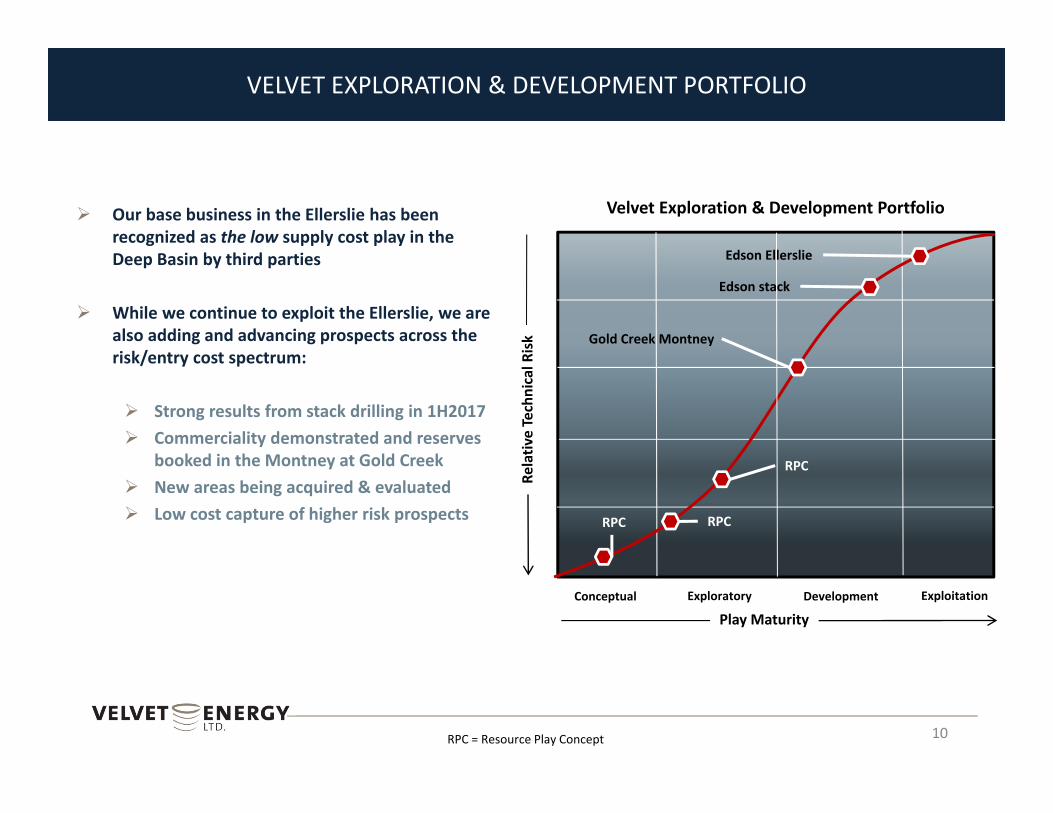
VELVET EXPLORATION & DEVELOPMENT PORTFOLIO
Our base business in the Ellerslie has been recognized as the low supply cost play in the Deep Basin by third parties
While we continue to exploit the Ellerslie, we are also adding and advancing prospects across the risk/entry cost spectrum:
Strong results from stack drilling in 1H2017 Commerciality demonstrated and reserves
booked in the Montney at Gold Creek New areas being acquired & evaluated Low cost capture of higher risk prospects
10
Velvet Exploration & Development Portfolio
Conceptual Exploratory Development Exploitation
Play Maturity
Edson Ellerslie
Relativ
e Technical R
isk Gold Creek Montney
RPC
RPC
RPC
RPC = Resource Play Concept
Edson stack
Gold Creek Montney ‐Unlocking the Light Oil Window
11
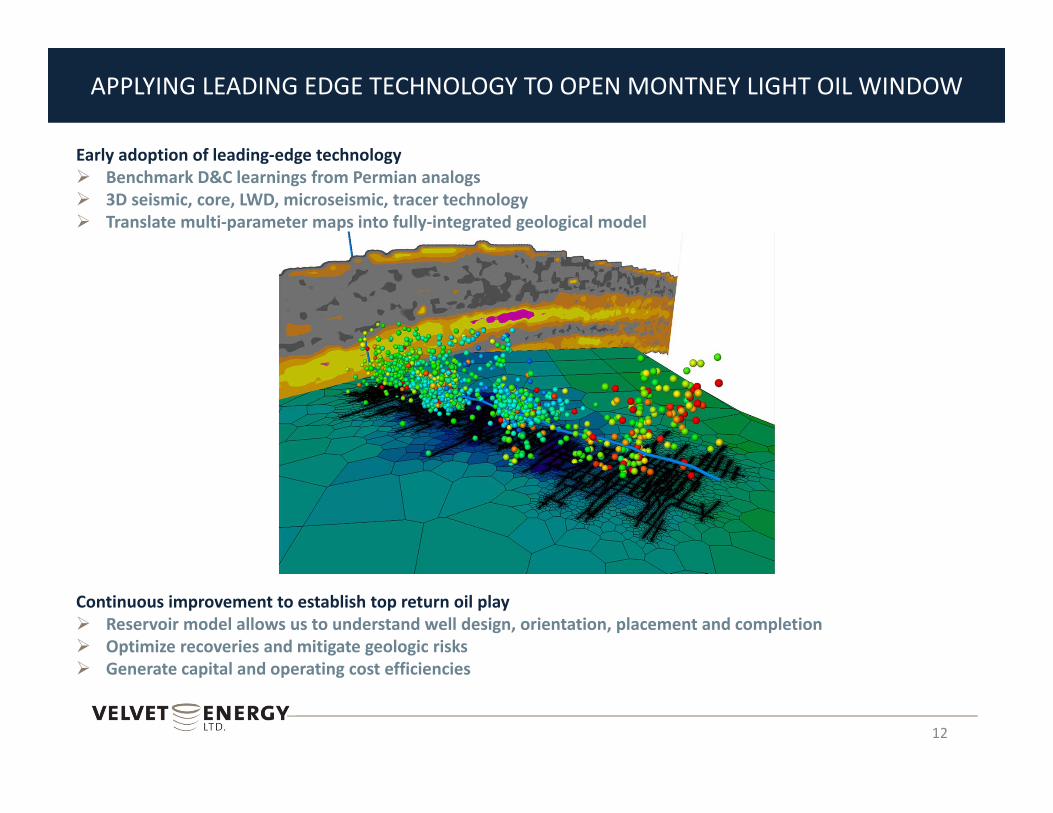
APPLYING LEADING EDGE TECHNOLOGY TO OPEN MONTNEY LIGHT OIL WINDOW
12
Early adoption of leading‐edge technology Benchmark D&C learnings from Permian analogs 3D seismic, core, LWD, microseismic, tracer technology Translate multi‐parameter maps into fully‐integrated geological model
Continuous improvement to establish top return oil play Reservoir model allows us to understand well design, orientation, placement and completion Optimize recoveries and mitigate geologic risks Generate capital and operating cost efficiencies
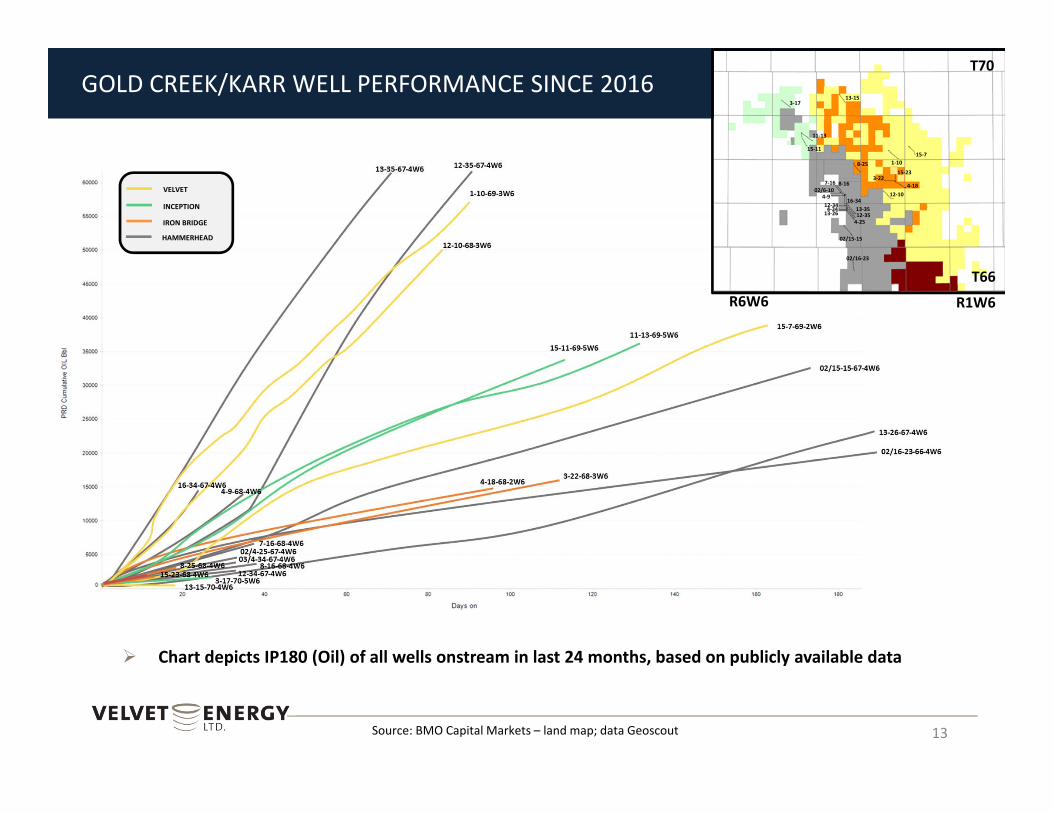
VELVET
INCEPTION
IRON BRIDGE
HAMMERHEAD
GOLD CREEK/KARR WELL PERFORMANCE SINCE 2016
Chart depicts IP180 (Oil) of all wells onstream in last 24 months, based on publicly available data
13
02/15‐15
12‐10
15‐71‐10
13‐15
11‐13
15‐11
3‐17
8‐25
4‐183‐22
8‐167‐16
4‐9
13‐26
15‐23
02/16‐23
02/6‐10
12‐344‐34 13‐35
12‐354‐25
16‐34
T66
T70
R1W6R6W6
Source: BMO Capital Markets – land map; data Geoscout
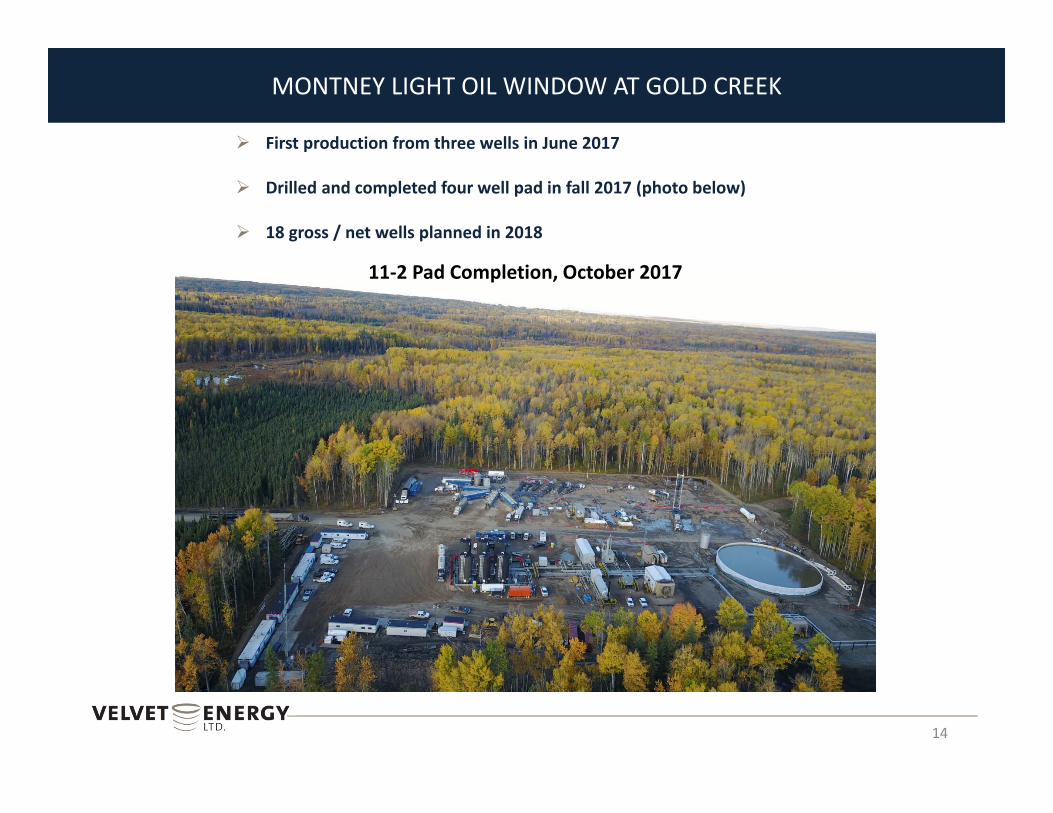
MONTNEY LIGHT OIL WINDOW AT GOLD CREEK
14
First production from three wells in June 2017
Drilled and completed four well pad in fall 2017 (photo below)
18 gross / net wells planned in 2018
11‐2 Pad Completion, October 2017
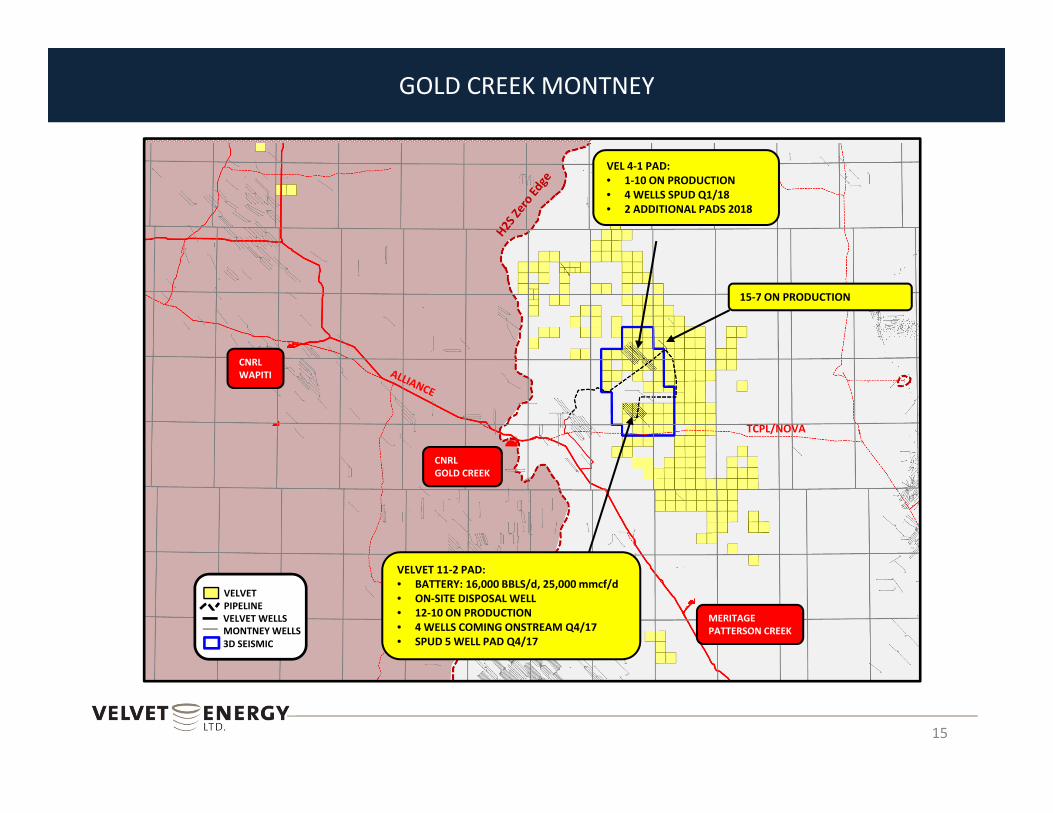
GOLD CREEK MONTNEY
15
TCPL/NOVA
MERITAGEPATTERSON CREEK
VELVET 11‐2 PAD:• BATTERY: 16,000 BBLS/d, 25,000 mmcf/d• ON‐SITE DISPOSAL WELL• 12‐10 ON PRODUCTION• 4 WELLS COMING ONSTREAM Q4/17• SPUD 5 WELL PAD Q4/17
VEL 4‐1 PAD:• 1‐10 ON PRODUCTION• 4 WELLS SPUD Q1/18• 2 ADDITIONAL PADS 2018
15‐7 ON PRODUCTION
CNRL GOLD CREEK
CNRL WAPITI
VELVET
3D SEISMIC
PIPELINEVELVET WELLSMONTNEY WELLS
Edson Ellerslie Hybrid Resource Play –Transitioning our High Return Base Business to FCF Generator
16
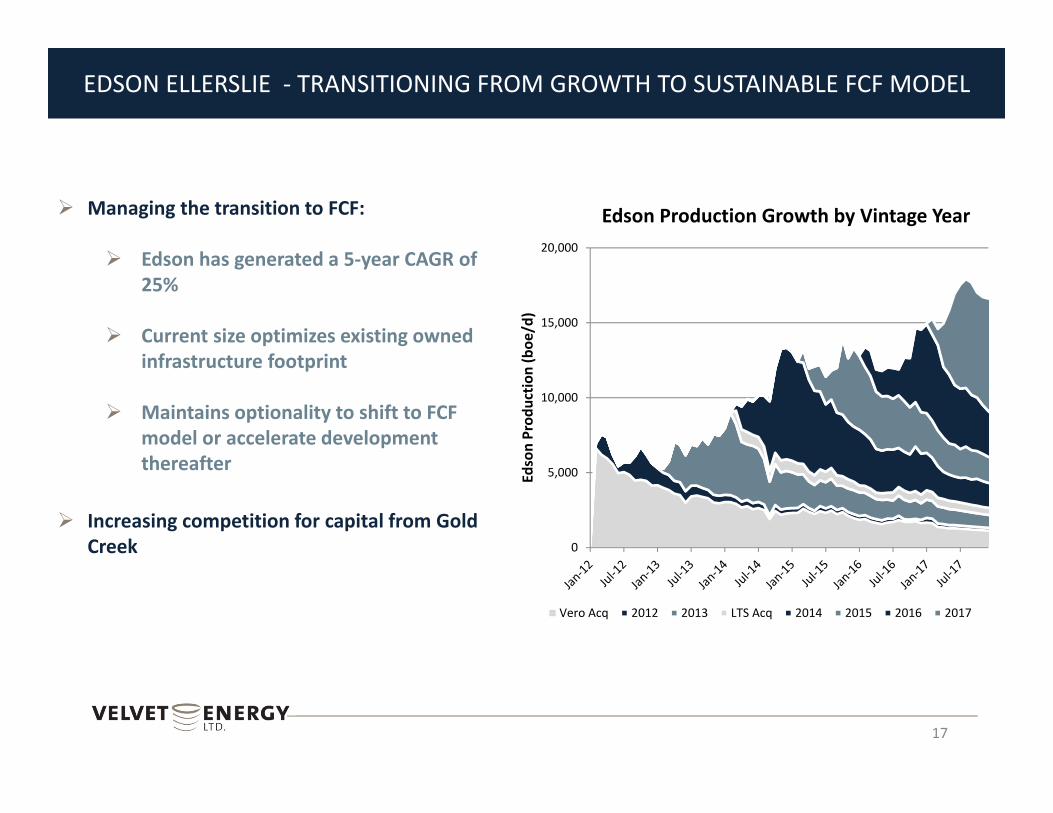
EDSON ELLERSLIE ‐ TRANSITIONING FROM GROWTH TO SUSTAINABLE FCF MODEL
17
Managing the transition to FCF:
Edson has generated a 5‐year CAGR of 25%
Current size optimizes existing owned infrastructure footprint
Maintains optionality to shift to FCF model or accelerate development thereafter
Increasing competition for capital from Gold Creek
Edson Production Growth by Vintage Year
0
5,000
10,000
15,000
20,000
Edson Prod
uctio
n (boe
/d)
Vero Acq 2012 2013 LTS Acq 2014 2015 2016 2017
EDSON FIELD FREE CASH FLOW PROFILE
18
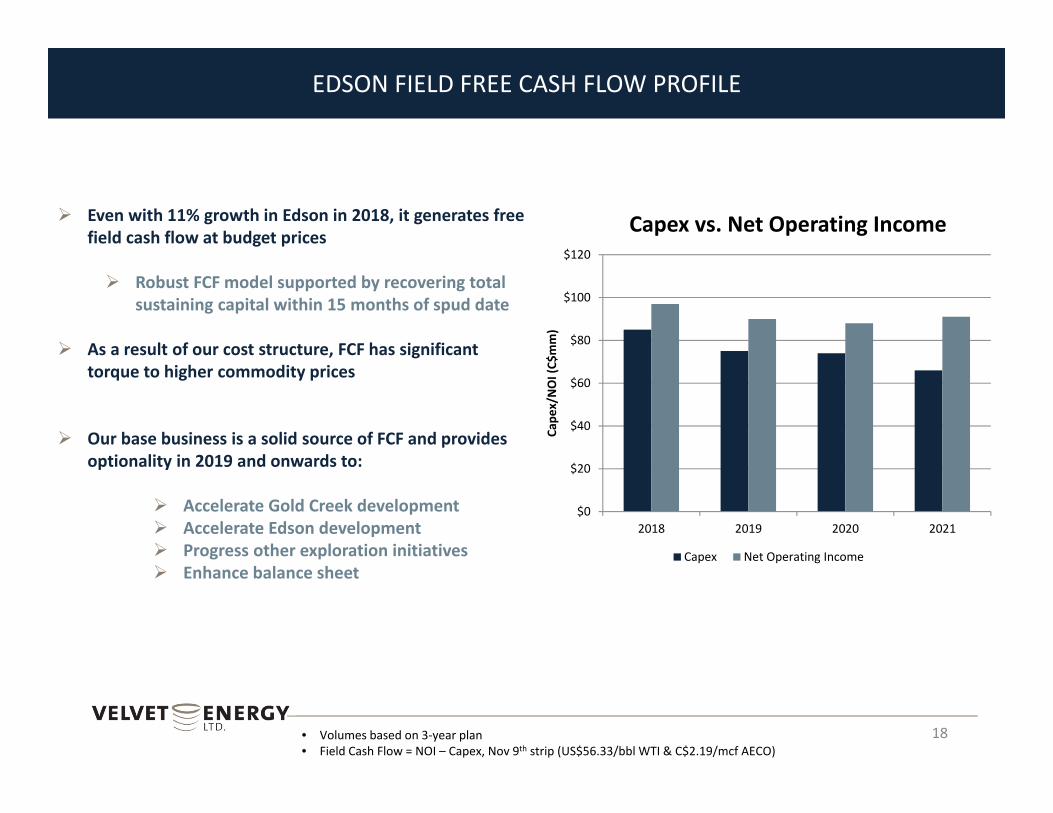
Even with 11% growth in Edson in 2018, it generates free field cash flow at budget prices
Robust FCF model supported by recovering total sustaining capital within 15 months of spud date
As a result of our cost structure, FCF has significant torque to higher commodity prices
Our base business is a solid source of FCF and provides optionality in 2019 and onwards to:
Accelerate Gold Creek development Accelerate Edson development Progress other exploration initiatives Enhance balance sheet
• Volumes based on 3‐year plan• Field Cash Flow = NOI – Capex, Nov 9th strip (US$56.33/bbl WTI & C$2.19/mcf AECO)
$0
$20
$40
$60
$80
$100
$120
2018 2019 2020 2021
Cape
x/NOI (C$
mm)
Capex vs. Net Operating Income
Capex Net Operating Income
0.0%
25.0%
50.0%
75.0%
100.0%
125.0%
1 2 3 4 5 6 7 8 9 10 11 12 13 14 15 16 17 18 19 20 21 22 23 24
% of D
CET Ca
pital R
ecovered
Time from Spud (months)
$3,150
$3,370
$2,366
$142 $861
$‐
$500
$1,000
$1,500
$2,000
$2,500
$3,000
$3,500
$4,000
DCET Revenue Royalties OperatingCosts
Year 1 NetOperatingIncome
C$mm
QUICK ELLERSLIE PAYOUTS PROVIDE SOLID BASE FOR FCF GENERATION
19
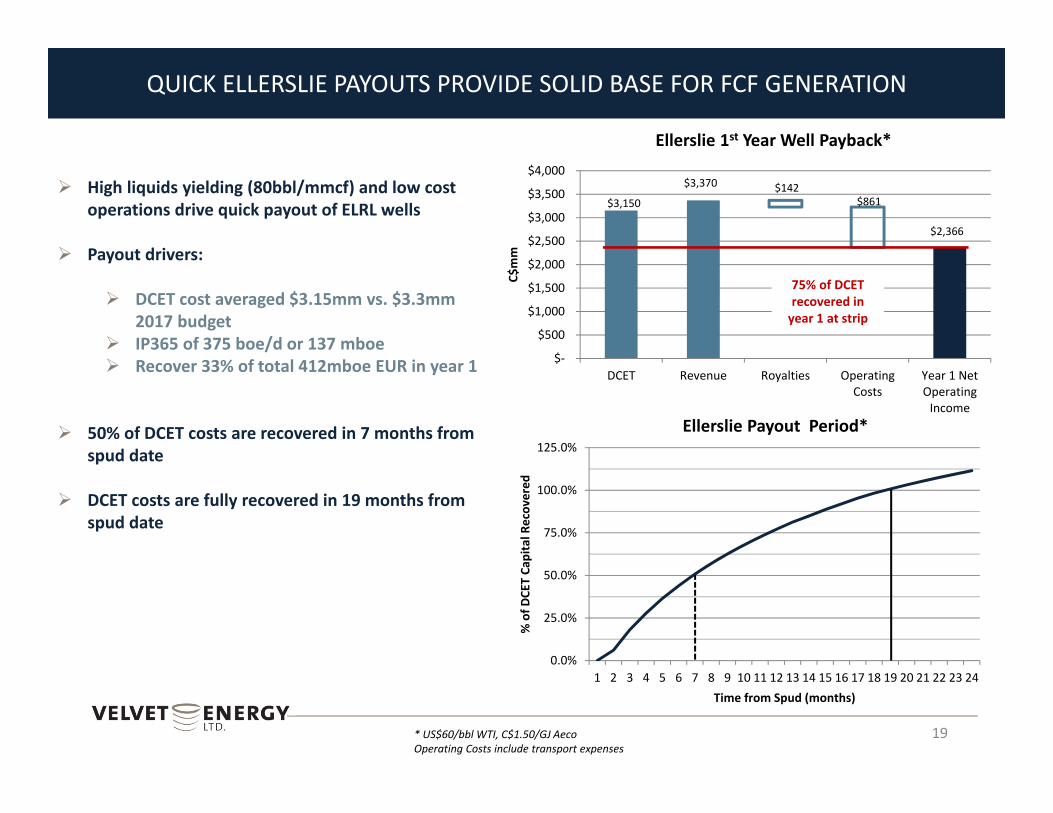
High liquids yielding (80bbl/mmcf) and low cost operations drive quick payout of ELRL wells
Payout drivers:
DCET cost averaged $3.15mm vs. $3.3mm 2017 budget
IP365 of 375 boe/d or 137 mboe Recover 33% of total 412mboe EUR in year 1
50% of DCET costs are recovered in 7 months from spud date
DCET costs are fully recovered in 19 months from spud date
Ellerslie 1st Year Well Payback*
* US$60/bbl WTI, C$1.50/GJ AecoOperating Costs include transport expenses
Ellerslie Payout Period*
75% of DCET recovered in year 1 at strip
EDSON DEPTH OF INVENTORY
20
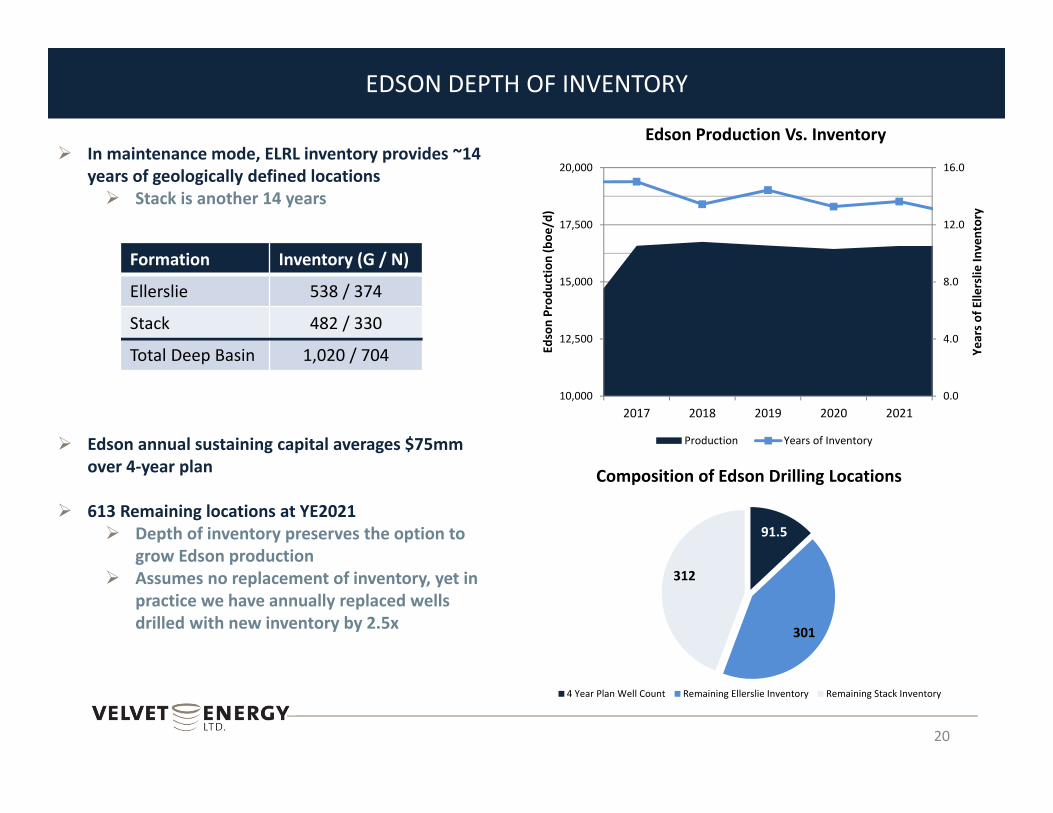
In maintenance mode, ELRL inventory provides ~14 years of geologically defined locations Stack is another 14 years
Edson annual sustaining capital averages $75mm over 4‐year plan
613 Remaining locations at YE2021 Depth of inventory preserves the option to
grow Edson production Assumes no replacement of inventory, yet in
practice we have annually replaced wells drilled with new inventory by 2.5x
Formation Inventory (G / N)
Ellerslie 538 / 374
Stack 482 / 330
Total Deep Basin 1,020 / 704
Edson Production Vs. Inventory
91.5
301
312
4 Year Plan Well Count Remaining Ellerslie Inventory Remaining Stack Inventory
0.0
4.0
8.0
12.0
16.0
10,000
12,500
15,000
17,500
20,000
2017 2018 2019 2020 2021
Years o
f Ellerslie
Inventory
Edson Prod
uctio
n (boe
/d)
Production Years of Inventory
Composition of Edson Drilling Locations

Corporate highlights
21
0%
10%
20%
30%
40%
50%
60%
70%
80%
90%
100%
‐
5.00
10.00
15.00
20.00
25.00
PEY
AAV
TOU
PONY
BIR
BNP
SRX CR VEL
ARX
PNE
ERF
IKM VII
TVE
RMP
TVL
CQE
VET
WCP BTE
ATU
RRX
NVA LXE
KEL
BNE
POU
JOY
TOG
DEE
CPG
SGY
OBE GXE
MQX
SPE CJ
Liqu
ids W
eight (%)
2018
E Ope
x + Tp
ort ($/bo
e)
Opex + Tport ($/boe) Liquids (%)
PEER GROUP OPEX + TRANSPORTATION COST – 2018E
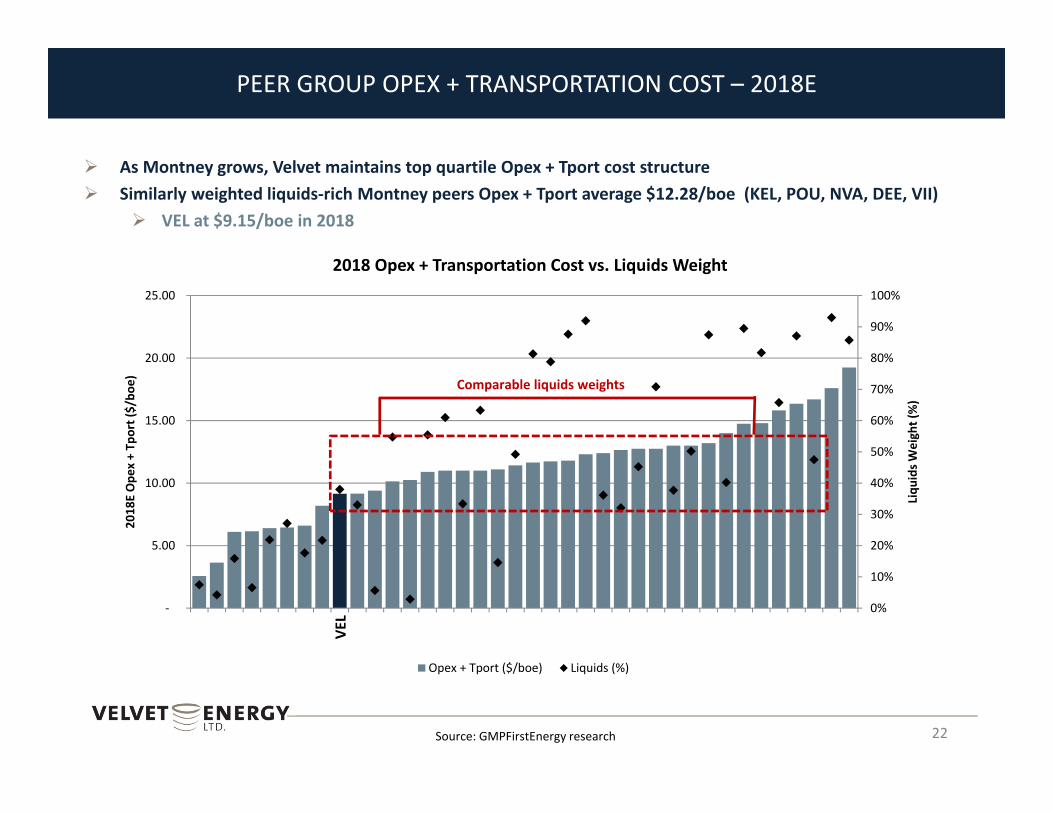
As Montney grows, Velvet maintains top quartile Opex + Tport cost structure Similarly weighted liquids‐rich Montney peers Opex + Tport average $12.28/boe (KEL, POU, NVA, DEE, VII)
VEL at $9.15/boe in 2018
22
2018 Opex + Transportation Cost vs. Liquids Weight
Source: GMPFirstEnergy research
Comparable liquids weights
VEL
SUPERIOR LIQUIDITY – EXTENDED DEBT MATURITY ENHANCES FINANCIAL FLEXIBILITY
23
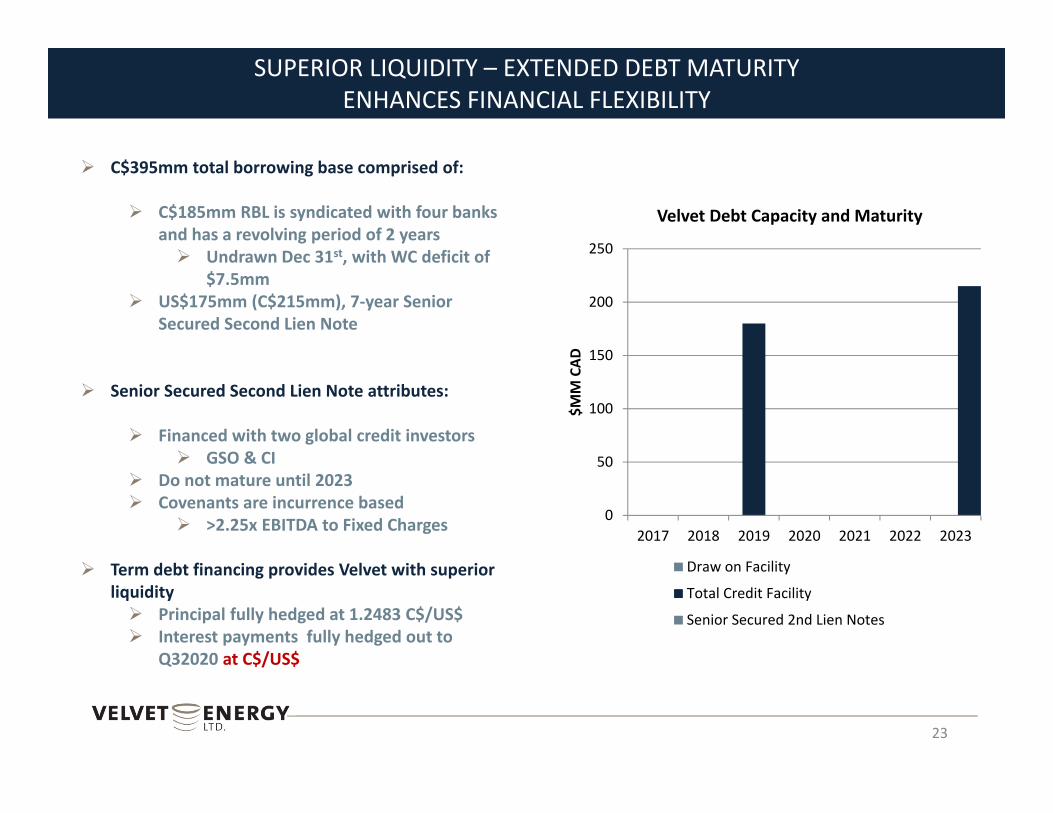
C$395mm total borrowing base comprised of:
C$185mm RBL is syndicated with four banks and has a revolving period of 2 years Undrawn Dec 31st, with WC deficit of
$7.5mm US$175mm (C$215mm), 7‐year Senior
Secured Second Lien Note
Senior Secured Second Lien Note attributes:
Financed with two global credit investors GSO & CI
Do not mature until 2023 Covenants are incurrence based
>2.25x EBITDA to Fixed Charges
Term debt financing provides Velvet with superior liquidity Principal fully hedged at 1.2483 C$/US$ Interest payments fully hedged out to
Q32020 at C$/US$
Velvet Debt Capacity and Maturity
0
50
100
150
200
250
2017 2018 2019 2020 2021 2022 2023
$MM CAD
Draw on Facility
Total Credit Facility
Senior Secured 2nd Lien Notes
RISK MANAGEMENT OVERVIEW: POLICY AND MANDATE
24
HEDGING PHILOSOPHY AND MANDATE:
The financial risk management mandate is to enable the effective execution of business and financing activities in the interest of Velvet’s stakeholders and partners by managing an active hedging program to mitigate price risks that achieves the following objectives
1) Protecting value and returns Protect PDP lending value Support rate of return thresholds
2) Supporting the execution of the business Near term budgets and long‐term plans Execution of top tier profitable growth Acquisitions and development commitments
3) Protect against adverse price movements and constraints Be adaptive to changing business and market conditions Diversify exposure in the interest of reducing risk
RISK MANAGEMENT OVERVIEW: 2018 SUMMARY
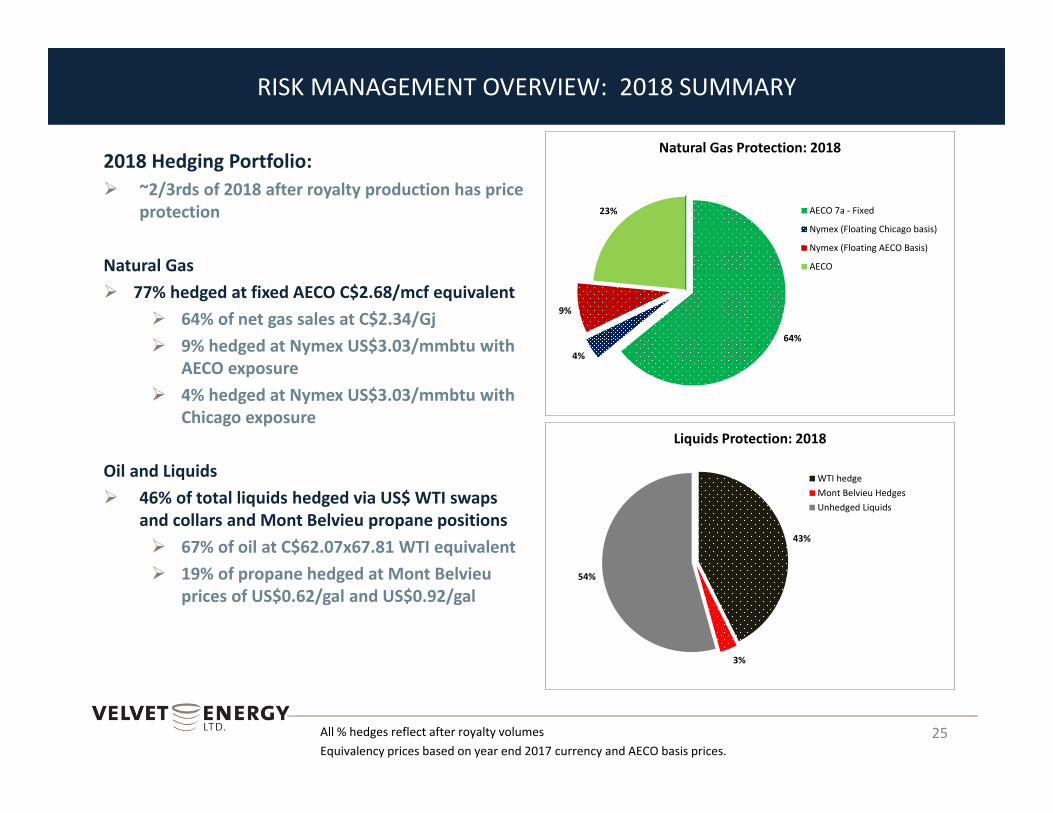
25All % hedges reflect after royalty volumesEquivalency prices based on year end 2017 currency and AECO basis prices.
64%
4%
9%
23%
Natural Gas Protection: 2018
AECO 7a ‐ Fixed
Nymex (Floating Chicago basis)
Nymex (Floating AECO Basis)
AECO
43%
3%
54%
Liquids Protection: 2018
WTI hedgeMont Belvieu HedgesUnhedged Liquids
2018 Hedging Portfolio: ~2/3rds of 2018 after royalty production has price
protection
Natural Gas 77% hedged at fixed AECO C$2.68/mcf equivalent
64% of net gas sales at C$2.34/Gj 9% hedged at Nymex US$3.03/mmbtu with
AECO exposure 4% hedged at Nymex US$3.03/mmbtu with
Chicago exposure
Oil and Liquids 46% of total liquids hedged via US$ WTI swaps
and collars and Mont Belvieu propane positions 67% of oil at C$62.07x67.81 WTI equivalent 19% of propane hedged at Mont Belvieu
prices of US$0.62/gal and US$0.92/gal
CORPORATE INFORMATION
26
AuditorsPricewaterhouseCoopers, LLPReservoir EngineersGLJ Petroleum ConsultantsMcDaniel & Associates Consultants Ltd.BankersCanadian Imperial Bank of CommerceRoyal Bank of CanadaBank of MontrealThe Toronto‐Dominion BankSolicitorsBurnet, Duckworth & Palmer LLP
Velvet Energy Ltd.1500, 308 4th Avenue SWCalgary, AB T2P 0H7
P: 403.781.9125
Investor contacts:
Ken Woolner, President & CEO403.781.9134
Chris Theal, Chief Financial Officer403.781.9162
www.velvetenergy.ca


![AkzoNobel Dulux Velvet Touch Emulsion€¦ · Dulux Dulux Dulux h Velvet TOUCh Velvet Touch DIAMOND PLATINUM GLO FINISH PEARL GLO FIN] NEW& IMPROVED rÅkZON0bel Dulux Velvet Touch](https://static.cupdf.com/doc/110x72/61481ebecee6357ef92525b0/akzonobel-dulux-velvet-touch-emulsion-dulux-dulux-dulux-h-velvet-touch-velvet-touch.jpg)


![AkzoNobel Dulux Velvet Touch Emulsion… · PEARL GLO FIN] NEW& IMPROVED rÅkZON0bel Dulux Velvet Touch zoNobel DUIux Velvet PEARL GLO FINISH _ NEW&. IMPROVED Dulux Velvet Touch DIAMOND](https://static.cupdf.com/doc/110x72/60a4cc2c64ba681d2238fa1f/akzonobel-dulux-velvet-touch-emulsion-pearl-glo-fin-new-improved-rkzon0bel.jpg)