I N V E S T I N G I N K E N Y A ’ S A G R I C U L T U R A L S E C T O R T R A N S F O R M A T I O N
2 0 1 9 - 2 0 2 4
N A T I O N A L A G R I C U L T U R E I N V E S T M E N T P L A N ( N A I P )
T O W A R D S S U S T A I N A B L E A G R I C U LT U R A L T R A N S F O R M A T I O N a n d F O O D S E C U R I T Y I N K E N Y A

Note: As per guidelines from the Ministry of Agriculture, Livestock, Fisheries and Irrigation style guide, spelling across this strategy follows Oxford English Dictionary (OED) conventions (i.e. organization, industrialization)”

Preface and acknowledgementsForewordAcronyms and AbbreviationsSelected glossary termsFiguresEXECUTIVE SUMMARY01 CONTEXT 1.1 Lessons learned from prior NAIPs 1.2 Policy context of the NAIP 1.3 Contribution of the ASTGS to the big four02 METHODOLOGY AND APPROACH 2.1 Theory of Change 2.2 Overview of approach 2.3 Use and limitations of economic models 2.4 Value chain prioritization 2.5 Flagship prioritization 2.6 Limitations in data use03 FLAGSHIP PROJECTS AND DELIVERY OVERVIEW 3.1 Overview of transformation impact targets 3.2 Overview of flagships and delivery mechanism 3.3 Drivers of flagship impact and investment04 KENYA’S AGRICULTURAL SECTOR RESULTS FRAMEWORK 4.1 Results framework and alignment to ASTGS 4.2 Assumptions underpinning flagship impact 4.3 Alignment to CAADP and Malabo 4.4 A note on impact and the economic models05 MONITORING AND EVALUATION (M&E) MECHANISM 5.1 Monitoring and evaluation 5.2 Ensuring mutual accountability06 INTEGRATED IMPLEMENTATION PLAN AND BUDGET 6.1 Integrated implementation plan 6.2 From NAIP to implementation 6.3 Linkages and interdependencies 6.4 Implementation budget and funding sources07 IMPLEMENTATION RISKS AND MITIGATING MEASURES 7.1 Financing risk 7.2 Political risk 7.3 Execution risk 7.4 Market riskAPPENDICES Appendix 1 - Flagship implementation plans Appendix 2 - Ongoing and planned GoK projects Appendix 3 - Metrics for transformation readinessREFERENCES
Co ntent s
iiiiivv
viiix134 4779
13152325313136395151545470717174777780838591919293949595
123135139

i
P R E FACE A N D ACK N O W L E D G E M E N TS
P R E F A C E A N D A C K N O W L E D G E M E N T S
Agriculture is the bedrock of Kenya’s development:Message from the Cabinet Secretary
Despite Kenya’s impressive advances across the economy, in innovation and entrepreneurship, private sector enterprise, infrastructure, public service delivery and human capabilities, agriculture continues to be the bedrock of the development of our nation and the key to creating equitable and sustainable growth for our people. No large country has ever achieved significant growth without modernizing its agricultural sector. In addition to driving our economic growth, agriculture also creates jobs for our rural communities and is essential to satisfying the nutritional needs of all our people.
The importance of agriculture has been emphasized in Kenya through Vision 2030 and the Medium-Term Plan III, and most recently the President’s Big Four priority agenda for 2017-2022, which emphasizes the importance of 100% food and nutrition security for all Kenyans.
We have made progress in modernizing agriculture in Kenya, but we have not yet reached our full potential. To achieve our potential, we must do agriculture in a different way, from how we create policy at the national level, to how we allocate resources in our farming households. Not only will we adopt new ideas under the mandate we have been given, we will be bold in achieving them.
We have developed nine flagships that serve as the core of our 10-year Agricultural Sector Growth and Transformation Strategy (ASTGS). These flagships draw on that status of our agriculture today, a rigorous and thorough review of data, lessons from global best practices, and our local realities. The actions inherent in these flagships are bold and ambitious. They will help to transform our agriculture sector in Kenya, drive 100% food and nutrition security, and ensure food is affordable, especially for those most in need. The strategy details the flagship projects prioritized for implementation in the first five years. Following a review of their performance, an additional set of projects will be developed for the next five years of the strategy to match the transformation needs at the time.
On behalf of the Ministry of Agriculture, Livestock, Fisheries and Irrigation (MoALF&I), I would like to convey profound gratitude to all who participated in the development of this strategy. It was a highly consultative and iterative process that left no one behind. Every institution and individual that shared their time, perspectives and expertise deserves recognition.
A special mention goes to the His Excellency President Uhuru Kenyatta and Deputy President William Ruto for their vision to provide access to affordable and nutritious food to every single Kenyan. My Ministry would like to also thank all of the national government institutions, including other ministries, parastatals, commissions, universities and research institutions for their commitment to transforming agriculture. To the affiliate institutions of county governments, which include the County Executives Committee Members, Members of County Assemblies (MCAs) and regional economic blocs led by the Council of Governors, thank you. The Joint Agriculture Sector Consultation and Cooperation Mechanism (JASCCM) and all its constituent bodies have been invaluable partners in this effort. They worked hand in hand to chart a clear path to implementation that will be led by the counties.
INVESTING IN KENYA’S AGRICULTURAL SECTOR TRANSFORMATION N A I P 2 0 1 9 - 2 0 2 4
ii
The Ministry wishes to express immense gratitude to our development partners across the Agriculture and Rural Development Donor Group (ARDDG), in particular the Alliance for a Green Revolution in Africa (AGRA), the Food and Agriculture Organization (FAO) of the United Nations (UN), the German Development Corporation (GDC), Deutsche Gesellschaft für Internationale Zusammenarbeit (GIZ), the Japan International Cooperation Agency (JICA), the Swedish Embassy, the United Nations Environmental Program (UNEP), and the United States Agency for International Development (USAID). You have been a reservoir of global best practices for domestication and dissemination of lessons learned. We thank you for the timely financial support extended to this process.
We also acknowledge and appreciate private sector institutions and associations and non-state players, including farmer organizations, civil society and the media, whose interests spread across various value chain processes and support areas, and whose operations will contribute to successful implementation of the ASTGS.
I am 100% committed to driving this agenda and seeing real results. We know what to do – now to the work of doing it.
Hon. Mwangi Kiunjuri, EGH, MGHCabinet Secretary, Ministry of Agriculture, Livestock, Fisheries and Irrigation

iii
FO R E W O R D
F O R E W O R D
Towards implementation with the counties:Message from the Chief Administrative Secretary and Principal Secretaries
We are excited to share the Agricultural Sector Transformation and Growth Strategy (ASTGS) with you, as we seek rapidly to transform this critical sector. Realising our potential in agriculture will achieve food security, improve our farmer and local community incomes, lower the cost of food, and increase employment (particularly for women and youth). These are our absolute priorities.
The strategy is simple. It has nine bold flagships that represent a departure from how we have done things in the past. They draw on extensive national and county-level consultation, global best practices and input from technical experts. They are tailored to our immediate needs.
Our focus is on the implementation of this strategy. We have defined clear actions, owners for each action, and budgets to mobilize resources. We are in the process of establishing the Agricultural Transformation Office (ATO) that will report to the Cabinet Secretary for MoAFL&I. The ATO will ensure that we stick to our timetable and address challenges as they arise.
In addition to extensive consultations with you as we designed the strategy, our engagement will only intensify as we move quickly to implementation. The counties are the bedrock of implementation and will need support from government, industry players, entrepreneurs, development partners and civil society to move forward.
We invite you to join forces with us to make the ASTGS a reality.
For the Ministry of Agriculture, Livestock, Fisheries and Irrigation:Dr. Andrew Tuimur, Chief Administrative Secretary[TBD], Principal Secretary, State Department for Crops DevelopmentMr. Harry Kimtai, Principal Secretary, State Department for LivestockProf. Japheth Micheni Ntiba, Principal Secretary, State Department for Fisheries Acquaculture and Blue EconomyProf. Fred Sigor, Principal Secretary, State Department for IrrigationProf. Hamadi Boga, Principal Secretary, State Department of Agriculture Research

INVESTING IN KENYA’S AGRICULTURAL SECTOR TRANSFORMATION N A I P 2 0 1 9 - 2 0 2 4
iv
A C R O N Y M S A N D A B B R E V I A T I O N S
AgCK Agricultural Council of KenyaAPDT Agro-processing Delivery TeamARDDG Agriculture and Rural Development Donor GroupASAL Arid and Semi-Arid LandASDS Agricultural Sector Development StrategyASDP Agricultural Sector Development PlanASTGS Agricultural Sector Transformation and Growth StrategyAUC African Union CommissionATO Agricultural Transformation OfficeCAADP Comprehensive Africa Agriculture Development ProgrammeCGE Computable General Equilibrium CIDP County Integrated Development PlanCoG Council of GovernorsD.P. Deputy PresidentEAC East African CommunityFAO Food and Agricultural OrganizationGDP Gross Domestic ProductGODAN Global Open Data for Agriculture and NutritionH.E. His ExcellencyIAA Institutional Architectural AssessmentIFAD International Fund for Agricultural DevelopmentIFPRI International Food Policy Research InstituteJASCCM Joint Agricultural Sector Consultation and Cooperation MechanismJASSCOM Joint Agricultural Sector Steering CommitteeJRC Joint Research CentreJSR Joint Sector ReviewKAAA Kenya Agribusiness and Agroindustry AllianceKAINet Kenya Agricultural Information NetworkKEPSA Kenya Private Sector AllianceKES Kenya ShillingsKETRACO Kenya Electricity Transmission Company KIHBS Kenya Integrated Household Budget Survey
KODI Kenya Open Data InitiativeKVDA Kenya Valley Development AuthorityKPI Key Performance IndicatorLAPSSET Lamu Port – South Sudan – Ethiopia TransportLiLO Legislative Intergovernmental Liaison OfficeM&E Monitoring and EvaluationMAFAP Monitoring and Analyzing Food and Agricultural PoliciesMoALF&I Ministry of Agriculture, Livestock, Fisheries and IrrigationMT Metric TonsMTIP Medium-Term Investment PlanMTP Medium-Term PlanNAIP National Agriculture Investment PlanNFNSP-IF National Food and Nutrition Security Policy Implementation Framework NFSC National Food Security CouncilPPP Public Private PartnershipPROGRESA Programa Nacional de Educacion, Salud y AlimentacionReSKASS Regional Strategic Analysis and Knowledge Support SystemRIAPA Rural Investment and Policy AnalysisSAM Social Accounting MatrixSDGs Sustainable Development GoalsSOPs Standard Operating ProceduresSFR Strategic Food ReserveSFRTF Strategic Food Reserve Trust FundSME Small and Medium-Sized EnterpriseTARDA Tana and Athi-River Development AuthorityUPOV Union for the Protection of New Varieties of Plants UNIDO United Nations Industrial Development OrganizationUSAID United States Agency for International Development

SE L ECT E D G LO SS A RY T E R M S
v
S E L E C T E D G L O S S A R Y T E R M S
Agro-processing delivery team (APDT): A small dedicated team within the Agricultural Transformation Office (ATO) to support pre- and post-feasibility study requirements for the agro-processing hubs detailed in flagship 3. The APDT will pre-screen approved service providers for the agro-processing hubs, manage the feasibility study grant programme, and maintain a library of standard project agreement
Agricultural transformation:A decades-long process characterized by four main shifts, including (1) modernization of on-farm production and input markets from subsistence to commercial agriculture serving local and export demand; (2) value (i.e. beneficiation) in the value chain moving from primary production towards processing and retail; (3) shift into more productive agricultural jobs; and (4) changing demand for what people eat (e.g., more processed foods, animal proteins) and where to buy them (e.g., formal retailing)
Anchor:A key outcome of the theory of change of this Agricultural Sector Transformation and Growth Strategy (ASTGS). Three anchors are articulated herewith: increasing small-scale farmer incomes, increasing agricultural output and value addition, and boosting household food resilience. Under each anchor, we defined ~2 flagship projects to drive the intended outcomes. Anchors are designed to guide the full 10 years of implementation while the flagships are designed for ~5 years, and need to be reviewed and revised in Year 5
Accelerator:Contracted for-profit or not-for profit companies that select, train, mentor, scale and conduct performance management of high-potential SMEs under flagship 1. These accelerators will be selected jointly by national and county governments to operate across the country. Foremost, the, accelerator must be able to demonstrate a proven track record in training and scaling SMEs in Kenya, or in a similar context. The accelerators may be a group of companies or organizations, but must be primarily headed by an impartial party and operate at a competitive price. These SME accelerators should be able to support SMEs with varying business models
Climate-Smart Agriculture:As defined by the FAO, CSA is an approach for developing agricultural strategies to secure sustainable food security under climate change
Domesticated:The process by which the counties translate the national-level ASTGS into an actionable county-level plan. This will require the counties to adopt the ASTGS to their county operating environments, budgetary processes, and Country Integrated Development Plans (CIDPs). JASCCM is a critical enabler of domestication as the interface between the national and county levels
Farmer:A person who owns, works on or operates an agricultural enterprise that cultivates land or crops, or raises animals including livestock and fish. Whenever this document refers to “farmer”, it assumes crop and fish farmers, pastoralists, including all animal and poultry husbandry, and fisherfolk
Flagship:A strategic project with a lifetime of at least 3-5 years, and both high feasibility and impact within Kenya’s operating context and goal of sustainabletransformation and food security
Food secure/security:A situation that exists when at all people, at all times, have physical, social and economic access to sufficient, safe and nutritious food that meets their dietary needs and food preferences for an active and healthy life
Household:While a household may have two farmers (and ~2-3 other members of the household as per the latest Kenya Integrated Household Budget Survey), the primary income earner tends to be the man in the household, particularly in rural areas that comprise 60-70% of the small-scale farmers targeted. For the relevant flagships:
i. Flagship 1 is focused on production and analysis focuses on individual income-earning farmersii. Flagship 2 is based on one subsidy per household. As the data gets better, we may be able to isolate the farmiii. Flagship 6 is focused on the entire household, income and non-income earner

INVESTING IN KENYA’S AGRICULTURAL SECTOR TRANSFORMATION N A I P 2 0 1 9 - 2 0 2 4
vi
Food resilience:As defined by the FAO, this is the ability of a household to keep within a certain level of well-being (i.e., being food-secure) by withstanding shocks and stresses. This definition implicitly considers both (ex ante) actions that reduce the risk of households becoming food insecure, and (ex post) actions that help households cope after a crisis occurs
Vulnerable population:With respect to determining targets for the strategic food reserve coverage, this population is defined as the ~1.3 million chronically food-insecure Kenyans in ASAL areas, and the approximately 4 million Kenyans in need of government support to be food-secure during emergencies (e.g., droughts) based on historical data. For this population, the assumed per capita consumption is 114 kg/capita/year of maize
Small/Medium Enterprise (SME):Comprise both formal and informal businesses concentrated in urban and peri-urban areas. As defined by the Kenya Institute for Public Policy Research and Analysis (2014), Kenyan SMEs have 10-100 employees, and an annual turnover of <KES 500,000 to KES 5 million per year

vii
F I GU R E S
Fig u re s
Figure 1: The big four agenda and the ASTGSFigure 2: Sources of insight to refine the ASTGS and NAIP approachFigure 3: 14 tests of agricultural transformationFigure 4: Overview of Kenya’s national transformation readinessFigure 5: Sample output of the CGEs used in NAIPFigure 6: List of Kenya’s ~100 produced value chainsFigure 7: Criteria to select value chainsFigure 8: Mapping of ASTGS/NAIP criteria to global best practiceFigure 9: ASTGS value chain prioritization matrixFigure 10: Role of cash and non-food value chains in ASTGSFigure 11: Flagship prioritization for feasibility and impactFigure 12: Sample questions to support hypothesis-driven approachFigure 13: Sample data sources and analytical output generatedFigure 14: Estimated impact of the transformationFigure 15: Impact of uplifted incomes and GDP from baselineFigure 16: Incremental contribution to agriculture and total GDPFigure 17: Major assumptions on cost and impact estimatesFigure 18: National coverage of the six anchor flagshipsFigure 19: Indicators incorporated into Kenya’s ag sector M&E frameworkFigure 20: Kenya’s agricultural sector results frameworkFigure 21: NAIP results trackingFigure 22: NAIP implementation performance management structureFigure 23: High level roadmap for transformationFigure 24: Year one transformation milestonesFigure 25: Five-year agriculture-specific and agriculture-supportive NAIP costFigure 26: Five-year flagship investment requirementsFigure 27: Financing costs for five-year NAIPFigure 28: Historical and expected future disbursements for MoALF&IFigure 29: Five-year agriculture-supportive NAIP costs
Box 1: Commitments under the Malabo DeclarationBox 2: Perspectives on maize value chain growth trendsBox 3: The nine ASTGS flagshipsBox 4: Mexico’s PROGRESA programme
Table 1: Assumptions for impact indicators within the results frameworkTable 2: Map of ASTGS flagships to CAADP performance indicators
Appendix 1: Detailed flagship implementation plansAppendix 2: Ongoing and planned GOK projects in the Agricultural SectorAppendix 3: Metrics for agricultural transformation readiness
510111314161718202225262733343536385253737378798686878789
2233776
5665
95123136


E X ECU T I V E SU M M A RY
ix
Kenya’s National Agriculture Investment Plan (NAIP) for 2019-2024 is the five-year investment plan accompanying the country’s 10-year Agriculture Sector Transformation and Growth Strategy (ASTGS). The ASTGS and NAIP are grounded in the belief that achieving 100% food and nutrition security requires a vibrant, commercial, modern and equitable agricultural sector that sustainably supports economic development in the context of devolution. Therefore, the NAIP is designed to accelerate Kenya’s agricultural transformation in alignment with the Big Four Presidential Agenda, Comprehensive Africa Agriculture Development Programme (CAADP), the United Nations Sustainable Development Goals (SDGs) and Kenya’s Medium-Term Plan III.
The iterative approach used to design and refine the NAIP required:1. an analysis of the country’s state of agriculture and transformation readiness2. a check for overall alignment with the national and county-level strategic priorities3. prioritization of value chains and interventions that have high implementation feasibility and impact in line with the theory of change
E X E C U T I V E S U M M A R Y

INVESTING IN KENYA’S AGRICULTURAL SECTOR TRANSFORMATION N A I P 2 0 1 9 - 2 0 2 4
x
The nine flagships that emerged from this process were informed by ~600 global, regional and Kenya-focused reports and data sets, consultations with ~500 government stakeholders from across Kenya and across all levels of government, interviews and engagements with ~150 organizations, including multinational and indigenous large firms and SMEs, universities, producers’ associations and cooperatives, ~150 technical agricultural experts from around the world, and an evaluation of ~13 value chains from the broader subset of ~100 produced in the country.
The nine flagships are oriented on the three anchors of the ASTGS Theory of Change: two flagships to increase small-scale farmer, pastoralist and fisherfolk incomes; two flagships to increase agricultural output and value addition; two flagships to boost household food resilience; and finally three enablers that run across the anchors:
Anchor 11. Target ~1 million farmers in ~40 zones (initially) producing crops, livestock and fish served by ~1,000 farmer-facing SMEs that provide inputs, equipment, processing and post-harvest aggregation 2. Shift nationwide subsidy programme focus to empower ~1.4 million registered high-needs farmers to access a wide range of inputs from a variety of private and public providers, using e-vouchers with digital service delivery
Anchor 23. Establish 6 large-scale agro- and food processing hubs across the country through a one-stop-shop, rapid public-private partnership (PPP) process, targeting both domestic and export markets4. Unlock ~50 new large-scale private farms (>2,500 acres each) with ~150,000 acres under sustainable irrigation from existing projects through competitive bidding, protected land ownership, and government provision of basic infrastructure (e.g., power, roads)
Anchor 35. Restructure governance and operations of the Strategic Food Reserve (SFR) to better serve ~4 million vulnerable Kenyans through: i. reserves optimized for emergency responses only; ii. buy/sell guidelines published with pre-determined emergency release triggers for stocks and cash; iii. private sector warehousing; iv. price stability managed through National Treasury (i.e., minimum price controls and cash transfers)6. Boost food resilience of ~1.3 million farming and pastoralist households in ASALs through community-driven design of interventions, and more active national and county coordination of development partner(s) and private sector
Enablers7. Launch three knowledge and skills programmes: i. field-and-forum curricula for ~200 national and county government leaders; ii. skill-building for public and private sector flagship implementers (including agri-business skills for ~1,000 change agent SMEs); iii. management/technical training for ~3,000 government youth-led and digital-enabled extension agents8. Strengthen research and innovation as launch priority digital and data use cases to better drive decision making and performance management. First wave of use cases to be supported by research includes: i. digital subsidy delivery programme; ii. production forecasting and digital performance monitoring of small-scale farmers and SMEs; iii. forecasting and monitoring SFR buy/sell needs9. Monitor responses to two key food system risks: i. sustainable and climate-smart natural resource management including health of water basins, soil quality and land use; and ii. rapid response crisis management for pests and diseases, climate and global price shocks
Delivery at the highest levels will be a collaborative effort between the Cabinet Secretary of Agriculture, Livestock, Fisheries and Irrigation (MoALF&I), the Council of Governors (CoG), and the other associated national sector ministries, including Devolution and ASAL areas; Environment and Forestry; Industry, Trade and Cooperatives; Lands and Physical Planning; Transport, Infrastructure,

E X ECU T I V E SU M M A RY
xi
Housing and Urban Development; Water and Sanitation; and the National Treasury. The Agricultural Transformation Office (ATO) will serve as the national secretariat coordinating transformation efforts across the sector.
The MoALF&I will formulate, implement and monitor agricultural policy and regulation, while developing and coordinating programmes to support crop development, livestock, fisheries, irrigation and research that are critical to delivering the ASTGS. The MoALF&I Cabinet Secretary will be responsible for delivering the sector targets.
Together, the NAIP’s flagships will underpin Kenyan agriculture’s shift towards a vibrant, commercial and modern agricultural sector that sustainably supports Kenya’s development and 100% food security aspiration in the context of devolution, and commitments to CAADP and the SDGs. Accordingly, this NAIP prioritizes three anchors to drive the 10-year transformation, with specific targets set for the first five years. Note that any reference to farmers includes mixed farmers, pastoralists and fisherfolk:
■ Anchor 1: Increase small-scale farmer incomes:
– Raise average annual incomes from KES 465/day to 625/day (~35% increase over baseline growth)i for ~3.3 million small-scale Kenyan farmers
■ Anchor 2: Increase agricultural output and value addition:
– Expand agricultural GDP by 4-5% above baseline scenario, to KES ~3.9 trillion (~6% CAGR)
– Grow contribution of agro-processing to GDP to KES ~110-150 billion over 5 years, a 50% increase from current contribution of KES ~260 billion
■ Anchor 3: Increase household food resilience:– Reduce the number of food-insecure
Kenyans in the ASAL regions from 2.7
i Business-as-usual incomes anticipated to increase from KES 149,000/yr to KES 169,000/yr, on pace with the ~30% income increase Kenya has observed over ~10 years. With transformation this can grow to 625/day, more in line with SDG target to double incomes between 2016-2030ii Aspirational case is 100% coverage of the average food-insecure population (taking % of population that is food-insecure from 2008-2017 and extrapolating to the 2022 population); conservative case is 100% coverage of minimum food-insecure population size; assume linear ramp-up
million on average to zero,ii while reducing the cost of food and improving nutrition
– Protect households against shocks, environmental and economic
This NAIP builds on lessons learned from Kenya’s previous investment programmes and therefore has a sharp focus on:■ improved coordination and capacity at both the national and county levels through the proposed Agricultural Transformation Office (ATO) working with the Joint Agricultural Sector Steering Committee (JASSCOM)■ improved data availability and utilization through focused data use cases required to deliver on ASTGS■ more effective participation of the private sector and civil society throughout NAIP design and implementation ■ more effective resource mobilization and disbursement through rigorous M&E to provide real-time visibility on spend performance across the flagships
Implementation of the NAIP is expected to start in the 2018/19 fiscal year. For the first 12 months, it will focus on achieving early quick-win results in each of the flagships to build momentum and buy-in from stakeholders for the transformation. The Agricultural Transformation Office (ATO) will also be set up in this first year to coordinate, oversee and create accountability for the nine flagships. The subsequent Years 2-4 will focus on embedding structural transformation and delivery at the counties, with Year 5 dedicated to drafting the second NAIP for the next five years.
To manage implementation progress and achieve impact targets, the ASTGS flagships will be subject to independent M&E to foster public accountability, promote sharing of lessons learned from the interventions, and highlight potential improvement areas. Within government, mutual accountability will come from each flagship being owned by a director-

INVESTING IN KENYA’S AGRICULTURAL SECTOR TRANSFORMATION N A I P 2 0 1 9 - 2 0 2 4
xii
level champion whose performance contract will be linked to achieving the targets of the flagship. The Cabinet Secretary in the Ministry of Agriculture, Livestock, Fisheries and Irrigation (MoALF&I) is similarly the champion of the entire transformation, and his/her performance contract will also be linked to achieving the ASTGS and NAIP goals.
In total, the ASTGS flagships require KES 440 billion in five years: KES 200-230 billion in agricultural-specific investment, and an additional KES ~210 billion in agricultural-supportive costs for roads and power infrastructure. With the right approach of efficient public-private partnerships (PPPs), up to ~80% of the agriculture-specific investments can come from the private sector, and are to be invested primarily in the agro-processing and arable land flagships. Thus, ~20% should come from the Government of Kenya (GoK) and development partners to cover subsidies and extension. This amount is over and above the cost for these items that are already in the national budget. GoK and development partners therefore need to raise ~KES 8-10 billion more per year to fund the NAIP.
This additional KES 8-10 billion required from GoK and development partners is equivalent to ~30-40% of historical annual MoALF&I disbursement. The NAIP has been developed with consideration of MoALF&I’s historical disbursed public expenditures, Kenya’s current budget position, and development partners’ shifting priorities, to identify a realistic financing aspiration for the investment plan.
As with any large-scale investment project, the NAIP has several associated implementation risks, the key ones being financing, political, market, and execution risk. To mitigate against financing risk, the NAIP includes interventions to ring-fence funds, and ensure priority allocation as a Big Four sector priority. To guard against political risk, the flagships include measures that strengthen institutional stability and secure broad public support for successful interventions. To mitigate execution risk that depends on coordination and action from multiple stakeholders, the ATO has been designed to focus on delivery and delivery alone as part of the transformation.
Finally, to guard against market risk, this NAIP promotes the use of as much data as possible to inform production and extension. Further, potentially market-distorting interventions (e.g., subsidies) are either designed to give as much flexibility as possible to the farmer to navigate the markets, or reduce market distortions caused by government (e.g., moving price stability mandate to the Ministry of Finance). Together, these different interventions will act to minimize the risk of disruption to the NAIP, increasing the likelihood that flagship implementation will be successfully delivered and that the intended impact of the transformation will be achieved.
Disclaimer: Impact and cost estimates within NAIP are point estimates and should not be used as forecasting tools. The impact calculated focuses on agricultural GDP, and is indicative, and therefore impact ranges are shown (while the ASTGS alone focuses on the upper end of the range). It should be used to understand the magnitude of impact within flagships and the relative ranges of impact across flagships. More detailed impact sizing is to be conducted by the implementation teams. Where possible, economy-wide impact from the IFAD-IFPRI RIAPA model was triangulated. Future efforts to arrive at a more accurate view of expected impact should ideally incorporate such modelling to ensure that indirect effects of the interventions that cascade through other sectors of the economy are captured as well.
1
CO N T E X T
In August 2010, Kenya adopted a new constitution, which devolved most agricultural functions from the national government to Kenya’s 47 county governments.1 Prior agriculture sector strategies (e.g., ASDS 2009-2020) were not written with devolution in mind. Therefore, Kenya struggled to integrate ASDS recommendations into national and county government objectives, and the country decided it needed a new agriculture sector strategy. In June 2014, Kenya signed the Malabo declaration that further outlined seven new commitments for the agricultural sector, and required the country to refresh its National Agricultural Investment Plan (NAIP).
0 1C O N T E X T
2
INVESTING IN KENYA’S AGRICULTURAL SECTOR TRANSFORMATION N A I P 2 0 1 9 - 2 0 2 4
In October 2015, as preparation for a JointSector Review (JSR) required by the Comprehensive Africa Agriculture Development Programme (CAADP), the Ministry of Agriculture, Livestock, Fisheries and Irrigation (MoALF&I) conducted an Institutional Architectural Assessment (IAA). One of the biggest challenges highlighted by the JSR was poor sector coordination, and in response the MoALF&I, the Council of Governors (CoG), with support from the Agriculture and Rural Development Donor Group (ARDDG), established the Joint Agricultural Sector Consultation and Cooperation Mechanism (JASCCM). JASCCM supports national and county governments to jointly pursue effective development of the agriculture sector. JASCCM, working with MoALF&I and the counties, appointed a task force in March 2017 to write Kenya’s new Agricultural Sector Transformation and Growth Strategy (ASTGS). This kicked off an approximately eight-month-long consultative, multi-stakeholder process to identify the challenges in the sector and how to address them.
In January 2018, the MoALF&I accelerated the process to complete the ASTGS with two clear outcomes: first, prioritize interventions for impact by adding a rigorous evidence base to the challenges and emerging solutions identified between 2014-2017. And second, ensure alignment with Kenya’s national aspirations in the context of the newly launched Big Four presidential agenda (100% food and nutrition security), the CAADP/Malabo Declaration, the United Nations Sustainable Development Goals, and Kenya’s Medium-Term Plan III 2017 (MTP III).
ASTGS has defined eight sector ministries to lead the national government contributions to agricultural transformation, given the current agricultural context and the initial set of interventions proposed for the first five years of the ASTGS (see Chapter 5). These ministries include:1. Ministry of Agriculture, Livestock, Fisheries and Irrigation (MoALF&I)2. Ministry of Devolution and ASAL areas3. Ministry of Environment and Forestry4. Ministry of Industry, Trade and Cooperatives 5. Ministry of Lands and Physical Planning6. Ministry of Transport, Infrastructure, Housing and Urban Development7. Ministry of Water and Sanitation 8. The National Treasury
As per the interventions required, the Ministry of Health; the Ministry of Education, Science and Technology; the Ministry of the EAC, Labour and Social Protection; and the Ministry of Information, Communications and Technology may be called upon to support implementation.The National Agriculture Investment Plan (NAIP) accompanies Kenya’s 10-year ASTGS in pursuit of a vibrant, modern and commercial agricultural sector that sustainably supports Kenya’s aspirations for 100% food security and economic development through agriculture, in the context of devolution.
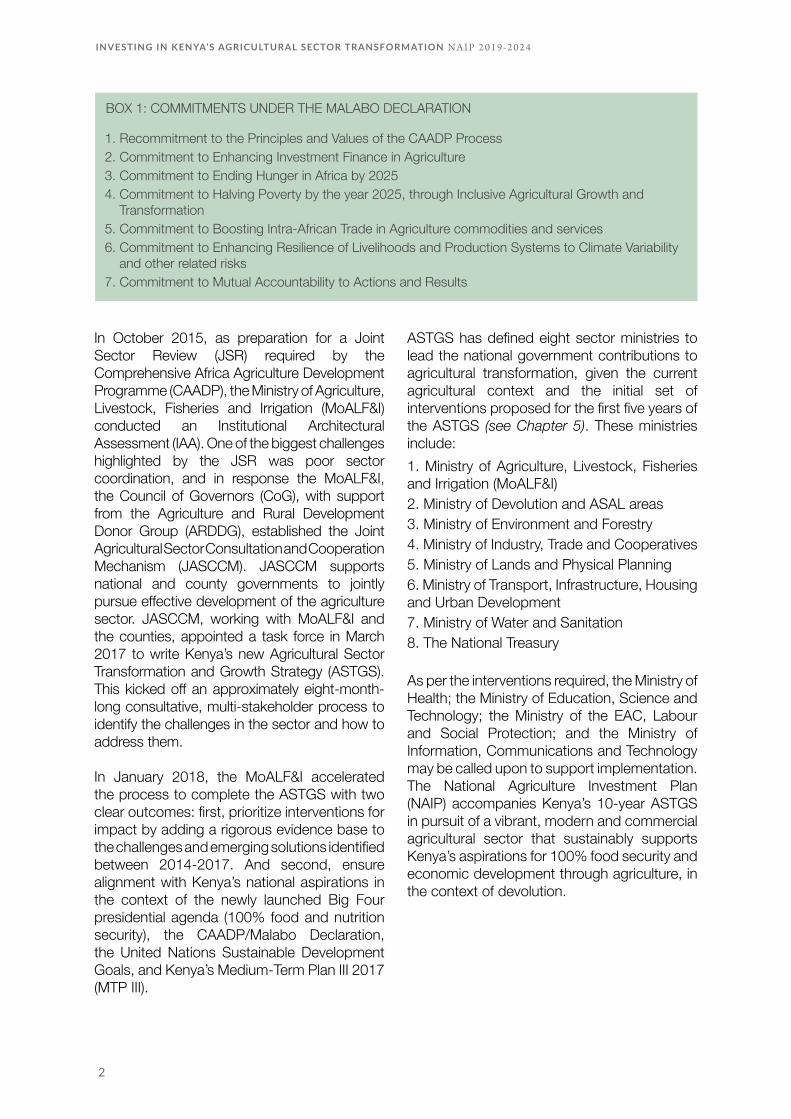
BOX 1: COMMITMENTS UNDER THE MALABO DECLARATION
1. Recommitment to the Principles and Values of the CAADP Process2. Commitment to Enhancing Investment Finance in Agriculture3. Commitment to Ending Hunger in Africa by 20254. Commitment to Halving Poverty by the year 2025, through Inclusive Agricultural Growth and
Transformation5. Commitment to Boosting Intra-African Trade in Agriculture commodities and services6. Commitment to Enhancing Resilience of Livelihoods and Production Systems to Climate Variability
and other related risks7. Commitment to Mutual Accountability to Actions and Results

3
CO N T E X T
1.1 LESSONS LEARNED FROM PRIOR NAIPs
This NAIP builds on lessons learned from Kenya’s previous investment programmes. In particular, it incorporates key recommendations from the November 2017 Joint Sector Review (JSR), which assessed Kenya’s 2010-2015 Medium Term Investment Plan.2 Lessons learned include the following:■ Design the flagships with impact and feasibility in mind: The NAIP was developed together with the ASGTS, drawing on 600+ reports and data sets, and consultations with 500+ stakeholders across government and private sector. This allowed the authors to add a rigorous fact base to the diagnostic, and therefore prioritize challenges and design impactful solutions to address their root causes. To cost the subsequent recommendations, this NAIP considers historical actual public expenditures, Kenya’s current budget position, and shifting priorities of development partners to identify a practical financing need (e.g., it does not recommend building new dams given the complexity, timing and longer than five-year time frame to impact). It further articulates what areas the government should consider foregoing if financing is not available.■ Improve coordination capacity at both the national and county levels: The strategy affirms the ASTGS Steering Council chaired by the Cabinet Secretary for MoALF&I as the highest governing body for the transformation. The Agricultural Transformation Office (ATO) reports to the Chief Administrative Secretary (CAS) at MoALF&I and acts as the secretariat for the Steering Committee. The ATO will be responsible for coordinating ASTGS and NAIP implementation among all national-level stakeholders, as well as working with JASSCOM to domesticate the strategy. In addition, a County Implementation Toolkit developed during this process will continue to be refreshed by the ATO in consultation with JASSCOM and assist counties to follow a uniform process in aligning their agricultural sector strategy and development plans with the national priorities contained in the ASTGS.■ Improve data availability and utilization: The ASTGS has a research, data and innovation
flagship that will play a key role in making quality data and data-driven insights available to stakeholders in agriculture for decision making. In addition, the knowledge and skills-building flagship will train transformation leaders and implementers in evidence-based decision making, thus ensuring that available data and insights are incorporated into production, M&E and policymaking decisions.■ Ensure effective participation of the private sector and civil society organizations in the development of the agriculture sector: The NAIP process has been highly consultative from inception and design. It has sought out and actively incorporated inputs from discussions with private sector umbrella organizations such as the Agricultural Council of Kenya (AgCK), the Kenya Private Sector Alliance (KEPSA), individual private sector players in agriculture, farmer organizations and NGOs. During implementation, feedback from these stakeholders will continue to guide the ASTGS through participation in the ATO’s semi-annual review process, involvement at the ASTGS Steering Council meetings, and other ongoing consultations led by MoALF&I.■ Strengthen the effectiveness of resource mobilization and disbursement: The delivery mechanism will incorporate rigorous M&E to provide visibility on comparative spending effectiveness across the interventions, in different counties and in different flagships. This will allow the ATO to highlight high-performing areas, and use them as a source of best practices and lessons learned to uplift the overall spending effectiveness of the transformation. In addition, having objectively measured data on spending effectiveness will allow transformation leaders to build a stronger case for resources mobilization and disbursement (from both the National Treasury and development partners).
An improvement area identified in the JSR that is not addressed explicitly by the NAIP is the need to define a new framework for the policy reform process. Since policy reform is viewed in the ASTGS and NAIP primarily as an enabler for transformation flagship implementation, no new policy framework has been explicitly identified as part of the strategy development process. Rather, the NAIP recommends an

4
INVESTING IN KENYA’S AGRICULTURAL SECTOR TRANSFORMATION N A I P 2 0 1 9 - 2 0 2 4
acceleration of existing provisions within the current policy framework, with a few exceptions detailed below. A more thorough review of the policy framework may be required to achieve the aspirations of the subsequent NAIP that will support the last five years of the ASTGS from 2024-2029.
1.2 POLICY CONTEXT OF THE NAIP
The ASTGS and NAIP support policies that address food and nutrition security with alignment to the County Integrated Development Plans (CIDPs) and the national MTIPs, while maintaining coherence to overarching development blueprints including CAADP Malabo declaration, the SDGs and the African Union 2063 Agenda. The full list of these legal and regulatory mandates is in Chapter 3.5 of the ASTGS – Policy Considerations.
The recommendations of this NAIP operate largely within the purview of these national policies and regulations, and push for their enforcement as necessary (e.g., clarification of mandates between national and county governments in the Water Act 2016). There are two exceptions that are covered in Chapter 3 of the ASTGS:– The Strategic Food Reserve (SFR) flagship 5 will require a revision to the Public Finance Management Act 12 of 2012 – Strategic Food Reserve Trust Fund Regulations (2015) to separate the price stability mandate from the SFRTF’s emergency food provision mandate, and to allow for competitive bidding for storage facilities for these reserves by the private sector– The investing in data and research flagship 8 will require a revision to the Access to Information Act No. 31 of 2016 to add penalties for non-compliance with data standards for the flagship
The review and development of certain existing policy and regulatory frameworks can accelerate the impact of the flagships, and drive broader transformation of agriculture beyond the flagships. The following should be prioritized for review within the first three years of ASTGS implementation:
■ Draft Agricultural Policy (2016)■ Amendments to regulations around key inputs including seeds and fertilizer, access to finance, post-harvest handling, extension and marketing, including:– Agricultural Commodity Imports – Cess taxation provisions– Credit Guarantee Cabinet Paper– Exchange and Benefits Sharing regulations– Fertilizer and Animal Feedstuffs Act, CAP
345 (2012)– Kenya School of Agriculture Bill, 2015– Livestock Bill, Animal Breeding Bill,
consolidation of animal health law, Fisheries– Procurement Affirmative Action – Seed Certification, Industry Regulations in
the Seed and Varieties Act – CAP 326, and Provisions for the International Union for the Protection of New Varieties of Plants (UPOV)
– Warehouse Receipt Systems Bill, 2014
This is not an exhaustive list, and should be reviewed as necessary to be sensitive to the evolving needs of the transformation.
1.3 CONTRIBUTION OF THE ASTGS TO THE BIG FOUR
Making nutritious food affordable and available to all is a central goal of any agricultural transformation. The ASTGS is grounded in the belief that achieving 100% food security – a goal of the Big Four -- requires a vibrant, commercial and modern agricultural sector development. In the first five of ASTGS, the flagships will not only lay the ground for the longer 10-year transformation of the sector, but these flagships will contribute significantly to the Big Four agenda by improving the availability of food for all. See Figure 1 for additional detail.

5
CO N T E X T
THE BIG FOUR AGENDAAND THE ASTGS
SOURCE: ASTGS, NAIP, Big 4 documents, Team analysis
NEXT 5 YEARSFIRST FIVE YEARS OF THE ASTGS (NAIP I)
ASTGS CONTRIBUTIONBIG FOUR AGENDA
• Based on the performance of flagships over the first five years, the next five years of ASTGS (NAIP II) may:
• Expand scope of existing interventions (e.g., more geographies)
• Adjust scope of existing flagships (e.g., value chains)
• Design brand new flagships
• Protect ~4mn vulnerable households from severe food shocks by increasing household resilience and improving operations of the Strategic Food Reserve (SFR)
• Increase food production by KES 400bn from commercial farming for priority value chains
• Boost farmer productivity for ~3.3mn farming households
RELEVANT FLAGSHIP
1 2 3 4 5 6
AFFORDABLE HOUSING
• Free household income for other housing related costs by increasing farming household income (from ~KES 465 to KES 625/day). This will increase food affordability (~40% cost of household budget) for non-farming households
RELEVANT FLAGSHIP
2 5 6
UNIVERSAL HEALTH CARE
• Boost resilience in ASAL regions and provide better nutrition from additional commodities in the SFR, therefore reducing strain on national health system. To impacting ~4mn Kenyans during emergencies and 1.3mn chronically
RELEVANT FLAGSHIP
5 6
MANUFACTURING TO BE 20% OF GDP BY 2022
• Increase agro-processing GDP by ~KES 130 bn through 6 planned agro-processing hubs and high volume standardised inputs from large scale farms
RELEVANT FLAGSHIP
3 4
100% FOOD AND NUTRITION SECURITY
FIGURE 1: THE BIG FOUR AGENDA AND THE ASTGS

7
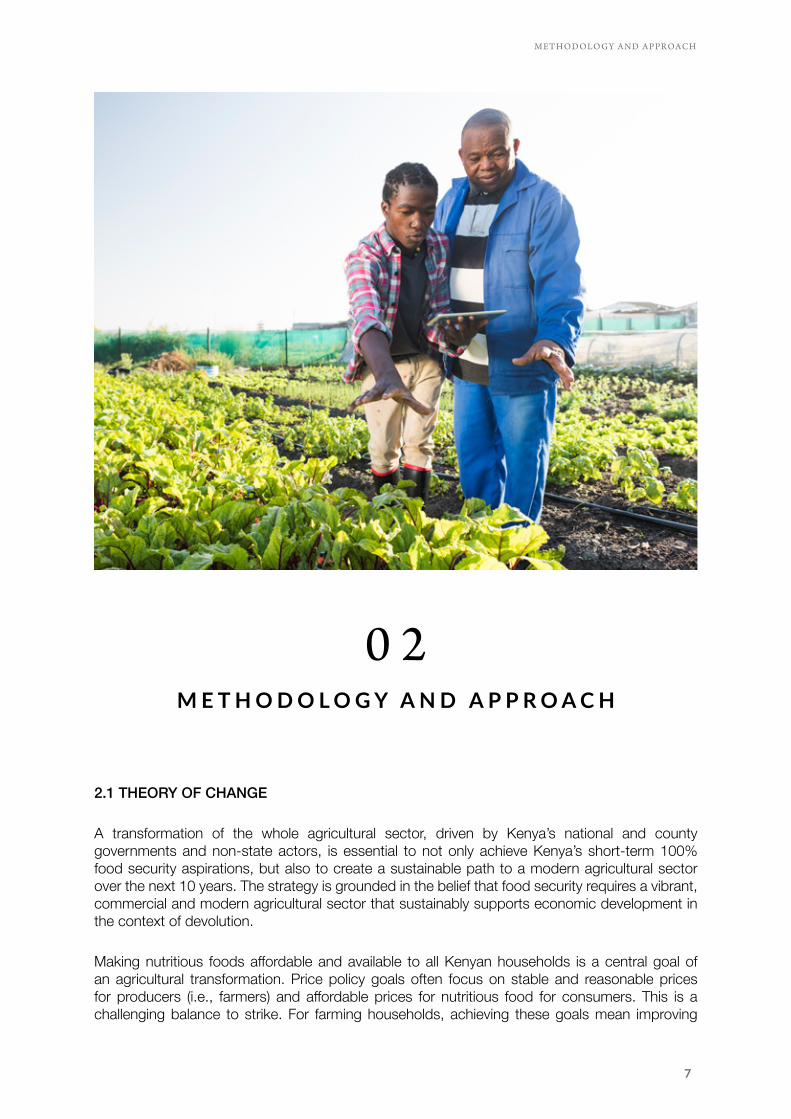
2.1 THEORY OF CHANGE
A transformation of the whole agricultural sector, driven by Kenya’s national and county governments and non-state actors, is essential to not only achieve Kenya’s short-term 100% food security aspirations, but also to create a sustainable path to a modern agricultural sector over the next 10 years. The strategy is grounded in the belief that food security requires a vibrant, commercial and modern agricultural sector that sustainably supports economic development in the context of devolution.
Making nutritious foods affordable and available to all Kenyan households is a central goal of an agricultural transformation. Price policy goals often focus on stable and reasonable prices for producers (i.e., farmers) and affordable prices for nutritious food for consumers. This is a challenging balance to strike. For farming households, achieving these goals mean improving
0 2M E T H O D O L O G Y A N D A P P R O A C H
M ET H O D O LO G Y A N D A P P ROACH

8
INVESTING IN KENYA’S AGRICULTURAL SECTOR TRANSFORMATION N A I P 2 0 1 9 - 2 0 2 4
productivity, market opportunities and working toward more predictable prices received for their produce.
Striking this balance – ensuring that all Kenyans have access to affordable, available and high-quality nutritious food – should also raise incomes for small-scale farmers. When farmers shift out of staple crops – for example into horticulture and livestock – greater quantities of nutritious food will become available. For non-farming households, as consumers, the affordability and availability of nutritious food requires a similarly targeted policy and regulatory framework such as the ASTGS tries to provide.
In general, the price of basic food items is only one indicator of the larger goals of an agricultural transformation. While price data informs assessments of food insecurity, particularly for lower-income households, it does not integrate many other important issues, such as measures of nutrition, household income, gender equality, producer prices, food safety or price stability. In addition to metrics that assess the affordability of food (e.g., % of the population able to afford a basic basket of food), the population share with adequate nutrients, gender equity metrics, foodborne disease burden, poverty indices, non-staple food energy scores and many other metrics can be important indicators of agricultural transformation.
Accordingly, the ASTGS theory of change builds on the 2018 National Food and Nutrition Security Implementation Framework (NFNSP-IF), designing the transformation around the people who are either leading agricultural transformation on the ground (on and off the farm), or beneficiaries most in need of food; these include: ■ Small-scale farmers, pastoralists, and fisherfolk households, as well as the local SMEs, larger businesses and agricultural
iii Currently, small-scale farmer income is ~KES 400 a day, based on total household income from FAO Family Farming Data Portraits. Assume that 60% of this is from on-farm income from the same source, and adjusted for PPP and inflation into 2018 KES baseline. Over the past ~10 years, incomes have grown 35%, below the pace required to meet SDG goal of doubling incomes between 2016-2030. If incomes are 145k today (~KES 400/day), without transformation by 2023 should grow to 170k (~KES 465/day) based on historical trends. Transformation Is estimated to contribute an incremental ~30% to 229k (~KES 625/day)iv Chronically food-insecure population is ~1.3 million. At times of drought, this increases to as high as ~4 million. The average is ~2.7 million
markets that support them. ASTGS is designed to shift these small-scale farmers from subsistence to market-oriented output to support long-term food security■ Large-scale commercial farmers, and the ecosystem of firms, domestic and export markets, and smaller farming communities that support them across the agricultural supply chain■ The millions of Kenyans who are still food-insecure – not just during times of emergency, but chronically all year round. ASTGS has provisions for very focused emergency responses for these beneficiaries, and longer-term household food resilience measures to support 100% food security
The success of the transformation delivers on the three target areas that are key to achieving 100% food security:■ Increase average participating small-scale farmer incomes from KES ~465/day to KES ~625/day over five years, and ensure that up to 3.3 million farmers benefit from the transformationiii
■ Increase agricultural GDP by 33% to KES 3.9 trillion (above the KES 3.7 trillion projection without a transformation)■ Reduce the number of food-insecure people from an average of 2.7 millioniv down to 0-1.3 million
A more detailed results framework follows in Chapter 4, but in summary, the ASTGS theory of change helps Kenya identify the key interventions (i.e., nine flagships), output metrics (e.g., small-scale farmer incomes) and outcomes (i.e., 100% food security through a vibrant, commercial, modern and equitable agricultural sector) as the basis for alignment to a results framework.

9
M ET H O D O LO G Y A N D A P P ROACH
2.2 OVERVIEW OF APPROACH
The NAIP was developed alongside the ASTGS through an iterative process with five steps:1. Assess current state of agriculture sector based on macro-economic, socio-economic and agriculture food system performance 2. Analyze Kenya’s readiness to transform based on commitment, follow-through and responsiveness, and determine the speed and risk of stalling along the way3. Derive principles for Kenya’s agricultural transformation from steps 1 and 2, and an understanding of what has worked and why in other countries that can be applied to the Kenyan context4. Use the above principles and analysis to validate the theory of change for ASTGS and ensure alignment with national priorities5. Develop actionable recommendations (“flagships”) for government stakeholders at national and county level that embed the strategic priorities in existing policy and investment frameworks
Since January 2018 alone, this approach was tested using ~600 global, regional and Kenya-focused reports and data sets, consultations with ~500 government stakeholders across Kenya and across all levels of government, interviews with ~150 organizations including multinational and indigenous large firms and SMEs, universities, producers’ associations and cooperatives, ~150 technical agricultural experts from around the world, and an evaluation of ~13 value chains from the broader subset of ~100 produced in the country (Figure 6). A brief overview of each of these steps follows.
Assess current state of the agriculture sector
To determine the starting point for this agricultural transformation, Kenya’s agriculture sector was evaluated using 14 Tests of Agricultural Transformation (Figure 3), and benchmarked to ~30 countries from around the globe.3 Varying levels of agricultural data exist to run these tests at the national and county levels, as well as for the agricultural sub-sectors (i.e., crops, fisheries, livestock).
Therefore, the most robust analysis focused on six tests, namely:■ Macro-economic tests: (i) agricultural GDP growth and contributions to overall GDP■ Socio-economic tests: (ii) historical trends of farmer incomes; (iii) food security indicators■ Agriculture food system tests: (iv) output by production volume and value; (v) output yields and yield gaps; (vi) level of value-add processing
The outcomes of this analysis are in Chapter 1.3 of the ASTGS – Agricultural Sector Trends. In summary, this diagnostic demonstrates Kenya’s regional strengths from sustained growth in agricultural production and small-scale farmer incomes of ~30% over the past decade. It also highlights several opportunities to boost productivity and market access for Kenya to be competitive beyond the East Africa region.■ Macro-economic tests: As of 2016, the agricultural sector was valued at KES 2.3 trillion, and contributed ~33% of GDP.4 Overall, the agriculture sector has grown at a steady ~4.8% since 2012, slightly below growth across the Kenyan economy at large. Kenya’s agricultural growth rate is on par with, or ahead of, countries in the region that had a similar mix of agriculture, manufacturing and services for the period 2012-2016, including Rwanda (4.7% agriculture growth) and Uganda (2.4%).5 But Kenya lags economies like Senegal and Cameroon that reached growth rates of ~6.5% and ~6.8% respectively by 2016.6 Between 2011 and 2016, despite having a smaller contribution of agriculture to GDP (~15-17%), Senegal’s agriculture sector is similar to Kenya’s including employment of ~51-53% of the sector, mostly in the rain-fed sector where crops and small-scale production contribute the largest share.7

10
INVESTING IN KENYA’S AGRICULTURAL SECTOR TRANSFORMATION N A I P 2 0 1 9 - 2 0 2 4
v
■ Socio-economic tests: The ILO estimates that ~62% of Kenya’s total employable population of ~28 millionvi earn some income from agriculture, including farmers and other off-farm employment related to agriculture
v Includes over 50 hours of workshops and meetings with USAID, GIZ, KFW, DFID, SIDA, Netherlands Embassy, JICA, Italy Department for Development Programme, EU, World Bank, FAO, IFAD, WFP, UNDP, AFDB, Rockefeller, AGRAvi Modelled ILO estimate. Employment is defined as persons of working age, who are engaged in any activity to produce goods or provide services for pay or profit, whether at work during the reference period or not at work due to temporary absence for a job, or to working time arrangement. ~28 million Kenyans are employed by this definition, and the agriculture sector includes hunting, forestry,fishing in accordance to Division I (ISIC 2) of categories A-B (ISIC A) or a category A (ISIC 4)
(e.g., agri-businesses).8 Determining which share of these ~18 million people are farmers is difficult. Nonetheless, ASTGS has estimated that, of the employable population, half of them (~9 million) are farmers – both those formally
FIGURE 2: SOURCES OF INSIGHT TO REFINE THE ASTGS AND NAIP APPROACH
600+REPORTS AND DATA SETS ANALYZEDto inform baseline diagnostic exercises, as well as flagship design, impact sizing and feasibility tests
500+GOVERNMENT STAKEHOLDERS ENGAGED IN THE PROCESS from all across Kenya, and across all levels of government including county agriculture executives
150+ORGANIZATIONS INVOLVED, including multinational and indigenous large firms and SMEs, universities, and producerassociations and co-ops
150+EXPERTS CONSULTED from the GoK, IFPRI, ILRI, the Agricultural and Rural Development Donor Group (ARD)V members,academics, and others
~13KENYAN VALUE CHAINS EVALUATED from a broader subset of ~100 produced in the country
SOURCE: Team Analysis

11
M ET H O D O LO G Y A N D A P P ROACH
employed (~340,000) and those in informal employment (~8.3 million).vii
The value added per worker has remained relatively stable between 2006-2016 at ~KES 98,000 per year,viii but lags best-in-class countries in Africa by up to 7x: Nigeria, South Africa and Cape Verde have value added per agricultural worker of ~KES 730,000 per year.9 Low value added per worker implies low levels of technology adoption and investment in labour productivity (e.g., mechanization), and therefore lower incomes.
vii Kenya Economic Survey (20616) from KNBS statistics show ~350,000 formal employees in agriculture. FAO data assumes ~60% of Kenya’s ~13 million informal workers are in agriculture (~8.3 million). KNBS statistics split employment by agriculture, manufacturing and services, so this strategy assumes that all non-farmer employment (e.g., agri-business workers, truck drivers, etc.) are accounted for in manufacturing and servicesviii Current prices (2018). ~KES 85,000 in constant 2010 terms. Only accounts for formal sector employment. Between 2006-16, the value (in constant 2010 terms) has grown at 1% p.a.
Compared to other East Africa Community (EAC) countries, Kenya fares well in availability of food per capita, but is behind in affordability and quality/nutrition. On average, ~30% of households regularly lack enough money for food, with this proportion being as high as 45% in Western Kenya.10 While most Kenyan households report an acceptable level of food quality, rural households and pastoralist communities tend to have lower dietary diversity than national averages, and higher micronutrient deficiencies including iron and Vitamin A.11
FIGURE 3: 14 TESTS OF AGRICULTURAL TRANSFORMATION
Ag GDP growth/contribution vs. overall GDP
Historical Ag expenditures from public sector and private sources, and future estimations
MACRO-ECONOMICENVIRONMENT
Historical trend of farmer income
Food security indicators
SOCIO-ECONOMICFACTORS
Farm size and land use
Top output by production volume and value
Top output yields and yield gaps
Agricultural relevant inputs and post-harvest support
‘Cost curve’ of value of crop per hectare in different conditions
Agricultural relevant infrastructure scores
Level of value-add processing
Cross-border trade potential
Supply/demand analysis for main local food items
AGRICULTURAL ANDFOOD-SPECIFICMETRICS
Current supply/demand of water analysis per basin NATIONALRESOURCES
PRIMARY METRICS OF INTEREST TO SHOW IMPACT AT OUTCOMES LEVEL OF ASTGS
These timeless tests were identified as the most crucial in agricultural transformation analyses
SOURCE: Team Analysis, based on an analysis of >30 transformations around the world, both historic and current.
12
INVESTING IN KENYA’S AGRICULTURAL SECTOR TRANSFORMATION N A I P 2 0 1 9 - 2 0 2 4
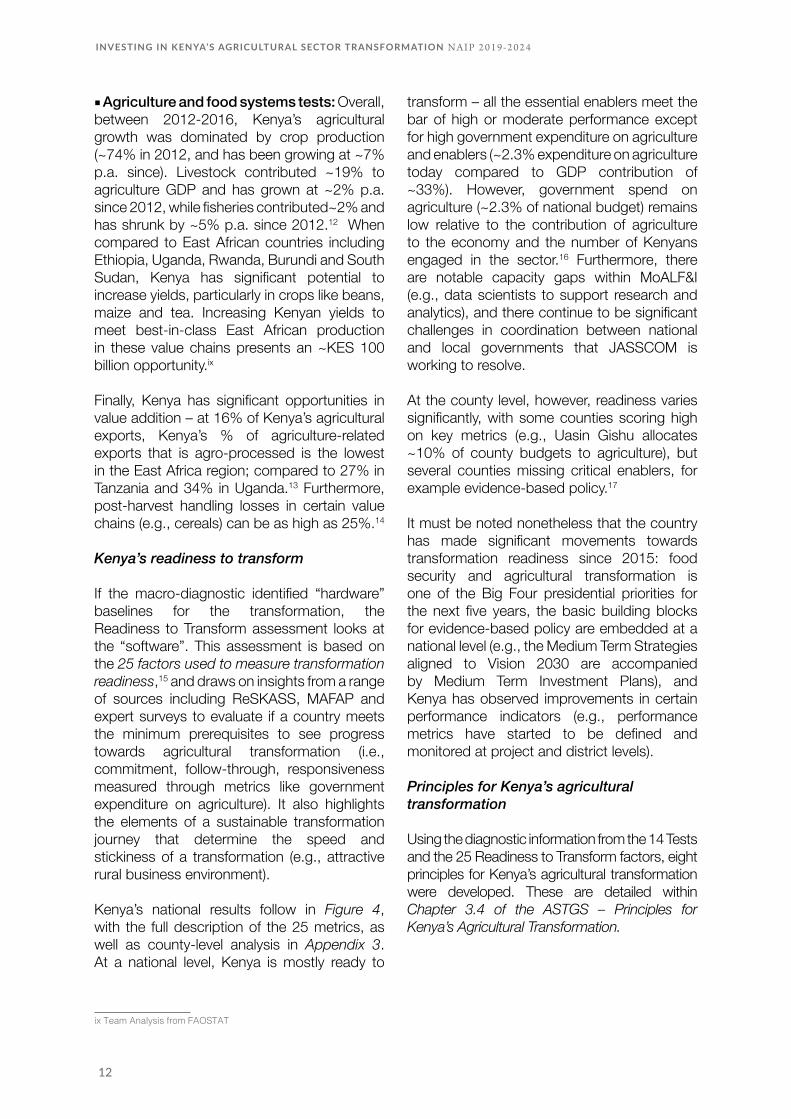
■ Agriculture and food systems tests: Overall, between 2012-2016, Kenya’s agricultural growth was dominated by crop production (~74% in 2012, and has been growing at ~7% p.a. since). Livestock contributed ~19% to agriculture GDP and has grown at ~2% p.a. since 2012, while fisheries contributed~2% and has shrunk by ~5% p.a. since 2012.12 When compared to East African countries including Ethiopia, Uganda, Rwanda, Burundi and South Sudan, Kenya has significant potential to increase yields, particularly in crops like beans, maize and tea. Increasing Kenyan yields to meet best-in-class East African production in these value chains presents an ~KES 100 billion opportunity.ix
Finally, Kenya has significant opportunities in value addition – at 16% of Kenya’s agricultural exports, Kenya’s % of agriculture-related exports that is agro-processed is the lowest in the East Africa region; compared to 27% in Tanzania and 34% in Uganda.13 Furthermore, post-harvest handling losses in certain value chains (e.g., cereals) can be as high as 25%.14
Kenya’s readiness to transform
If the macro-diagnostic identified “hardware” baselines for the transformation, the Readiness to Transform assessment looks at the “software”. This assessment is based on the 25 factors used to measure transformation readiness,15 and draws on insights from a range of sources including ReSKASS, MAFAP and expert surveys to evaluate if a country meets the minimum prerequisites to see progress towards agricultural transformation (i.e., commitment, follow-through, responsiveness measured through metrics like government expenditure on agriculture). It also highlights the elements of a sustainable transformation journey that determine the speed and stickiness of a transformation (e.g., attractive rural business environment).
Kenya’s national results follow in Figure 4, with the full description of the 25 metrics, as well as county-level analysis in Appendix 3. At a national level, Kenya is mostly ready to
ix Team Analysis from FAOSTAT
transform – all the essential enablers meet the bar of high or moderate performance except for high government expenditure on agriculture and enablers (~2.3% expenditure on agriculture today compared to GDP contribution of ~33%). However, government spend on agriculture (~2.3% of national budget) remains low relative to the contribution of agriculture to the economy and the number of Kenyans engaged in the sector.16 Furthermore, there are notable capacity gaps within MoALF&I (e.g., data scientists to support research and analytics), and there continue to be significant challenges in coordination between national and local governments that JASSCOM is working to resolve.
At the county level, however, readiness varies significantly, with some counties scoring high on key metrics (e.g., Uasin Gishu allocates ~10% of county budgets to agriculture), but several counties missing critical enablers, for example evidence-based policy.17
It must be noted nonetheless that the country has made significant movements towards transformation readiness since 2015: food security and agricultural transformation is one of the Big Four presidential priorities for the next five years, the basic building blocks for evidence-based policy are embedded at a national level (e.g., the Medium Term Strategies aligned to Vision 2030 are accompanied by Medium Term Investment Plans), and Kenya has observed improvements in certain performance indicators (e.g., performance metrics have started to be defined and monitored at project and district levels).
Principles for Kenya’s agricultural transformation
Using the diagnostic information from the 14 Tests and the 25 Readiness to Transform factors, eight principles for Kenya’s agricultural transformation were developed. These are detailed within Chapter 3.4 of the ASTGS – Principles for Kenya’s Agricultural Transformation.

13
M ET H O D O LO G Y A N D A P P ROACH
The results of the last two steps of our iterative process (i.e., validate the strategic priorities, develop actionable recommendations for national and county-level governments) bore nine flagships. These nine were filtered through a rigorous process of prioritization for feasibility, impact and value-chain fit for the agro-ecological zones in which the flagships will be implemented. The rest of this chapter will address these areas in detail.
2.3 USE AND LIMITATIONS OF ECONOMIC MODELS
Outside of the extensive interviews conducted, the NAIP process was not conducted through extensive primary research. Instead, the ASTGS and NAIP rely on existing research and a targeted set of new commissioned reports including two Computable General Equilibrium (CGEs) models: IFAD-IFPRI-RIAPA and FAO-MAFAP-JRC. Application of the results of the CGEs to the NAIP adds a layer of dynamic scale effects to the analysis, by modelling economy-wide implications like positive spill-overs to other value chains and parts of the
Kenya is mostly ready to transform with all but two essential enablers at moderate performance or above
FIGURE 4: OVERVIEW OF KENYA’S NATIONAL TRANSFORMATION READINESS
SOURCE: Country strategy documnets; Strategy reviews; Academic papers and reports; Team Analysis
Agric
ultu
re tr
ansf
orm
atio
n re
adin
ess
Responsiveness
Commitment
Follow-throughEssentialenablers
Buildimmediately
Build overtime
National Level Trends
2000
2005
2010
2015
2017
1
2
3
4
5
HIGH PERFORMANCE
MODERATE PERFORMANCE
LOW PERFORMANCE
INSUFFICIENT DATA
High government expenditure on agricultureAg. transformation is a high priority of head of statesAg. policy is driven by evidence more than politicsAg. plan has basic building blocksHigh % of ag. budget disbursedHigh % of ag. budget spent on enablersDemonstrated commitment to policy stabilityGovernment model allows ag. ministry to make policy chargesWillingness to adapt transformation strategy based on evidenceEffective process to coordinate national and local ag. strategyPerformance tracking exists for country ag. strategyEffective delivery of ag. goods and servicesConsultation process across government, donors, and private sectorCapacity of ministries to coordinate ag. policiesAbility to make evidence-based policyPresence of sufficient storage infrastructureAttractive rural business environment Good legal and regulatory framework for agricultural creditGood legal and regulatory framework for seedGood legal and regulatory framework for fertilizerHigh rate of literacyHigh rate of rural electrificationHigh rate of rural telephony infrastructureSufficient port infrastructureSufficient road infrastructure

14
INVESTING IN KENYA’S AGRICULTURAL SECTOR TRANSFORMATION N A I P 2 0 1 9 - 2 0 2 4
economy. These models were used to support value chain and flagship prioritization, as well as verification points for overall impact sizing as described in the rest of this chapter, as well as Chapter 4.4 – A note on impact and the economic models.
These two CGEs have some common foundations, but they simulate the economy through different scenarios, and thus achieve different outcomes.
Common foundations
■ Both models were designed to support the NAIP. However, interactions between the modelling teams building and the teams writing
x xi xii xiii xiv xv
x Includes fruits and nuts xi Beef not explicitly covered in RIAPPA. Used goats, sheep as proxy xii Measures GDP growth elasticity for the whole economy xiii Measures employment elasticity % increase in the agriculture food system employment from a 1% increase in agricultural GDP. Horticulture uses vegetables as proxy, wheat flour uses sorghum and millet as a proxy. Not all jobs are expected to originate within the same value chainxiv Measures value added if a standard increase in demand for the value chainxv Measure increment in the number of jobs of the a standard amount of demand is introduced
the NAIP were limited. While both teams went through extensive iterations on their approach and methodology, these iterations did not necessarily speak to each other. ■ The reports submitted were not run to forecast specific impact of flagship interventions recommended. Rather, both sets of results from the models were interpreted as input into the NAIP writing team. Future NAIPs would benefit from greater integration of these models (and others, e.g., Torero’s work) into the process.■ Natural limitations are common to both, including: very large number of assumptions, limited data, and sample theoretical policy interventions show direction and relative magnitude of impacts on the model’s endogenous variables.
Sample of CGEs used by NAIP Sample of JRC/MAFAP results
SAMPLE CONVERGENCE IN MODEL RESULTS
STAPLE FOOD
OTHER
CASH CROP
Low Medium High
Low
Medium
High
Value addedxiv
Coffee
Beans
Poultry
Job creation potentialxiii
Sugar
GDP potentialxii
Fruitsx
Beefxi
Rice
Dairy
Employment multiplierxv
Low Medium High
Low
Medium
High
Cotton Rice
Beans
Poultry
Tea
Sugar
Fish
Wheat
Beef
Dairy Fruits
Potatoes
Maize
Oil crops
Fish
Potatoes
FIGURE 5: SAMPLE OUTPUT OF THE CGEs USED IN NAIP
Oil crops
Maize
SOURCE: IFPRI-IFAD, MAFAP/JRC

15
M ET H O D O LO G Y A N D A P P ROACH
Different scenarios
Using a 2013 Social Accounting Matrix (SAM), IFAD-IFPRI-RIAPA measures changes in production in a particular value chain, and the impact on the agricultural food system and total economy, including employment effects. This tool provided insights into general equilibrium effects and comparative impact potential across value chains, which was an invaluable addition to the value chain prioritization within the NAIP (Chapter 2.4 – Value Chain Prioritization).■ Using a 2014 SAM, FAO-MAFAP-JRC allocates spend of the entire agricultural budget into one of six areas – extension, input subsidies (maize/fertilizer), irrigation, rural roads, rural health and education, and trade liberalization to determine impacts of these policy interventions on demand and employment by value chain. This tool provided unique insights into general equilibrium effects of potential policy interventions, which improved the approach to flagship prioritization within the NAIP (Chapter 2.5 – Flagship prioritization).
Different outcomes
The models are not directly comparable in many respects – they serve different purposes that this NAIP uses as described above. However, where directionally the results of these models converged, both results were used. For example, both models identified dairy, beef, fish and poultry as value chains with medium to high potential for jobs, value addition and GDP (see Figure 5).
2.4 VALUE CHAIN PRIORITIZATION
Kenya currently produces approximately 100 different value chains (Figure 6).
To identify the highest-potential value chains for agricultural transformation, and therefore priority for ASTGS and the NAIP, these ~100 value chains were investigated using the following sequential questions:
xvi This figure conducts measurements by “marketed agricultural produce”, which measures the value of commodities sold in the market. Value may differ from total production value contribution to GDP
1. What does Kenya grow well? Given Kenya’s agro-ecology, all potential food and horticulture crops, livestock and fish that could be produced were ranked by production value (KES), and the top 11 that drive >90% of marketed valuexvi were selected. Ideally, one would also ask what can Kenya grow well, but data was very limited to support this analysis, and there were limited opportunities for primary research in writing the NAIP. Industrial crops and floriculture dominated this list by value. See Figure 6, bar chart.
2. What are Kenya’s agricultural national priorities beyond food production? The current government priorities for the sector, as articulated in the Big Four, Vision 2030, the MTPs and others address food and nutrition security, modernization of the agriculture sector, and the provision of inputs to the manufacturing sector. Outside of the 11 value chains identified by production value, the answer to this question added four more value chains (for a total of 15) to consider: beans and rice for food and nutrition security, cotton and livestock – including skin and hide – for inputs into manufacturing.
3. What value chains are most aligned with the ASGTS theory of change? Additional consideration was given to identify the value chains that will best support: (i) small-scale farmer income increases; (ii) increased agricultural output (i.e., GDP) and value addition; (iii) improved household food resilience. To answer this question, the NAIP team developed eight criteria, consistent with methods in the extensive primary value chain analysis conducted by the World Bank, UNIDO, USAID, Grow Africa and KAAA and others. See Figure 7 and Figure 8.

16
INVESTING IN KENYA’S AGRICULTURAL SECTOR TRANSFORMATION N A I P 2 0 1 9 - 2 0 2 4
117
Chicken and eggs
Coffee
Dairy
Teas
Sugar cane
Vegetables
Wheat
Cut flowers
Cattle products
Maize
85
71
24
23
23
16
9
8
8
7
Other value chains
BeansChickpeasCowpeas
DolichosFrench beansFrench peas
Garden peasGreen gramsLentils
Pigeon peasSnow peas
LEG
UM
ES
ArrowrootsCassava
CocoyamGinger
Irish potatoesSweet potatoes
Yams
STAR
CH
YR
OO
TS
ApplesApricotsArtichokesAsparagusBananasButternutsCabbagesCarrotsCeleryCoconut
CorianderCourgettesCucumbersDatesDatesEggplantsGarlicGrapesKaleLeeks
LemonsLimesMangoesOnionsOrangesPassionfruitPawpawsPearsPineapplesPumpkin
SpinachSteviaStrawberryTangerinesTomatoesWatermelonsYellow Berries
FRU
ITS
AND
VEG
ETAB
LES
CamelsDucksGoatsPeacocks
PigsQuailRabbitsSheep
Snails
LIVE
STO
CK
PRO
DU
CTS
CER
EALS Amaranth
BarleyMillet
OatsRiceRye
SimsimSorghumWheat
Aloe VeraBambara nutsBees & honeyCapsicumCashews
ChilliesCocoa CottonFeed grassesFreshwater fish
GroundnutMacadamiaMarine fishMushroomPepper
PyrethrumSoya beansSunflowerTobacco
OTH
ERS
Fruits
Top value chains by marketed value, 2016, KES bn
FIGURE 6: LIST OF KENYA’S ~100 PRODUCED VALUE CHAINS
Kenya produces ~100 value chains, with the highest production value coming from tea, livestock products and flowers
SOURCE: KNBS

17
M ET H O D O LO G Y A N D A P P ROACH
xvii xviii
xvii E.g. wheat flour, rice paddy cleaning, frozen fillet, chilled chicken carcass/packed eggs, pasteurized milk, chilled meat, freshly packed flowers, cleaning, grading, packing xviii E.g. white rice, rice powder, chicken nuggets, yogurts, sausages, patties, pre-cut potatoes, chips/crisps
Criteria to narrow down value chains for ASTGS and NAIP priorities
Description Rationale
Production value Current contribution to GDP from production in the value chain
Regional importdemand
Source
Gauges magnitude of increase to ag GDP from value chain expansion
KNBS, IFPRI
Current volume of imports into EAC (including Kenya)
Measures how much additional output the country and regional market can absorb
OEC
Prioritizationcriteria
Competitiveadvantage
Compares farm gate prices with import prices
Determines economic efficiency of domestic production vs. importing
FAO
Potential yieldincrease
% yield improvement potential, based on comparison with peer countries
Estimates potential volume contributions to GDP via inputs, higher-variety seeds etc. Implicitly measures involvement of other value chain players
FAO
Agro-processingpotential
Qualitative assessment based on consideration of primaryxvii, secondaryxviii and tertiaryxviii processing
Estimates the ability of the commodity to improve nutrition in the population
USDA
Smallholdersinvolved
% of total value chain output that comes from smallholders
Estimates the relative importance of value chain to smallholder farmers
Value chain analysis
Nutritional value Shows if commodity has the ability to improve protein intake, micro-nutrients intake, and/or dietary diversity
Gauges relative potential contribution to ensuring food security (nutrition)
Team analysis
Calorific value Relevance to Kenya’s current nutrient deficiency prevalence
Gauges relative potential contribution to food security availability and reducing the caloric deficit
USDA
PILLAR RELEVANCE
ALL
SMALL-SCALE FARMERS
AG OUTPUT / VALUE-ADD
FOOD RESILIENCE
1
2
3
4
5
6
7
8
FIGURE 7: CRITERIA TO SELECT VALUE CHAINS
SOURCE: Team Analysis

18
INVESTING IN KENYA’S AGRICULTURAL SECTOR TRANSFORMATION N A I P 2 0 1 9 - 2 0 2 4
xix xx xxi xxii xxiii xxiv xxv xxvi xxvii xxviii xxix xxx xxxi xxxii xxxiii xxxiv xxxv xxxvi
xix Includes imports into Burundi, Rwanda, South Sudan, Tanzania and Uganda xx Producer price to import price ratio. Import price determined from total import values and volumesxxi UNIDO also considers potential contribution to GDP, current manufacturing value added and spill-over effects on other economic activitiesxxii Captured as domestic and international demandxxiii Captured as price factors (labour costs, cost of data and analytical sources and exchange rates)xxiv Captured as manufacturing value addedxxv USAID also considers participation by a wider range of beneficiaries, including women and vulnerable groups, highest use of productive resources in project area and potential for bankabilityxxvi Captured as importance in agricultural economyxxvii Captured as market potentialxxviii Captured as location-specific advantagexxix Captured as potential for increasing value and volume of marketed productsxxx Captured as impact on food securityxxxi Captured as impact on incomes and integrating producers/farmer groups into value chainxxxii Captured as value addition, premium price capture and industrial usexxxiii Captured as private sector/producer linkages and leveraging private/public sector investmentxxxiv World Bank also looks at existing capacity to realize improvementsxxxv Measured using the Domestic Resource Cost ratioxxxvi Captured as value chain improvement feasibility
Mapping of ASTGS / NAIP criteria to global best practice
UNIDOxxi USAIDxxv World BankxxxivASTGS
PILLAR RELEVANCE
ALL
SMALL-SCALE FARMERS
AG OUTPUT / VALUE-ADD
FOOD RESILIENCE
Production value, 2016 (KES bn)1
Regional demandxix, 2015 (USD mn)2
Competitive advantagexx (units)3
Agro-processing potential (scale)7
Smallholders involved (%)6
Calorific value (kcal/100g)8
Potential yield increase (%)4
Nutrient composition5
xxxvi
xxxv
Value chain prioritization criteria comparison
FIGURE 8: MAPPING OF ASTGS/NAIP CRITERIA TO GLOBAL BEST PRACTICE
xxii
xxii
xxiii
xxiv
xxvii
xxvi
xxviii
xxx
xxix
xxxi
xxxiii
xxxii xxxvi
SOURCE: UNIDO, World Bank, KAAA, “Value Chain Selection Report”, 2015; World Bank, “Kenya Value Chain Competitiveness report”, 2015; USAID-KHCP report, 2015, Government of Kenya, Grow Africa reports, 2014, UNIDO

19
M ET H O D O LO G Y A N D A P P ROACH
4. What value chains are best suited to rural development and dietary diversity? Answering this question requires a dynamic understanding of how agricultural growth impacts rural development – a good use case for the CGEs. In particular, the NAIP used the IFAD-IFPRI-RIAPA model to calibrate the results from questions 1-3, and ensure that no critical value chains with high potential for rural development and dietary diversity were missing. Oil crops were identified as critical for raising incomes, so they were added back to the full set for NAIP consideration, bringing the total to 16 value chains. Oil crops were then subject to the criteria from question three.
Figure 9 shows all 16 value chains identified through this process. In order to further prioritize across these 16, all the value chains were awarded a relative ranking between 1-10, with 10 being the highest for agricultural transformation impact based on the data available. As a simplifying assumption, all criteria received equal weighting. Any value chain with a score of 4 or less (including tea, flowers, cotton, sugar cane) were then de-prioritized for food and nutrition security and agricultural transformation.
Therefore, 13 value chains emerged with the highest potential for food security and agricultural transformation, including: staples (maize, potatoes, rice, beans), horticulture (fruits, vegetables), livestock (beef, poultry, dairy – and where relevant for specific counties sheep/goats, camels), fish, and others as inputs into agro-processing and not necessarily for local production (wheat, palm oil).
xxxvii Own analysis conducted from a combination of data sources including the Kenya Economic Review, Observatory of Economic Data, Central Bank of Kenya, USDA, FAO, IFPRI, One Acre Fund and others
Figure 5 shows the 13 priority value chains for ASTGS by type of crop (i.e., cash, staple, other) ranked for GDP and jobs potential measured using elasticities in the IFAD-IFPRI-RIAPA model. The size of the bubble indicates share of small-scale farmers involved in production. From this graph, sugar and cotton have low relative GDP growth and job potential. While coffee, tea and flowers have high GDP potential, they involve a much smaller share of small-scale farmers in production. And finally, cotton as a non-food crop does not support the core aims of agricultural transformation for food and nutrition security.
In addition to the 13 priority value chains, ASTGS recognizes the importance of the four cash and non-food crops (including tea, flowers, cotton, sugar cane) that ranked low for broad-based agricultural transformation due to their relatively low share of small-scale farmers involved in production (e.g., flowers <3%), limited nutritional benefits (e.g., tea) or low competitive advantages (e.g., non-Bt cotton).xxxvii These value chains are still important contributors to Kenya’s agricultural GDP today. Flowers, coffee and tea alone make up ~70% of Kenya’s total agricultural exports. The ASTGS therefore encourages successful ongoing sector-wide activity to continue in these value chains, mindful that there are some resource trade-offs to continue activity in these value chains versus doubling down on those that support agricultural transformation.

20
INVESTING IN KENYA’S AGRICULTURAL SECTOR TRANSFORMATION N A I P 2 0 1 9 - 2 0 2 4
FIGURE 9: ASTGS VALUE CHAIN PRIORITIZATION MATRIX
Full consideration of Kenya’s agro-ecology, national priorities, prior value chain analysis and CGE output provides 13 value chains for ASTGS
SOURCE: Kenya Economic Review, Observatory of Economic Data, CBK, USDA, FAO, IFPRI, One Acre Fund
Coffee
16 6 No
data
111%
63% 1 5
Beans
18xl
v
133lv
ii
0.8
393
Mxl
vii ,
Pliix
,Fxl
vi
No
data
329 7
Cotton
1xlv 0 0.7
102% No
data
N/A 4
Wheat
8 627
0.8
84%
Fxlvi
No
data
270 6
Rice
6 317
0.7
0% Fxlvi
No
data
151 7
Oil Crops liii
3xlv 6 2
0%liv
Mxl
vii ,
Plii
No
data
567liv
4Poultry xl 9 13 1.
4
9% Mxl
vii ,
Plii
No
data
239 6
Sugarxlii 24 219
No
data
0% 92%
387 6
Tea
117
180
0.6
102%
58% 1 5
Flowers
71 0 No
data
TBD
3% N/A 4
Dairyxxxvix 23 68 2
42%
Fxlvi,
Mxl
vi
No
data 61 8
Banana xxxviii
No
data 80 2 0% M
xlvi
i
80%
xlix 89 7
Fish
No
data 34 No
data
TBD
Mxl
vii ,
Plii
80%
129xl
iv
5
Beef
85xl
iii
13 1 0% Mxl
vii ,
Plii
80-
90%
247 8
Potato
No
data 9 0.4
50%
TBD
83% 77 6
Maize
8 102
3.3
157% Fxl
vi
75%
365 7
1 Pr
oduc
tion
valu
e,
2016
(KES
b)
2 Re
gion
al im
port
dem
and
(USD
mn)
xli
3 C
ompe
titiv
e ad
vant
agexl
viii
4 Po
tent
ial y
ield
in
crea
se (%
)l
5 N
utrie
nt
com
posi
tionli
6 Sm
allh
olde
rs s
hare
of
tota
l pro
duct
ion
(%)
7 Ag
ro-p
roce
ssin
g po
tent
iallv
i
8 C
alor
ific
valu
e (k
cal/1
00g)
Rel
ativ
e tr
ansf
orm
atio
n ra
nk
(10=
high
est)
HIGH
MEDIUM
LOW
ALL
SMALL SCALE
AGRO-PROCESSING
FOOD SECURITY

21
M ET H O D O LO G Y A N D A P P ROACH
Therefore, the ASTGS proposes that where a natural extension of ASTGS activities can efficiently support these value chains, they should be encouraged. For example:
■ Branded tea: Support ongoing “Buy Kenya” campaign and SME knowledge and skills for value-added varieties. ASTGS has a strong emphasis on training SMEs and promoting institutional buying mandates that can extend to branded tea in high tea-growing regions (see Chapter 4 of ASTGS – flagship 1)■ Sugar processing: Extend agri-business training to sugar cane millers (see Chapter 4 of ASTGS – flagship 1)■ Coffee: Protect land for coffee through zoning (Chapter 4 of ASTGS – flagship 9) ■ Cotton: Encourage use of cottonseed for feed (Chapter 4 of ASTGS – flagship 6)
xxxviii Chosen as the proxy for all fruits as it represent 45% of all fruit production by volumexxxix Includes concentrated milk and milkxl Includes meat and eggsxli Imports of value chain into Kenya, Burundi, Rwanda, South Sudan, Tanzania and Ugandaxlii Includes raw sugarcane, sugar, and sweetenersxliii Includes other cattle productsxliv For tilapiaxlv 2005 dataxlvi Fortifiablexlvii Contains micronutrients (e.g. Vitamin A, iron, iodine etc.) or proteinxlviii Import price to producer price ratio. Import price is determined from total import values and volumesxlix For all fruits not just bananasl Based on comparison with regional peers i.e. Ethiopia, Tanzania, Uganda, Rwanda, Kenya, Burundi, and South Sudanli Shows the potential for the value chain for improving 3 nutritional metrics: undernutrition, micro-nutrient deficiency, and proteins. Considered medium potential is it addresses one and high is it addresses 2 or morelii Ability to contribute to protein intake. Indicates that commodity has more than 10g/100g of protein contentliii Contains groundnuts, soybeans, rape & mustard seeds, coconuts, sesame seeds, palm, oliveliv For groundnutslv Considered low potential if lower quartile, high potential if upper quartile and the rest is medium potential. Exceptions are competitive advantage, nutrient composition, and agro-processing potential which have different ranking methodslvi Qualitative measure on the ability of a value chain to be processed furtherlvii Includes all dried legumes.
Finally, the ASTGS and NAIP do not prescribe that the counties strictly adopt the 13 value chains emerging from this process. Rather, the NAIP suggests that counties select value chains that have similar characteristics to the ones selected (e.g., loose/tight, perishable/non-perishable) that are most suited for their agro-ecological zones as identified in Chapter 1.4 of the ASTGS. Given the importance of maize in the diets of Kenyans, Box 2 shares perspectives on maize consumption that counties should consider with respect to the staple they choose for food and nutrition security.
As part of the ASTGS process, the counties have already begun to align the value chains they identified in their CIDPs to the ASTGS priorities, given the flagships they want to implement. See Chapter 5 of the ASTGS.
xxxviii xxxix xl xli xlii xliii xliv xlv xlvi xlvii xlviii xlix l li lii liii liv lv lvi lvii

22
INVESTING IN KENYA’S AGRICULTURAL SECTOR TRANSFORMATION N A I P 2 0 1 9 - 2 0 2 4
lviii lix lx lxi lxii lxiii lxiv lxv
lviii Includes fruits and nutslix Potential to intercrop with maizelx Measures GDP growth elasticity for the whole economylxi Measures employment elasticity % increase in the agriculture food system employment from a 1% increase in agricultural GDP. Horticulture uses vegetables as proxy, wheat flour uses sorghum and millet as a proxy. Not all jobs are expected to originate within the same value chainlxii Used millet, sorghum as proxylxiii List not comprehensivelxiv Not included in RIAPPA model. Used employment multipliers and value add potential of MAFAP/JRC model to determine relative position. Used ‘other crops’ from MAFAP for flowerslxv Beef not explicitly covered in RIAPPA. Used goats, sheep as proxy
GDP numbers subject to change for Maize, Cotton, Coffee, FlowersSize = number of smallholders involved
STAPLE FOOD
OTHER
CASH CROP
Low Medium High
Low
Medium
High
Job creation potentiallxi
GDP potentiallx
FIGURE 10: ROLE OF CASH AND NON-FOOD VALUE CHAINS IN ASTGS
SOURCE: FAO, Grow Africa Kenya, KAAA value chain analysis, World Bank, SNV, USAID, KNBS, IFPRI-IFAD, MAFAP/JRC
Maizelix
FruitslviiiBeeflxv
Oil crops
Coffeelxiv
Sugar Wheatlxii
Rice Fish
Cottonlxiv
Tea lxiv Flowerslxiv
Beans Dairy
Potatoes
Poultry
Ongoingactivitieslxiii
Proposed role for ASTGS
BrandedTea
“Buy Kenya”SME capacity building for value-added tea
Flowers
Sugar
Coffee
Cotton
Institutional buying from 1,000 SMEs, train youth on value-add method
Marking all exported flowers with Kenya as country of origin
On commercial farms, support Kenya branding efforts
Improved cane testing/weighing – sucrose content is taken into account
Invest in weighing /testing equipment and SME capacity building
Promoting local consumption“Coffee Kenya Mark of Origin”
Promote local brands via SMEsProtect coffee land use
“Buy Kenya”Cotton Processing and Marketing Project
Allow for cotton post-harvest handling with other VCs, use of cotton seed for feed

23
M ET H O D O LO G Y A N D A P P ROACH
lxvi lxvii
2.5 FLAGSHIP PRIORITIZATION
The strategy recommends nine flagships for implementation within the first five years of the ASTGS, and they were prioritized for high feasibility and impact. Of these, the six “anchor” flagships drive increases in small-scale farmer incomes, agricultural output and value addition, and household food resilience. The three “enabler” flagships focused on knowledge and skill building, data and research; and food system risks in sustainability, climate, pests, diseases and global commodity price shocks were then deduced from the delivery needs of the anchor flagships.
Feasibility and impact are defined as follows:
■ High feasibility: this is an iterative qualitative assessment made in consultation with key stakeholders. A flagship must satisfy all the feasibility requirements, including:– political feasibility: how much a flagship aligns with both national and county priorities and commitments (e.g., strategy does not
lxvi From 73 kg/capita/year in 2006 to 58 kg/capita/year in 2016lxvii Team analysis based on data on the changes in the commodity composition of food in sub-Saharan Africa from FAO, World Agriculture Towards 2030/2050
prescribe where agro-processing facilities are set up, but rather outlines criteria for counties to bid competitively to host one depending on their county-level priorities)– administrative feasibility: can the public sector implementing party access the resources and capabilities required to effectively deliver on a flagship within five years? (e.g., new national government dam builds were deprioritized, in lieu of accelerating plans to rehabilitate existing ones)– potential investor, development partner, and private sector/not-for-profit implementer buy-in: how excited these stakeholders are to engage with a flagship as a potential funder or implementer
■ High impact: an iterative quantitative assessment made once a flagship was deemed feasible. Impact sizing is based on top-down estimates, with logic fully explained in Chapter 4 of the NAIP. A flagship must impact at least one of the following in the first five years:
BOX 2: PERSPECTIVE ON MAIZE VALUE CHAIN GROWTH TRENDS
Of the 13 focus value chains for ASTGS, maize is particularly important for Kenyan household consumption and small-scale farmers. 2016 local production was 3.3 million tonnes compared to 3.9 million tonnes of demand, with small-scale farmers growing >75% of this volume, and the deficit satisfied by imports.18 Cereals, including maize, form ~41% of all calories currently consumed in the Kenyan diet. Maize accounted for 56% of all calories consumed from cereals and 23% of the total calorific intake for Kenyans, the highest of any value chain.
The average per capita consumption of maize for food has dropped at ~3% per annum over the past decade.lxvi Trends like this are often observed either if food security has worsened, or if average incomes of Kenyans have increased and therefore consumer preferences have changed and per capita consumption of maize has declined. Without doing a causal analysis, one would infer from Kenya’s 2014 move into lower middle-income country status that the former effect has been stronger than the latter.19 Further, forecasts for sub-Saharan Africa over the next three decades predict that the growth in maize consumption will be slower than other food groups such as meat, sugars and vegetables oils, which will grow at ~2x the rate of maize consumption.lxvii
Many countries that undergo agricultural transformation, after initial yield increases in staple food crops, eventually exhibit slow growth in cereal consumption as consumer preferences diversify from cereals and roots to more meat, oils and processed foods; even when one accounts for the additional feed production required. For example, China – a country amid an agricultural transformation, is projected to have a 36% decline in maize consumption between 1990 to 2026.20

24
INVESTING IN KENYA’S AGRICULTURAL SECTOR TRANSFORMATION N A I P 2 0 1 9 - 2 0 2 4
– affects at least 500,000 small-scale farming households across the country (~10% of estimated rural agricultural employment).lxviii Direct impact to a material number of farmers is expected to have a positive impact beyond those farmers’ individual households, because agriculture has strong linkages to the broader economy (e.g., trade and transport).21 10% is the threshold ASTGS set for “material”, informed through expert consultations. It is important for these ~500k to cover a significant part of the country – contributes at least KES 10 billion to agricultural GDP (~0.3% of estimated agricultural GDP in five years).lxix This threshold was validated by stakeholders for materiality, relative to the impact of large ongoing Ministry projects (see Appendix 2 for full list)– involves a high-impact intervention identified in the economic models generated for the strategy. For example, a MAFAP/JRC joint report commissioned for ASTGS simulates several policy scenarios, and finds the highest impact from investments in extension, input subsidies and rural roads to provide market access.lxx, 22
Figure 11 maps out the flagships that were derived from this process for their feasibility and impact. The assumptions underlying the impact and cost calculations are detailed in Chapter 4; however, it is worth noting that the highest GDP uplift of ~KES 150-185 billion cumulative over 5 years comes from the new farms – the flagship designed to boost agricultural GDP. We assume a relatively high feasibility for this flagship because there is a significant amount of private sector interest in funding such a project, with infrastructure investments already in place (e.g., the Lamu Port-South Sudan – Ethiopia Transport – LAPPSET Corridor project is already underway) that can enable such projects to thrive – if procured properly.
lxviii While ~75-80% of Kenyans earn income from agriculture, the Kenya Economic Survey for wage employment identifies ~340,000 formally employed in agricultural sector works. Working team further estimated that the agricultural share of informal employment is ~60% (~8.3 million), based on information from a 2016 JRC report. So, the total estimated farmers is ~8.6 million. Then assumed that ~70% of the informal workers are rural = ~5.8mlxix If continue to grow sector at 5% p.a. from KES 2.3tn in 2016 (extrapolated baseline to KES 2.9tn), will reach ~KES 3.7tr by 2023lxx Note from authors: “We recognize the limitations of analysis like this for making robust policy recommendations, given the approach of simulating policy changes. A more detailed regional and household level model is required to better inform policy”
Closely following GDP contribution is the ~KES 135-165 billion from the subsidies programme, which impacts over two million Kenyan farmers (~half of all farmers who are responsible for ~60% of Kenya’s production today). This is the flagship with the widest reach, so the magnitude of impact is not surprising. The cost of this programme is ~2-4% of total five-year NAIP cost (KES 5-10 billion), assuming there is already ~KES 25 billion over this time period for subsidies that is already in budget and can be reallocated.
However, the subsidies programme is moderately difficult to implement due to administrative challenges: all farmers must register to have an effective targeting and performance management system for the subsidies. Building the supporting infrastructure for subsidies requires several stakeholders, including the registration platform and others. And finally, GoK would have to shift the current allocation of resources from the existing maize and fertilizer subsidies to this new flagship.
Finally, while individual flagships can be significant contributors to impact, it is critical to consider the full set of flagships as a portfolio of interventions that work together to deliver agricultural transformation. A single focus on any one will not support a system-wide modernization of the sector. Equally, sequencing across the portfolio for quick wins and interdependencies is important. Chapter 6 of the NAIP discusses the implementation process and sequencing in more detail.
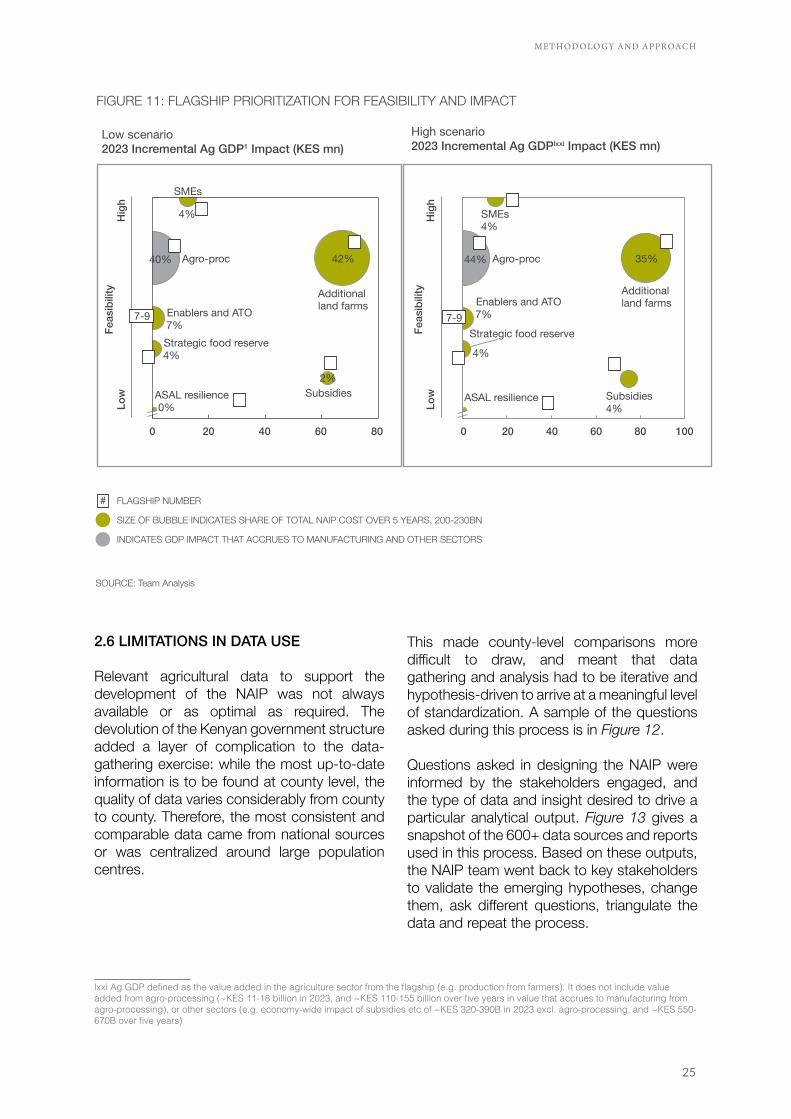
25
M ET H O D O LO G Y A N D A P P ROACH
lxxi 2.6 LIMITATIONS IN DATA USE
Relevant agricultural data to support the development of the NAIP was not always available or as optimal as required. The devolution of the Kenyan government structure added a layer of complication to the data-gathering exercise: while the most up-to-date information is to be found at county level, the quality of data varies considerably from county to county. Therefore, the most consistent and comparable data came from national sources or was centralized around large population centres.
lxxi Ag GDP defined as the value added in the agriculture sector from the flagship (e.g. production from farmers). It does not include value added from agro-processing (~KES 11-18 billion in 2023, and ~KES 110-155 billion over five years in value that accrues to manufacturing from agro-processing), or other sectors (e.g. economy-wide impact of subsidies etc of ~KES 320-390B in 2023 excl. agro-processing, and ~KES 550-670B over five years)
This made county-level comparisons more difficult to draw, and meant that data gathering and analysis had to be iterative and hypothesis-driven to arrive at a meaningful level of standardization. A sample of the questions asked during this process is in Figure 12.
Questions asked in designing the NAIP were informed by the stakeholders engaged, and the type of data and insight desired to drive a particular analytical output. Figure 13 gives a snapshot of the 600+ data sources and reports used in this process. Based on these outputs, the NAIP team went back to key stakeholders to validate the emerging hypotheses, change them, ask different questions, triangulate the data and repeat the process.
Feas
ibili
ty
Hig
h Lo
w
60 8040200
Feas
ibili
ty
Hig
h Lo
w
Low scenario2023 Incremental Ag GDP1 Impact (KES mn)
High scenario2023 Incremental Ag GDPlxxi Impact (KES mn)
FLAGSHIP NUMBER
SIZE OF BUBBLE INDICATES SHARE OF TOTAL NAIP COST OVER 5 YEARS, 200-230BN
INDICATES GDP IMPACT THAT ACCRUES TO MANUFACTURING AND OTHER SECTORS
#
FIGURE 11: FLAGSHIP PRIORITIZATION FOR FEASIBILITY AND IMPACT
4%
42%
4%
0%
7%
SMEs
Subsidies2%
Agro-proc40%
Additional land farms
Strategic food reserve
ASAL resilience
Enablers and ATO7-9
4%
4%
35%
4%
7%
SMEs
Subsidies
Agro-proc 44%
Additional land farms
Strategic food reserve
ASAL resilience
Enablers and ATO 7-9
60 10040200 80
SOURCE: Team Analysis

26
INVESTING IN KENYA’S AGRICULTURAL SECTOR TRANSFORMATION N A I P 2 0 1 9 - 2 0 2 4
Sample research questions across all flagships
What value chain will drive the highest impact (i.e., jobs, incomes, GDP output) for the flagship in question? Where does it grow?
How can we design a transformational intervention that builds on lessons learned from Kenya’s implementation history as well as global case studies?
What is the likely impact of the intervention on the metrics we care most about?
Sample research questions specific to flagships and enablers
Flagship 1: What should we use to determine the highest productivity zones? What proxies exist for demand, supply and market access (e.g., population, yields, road networks)?
Flagship 2: What is the impact of current fertilizer subsidies on maize yield increases? How can subsidies better increase productivity?
Flagship 3: Why is Kenya’s value added from processing below regional peers? What are the barriers to entry into agro-processing?
Flagship 4: What government-owned land is suitable for commercial farming? What are the water sources available to irrigate this land?
Flagship 5: What are the design elements of high-performing strategic food reserve (SFR) systems? What is the optimal target size for Kenya’s SFR?
Flagship 6: What are the barriers to scaling up successful resilience interventions in ASAL area?
Flagships 7-9: What cross-cutting interventions do we need to support pillar flagships (e.g., flagship 1 – what inputs do agro-dealers need to stock for the value chains and agro-ecology of that region?)
FIGURE 12: SAMPLE QUESTIONS TO SUPPORT HYPOTHESIS-DRIVEN APPROACH
SOURCE: Team Analysis

27
M ET H O D O LO G Y A N D A P P ROACH
FIGURE 13: SAMPLE DATA SOURCES AND ANALYTICAL OUTPUT GENERATEDNOT EXHAUSTIVE
Source Type of data / insight used Analytical output Sample use within ASTGS
IFRPI
RIAPA model GDP and job creation potential by value chain
Chapter 4 -- Theory of Change, Value Chain Selection
Yields, workers per farm, maize contribution to Ag GDP
Chapter 5 - Flagship Projects (Arable land flagship, making the case for shifting away from maize dependency)
Strategic food reserve best practices
SFR recommendations for Kenya Chapter 5 - Flagship Projects (SFR -- strategic food reserve -- recommendations)
Global hunger index scores
World Bank
Consumption data Share of household expenditure spent on food
Chapter 5 -- Flagship Projects (SME)
Kenya Value Chain Competitiveness report (2015)
Value chain analysis of dairy, animal feed, juice, meat, fish
Chapter 4 -- Theory of Change, Value Chain Selection
Ease of Enabling Agriculture in Kenya
Benchmarks on key agriculture enablers in Kenya vs. SSA
Chapter 2 -- Diagnostic
World development statistics Depth of food deficit, EAC population, time/cost to import/export
Chapter 5 -- Flagship Projects (SME)
Tegemeo
Climate change impact Expected price increases Chapter 5 -- Flagship Projects (SME)
Smallholder maize production efficiency in Kenya (2012)
Maize yields productivity Chapter 5 - Flagship Projects (SME flagship and subsidy flagship, potential impact from maize yield improvements)
FAO
Agro-industrial parks - Experience from India
Cases studies of successful agro-industrial parks
Chapter 5 - Flagship Projects (Agroprocessing -- recommendations)
Food security indicattors Per capita food supply variability, share of energy from cereals & roots,
Chapter 5 -- Flagship Projects (SME)
Data status in Kenya State of Data availability, handling and uses in Kenya
Chapter 5 -- Flagship Projects (Enablers)
Horn of Africa Crisis Report Size of vulnerable population in the ASAL
Chapter 5 - Flagship Projects (SFR -- impact sizing)
SAM Model (MAFAP/JRC) GDP and job creation potential by value chain
Chapter 4 -- Theory of Change, Value Chain Selection
GIZ
Assessing Vulnerability of Communities and Livelihood Systems in Turkana and Marsabit Counties
Case studies on successful interventions to increase resiliency in agriculture
Chapter 5 - Flagship Projects (ASAL resiliency)
Baseline report- Food Nutrition and Security
Facts on nutrtion, women and children Chapter 5 -- Flagship Projects (SME)
Baseline report for Trilaterial Tilapia Cooperation (Aquaculture)
Case studies on successful aquaculture
Chapter 5 -- Flagship Projects (SME)
Economics of Land Degradation Initiative: Kenya Project Report on costs and benefits of sustainable soil fertility management in Western Kenya
Sustainable land management, soil Chapter 5 -- Flagship Projects (SME)
Green Innovation Baseline study: Country report Kenya
Value chain analysis on sweet potatoe & dairy
Chapter 5 -- Flagship Projects (SME)
Programmatic and Institutional overview of CAADP
Understand CAADP commitments and processes
Chapter 5 -- Flagship Projects (SME)

28
INVESTING IN KENYA’S AGRICULTURAL SECTOR TRANSFORMATION N A I P 2 0 1 9 - 2 0 2 4
Source Type of data / insight used Analytical output Sample use within ASTGS
USAID
Climate change data Projected rainfall and temperature changes
Chapter 5 -- Flagship Projects (SME)
KAVES value chain analysis - various
Productive areas, yields, types of SMEs by value chain, historica & projected per capital consumption of maize
Chapter 5 -- Flagship Projects (SME); Chapter 5 -- Flagship Projects (Arable land flagship, making the case for shifting away from maize dependency | SME flagship, calculating impact)
Kenya Horticulture Competitiveness Project report, 2015
Horticulture value chain analysis Chapter 4 -- Theory of Change, Value Chain Selection
Kenya Livestock End Market Study
Baseline livestock production and productivity
Chapter 5 - Flagship Projects (SMEs)
IFAD
IFAD-Public Private Producer Partnership cases
Regional and international cases of projects completed under PPP
Chapter 4 - Agroprocessing
IFAD-IFPRI Draft VC Prioritization 020518
Yields, employment, Growth and Employment Linkages
Chapter 4 - impact sizing of both flagships
JICA
AECT & JICA Irrigation analyses
Irrigation for agricultural transformation Chapter 5 -- Flagship Projects (SME)
National Water Master Plan 2030
Water balance by catchment area, Existing irrigation schemes, water consumption (current and future)
Chapter 5 -- Flagship Projects (SME, Arable land, sustainability)
Northern Corridor Development Plan
Alternative livelihoods and development trajectories in Norhter Kenya
Chapter 5 - Flagship Projects (Increase resilience of crop and animals in ASALs)
ILRI Milk production Historic milk yields, production Chapter 5 - Flagship Projects (SFR, Increase resiliency, SMEs)
KNBS
2017 Economic Survey (food prices)
GDP increase due to increased production, GDP and employment split by sector, production, import, consumption volumes, wholesale retail prices
Chapter 5 - Flagship Projects (Increase resilience of crop and animals in ASALs)
County Statistical Abstracts Arable land areas in ASALs Chapter 5 - Flagship Projects (Increase resilience of crop and animals in ASALs)
Kenya Demographic and Health Survey
Prevalence of stunting, Food consumption scores
Chapter 5 - Flagship Projects (Increase resilience of crop and animals in ASALs, SFR)
Other GoK (e.g., Ministry of Lands Spatial Plan)
2016/17 and 2017/18 Budget Statements
Budget allocation for Strategic Food Reserve
Chapter 5 - Flagship Projects (SFR)
Economic review of Agriculture (2015)
Idenitfication of highest production per county
Chapter 5 - Flagship Projects (Agro-processing)
EPZA Annual Report Identification of existing and future EPZ zones, the role of agroprocessing within zones
Chapter 5 - Flagship Projects (Agro-processing)
Kenya Food Security Steering Group Biannual Assessments
Size of vulnerable population in the ASAL
Chapter 5 - Flagship Projects (SFR)
Ministry of Agriculture - Economic review of agriculture
Yields and production volumes Chapter 5 - Flagship Projects (ASAL resilience)
National Irrigation Board List of existing irrigation schemes in Kenya
Chapter 5 - Flagship Projects (Arable land)
National Spatial Plan (2015-2045)
Understanding of land usage in Kenya Chapter 5 - Flagship Projects (Arable land)
Public Finance Management Act
Mandate of SFRTF Chapter 5 - Flagship Projects (SFR)
Socioeconomic Atlas of Kenya
Economic Development, Rural Development

29
M ET H O D O LO G Y A N D A P P ROACH
The ability to run analyses and test hypotheses is limited by the quality of data available – particularly on impact. While there are many working models with available data, insights are not always immediately apparent. For instance, in consultation with ILRI about modelling impacts of interventions in ASAL counties in Kenya, it was clear that models for the complex processes of ASAL livestock and livelihoods are either incomplete or absent. The development team used, as noted, RIAPA elasticities and many other tools. But this
project did not allow for working partnerships with modellers to run specific scenarios. The modelling teams produced reports for the NAIP working team that were pre-determined (including defining their own scenarios) and not interactive with the strategy and NAIP development. Future efforts to arrive at a more accurate view of expected impact should ideally allow for the development team to run their own scenarios, ensuring that indirect effects of the interventions that cascade through other sectors of the economy are captured as well.
Source Type of data / insight used Analytical output Sample use within ASTGS
OTHER
APHILIS Post harvest losses Chapter 5 - Flagship Projects (Increase resilience of crop and animals in ASALs, SFR)
ARD website Annual development partner ag. funding to ASALs
Chapter 5 - Flagship Projects (ASAL resilience)
Dalberg -- Business case for regional potato value chains in East Africa
Yields for potatoes Chapter 5 - Flagship Projects (Arable land)
Data Africa Rainfall variability Chapter 5 - Flagship Projects (Increase resilience of crop and animals in ASALs, SFR)
Deloitte - Kenya Economic Outlook, 2016
Subsidy expenditure Chapter 5 - Flagship Projects (SMEs, subsidies)
EIU -- Various Readiness assessment (several factors e.g., storage facilities)
Chapter 3 -- Why Agricultural Transformation
Global food security index Macronutrient availability Chapter 5 - Flagship Projects (Increase resilience of crop and animals in ASALs, SFR)
Grow Africa Reports (Various, 2014)
Value chain analysis of dairy, rice, sufarcane, livestock, mango
Chapter 2 - Kenya's Agricultural Context, Value chain selection
KAAA, “Value Chain Selection Report
Value chain analysis of dairy, beef, maize, potatoes, sugarcane
Chapter 2 - Kenya's Agricultural Context, Value chain selection
Kenya Land Alliance -- Land use in Kenya - the case for national land use policy
Available land and its suitability Chapter 5 - Flagship Projects (Arable land)
MIT Atlas OEC import/export data
Major agricultural export/import values Chapter 2 - Kenya's Agricultural Context
RATIN Storage capacity and location, cereal prices
Fact base for food security pillar
Rwanda National Strategic Grain Reserve Ops Manual
SFR recommendations for Kenya Chapter 5 - Flagship Projects (SFR)
UNICEF nutrition statistics Child stunting, vitamin A supplementation
Chapter 5 - Flagship Projects (Increase resilience of crop and animals in ASALs, SFR)
WFP VAM commodity prices Wholesale prices for food commodities Chapter 5 - Flagship Projects (SFR)


31
F L AG SH I P P RO J ECTS A N D D E L I V E RY OV E RV I E W
3.1 OVERVIEW OF TRANSFORMATION IMPACT TARGETS
The overall objective of the NAIP is to accelerate the transformation of Kenya’s agriculture towards a vibrant, commercial and modern agricultural sector that sustainably supports Kenya’s development and 100% food security goal in the context of devolution, CAADP and the SDGs. To this end, there are three main outcomes for which targets are set for the NAIP: 1) increases in small-scale farmer incomes (includes only income from agricultural activities) and the number of farmers benefiting from the strategy, 2) increases in agricultural GDP and value addition, 3) reduction in food-insecure population and a reduction in the cost of food.
The NAIP’s three overarching outcomes targets have been selected to closely align with the Sustainable Development Goals (SDGs), CAADP and the Big Four: the goal of raising small-scale incomes is from SDG Target 2.3, the agriculture GDP growth targets are derived directly from
0 3F L AG S H I P P R OJ E C T S A N D D E L I V E RY OV E RV I E W

32
INVESTING IN KENYA’S AGRICULTURAL SECTOR TRANSFORMATION N A I P 2 0 1 9 - 2 0 2 4
CAADP’s target of 6% expansion per year, and the food security target captures the Big Four’s goal of 100% food and nutrition security. To ensure close coordination with the other three priority areas of the Big Four, the MoALF&I will work with the Presidential Delivery Unit (PDU) to ensure that targets set for these areas reflect any relevant linkages with the implementation timeline and target of the NAIP.
The estimated impact of the NAIP interventions on these three target metrics is shown in Figure 14. The individual contribution from each flagship, as well as an explanation of drivers of this impact, are summarized in Chapter 4.2. Given the alignment of these output metrics to CAADP, it is important to note that the CAADP nutrition outcomes that are critical to supporting food security (e.g., reduction in stunting and malnutrition) will be collected as
part and parcel of M&E for the transformation, even if they are not headline metrics (see Chapter 5.2).
Comparing the impact of the NAIP on the headline metrics to the estimated baseline scenario (i.e., business-as-usual without the NAIP), the expected impact is equivalent to an increase in small-scale farmer income from agricultural activities of up to ~35% for the small-scale farmers impacted, and an agriculture GDP uplift of ~5% in five years (Figure 15).

33
F L AG SH I P P RO J ECTS A N D D E L I V E RY OV E RV I E W
lxxii lxxiii lxxiv lxxv lxxvi lxxvii lxxviii lxxix lxxx
lxxii Based on Big Four targets, unless otherwise statedlxxiii Assume KES ~145,000 for 2017/18 based on FAO Family Farming Knowledge Platform data (2005 household income of USD 2,819 in 2009 international dollars; income from farm is 60%), and income CAGR if 3% (based on historical GDP per capita CAGR)lxxiv Based on SDG goal of doubling smallholder income between 2016 and 2030, and assuming constant CAGR over this period lxxv In addition to farmers impacted, we have estimated a cumulative ~200-300k direct on- and off-farm jobs. Does not include indirect jobs through economy-wide multipliers; estimate ranges exist, with differing assumptions shown in the NAIPlxxvi Take 2016 Ag GDP from Kenya Economic Survey and apply 5% CAGR (based on 2012-16 historical CAGR)lxxvii Based on CAADP-Malabo targets of 6% CAGR in agriculture GDPlxxviii Non-ASAL food-insecure population (~10 mn people, based on the National Food and Nutrition Security Policy Implementation Framework) will be addressed indirectly through Flagships 1-4 (see next page for details), which will increase production and reduce food prices, and also through the income-boosting effects of Flagships 1-2lxxix Aspirational case is 100% coverage of the average food-insecure population (taking % of population that is food-insecure from 2008-2017 and extrapolating to the 2022 population); conservative case is 100% coverage of minimum food-insecure population size; assume linear ramp-uplxxx Based on Big Four target of 100% food and nutrition security, and average ASAL food-insecure population of 2.7 mn over 2008-2017
Through agricultural transformation, these flagships will help Kenya achieve food security aspirations, CAADP and SDG commitments
TransformationAnchor Transformation metrics Annual impact estimates
SMALL-SCALEFARMERINCOMES
Average annual small-holder income,lxxiii
KES ‘000 per household
229210191176
INCREASEAGRICULTURALOUTPUT AND VALUE ADD
Agriculture GDP,KES tn
3.93.73.5 3.9lxxvii
BOOST HOUSEHOLDFOODRESILIENCE
Food insecure population,mn (ASAL region onlylxxviii)
0-1.3lxxix0.5-1.61.1-1.8
2.71.6-2.1
2.2-2.5
0lxxx
Farmers directly impacted by transformationlxxv, mn
3.33.32.7
0
20.9
Baseline Year 2 Year 3Year 1 Year 4 Year 5
BASELINE
ASTGS RAMP-UP
5 YEAR TARGETlxxii
192lxxiv
FIGURE 14: ESTIMATED IMPACT OF THE TRANSFORMATION
145 161
2.9lxxvi 3.1 3.3
SOURCE: Kenya Economic Survey; World Bank; MAFAP; CAADP Results Framework; Big Four targets; FAO Family Farming Knowledge Platform

34
INVESTING IN KENYA’S AGRICULTURAL SECTOR TRANSFORMATION N A I P 2 0 1 9 - 2 0 2 4
lxxxi lxxxii
In addition to the agriculture GDP uplift, the ASTGS flagships will also increase Kenya’s GDP in other sectors, for example manufacturing GDP from production in the agro-processing hubs of flagship 3, and services GDP from the trading activities of the 1,000 SMEs of flagship 1. This incremental total GDP was calculated in the following way:
Anchors 1 and 3: Estimated ~55% of value addition from small-scale farmers is non-agriculture GDP given the ratio between the marketed value of estimated small-scale farmer production and total income earned from production (~45%), or profit margins where available for certain value chains
lxxxi Includes only income from farming activities; assume KES ~145,000 for 2017/18 based on FAO Family Farming Knowledge Platform data (2005 household income of USD 2,819 in 2009 international dollars; income from farm is 60%), and income CAGR if 3% (based on historical GDP per capita CAGR)lxxxii Baseline scenario constructed using 2016 baseline of KES 2.3 bn (2016 prices) from KNBS data, inflating to 2018 prices using inflation rate from Central Bank of Kenya, and then growing at CAGR of 4.8% based on historical agriculture GDP 2012-2016 CAGR (this growth rate is higher than the IFAD-IFPRI RIAPA model’s business-as-usual CAGR of 3.6%)
Anchor 2: Estimated that all the capital costs associated with new farms and agro-processing (e.g., construction, clearing land) accrue to other sectors
In total, the NAIP is expected to increase Kenya’s overall GDP by KES 330-410 billion in five years, equivalent to 3-4% of Kenya’s baseline GDP. As shown in Figure 16, most of this incremental GDP (~80%) will come from the increased production due to the new farms and subsidies flagships. These estimates do not include the GDP impact from building agriculture-supportive infrastructure (roads, power).
Transformationanchor Transformation metrics Baseline scenario vs NAIP
INCREASESMALL-SCALEFARMERINCOMES
Average annual smallholder income,lxxxi
KES ‘000 per household149
INCREASEAGRICULTURALOUTPUT AND VALUE ADD
Agriculture GDP,lxxxii
KES tn
+35%161 154176
159191
164
210169
229
YEAR 1 YEAR 3 YEAR 4YEAR 2 YEAR 5
BASELINE SCENARIO
NAIP RAMP-UP
3.1 3.1 3.2 3.3 3.4 3.5 3.6 3.7 3.7 3.9 +5%
Baseline vs. uplifted small-scale farmer incomes and agricultural GDP
FIGURE 15: IMPACT OF UPLIFTED INCOMES AND GDP FROM BASELINE
SOURCE: Kenya Economic Survey; World Bank; MAFAP; CAADP Results Framework; Big Four targets; FAO Family Farming Knowledge Platform

35
F L AG SH I P P RO J ECTS A N D D E L I V E RY OV E RV I E W
lxxxiii lxxxiv The NAIP’s expected impact on each of the target metrics, as shown on the above Figures, has been estimated based on assumptions from each flagship, of which the major ones are outlined in Figure 17.
lxxxiii Numbers may not sum to total due to roundinglxxxiv Baseline scenario estimated by using historical agriculture and overall GDP data from Kenya Economic Survey and applying baseline scenario CAGR from the IFAD-IFPRI RIAPA model
It is important to note that the estimates in this NAIP across both cost and impact are focused on the agricultural sector cost and impacts – not economy-wide. There will therefore be indirect benefits (and potential costs) of implementing the NAIP that are not fully accounted for, especially because, in Kenya, 1% of growth in agriculture is estimated to drive 1.6% overall GDP growth, according to the IFPRI-RIAPA model.
INCREMENTAL AGRICULTURE GDP, KES bn
INCREMENTALOVERALL GDP,KES bn
YEAR 5
GDP impact from NAIP
FIGURE 16: INCREMENTAL CONTRIBUTION TO AGRICULTURE AND TOTAL GDP
SOURCE: Kenya Economic Survey; IFAD-IFPRI RIAPA model; team analysis
NAIP impact on agriculture GDP and overall GDPlxxxiii, KES bn
47-5764-78
100-130140-170
AGRO-PROCESSING FLAGSHIP
NEW FARMS FLAGSHIP
SUBSIDIES
SMES
ASAL RESILIENCE
INCREMENT AS % OF BASELINElxxxiv
1-2% 4-5%3-4%2%
3-4%
330-410
21-25
1%
7-912-15
2
19-2322-26
8
22-2731-37
131
45-5547-56
141
67-82
62-75151
YEAR 1
1%
72-9025-3416-1928-33
31
YEAR 2
2%
130-160
YEAR 3
2%
180-250
YEAR 4
3%
240-300
25-3442-5148-5814-17
2
36-5149-6069-8324-282-4
11-18100-120
100-12025-31
24
11-18
150-190
140-170
27-333-6

36
INVESTING IN KENYA’S AGRICULTURAL SECTOR TRANSFORMATION N A I P 2 0 1 9 - 2 0 2 4
lxxxv lxxxvi
3.2 OVERVIEW OF FLAGSHIPS AND DELIVERY MECHANISM
The NAIP consists of nine flagship projects, organized around the three transformation anchors of 1) increasing small-scale farmer and fisherfolk incomes, 2) increasing agricultural output and value addition and 3) boosting household food resilience, supported by a set of three enablers, see Box 3 below.
lxxxv Boosting food resilience anchor was <1% contributor to impact and <4% to cost, therefore assumptions not shownlxxxvi Only one scenario for enablers and delivery mechanism
These nine big ideas should be considered as an entire portfolio of interventions. Farmers in every single county have the potential to benefit from at least five flagships – the new subsidy programme (flagship 2), the national strategic food reserve (flagship 5), and the three enablers around knowledge and skills, research and analytics, and sustainability and climate change.
FIGURE 17: MAJOR ASSUMPTIONSlxxxv ON COST AND IMPACT ESTIMATES
Overall High case
Increase small-scale farmerincomes
All farmers affected by SMEs are also beneficiaries of subsidies Calculate weighted average yield increase (~24%) based on closing yield gaps to best-in Africa by 50%
Low case
~40% of total small-scale farmers (~1 mn farmers) benefit
~30% of total small-scale farmers (~0.8 mn farmers) benefit
Anchor
Average subsidy cost per farmer is KES 5,000 which can cover sufficient lime (~KES 1,600 for 1.2 acres) and other farmer desired inputs for KES 3,400
~60% of total small-scale farmers (~1.4 mn households) receive subsidies
~50% of total small-scale farmers (~1.2 mn households) receive subsidies
Increaseagricultural outputand value addition
6 agro-processing projectsGross profit margin is 35%Internal Rate of Return (IRR) and cost modified from Ethiopia case for Kenya specifics
Each project has KES 15 bn capital outlay, spread over 3 years16% IRR
Each project has KES 20 bn capital outlat, spread over 3 years17% IRR
500,000 acres of arable land is unlocked25% of land is dedicated to maize productionMaize yield of ~10 tonnes per acre
75% of land can be dedicated to various value chains, but value created is assumed to be equal to that from growing potatoes with yield of 10 tonnes per acre
75% of land can be dedicated to various value chains, but value created is assumed to be equal to that from growing potatoes with yield of 8 tonnes per acre
Enablers Ratio of farms per extension is reduced from current 1,000 to 600Overheads cost (includes all enablers except extension) is 20% of the opex of Flagships 1-6ATO operating cost is KES ~180 mn per year (10 staff plus, 8 junior staff supporting counties)
N/Alxxxvi N/Alxxxvi
SOURCE: Team Analysis
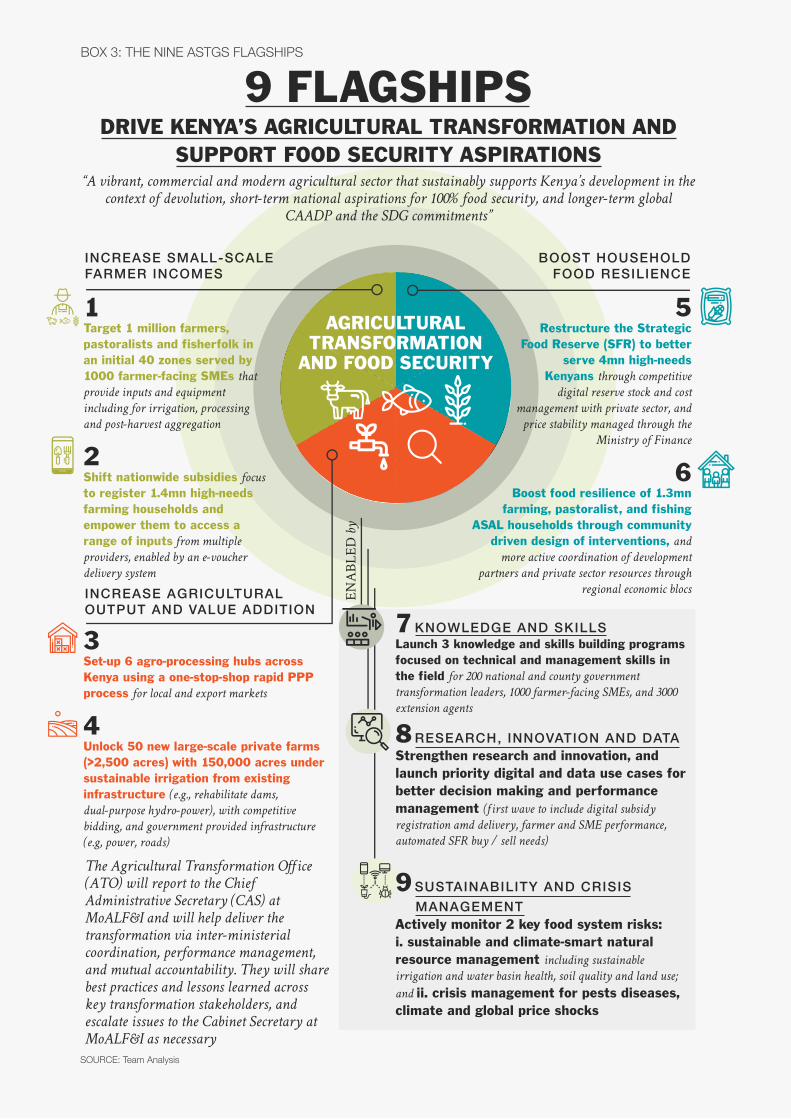
37
BOX 3: THE NINE ASTGS FLAGSHIPS
INCREASE SMALL-SCALEFARMER INCOMES
1Target 1 million farmers, pastoralists and fisherfolk in an initial 40 zones served by 1000 farmer-facing SMEs that
provide inputs and equipment
including for irrigation, processing
and post-harvest aggregation
2Shift nationwide subsidies focus to register 1.4mn high-needs farming households and empower them to access a range of inputs from multiple
providers, enabled by an e-voucher
delivery system
BOOST HOUSEHOLDFOOD RESILIENCE
5Restructure the Strategic
Food Reserve (SFR) to better serve 4mn high-needs
Kenyans through competitive
digital reserve stock and cost
management with private sector, and
price stability managed through the
Ministry of Finance
ENABL
ED by
AGRICULTURALTRANSFORMATION
AND FOOD SECURITY
INCREASE AGRICULTURALOUTPUT AND VALUE ADDITION
3Set-up 6 agro-processing hubs across Kenya using a one-stop-shop rapid PPP process for local and export markets
4Unlock 50 new large-scale private farms (>2,500 acres) with 150,000 acres under sustainable irrigation from existing infrastructure (e.g., rehabilitate dams,
dual-purpose hydro-power), with competitive
bidding, and government provided infrastructure
(e.g, power, roads)
6Boost food resilience of 1.3mn
farming, pastoralist, and fishing ASAL households through community
driven design of interventions, and
more active coordination of development
partners and private sector resources through
regional economic blocs
The Agricultural Transformation Office
(ATO) will report to the Chief
Administrative Secretary (CAS) at
MoALF&I and will help deliver the
transformation via inter-ministerial
coordination, performance management,
and mutual accountability. They will share
best practices and lessons learned across
key transformation stakeholders, and
escalate issues to the Cabinet Secretary at
MoALF&I as necessary
9 FLAGSHIPSDRIVE KENYA’S AGRICULTURAL TRANSFORMATION AND
SUPPORT FOOD SECURITY ASPIRATIONS“A vibrant, commercial and modern agricultural sector that sustainably supports Kenya’s development in the
context of devolution, short-term national aspirations for 100% food security, and longer-term global
CAADP and the SDG commitments”
7 KNOWLEDGE AND SKILLSLaunch 3 knowledge and skills building programs focused on technical and management skills in the field for 200 national and county government
transformation leaders, 1000 farmer-facing SMEs, and 3000
extension agents
8RESEARCH, INNOVATION AND DATAStrengthen research and innovation, and launch priority digital and data use cases for better decision making and performance management (first wave to include digital subsidy
registration amd delivery, farmer and SME performance,
automated SFR buy / sell needs)
9 SUSTAINABILITY AND CRISIS MANAGEMENTActively monitor 2 key food system risks: i. sustainable and climate-smart natural resource management including sustainable
irrigation and water basin health, soil quality and land use;
and ii. crisis management for pests diseases, climate and global price shocks
SOURCE: Team Analysis

38
INVESTING IN KENYA’S AGRICULTURAL SECTOR TRANSFORMATION N A I P 2 0 1 9 - 2 0 2 4
Furthermore, the six big ideas of the main anchors provide a path to 100% food and nutrition security by covering people across all of Kenya’s agro-ecological areas, all the time – year round and during periods of emergency (Figure 18). Finally, to ensure compliance with the NFNS-IF, ASTGS has integrated nutritional needs into the design, planning, implementation and monitoring of agricultural programmes and projects as detailed in the ASTGS.
Delivery at the highest levels will be a collaborative effort between the Cabinet Secretary of Agriculture, Livestock, Fisheries and Irrigation (MoALF&I), the Council of Governors (CoG), and the other associated national sector ministries including Devolution and ASAL Areas; Environment and Forestry; Industry, Trade and Cooperatives; Lands and Physical Planning; Transport, Infrastructure, Housing and Urban Development; Water and
lxxxvii Arid and Semi-Arid Landslxxxviii Existing programme
Sanitation; and the National Treasury. The Agricultural Transformation Office (ATO) will serve as the national secretariat coordinating transformation efforts across the sector.
The MoALF&I will formulate, implement and monitor agricultural policy and regulation, while developing and coordinating programmes to support crop development, livestock, fisheries, irrigation and research that are critical to delivering the ASTGS. The MoALF&I Cabinet Secretary will be responsible for delivering the sector targets.
The Agricultural Transformation Office (ATO) will support inter-ministerial coordination, performance management and mutual accountability across the sector, and will report to the Chief Administrative Secretary (CAS) at MoALF&I, and support the MoALF&I Cabinet Secretary on his/her transformation mandate. lxxxvii lxxxviii
ASALlxxxvii Non-ASAL
COVERAGEDURING NON- EMERGENCY PERIODS
Target 1mn farmers through 1000 farmer-facing SMEs1
CURRENT COVERAGE
PROPOSED COVERAGE
FLAGSHIP NUMBER#
COVERAGEDURING EMERGENCYPERIODS
5
Shift nationwide subsidy programme to empower farmer2Set up 6 agro-processing hubs through rapid PPP process3Unlock 50 new private farms (>2,500 acres each) with multiple value chains and irrigation for up to 150,000 acres
4Increase food resilience of 1.3mn ASAL households
6Cash transfer through the Hunger Safety Net Programme (HNSP)2
Cash transfer through ‘Chakula kwa jamii’lxxxviii
Expand other measures (e.g., cash transfers, import duties) for price stability
Food supply through the Strategic Food Reserve with competitive bidding for stocks and storage
5
FIGURE 18: NATIONAL COVERAGE OF THE SIX ANCHOR FLAGSHIPS
The six anchor transformation flagships provide national coverage all year round and support food security for all
SOURCE: Team Analysis

39
F L AG SH I P P RO J ECTS A N D D E L I V E RY OV E RV I E W
The ATO will also collaborate closely with the Joint Agricultural Sector Steering Committee (JASSCOM) and the Council of Governors, as the latter bodies support the counties to domesticate the ASTGS. This domestication is critical not only for ongoing County Integrated Development Plans (CIDPs), but also as the counties draft their own 10 year Agriculture Sector Development Plans (ASDPs).
The flagships will be financed by a combination of private sector, government and development partner resources (see Chapter 6.2 for more details). For each flagship, MoALF&I has held discussions with both the private sector and development partners, as well as examined the Ministry’s own expected development budget disbursements and priorities, to estimate the financing contribution from each party. These estimates are listed for each flagship in the following section.
3.3 DRIVERS OF FLAGSHIP IMPACT AND INVESTMENT
An overview of flagship design, along with individual flagship impact targets, investment requirements and funding sources is outlined below. Where a split in sources of funding between government and development partners is known, that split has been articulated. Where it is unknown and currently under negotiation by MoALF&I, a total number is given with “TBD” under the split. A more detailed view of the assumptions underpinning the estimated impact and investment numbers is included in Chapter 4.2, with the analytical model available to the stakeholders who will translate this work into detailed implementation plans and annual operational budgets.

40
INVESTING IN KENYA’S AGRICULTURAL SECTOR TRANSFORMATION N A I P 2 0 1 9 - 2 0 2 4
Flagship 1: Target ~1 million farmers in ~40 zones (initially) producing crops, livestock and fish served by ~1,000 farmer-facing SMEs that provide inputs, equipment, processing and post-harvest aggregation
OverviewThis flagship will increase the incomes of farmers in ~40 initial high-productivity zones by providing them with a selection of inputs, irrigation and other equipment, post-harvest handling aggregation and other services, all delivered by ~1,000 SMEs. The specific types of SMEs are determined by the needs of the farmers in each zone, and the flagship will provide opportunities for inclusive business growth by focusing on women- and youth-led SMEs. The zones are divided into lots that will be operated by an SME accelerator – a contracted for-profit or not-for profit company that can select, train, mentor, scale and conduct performance management of the SMEs. These accelerators will be jointly selected by national and county governments, and may be a single company or a consortia of organizations. MoALF&I will monitor performance of these zones closely, and share best practices across zones as they are developed during implementation.
Impact and investment requiredWithin the first five years, this flagship will have estimated impact of:■ Increase in annual small-scale farmer incomes: KES ~20,000■ Total agriculture sector value created (agriculture GDP increase summed over five years): KES 42-50 billion■ Increase in agricultural GDP in Year 5: KES 12-15 billion■ Farmers impacted: 0.7-0.9 million■ Investment required over five years: KES 7.6-9.6 billion
Drivers of impact and cost■ Close to 1 million farmers, or more precisely 0.7-0.9 million farmers (~0.4 million households) located in zones covered by the SMEs are the main driver of impact for this flagship. The farmers are assumed to have already experienced the productivity increase from using the subsidies in flagship 2 (see below). The SMEs flagship is expected to then close 50% of the gap between the original yield baseline (i.e., before the subsidies flagship) and the yield potential for the value chains the farmers are engaged in.■ Estimated the “weighted average yield” (on top of the gains from flagship 2), and therefore the commensurate increase in income for each household based on yield gaps in six priority chains (maize, potatoes, horticulture, beef, poultry and dairy). These value chains were weighted based on their current contribution to agriculture GDP. The result was an approximate 12% increase in “weighted average yield”.■ Assuming baseline annual income of KES ~200,000 per farming household with an assumed one income earner per household (after the impact of flagship 2), this increases farmer income by KES 20,000 per household. Across the ~1 million farmers, this equates to total increase in agricultural GDP of KES 12-15 billion in five years. Summing up each year’s agriculture GDP increase over the five-year ramp-up period gives a total agriculture sector value creation of KES 42-50 billion.■ The cost of running the six SME accelerators is estimated to be KES 8-10 billion over five years to be shared between GoK and development partners (e.g., GoK backed loans), the exact split is to be determined. This cost will cover the personnel, training, business registration and logistics costs associated with operations. Upgrading the SMEs (e.g., expanding cold-chain storage capacity) is expected to cost KES 0.3-0.8 billion, and should be met by the private sector.

41
F L AG SH I P P RO J ECTS A N D D E L I V E RY OV E RV I E W
Flagship 2: Shift nationwide subsidy programme focus to empower ~1.4 million registered high-needs farmers to access a variety of inputs from a range of private and public providers, enabled by digital service delivery
OverviewThe flagship will diversify the agricultural subsidies programme to increase farmers’ ability to invest in the right inputs at the right time. The flagship design consists of five elements: 1. Register and screen all farmers for eligibility. Registration will be free of charge and done via a mobile phone survey that captures name, ID number, size of farm, commodities farmed and annual income. Extension agents will verify every registered farm over the first three years. 2. Reallocate the government’s KES 5 billion from procurement of fertilizer and maize seed to a digital e-voucher system that sends vouchers directly to eligible farmers’ mobile phones. 3. Allow farmers to use the voucher to purchase a range of inputs, including seed for high-value crops, animal feed and health products.4. Integrate mandatory extension services to explain what fertilizer to use based on soil needs (according to national soil testing results), with compulsory lime vouchers for farmers with acidic soils, and mandatory treatment where the risk of aflatoxin is high.
5. Allow the private sector to provide inputs, including through registered agro-dealers, to give farmers the option to spend their e-voucher in their local village. 6. Ensure that input suppliers (e.g., agro-dealers) are paid immediately for items purchased via e-voucher so that they are not “out of pocket” and therefore discouraged from participating in the e-voucher programme.
Impact and investment requiredWithin the first five years, this flagship will have estimated impact of:■ Increase in annual small-scale farmer incomes: KES ~54,000■ Total agriculture sector value created (agriculture GDP increase summed over five years): ~KES 175-210 billion■ Increase in agricultural GDP in Year 5: KES 62-75 billion■ Farmers impacted: ~1.1-1.4 (assume single voucher per household, though a household can have 2 farmers, so affect a total 2.3-2.8 million farmers)■ Investment required over five years: KES 4-10 billion
Drivers of impact and cost■ Of Kenya’s 4.5 million small-scale farmers and fisherfolk households, 1.1-1.4 million (50-60%) are expected to receive subsidies via targeting using mobile-based registration. Subsidies will be limited to one per farm – this is equivalent to one per household.
Activity Investment required (KES bn)
Private sector contribution
GoK contribution Development partner contribution
Operating the six SME accelerators to train the 1,000 SMEs
7.3-8.8 TBD 7.3-8.8 (100%) TBD
Upgrading the 1,000 SMEs, e.g. expanding cold-chain storage capacity
0.3-0.8 0.3-0.8 (100%) 0 0
Total 7.6-9.6 0.3-0.8 7.3-8.8 TBD
Cost breakdown and sources of finance

42
INVESTING IN KENYA’S AGRICULTURAL SECTOR TRANSFORMATION N A I P 2 0 1 9 - 2 0 2 4
■ These households will each receive KES 5,000 in subsidies, which is ~10% of the average small-scale farmer’s annual production cost, and is sufficient to cover the costs of lime, aflatoxin management and a significant portion of other inputs for the average 1.2-acre plot. These additional inputs are assumed to close 25% of the gap between current yield and potential yield in each value chain, giving an average yield increase of 37% in five years (using similar weightings across value chains as in flagship 1 above).■ Household incomes will therefore increase by approximately the same proportion of 37%. Assuming baseline annual income of KES ~145,000 per farming household, the income increase per household is therefore KES ~54,000. Across the 1.1-1.4 million households, this equates to total increase in agricultural GDP of KES 62-75 billion.
■ Summing up each year’s agriculture GDP increase over the five-year ramp-up period gives the total agriculture sector value creation of KES 174-209 billion.■ Achieving this impact will require KES 4-10 billion in subsidies cost – in addition to the annual KES 5 billion subsidies cost that is already part of the current government budget – and KES ~1 billion in personnel and IT cost over five years. These costs account for ~KES 1,000 for extension, over and above the KES 5,000 that the farmer receives directly.
Cost breakdown and sources of finance
Activity Investment required (KES bn)
Private sector contribution
GoK contribution Development partner contribution
Paying subsidies to farmers 3.8-9.5 0 3.8-9.5 (100%) 0
Maintaining and operating the e-voucher payment system
~0.7 0 ~0.7 (100%) 0
Total 4.5-10.2 0 4.5-10.2 0

43
Flagship 3: Set up 6 agro-processing hubs across the country through a rapid one-stop shop PPP process for domestic and export markets
OverviewThe Agro-Processing Delivery Team (APDT) will offer developers a one-stop solution, and unlock six Kenyan agro-processing facilities with combined capital value of KES 75-100 billion, largely private sector-financed.
As a unit, it will operate with a clear agro-processing mandate under the ATO, with measurable KPIs, performance-based budget allocations, and regularized reporting requirements. The APDT will embed five guiding principles for successful agro-processing delivery: 1) a ruthless focus on project feasibility, 2) an uncompromising insistence on procurement best practice, 3) a structured process to maximizing competition and private sector involvement, 4) a highly coordinated response to specific project bottlenecks, and 5) a codified approach to minimizing conflicts of interest.
Impact and investment requiredWithin the first five years, this flagship will have estimated impact of:■ Total value created from agro-processing (GDP increase summed over five years): KES 110-150 billon
■ Increase in GDP from agro-processing in Year 5: KES 11-18 billion■ Investment required over five years: KES 76-100 billion
Drivers of impact and cost■ Each agro-processing hub is expected to cost KES 15-20 billion in capital expenditure (capex), based on similar agri-industrial facilities in Ethiopia. This gives a total investment capex of KES 75-100 billion. Ethiopia was chosen as the comparator because its facilities are similar to this flagship’s target in terms of production capacity and value chains, and faced similar infrastructure constraints to what this flagship will face.■ Revenue is expected to start accruing in Year 3, and assuming an IRR of 17% based on other infrastructure projects in Kenya, this implies an annual revenue of KES 30-50 billion. The agro-processing hubs’ gross profit margin is expected to be 35%. This therefore gives an estimated GDP increase of KES 11-18 billion per year. ■ Adding the construction value of KES 75-100 billion, this gives a total value creation of KES 110-150 billion over the five years.■ In addition to the capex costs, the flagship is also expected to require KES 400 million for feasibility studies in the first year, and then KES 50 million per year subsequently to operate the APDT.
F L AG SH I P P RO J ECTS A N D D E L I V E RY OV E RV I E W
Cost breakdown and sources of finance
Activity Investment required (KES bn)
Private sector contribution
GoK contribution Development partner contribution
Creating facility design templates and conducting feasibility studies
~0.3 0 ~0.3 (100%) 0
Operating the hubs accelerator ~0.3 0 ~0.3 (100%) 0
Building the agro-processing hubs
76-101 76-101 (100%) 0 0
Total 4.5-10.2 0 4.5-10.2 0
44
INVESTING IN KENYA’S AGRICULTURAL SECTOR TRANSFORMATION N A I P 2 0 1 9 - 2 0 2 4
Flagship 4: Unlock 50 new large-scale (>2,500 acre) farms delivering KES ~70 billion of agricultural GDP, through competitive bidding, protected community land ownership, and government provision of basic infrastructure (e.g., power, roads, irrigation as needed)
OverviewLarge portions of arable land in Kenya are either underused or lie dormant. Much of this land is owned by parastatals, state-owned entities, or regional development authorities.
Consultations with the relevant agencies have secured in-principle commitments from landowners to provide up to 150,000 acres in 15 farming locations for agricultural production over the next three years. These commitments are the basis of the first wave of implementation of this flagship, and will be supplemented by further commitments from both private and public sector landowners (over the next three years) to take the total land under production to 500,000 acres in five years.lxxxix
Impact and investment requiredWithin the first five years, this flagship will have estimated impact of:■ Total agriculture sector value created (agriculture GDP increase summed over five years): KES 160-195 billion■ Increase in agricultural GDP in Year 5: ~KES 67-80 billion
lxxxix The Big Four agenda targets 1,75 million hectares; however not all of this has been confirmed. The impact estimation for this flagship has therefore erred on the conservative side
■ Investment required over five years: KES ~80 billion (not including potential KES ~200 billion in agriculture-supportive costs for power and roads)
Drivers of impact and cost■ The programme is expected to make 500,000 acres of new farms available for agriculture.■ Assuming 25% of the land produces a value equivalent to 10 tonnes of maize per hectare, and 75% of the land produces a value equivalent to 20-25 tonnes of potatoes per hectare, the increase in agricultural GDP from this new land will be ~KES 07-80 billion in 2023.– The 25% allocation to maize will be government-mandated, with the aim of strengthening Kenya’s food security situation. – The other 75% of the land can be allocated as the farmer chooses – including for livestock and fisheries. For simplicity, potato is used as a proxy to conservatively estimate the value creation from this portion of the land as its price is lower than that of many cash crops (e.g., French beans and tomatoes). Adding up the ramp-up in production from 2018 to 2023, the total agricultural sector value created across the five years from this flagship will be KES 160-195 billion.■ To realize this impact, the flagship is expected to incur KES 400,000 to clear, drain and prepare each hectare of land (including installing irrigation equipment), as well as KES 130 million over five years for knowledge and skills strengthening and M&E, resulting in a total cost of KES ~80 billion across in five years.
Cost breakdown and sources of finance
Activity Investment required (KES bn)
Private sector contribution
GoK contribution Development partner contribution
Clearing, draining, levelling the land and installing infrastructure
~81 ~81 (100%) 0 0
Designing lease contracts and running flagship admin and M&E
~0.1 0 ~0.1 (100%) 0
Total ~81 ~81 ~0.1 0

45
F L AG SH I P P RO J ECTS A N D D E L I V E RY OV E RV I E W
Flagship 5: Restructure governance and operations of the Strategic Food Reserve (SFR) to better serve ~4 million vulnerable Kenyans through: i. reserves optimized for emergency responses only; ii. buy/sell guidelines published with pre-determined emergency release triggers for stocks and cash; iii. private sector warehousing; iv. price stability managed through Treasury (i.e., minimum price controls and cash transfers)
OverviewTo improve the governance, decision making and operations of the strategic food reserve, it is recommended that the reserve:■ Optimize for the most vulnerable at times of emergency for a longer period of time (3 months), compared to the current target to cover the entire country for one month. This will require adding a material amount of legumes/pulses to stocks, but will overall reduce the reserve’s total target size to reflect the expected vulnerable population and the lead time required to import additional supplies into the country.■ Publish explicit, predictable buy/sell policy guidelines and emergency trigger criteria and set up an emergency fund to ensure immediate response.■ Introduce competitive bidding to allocate reserves to the private sector; and monitor stocks digitally in real time.■ Separate price stabilization from the emergency food supply mandate. The latter should become the primary mandate of the reserve, with the former transferred to Treasury.
Impact and investment requiredWithin the first five years, this flagship will have estimated impact of:■ Reduction in food-insecure population: ~2.7 million (average size of drought-induced food-insecure population over the past 10 years; actual number depends on future severity of droughts)
■ Investment required over five years: KES 7.5-9.5 billion
Drivers of impact and cost■ Flagship 5 is expected to put Kenya on a path to 100% food and nutrition security during emergencies for Kenya’s most vulnerable populations. Based on historical data on the food-insecure population from the short and long rains assessments by the Kenya Food Security Steering Group, the average size of Kenya’s drought-induced food-insecure population is 2.7 million people. The flagship’s interventions are aimed at addressing the needs of this population, lifting all of them out of food insecurity.■ While the average size of the drought-induced food-insecure population over the past decade is 2.7 million people, the maximum number observed was 3.7 million (in 2010/2011). To ensure 100% food and nutrition security, the SFR needs to have sufficient reserve to at least address this worst-case scenario. Given the risks associated with climate change, the worst-case scenario could become even more severe in the future; the flagship has therefore been designed to have sufficient capacity to address 4-5 million food-insecure people, over 10% of Kenya’s population.■ The implementation cost of improving the SFR is based on the costs of adding legumes/pulses to the reserve (using beans as a proxy), installing a barcode-based reserve level tracking system in all facilities and annually maintaining this system.– Each of the 4-5 million target population will require 0.2 kg of beans per day, and the reserve will need to last for 90 days (based on the lead time needed to import additional relief food), hence 86,000 tonnes of beans will be required in the reserve. Taking the wholesale cost of beans to be KES ~70/kg, the total beans purchase capex required will be KES 4.7-6.0 billion.– Since the maize reserve already exists and is larger than the amount needed for 10 million people in 90 days, there will be no additional capex required for maize purchase. Assuming reserve commodities will be rotated through buying and selling at market prices, it is expected that over time the opex cost of

46
INVESTING IN KENYA’S AGRICULTURAL SECTOR TRANSFORMATION N A I P 2 0 1 9 - 2 0 2 4
buying will be approximately the same as the opex cost of selling, making reserve rotation cost-neutral.– The barcode system is expected to cost KES 5 million per scanning point to install (including both equipment and personnel training) and another KES 250,000 per scanning point for annual maintenance. To estimate the number of facilities requiring installation of the new system, it is assumed that the average private reserve facility has ~3,500 tonnes of capacity (based on RATIN data),23 that 25 private facilities (half of existing major facilities) will participate in the
reserve system, and that the rest of required capacity will be served by NCPB facilities that can store ~170,000 tonnes each; a total of 30-35 facilities will need to be installed with the new tracking system. Hence, the cost required for the barcode system over five years will be KES ~0.2 billion.– In total, flagship 5 will require KES 7.5-9.6 billion in costs over the five years. Most of the cost will be shared between GoK and development partners; the exact split is to be determined.
Cost breakdown and sources of finance
Activity Investment required (KES bn)
Private sector contribution
GoK contribution Development partner contribution
Purchasing legumes to add to the SFR
4.7-6.0 0 4.7-6.0 (100%) TBD
Holding the beans in the SFR (inventory cost)
2.6-3.4 0 2.6-3.4 (100%) TBD
Installing and running barcode-based reserve tracking systems and training personnel
~0.2 ~0.2 (100%) 0 0
Total 7.5-9.6 ~0.2 7.3-9.4 TBD
47
F L AG SH I P P RO J ECTS A N D D E L I V E RY OV E RV I E W
Flagship 6: Boost resilience of ~1.3 million farming and pastoralist households in ASALs through community-driven design of interventions, and more active national and county coordination of development partners and private sector
OverviewWe will implement an ASAL resilience programme focused on community involvement in design and implementation of interventions and coordination between national, county, private sector and development partners. These interventions will be tailored to the highest needs of given communities, including women, youth, and PWDs, from a carefully selected set of interventions to increase drought-tolerant crop production, reduce animal mortality due to drought and diseases, increase water availability and management and increase uptake of index-based insurance.
Impact and investment requiredWithin the first five years, this flagship will have estimated impact of:■ Total agriculture sector value created (agriculture GDP increase summed over five years): KES 1.4-2.4 billion■ Increase in agricultural GDP in Year 5: KES 0.5-0.9 billion■ Farmers impacted: 2.5 million farmers (~1.3 million households)
■ Investment required over five years: ~KES 0.5 billion■ Counties impacted: 16 selected counties of Turkana, Marsabit, Mandera, Garissa, Tana River, Samburu, Isiolo, Laikipia, Makueni, Kitui, Machakos, Kajiado, Narok, Wajir, Embu, West Pokot in first wave, expanding to the other ASALs in second wave
Drivers of impact and cost■ All 1.3 million ASAL households are expected to be covered by the flagship through community involvement. By implementing community-tailored menus of prioritized interventions, the counties are expected to close 30%-50% of the crop yield gaps to the best performing county in the same agro-ecological zone. Additionally, it is assumed that with better animal feeds and health the pastoralist communities will reduce animal mortality by 25%-50%. Across the 1.3 million households, these improvements are expected to raise agriculture sector value addition by KES 1.4-2.4 over the five years of the NAIP and a run rate agriculture GDP increase of KES 0.5-0.9 billion.■ The cost of running the community involvement programme is expected to be KES 15 million per county per year, based on experience from Makueni county. Assuming the programme is piloted in five counties in Year 1 before being rolled out across 16 counties in Year 2, the total cost is thus expected to be ~KES 0.5 billion over five years, to be shared between GoK and development partners (exact split to be determined).
Cost breakdown and sources of finance
Activity Investment required (KES bn)
Private sector contribution
GoK contribution Development partner contribution
Engaging communities to develop tailored sets of interventions
~0.5 0 0.5 (100%) TBD
Total ~0.5 0 0.5 TBD

48
INVESTING IN KENYA’S AGRICULTURAL SECTOR TRANSFORMATION N A I P 2 0 1 9 - 2 0 2 4
Flagship 7: Launch 3 knowledge and skills-building programmes: i. field-and-forum curricula for ~100 national and county government leaders; ii. skill building for public and private sector flagship implementers (including 1,000 change agent SMEs); iii. management/technical training for ~3,000 IT-enabled government youth extension agents
OverviewTo ready MoALF&I, national and county-level leaders and implementers for the transformation, a capacity-building flagship will be implemented with three components: (i) a leadership programme to build transformation-critical skills for national and county leaders through formal training and on-the-job learning, and strengthen MoALF&I for transformation delivery; (ii) a training programme to build relevant skills among operational-level implementers through both formal training and on-the-job learning; and (iii) a programme to revitalize extension services in the counties through digitally enabled youth extension workers who are trained to provide information on agricultural and nutritional best practices that are area-specific and gender-sensitive. See below for drivers of cost and impact.
Flagship 8: Strengthen research and innovation as launch priority digital and data use cases to better drive decision making and performance management. First wave of use cases to be supported by research includes: i. digital subsidy delivery programme; ii. production forecasting and digital performance monitoring of small-scale farmers and SMEs; iii. forecasting and monitoring SFR buy/sell needs
OverviewTo enable effective implementation of flagships 1, 2 and 5, new data platforms need to be assembled and used for fact-based decision making in these areas. Flagship 8 will launch digital and data use cases for these anchor flagships, focusing on three priority use cases: (i) tracking the performance of the SME accelerators to determine which ones should continue to operate and potentially receive additional lots; (ii) tracking performance of subsidies awarded for renewal to farmers, or re-certification of vendors; (iii) automating buy/sell decisions of the SFR during emergencies. As priority use cases are expanded after the first two to three years of implementation, broader use cases in research and policy should be considered. See below for drivers of cost and impact.
Flagship 9: Monitor responses to two key food system risks: i. sustainable and climate-smart natural resource management including health of water basins, soil quality and land use; and ii. crisis management for disease and pests, climate and global price shocks
OverviewTo ensure that the improvements in Kenya’s agriculture and food system realized by the NAIP are sustained into the future, the ATO will perform the necessary tracking, compliance monitoring and early emergency response work across the relevant stakeholders to ensure compliance with best-practice sustainability, climate-resilient and crisis management measures. This will involve: (i) tracking all projects receiving MoALF&I funding to ensure compliance with the Ministry’s sustainability checklist, (ii) annually reviewing and updating the checklist to ensure that it adequately addresses all the relevant risks, and (iii) operating as a first-response team for food-related crises and coordinating between research institutions, the SFRTF,

49
F L AG SH I P P RO J ECTS A N D D E L I V E RY OV E RV I E W
relevant private sector producers and storage providers, technical experts, as well as relevant government agencies and development partners. See below for drivers of cost and impact.
Drivers of cost for enablers (flagships 7-9), M&E and the delivery mechanism
NAIP costs outside of the anchor flagships have been estimated in the following manner:■ Extension: The largest cost component outside of the anchor flagships is the extension programme, estimated to cost KES ~7.2 billion over five years on top of the estimated KES ~13 billion already being spent annually on the wages of existing extension workers. (This current spending is estimated based on the current ratio of 1,000 farms per extension worker24 and an estimated monthly wage of KES 50,000 per worker). The programme aims to reduce the ratio of farms per extension worker to 600, thus implying the need to hire an additional ~2,800 workers, who will be the digitally enabled youth extension workers who are core to the process of revitalizing extension. Assuming these youth workers have an average monthly wage of KES 15,000 and there is a gradual ramp-up in hiring over five years, their wages are expected to cost KES ~2 billion over the course of the NAIP. In addition to these costs, another KES ~4.7 billion is anticipated to provide the extension services (e.g., smartphones, transportation costs for farmer visits, cost of producing the radio and television programmes). The incentive system for the counties is expected to cost another 10% (KES ~0.6 billion over five years) on top of this.■ M&E: The M&E mechanism is estimated to cost 15% of the opex of the anchor flagships 1-6, based on experiences from other public sector transformation efforts. This equals KES ~2.3 billion over the five years of the NAIP.
■ Soil testing: The soil testing programme is expected to cost KES 0.7 billion over five years. The programme is expected to be conducted out of 10 labs, which will cost KES ~10 million in capex and KES ~7 million in opex each. Soil sampling is expected to cost KES 100 in labour and KES 20 in equipment cost per sample, and each of the 10 labs is expected to process 15,000 samples in Year 1, 20,000 samples in Year 2 and 50,000 annually subsequently. Summing these costs over the 10 labs over the five years gives KES ~680 million. On top of this, the cost of supervising and coordinating the labs is estimated to be KES ~10 million over five years.■ ATO: The ATO is expected to have an annual opex of KES ~180 million, based on the cost of similar transformation offices in other countries. These add up to KES ~0.9 billion over five years.■ Other enablers: The costs of other enablers—capacity building, research and data platforms and sustainability – are estimated to be 20% of the opex of the anchor flagships (1-6), as seen in similar transformation programmes in other countries. This is approximately KES 3.1 billion over five years. (This includes the cost of hiring data scientists, data engineers, data analysts and geospatial analysts for flagship 8 – estimates have indicated the 20% approximation will be sufficient to cover this.)
The total costs of the enablers, M&E and the ATO should be shared between GoK and development partners, the exact split to be determined.

50
INVESTING IN KENYA’S AGRICULTURAL SECTOR TRANSFORMATION N A I P 2 0 1 9 - 2 0 2 4
Drivers of agriculture-supportive costs
In addition to the agriculture-specific investments discussed above, the NAIP will also require investments in other sectors that support agriculture. These include:■ Roads to access the new farms: Assuming that 25 of the new farms (50% of the total) will require new access roads that are each 25 km in length, and that each km costs KES 270 million on average, this implies an investment cost of KES ~170 billion.25
■ Power grid expansion for the new farms: Assuming that 25 of the new farms (50% of the total) will require grid expansion of 10 km each, and that each km of grid expansion costs KES 20 million on average, this implies an investment cost of KES ~5 billion.26
■ Food price stabilization: The Ministry of Finance will have to incur the cost of stabilizing food prices; historically this has cost KES ~7 billion annually, implying KES ~34 billion over the five years of the NAIP.
To calculate the direct impact of the transformation on agricultural GDP and the investments required above, it was important to understand the interactions between the flagship designs. Every effort was made to avoid double counting – for example due to the nationwide eligibility design choice for subsidies, it was assumed that every farmer in flagship 1 is eligible for subsidies that drive some level of yield improvements. Therefore, impact of flagship 1 assumed yield improvements from subsidies, so impact in this flagship calculated
the difference between yield with subsidies and yield with SME interventions – not the difference between no intervention and SMEs.
The question of linkages and interdependencies in implementation is equally important, and covered in the next chapter on integrated implementation plans and budgets. Also, the results framework in Chapter 5 and M&E approach discussed in Chapter 6 outlines the path between output, outcomes and impact to measure and determine the precise causal mechanisms behind the transformation over time.
Finally, it is important to appreciate that impact and cost estimates within NAIP are point estimates, and should not be used as forecasting tools. The impact metrics in particular should be used to understand the magnitude of impact within flagships and the relative ranges of impact across flagships in generating agricultural GDP. Where possible, economy-wide impact was triangulated from the IFAD-IFPRI-RIAPA model. Future efforts to arrive at a more accurate view of expected impact should ideally incorporate such modelling to ensure that indirect effects of the interventions that cascade through other sectors of the economy and broader GDP are captured as well.
Activity Investment required (KES bn)
Private sector contribution
GoK contribution Development partner contribution
Launching the youth-led, digitally enabled extension services
~7.2 0 ~7.2 (100%) TBD
Launching and running the NAIP M&E mechanism
~2.3 0 ~2.3 (100%) TBD
Building Kenya’s soil map ~0.7 0 ~0.7 (100%) TBD
Running the ATO ~0.9 0 ~0.9 (100%) TBD
Putting in place the capacity building, research, data, and sustainability enablers
~3.1 0 ~3.1 (100%) TBD
Total ~14.3 0 ~14.3 TBD

51
K E N YA’S AG R I CU LT U R A L SECTO R R E SU LTS F R A M E W O R K
4.1 RESULTS FRAMEWORK AND ALIGNMENT TO ASTGS
The MoALF&I Taskforce on M&E has developed an Agricultural Sector Results Framework aligned to the realities of devolution, broader regional and national results framework requirements, key commitments to the SDGs, and CAADP (see Figure 19).
As illustrated in Figure 20, Kenya’s work-in-progress results framework is aligned with the ASTGS. The numbers in green circles identify the most relevant flagships driving the desired outputs and outcomes. However, interdependencies between flagships exist, as discussed in Chapter 7.3, so a broader set of flagships may drive specific results within the framework.
0 4K E N Y A ’ S A G R I C U LT U R A L S E C T O R
R E S U LT S F R A M E W O R K

52
INVESTING IN KENYA’S AGRICULTURAL SECTOR TRANSFORMATION N A I P 2 0 1 9 - 2 0 2 4
Global Suitable Development goals
i) Global Indicators
African UnionMalabo Declaration Commitments (ii) CAADP Results Framework indicators
(iii) EAC Results Framework indicators EAC
KenyaAgriculture Sector Transformation and Growth Strategy
(iv) ASTGS outcome metrics indicators
County County County Integrated Development Plans (CIDPs)
(v) County Agriculture Sector Indicators County Integrated Development Plans (CIDPs)
(iv) County Agriculture Sector Indicators
Project Project Project Project Project Project (vi) Indicators (vi) Indicators (vi) Indicators (vi) Indicators (vi) Indicators (vi) Indicators
FIGURE 19: INDICATORS INCORPORATED INTO KENYA’S AG SECTOR M&E FRAMEWORK

53
K E N YA’S AG R I CU LT U R A L SECTO R R E SU LTS F R A M E W O R K
Contribution of Agriculture to economic growth and inclusive development
IMPA
CT (1.1) Increased
contribution to wealth creation
Increased ecosystem resilience and sustainability
(1.4) Increased access to productive
social protection
(1.2) Improved food security and nutrition
for all
(1.3) Econ opportuni-ties and prosperity –
jobs and poverty alleviation
OU
TCO
ME
(2.1) Increased agricultural
production and productivity
(2.5) Improved governance and management of
natural resources for sustainable agricultural production
(2.4) Increased resilience of
livelihoods and improved
management of risks in the agricultural
sector
(2.3) Expanded domestic
agro-industry and value chain
development
(2.2) Increased intra-Africa regional
trade and better functioning national
and regional agriculture and food
markets
OU
TPU
T
(3.6) More agricultural research and technological
innovation with increased capacity
to use resulting data
(3.1) Resilience building of
production systems including through
effective policy design and
implementation
(3.5) Public investment on post
harvest logistics and farmers capacity building on post
harvest loss
(3.5) Increase public investment in policy, infrastructure, and
capacity development for PPP.
(3.4) Create an enabling
environment, for multiple partnerships,
cooperation and coordination
(3.2) Strong regional policy on
Intra-African Trade; and trade in food
…with capacity to assess
implementation of policies and
commitments
ATO
1 2 8 3 4 5 1 3 4 1 2 5 6 9
CAADP INDICATOR
PROPOSED ADDITION FROM ASTGS
FLAGSHIPS
INDIRECTLY MEASURED
(X.X)
BOLD#
FIGURE 20: KENYA’S AGRICULTURAL SECTOR RESULTS FRAMEWORK
The MoALF&I M&E Taskforce was in the process of operationalizing this framework before the ASTGS drafting process began. However, the Taskforce needs to finalize collection of baseline data, particularly with information from the county level. The Taskforce has already developed the workplan for this process, and has estimated a budget of KES ~285 million to complete baselining. This cost has been included in the M&E budget of the NAIP, given how critical a good baseline is to run effective M&E of this NAIP.
This NAIP proposes a revision to some of the outputs in the existing framework to fully align with ASTGS. In particular, it recommends that:■ Technology, research and innovation (from flagships 8, 1 and 2) should be accompanied by an increased capacity to use the data.
The aforementioned flagships rely heavily on providing farmers with access to new technologies and the extension support to use them. Further, the NAIP provides for hiring critical data personnel to improve data usage capacity, including a handful of data scientists, statisticians and data/geospatial analysts.■ Strong intra-African trade policies should be accompanied with capacity building to assess implementation of policies and commitments in an evidence-based way. Flagships 3 and 4 are focused on production for both domestic and regional demand, which will increase trade. Flagship 5 outlines provisions for when to import staples, with very clear triggers during times of emergency, providing clarity to regional policy around imports.

54
INVESTING IN KENYA’S AGRICULTURAL SECTOR TRANSFORMATION N A I P 2 0 1 9 - 2 0 2 4
■ Building resilience of production systems should include effective policy design and implementation as a lever. For example, flagships 6 and 9 are focused on more detailed policy design that includes community-driven elements, and stronger county and economic bloc responses to crises, enabled by clearer policy and standard operating procedures (SOPs).
The remaining outputs are sufficiently aligned to flagships 1-5, which focus on rapid PPP processes, and use the ATO as the catalyst for inter-ministerial collaboration, with broader partnerships encouraged across the private, non-profit and non-state actors across the NAIP.
4.2 ASSUMPTIONS UNDERPINNING FLAGSHIP IMPACT
A detailed set of assumptions underpin the estimated impact and investment numbers articulated in Chapter 4 of this NAIP. Table 1 below provides an overview of the primary assumptions and how they align to the results framework in Figure 19. This table maps all the flagships to:■ The ASTGS top-line impact metric they directly contribute to (i.e., increasing small-scale farmer incomes, increasing agricultural output and value addition, number of farmers impacted). It also identifies any other impact metrics core to the design of the flagship (e.g., number of agro-processing facilities, assumed yield increases).■ The associated outcomes and outputs in the results framework from Figure 19 (e.g., 2.1 increased agricultural production, 3.5 investment in post-harvest handling). Recall that all of these associated outcomes and outputs can be aligned to CAADP Level 2 and 3 as we describe below.
The table also provides the assumed baseline and annual impact targets – both in the low and high scenarios estimated. What makes a scenario high or low varies in each flagship. In some cases, the same number of units is assumed in the high and low case, so the impact in the intervention is driven by intensity of productivity of the units (e.g., number of
SMEs). In some cases, particularly where representative data is quite difficult to find, the difference between high and low is the time to impact, but the end point is the same (e.g., assumed yield is achieved faster in high case than low case, but the maximum yield considered is the same). Finally, it is worth noting that some flagships require a quick ramp-up in terms of the units employed (e.g., number of agro-processing units for flagship 3 are all built in the first two years), so the assumed increase in impact comes from fully operationalising the factories. As better data from implementation is available, these assumptions should be refined.
4.3 ALIGNMENT TO CAADP AND MALABO
Kenya’s Agricultural Sector results framework as shown in Figure 19 is very aligned to CAADP Level 3 and Level 2 Indicators as described below. At the output level, the results framework can be mapped to the Level 3 CAADP outcomes. The framework goes further to more strongly consider issues of post-harvest handling (~20-25% of cereals harvest is lost in this way), and increased resilience of production systems.
At the outcomes level, ASTGS and this results framework map fully to the Level 2 and Level 1 CAADP outcomes. Chapter 4 details the drivers of impact within each flagship that move them from outputs to outcomes. At the impact level, ASTGS is fully aligned with four of the five CAADP outcomes – wealth creation through increased incomes; economic opportunities and prosperity through the number of farmers directly benefiting from the transformation; improved food security for all; and improved access to productive social protection through reducing the high-needs population (and providing minimum price controls using cash transfers in lieu of price stabilization through the strategic food reserve). The ASTGS treats the fifth outcome – increased ecosystem resilience and sustainability – as an output of the other four.
In addition to alignment with the CAADP Results Framework, the ASTGS flagships will impact most of the 43 CAADP performance indicators that are tracked as part of Kenya’s

55
K E N YA’S AG R I CU LT U R A L SECTO R R E SU LTS F R A M E W O R K
Biennial Review (BR) process.27 Table 2 below provides a detailed mapping of these indicators based on the 2018 BR process. Kenya’s M&E and CAADP teams already regularly compile data on these performance indicators for use in the BR process. While targets for these indicators have been set for the milestone year – 2025 for most of the indicators – interim targets are pending. These teams are committed to reviewing these targets in light of Table 1 for the ASTGS, and aligning Kenya’s BR commitments accordingly following due process. In line with ASTGS, it is recommended that annual or biennial targets should be set for the years prior to the milestone year, so that regular progress reviews can be made against these.

56
INVESTING IN KENYA’S AGRICULTURAL SECTOR TRANSFORMATION N A I P 2 0 1 9 - 2 0 2 4
Map
ping
to K
enya
’s A
gric
ultu
ral
Sect
or R
esul
ts F
ram
ewor
k (F
igur
e 19
)
ImpactBaseline
Annu
al im
pact
targ
ets
(low
)An
nual
impa
ct ta
rget
s (h
igh)
Associated Outcome
Associated Output
Year 1
Year 2
Year 3
Year 4
Year 5
Sum Total
Year 1
Year 2
Year 3
Year 4
Year 5
Sum Total
FLAG
SHIP
1: T
arge
t ~1
mn
farm
ers
in ~
40 z
ones
(ini
tially
) pro
duci
ng c
rops
, liv
esto
ck a
nd fi
sh s
erve
d by
~1,
000
farm
er-fa
cing
SM
Es th
at p
rovi
de in
puts
, equ
ipm
ent,
proc
essi
ng a
nd p
ost-
harv
est a
ggre
gatio
n
Impa
ct 1
: In
crea
se in
an
nual
sm
all-
scal
e fa
rmer
in
com
es (K
ES)
2.1
Incr
ease
d ag
pr
oduc
tion
2.3
Expa
nded
va
lue
chain
de
velo
pmen
t2.
4 In
crea
sed
resil
ience
3.5
Inve
stm
ent
in p
ost-h
arve
st
hand
ling
3.6
Mor
e ag
re
sear
ch a
nd
inno
vatio
n
09,
900
17,9
0029
,800
32,1
0034
,400
34,4
009,
900
17,9
0029
,800
32,1
0034
,400
34,4
00
Impa
ct 2
: In
crea
se in
ag
ricul
tura
l GD
P (K
ES, b
n)
2.1
Incr
ease
d ag
pr
oduc
tion
2.3
Expa
nded
va
lue
chain
de
velo
pmen
t2.
4 In
crea
sed
resil
ience
3.5
Inve
stm
ent
in p
ost-h
arve
st
hand
ling
3.6
Mor
e ag
re
sear
ch a
nd
inno
vatio
n
02.
613
.221
.923
.625
.387
3.2
15.8
26.3
28.3
30.4
104.
0
Impa
ct 3
: N
umbe
r of
farm
ers
impa
cted
(m
n)
2.1
Incr
ease
d ag
pr
oduc
tion
2.3
Expa
nded
va
lue
chain
de
velo
pmen
t
3.4
Crea
te
enab
ling
envir
onm
ent f
or
partn
ersh
ip3.
5 In
vest
men
t in
pos
t-har
vest
ha
ndlin
g
00.
30.
70.
70.
70.
70.
70.
30.
90.
90.
90.
90.
9
Ove
rvie
w o
f ass
umpt
ions
for i
mpa
ct in
dica
tors
with
in th
e re
sults
fram
ewor
k TA
BLE
1: A
SSUM
PTIO
NS F
OR
IMPA
CT IN
DICA
TORS
WIT
HIN
THE
RESU
LTS
FRAM
EWO
RKNo
te: T
his
tabl
e ro
unds
num
bers
to tw
o sig
nific
ant fi
gure
s, u
nles
s th
ere
is a
mat
erial
loss
in m
eani
ng a
cros
s ye
ars,
whe
re m
ore
signi
fican
t figu
res
are
prov
ided
. The
tabl
e m
ainta
ins
the
met
ric s
yste
m o
f m
easu
rem
ent t
o be
con
siste
nt w
ith C
AADP
mea
sure
men
ts, a
nd h
ence
diffe
rs s
light
ly fro
m th
e re
st o
f the
doc
umen
t tha
t use
s ac
res.

57
K E N YA’S AG R I CU LT U R A L SECTO R R E SU LTS F R A M E W O R K
Impa
ct 4
: Num
ber
of fa
rmer
-faci
ng
SMEs
sup
porte
d (u
nit)
[exc
lude
s FB
Os]
2.1
Incr
ease
d ag
pr
oduc
tion
2.3
Expa
nded
va
lue
chain
de
velo
pmen
t
3.4
Crea
te
enab
ling
envir
onm
ent f
or
partn
ersh
ip3.
5 In
vest
men
t in
pos
t-har
vest
ha
ndlin
g
066
080
080
080
080
080
080
01,
000
1,00
01,
000
1,00
01,
000
Assu
med
yiel
d un
derp
inni
ng th
e ab
ove
impa
ct
2.1
Incr
ease
d ag
pr
oduc
tion
2.3
Expa
nded
va
lue
chain
de
velo
pmen
t
3.4
Crea
te
enab
ling
envir
onm
ent f
or
partn
ersh
ip3.
6 M
ore
ag
rese
arch
and
in
nova
tion
Maiz
e (to
nnes
per
he
ctar
e)1.
91.
91.
92.
02.
02.
02.
01.
92.
02.
02.
02.
02.
0
Pota
toes
(ton
nes
per h
ecta
re)
15.4
15.4
19.6
23.9
23.9
23.9
23.9
19.6
23.9
23.9
23.9
23.9
23.9
Horti
cultu
re (t
onne
s pe
r hec
tare
)11
.711
.713
.515
.415
.215
.415
.413
.515
.415
.415
.415
.415
.4
Beef
(kg
of m
eat
per h
ead)
140
140
145
150
150
150
150
145
150
150
150
150
150
Dairy
(litre
s pe
r he
ad)
1,32
01,
320
1,36
01,
390
1,39
01,
390
1,39
01,
360
1,39
01,
390
1,39
01,
390
1,39
0
Poul
try (k
g of
mea
t pe
r chi
cken
)1.
61.
61.
81.
82.
02.
02.
01.
81.
81.
81.
81.
81.
8
FLAG
SHIP
2: S
hift
natio
nwid
e su
bsid
y pr
ogra
mm
e fo
cus
to e
mpo
wer
~1.
4 m
illio
n re
gist
ered
hig
h-ne
eds
farm
ers
to a
cces
s a
wid
er ra
nge
of in
puts
from
a v
arie
ty o
f pro
vide
rs, e
nabl
ed b
y di
gita
l ser
vice
del
iver
y
Impa
ct 1
: In
crea
se in
an
nual
sm
all-
scal
e fa
rmer
in
com
es (K
ES)
2.1
Incr
ease
d ag
pr
oduc
tion
2.4
Incr
ease
d re
silien
ce
3.5
Inve
stm
ent
in p
ost-h
arve
st
hand
ling
3.6
Mor
e ag
re
sear
ch a
nd
inno
vatio
n
010
,800
19,0
0027
,100
40,6
0054
,200
54,2
0010
,800
19,0
0027
,100
40,6
0054
,200
54,2
00
Impa
ct 2
: In
crea
se in
ag
ricul
tura
l GD
P (K
ES, b
n)
2.1
Incr
ease
d ag
pr
oduc
tion
2.4
Incr
ease
d re
silien
ce
3.5
Inve
stm
ent
in p
ost-h
arve
st
hand
ling
3.6
Mor
e ag
re
sear
ch a
nd
inno
vatio
n
012
.521
.831
.146
.762
.317
0.4
15.0
26.2
37.4
56.1
74.8
210.
3

58
INVESTING IN KENYA’S AGRICULTURAL SECTOR TRANSFORMATION N A I P 2 0 1 9 - 2 0 2 4
Map
ping
to K
enya
’s A
gric
ultu
ral
Sect
or R
esul
ts F
ram
ewor
k (F
igur
e 19
)
ImpactBaseline
Annu
al im
pact
targ
ets
(low
)An
nual
impa
ct ta
rget
s (h
igh)
Associated Outcome
Associated Output
Year 1
Year 2
Year 3
Year 4
Year 5
Sum Total
Year 1
Year 2
Year 3
Year 4
Year 5
Sum Total
Impa
ct 3
: N
umbe
r of
farm
ers
impa
cted
(m
n)
2.1
Incr
ease
d ag
pr
oduc
tion
3.5
Inve
stm
ent
in p
ost-h
arve
st
hand
ling
02.
32.
32.
32.
32.
32.
32.
82.
82.
82.
82.
82.
8
Assu
med
yiel
d un
derp
inni
ng th
e ab
ove
impa
ct
2.1
Incr
ease
d ag
pr
oduc
tion
3.5
Inve
stm
ent
in p
ost-h
arve
st
hand
ling
3.6
Mor
e ag
re
sear
ch a
nd
inno
vatio
n
Maiz
e (to
nnes
per
he
ctar
e)1.
71.
81.
81.
81.
81.
91.
91.
81.
81.
81.
81.
91.
9
Pota
toes
(ton
nes
per h
ecta
re)
9.9
12.4
14.2
16.1
19.2
22.2
22.2
12.4
14.2
16.1
19.2
22.2
22.2
Horti
cultu
re (t
onne
s pe
r hec
tare
)9.
09.
810
.411
.012
.013
.013
.09.
810
.411
.012
.013
.013
.0
Beef
(kg
of m
eat
per h
ead)
130
130
130
130
140
140
140
130
130
130
140
140
140
Dairy
(litre
s pe
r he
ad)
1300
1,30
01,
300
1,30
01,
300
1,30
01,
300
1,30
01,
300
1,30
01,
300
1,30
01,
300
Poul
try (k
g of
mea
t pe
r chi
cken
)1.
11.
21.
31.
31.
41.
61.
61.
21.
31.
31.
41.
61.
6

59
Map
ping
to K
enya
’s A
gric
ultu
ral
Sect
or R
esul
ts F
ram
ewor
k (F
igur
e 19
)
ImpactBaseline
Annu
al im
pact
targ
ets
(low
)An
nual
impa
ct ta
rget
s (h
igh)
Associated Outcome
Associated Output
Year 1
Year 2
Year 3
Year 4
Year 5
Sum Total
Year 1
Year 2
Year 3
Year 4
Year 5
Sum Total
Impa
ct 3
: N
umbe
r of
farm
ers
impa
cted
(m
n)
2.1
Incr
ease
d ag
pr
oduc
tion
3.5
Inve
stm
ent
in p
ost-h
arve
st
hand
ling
02.
32.
32.
32.
32.
32.
32.
82.
82.
82.
82.
82.
8
Assu
med
yiel
d un
derp
inni
ng th
e ab
ove
impa
ct
2.1
Incr
ease
d ag
pr
oduc
tion
3.5
Inve
stm
ent
in p
ost-h
arve
st
hand
ling
3.6
Mor
e ag
re
sear
ch a
nd
inno
vatio
n
Maiz
e (to
nnes
per
he
ctar
e)1.
71.
81.
81.
81.
81.
91.
91.
81.
81.
81.
81.
91.
9
Pota
toes
(ton
nes
per h
ecta
re)
9.9
12.4
14.2
16.1
19.2
22.2
22.2
12.4
14.2
16.1
19.2
22.2
22.2
Horti
cultu
re (t
onne
s pe
r hec
tare
)9.
09.
810
.411
.012
.013
.013
.09.
810
.411
.012
.013
.013
.0
Beef
(kg
of m
eat
per h
ead)
130
130
130
130
140
140
140
130
130
130
140
140
140
Dairy
(litre
s pe
r he
ad)
1300
1,30
01,
300
1,30
01,
300
1,30
01,
300
1,30
01,
300
1,30
01,
300
1,30
01,
300
Poul
try (k
g of
mea
t pe
r chi
cken
)1.
11.
21.
31.
31.
41.
61.
61.
21.
31.
31.
41.
61.
6
K E N YA’S AG R I CU LT U R A L SECTO R R E SU LTS F R A M E W O R K
FLAG
SHIP
3: S
et-u
p 6
agro
-pro
cess
ing
hubs
acr
oss
the
coun
try v
ia o
ne-s
top-
shop
rapi
d PP
P pr
oces
s fo
r dom
estic
and
exp
ort m
arke
ts
Impa
ct 1
: Tot
al
valu
e cr
eate
d fro
m a
gro-
proc
essi
ng (K
ES,
bn)
2.2
Incr
ease
d in
tra-A
frica
n tra
de2.
3 Ex
pand
ed
agro
-indu
stry
3.2
Stro
ng in
tra-
Afric
an tr
ade
polic
y3.
4 Cr
eate
en
ablin
g en
viron
men
t for
pa
rtner
ship
3.5
Incr
ease
in
vest
men
t in
pol
icy,
infra
stru
ctur
e an
d PP
Ps
00.
00.
010
.610
.610
.631
.80.
00.
017
.717
.717
.753
.0
Impa
ct 2
: In
crea
se in
GD
P (K
ES, b
n)
2.2
Incr
ease
d in
tra-A
frica
n tra
de2.
3 Ex
pand
ed
agro
-indu
stry
3.2
Stro
ng in
tra-
Afric
an tr
ade
polic
y3.
4 Cr
eate
en
ablin
g en
viron
men
t for
pa
rtner
ship
3.5
Incr
ease
in
vest
men
t in
pol
icy,
infra
stru
ctur
e an
d PP
Ps
025
.325
.335
.910
.610
.611
0.6
33.7
33.7
51.3
17.7
17.7
150.
0
Impa
ct 3
: As
sum
ed In
tern
al
Rate
of R
etur
n (IR
R) (%
)
2.2
Incr
ease
d in
tra-A
frica
n tra
de2.
3 Ex
pand
ed
agro
-indu
stry
3.2
Stro
ng in
tra-
Afric
an tr
ade
polic
y3.
4 Cr
eate
en
ablin
g en
viron
men
t for
pa
rtner
ship
3.5
Incr
ease
in
vest
men
t in
pol
icy,
infra
stru
ctur
e an
d PP
Ps
N/A
N/A
N/A
N/A
N/A
N/A
10%
N/A
N/A
N/A
N/A
N/A
17%

60
INVESTING IN KENYA’S AGRICULTURAL SECTOR TRANSFORMATION N A I P 2 0 1 9 - 2 0 2 4
Map
ping
to K
enya
’s A
gric
ultu
ral
Sect
or R
esul
ts F
ram
ewor
k (F
igur
e 19
)
ImpactBaseline
Annu
al im
pact
targ
ets
(low
)An
nual
impa
ct ta
rget
s (h
igh)
Associated Outcome
Associated Output
Year 1
Year 2
Year 3
Year 4
Year 5
Sum Total
Year 1
Year 2
Year 3
Year 4
Year 5
Sum Total
Impa
ct 4
: In
crem
enta
l nu
mbe
r of
agro
-pro
cess
ing
faci
litie
s (u
nit)
2.2
Incr
ease
d in
tra-A
frica
n tra
de2.
3 Ex
pand
ed
agro
-indu
stry
3.2
Stro
ng in
tra-
Afric
an tr
ade
polic
y3.
4 Cr
eate
en
ablin
g en
viron
men
t for
pa
rtner
ship
3.5
Incr
ease
in
vest
men
t in
pol
icy,
infra
stru
ctur
e an
d PP
Ps
00
05
55
50
05
55
5
FLAG
SHIP
4: U
nloc
k ~5
0 ne
w la
rge-
scal
e (>
2,50
0 ac
re) f
arm
s, w
ith 1
50,0
00 a
cres
und
er s
usta
inab
le ir
rigat
ion,
with
com
petit
ive
bidd
ing,
pro
tect
ed la
nd o
wne
rshi
p, a
nd g
over
nmen
t pr
ovis
ion
of b
asic
infra
stru
ctur
e (i.
e., p
ower
, roa
ds)
Impa
ct 1
: In
crea
se in
ag
ricul
tura
l GD
P (K
ES, b
n)
2.2
Incr
ease
d in
tra-A
frica
n tra
de2.
3 Ex
pand
ed
agro
-indu
stry
3.2
Stro
ng in
tra-
Afric
an tr
ade
polic
y3.
4 Cr
eate
en
ablin
g en
viron
men
t for
pa
rtner
ship
3.5
Incr
ease
in
vest
men
t in
pol
icy,
infra
stru
ctur
e an
d PP
Ps
07.
118
.621
.944
.767
.416
0.8
8.7
22.7
26.8
54.7
82.5
200.
0
Maiz
e (h
ecta
re)
05,
000
13,7
0016
,300
33,1
0050
,000
50,0
005,
000
13,7
0016
,300
33,1
0050
,000
50,0
00
Pota
toes
(hec
tare
)0
15,1
0041
,200
48,8
0099
,400
150,
000
150,
000
15,1
0041
,200
48,8
0099
,400
150,
000
150,
000

61
K E N YA’S AG R I CU LT U R A L SECTO R R E SU LTS F R A M E W O R K
Impa
ct 2
: Lan
d un
der fl
agsh
ip
(ha)
2.2
Incr
ease
d in
tra-A
frica
n tra
de2.
3 Ex
pand
ed
agro
-indu
stry
3.2
Stro
ng in
tra-
Afric
an tr
ade
polic
y3.
4 Cr
eate
en
ablin
g en
viron
men
t for
pa
rtner
ship
3.5
Incr
ease
in
vest
men
t in
pol
icy,
infra
stru
ctur
e an
d PP
Ps
020
,200
55,0
0065
,100
132,
500
200,
000
200,
000
20,2
0055
,000
65,1
0013
2,50
020
0,00
020
0,00
0
Impa
ct 3
: As
sum
ed la
nd
unde
r irri
gatio
n (h
a)
2.2
Incr
ease
d in
tra-A
frica
n tra
de2.
3 Ex
pand
ed
agro
-indu
stry
3.2
Stro
ng in
tra-
Afric
an tr
ade
polic
y3.
4 Cr
eate
en
ablin
g en
viron
men
t for
pa
rtner
ship
3.5
Incr
ease
in
vest
men
t in
pol
icy,
infra
stru
ctur
e an
d PP
Ps
05,
400
10,7
0020
,600
21,4
0022
,300
22,3
0010
,900
21,9
0038
,900
43,7
0048
,600
48,6
00
FLAG
SHIP
5: R
estru
ctur
e go
vern
ance
and
ope
ratio
ns o
f the
Stra
tegi
c Fo
od R
eser
ve (S
FR) t
o be
tter s
erve
~4m
n vu
lner
able
Ken
yans
Impa
ct 1
: Re
duct
ion
in
food
-inse
cure
po
pula
tion
2.2
Incr
ease
d in
tra-A
frica
n tra
de
3.2
Stro
ng in
tra-
Afric
an tr
ade
polic
y3.
5 In
crea
se
inve
stm
ent i
n po
st-h
arve
st
hand
ling
022
2,10
044
4,10
066
6,20
088
8,20
01,1
10,30
01,1
10,30
054
3,80
01,0
87,60
01,6
31,40
02,1
75,20
02,7
19,00
02,7
19,00
0
Impa
ct 2
: Sto
cks
mai
ntai
ned
(tonn
es)
2.2
Incr
ease
d in
tra-A
frica
n tra
de2.
4 In
crea
sed
resil
ience
3.2
Stro
ng in
tra-
Afric
an tr
ade
polic
y3.
5 In
crea
se
inve
stm
ent i
n po
st-h
arve
st
hand
ling
020
,200
55,0
0065
,100
132,
500
200,
000
200,
000
20,2
0055
,000
65,1
0013
2,50
020
0,00
020
0,00
0
Maiz
e22
2k44
4,10
066
6,20
088
8,20
01,1
10,30
01,1
10,30
054
3,80
01,0
87,60
01,6
31,40
02,1
75,20
02,7
19,00
02,7
19,00
022
2,10
0
Bean
s0
28,7
0057
,300
86,0
0086
,000
86,0
0086
,000
2870
057
300
86,0
0086
,000
86,0
0086
,000
Rice
0TB
DTB
DTB
DTB
DTB
DTB
DTB
DTB
DTB
DTB
DTB
DTB
D
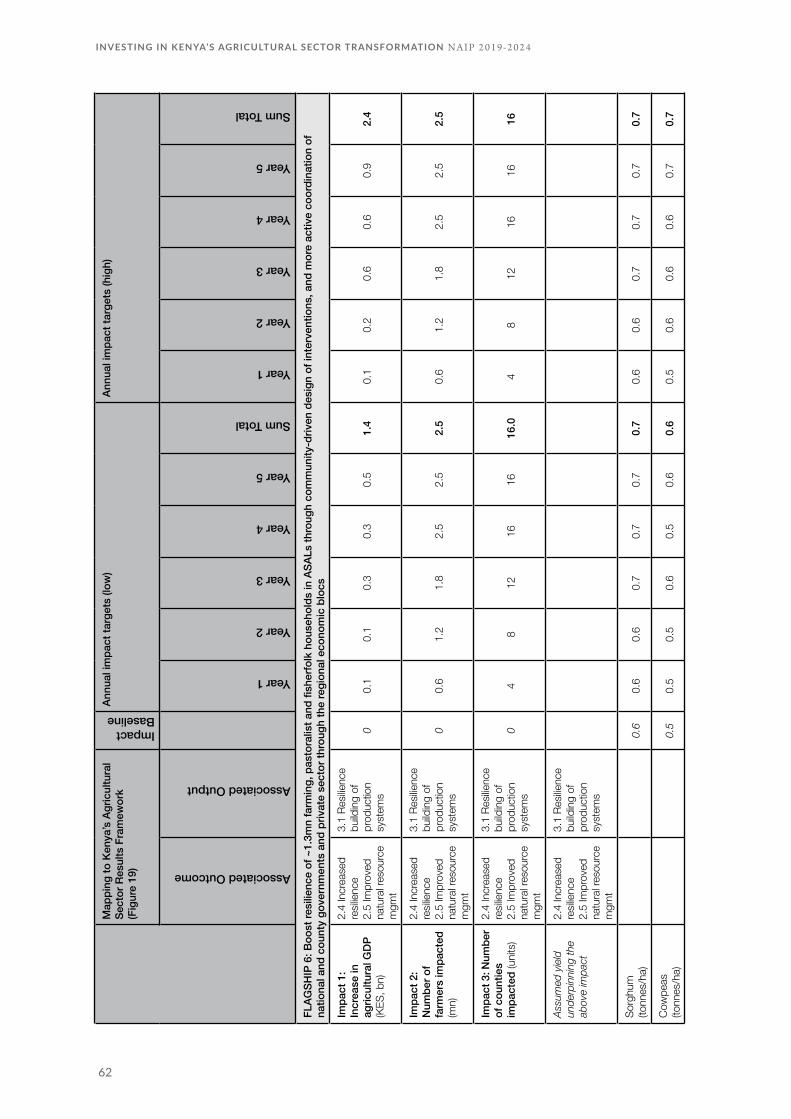
62
INVESTING IN KENYA’S AGRICULTURAL SECTOR TRANSFORMATION N A I P 2 0 1 9 - 2 0 2 4
Map
ping
to K
enya
’s A
gric
ultu
ral
Sect
or R
esul
ts F
ram
ewor
k (F
igur
e 19
)
ImpactBaseline
Annu
al im
pact
targ
ets
(low
)An
nual
impa
ct ta
rget
s (h
igh)
Associated Outcome
Associated Output
Year 1
Year 2
Year 3
Year 4
Year 5
Sum Total
Year 1
Year 2
Year 3
Year 4
Year 5
Sum Total
FLAG
SHIP
6: B
oost
resi
lienc
e of
~1.
3mn
farm
ing,
pas
tora
list a
nd fi
sher
folk
hou
seho
lds
in A
SALs
thro
ugh
com
mun
ity-d
riven
des
ign
of in
terv
entio
ns, a
nd m
ore
activ
e co
ordi
natio
n of
na
tiona
l and
cou
nty
gove
rnm
ents
and
priv
ate
sect
or th
roug
h th
e re
gion
al e
cono
mic
blo
cs
Impa
ct 1
: In
crea
se in
ag
ricul
tura
l GD
P (K
ES, b
n)
2.4
Incr
ease
d re
silien
ce2.
5 Im
prov
ed
natu
ral r
esou
rce
mgm
t
3.1
Resil
ience
bu
ildin
g of
pr
oduc
tion
syst
ems
00.
10.
10.
30.
30.
51.
40.
10.
20.
60.
60.
92.
4
Impa
ct 2
: N
umbe
r of
farm
ers
impa
cted
(m
n)
2.4
Incr
ease
d re
silien
ce2.
5 Im
prov
ed
natu
ral r
esou
rce
mgm
t
3.1
Resil
ience
bu
ildin
g of
pr
oduc
tion
syst
ems
00.
61.
21.
82.
52.
52.
50.
61.
21.
82.
52.
52.
5
Impa
ct 3
: Num
ber
of c
ount
ies
impa
cted
(uni
ts)
2.4
Incr
ease
d re
silien
ce2.
5 Im
prov
ed
natu
ral r
esou
rce
mgm
t
3.1
Resil
ience
bu
ildin
g of
pr
oduc
tion
syst
ems
04
812
1616
16.0
48
1216
1616
Assu
med
yiel
d un
derp
inni
ng th
e ab
ove
impa
ct
2.4
Incr
ease
d re
silien
ce2.
5 Im
prov
ed
natu
ral r
esou
rce
mgm
t
3.1
Resil
ience
bu
ildin
g of
pr
oduc
tion
syst
ems
Sorg
hum
(to
nnes
/ha)
0.6
0.6
0.6
0.7
0.7
0.7
0.7
0.6
0.6
0.7
0.7
0.7
0.7
Cow
peas
(to
nnes
/ha)
0.5
0.5
0.5
0.6
0.5
0.6
0.6
0.5
0.6
0.6
0.6
0.7
0.7

63
K E N YA’S AG R I CU LT U R A L SECTO R R E SU LTS F R A M E W O R K
Gre
en g
ram
s (to
nnes
/ha)
0.5
0.5
0.6
0.6
0.6
0.6
0.6
0.6
0.6
0.6
0.6
0.7
0.7
Cass
ava
(tonn
es/h
a)0.
90.
90.
91.
01.
01.
01.
01.
01.
01.
11.
11.
11.
1
Impa
ct 5
: As
sum
ed
lives
tock
m
orta
lity
rate
re
duct
ion
(redu
ce
by 2
5-50
%)
2.4
Incr
ease
d re
silien
ce2.
5 Im
prov
ed
natu
ral r
esou
rce
mgm
t
3.1
Resil
ience
bu
ildin
g of
pr
oduc
tion
syst
ems
5.0%
4.9%
4.9%
4.7%
4.7%
4.6%
4.6%
4.8%
4.6%
4.4%
4.4%
4.1%
4.1%
FLAG
SHIP
7: L
aunc
h 3
know
ledg
e an
d sk
ills-
build
ing
prog
ram
mes
for ~
200
natio
nal a
nd c
ount
y go
vern
men
t lea
ders
; ski
ll bu
ildin
g fo
r pub
lic a
nd p
rivat
e se
ctor
flag
ship
impl
emen
tatio
n;
man
agem
ent/t
echn
ical
trai
ning
for ~
3,00
0 IT
-ena
bled
gov
ernm
ent y
outh
ext
ensi
on p
rogr
amm
es
Impa
ct 1
: Num
ber
of c
ount
y ex
ecut
ives
re
ceiv
ing
train
ing
(uni
ts)
Indi
rect
ly lin
ked
to a
ll out
com
esIn
dire
ctly
linke
d to
all o
utpu
ts0
1616
1616
1616
1616
1616
1616
Impa
ct 2
: Num
ber
of n
atio
nal
exec
utiv
es
train
ed (u
nits
)
Indi
rect
ly lin
ked
to a
ll out
com
esIn
dire
ctly
linke
d to
all o
utpu
ts0
200
200
200
200
200
200
200
200
200
200
200
200
Impa
ct 3
: Num
ber
of fa
rmer
-faci
ng
SMEs
trai
ned
[exc
lude
s FB
Os]
Indi
rect
ly lin
ked
to a
ll out
com
esIn
dire
ctly
linke
d to
all o
utpu
ts0
660
800
800
800
800
800
800
1,00
01,
000
1,00
01,
000
1,00
0
Impa
ct 4
: Num
ber
of e
xten
sion
w
orke
rs h
ired
(uni
ts)
Indi
rect
ly lin
ked
to a
ll out
com
esIn
dire
ctly
linke
d to
all o
utpu
ts0
750
1,50
02,
200
3,00
03,
000
3,00
075
01,
500
2,20
03,
000
3,00
03,
000
Impa
ct 5
: Rat
io
of e
xten
sion
w
orke
rs: f
arm
s (u
nits
)
Indi
rect
ly lin
ked
to a
ll out
com
esIn
dire
ctly
linke
d to
all o
utpu
ts1,
000
860
750
670
600
600
600
860
750
670
600
600
600
FLAG
SHIP
8: S
treng
then
rese
arch
and
inno
vatio
n, w
hile
laun
chin
g pr
iorit
y di
gita
l and
dat
a us
e ca
se to
bet
ter d
rive
deci
sion
mak
ing
and
perfo
rman
ce m
anag
emen
t
Impa
ct 1
: Num
ber
of fa
rmer
s el
ectro
nica
lly
regi
ster
ed (m
n)
2.1
Incr
ease
ag
prod
uctio
n3.
6 M
ore
ag
rese
arch
and
in
nova
tion
02.
32.
32.
32.
32.
32.
32.
762.
762.
762.
762.
762.
76

64
INVESTING IN KENYA’S AGRICULTURAL SECTOR TRANSFORMATION N A I P 2 0 1 9 - 2 0 2 4
Map
ping
to K
enya
’s A
gric
ultu
ral
Sect
or R
esul
ts F
ram
ewor
k (F
igur
e 19
)
ImpactBaseline
Annu
al im
pact
targ
ets
(low
)An
nual
impa
ct ta
rget
s (h
igh)
Associated Outcome
Associated Output
Year 1
Year 2
Year 3
Year 4
Year 5
Sum Total
Year 1
Year 2
Year 3
Year 4
Year 5
Sum Total
Impa
ct 2
: N
umbe
r of S
MEs
on
-boa
rded
and
re
gist
ered
(uni
ts)
[exc
lude
s FB
Os]
2.1
Incr
ease
ag
prod
uctio
n3.
6 M
ore
ag
rese
arch
and
in
nova
tion
066
080
080
080
080
080
080
01,
000
1,00
01,
000
1,00
01,
000
FLAG
SHIP
9: M
onito
r res
pons
es to
two
key
food
sys
tem
risk
s: (i
) sus
tain
able
and
clim
ate-
smar
t nat
ural
reso
urce
man
agem
ent;
(ii) c
risis
man
agem
ent f
or p
ests
, dis
ease
clim
ate
and
glob
al
pric
e sh
ocks
Impa
ct 1
: N
umbe
r of s
ites
getti
ng s
oil
test
ing
(uni
ts)
2.5
Impr
oved
na
tura
l res
ourc
e m
gmt
3.1
Resil
ience
of
pro
duct
ion
syst
ems
015
0,00
020
0,00
050
0,00
050
0,00
050
0,00
01,8
50,00
015
0,00
020
0,00
050
0,00
050
0,00
050
0,00
01,8
50,00
0
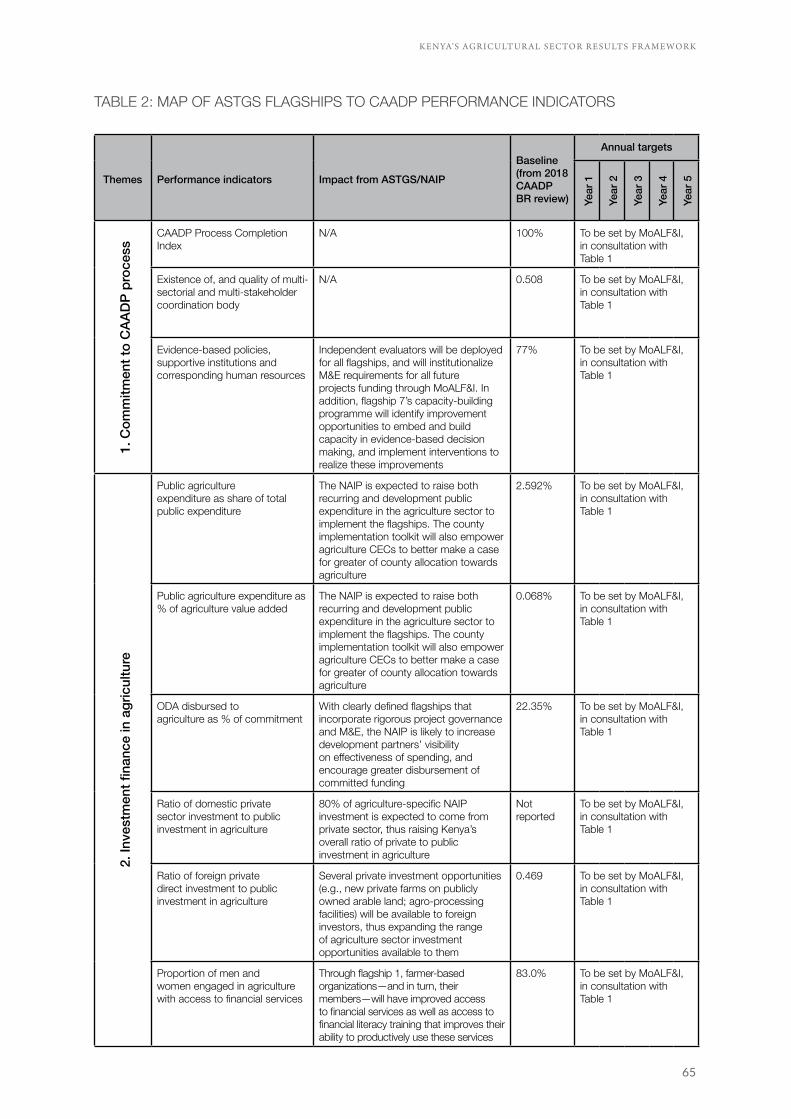
65
K E N YA’S AG R I CU LT U R A L SECTO R R E SU LTS F R A M E W O R K
Themes Performance indicators Impact from ASTGS/NAIP
Baseline (from 2018 CAADP BR review)
Annual targets
Year
1
Year
2
Year
3
Year
4
Year
5
1. C
omm
itmen
t to
CAA
DP
proc
ess
CAADP Process Completion Index
N/A 100% To be set by MoALF&I, in consultation with Table 1
Existence of, and quality of multi-sectorial and multi-stakeholder coordination body
N/A 0.508 To be set by MoALF&I, in consultation with Table 1
Evidence-based policies, supportive institutions and corresponding human resources
Independent evaluators will be deployed for all flagships, and will institutionalize M&E requirements for all future projects funding through MoALF&I. In addition, flagship 7’s capacity-building programme will identify improvement opportunities to embed and build capacity in evidence-based decision making, and implement interventions to realize these improvements
77% To be set by MoALF&I, in consultation with Table 1
2. In
vest
men
t fina
nce
in a
gric
ultu
re
Public agriculture expenditure as share of total public expenditure
The NAIP is expected to raise both recurring and development public expenditure in the agriculture sector to implement the flagships. The county implementation toolkit will also empower agriculture CECs to better make a case for greater of county allocation towards agriculture
2.592% To be set by MoALF&I, in consultation with Table 1
Public agriculture expenditure as % of agriculture value added
The NAIP is expected to raise both recurring and development public expenditure in the agriculture sector to implement the flagships. The county implementation toolkit will also empower agriculture CECs to better make a case for greater of county allocation towards agriculture
0.068% To be set by MoALF&I, in consultation with Table 1
ODA disbursed to agriculture as % of commitment
With clearly defined flagships that incorporate rigorous project governance and M&E, the NAIP is likely to increase development partners’ visibility on effectiveness of spending, and encourage greater disbursement of committed funding
22.35% To be set by MoALF&I, in consultation with Table 1
Ratio of domestic privatesector investment to public investment in agriculture
80% of agriculture-specific NAIP investment is expected to come from private sector, thus raising Kenya’s overall ratio of private to public investment in agriculture
Not reported
To be set by MoALF&I, in consultation with Table 1
Ratio of foreign privatedirect investment to public investment in agriculture
Several private investment opportunities (e.g., new private farms on publicly owned arable land; agro-processing facilities) will be available to foreign investors, thus expanding the range of agriculture sector investment opportunities available to them
0.469 To be set by MoALF&I, in consultation with Table 1
Proportion of men and women engaged in agriculture with access to financial services
Through flagship 1, farmer-based organizations—and in turn, their members—will have improved access to financial services as well as access to financial literacy training that improves their ability to productively use these services
83.0% To be set by MoALF&I, in consultation with Table 1
TABLE 2: MAP OF ASTGS FLAGSHIPS TO CAADP PERFORMANCE INDICATORS

66
INVESTING IN KENYA’S AGRICULTURAL SECTOR TRANSFORMATION N A I P 2 0 1 9 - 2 0 2 4
Themes Performance indicators Impact from ASTGS/NAIP
Baseline (from 2018 CAADP BR review)
Annual targets
Year
1
Year
2
Year
3
Year
4
Year
5
3. E
ndin
g hu
nger
Fertilizer consumption(kilogram of nutrients per hectare of arable land)
Through flagship 2, soil testing and diversification of subsidies will expand fertilizer access and effectiveness for farmers in different agro-ecological zones and value chains
6.33 kg per ha of arable land
To be set by MoALF&I, in consultation with Table 1
Growth rate of the size ofirrigated areas from its value of the year 2000
The SMEs in flagship 1 will increase access to irrigation technologies in the appropriate zones; flagship 2 will make pumps more affordable to small-scale farmers, and is likely to increase irrigated land area; in addition, the arable land scheme of flagship 4 will use existing dams to increase irrigated arable publicly owned land and will also allow farmers to invest in irrigation, given the long lease tenure
281% To be set by MoALF&I, in consultation with Table 1
Growth rate of the ratioof supplied quality agricultureinputs (seed, breed,fingerlings) to the totalnational inputs requirements for the commodity
Flagships 1 and 2 will increase access to quality inputs, including seeds, breeds, and fingerlings, among small-scale farmers and fisherfolk, and likely will raise the growth rate of these inputs’ use
-0.035 NPK and feeds-12% in seed
To be set by MoALF&I, in consultation with Table 1
Proportion of farmershaving access to Agricultural Advisory Services
Flagship 7 will expand extension services through the counties by leveraging youth and digital technologies, thus expanding access to Agricultural Advisory Services for farmers
75% To be set by MoALF&I, in consultation with Table 1
Total agricultural research spending as a share of agriculture GDP
Flagship 8 will involve greater funding for non-traditional research areas, such as crop varieties and livestock breeds for ASAL areas
2% To be set by MoALF&I, in consultation with Table 1
Proportion of farm households with ownership or secure land rights
N/A 38.2% To be set by MoALF&I, in consultation with Table 1
Growth rate of agriculturevalue added, in constant US dollars, per agricultural worker
Flagships 1, 2, 4, 6, 7, 8 and 9 will raise the labour productivity of farmers, and flagship 9 will raise the likelihood that these productivity improvements will be sustained into the future
14.0% To be set by MoALF&I, in consultation with Table 1
Growth rate of agriculture value added, in constant US dollar, per hectare of agricultural arable land
Flagships 1, 2, 4, 6, 7, 8 and 9 will raise the land productivity, and flagship 9 will raise the likelihood that these productivity improvements will be sustained into the future
14.2% To be set by MoALF&I, in consultation with Table 1
Growth rate of yields for the 5 national priority commodities, and possibly for the 11 AU agriculture priority commodities
Flagships 1, 2, 4, 6, 7 and 8 will raise the yield for national priority flagships (maize, tea, rice, beef and dairy milk) and possibly the other of the 11 AU priority commodities; and flagship 9 will raise the likelihood that these productivity improvements will be sustained into the future
-1.07% To be set by MoALF&I, in consultation with Table 1

67
K E N YA’S AG R I CU LT U R A L SECTO R R E SU LTS F R A M E W O R K
Themes Performance indicators Impact from ASTGS/NAIP
Baseline (from 2018 CAADP BR review)
Annual targets
Year
1
Year
2
Year
3
Year
4
Year
5
3. E
ndin
g hu
nger
Reduction rate of post-harvest losses for (at least) the 5 national priority commodities, and possibly for the 11 AU agriculture priority commodities
Flagship 1 and 2 will increase access and affordability of quality post-harvest services for farmers, reducing PHL; in addition, flagship 3 will incorporate stringent standards for post-harvest storage and processing, further cutting down PHL; flagship 5 will also reduce storage-related PHL by introducing strict quality-control standards to storage facilities involved in the strategic food reserve system
-0.85% To be set by MoALF&I, in consultation with Table 1
Budget lines (%) on socialprotection as percentage of the total resource requirements for coverage of the vulnerable social groups
Expansion of the cash transfer programme to non-ASAL regions, as suggested in flagship 6, will provide additional protection for Kenya’s food-insecure population
0.867 To be set by MoALF&I, in consultation with Table 1
Prevalence of stunting (%of children under 5 years old)
Flagships 1, 2, 4, 6, 7, 8 and 9 will increase agricultural productivity and will thus, together with flagship 3 and 5, increase the food supply and bring down the cost of food in Kenya. Together, these effects are expected to reduce the prevalence of child stunting in Kenya
26% To be set by MoALF&I, in consultation with Table 1
Prevalence of underweight (% of children under 5 years old)
Flagships 1, 2, 4, 6, 7, 8 and 9 will increase agricultural productivity and will thus, together with flagship 3 and 5, increase the food supply and bring down the cost of food in Kenya. Together, these effects are expected to reduce the prevalence of underweight among children in Kenya
11% To be set by MoALF&I, in consultation with Table 1
Prevalence of wasting (%of children under 5 old)
Flagships 1, 2, 4, 6, 7, 8 and 9 will increase agricultural productivity and will thus, together with flagship 3 and 5, increase the food supply and bring down the cost of food in Kenya. Together, these effects are expected to reduce the prevalence of wasting in Kenya
4% To be set by MoALF&I, in consultation with Table 1
Proportion of thepopulation that isundernourished (% of thecountry’s population)
Flagships 1, 2, 4, 6, 7, 8 and 9 will increase agricultural productivity and will thus, together with flagship 3 and 5, increase the food supply and bring down the cost of food in Kenya. Together, these effects are expected to reduce the proportion of the population that is undernourished
24.3% To be set by MoALF&I, in consultation with Table 1
Growth rate of theproportion of MinimumDietary Diversity-Women
Flagships 1, 2, 4, 6, 7, 8 and 9 will increase agricultural productivity and will thus, together with flagship 3 and 5, increase the food supply and bring down the cost of food in Kenya. In addition, the focus on promoting women as agricultural producers and decision-makers through flagship 1, 2, 3, 4 and 7 will increase women’s access to food. Together, these effects are expected to increase the proportion of women meeting Minimum Dietary Diversity requirements
Not reported
To be set by MoALF&I, in consultation with Table 1

68
INVESTING IN KENYA’S AGRICULTURAL SECTOR TRANSFORMATION N A I P 2 0 1 9 - 2 0 2 4
Themes Performance indicators Impact from ASTGS/NAIP
Baseline (from 2018 CAADP BR review)
Annual targets
Year
1
Year
2
Year
3
Year
4
Year
5
3. E
ndin
g hu
nger Proportion of 6-23-month-old
children who meet the Minimum Acceptable Diet
Flagships 1, 2, 4, 6, 7, 8 and 9 will increase agricultural productivity and will thus, together with flagship 3 and 5, increase the food supply and bring down the cost of food in Kenya. Together, these effects are expected to increase the proportion of 6-23-month-old children who meet the Minimum Acceptable Diet
22% To be set by MoALF&I, in consultation with Table 1
4. E
radi
catin
g po
verty
thro
ugh
agric
ultu
re
Growth rate of theagriculture value added, inconstant US dollars
Flagships 1, 2, 4, 6, 7, 8 and 9 will raise agricultural productivity, and flagship 9 will raise the likelihood that these productivity improvements will be sustained into the future; together, these effects will accelerate the growth of Kenya’s agricultural value added
4.1% 6% 6% 6% 6% 6%
Agriculture contribution to the overall poverty reduction target
Flagships 1, 2, 6 and 7 will directly increase the income level of small-scale farmers and fisherfolk, thus reducing the incidence of poverty among the population; flagship 3 and 4 will also be major sources of jobs and income, providing sustainable paths out of poverty for those in the implementation area
Not reported
To be set by MoALF&I, in consultation with Table 1
Reduction rate of poverty headcount ratio, at national poverty line (% of population)
Flagships 1, 2, 6 and 7 will directly increase the income level of small-scale farmers and fisherfolk, thus reducing % of Kenya’s population living below the national poverty line; flagship 3 and 4 will also be major sources of jobs and income, providing sustainable paths out of poverty for those in the implementation area
Not reported
To be set by MoALF&I, in consultation with Table 1
Reduction rate of poverty headcount ratio at international poverty line (% of population)
Flagships 1, 2, 6 and 7 will directly increase the income level of small-scale farmers and fisherfolk, thus reducing % of Kenya’s population living below the national poverty line; flagship 3 and 4 will also be major sources of jobs and income, providing sustainable paths out of poverty for those in the implementation area
Not reported
To be set by MoALF&I, in consultation with Table 1
Reduction rate of the gapbetween the wholesale price and farm gate price
Flagship 1 will improve market access for small-scale farmers and fisherfolk, including access to aggregation and transport services and market information, thus accelerating the gap reduction between wholesale price and farm gate price
-0.39 for maize
To be set by MoALF&I, in consultation with Table 1
Number of priorityagricultural commodity value chains for which a PPP is established with strong linkage to small-scale agriculture
Flagship 1 will facilitate the growth of private sector SMEs in high-productivity areas throughout Kenya to directly support the growth of small-scale agriculture
1 To be set by MoALF&I, in consultation with Table 1
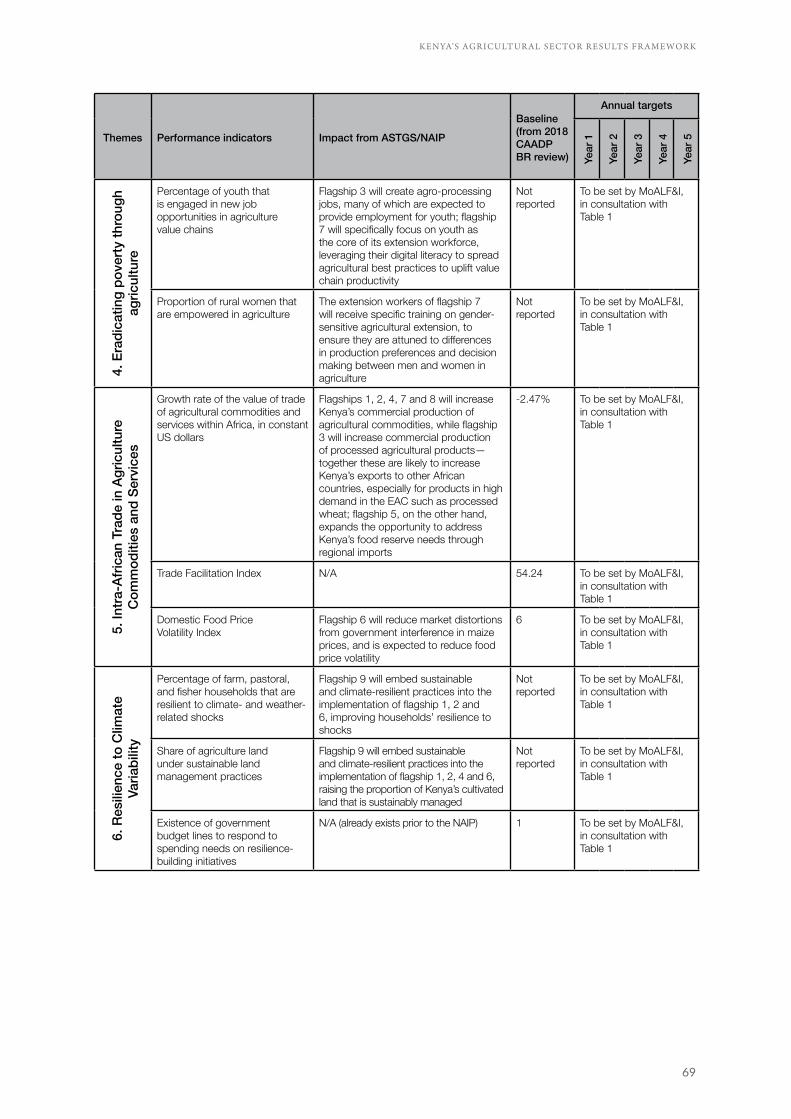
69
K E N YA’S AG R I CU LT U R A L SECTO R R E SU LTS F R A M E W O R K
Themes Performance indicators Impact from ASTGS/NAIP
Baseline (from 2018 CAADP BR review)
Annual targets
Year
1
Year
2
Year
3
Year
4
Year
5
4. E
radi
catin
g po
verty
thro
ugh
agric
ultu
re
Percentage of youth thatis engaged in new jobopportunities in agriculturevalue chains
Flagship 3 will create agro-processing jobs, many of which are expected to provide employment for youth; flagship 7 will specifically focus on youth as the core of its extension workforce, leveraging their digital literacy to spread agricultural best practices to uplift value chain productivity
Not reported
To be set by MoALF&I, in consultation with Table 1
Proportion of rural women that are empowered in agriculture
The extension workers of flagship 7 will receive specific training on gender-sensitive agricultural extension, to ensure they are attuned to differences in production preferences and decision making between men and women in agriculture
Not reported
To be set by MoALF&I, in consultation with Table 1
5. In
tra-A
frica
n Tr
ade
in A
gric
ultu
re
Com
mod
ities
and
Ser
vice
s
Growth rate of the value of trade of agricultural commodities and services within Africa, in constant US dollars
Flagships 1, 2, 4, 7 and 8 will increase Kenya’s commercial production of agricultural commodities, while flagship 3 will increase commercial production of processed agricultural products—together these are likely to increase Kenya’s exports to other African countries, especially for products in high demand in the EAC such as processed wheat; flagship 5, on the other hand, expands the opportunity to address Kenya’s food reserve needs through regional imports
-2.47% To be set by MoALF&I, in consultation with Table 1
Trade Facilitation Index N/A 54.24 To be set by MoALF&I, in consultation with Table 1
Domestic Food PriceVolatility Index
Flagship 6 will reduce market distortions from government interference in maize prices, and is expected to reduce food price volatility
6 To be set by MoALF&I, in consultation with Table 1
6. R
esili
ence
to C
limat
e Va
riabi
lity
Percentage of farm, pastoral, and fisher households that are resilient to climate- and weather-related shocks
Flagship 9 will embed sustainable and climate-resilient practices into the implementation of flagship 1, 2 and 6, improving households’ resilience to shocks
Not reported
To be set by MoALF&I, in consultation with Table 1
Share of agriculture landunder sustainable landmanagement practices
Flagship 9 will embed sustainable and climate-resilient practices into the implementation of flagship 1, 2, 4 and 6, raising the proportion of Kenya’s cultivated land that is sustainably managed
Not reported
To be set by MoALF&I, in consultation with Table 1
Existence of governmentbudget lines to respond tospending needs on resilience-building initiatives
N/A (already exists prior to the NAIP) 1 To be set by MoALF&I, in consultation with Table 1

70
INVESTING IN KENYA’S AGRICULTURAL SECTOR TRANSFORMATION N A I P 2 0 1 9 - 2 0 2 4
Themes Performance indicators Impact from ASTGS/NAIP
Baseline (from 2018 CAADP BR review)
Annual targets
Year
1
Year
2
Year
3
Year
4
Year
5
7. M
utua
l Acc
ount
abili
ty fo
rAc
tions
and
Res
ults
Index of capacity to generate and use agriculture statistical data and information
Flagship 7 will build capacity in evidence-based decision making and data management among policymakers and implementers, and flagship 8 will strengthen availability of data and data-driven insights to stakeholders
58 To be set by MoALF&I, in consultation with Table 1
Existence of inclusive institutionalized mechanisms and platforms for mutual accountability and peer review
Flagship 7 will institutionalize improved project governance through independent public evaluation of flagship projects, and incorporate M&E requirements into all future projects in the agricultural sector; in addition, the ATO will also ensure rigorous performance management of all flagships throughout the transformation
Not reported
To be set by MoALF&I, in consultation with Table 1
Country Biennial Reportsubmission
N/A (already handled through Kenya’s CAADP Focal Point Team)
Not reported
To be set by MoALF&I, in consultation with Table 1
4.4 A NOTE ON IMPACT AND THE ECONOMIC MODELS
Based on the NAIP’s expected contribution to agriculture GDP, and using the IFAD-IFPRI Rural Investment and Policy Analysis (RIAPA) model, implementation of the flagships is expected to create ~300,000 jobs (direct and indirect) in the Kenyan economy in five years. This number is estimated using the RIAPA model’s estimated total economy employment elasticity. It is important to note that this figure only accounts for direct and indirect job creation due to agriculture GDP increase. Since the NAIP is also expected to increase GDP in other sectors (e.g., manufacturing GDP from agro-processing), the total job creation impact of the NAIP will be greater than this.
In fact, if both agriculture and non-agriculture GDP are considered, the NAIP’s total direct contribution to the Kenyan economy over the five years is estimated to be KES 1.0-1.2 trillion. This is equivalent to 2.0-2.5% of Kenya’s expected total baseline GDP over the same period. Finally, note that we do not consider the possibility of improvements in agricultural public expenditure efficiency which have potential to further increase the results shared.

71
M O N I TO R I N G A N D E VA LUAT I O N (M & E) M ECH A N I S M
5.1 MONITORING & EVALUATION
Monitoring and evaluation (M&E) is critical for accountability and for learning. This NAIP includes multiple references to performance-based programming. The success of NAIP implementation depends on a strong M&E framework, with clear accountability within both the national and county governments.
To monitor the NAIP’s implementation, performance will be measured against progress milestones as well as result metrics at different levels – inputs, outputs, and outcomes. As mentioned in Chapter 5, three outcome metrics areas will be tracked to determine progress for the overall NAIP: small-scale farmer incomes, agricultural GDP, and reduction in food-insecure population. Across each of these outcomes, the number of small-scale farmers directly impacted by the transformation will also be monitored. These outcome metrics will also be tracked at the individual
0 5MONITORING AND EVALUATION (M&E) MECHANISM
72
INVESTING IN KENYA’S AGRICULTURAL SECTOR TRANSFORMATION N A I P 2 0 1 9 - 2 0 2 4
flagship level for each county in which the flagship is implemented. This flagship-level tracking will be used to determine linkages between national outcome and flagship outcome in each county, and to highlight any differences in target attainment between the flagships, as well as between different counties implementing the same flagship.
In addition to the outcome metrics, operational-level input and output metrics will be tracked at the flagship level for each county, to ensure that planned implementation milestones and operational targets are achieved as intended. A summary of these three different levels of result metrics and their tracking at the overall NAIP level and flagship level is shown in Figure 21. MoALF&I should carry out an evaluation of the counties’ M&E and reporting systems, as well as their capacity to effectively implement the ASTGS according to the provisions in this chapter. JASCCM will be an invaluable partner to the counties and national government in this process, and can work with the ATO, once it has been set up, to provide additional technical support. It is important to align the M&E cadence as closely as possible with existing county processes and capabilities so that reporting does not detract from the work of implementation.
While the high-level outcome metrics for the NAIP have already been defined, individual flagship owners will need to define all the operational-level input and output metrics for their flagships. In doing this, they will need to ensure that the metrics are aligned with the four outcomes metrics of the ASTGS as well as the Agricultural Sector M&E Framework.
During implementation, performance data on input and output metrics, as well as progress against the implementation milestones at the operations level, will be entered into a digital performance management system by operation-level staff within each county. These compiled data will be owned by GoK, and the ATO and other key stakeholders should have access through a data exchange that can be facilitated by the Office of the Deputy President and the Legislative Intergovernmental Liaison Office (LiLOn). LiLO was created to track all county assemblies, National Assembly and Senate Bills, and proactively mitigate
the conflict of law between the county and national assemblies articulated in Article 191 of the Constitution of Kenya. This data should be interoperable with the Open Data Policy recommended in flagship 8, and work with the relevant existing GoK reporting modules (e.g., the National Horticulture Marketing Information System – NAHMIS). All personally identifiable data will be coded securely by the system.
The digital performance management system will aggregate operation-level data into county-level and national-level performance data for each flagship. It will also provide a dashboard that allows the ATO, flagship champions (Director-level ministry supporters – see below for further information), county governments as well as implementers to see up-to-date progress against targets at different levels, with varying degrees of visibility depending on the user. For example, the ATO and flagship champions will be able to view progress against the milestones and results targets of each flagship at the operation level within each county, at the county level, and at the national level. The performance data at these different levels will also be periodically validated by independent evaluators, as described below, to ensure that information entered into the system by operation-level staff reflects the reality on the ground. This performance management structure is summarized in Figure 22.
For each flagship, independent evaluators will be contracted to conduct M&E in each county where the flagship is being implemented. For flagships 1, 2 and 5, the independent evaluator will heavily leverage the data platforms that will be built as part of the data enabler in flagship 8. These M&E data from all the flagships will then be combined by the ATO to create a transformation-wide visibility on progress against target inputs, outputs and outcomes, including where implementation is going as planned and where there are delays. The data, both at the overall NAIP level and at the individual flagship level, will also be made public, in order to generate accountability for implementation and achievement of targets. To ensure public trust in the M&E process, the evaluators involved should be seen as truly independent, objective and non-political, and should be selected by competitive bidding.

73
M O N I TO R I N G A N D E VA LUAT I O N (M & E) M ECH A N I S M
xc xci xcii
xc Kenya National Bureau of Statisticsxci Agriculture Transformation Officexcii Kenya Food Security Steering Group
DescriptionOverall NAIP-leveltracking
Outcomes High-level impact metrics that are core to the NAIP’s objectives:Small-scale farmer income growthAgricultural GDP expansionReduction in food-insecure population
Outputs
Flagship-level tracking
Ag GDP – by KNBSxc
Incomes – by ATOxci
Food-insecure population – by KFSSGxcii
All three metrics are tracked by the independent evaluator for each flagship at the county level
Result metrics
Operational-level output metrics for each flagship, e.g.:Yield improvement for small-scale farmers receiving subsidiesLead time to supply food aid to vulnerable population during crises
N/A Metrics to be defined by the owner of each flagship and tracked by the independent evaluator for each flagship at the county level
Inputs Operational-level output metrics for each flagship, e.g.:Actual subsidy amount disbursedQuantity of each commodity in the Strategic Food Reserve system
N/A Metrics to be defined by the owner of each flagship and tracked by the independent evaluator for each flagship at the county level
FIGURE 21: NAIP RESULTS TRACKING
SOURCE: Team Analysis
Tracking of NAIP result metrics at the national and flagship levels
Description Reporting process
Sub-county Milestones, operation-level input and output metrics, (e.g. production by value chain for each new large farm)
County
Reviewer and reviewfrequencyLevel
National
County CEC of agriculture and other implementation partners regular review progress and address issues as needed
Operations staff enter data into digital tool bi/monthly (i.e. aligned to existing process Periodically validated by independent evaluator
Milestones, operation-level input and output metrics, (e.g. total county-production by value chain from new farms)
ATO reviews progress weekly and works with CECs and GoK sponsors to resolve or escalate issues
Digital tool aggregates data, validated bi/monthly by CECPeriodically validated by independent evaluator
Milestones, output and outcome metrics, (e.g. total production by value chain ~50 new farms; ag GDP increase)
ASTGS SteerCo reviews progress every ~8 weeks digitally, in person 4-6x p.a. Works with MoALF&I CS, ATO and GoK sponsors to resolve issues
Digital tool aggregates data, validated bi/monthly by Director in MoAFL&IPeriodically validated by independent evaluator
See Chapter 8 of ASTGS for detailed information on delivery mechanism
FIGURE 22: NAIP IMPLEMENTATION PERFORMANCE MANAGEMENT STRUCTURE

74
INVESTING IN KENYA’S AGRICULTURAL SECTOR TRANSFORMATION N A I P 2 0 1 9 - 2 0 2 4
5.2 ENSURING MUTUAL ACCOUNTABILITY
The above M&E structure will be used for progress tracking and performance management, and will be the foundation of mutual accountability for the stakeholders in the transformation. The role of each stakeholder in the structure is as follows:■ MoALF&I Cabinet Secretary is the ultimate owner of the national outcomes of the ASTGS. The outcome metrics articulated within this NAIP and the ASTGS will be embedded in the CS’s performance contracts and tied to performance incentives. While the GoK flagship champions will define the operation-level input and output metrics that support the outcomes the CS is responsible for, the CS will report on the full set of performance (outcomes, outputs and inputs) at the ASTGS Steering Council meetings. The CS will therefore be accountable to formulating, implementing and monitoring agricultural policy and regulation, and supporting the MoALF&I to detail the flagships critical to delivering the ASTGS. The MoALF&I Chief Administrative Secretary (CAS) will support the CS with alignment of this accountability across the five state departments of this Ministry. ■ GoK flagship champions (i.e., Permanent Secretaries and Director-level staff from Ministries that comprise the sector, including MoALF&I) will define the operational-level input and output metrics for their respective flagships at the start of the transformation, in consultation with county representatives and the ATO. These metrics will need to align with the four NAIP outcome metrics and with Kenya’s agriculture sector results framework (see Chapter 5). These result metrics – along with the flagship milestones – will then be embedded in their performance contracts and tied to performance incentives. The flagship champions will therefore be held accountable for the delivery of both flagship progress and attainment of result metrics (inputs, outputs and outcomes), and will collaborate with the relevant county CECs of agriculture to achieve these targets. Broad visibility of progress against milestones and impact metrics – enabled through collection and public reporting by the ATO – will be used to foster mutual accountability among
the different stakeholders involved in each flagship and in the transformation as a whole. If a flagship misses implementation milestones or result metric targets, the flagship champion will need to work with the CECs and the ATO to identify the root cause and come up with a solution to debottleneck the issue. Flagships with prolonged delays or underperformance, or those with issues that cannot be resolved at the champion/CEC/ATO level, will be escalated to the ASTGS Steering Council for resolution by the Cabinet Secretary for MoALF&I.■ Council of Governors and County CECs of Agriculture will lead the domestication of the ASTGS and development of the county-specific agricultural transformation plan for their counties with the support of JASSCOM (see the ASTGS document for details), collaborating with the GoK champion of the relevant flagships to set county-level progress and result targets. They will then lead implementation of the ASTGS flagships in their respective counties based on these county transformation plans. During implementation, the county-level progress and result targets will be embedded in the CECs’ performance contracts and tied to performance incentives. The CECs will therefore be held accountable for the delivery of both implementation progress and attainment of result metrics for the flagships in their counties, similarly to the GoK champions. While the counties have expressed great interest in domesticating the strategy, there is a capability gap between national and county governments that will need to be addressed through knowledge and skills building and transfers.The CECs will need to collaborate with the independent evaluators of the relevant flagships to accurately report their counties’ performance on these metrics, as well as work with the individual flagship implementers to gather the intra-county data necessary for this (e.g., working with all the new private farms under flagship 4 in their counties to track production volumes). Visibility of county-level performance against progress and result targets by the ATO, the GoK champions, other county CECs working on similar flagships, other implementation partners, as well as the general public will ensure that the CECs are held accountable for results delivery. If a county

75
M O N I TO R I N G A N D E VA LUAT I O N (M & E) M ECH A N I S M
misses its implementation milestones or result targets, the CEC will need to work with the relevant GoK champions, other implementers and the ATO to identify the root cause and come up with a solution to debottleneck the issue. Flagships with prolonged delays or underperformance, or those with issues that cannot be resolved at the champion/CEC/ATO level, will be escalated to the ASTGS Steering Council for resolution by the Cabinet Secretary for MoALF&I.■ Independent evaluators will play a key role in fostering mutual accountability among the different implementers and stakeholders of the transformation. Once flagship-level result metrics and targets have been agreed between the GoK champions and the ATO, and once the county-level targets of each flagship have been agreed between the county CECs, the GoK champions and the ATO, the independent evaluator of each flagship will be responsible for collecting data on progress against these targets in each county implementing the flagship, and for reporting the data to the ATO. In this process the independent evaluators will need to work closely with the GoK champion, the relevant CECs of agriculture, operational-level implementers (e.g., SME accelerators, SFR private storage providers) and farming households to ensure accuracy of performance data. To generate visibility at different levels of each flagship, the independent evaluator will collect data at the national level, the county level, and within each county as necessary. Different evaluation methods, e.g., randomized controlled trials (RCTs), mobile-based farmer surveys or focus groups will be used as appropriate.■ The ATO will be responsible for performance management of the entire transformation, and will track progress against target milestones and result metrics at the national, flagship and county levels using data collected by the independent evaluators. The ATO will publish these performance tracking results for broad visibility by different stakeholders, including transformation leaders at the national and county levels, implementers and the general public, to foster public, mutual accountability among the partners involved in the transformation. In addition to being the custodian and broadcaster of the
transformation’s performance tracking data, the ATO will be responsible for identifying points of delay or underachievement of result metrics, and working with the relevant GoK champion and county CECs of agriculture to problem-solve the issue. Flagships with prolonged delays or underperformance, or those with issues that cannot be resolved at the champion/CEC/ATO level, will be escalated by the ATO to the ASTGS Steering Council for resolution by the Cabinet Secretary for MoALF&I. See ASTGS for further details on the structure and cadence of the delivery mechanism.In addition to performance management and mutual accountability, this M&E structure has two other purposes. First, rigorous M&E builds credibility with investors and development partners. Objective, reliable data enables NAIP funders to gauge the impact of their investments, increasing the likelihood of continued funding for successful interventions. In addition, they also provide a basis on which to request technical assistance for interventions that are behind target.Second, M&E fosters public accountability and helps garner public and political support for the interventions that have successful, measurable impact. As can be seen with Mexico’s PROGRESA’s programme (see Box 4), an M&E mechanism run by an independent, non-political organization with strong public transparency can dramatically improve the likelihood that successful interventions will outlast changes in government leadership. Having a public, credible M&E mechanism in place will therefore be critical to sustaining continuity of the ASTGS.In addition to creating the above M&E structure for the NAIP, the Ministry will also institutionalize M&E requirements for all future projects from Year 5, i.e., to obtain approval for funding through the Ministry, projects will need to have M&E mechanisms that demonstrate how well initiatives achieve measurable targets in agriculture or food security. To prepare for this shift, the Ministry will develop a plan to transfer M&E capabilities from the independent evaluators monitoring the performance of the ASTGS flagships to Ministry M&E officials over the first three years of implementing this first NAIP. This capability transfer is required because, while ASTGS contains a small

76
INVESTING IN KENYA’S AGRICULTURAL SECTOR TRANSFORMATION N A I P 2 0 1 9 - 2 0 2 4
number of flagships that can be manageably monitored through specific independent evaluators, MoALF&I’s normal course of business typically involves running over 300 projects – likely more than can be managed by the independent evaluators available to Kenya; Ministry officials will therefore need to take on the role of M&E themselves. The goal is that, once NAIP flagship implementation is complete and the work of the independent
evaluators is finished, the ATO and the Ministry will have developed the capabilities required to execute rigorous M&E for all future projects in the agricultural sector.
BOX 4: CASE EXAMPLE: MEXICO’S PROGRESA PROGRAMME
Mexico’s Programa Nacional de Educacion, Salud y Alimentacion (PROGRESA) was a conditional cash transfer programme that used randomized controlled trials (RCTs) to measure its effectiveness. By having a respected non-political international institution – the International Food Policy Research Institute (IFPRI) – independently administer the RCTs, the government ensured the credibility of the findings. In addition to providing insights that helped the government improve the programme, the results of the RCTs also demonstrated the social and economic benefits for its beneficiaries. This strengthened public support for PROGRESA. As a result of the widely publicized benefits of the programme and the broad political support it garnered, PROGRESA has been continued by subsequent political administrations and has been variously rebranded as “Oportunidades” and “Prospera”.28
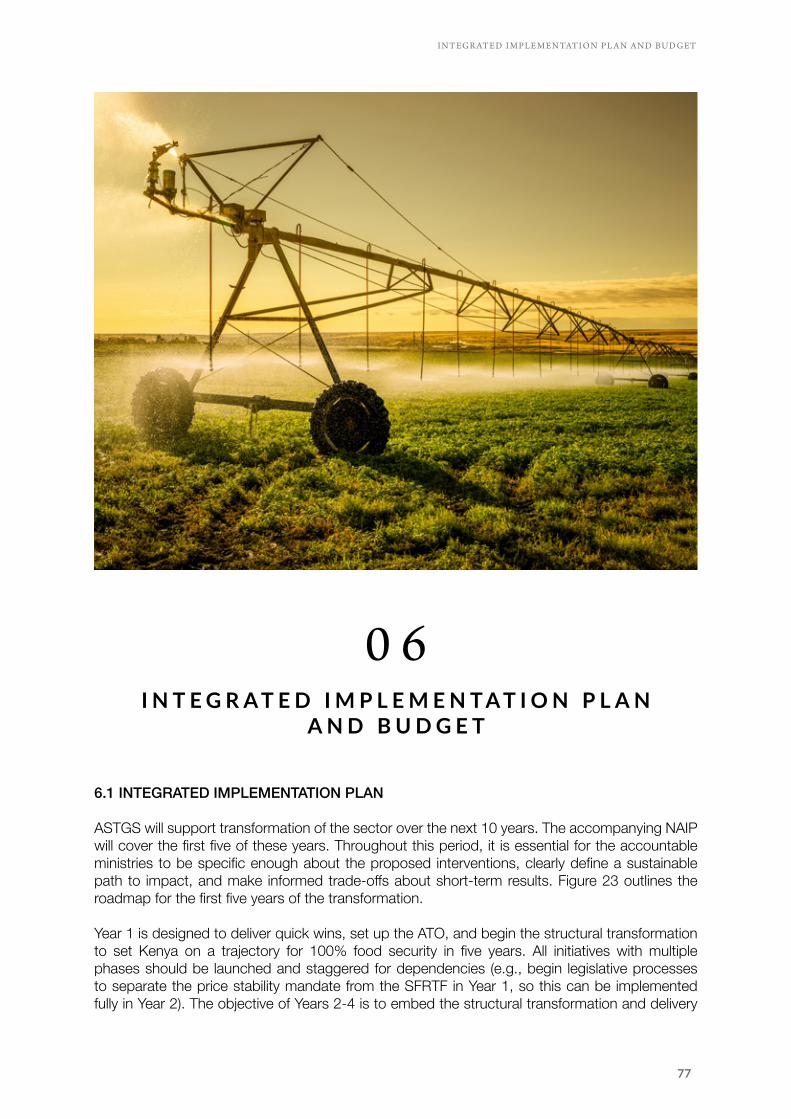
77
I N T EG R AT E D I M P L E M E N TAT I O N P L A N A N D B U D G ET
6.1 INTEGRATED IMPLEMENTATION PLAN
ASTGS will support transformation of the sector over the next 10 years. The accompanying NAIP will cover the first five of these years. Throughout this period, it is essential for the accountable ministries to be specific enough about the proposed interventions, clearly define a sustainable path to impact, and make informed trade-offs about short-term results. Figure 23 outlines the roadmap for the first five years of the transformation.
Year 1 is designed to deliver quick wins, set up the ATO, and begin the structural transformation to set Kenya on a trajectory for 100% food security in five years. All initiatives with multiple phases should be launched and staggered for dependencies (e.g., begin legislative processes to separate the price stability mandate from the SFRTF in Year 1, so this can be implemented fully in Year 2). The objective of Years 2-4 is to embed the structural transformation and delivery
0 6I N T E G R A T E D I M P L E M E N T A T I O N P L A N
A N D B U D G E T
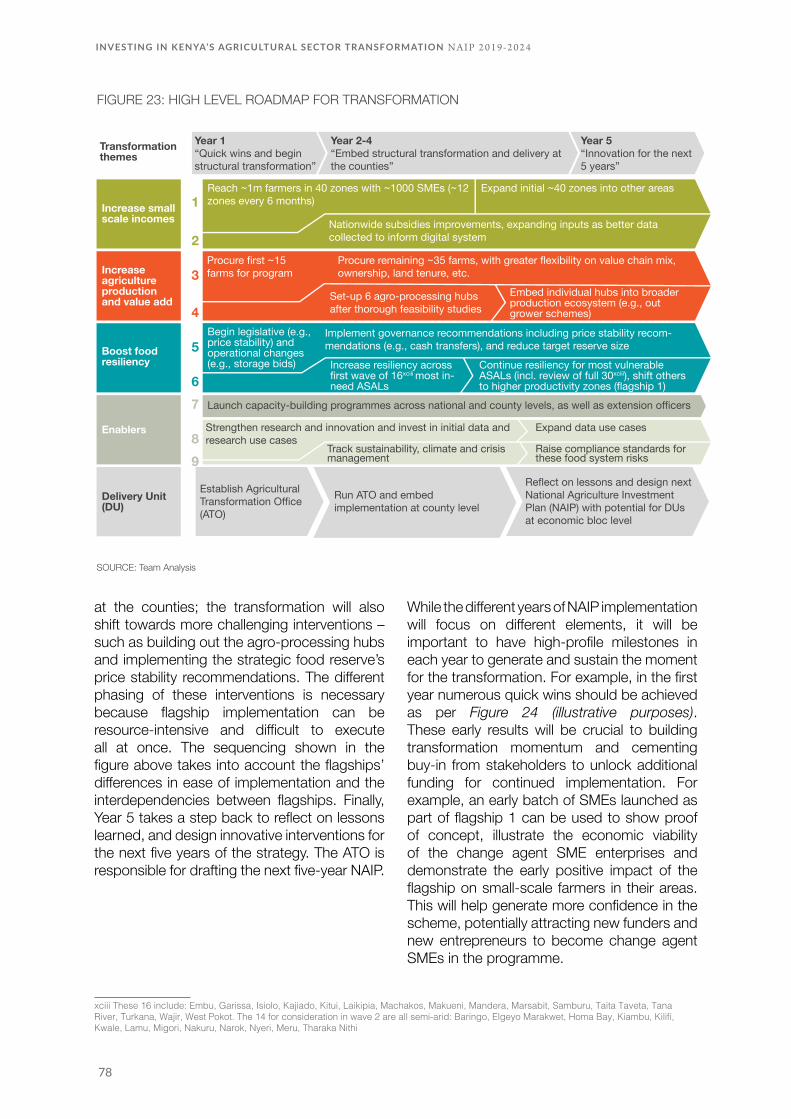
78
INVESTING IN KENYA’S AGRICULTURAL SECTOR TRANSFORMATION N A I P 2 0 1 9 - 2 0 2 4
xciii
at the counties; the transformation will also shift towards more challenging interventions – such as building out the agro-processing hubs and implementing the strategic food reserve’s price stability recommendations. The different phasing of these interventions is necessary because flagship implementation can be resource-intensive and difficult to execute all at once. The sequencing shown in the figure above takes into account the flagships’ differences in ease of implementation and the interdependencies between flagships. Finally, Year 5 takes a step back to reflect on lessons learned, and design innovative interventions for the next five years of the strategy. The ATO is responsible for drafting the next five-year NAIP.
xciii These 16 include: Embu, Garissa, Isiolo, Kajiado, Kitui, Laikipia, Machakos, Makueni, Mandera, Marsabit, Samburu, Taita Taveta, Tana River, Turkana, Wajir, West Pokot. The 14 for consideration in wave 2 are all semi-arid: Baringo, Elgeyo Marakwet, Homa Bay, Kiambu, Kilifi, Kwale, Lamu, Migori, Nakuru, Narok, Nyeri, Meru, Tharaka Nithi
While the different years of NAIP implementation will focus on different elements, it will be important to have high-profile milestones in each year to generate and sustain the moment for the transformation. For example, in the first year numerous quick wins should be achieved as per Figure 24 (illustrative purposes). These early results will be crucial to building transformation momentum and cementing buy-in from stakeholders to unlock additional funding for continued implementation. For example, an early batch of SMEs launched as part of flagship 1 can be used to show proof of concept, illustrate the economic viability of the change agent SME enterprises and demonstrate the early positive impact of the flagship on small-scale farmers in their areas. This will help generate more confidence in the scheme, potentially attracting new funders and new entrepreneurs to become change agent SMEs in the programme.
Year 1“Quick wins and begin structural transformation”
Year 2-4“Embed structural transformation and delivery at the counties”
Year 5“Innovation for the next 5 years”
Transformation themes
Increase small scale incomes
Increase agriculture production and value add
Boost food resiliency
Enablers
Delivery Unit (DU)
Reach ~1m farmers in 40 zones with ~1000 SMEs (~12 zones every 6 months)
Expand initial ~40 zones into other areas
Nationwide subsidies improvements, expanding inputs as better data collected to inform digital system
Procure first ~15 farms for program
Set-up 6 agro-processing hubs after thorough feasibility studies
Embed individual hubs into broader production ecosystem (e.g., out grower schemes)
Procure remaining ~35 farms, with greater flexibility on value chain mix, ownership, land tenure, etc.
Begin legislative (e.g., price stability) and operational changes (e.g., storage bids) Increase resiliency across
first wave of 16xciii most in- need ASALs
Continue resiliency for most vulnerable ASALs (incl. review of full 30xciii), shift others to higher productivity zones (flagship 1)
Implement governance recommendations including price stability recom-mendations (e.g., cash transfers), and reduce target reserve size
Strengthen research and innovation and invest in initial data and research use cases
Track sustainability, climate and crisis management
Launch capacity-building programmes across national and county levels, as well as extension officers
Expand data use cases
Raise compliance standards for these food system risks
Establish Agricultural Transformation Office (ATO)
Run ATO and embed implementation at county level
Reflect on lessons and design next National Agriculture Investment Plan (NAIP) with potential for DUs at economic bloc level
1
2
3
4
5
67
89
FIGURE 23: HIGH LEVEL ROADMAP FOR TRANSFORMATION
SOURCE: Team Analysis

79
I N T EG R AT E D I M P L E M E N TAT I O N P L A N A N D B U D G ET
YEAR 1TRANSFORMATION MILESTONES2019MARCH
Launch open data policy for the agricultural sector, and pilot first data use case on small-scale farmer production forecasts
8FLAGSHIP
APRIL
Start first fully funded agro-processing hub feasibility study and launch roadshow with global and local investors
4FLAGSHIPJUNE
Target ~180,000 farmers, pastoralists and fisherfolk as well as ~150 farmer-facing SMEs with launch of first wave of high productivity zones. Zones will be operated by business accelerators who will be jointly selected with the Counties
1FLAGSHIPJUNE
Register the 1,000,000th farmer from joint registration effort between Ministry of Agriculture, the Counties, and private sector partners. Begin pilot for new digital e-voucher subsidy scheme
5FLAGSHIP
AUGUSTProcure first batch of ~70,000 tonnes of beans to better focus Strategic Food Reserve (SFR) stocks on ~4 million most in-need Kenyans
OCTOBER
Host development partner summit focused on transformation and coordination of ASAL household food resilience efforts. Development partners to demonstrate results from their work to date
6FLAGSHIP
NOVEMBER
First harvest of maize and other crops from one of the proposed 50 new farms under irrigation. Showcase real-time data on water use on this farm, and how it is supporting sustainable water use through the national digital water basin management system
4FLAGSHIP
DECEMBER
2FLAGSHIP
Launch new nationwide e-voucher subsidy programme to target ~1.4 million small-scale farmers, pastoralists and fisherfolk over five years. New programme gives farmers choice of a range of inputs from a variety of private and public providers
SOURCE: Team Analysis
FIGURE 24: YEAR ONE TRANSFORMATION MILESTONES
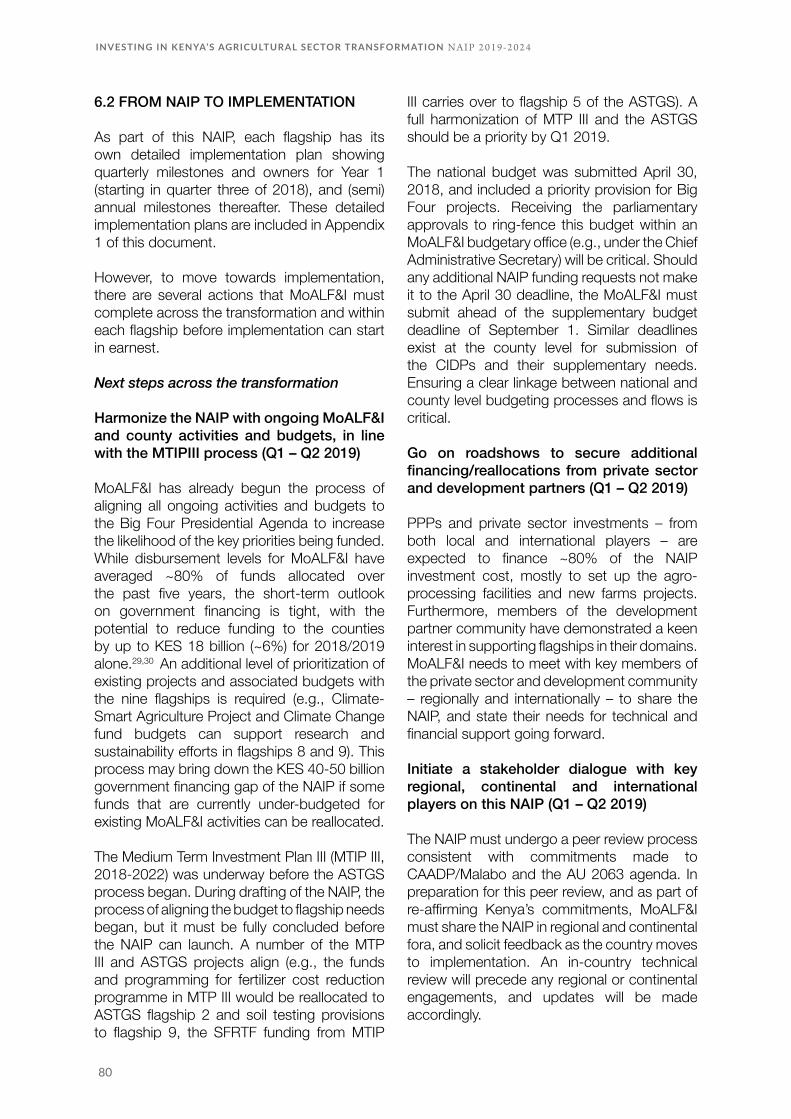
80
INVESTING IN KENYA’S AGRICULTURAL SECTOR TRANSFORMATION N A I P 2 0 1 9 - 2 0 2 4
6.2 FROM NAIP TO IMPLEMENTATION
As part of this NAIP, each flagship has its own detailed implementation plan showing quarterly milestones and owners for Year 1 (starting in quarter three of 2018), and (semi) annual milestones thereafter. These detailed implementation plans are included in Appendix 1 of this document.
However, to move towards implementation, there are several actions that MoALF&I must complete across the transformation and within each flagship before implementation can start in earnest.
Next steps across the transformation
Harmonize the NAIP with ongoing MoALF&I and county activities and budgets, in line with the MTIPIII process (Q1 – Q2 2019)
MoALF&I has already begun the process of aligning all ongoing activities and budgets to the Big Four Presidential Agenda to increase the likelihood of the key priorities being funded. While disbursement levels for MoALF&I have averaged ~80% of funds allocated over the past five years, the short-term outlook on government financing is tight, with the potential to reduce funding to the counties by up to KES 18 billion (~6%) for 2018/2019 alone.29,30 An additional level of prioritization of existing projects and associated budgets with the nine flagships is required (e.g., Climate-Smart Agriculture Project and Climate Change fund budgets can support research and sustainability efforts in flagships 8 and 9). This process may bring down the KES 40-50 billion government financing gap of the NAIP if some funds that are currently under-budgeted for existing MoALF&I activities can be reallocated.
The Medium Term Investment Plan III (MTIP III, 2018-2022) was underway before the ASTGS process began. During drafting of the NAIP, the process of aligning the budget to flagship needs began, but it must be fully concluded before the NAIP can launch. A number of the MTP III and ASTGS projects align (e.g., the funds and programming for fertilizer cost reduction programme in MTP III would be reallocated to ASTGS flagship 2 and soil testing provisions to flagship 9, the SFRTF funding from MTIP
III carries over to flagship 5 of the ASTGS). A full harmonization of MTP III and the ASTGS should be a priority by Q1 2019.
The national budget was submitted April 30, 2018, and included a priority provision for Big Four projects. Receiving the parliamentary approvals to ring-fence this budget within an MoALF&I budgetary office (e.g., under the Chief Administrative Secretary) will be critical. Should any additional NAIP funding requests not make it to the April 30 deadline, the MoALF&I must submit ahead of the supplementary budget deadline of September 1. Similar deadlines exist at the county level for submission of the CIDPs and their supplementary needs. Ensuring a clear linkage between national and county level budgeting processes and flows is critical.
Go on roadshows to secure additional financing/reallocations from private sector and development partners (Q1 – Q2 2019)
PPPs and private sector investments – from both local and international players – are expected to finance ~80% of the NAIP investment cost, mostly to set up the agro-processing facilities and new farms projects. Furthermore, members of the development partner community have demonstrated a keen interest in supporting flagships in their domains. MoALF&I needs to meet with key members of the private sector and development community – regionally and internationally – to share the NAIP, and state their needs for technical and financial support going forward.
Initiate a stakeholder dialogue with key regional, continental and international players on this NAIP (Q1 – Q2 2019)
The NAIP must undergo a peer review process consistent with commitments made to CAADP/Malabo and the AU 2063 agenda. In preparation for this peer review, and as part of re-affirming Kenya’s commitments, MoALF&I must share the NAIP in regional and continental fora, and solicit feedback as the country moves to implementation. An in-country technical review will precede any regional or continental engagements, and updates will be made accordingly.

81
I N T EG R AT E D I M P L E M E N TAT I O N P L A N A N D B U D G ET
Embed the ASTGS in the County Integrated Development Plan (CIDP) and Agriculture Sector Development Plans (ASDP) processes (Q2 – Q4 2019)
The CIDP process at the counties is well underway for 2018/2019, and many counties have used interactions with MoALF&I on the ASTGS to inform their CIDPs. However, the much longer and more structural process of drafting the 10-year county ASDPs should begin as soon as possible. MoALF&I working together with JASCCM should engage in another round of county conversations to refine the flagship workplans for the counties. This process will be an opportunity to put the County Toolkit developed as part of the ASTGS (Chapter 6) into practice. MoALF&I should also carry out an evaluation of the counties’ M&E systems and capacity to effectively implement the ASTGS. JASCCM will be an invaluable partner to the counties and national government in this process, and can work with the ATO, once it has been set up, to provide additional technical support.
Flagship-specific next steps (Q1 – Q2 2019)
Each flagship’s design elements and implementation plans need to be further detailed into bankable plans with monthly milestones, operational KPIs and day-to-day owners identified at the ground level. These operation-level milestones and KPIs will cascade through to the CECs of Agriculture at the county level, to the championing Director-level counterpart at the MoALF&I, and eventually the ASTGS Steering Council chaired by H.E. or the D.P. Developing these bankable plans will require additional engagements with the counties, private sector, development partners and other non-state actors. These activities must get underway as the ATO is being recruited and include the following, which are to be led by MoALF&I unless stated otherwise:
Anchor 1 – increase small-scale farmer incomesFlagship 1: ~1 million farmers benefiting from ~1,000 SMEs■ By Q1 2019: Shortlist existing government projects (e.g., Enable Youth) for the capacity
and capability to take on the project procurement role■ By Q1 2019: Develop RFP for the first lot of SMEs
Flagship 2: Shift focus of subsidies programme via e-voucher■ By Q1 2019: Detail plan to reallocate existing ~KES 5 billion in subsidies funding to the new programme (e.g., provisions for current recipients) ■ By Q1 2019: Collate all information on current national and county farmer registration systems, e-voucher systems, policies and mandates and align them to the flagship■ By Q2 2019: Begin migration to new system in counties that are most ready, with a roll-out plan for the next 12 months to on-board all counties and coincide with farmer registration efforts
Anchor 2 – increase agricultural output and value additionFlagship 3: Set up 5 agro-processing flagships via rapid PPP process ■ By Q1 2019: Align with Ministry of Industrialization and other key parties on the leadership of the APDT, preferably on a full-time basis. Other logistics to be agreed include location and office space■ By Q1 2019: Have a long list of private sector service providers for different types of services required (e.g., architects, bid evaluators, construction contractors). Begin to vet them in roadshow conversations
Flagship 4: Unlock ~50 new farms with ~60,000 ha under irrigation ■ By Q1 2019: Obtain firm commitments from Phase One (~60,000 ha) landowners, and begin to seek investors for the land. Draft the standard form lease agreements, and align on target rental periods and mixed cropping plans■ By Q1 2019: Begin independent soil studies for Phase One locations, complete the data rooms, and schedule site visits ■ By Q1 2019: Ongoing site visits as work with National Treasury to secure Government

82
INVESTING IN KENYA’S AGRICULTURAL SECTOR TRANSFORMATION N A I P 2 0 1 9 - 2 0 2 4
Letters of Support (or Sovereign Guarantees) to back-stop some of the land risks. Goal should be to standardise this letter for flagship 4, using precedent set in other sectors (e.g., power, roads)■ Ongoing: Secure investors and begin preparation for production to catch long rains■ Ongoing: Start cataloguing process of land for subsequent bid windows including private land ownership that can qualify for this flagship (>100 ha) Anchor 3 – increase household food resilience
Flagship 5: Restructure the Strategic Food Reserve (SFR)■ By Q1 2019: SFRTF to align with key stakeholders (both government and private players) on the buy/sell guidelines, terms of engagement with private sector storage players, and emergency triggers for food■ By Q2 2019: SFRTF to detail process to actively store and manage an additional ~70,000-85,000 tonnes of legumes/pulses to the food reserve by early January 2019 including:– Estimating local availability of beans in the next harvest season, and determining whether there will be a need to import– Defining the size, phasing, and rotation of batches as they build up beans in the reserve alongside existing maize– Allocating NCPB warehouse space to store the first batch of beans■ By Q2 2019: Draft policy required to transition price stability mandate to the Ministry of Finance, with the aim of tabling it before the December recess. To prepare this draft for syndication, SFRTF and MoALF&I must meet with the Ministry of Finance to align on:– The terms of the mandate separation, and the data the Ministry of Finance will need from MoALF&I to support its price stabilization models– The process to fast-track supplementary budget requests to provide cash transfers during times of emergency■ By Q2 2019: SFRTF/NCPB feasibility study on facilities that are appropriate (or need major modifications) to have the real-time monitoring
system. Scope out the specifications for central monitoring (e.g., technical support, maintenance, app creation). ATO should be in place by October to assist and ensure interoperability with overall transformation trackers
Flagship 6: Boost ASAL household food resilience ■ By Q1 2019: Select the counties for Phase 1■ By Q1 2019: Determine KPIs and baselines for impact of ongoing and future interventions, based on a clear understanding of all development partner activities in the pilot counties, and results for investment to date■ By Q2 2019: Work with communities in pilot counties to begin community profiles (including demographics and economic practices, migration routes). Profiling should take 4-6 weeks■ By Q2 2019: Agree on the process to select the opinion leaders, women and youth representatives and other stakeholders (e.g., model farmers) who will be part of designing the menu of interventions. Begin designing menus.
EnablersFlagship 7: Launch knowledge and skills-building programmes■ By Q2 2019: Select partner organizations for the following actions, so they can be actively involved in the process of detailing the flagships. They should have an intimate understanding of what the flagship demands of the groups of people they will be training:– design and deliver knowledge- and skill-building curricula for transformation leaders and implementers– assemble international peer network– conduct organizational effectiveness diagnostic for MoALF&I. Important to gather a baseline understanding of the organizational effectiveness early on in the transformation
Flagship 8: Strengthen research and innovation as data use cases are launched■ By Q1 2019: Catalogue and categorize existing research from KALRO, KEMFRI,

83
I N T EG R AT E D I M P L E M E N TAT I O N P L A N A N D B U D G ET
Tegemeo and other government research agencies, as well as those available from open data sources like GODAN. Start data gaps diagnostic to conclude by September 2018, using the significant amount of data gathered during ASTGS and NAIP process as a starting point■ By Q2 2019: Work with the Legislative Intergovernmental Liaison Office (LiLO) in the office of the Deputy President to draft the Open Data Policy for the sector; hire the data scientists, data engineers, data analysts and geospatial analysts required to manage the use cases■ By Q2 2019: Conclude data diagnostic for use cases, then detail all outstanding data needs. Map the process and tools to gather required data into useable dashboards for the SFRTF, ATO and MoALF&I■ By Q1 2019: Begin dashboard development. Aim to track first full quarter of transformation performance in these tools for Q2 2019Flagship 9: Start building the people, tools and data to embed sustainability practices■ By Q1 2019: Finalize sustainability checklist (ASTGS Figure 49) for use as a tool immediately in “Greening” MoALF&I policies, and to support the Climate-Smart Initiative roll-out■ By Q1 2019: Complete a stakeholder map for the key priorities in the flagship. Identify a champion for each of the activities that need mutual accountability, and design KPIs around them ■ By Q1 2019: Refine the mandate of the crisis management team vis-à-vis the rest of the national disaster management teams. Also, map out data available from early warning systems and other sources to stay one step ahead of emerging crises. Automate/set alerts for key areas the team is watchingDelivery mechanism: Set up the ATO■ By Q1 2019: Create detailed job descriptions (see ASTGS appendix for samples), operation manual and defined KPIs for all ATO members. Hire a professional recruitment firm to support search■ By Q1 2019: Begin recruiting ATO, starting with the Director who will be instrumental in picking his/her team, and can make decisions
and begin to build relationships quickly in the interim before the full team is on the ground ■ By Q1 2019: Physically set up the ATO location
6.3 LINKAGES AND INTERDEPENDENCIES
The transformation flagships are a portfolio of interventions and should not be considered in isolation. Multiple linkages and interdependencies exist across these flagships, so it is important to sequence and coordinate implementation to achieve the desired impact. Given the portfolio nature of this programme, if impact is accelerated or delayed in one flagship there would be a knock-on effect in other flagships – for example, if farmer registration is delayed through the extension flagship, launch of the subsidies programme would also be delayed.
These linkages and interdependencies fall in one of the following three categories: geographic or value chain overlaps, strong links to the enablers, and links to ongoing or planned projects in other Ministries (and therefore to the agriculture-supportive parts of the NAIP budget). Primary examples are outlined below, but these lists are not exhaustive, and more should be identified during implementation. Where coordination is lagging, the ATO has a role to play in connecting the dots; however, it should not be a bottleneck to implementers directly engaging with each other (e.g., the farmers in anchor 1 with the processors in anchor 2).
Interventions with geographic or value chain overlaps ■ Flagship 1 – SMEs:– Agro-dealers in this flagship should register with the subsidy programme (flagship 2) to provide inputs for farmers to purchase with the e-voucher. The SME accelerators should ensure that the SMEs they train fully understand the subsidy registration requirements and procedures to sign up as a provider– SME accelerators should link farmer associations and other aggregators to agro-processing hubs (flagship 3) in nearby zones. The SME accelerators should therefore

84
INVESTING IN KENYA’S AGRICULTURAL SECTOR TRANSFORMATION N A I P 2 0 1 9 - 2 0 2 4
support these associations to run projections of production, and manage the quality to meet off-take needs of the agro-processors – SME accelerators can provide coordination assistance in the ASALs (flagship 6) to help design the menus of interventions that can be served by the SMEs. SME accelerators working with the ATO and JASSCOM should liaise with the agriculture coordinators in the economic blocs who are responsible for consolidating the community menu of interventions
■ Flagship 3 – Agro-processing hubs: Hubs will use some production inputs from the new farms (flagship 4). Both flagships will benefit from coordination on value chains produced and the public infrastructure provided by government (e.g., roads, power). The APDT should help processors with supply chain development to ensure that reliable inputs are negotiated and maintained, including from the new farms ■ Flagship 4 – New farms: These~50 large-scale farms will need to dedicate a certain proportion of their land to grow government-mandated staples, partly to provide stocks for the SFR. The private farms will need to register to participate in the bidding (window two onwards) to sell grain to the SFR for their off-take (flagship 5)
Interventions relying on enablersBy design, each of the enabler flagships is linked to anchor flagships. The list below highlights the linkages that will be likely to require the most coordination:■ Flagship 7 – Knowledge and skills building (incl. extension): – Flagship 2: The national subsidy programme requires registration and pre-qualification, with instructions provided by the extension television and radio programmes. Smooth connectivity between extension and subsidies is therefore critical (e.g., so farmers receive subsidies and can purchase inputs in time for the planting season)– Various: SMEs (flagship 1), subsidies (flagship 2), and producer price stabilization (flagship 5) will all require registration, which
is the purview of the extension officers in this flagship. For efficiency and to prevent issues of duplicate data in the future, registration efforts should gather all the data required across these flagships at point of registration
■ Flagship 8 – Research, innovation and data: – Flagship 1 (SMEs): The performance of SMEs will be tracked on an ongoing basis by accelerators to drive decision making about SME expansion and growth, access to financial products and eligibility for continued support. Performance metrics may include volumes sold (including inventory management) and percentage change in turnover (including accounting), for example. The accelerators will require an IT platform and various IT tools to collect and manage this data (flagship 8)Further, SMEs interested in selling new seed strains and veterinary products will need to encourage farmers to get their soil tested (see flagship 9); they will also require access the research and genetics work made publicly available from flagship 8 to inform their stock choices– Flagship 5 (SFR): The new SFR barcode-based reserve tracking system will compile real-time information on reserve levels across multiple government and private sector facilities into a single data platform. The ATO should support the SFRTF to ensure that the platform is in place before the barcode system is rolled out■ Flagship 9 – Actively monitor food system risks (incl. water basin management)– Flagship 1 (SMEs) and flagship 2 (subsidies): The water needs of large farms must be balanced with those of small-scale farms. Furthermore, there is a need to coordinate water transfer from source to farm gate. The SME accelerators should therefore aim to assist some SMEs that supply irrigation equipment. The irrigation equipment eligible for subsidy should also include sustainability-focused options (e.g., drip irrigation kits, rainwater harvesting systems). SME accelerators are responsible for ensuring compliance of the equipment manufacturers kits with the digital water monitoring systems that will help ensure sustainable extraction of water

85
I N T EG R AT E D I M P L E M E N TAT I O N P L A N A N D B U D G ET
– Flagship 4 (new farms): These farms need to be sustainably rehabilitated, farmed, and irrigated up to ~150,000 acres. To enhance and preserve soil quality, sustainable farming methods should be adopted and monitored. To manage water supply risks, new farms must minimize reliance on new dams. Any proposed new dams (as opposed to restorations or dual-purposing dams) will need to be checked by the sustainability team within the ATO for feasibility and impact ■ Delivery mechanism: The food resilience unit in the ATO will need to have a running list of all interventions in the ASALs and county government priorities. This central repository/database needs to be set up before the creation of community-driven interventions so that information is not siloed within different counties during the process of designing menus. This information should be updated as frequently as needed.
Interventions linked to the large ongoing programmes or projects outside the NAIP■ Flagship 4 – new farms: – Land: A significant portion of this land is owned by the regional development authorities, including the Kenya Valley Development Authority (KVDA) and Tana and Athi River Development (TARDA). Rental of this medium- to high-potential agricultural areas is critical, versus land being provided to other uses– Basic infrastructure: Roads, grid expansion and rehabilitation or dual-purposing of existing dams will be required to support the new farms in areas like Turkana, Taita Taveta and West Pokot. This transformation should leverage existing efforts by Kenya’s Roads Programme on road access, Kenya Power and the Kenya Electricity Transmission Company’s (KETRACO) programme on reliable grid infrastructure, and dam projects by the National Irrigation Board (NIB)
■ Flagship 8 – research and data: The flagship will involve integration with several open data platforms, internal research websites and portals for data hosting collection (e.g., the Kenya Open Data Initiative – KODI, Global Open Data for Agriculture and Nutrition – GODAN, and the Kenya Agricultural Information Network – KAINet). Collaboration with LiLO to quickly
launch the agricultural sector open data policy will smooth the process of data sharing across these different platforms.
6.4 IMPLEMENTATION BUDGET AND FUNDING SOURCES
The NAIP is expected to cost KES 400-440 billion in investment over the first five years. This consists of KES 200-230 billion in agriculture-specific costs, i.e., costs borne by MoALF&I and private sector implementers involved in the ASTGS flagships, and KES ~210 billion in agriculture-supportive costs, i.e., costs such as those for roads and power infrastructure that are borne by other ministries, but that nevertheless are required to support implementation of the flagships (Figure 25).
Figure 26 shows the split of agriculture-specific costs by year and by flagship. Over the five years of the NAIP, the flagship with the highest cost is flagship 3 (agro-processing hubs), which is expected to account for 40-45% of agriculture-specific costs; most of this cost is attributable to the factory capex that will be financed by the private sector. The flagship with the second highest cost is flagship 4 (new private farms), taking up 35-40% of agriculture-specific costs. The KES 200-230 billion total agriculture-specific costs assume that existing subsidies cost of KES 5 billion per year and existing extension worker wages of KES ~3 billion per year are already part of the current government budget. If these fail to be included in future budgets, then the cost of the NAIP will have to rise by an additional KES ~8 billion per year, totalling 40 billion over five years.
Of the KES 200-230 billion agriculture-specific cost, ~80% (KES 165-180 billion) is expected to be financed by the private sector (Figure 27). This private sector financing is almost entirely in flagships 3 and 4, in the form of financing for the new agro-processing hubs (KES 80-100 billion) and the new private farms (KES ~80 billion). This leaves KES 35-45 billion to be financed by the public sector, averaging KES 8-10 billion per year. Compared with historical and expected future development budget disbursements for MoALF&I, this KES 8-10 billion is equivalent to 30-40% of the Ministry’s expected annual development budget disbursement (see Figure 28).31
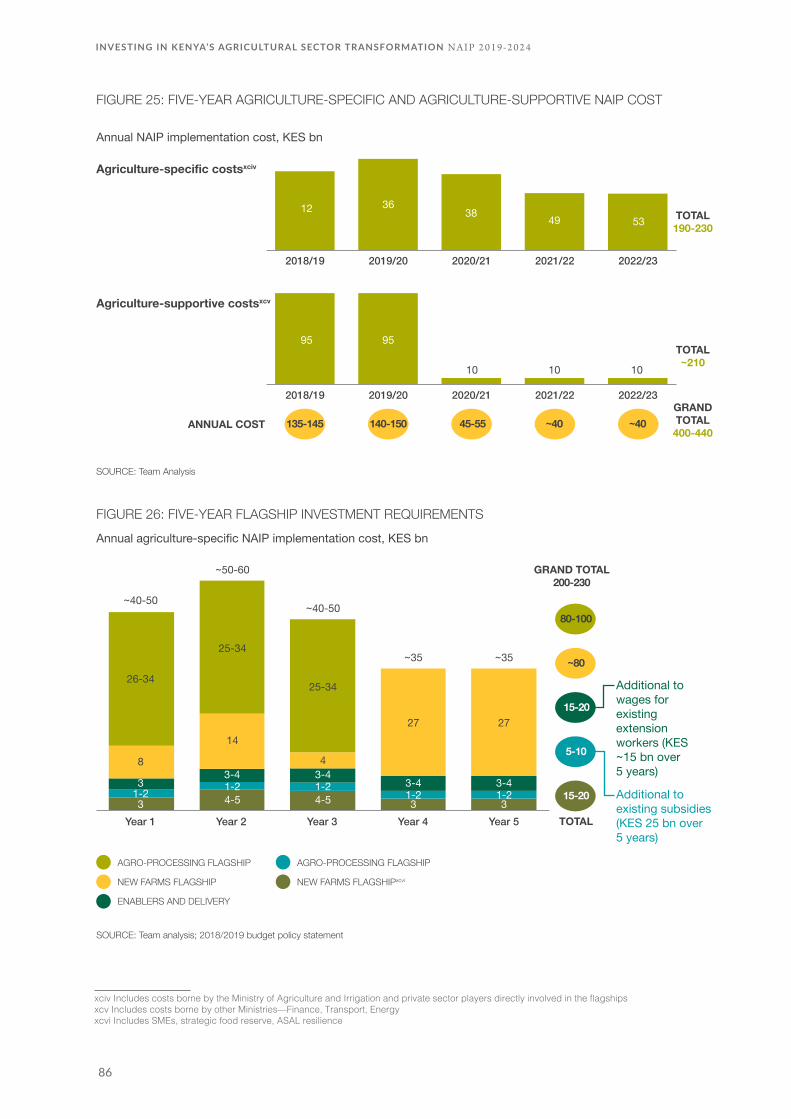
86
INVESTING IN KENYA’S AGRICULTURAL SECTOR TRANSFORMATION N A I P 2 0 1 9 - 2 0 2 4
xciv xcv xcvi
xciv Includes costs borne by the Ministry of Agriculture and Irrigation and private sector players directly involved in the flagshipsxcv Includes costs borne by other Ministries—Finance, Transport, Energyxcvi Includes SMEs, strategic food reserve, ASAL resilience
Annual NAIP implementation cost, KES bn
TOTAL190-230
2018/19 2022/232019/20 2020/21 2021/22
1249
3653
38
Agriculture-specific costsxciv
Agriculture-supportive costsxcv
TOTAL~21010
2018/19 2022/232019/20 2020/21 2021/22
95 95
1010
ANNUAL COST 135-145 140-150 45-55 ~40 ~40GRANDTOTAL
400-440
FIGURE 25: FIVE-YEAR AGRICULTURE-SPECIFIC AND AGRICULTURE-SUPPORTIVE NAIP COST
SOURCE: Team Analysis
Annual agriculture-specific NAIP implementation cost, KES bn
Additional toexisting subsidies(KES 25 bn over5 years)
Additional to wages for existing extension workers (KES ~15 bn over 5 years)
~40-50
~50-60
~40-50
~35 ~35
8
26-34
14
25-34
4
25-34
27 27
31-23
3-41-24-5
3-41-24-5
3-41-23
3-41-23
Year 1 Year 5Year 2 Year 3 Year 4 TOTAL
GRAND TOTAL200-230
80-100
15-20
~80
15-20
5-10
FIGURE 26: FIVE-YEAR FLAGSHIP INVESTMENT REQUIREMENTS
AGRO-PROCESSING FLAGSHIP
NEW FARMS FLAGSHIP
ENABLERS AND DELIVERY
AGRO-PROCESSING FLAGSHIP
NEW FARMS FLAGSHIPxcvi
SOURCE: Team analysis; 2018/2019 budget policy statement

87
I N T EG R AT E D I M P L E M E N TAT I O N P L A N A N D B U D G ET
xcvii xcviii xcix
xcvii Includes financing for most capex requirements including new farm rehabilitation, agro-processing feasibility studies and constructionxcviii Excludes already budgeted annual subsidies of KES 5 bn, extension workers cost of KES 2.6 bnxcix Based on 2017/18-2019/20 ARUD Sector Report expenditure analysis; includes Programme 1 (General Administration, Planning and Support services for Agriculture), Programme 2 (Crop Development and Management), Programme 3 (Agribusiness and Information Management), Programme 4 (Irrigation and Drainage Infrastructure), Programme 5 (Fisheries Development and Management) and Programme 6 (Livestock Resources Management and Development)
Transformation costs over five years, require up to KES 35-45 bn in government funds with support from development partners (~an annual increase of 30-40% in MOALF&I development budget)
With the right approach, up to 80% of transformation costs can be funded through PPPs,with the remaining 20% by government
KES bn
~80
80-100
200-230
10-155-1015-20
Total Cost Total Cost Private sectorxcvii Public sector
200-230
165-185
35-45
High functioning PPPs are critical to supporttransformation with commercial loans
KES 35-45 bn in govt funding is ~30-40% of annual MoALF&I development budgetxcviii.
FIGURE 27: FINANCING COSTS FOR FIVE-YEAR NAIP
AGRO-PROCESSING FLAGSHIP
NEW FARMS FLAGSHIP
ENABLERS AND DELIVERY
AGRO-PROCESSING FLAGSHIP
NEW FARMS FLAGSHIP
SOURCE: GoK, 2018/19 Budget Policy Statement; Deloitte Kenya Economic Outlook 2017; USAID
MoALF&I historical and expected future disbursed development budgetAgriculture and irrigation disbursed development budget, KES bn
HISTORICALxcix
2014/15 2015/162013/14 2018/19 2019/20 2020/21
ESTIMATED FUTURE
27 26
2122 23
25
Estimated annual NAIP cost to MoALF&I:KES 8-10 bn(30-40% of expected disbursement)
FIGURE 28: HISTORICAL AND EXPECTED FUTURE DISBURSEMENTS FOR MOALF&I
SOURCE: Agriculture, Rural and Urban Development Sector Report for MTEP 2017/18-2019/20; Budget Policy Statement 2018/19
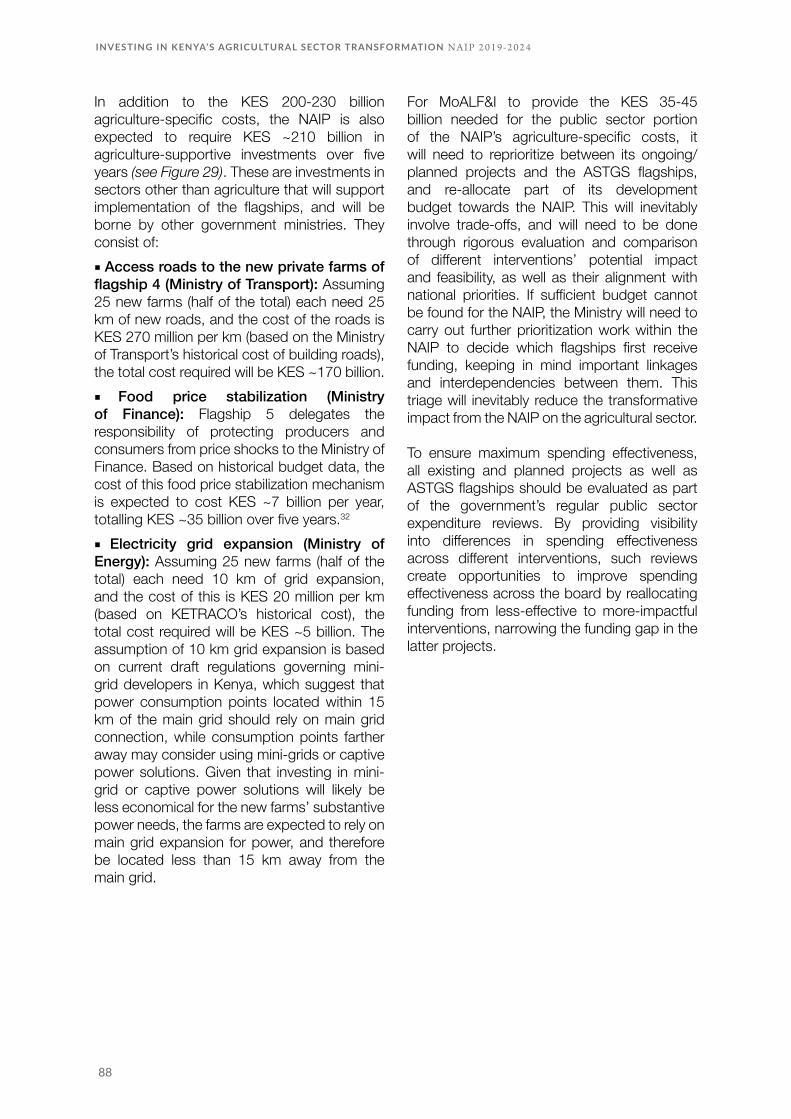
88
INVESTING IN KENYA’S AGRICULTURAL SECTOR TRANSFORMATION N A I P 2 0 1 9 - 2 0 2 4
In addition to the KES 200-230 billion agriculture-specific costs, the NAIP is also expected to require KES ~210 billion in agriculture-supportive investments over five years (see Figure 29). These are investments in sectors other than agriculture that will support implementation of the flagships, and will be borne by other government ministries. They consist of:■ Access roads to the new private farms of flagship 4 (Ministry of Transport): Assuming 25 new farms (half of the total) each need 25 km of new roads, and the cost of the roads is KES 270 million per km (based on the Ministry of Transport’s historical cost of building roads), the total cost required will be KES ~170 billion.■ Food price stabilization (Ministry of Finance): Flagship 5 delegates the responsibility of protecting producers and consumers from price shocks to the Ministry of Finance. Based on historical budget data, the cost of this food price stabilization mechanism is expected to cost KES ~7 billion per year, totalling KES ~35 billion over five years.32
■ Electricity grid expansion (Ministry of Energy): Assuming 25 new farms (half of the total) each need 10 km of grid expansion, and the cost of this is KES 20 million per km (based on KETRACO’s historical cost), the total cost required will be KES ~5 billion. The assumption of 10 km grid expansion is based on current draft regulations governing mini-grid developers in Kenya, which suggest that power consumption points located within 15 km of the main grid should rely on main grid connection, while consumption points farther away may consider using mini-grids or captive power solutions. Given that investing in mini-grid or captive power solutions will likely be less economical for the new farms’ substantive power needs, the farms are expected to rely on main grid expansion for power, and therefore be located less than 15 km away from the main grid.
For MoALF&I to provide the KES 35-45 billion needed for the public sector portion of the NAIP’s agriculture-specific costs, it will need to reprioritize between its ongoing/planned projects and the ASTGS flagships, and re-allocate part of its development budget towards the NAIP. This will inevitably involve trade-offs, and will need to be done through rigorous evaluation and comparison of different interventions’ potential impact and feasibility, as well as their alignment with national priorities. If sufficient budget cannot be found for the NAIP, the Ministry will need to carry out further prioritization work within the NAIP to decide which flagships first receive funding, keeping in mind important linkages and interdependencies between them. This triage will inevitably reduce the transformative impact from the NAIP on the agricultural sector.
To ensure maximum spending effectiveness, all existing and planned projects as well as ASTGS flagships should be evaluated as part of the government’s regular public sector expenditure reviews. By providing visibility into differences in spending effectiveness across different interventions, such reviews create opportunities to improve spending effectiveness across the board by reallocating funding from less-effective to more-impactful interventions, narrowing the funding gap in the latter projects.

89
I N T EG R AT E D I M P L E M E N TAT I O N P L A N A N D B U D G ET
Transformation investment requirements (agriculture-supportive costs)
Annual agriculture-supportive NAIP implementation cost, KES bn
ROADS (MINISTRY OF TRANSPORT)
FOOD PRICE STABILIZATION (MINISTRY OF FINANCE)
POWER GRID EXPANSION (MINISTRY OF ENERGY)
~94 ~94
~7 ~7 ~77
84
7
84
7 7 73 3Year 1 Year 5Year 2 Year 3 Year 4 TOTAL
GRAND TOTAL~210
~170
~35
~5
FIGURE 29: FIVE-YEAR AGRICULTURE-SUPPORTIVE NAIP COSTS
SOURCE: Team analysis


91
I M P L E M E N T I N G R I SK S A N D M I T I G AT I N G M E A SU R E S
Successful implementation of the NAIP faces several key risks, detailed below along with mitigating measures that are incorporated into implementation plans (Appendix 1). Financing, political, market and execution risks detailed below are in addition to overarching climatic risks which commonly affect the sector. The latter is addressed extensively in flagship 9.
7.1 FINANCING RISK
Complete implementation of the NAIP is dependent on continued funding of the flagships over its five-year timeline. However, as ~20% of the funding is expected to come from government and development partners, and ~80% from PPPs with the private sector, there is a risk that NAIP funding may be reduced or withdrawn before implementation is complete, threatening attainment of the NAIP targets. The implementation plan includes measures to mitigate these funding risks, as detailed below.
0 7I M P L E M E N T A T I O N R I S K S A N D
M I T I G A T I N G M E A S U R E S

92
INVESTING IN KENYA’S AGRICULTURAL SECTOR TRANSFORMATION N A I P 2 0 1 9 - 2 0 2 4
Government financing risk
KES 35-45 billion of agriculture-specific cost (30-40%) is expected to be financed by MoALF&I, and KES 210 billion of agriculture-supportive cost for roads, power, etc. is expected to be financed by other government ministries, which are encouraged to engage in PPPs as appropriate. Since public sector budget allocations can vary from year to year, there is a risk that budget allocation to the NAIP in subsequent years will fall short of the expected amount. To mitigate against this, government budget for the NAIP will be ring-fenced and marked as “strategic” and tied to the Big Four, thus protecting it from austerity measures and ensuring stability in the NAIP funding pipeline from the government.
Development partner financing risk
As development partner countries go through their respective election cycles and political changes, international development funding amounts and priority areas also potentially shift, and this may result in reduced resource availability for the NAIP. To mitigate this risk, Kenya’s national transformation leaders will be trained in transformation financing as part of the knowledge and skills strengthening enabler and tasked with engaging key development partners in regular dialogue to ascertain likely changes in funding availability. In parallel, the ATO will be part of the monthly ARD meetings and will keep up to date on any likely changes in future funding availability, providing lead time for transformation leaders to secure additional funding sources should the need arise. Development partners will also be invited once per annum to attend the ATO’s semi-annual transformation progress review, and through this forum will be able to raise any concerns regarding funding risk in a timely manner. Through interactions in these different settings, MoALF&I will be able to work much more closely with development partners to ensure greater alignment between funding needs and resources available.
Private sector financing risk
If the right PPP mechanisms are set up, the private sector can contribute up to 80%
of NAIP financing. Uncertainty regarding private sector implementers’ financial health is therefore a key source of implementation risk. This risk is mitigated in three ways. First, the business models of private sector implementers in the ASTGS flagships are based on existing, viable enterprises in Kenya, suggesting that the opportunity to earn healthy margins exists under current conditions. As part of stakeholder sensitization, potential implementers have also been interviewed regarding supporting policies that would make investment conditions more favourable, and such measures have been included under the enabler on policy environment. Second, all businesses wishing to take part in any of the ASTGS flagships will be required to undergo a screening process to assess their financial history and – in the case of agro-processors – submit a business proposal for evaluation. Third, all private sector implementers will have to undergo compulsory knowledge and skills-strengthening programmes to build the skills needed for successful business management. These measures, along with performance management by the ATO, will reduce the risk of implementation disruption caused by business failure on the part of private sector implementers.
7.2 POLITICAL RISK
Risk from administration change
The NAIP timeline runs until 2023. However, the current Presidency will end in 2022. There is therefore a risk that the change in political administration could disrupt the final stages of NAIP implementation. To mitigate this risk, it is important that support for the transformation be built among the public sector officials as well as the public at large, particularly those affected by the transformation. To garner support among officials and highlight the importance of the ASTGS to the country’s agriculture, the change management programme will roll out a Ministry-wide communications plan to inform, motivate and rally the organization behind the transformation, as well as continually engage Ministry officials at all levels in two-way feedback to ensure that relevant departments feel ownership of their part of the transformation. To generate public support for the transformation,

93
I M P L E M E N T I N G R I SK S A N D M I T I G AT I N G M E A SU R E S
the M&E results will be publicly announced to foster public accountability and ensure that the impacts of the transformation are made known to the communities and stakeholders affected.
Risk from leadership changes at the Ministry of Agriculture
As mentioned in the enabler deep dive on building capacity and strengthening institutions, national and county leaders will be key in driving a successful transformation. As a number of leaders in agriculture are political appointees, there is a risk that they can be replaced at any time, thus disrupting the momentum of the part of the transformation they are leading, and requiring new investment to build the required transformation capabilities in their successor. To mitigate this risk, it is critical that the executive branch of government be part of the ASTGS’s semi-annual review so it takes ownership of the transformation and understands the importance of leadership continuity to the process.
7.3 EXECUTION RISK
A number of key steps are required to bring the ASTGS and NAIP to successful delivery. Implementation of these steps depends on coordination and action from multiple stakeholders and is therefore subject to several execution risks. The key actor to mitigate against these risks will be the ATO, as described below.
Risks during the detailed design stage
While the ASTGS and NAIP documents have outlined the key design features of the transformation flagships, the flagship owners will still need to work with the county CECs of agriculture to define the detailed steps of implementation. If this detailed design work is not carried out in adherence to the overall ASTGS timeline and with proper consultation with major stakeholders involved, there is a risk that the final implementation plan will not be conducive to effective flagship implementation. To mitigate against this risk, the ATO will liaise with all flagship owners to help guide the process in adherence to the ASTGS timeline and implementation design best practices.
Risks from lack of inter-ministerial and inter-sectoral coordination
Successful delivery of flagship implementation requires actions from more than just MoALF&I and the county departments of agriculture. Over the course of planning and implementation, MoALF&I will need to work with implementation partners in the private and social sectors, as well as the other sector ministries identified by the ASTGS (Ministry of Devolution and ASAL; Ministry of Environment and Forestry; Ministry of Industrialization and Enterprise Development; Ministry of Lands and Physical Planning; Ministry of Transport, Infrastructure and Housing; Ministry of Water and Sanitation; the National Treasury) and the Ministry of Health. This complex web of dependencies gives rise to the risk that inaction by any involved party could prevent effective implementation of the flagships and undermine the efforts of the other implementers.
To mitigate against this, the ATO and the flagship owners will regularly jointly monitor implementation progress against milestones, and work with the relevant milestone owners (including other ministries) to address any delays and escalate matters to the Cabinet Secretary for MoALF&I as needed. In addition, the mutual accountability generated by the ATO and its public dashboard will further foster accountability among the parties involved in planning and implementation. Accountability will also be further reinforced by embedding the progress milestones and results metrics into implementers’ formal job KPIs and tying these to their performance incentives.
Risks of resource competition from other priorities
Over the five years of the NAIP, new political priorities may arise for GoK, both within and outside the agricultural sector. These emerging priorities may take resources – including leadership time and attention – away from NAIP implementation, potentially causing delays and undermining transformation impact. To guard against this, the ATO. which reports directly to the highest levels of government, will closely monitor implementation progress by the different partners and rigorously ensure careful

94
INVESTING IN KENYA’S AGRICULTURAL SECTOR TRANSFORMATION N A I P 2 0 1 9 - 2 0 2 4
prioritization of NAIP implementation against competing priorities. In addition, the ATO and its M&E system will make any implementation delays visible to all other stakeholders, including the farmers who are directly impacted by these delays, fostering a network of mutual accountability to keep all stakeholders to task in successfully delivering the transformation.
7.4 MARKET RISK
The value generated from agricultural production is determined in part by market prices for the value chains produced, which in turn are influenced by market demand. As market demand for agricultural commodities can be unpredictable, this linkage gives rise to the risk that the incremental production value (and therefore incremental agriculture GDP) generated by the transformation may be significantly lower than anticipated. This risk can be serious both for small-scale farmers, whose
livelihoods depend to a large extent on income from agriculture, and for investors in the agro-processing and new private farms flagships, whose ventures will require significant up-front investment and whose returns will be affected by market demand for their products.
ASTGS mitigates against this market risk by improving access to market information for stakeholders in the agricultural sector, through SMEs, extension services and the data platforms in flagship 8. This allows small-scale farmers and investors to have visibility on recent trends in market prices for different value chains. In addition, the strategy does not dictate which value chains are produced, but rather empowers farmers – through extension services – to use their improved access to market and agro-ecological information to engage in value chains that have the greatest likelihood of catering to a receptive market.

95
A P P E N D I CE S
A P P E N D I C E S
APPENDIX 1 – FLAGSHIP IMPLEMENTATION PLANSAppendix 1: Detailed flagship implementation plans
Below are the detailed implementation plans of flagships 1-9, with description, timeline and owner of each milestone. Each flagship requires an Advisory Sub-Committee and GoK champion. These are subject to change as implementation gets underway. While the plan has already been detailed at the national level, the counties will need to domesticate these and develop their own county-level agricultural transformation plans. The process for this has already begun with several consultations across the counties, including in-person sessions with the Chief Officers of Agriculture, Chief Officers of Finance and the County Executives for Agriculture, as well as the ASTGS County Cluster Workshops. The Joint Agricultural Sector Steering Committee (JASSCOM) will be responsible for coordinating the process for the counties to build the ASTGS flagships into their County Integrated Development Plans (CIDPs).
Anchor 1 – Increase small-scale farmer, pastoralist and fisherfolk incomes
Impl
emen
ting
Org
aniz
atio
n/
Agen
cy
Advi
sory
Sub
-Com
C
ham
pion
GoK
cha
mpi
on (P
S or
AS
leve
l)
Stat
us
Year
1
Year
2
Year
3
Year
4
Year
5Q1 2019
Q2 2019
Q3 2019
Q4 2019
HY 1 HY 2
FLAGSHIP 1 – Target ~1 million farmers in ~40 zones (initially) served by ~1,000 SMEs
Varies Private sector player (TBC)
PS Crops, PS Livestock, PS Fisheries, PS Irrigation
Objective: Increase access to markets and affordability of high-quality inputs for farmers
Workstream 1 – Draw up detailed programme design and establish management mechanism
MoALF&I
Draw up detailed design of programme
MoALF&I
Build on design outlined in strategy and draw up full scope of work, testing the viability of the model with potential accelerator partners
MoALF&I
Select existing government project
MoALF&I
Agree on selection criteria
MoALF&I
Review existing, relevant government projects
MoALF&I
Select project MoALF&I

96
INVESTING IN KENYA’S AGRICULTURAL SECTOR TRANSFORMATION N A I P 2 0 1 9 - 2 0 2 4
Impl
emen
ting
Org
aniz
atio
n/
Agen
cy
Advi
sory
Sub
-Com
C
ham
pion
GoK
cha
mpi
on (P
S or
AS
leve
l)
Stat
us
Year
1
Year
2
Year
3
Year
4
Year
5Q1 2019
Q2 2019
Q3 2019
Q4 2019
HY 1 HY 2
Decide on system to manage and report performance of selected government project, accelerators and SMEs, plan annual competition
MoALF&I
Draw up list of all performance management criteria
MoALF&I
Outline performance management system
MoALF&I
Decide on cadence of reporting
MoALF&I
Plan annual SME competition, with winners by zone, lot and nationally to be awarded grants
MoALF&I
Identify members of the “Accelerator Selection Committee” to select the accelerators
MoALF&I
Draw up committee terms of reference
MoALF&I
Select/elect committee
MoALF&I
Workstream 2 – Select accelerators to manage zone clusters
MoALF&I & Accelerator Selection Committee
Prepare for publishing RFP
MoALF&I & Accelerator Selection Committee
Refine budget MoALF&I
Source/identify funds
MoALF&I
Agree on selection criteria (e.g., zones in each lot, criteria for selection of accelerators)
Accelerator Selection Committee
Publish RFP and award contracts to accelerators
Accelerator Selection Committee
Draw up and publish RFP, including zones per lot, selection and evaluation criteria
Accelerator Selection Committee
Score all submissions according to selection criteria and select accelerators for first 2 lots
Accelerator Selection Committee
Agree on terms and award contracts
Accelerator Selection Committee
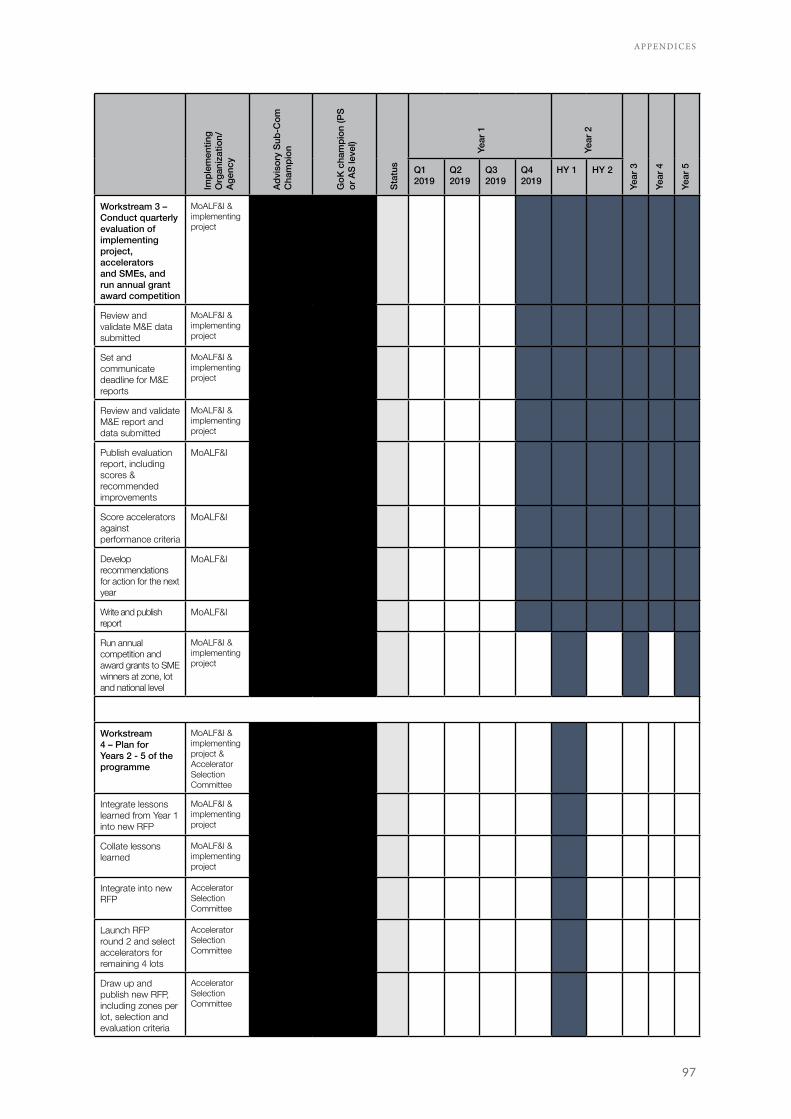
97
A P P E N D I CE S
Impl
emen
ting
Org
aniz
atio
n/
Agen
cy
Advi
sory
Sub
-Com
C
ham
pion
GoK
cha
mpi
on (P
S or
AS
leve
l)
Stat
us
Year
1
Year
2
Year
3
Year
4
Year
5Q1 2019
Q2 2019
Q3 2019
Q4 2019
HY 1 HY 2
Workstream 3 – Conduct quarterly evaluation of implementing project, accelerators and SMEs, and run annual grant award competition
MoALF&I & implementing project
Review and validate M&E data submitted
MoALF&I & implementing project
Set and communicate deadline for M&E reports
MoALF&I & implementing project
Review and validate M&E report and data submitted
MoALF&I & implementing project
Publish evaluation report, including scores & recommended improvements
MoALF&I
Score accelerators against performance criteria
MoALF&I
Develop recommendations for action for the next year
MoALF&I
Write and publish report
MoALF&I
Run annual competition and award grants to SME winners at zone, lot and national level
MoALF&I & implementing project
Workstream 4 – Plan for Years 2 - 5 of the programme
MoALF&I & implementing project & Accelerator Selection Committee
Integrate lessons learned from Year 1 into new RFP
MoALF&I & implementing project
Collate lessons learned
MoALF&I & implementing project
Integrate into new RFP
Accelerator Selection Committee
Launch RFP round 2 and select accelerators for remaining 4 lots
Accelerator Selection Committee
Draw up and publish new RFP, including zones per lot, selection and evaluation criteria
Accelerator Selection Committee

98
INVESTING IN KENYA’S AGRICULTURAL SECTOR TRANSFORMATION N A I P 2 0 1 9 - 2 0 2 4
Impl
emen
ting
Org
aniz
atio
n/
Agen
cy
Advi
sory
Sub
-Com
C
ham
pion
GoK
cha
mpi
on (P
S or
AS
leve
l)
Stat
us
Year
1
Year
2
Year
3
Year
4
Year
5Q1 2019
Q2 2019
Q3 2019
Q4 2019
HY 1 HY 2
Score all submissions according to selection criteria and select accelerators for remaining 4 lots
Accelerator Selection Committee
Agree on terms and award contracts for remaining 4 lots
Accelerator Selection Committee
FLAGSHIP 2 – Restructuring national subsidies
Varies Development partner (TBC)
PS CAS
Objective: Increase affordability of inputs to farmers
Workstream 1 – Design the new subsidy system
MoALF&I
Select working team of multidisciplinary experts & decision-makers
MoALF&I
Agree on team terms of reference
MoALF&I
Select team MoALF&I
Syndicate and align current farmer registration, e-voucher and other similar mechanisms already in place with flagship 2 design
Technical working team – TBC
Collate detailed information on current initiatives, systems and policies, at national and county levels
Technical working team – TBC
Syndicate and align with flagship 2 design
Technical working team – TBC
Draw up system design, including detailed costing, targets, digital mechanism design and roll-out plan
Technical working team – TBC
Draw up detailed system design
Technical working team – TBC
Draw up costing Technical working team – TBC
Plan roll out Technical working team – TBC
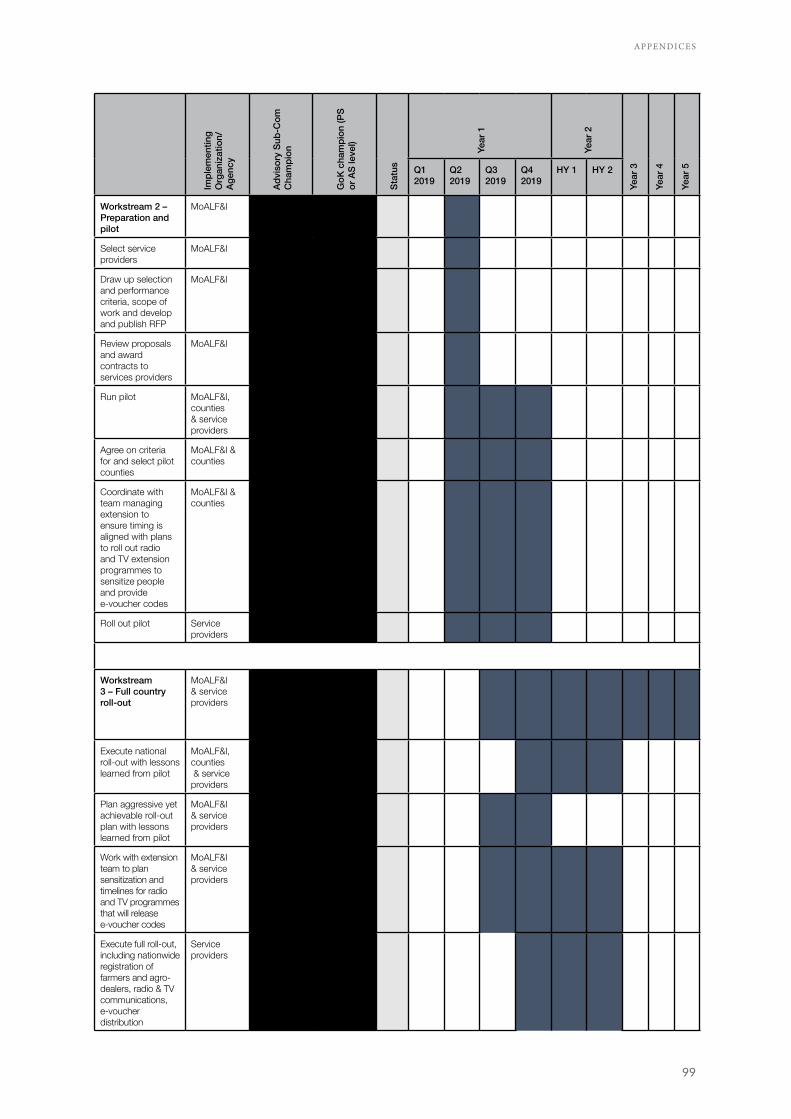
99
A P P E N D I CE S
Impl
emen
ting
Org
aniz
atio
n/
Agen
cy
Advi
sory
Sub
-Com
C
ham
pion
GoK
cha
mpi
on (P
S or
AS
leve
l)
Stat
us
Year
1
Year
2
Year
3
Year
4
Year
5Q1 2019
Q2 2019
Q3 2019
Q4 2019
HY 1 HY 2
Workstream 2 – Preparation and pilot
MoALF&I
Select service providers
MoALF&I
Draw up selection and performance criteria, scope of work and develop and publish RFP
MoALF&I
Review proposals and award contracts to services providers
MoALF&I
Run pilot MoALF&I, counties & service providers
Agree on criteria for and select pilot counties
MoALF&I & counties
Coordinate with team managing extension to ensure timing is aligned with plans to roll out radio and TV extension programmes to sensitize people and provide e-voucher codes
MoALF&I & counties
Roll out pilot Service providers
Workstream 3 – Full country roll-out
MoALF&I & service providers
Execute national roll-out with lessons learned from pilot
MoALF&I, counties & service providers
Plan aggressive yet achievable roll-out plan with lessons learned from pilot
MoALF&I & service providers
Work with extension team to plan sensitization and timelines for radio and TV programmes that will release e-voucher codes
MoALF&I & service providers
Execute full roll-out, including nationwide registration of farmers and agro-dealers, radio & TV communications, e-voucher distribution
Service providers

100
INVESTING IN KENYA’S AGRICULTURAL SECTOR TRANSFORMATION N A I P 2 0 1 9 - 2 0 2 4
Impl
emen
ting
Org
aniz
atio
n/
Agen
cy
Advi
sory
Sub
-Com
C
ham
pion
GoK
cha
mpi
on (P
S or
AS
leve
l)
Stat
us
Year
1
Year
2
Year
3
Year
4
Year
5Q1 2019
Q2 2019
Q3 2019
Q4 2019
HY 1 HY 2
Workstream 4 – Monitor & revise system
MoALF&I
Draw up monitoring plan
MoALF&I
Agree on performance targets, e.g., number of farmers reached, cost and type of inputs bought, value for money of digital platform and others, taking into account lessons learned from the pilot
MoALF&I
Agree on reporting system and cadence, taking into account lessons learned from the pilot
MoALF&I
Revise monitoring plan based on lessons learned from national roll-out
MoALF&I
Revise programme, annually
MoALF&I
Revise targets, strategy and costing of programme, as needed, based on lessons learned
MoALF&I
Renew and revise contracts with service providers every 3-5 years
MoALF&I
Revise targets, strategy and costing of contracts with service providers, as needed, based on lessons learned
MoALF&I

101
A P P E N D I CE S
Anchor 2 – increase agricultural output and value addition
Impl
emen
ting
Org
aniz
atio
n/
Agen
cy
Advi
sory
Sub
-Com
C
ham
pion
GoK
cha
mpi
on (P
S or
AS
leve
l)
Stat
us
Year
1
Year
2
Year
3
Year
4
Year
5Q1 2019
Q2 2019
Q3 2019
Q4 2019
HY 1 HY 2
FLAGSHIP 3 – Through the APDT, a one-stop shop for agro-processors, develop and construct 6 large-scale agro- and food processing hubs
Varies Private sector player (TBC)
PS Crops, PS Livestock, PS Fisheries, PS Investment and Industry
Objective: Solicit Kenya’s highest potential projects, and offer a one-stop solution for implementation of 6 Kenyan agro-processing facilities with combined capital value exceeding ~KES 75bn, largely private sector-financed
Workstream 1 – Establish, fund and empower the Accelerator
Establish the agro-processing Accelerator
MoALF&I
Create direct reporting line into the ATO
MoALF&I
Create clear performance objectives and metrics, with a regular reporting requirement
MoALF&I
Convene key leadership (ministries, parastatals, and private sector representatives)
MoALF&I
Establish a multi-year funding mechanism, subject to Accelerator performance
MoALF&I
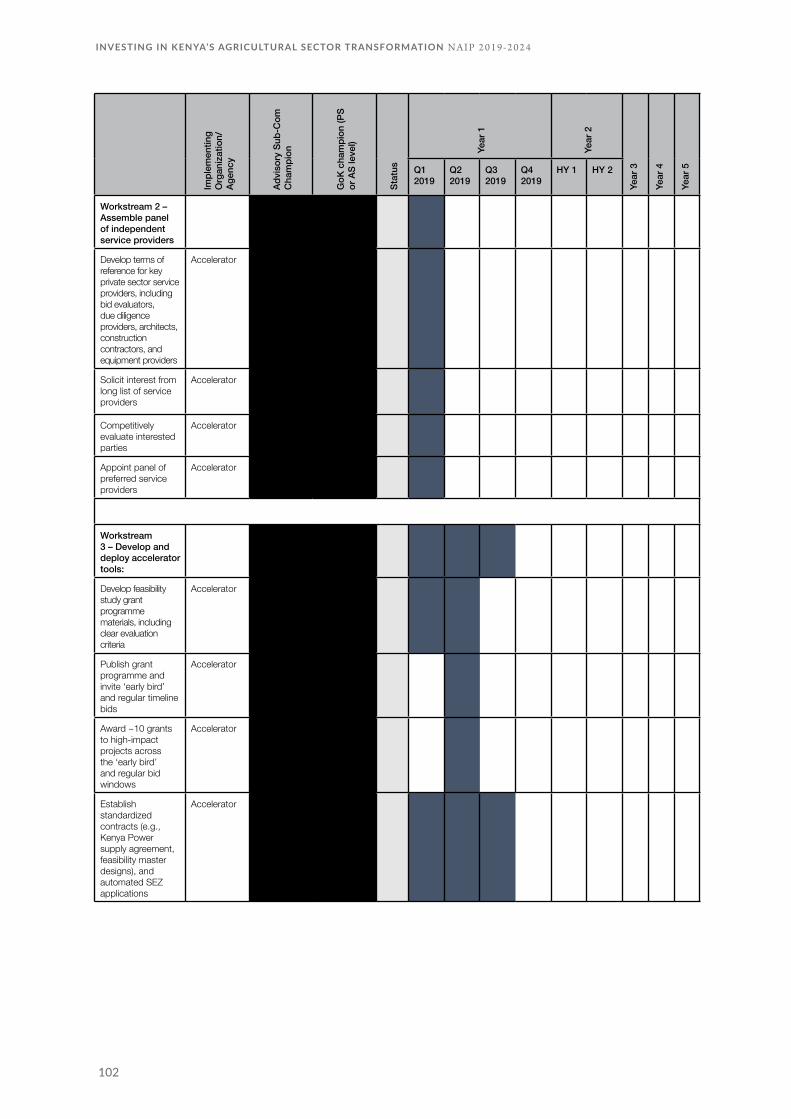
102
INVESTING IN KENYA’S AGRICULTURAL SECTOR TRANSFORMATION N A I P 2 0 1 9 - 2 0 2 4
Impl
emen
ting
Org
aniz
atio
n/
Agen
cy
Advi
sory
Sub
-Com
C
ham
pion
GoK
cha
mpi
on (P
S or
AS
leve
l)
Stat
us
Year
1
Year
2
Year
3
Year
4
Year
5Q1 2019
Q2 2019
Q3 2019
Q4 2019
HY 1 HY 2
Workstream 2 – Assemble panel of independent service providers
Develop terms of reference for key private sector service providers, including bid evaluators, due diligence providers, architects, construction contractors, and equipment providers
Accelerator
Solicit interest from long list of service providers
Accelerator
Competitively evaluate interested parties
Accelerator
Appoint panel of preferred service providers
Accelerator
Workstream 3 – Develop and deploy accelerator tools:
Develop feasibility study grant programme materials, including clear evaluation criteria
Accelerator
Publish grant programme and invite ‘early bird’ and regular timeline bids
Accelerator
Award ~10 grants to high-impact projects across the ‘early bird’ and regular bid windows
Accelerator
Establish standardized contracts (e.g., Kenya Power supply agreement, feasibility master designs), and automated SEZ applications
Accelerator

103
A P P E N D I CE S
Impl
emen
ting
Org
aniz
atio
n/
Agen
cy
Advi
sory
Sub
-Com
C
ham
pion
GoK
cha
mpi
on (P
S or
AS
leve
l)
Stat
us
Year
1
Year
2
Year
3
Year
4
Year
5Q1 2019
Q2 2019
Q3 2019
Q4 2019
HY 1 HY 2
Workstream 4 – Undertake ~10 feasibility studies
From panel of service providers, appoint due diligence provider to undertake ~10 comprehensive feasibility studies, leading to 6 projects with independent feasibility reports
Accelerator
Transfer ownership of feasibility to project champions
Accelerator
Allocate minority shareholding in facilities to strategic agriculture stakeholder groups (women, youth and community groups)
Accelerator
Workstream 5 – Construct 6 large-scale processing facilities
Procure design specialists from panel of approved providers to complete facility design
Accelerator
Procure equipment providers and construction contractors to undertake construction of new facilities
Accelerator
Construct facilities Accelerator

104
INVESTING IN KENYA’S AGRICULTURAL SECTOR TRANSFORMATION N A I P 2 0 1 9 - 2 0 2 4
Impl
emen
ting
Org
aniz
atio
n/
Agen
cy
Advi
sory
Sub
-Com
C
ham
pion
GoK
cha
mpi
on (P
S or
AS
leve
l)
Stat
us
Year
1
Year
2
Year
3
Year
4
Year
5Q1 2019
Q2 2019
Q3 2019
Q4 2019
HY 1 HY 2
FLAGSHIP 4 – Unlock ~50 new large-scale private farms across 200,000 hectares with 150,000 acres under sustainable irrigation
Varies Private sector player (TBC)
PS Crops, PS Livestock, PS Irrigation
Objective: Grow Kenya’s output by around KES 65bn annually, and reduce the staple deficit by ~50%
Workstream 1 – Prepare for procurement
Get final confirmation of land availability from first 15 locations
MoALF&I, state landowners
Determine minimum bid criteria
MoALF&I, PPPU
Determine bid evaluation
MoALF&I, PPPU
Create standardized concession materials (concession contracts, land rental agreements, cropping plans, performance contracts, etc.)
MoALF&I, PPPU, private sector law firm
Create data room (x15, per farm), containing soil data, security details, dam feasibility studies (where relevant), etc.)
MoALF&I, private sector soil service provider
Organize site visit for bidders (x15, per farm)
MoALF&I, landowners
Gazette new programme publicly
PPPU
First Bid Window – Procure 15 new farm consortiums (~150k acres ha)
Publish RFP for first 15 locations
PPPU
Appoint independent bid evaluators (e.g. reputable accounting firms)
MoALF&I, PPPU, Private sector bid evaluator
Evaluate First Bid Window bids
Bid evaluators
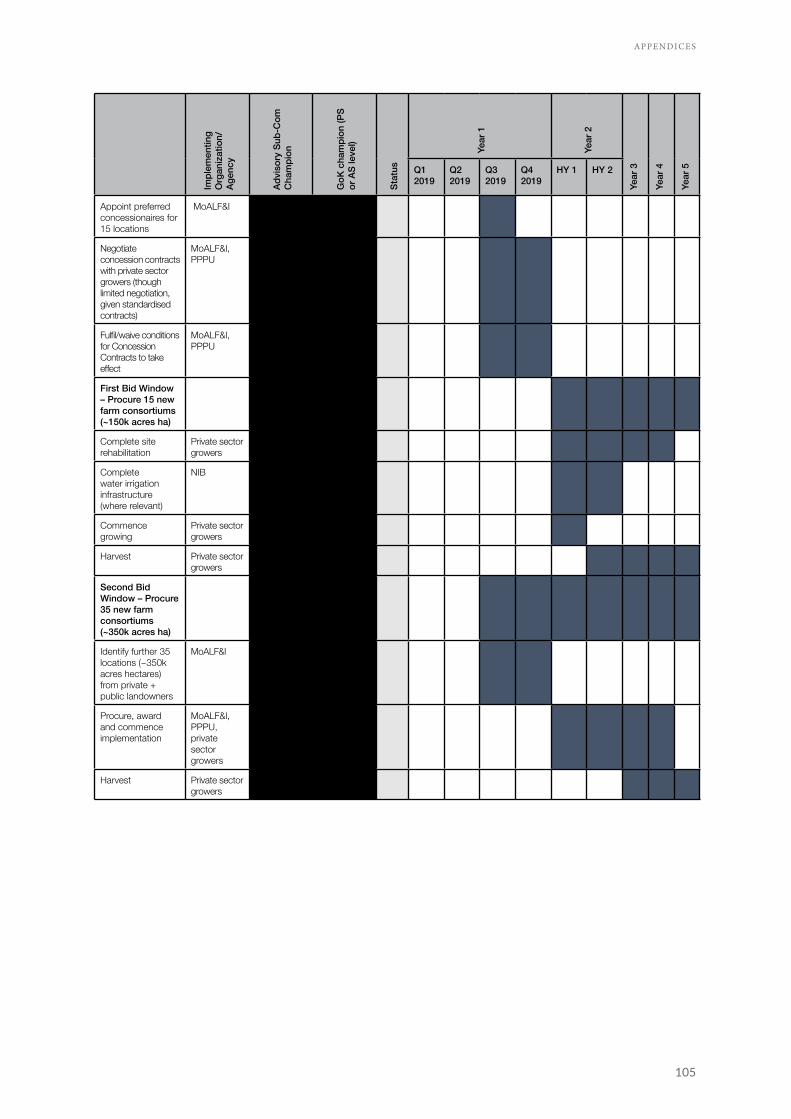
105
A P P E N D I CE S
Impl
emen
ting
Org
aniz
atio
n/
Agen
cy
Advi
sory
Sub
-Com
C
ham
pion
GoK
cha
mpi
on (P
S or
AS
leve
l)
Stat
us
Year
1
Year
2
Year
3
Year
4
Year
5Q1 2019
Q2 2019
Q3 2019
Q4 2019
HY 1 HY 2
Appoint preferred concessionaires for 15 locations
MoALF&I
Negotiate concession contracts with private sector growers (though limited negotiation, given standardised contracts)
MoALF&I, PPPU
Fulfil/waive conditions for Concession Contracts to take effect
MoALF&I, PPPU
First Bid Window – Procure 15 new farm consortiums (~150k acres ha)
Complete site rehabilitation
Private sector growers
Complete water irrigation infrastructure (where relevant)
NIB
Commence growing
Private sector growers
Harvest Private sector growers
Second Bid Window – Procure 35 new farm consortiums (~350k acres ha)
Identify further 35 locations (~350k acres hectares) from private + public landowners
MoALF&I
Procure, award and commence implementation
MoALF&I, PPPU, private sector growers
Harvest Private sector growers

106
INVESTING IN KENYA’S AGRICULTURAL SECTOR TRANSFORMATION N A I P 2 0 1 9 - 2 0 2 4
Anchor 3 – increase household food resilience
Impl
emen
ting
Org
aniz
atio
n/
Agen
cy
Advi
sory
Sub
-Com
C
ham
pion
GoK
cha
mpi
on (P
S or
AS
leve
l)
Stat
us
Year
1
Year
2
Year
3
Year
4
Year
5Q1 2019
Q2 2019
Q3 2019
Q4 2019
HY 1 HY 2
FLAGSHIP 5 – Improve performance of the strategic food reserve
Varies Private sector player (TBC)
PS Crops, PS CAS
Objective: Diversify and improve operations, governance, responsiveness and cost-efficiency of the strategic reserve
Workstream 1 – Improve strategic food reserves policy, governance and decision-making mechanism
a. Pass legislation/policy to enable governance changes
Varies
Legislation change to move price stabilization mandate from SFRTF
MoALF&I, Parliament, Treasury
Policy to explicitly allow private sector to participate in strategic food reserve storage
MoALF&I, Parliament, Treasury
Policy for buy/sell decision-making framework, competitive, emergency release triggers, targeting criteria, M&E, and periodic review to SFRTF mandate
MoALF&I
b. Formulate explicit governing policies for SFR
Varies
Data gathering and analysis of technical data on food supply and demand
Tegemeo, KALRO, SFRTF, ILRI, other govt/private research orgs as needed
Formulate buy/sell framework and rules
SFRTF
Formulate framework for responding to emergencies with set triggers for release
SFRTF
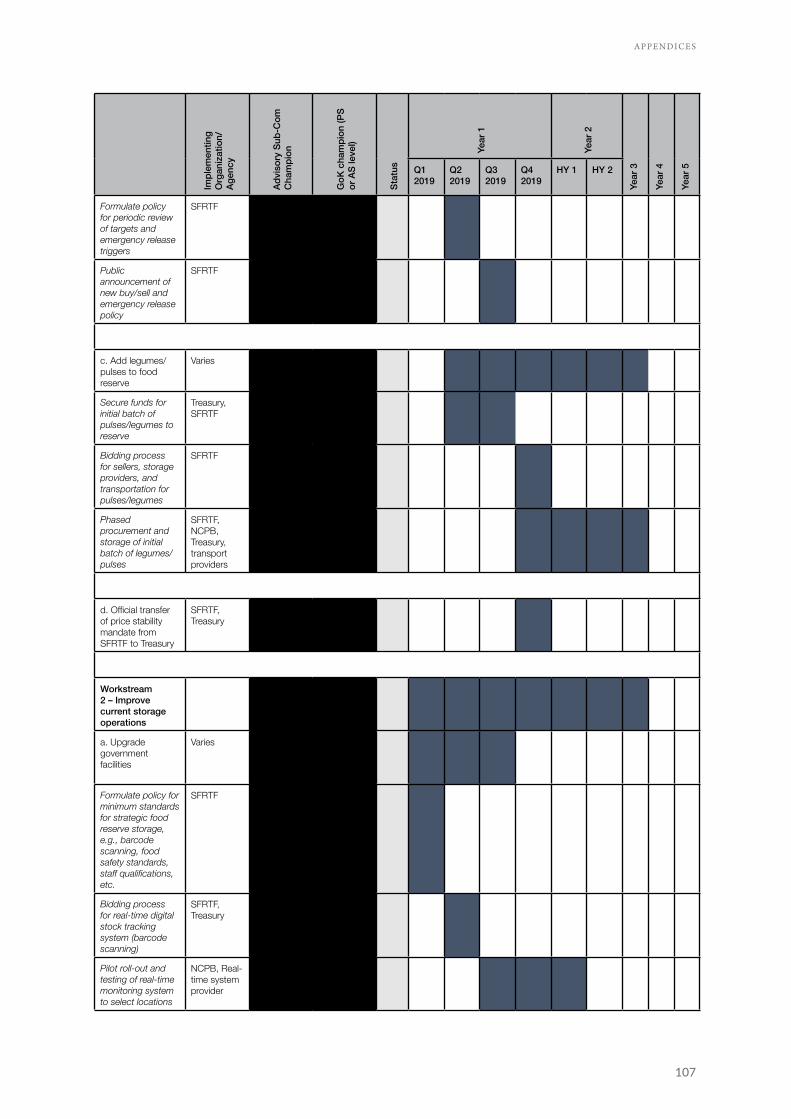
107
A P P E N D I CE S
Impl
emen
ting
Org
aniz
atio
n/
Agen
cy
Advi
sory
Sub
-Com
C
ham
pion
GoK
cha
mpi
on (P
S or
AS
leve
l)
Stat
us
Year
1
Year
2
Year
3
Year
4
Year
5Q1 2019
Q2 2019
Q3 2019
Q4 2019
HY 1 HY 2
Formulate policy for periodic review of targets and emergency release triggers
SFRTF
Public announcement of new buy/sell and emergency release policy
SFRTF
c. Add legumes/pulses to food reserve
Varies
Secure funds for initial batch of pulses/legumes to reserve
Treasury, SFRTF
Bidding process for sellers, storage providers, and transportation for pulses/legumes
SFRTF
Phased procurement and storage of initial batch of legumes/pulses
SFRTF, NCPB, Treasury, transport providers
d. Official transfer of price stability mandate from SFRTF to Treasury
SFRTF, Treasury
Workstream 2 – Improve current storage operations
a. Upgrade government facilities
Varies
Formulate policy for minimum standards for strategic food reserve storage, e.g., barcode scanning, food safety standards, staff qualifications, etc.
SFRTF
Bidding process for real-time digital stock tracking system (barcode scanning)
SFRTF, Treasury
Pilot roll-out and testing of real-time monitoring system to select locations
NCPB, Real-time system provider
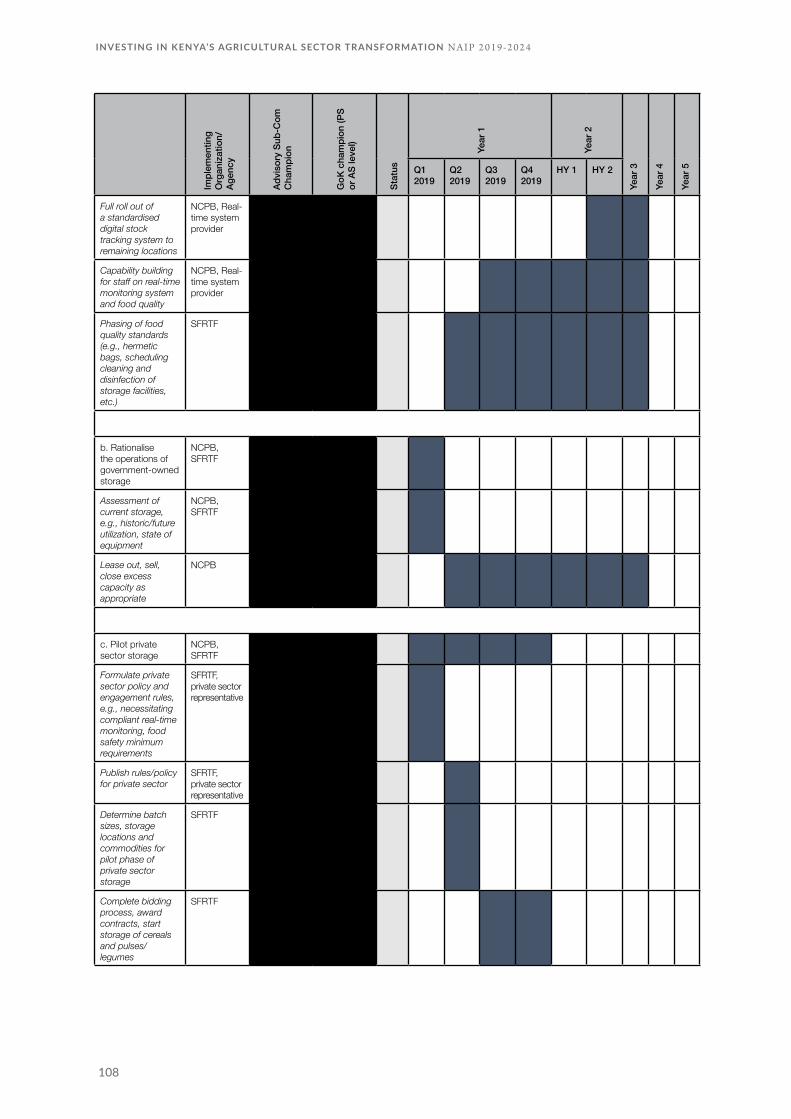
108
INVESTING IN KENYA’S AGRICULTURAL SECTOR TRANSFORMATION N A I P 2 0 1 9 - 2 0 2 4
Impl
emen
ting
Org
aniz
atio
n/
Agen
cy
Advi
sory
Sub
-Com
C
ham
pion
GoK
cha
mpi
on (P
S or
AS
leve
l)
Stat
us
Year
1
Year
2
Year
3
Year
4
Year
5Q1 2019
Q2 2019
Q3 2019
Q4 2019
HY 1 HY 2
Full roll out of a standardised digital stock tracking system to remaining locations
NCPB, Real-time system provider
Capability building for staff on real-time monitoring system and food quality
NCPB, Real-time system provider
Phasing of food quality standards (e.g., hermetic bags, scheduling cleaning and disinfection of storage facilities, etc.)
SFRTF
b. Rationalise the operations of government-owned storage
NCPB, SFRTF
Assessment of current storage, e.g., historic/future utilization, state of equipment
NCPB, SFRTF
Lease out, sell, close excess capacity as appropriate
NCPB
c. Pilot private sector storage
NCPB, SFRTF
Formulate private sector policy and engagement rules, e.g., necessitating compliant real-time monitoring, food safety minimum requirements
SFRTF, private sector representative
Publish rules/policy for private sector
SFRTF, private sector representative
Determine batch sizes, storage locations and commodities for pilot phase of private sector storage
SFRTF
Complete bidding process, award contracts, start storage of cereals and pulses/legumes
SFRTF

109
A P P E N D I CE S
Impl
emen
ting
Org
aniz
atio
n/
Agen
cy
Advi
sory
Sub
-Com
C
ham
pion
GoK
cha
mpi
on (P
S or
AS
leve
l)
Stat
us
Year
1
Year
2
Year
3
Year
4
Year
5Q1 2019
Q2 2019
Q3 2019
Q4 2019
HY 1 HY 2
Workstream 4 – Plan for Years 3 - 5 of the programme
a. Annual review of governing policy
SFRTF
Review and adjust target reserve size and emergency triggers
SFRTF
Review and adjust commodities in the reserves and adjust if necessary
SFRTF
Review decision-making rationale for buy/selling, compare to past performance and adjust if necessary
SFRTF
Review food quality measure performance and take remedial action
SFRTF
Review operational guidelines and performance for private and govt facilities
SFRTF
Public announcement of any updates to targets, triggers, decision-making rationale, food safety and private storage policy
SFRTF
b. Ramp up private sector involvement
SFRTF
Review performance of private sector pilot
SFRTF
Take remedial action in case of poor performance, e.g., modify engagement rules, locations, commodities, etc.
SFRTF
Expand or rerun pilot
SFRTF

110
INVESTING IN KENYA’S AGRICULTURAL SECTOR TRANSFORMATION N A I P 2 0 1 9 - 2 0 2 4
Impl
emen
ting
Org
aniz
atio
n/
Agen
cy
Advi
sory
Sub
-Com
C
ham
pion
GoK
cha
mpi
on (P
S or
AS
leve
l)
Stat
us
Year
1
Year
2
Year
3
Year
4
Year
5Q1 2019
Q2 2019
Q3 2019
Q4 2019
HY 1 HY 2
c. Operations and maintenance activities
Varies
Updates to real-time tracking system on per need basis
NCPB, private storage providers
Investment in new machinery/equipment
NCPB, private storage providers
Food safety activities, e.g., disinfection, cleaning, etc.
NCPB, private storage providers
d. Review and adjust commodities in SFR as required to include others (e.g., milk, meat)
SFRTF
FLAGSHIP 6: ASALs Resilience
Varies Economic bloc CEO (TBC), Development partner (TBC)
PS Crops, PS Fisheries, PS Livestock, PS Irrigation
Objective: Achieve food resilience through community-driven well-coordinated interventions/projects
Workstream 1 – Set up coordination mechanism
MoALF&I, county governments (via regional economic blocs), development partners
a. Establish a food resilience coordination department at MoALF&I
MoALF&I
Structure governance and coordination mechanism to interact national government, county, development partners, private sector and communities
MoALF&I
Develop a meeting cadence for the ASALs’ economic bloc representatives and development partners
MoALF&I, Council of Governors

111
A P P E N D I CE S
Impl
emen
ting
Org
aniz
atio
n/
Agen
cy
Advi
sory
Sub
-Com
C
ham
pion
GoK
cha
mpi
on (P
S or
AS
leve
l)
Stat
us
Year
1
Year
2
Year
3
Year
4
Year
5Q1 2019
Q2 2019
Q3 2019
Q4 2019
HY 1 HY 2
Develop a yearly M&E schedule for interventions/projects to be implemented and communicate to stakeholders
MoALF&I, county governments
Convene economic blocs convene a briefing meeting with the governors and agriculture CECs
NCPB, private storage providers
Coordinate capability building for counties to acquire required skills to drive community involvement and feasibility studies
MoALF&I, development partners
Establish mechanism and process for disseminating lessons learned for Phase 2 and future practical application of best practices (knowledge transfer)
MoALF&I, development partners
Workstream 2 – Counties’ community involvement, menu of interventions, operational plan for Phase 1 (to be used as template for Phase 2)
MoALF&I, county governments (via regional economic blocs), development partners
a. Community mapping and involvement
MoALF&I
Determine support required to drive the community involvement and conduct feasibility studies (all 16 counties)
MoALF&I, development partners
Map out communities in counties as per their characteristics (economic, demographic, cultural)
County governments and development partners
Establish resilience committees at each administrative level
County governments and development partners
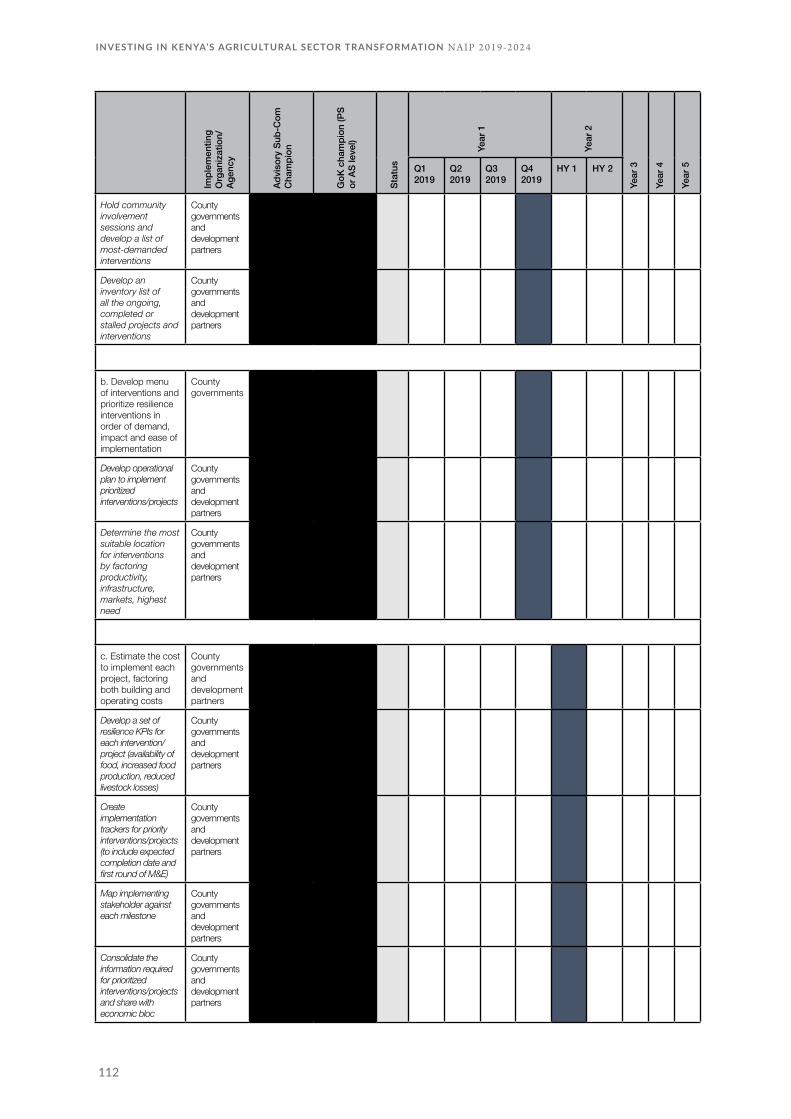
112
INVESTING IN KENYA’S AGRICULTURAL SECTOR TRANSFORMATION N A I P 2 0 1 9 - 2 0 2 4
Impl
emen
ting
Org
aniz
atio
n/
Agen
cy
Advi
sory
Sub
-Com
C
ham
pion
GoK
cha
mpi
on (P
S or
AS
leve
l)
Stat
us
Year
1
Year
2
Year
3
Year
4
Year
5Q1 2019
Q2 2019
Q3 2019
Q4 2019
HY 1 HY 2
Hold community involvement sessions and develop a list of most-demanded interventions
County governments and development partners
Develop an inventory list of all the ongoing, completed or stalled projects and interventions
County governments and development partners
b. Develop menu of interventions and prioritize resilience interventions in order of demand, impact and ease of implementation
County governments
Develop operational plan to implement prioritized interventions/projects
County governments and development partners
Determine the most suitable location for interventions by factoring productivity, infrastructure, markets, highest need
County governments and development partners
c. Estimate the cost to implement each project, factoring both building and operating costs
County governments and development partners
Develop a set of resilience KPIs for each intervention/project (availability of food, increased food production, reduced livestock losses)
County governments and development partners
Create implementation trackers for priority interventions/projects (to include expected completion date and first round of M&E)
County governments and development partners
Map implementing stakeholder against each milestone
County governments and development partners
Consolidate the information required for prioritized interventions/projects and share with economic bloc
County governments and development partners

113
A P P E N D I CE S
Impl
emen
ting
Org
aniz
atio
n/
Agen
cy
Advi
sory
Sub
-Com
C
ham
pion
GoK
cha
mpi
on (P
S or
AS
leve
l)
Stat
us
Year
1
Year
2
Year
3
Year
4
Year
5Q1 2019
Q2 2019
Q3 2019
Q4 2019
HY 1 HY 2
Workstream 3 – Coordination of implementation (Phase 1 and 2)
a. Consolidate interventions and projects from the ASAL economic blocs
MoALF&I
b. Identify developing themes and determine which interventions should be implemented at national level for the ASALs (depending on scale required)
MoALF&I
Host high-level stakeholder forum to discuss funding/allocation of proposed interventions
MoALF&I
Achieve agreement on projects of scale among stakeholders required to form consortium
MoALF&I
c. Coordinate development partners, NGOs, national government, government ministries and economic blocs to select and commit to which prioritized interventions to implement
MoALF&I
Commission the start of quick-win interventions
MoALF&I, development partners, county government, national government
Commission start of projects of scale
MoALF&I, development partners, county government, national government
Monitor implementation of projects of scale against plan and convene progress review sessions
MoALF&I
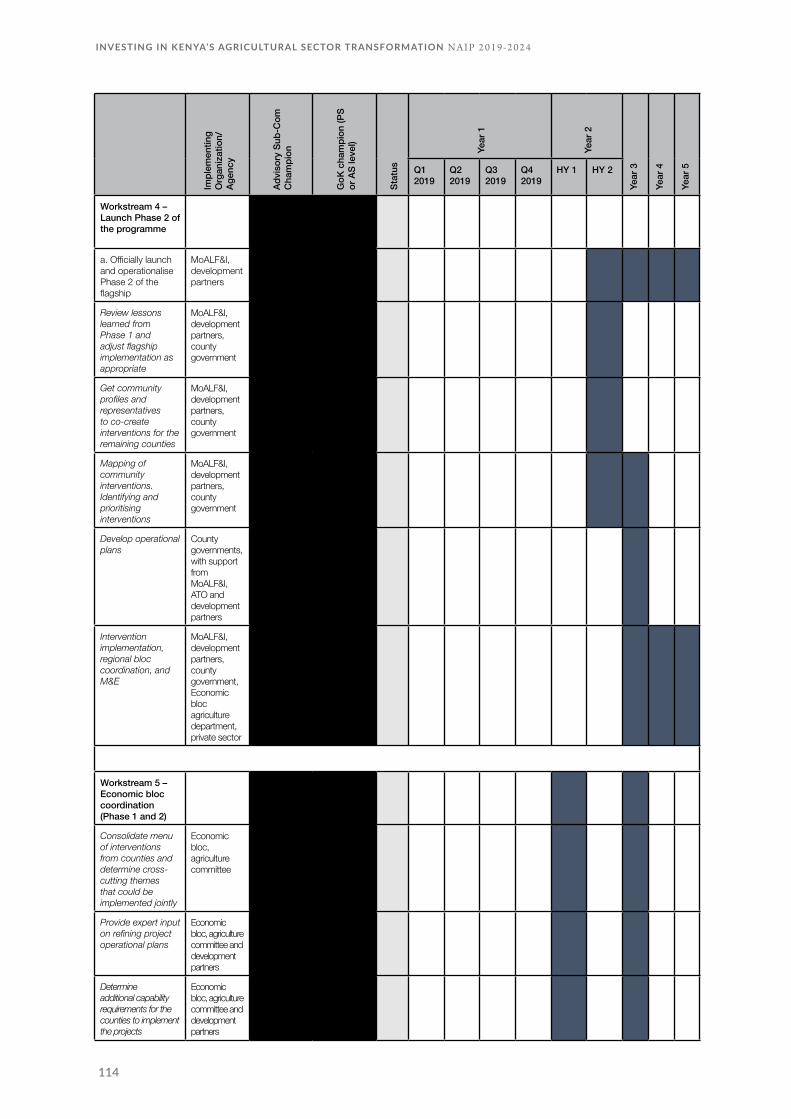
114
INVESTING IN KENYA’S AGRICULTURAL SECTOR TRANSFORMATION N A I P 2 0 1 9 - 2 0 2 4
Impl
emen
ting
Org
aniz
atio
n/
Agen
cy
Advi
sory
Sub
-Com
C
ham
pion
GoK
cha
mpi
on (P
S or
AS
leve
l)
Stat
us
Year
1
Year
2
Year
3
Year
4
Year
5Q1 2019
Q2 2019
Q3 2019
Q4 2019
HY 1 HY 2
Workstream 4 –Launch Phase 2 of the programme
a. Officially launch and operationalise Phase 2 of the flagship
MoALF&I, development partners
Review lessons learned from Phase 1 and adjust flagship implementation as appropriate
MoALF&I, development partners, county government
Get community profiles and representatives to co-create interventions for the remaining counties
MoALF&I, development partners, county government
Mapping of community interventions. Identifying and prioritising interventions
MoALF&I, development partners, county government
Develop operational plans
County governments, with support from MoALF&I, ATO and development partners
Intervention implementation, regional bloc coordination, and M&E
MoALF&I, development partners, county government, Economic bloc agriculture department, private sector
Workstream 5 – Economic bloc coordination (Phase 1 and 2)
Consolidate menu of interventions from counties and determine cross-cutting themes that could be implemented jointly
Economic bloc, agriculture committee
Provide expert input on refining project operational plans
Economic bloc, agriculture committee and development partners
Determine additional capability requirements for the counties to implement the projects
Economic bloc, agriculture committee and development partners

115
A P P E N D I CE S
ENABLERS
Impl
emen
ting
Org
aniz
atio
n/
Agen
cy
Advi
sory
Sub
-Com
C
ham
pion
GoK
cha
mpi
on (P
S or
AS
leve
l)
Stat
us
Year
1
Year
2
Year
3
Year
4
Year
5Q1 2019
Q2 2019
Q3 2019
Q4 2019
HY 1 HY 2
Workstream 6 – Sustainability
Determine the capabilities required for the communities to drive intervention beyond implementation
MoALF&I, development partners, county government, national government
Build local community capacity over the period of the project implementation
MoALF&I, development partners, county government, national government
Identify success stories within the community and run a sensitization campaign on radio or market places
MoALF&I, development partners, county government, national government
Impl
emen
ting
Org
aniz
atio
n/
Agen
cy
Advi
sory
Sub
-Com
C
ham
pion
GoK
cha
mpi
on (P
S or
AS
leve
l)
Stat
us
Year
1
Year
2
Year
3
Year
4
Year
5Q1 2019
Q2 2019
Q3 2019
Q4 2019
HY 1 HY 2
FLAGSHIP 7 Knowledge and skill building and institution strengthening
Varies Private sector or non-state actor player (TBC)
PS CAS, PS Research & Extension
Objective: Achieve the personnel and institutional readiness to drive Kenya’s agricultural transformation at the national and county levels, across government leaders and private sector implementers
Work with the ATO to define operational-level metrics to ensure accountability
MoALF&I
Workstream 1 – Knowledge and skills-building programme
MoALF&I, development partners, county government, national government

116
INVESTING IN KENYA’S AGRICULTURAL SECTOR TRANSFORMATION N A I P 2 0 1 9 - 2 0 2 4
Impl
emen
ting
Org
aniz
atio
n/
Agen
cy
Advi
sory
Sub
-Com
C
ham
pion
GoK
cha
mpi
on (P
S or
AS
leve
l)
Stat
us
Year
1
Year
2
Year
3
Year
4
Year
5Q1 2019
Q2 2019
Q3 2019
Q4 2019
HY 1 HY 2
a. Assign responsibilities to transformation leaders and implementers
MoALF&I, Council of Governors
Assign responsibility for different transformation areas to national leaders
MoALF&I
Assign responsibility for transformation in each county to county leaders
Ag CEC of each county
Assign implementation responsibilities to implementation personnel
Varies
b. Launch formal training programmes
MoALF&I
Design curricula for transformation leaders
MoALF&I
Launch in-person training for transformation leaders
MoALF&I
Design national curricula for implementers
MoALF&I
Roll out pilot training for transformation implementers
MoALF&I
Design area-specific training curricula for extension workers
Private sector partner
Launch area-specific training curricula for extension workers
Private sector partner
c. Assemble peer network
ATO
Compile list of potential international network members in conjunction with partner organization
ATO
Design model of interaction for network
ATO
Invite potential international network members to join
ATO
Organize first mini-lab
ATO

117
A P P E N D I CE S
Impl
emen
ting
Org
aniz
atio
n/
Agen
cy
Advi
sory
Sub
-Com
C
ham
pion
GoK
cha
mpi
on (P
S or
AS
leve
l)
Stat
us
Year
1
Year
2
Year
3
Year
4
Year
5Q1 2019
Q2 2019
Q3 2019
Q4 2019
HY 1 HY 2
d. Roll out youth-led digital extension service
County agriculture departments
Draw up RFPs and organize area-specific bids to select implementation partners
County agriculture departments
Start recruitment and training of youth extension workers
County agriculture departments and implementation partner
Roll out youth-led extension across the counties
County agriculture departments
Workstream 2 – MoALF&I Change Management
a. Design change management programme
MoALF&I
Conduct organizational diagnostic
MoALF&I
Design and prioritize organizational interventions based on result of diagnostic
MoALF&I
Design organizational communications plans
MoALF&I
b. Launch change management programme
MoALF&I
Launch organizational transformation kick-off and transformation plan
MoALF&I
Start implementing organizational interventions
MoALF&I
Workstream 3 – Plan for Years 2-5 of the programme
a. Plan knowledge and skill-building programmes Years 2-5
MoALF&I, CoG
Plan training curricula for Years 2-5
MoALF&I
Mark preliminary dates for future mini-labs
ATO

118
INVESTING IN KENYA’S AGRICULTURAL SECTOR TRANSFORMATION N A I P 2 0 1 9 - 2 0 2 4
Impl
emen
ting
Org
aniz
atio
n/
Agen
cy
Advi
sory
Sub
-Com
C
ham
pion
GoK
cha
mpi
on (P
S or
AS
leve
l)
Stat
us
Year
1
Year
2
Year
3
Year
4
Year
5Q1 2019
Q2 2019
Q3 2019
Q4 2019
HY 1 HY 2
b. Plan change management programme Years 2-5
Continue rolling out change management programme
MoALF&I
Refine change management programme plan for Years 2-5 based on preliminary feedback
MoALF&I
c. Plan project governance for Years 2-5
MoALF&I, CoG
First semi-annual effectiveness review of NAIP flagships
ATO
Revise flagship design and implementation plan based on lessons learned from first semi-annual review
MoALF&I
Flagship 8 – Launch priority digital and data use cases for better decision making, research and performance management
Varies Private sector player
All PS CAS, PS Research & Extension
Objective: Invest in data and research for better decision making and improved accountability
Workstream 1 – Policy changes and enforcement
a. Pass legislation/policy to enable governance changes
Parliament, Office of the D.P.
Legislation change to impose penalties for noncompliance on data submission to KODI
Parliament, Office of the D.P.
Definition and dissemination of national standards for data collection, storage and open data sharing
Varies

119
A P P E N D I CE S
Impl
emen
ting
Org
aniz
atio
n/
Agen
cy
Advi
sory
Sub
-Com
C
ham
pion
GoK
cha
mpi
on (P
S or
AS
leve
l)
Stat
us
Year
1
Year
2
Year
3
Year
4
Year
5Q1 2019
Q2 2019
Q3 2019
Q4 2019
HY 1 HY 2
Workstream 2 – Data collection and sensitization for priority use cases
a. Conduct an Ag data diagnostic to identify data gaps and the owners of existing data
TBC, private sector or research player
Identify private sector partners for data collection
MoALF&I, MoICT
Train different stakeholders on data standards
MoICT
Revamp KODI and link it with ODC & GODAN
MoICT
Embark on data collection exercise with private sector partners
MoALF&I, MoICT
Complete the above steps as necessary to support additional data needs for transformation beyond priority use cases
MoALF&I, MoICT
Workstream 3 – Tighten links between research, extension and policy, informed by real-time performance data
a. Work with key research, extension and policy stakeholders to align on 2-3 priorities for collaboration for the year, relevant to the 9 flagships
MoALF&I and other stakeholders
Align on key research questions, inputs and desired output for these priority areas, as well as the precise locations where they will be tested
MoALF&I and other stakeholders

120
INVESTING IN KENYA’S AGRICULTURAL SECTOR TRANSFORMATION N A I P 2 0 1 9 - 2 0 2 4
Impl
emen
ting
Org
aniz
atio
n/
Agen
cy
Advi
sory
Sub
-Com
C
ham
pion
GoK
cha
mpi
on (P
S or
AS
leve
l)
Stat
us
Year
1
Year
2
Year
3
Year
4
Year
5Q1 2019
Q2 2019
Q3 2019
Q4 2019
HY 1 HY 2
Roll out priority research agenda areas, working with the digitally enabled extension workers detailed in flagship 7, the relevant state departments and global collaborators and academics. Ensure feedback loops exist to inform flagship implementation for the first 5 years, as well as the 2nd NAIP
Workstream 4 – Roll-out and monitoring
a. Develop, iterate and launch the tracking tools required for the priority use cases, integrating data from workstream 1
MoALF&I
Use these tools on an ongoing basis for decision making and performance monitoring, adjusting the tools as necessary
MoALF&I
Identify new use cases required based on current performance; and begin data collection process there
MoALF&I
b. Update KODI MoICT
Create an online payment capability for KODI and incentives to join the platform (e.g., online royalty programme)
MoICT
Define charges for data
MoICT
Upgrade infrastructure, continue trainings
Varies
Monitor data submissions and do quality checks on data
MoICT

121
A P P E N D I CE S
Impl
emen
ting
Org
aniz
atio
n/
Agen
cy
Advi
sory
Sub
-Com
C
ham
pion
GoK
cha
mpi
on (P
S or
AS
leve
l)
Stat
us
Year
1
Year
2
Year
3
Year
4
Year
5Q1 2019
Q2 2019
Q3 2019
Q4 2019
HY 1 HY 2
Flagship 9 – Monitor responses to key food system risks
Varies Private sector player
All PS AG
Objective: Ensure that sustainable and climate-smart natural resource management are implemented, and that responses to pest, climate and price shocks are well coordinated across different sectors
Workstream 1 – Design of sustainability action plan
a. Conduct sustainability diagnostic to identify full universe of needs and owners
TBC, private sector or research player
Identify team of multi-disciplinary experts to analyze results of diagnostic and draw up detailed design on interventions, resources needed and ownership
MoALF&I
Workstream 2 – Preparation and sensitization
a. Integrate recommendations from ASTGS (e.g., sustainability checklist, crisis management team) into the activities of the relevant government agency, ensuring that achieving the outcomes is included as part of the performance contracts of the heads of these agencies
MoALF&I, Mo Environment
Conduct training exercise for all stakeholders including communities
MoALF&I

122
INVESTING IN KENYA’S AGRICULTURAL SECTOR TRANSFORMATION N A I P 2 0 1 9 - 2 0 2 4
Impl
emen
ting
Org
aniz
atio
n/
Agen
cy
Advi
sory
Sub
-Com
C
ham
pion
GoK
cha
mpi
on (P
S or
AS
leve
l)
Stat
us
Year
1
Year
2
Year
3
Year
4
Year
5Q1 2019
Q2 2019
Q3 2019
Q4 2019
HY 1 HY 2
b. Begin pre-work on initiatives
MoALF&I
Begin implementation interventions as identified through stakeholder engagement across all flagships
MoALF&I
Identify 10 counties across the country in which to pilot soil testing (and other priority initiatives identified as part of soil management)
MoALF&I
Issue RFP and award contract to select private sector partner to conduct soil testing
MoALF&I
Roll out smart water meters for water level monitoring on all major water bodies in the country (and other initiatives identified as part of sustainable water basin management)
MoALF&I, MoW
c. Set up crisis management coordinating processes, with clear processes and SOPs across the required stakeholders (e.g., NDMA on global food price shocks)
MoALF&I
Workstream 3 – Scale-up and monitoring
a. Roll out initiatives (e.g., smart meters to other water bodies, soil testing, etc.) in the country
MoALF&I
Monitor results and upload to KODI
MoALF&I, MoICT
Integrate data from across the flagships into crisis management cadences, escalating issues as necessary to ensure coordination at the right level (e.g., county-level responses to FAW)
MoALF&I

123
A P P E N D I CE S
APPENDIX 2 – ONGOING AND PLANNED GOK PROJECTS Appendix 2: Ongoing and planned GoK projects in the agricultural sector
There are 357 ongoing and planned projects in the agricultural sector in Kenya, handled by different ministries, departments, agencies and other organizations. To align these with the ASTGS and streamline the Ministry’s future development projects, MoALF&I has begun the process of prioritizing these projects based on the ASTGS focus areas. As the ASTGS is translated from a strategy into implementation programmes, these other ongoing and planned projects will either be included as part of the flagship programmes, implemented separately, or deprioritized. The budget originally intended for the deprioritized projects will then be reallocated accordingly.
The tables below show mapping of these projects by NAIP flagship, to indicate which can potentially be included as part of the flagships’ implementation programmes. Note that some existing projects can align to more than one flagship, especially with respect to the enablers. During implementation, MoALF&I will need to rationalize the allocation of projects as necessary.
Programmes and projects that relate most closely to flagship 1 (small-scale production and SMEs)
Programme/project title GoK Development partner Other applicable flagships
Smallholder Irrigation Programme Yes Various
National Water Harvesting and Ground Water exploration
Yes
Smallholder Horticulture Empowerment Project for Local and Upscaling (SHEP-Plus)
Yes JICA
Strengthening Fertilizer Quality and Regulatory Standards
Yes AGRA
Small-scale Irrigation Programme Mt Kenya Region –(SIPMIK)
National Accelerated Agricultural Inputs Access Programme
Yes
Rehabilitation of Fish Landing sites in Lake Victoria (namely Sori in Migori, Nyandiwa in Homa Bay, Mulukhoba in Busia, Wichlum in Siaya, Lwanda K’Otieno in Siaya and Ogal in Kisumu County)
Yes
Development of Fish Quality Laboratories Yes Government of Spain
Kenya Marine Fisheries and Socio-Economic Develop-ment (KEMFSED)
Yes World Bank
Upgrading of New KCC Yes
Waiver of Debt owed by Stegro SACCO to Co-operative Bank
Yes
Waiver of Debt owed by Kipkelion District Union to Commodity Fund
Yes
Waiver of debt owed by Banyala Fishermen Co-op to AFC
Yes
Establishment of Co-operative Development Fund Yes
Cotton Yes
Athi-River Tier 1 Retail Market Yes
Maragua Wholesale Hub Yes
Small-scale Horticulture Empowerment Promotion Proj-ect for Local Upscaling (SHEP-PLUS)
Yes JICA
Small-scale Irrigation & Value Addition Project (SIVAP) AfDB; FAO

124
INVESTING IN KENYA’S AGRICULTURAL SECTOR TRANSFORMATION N A I P 2 0 1 9 - 2 0 2 4
Programme/project title GoK Development partner Other applicable flagships
National agriculture and rural growth inclusive project Yes
Standard and market access project Yes
Small-scale Horticulture Empowerment Programme for Local Upscaling (SHEP-PLUS)
Yes JICA
Improved access to coconut hybrids (seed nuts) from India
The Seed Cane Multiplication and Distribution Framework
Yes
Infrastructure improvement in sugar cane growing areas EU
Installation of Cane Testing Units Yes
Cotton Victoria Project, BRA/12/002-S007 Government of Brazil
FOODSCAP Project Yes USAID
Improved Food Safety, Quality and Value Addition in the Dairy and Horticulture Sector
Yes
Maize Seed Production
Other Seed Crops (Wheat, Pasture and Sorghum)
Establishment of semen production centre – Kitale Yes
Enhanced seed potato production Yes
Sub-contracting and Partnership Exchange
Seasonal Crop Credit Scheme JICA
Improving access to agricultural finance by smallholder farmers in Bura Irrigation Scheme
AGRA
Programme For Rural Outreach of Financial Innovation Technologies (PROFIT)
NT & IFAD
Programme for Livestock production Yes
Financing for Agricultural SMEs Yes
Programme for Horticulture and Floriculture Credit Yes
Financing establishment of permanent crops Yes
Financing farm infrastructure Yes
Financing New and Reconditioned Machinery Credit Yes
Wholesale lending through SACCOs Yes
Establishment of liquid nitrogen plants Yes
Establishment of dairy goat Artificial Insemination and Multiplication Centre
Yes
Invitro Embryo Production (IVEP) World Bank; Government of China
Pig Breeding & A.I. Services Yes
Indigenous Chicken Upgrading Yes
Kimira-Oluch Small-scale Farm Improvement Project (KOSFIP)
Yes
Improved indigenous chicken breeding, multiplication and dissemination
Yes EU
Formulation, testing and promotion of feeds for improv-ing indigenous chicken productivity under semi-inten-sive/intensive production systems
Government of Korea

125
A P P E N D I CE S
Programme/project title GoK Development partner Other applicable flagships
Enhancing indigenous poultry production and marketing systems for poverty alleviation and improved food security among small-scale households: A case of model village development in Central and Eastern Kenya
Government of Korea
Insects for Food and Feed (INSFEED) IDRC
Production, utilization and on-farm upscaling of sweet Lupin cultivars as feed for small-scale dairy cattle production
USAID
Identification, evaluation and promotion of alternative forages to support smallholder dairy production in Western Kenya
USAID
Molasses urea mineral blocks for feed supplementation USAID
Rift Valley Fever diagnostic test evaluation in Kenya USDA
Enhancing production, processing and marketing of mangoes in Bungoma (Western), Taita Taveta (Coast) and Marakwet (Rift Valley) counties of Kenya for increased household income
USAID
Develop and supply clean seedlings of horticultural crops
USAID
Promotion and deployment of IPM strategies in passion fruit production systems in North Rift Region of Kenya
USAID
Promoting modern citrus production and post-harvest techniques in Taita-Taveta, Baringo, and Elgeyo Marakwet
USAID
Kenya Seed Unit Operations Yes
Sugar Reforms support project Yes EU
Seed Cane Multiplication and Distribution Yes
Support for improvement of added value to coffee "Coffee Value Addition Support (CVAS) Project"
AFD
Business Incubators for African Women (BIAWE)
PROFIT
FtMA
East Africa Potato Consortium – Technoserve and National Potato Council
Enhancing Inclusive Grain Supply Chain Development in Kenya
Agribusiness Investment for Market Stimulation
Enhancing Structured Grain Trade for Smallholder Farmers in Eastern Africa
CTA - Netherlands
Mango Value Chain Project Yes 3

126
INVESTING IN KENYA’S AGRICULTURAL SECTOR TRANSFORMATION N A I P 2 0 1 9 - 2 0 2 4
Programmes and projects that relate most closely to flagship 2 (Small-scale production and subsidies)
Programmes and projects that relate most closely to flagship 3 (agro-processing)
Programme/project title GoK Development partner Other applicable flagships
Ndeiya Karai food Security Project Yes
GoK Subsidized Fertilizer Yes
AFC/SDF Agency Programme Yes
Programme/project title GoK Development partner Other applicable flagships
Exploitation of Marine resources Yes Government of Spain
Agro-Processing and Agro-Industrial Park (Agropolis) Yes
Aquaculture mini processing plants Yes
Proposed Gatitu Tea Factory
Partnership for Investment and Growth for Africa ITC; DFID; CCPIT; CAD Fund
Textile Development Yes
Muhoroni Agro-Industrial Park Project Yes
Upscaling of LBDC – Rice Mill Yes
Upscaling of LBDC- Rice Mill Yes
Improving Livelihoods by Increasing Livestock Production in Africa (ILIPA): An agribusiness model to commercially produce high-quality insect-based protein ingredients for chicken, fish and pig industries
Government of the Netherlands
Upgrading artisanal nyirinyiri processing technologies in North Kenya for enhanced equality, safety and market access
Utilization of food processing wastes for the development of high-value products
Yes
Development of hypertensive tea
Laboratory-scale synthesis of carboxyl metal cellulose from agro-waste
Yes
Contracted Technical Services in Cotton Production and Value Addition
Yes 1
Plant upgrade/Modernization Yes 1
Production of hides and skin for the leather industry
Yes 1, 6
Development of Leather Industrial Park Yes 1, 6
Blue economy – Seaweed value addition in Kibuyuni, Kwale
Yes 1, 6
Mango Value Chain Project Yes 1, 2

127
A P P E N D I CE S
Programmes and projects that relate most closely to flagship 4 (large-scale commercial production)
Programmes and projects that relate most closely to flagship 5 (Strategic Food Reserve)
Programmes and projects that relate most closely to flagship 6 (ASAL resilience)
Programme/project title GoK Development partner Other applicable flagships
National Land Reclamation Policy and Bill 2018 Yes GiZ
Commercial maize Yes
High Grand Falls Multipurpose Dam Yes Private sector
Magwagwa Multipurpose Dam project Yes
Enhancing intensive commercial vegetable farming through greenhouse production systems in diverse AEZs of Kenya
USAID
Nandi Multipurpose Dam project Yes
Programme/project title GoK Development partner Other applicable flagships
Strategic food reserve Yes
Warehouse modernization at Kenya National Training Corporation (KNTC)
Yes
Establishment of Commodity Exchange Platform Yes
Lake Victoria Environmental Management Project 111 World Bank
Kenya Cereal Enhancement Project (KCEP) EU; IFAD
Programme/project title GoK Development partner Other applicable flagships
Turkana Irrigation Development Programme Yes
Turkana Rehabilitation Programme Yes WFP, UNDP
Garissa Rehabilitation Programme Yes WFP, UNDP
Thwake Multipurpose Development Programme Yes AfDB
Agriculture Sector Development Support Programme (ASDSP) II
SIDA
Drought Resilience and Sustainable Livelihood Programme in the Horn of Africa (DRSLP)
Yes AfDB
Kenya Cereals Enhancement Project (KCEP) Yes EU; IFAD; EBL; private sector
Food Security and Crop Diversification Project
Crop Insurance Yes World Bank
Livestock Insurance Scheme Yes
Construction and Refurbishment – Sheep & Goat Breeding Farms
Yes
Modernization and Rehabilitation of Kenya Meat Commission (KMC)
1, 3
Regional Pastoral Livelihoods Resilience Project
Establishment of Disease Free Zone (DFZ)
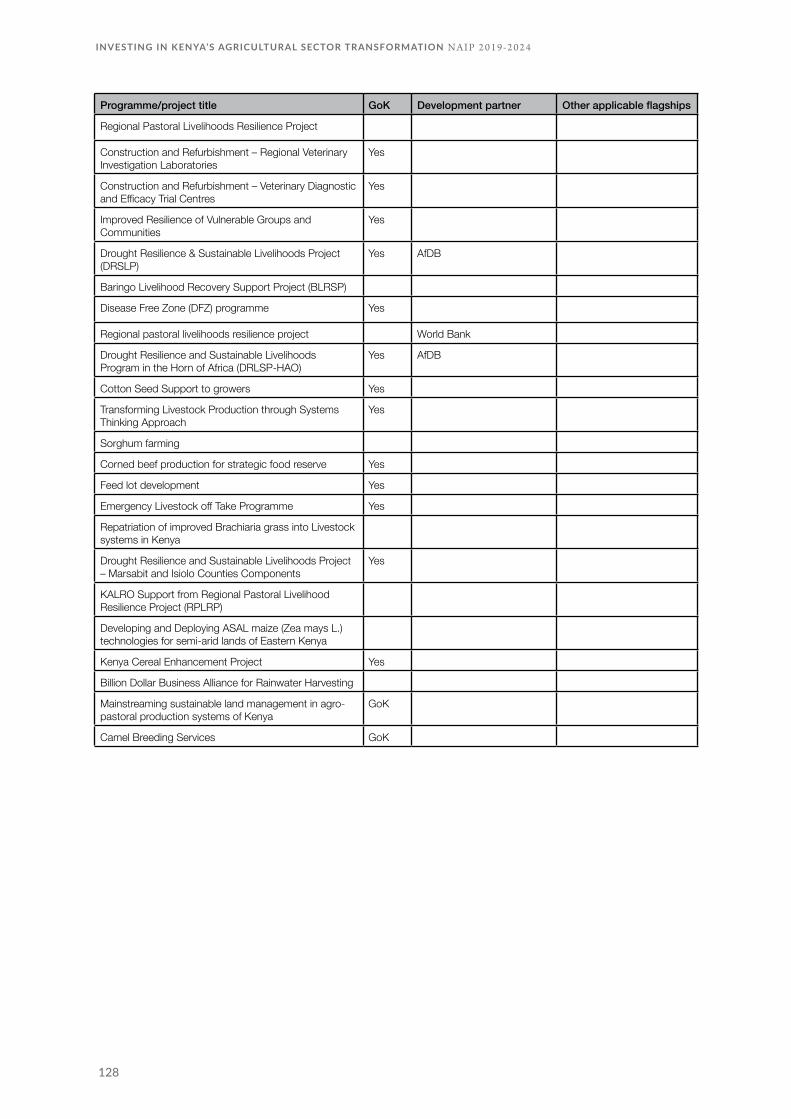
128
INVESTING IN KENYA’S AGRICULTURAL SECTOR TRANSFORMATION N A I P 2 0 1 9 - 2 0 2 4
Programme/project title GoK Development partner Other applicable flagships
Regional Pastoral Livelihoods Resilience Project
Construction and Refurbishment – Regional Veterinary Investigation Laboratories
Yes
Construction and Refurbishment – Veterinary Diagnostic and Efficacy Trial Centres
Yes
Improved Resilience of Vulnerable Groups and Communities
Yes
Drought Resilience & Sustainable Livelihoods Project (DRSLP)
Yes AfDB
Baringo Livelihood Recovery Support Project (BLRSP)
Disease Free Zone (DFZ) programme Yes
Regional pastoral livelihoods resilience project World Bank
Drought Resilience and Sustainable Livelihoods Program in the Horn of Africa (DRLSP-HAO)
Yes AfDB
Cotton Seed Support to growers Yes
Transforming Livestock Production through Systems Thinking Approach
Yes
Sorghum farming
Corned beef production for strategic food reserve Yes
Feed lot development Yes
Emergency Livestock off Take Programme Yes
Repatriation of improved Brachiaria grass into Livestock systems in Kenya
Drought Resilience and Sustainable Livelihoods Project – Marsabit and Isiolo Counties Components
Yes
KALRO Support from Regional Pastoral Livelihood Resilience Project (RPLRP)
Developing and Deploying ASAL maize (Zea mays L.) technologies for semi-arid lands of Eastern Kenya
Kenya Cereal Enhancement Project Yes
Billion Dollar Business Alliance for Rainwater Harvesting
Mainstreaming sustainable land management in agro-pastoral production systems of Kenya
GoK
Camel Breeding Services GoK

129
A P P E N D I CE S
Programmes and projects that relate most closely to flagship 7 (knowledge and skills building)
Programmes and projects that relate most closely to flagship 8 (data and research)
Programme/project title GoK Development partner Other applicable flagships
Construction and Refurbishment – Regional Pastoral Training Centre
Yes
Equipping Refurbishment and Construction of Training Facility – Kiboko
Capacity building for law enforcers Yes
Transboundary coastal processes and human resource utilization patterns as a basis for a Kenya-Tanzania conservation area initiative (Trans-Coast)
Yes VLIR-UOS
Supporting an integrated approach for marine pollution monitoring using nuclear analytical techniques training
IAEA
Building a strategic framework for aquaculture education in Kenya
VLIR-UOS
Development and dissemination of proven feed rations for enhanced small-scale dairy production in Nyamira and Bungoma Counties in Kenya
USAID
Improvement of reproductive performance among smallholder dairy farms in selected counties in Kenya
USAID
Establishment of seed (cuttings) system, promotion of field production and utilization of cassava and sweet potato in semi-arid Kenya
USAID
Training farmers on good nursery management USAID
Farmer capacity building on good agricultural practices USAID
Mentorship Programme YPARD; AWARD
On-farm Hands-on trainings and Capacity Building for Kenya Youth in Agriculture
YPARD; AWARD
AGRIFI-MESPT EU 1, 9
UNEP-GEF project for sustainable capacity building for effective participation in the BCH (BCH III)
UNEP 9
Capacity Building and Technology transfer Yes 9
Programme/project title GoK Development partner Other applicable flagships
Aquaculture Technology Development and Innovation Transfers
Yes
Research, Technology and Innovation Laboratories and Related Infrastructure at Kisumu
Yes
Digitalization Co-operative Management Information System
Yes
Establishment of E-Trade Portal Yes
Baseline survey on counterfeiting Yes
Anti-Counterfeit Agency Quick Response (QR) solution Yes
Enforcement Case Management System Yes
Acquisition and Installation of CAT 3 Automatic Weather Stations (AWS) Phase V
Yes
Agribusiness value chain systems for agricultural products

130
INVESTING IN KENYA’S AGRICULTURAL SECTOR TRANSFORMATION N A I P 2 0 1 9 - 2 0 2 4
Programme/project title GoK Development partner Other applicable flagships
Harmonization of applications in the agricultural sector
Traceability of livestock and livestock products
Science & Technology Research Partnership for Sustainable Development (SATREPS)
JICA
National Traceability USAID; HCD
Join the E-trade portal managed by KenTrade Network Agency under the National Treasury
Yes
Construction and equipping of a Referral National Dairy Laboratory
Yes
The SOCBIO Afri project “Addressing the societal challenges of biotechnology in Africa: towards balanced innovation”
Yes
Provision of Standards-based solutions that promote Innovation, Trade and Quality Life
Yes
National Information Platform for Food and Nutrition (NIPFN)
EC; DFID; BMGF
Regulatory impact assessment of the Coffee (General) Regulations, 2018
Yes
Poverty dynamics: Kenya country study case ODI
Regulatory impact assessment of the Coffee (General) Regulations, 2018
Yes
Agri benchmark Global Networks GUG
National Agriculture and Rural Inclusive Growth Project (NARIGP)
Yes
Regulatory impact assessment of the Sugar (General) Regulations, 2018
Yes
Development of 3 new maize varieties: H12ML1, H13ML1 and WEII01
Private sector
Seed quality improvement on maize varieties H624, H520 and H6218
Private sector
Regional Demonstration and Technology Development Centres
Yes
Socio-ecological assessment of fisheries in three estuarine systems of SWIO
Yes
Concept Proposal and Terms of Reference (ToR) for Electronic Fish Market Information System (EFMIS) Project Upscaling
Pesticides assessment in L. Victoria (PhD project) Yes
Feed inventory and documentation of dairy feeding management practices and technologies
IFAD
Determination and control of residues and contaminant levels in milk for improved health and productivity of animals and humans
USAID
Assessment of adoption and impact of improved dairy technologies
USAID
Conduct research to identify options for integrated control of maize lethal necrosis disease (MLND)
USAID
Develop MLND-resistant maize varieties. USAID
WEMA – Water-efficient Maize for Africa AATF/CIMMYT
SATREPS – project on rice research for tailor-made breeding and cultivation technology development in Kenya
Yes JICA

131
A P P E N D I CE S
Programmes and projects that relate most closely to flagship 9 (sustainability)
Programme/project title GoK Development partner Other applicable flagships
Improvement of Research Infrastructure in Kenya at KALRO – Mwea
Government of Japan
Sericulture Research Yes JICA
Construction and equipping tea research and development factory
Yes
Tea, sugar and coffee research Yes
Programme of Accompanying Research for Innovation (PARI)
FARA
Development of claim enzymatic technologies for leather processing
Yes
Adaptation and promotion of refractance window drying technology for production of high-quality bio products
Strengthening Food Grains Market Systems in Eastern and Southern Africa
SIDA
Programme/project title GoK Development partner Other applicable flagships
Sustainable Smallholder Irrigation Development and Management
Yes
Land Degradation Assessment (LADA) Yes
Land Reclamation (Land Degradation Assessment Programme)
Yes
Bee Bulking Project – Apiculture and Emerging Livestock Services
Yes
Establishment of a Bull Station at ADC Sabwani Complex (Construction)
Yes
Construction and Refurbishment – Foot & Mouth Disease National Reference Laboratory
Yes
Upgrade of Foot and Mouth Disease Laboratory – Kevevapi
Yes
Tsetse Eradication – KENTTEC Yes
Monitoring, Control and Surveillance Centre Yes
Aquaculture Business Development Yes IFAD
Imarisha Lake Naivasha catchment and ecosystems Yes
Kenya Cereal Enhancement Project & Kenya climate-resilient agricultural livelihoods project – KCEP-CRAL
Yes EU; IFAD; FAO
Bulking of pyrethrum superior clones and varieties
Pesticide Management Initiative East African Region: Kenya
Government of Netherlands
Establishment of a fully functional state-of-the-art Biosafety Level 2 molecular laboratory
Yes
Construction of the state-of-the-art GMO testing and reference laboratory
Yes
Resilience measures to mitigate the impact of drought and floods in Kenya
Yes
Regional assessment of agricultural production, climate change, trade and food security
UNECA-ACPC
Seed self-regulation Yes

132
INVESTING IN KENYA’S AGRICULTURAL SECTOR TRANSFORMATION N A I P 2 0 1 9 - 2 0 2 4
Programme/project title GoK Development partner Other applicable flagships
Mau & Embobut buffer establishment project Yes
Supply, delivery, distribution, testing and commissioning of laboratory equipment
Yes
Supply, delivery, distribution, testing and commissioning of liquid nitrogen plant
Yes
Tsetse and trypanosomiasis eradication programme Yes
Disease Free Zoning Programme Yes
Enhancing capacity for semen production and preservation through laboratory upgrading
Yes
Environmental Conservation Programmes Yes
Bio-economy technology facilitation and transfer program in Kenya
Yes
Responses of Biological Productivity and Fisheries to Changes in Atmospheric and Oceanographic Conditions in the Upwelling Region Associated with the East African Coastal Current
Yes
Africa Centre of Excellence for Water Management World Bank
GEF Blue Forest Project GEF-UNEP
Cyanobacteria and algal bloom in L. Victoria, Kenya Yes USAID
Drivers of phytoplankton community structure and their toxicity in Kisumu Bay, Lake Victoria, Kenya
Yes USAID
Which river catchment pollutes Lake Victoria, Kenya the most? A proof of concept for management implications
Yes
The Potential for Aquaculture in Lake Victoria and Implications for wild fisheries and fish commodity markets
Yes USAID
Lake Victoria aquaculture: Pathway to food security in Kenya
Newton Fund, UK
Baseline Aquatic Ecosystem Survey for New Nairobi-Mombasa Expressway
Yes
The potential for aquaculture in Lake Victoria and implications for wild fisheries and fish commodity markets
Yes USAID
Life History Strategy Patterns of Selected Fish Species in the River Kuja-Migori Basin in South Western Kenya
Yes
Sustainable New Ingredients to Promote Health (SNIPH) – Project partners UK, KMFRI, Tanzania and India
Newton Fund, UK
Development of a thermo-stable CBPP sub-unit vaccine IDRC
Production of an ECF – Marikebuni vaccine batch USAID
Surveillance and Molecular Epidemiology of Newcastle disease (NCD) in Kenya
USDA
Development of a sub-unit vaccine for Rift Valley Fever USAID
Development of PPR sub-unit vaccine USAID
Development of Improved Diagnostics for Capripoxvirus Infections
African Bioscience Challenge fund
Development of improved nutritional quality feed/fodder using novel rumen microflora
USAID
Optimizing small-scale biogas technology for household energy and improvement of soil fertility within coffee-dairy production systems in Kiambu and Machakos Counties
Yes

133
A P P E N D I CE S
Programme/project title GoK Development partner Other applicable flagships
Evaluation of socio-economic impacts of selected livestock diseases
USAID
Participatory Evaluation of Cowpea Elite Lines for Adaptability and yield performance in Semi-Arid region of Kenya
USAID
Develop new bacterial wilt-resistant potato varieties for the market and avail to 500 farmers
USAID
Promotion, conservation and utilization of native horticultural and medicinal genetic resources for improved livelihood and economic development
USAID
Establishing effective Integrated Pest Management (IPM) system for key pests of horticultural crops in Kenya
USAID
Biological Control of Water Hyacinth in Lake Victoria World Bank
Global rust initiative for wheat (2015) BMGF
Aflasafe plant IITA
Management of MLN viruses causing vectors ASARECA
Global Environmental Fund Global Environment Fund
Sustainable Smallholder Irrigation Development and Management
Yes
Land Degradation Assessment (LADA) Yes
Land Reclamation (Land Degradation Assessment Programme)
Yes
Billion Dollar Business Alliance for Rainwater Harvesting
Bee Bulking Project – Apiculture and Emerging Livestock Services
Yes
Establishment of a Bull Station at ADC Sabwani Complex (Construction)
Yes
Construction and Refurbishment – Foot & Mouth Disease National Reference Laboratory
Yes
Upgrade of Foot and Mouth Disease Laboratory – Kevevapi
Yes
Tsetse Eradication – KENTTEC Yes
Monitoring, Control and Surveillance Centre Yes
Aquaculture Business Development Yes IFAD
Imarisha Lake Naivasha Catchment and ecosystems Yes
Integrated Programme to Build Resilience to Climate Change & Adaptive Capacity of Vulnerable Communities in Kenya
World Bank
Early warning systems in the agricultural sector
Kenya Cereal Enhancement Project & Kenya climate resilient agricultural livelihoods project – KCEP-CRAL
Yes EU; IFAD; FAO
Tsetse flies suppression project Yes
Mainstreaming sustainable land management in agro-pastoral production systems of Kenya
Yes
Bulking of pyrethrum superior clones and varieties Yes
Pesticide Management Initiative East African Region: Kenya
Government of the Netherlands
Establishment of a fully functional state-of-the-art Biosafety Level 2 molecular laboratory
Yes
Construction of the state of the art GMO testing and reference laboratory
Yes

134
INVESTING IN KENYA’S AGRICULTURAL SECTOR TRANSFORMATION N A I P 2 0 1 9 - 2 0 2 4
Programme/project title GoK Development partner Other applicable flagships
Resilience measures to mitigate the impact of drought and floods in Kenya
Yes
Regional assessment of agricultural production, climate change, trade and food security
UNECA-ACPC
Kenya Climate Smart Agriculture Project (KCSAP) World Bank
Seed self-regulation Yes
Mau & Embobut buffer Establishment Project Yes
Supply, delivery, distribution, testing and commissioning of laboratory equipment
Yes
Supply, delivery, distribution, testing and commissioning of liquid Nitrogen Plant.
Yes
Tsetse and trypanosomiasis eradication programme Yes
Disease Free Zoning Programme Yes
Enhancing capacity for semen production and preservation through laboratory upgrading
Yes
Climate Change Adaptation Yes
Environmental Conservation Programmes Yes
Bio-economy technology facilitation and transfer program in Kenya
Yes FAO
Responses of biological Productivity and Fisheries to Changes in Atmospheric and Oceanographic Conditions in the upwelling Region associated with the East African Coastal Current
Yes
Africa Centre of Excellence for Water Management World Bank
GEF Blue Forest Project GEF-UNEP
Cyanobacteria and algal bloom in L. Victoria, Kenya Yes USAID
Drivers of phytoplankton community structure and their toxicity in Kisumu Bay, Lake Victoria, Kenya
Yes USAID
Which river catchment pollutes Lake Victoria, Kenya the most? A proof of concept for management implications.
Yes
The Potential for Aquaculture in Lake Victoria and Implications for wild fisheries and fish commodity markets
Yes USAID
Lake Victoria aquaculture: Pathway to food security in Kenya
Newton fund, UK
Baseline Aquatic Ecosystem Survey for New Nairobi-Mombasa Expressway
Yes
The Potential for Aquaculture in Lake Victoria and Implications for wild fisheries and fish commodity markets
Yes
Enhancing Climate-Smart Aquaculture Technologies and Innovations towards Food Security and Sustainable Livelihoods in East and Southern Africa.
Yes World Bank
Life History Strategy Patterns of Selected Fish Species in the River Kuja-Migori Basin in South Western Kenya
Yes
Sustainable New Ingredients to Promote Health (SNIPH) – Project partners UK, KMFRI, Tanzania and India
Newton fund, UK
Breeding and conservation programmes for Sahiwal cattle genetic resources in Eastern Africa
AU-IBAR
Development of a thermo-stable CBPP Subunit vaccine IDRC
Production of an ECF – Marikebuni vaccine batch USAID

135
A P P E N D I CE S
Programme/project title GoK Development partner Other applicable flagships
Surveillance and Molecular Epidemiology of Newcastle disease (NCD) in Kenya
USDA
Development of a sub-unit vaccine for Rift Valley Fever USAID
Development of PPR sub-unit vaccine USAID
Development of Improved Diagnostics for Capripoxvirus Infections
African Bioscience Challenge fund
Development of improved nutritional quality feed/fodder using novel rumen microflora
USAID
Optimizing small-scale biogas technology for household energy and improvement of soil fertility within coffee-dairy production systems in Kiambu and Machakos Counties
Yes
Evaluation of socio-economic impacts of selected livestock diseases
USAID
Development, deployment and commercialization of genetically and agronomic superior highland maize varieties in the high potential region of Western Kenya and Rift Valley (HR1)
USAID
Participatory Evaluation of Cowpea Elite Lines for Adaptability and yield performance in Semi-Arid region of Kenya
USAID
Develop new bacterial wilt-resistant potato varieties for the market and avail to 500 farmers
USAID
Promotion, conservation and utilization of native horticultural and medicinal genetic resources for improved livelihood and economic development
USAID
Establishing effective Integrated Pest Management (IPM) system for key pests of horticultural crops in Kenya
USAID
Biological Control of Water hyacinth in Lake Victoria World Bank
Global rust initiative for wheat (2015) BMGF
Aflasafe plant IITA
Management of MLN viruses causing vectors ASARECA
Global Environmental Fund Global Environmental Fund

136
INVESTING IN KENYA’S AGRICULTURAL SECTOR TRANSFORMATION N A I P 2 0 1 9 - 2 0 2 4
APPENDIX 3 – METRICS FOR TRANSFORMATION READINESS Appendix 3: Metrics for agricultural transformation readiness
What to look for Hypothesis Data source
Esse
ntia
l ena
bler
s
Com
mitm
ent
1. High government expenditures on agriculture
Countries committed to agricultural transformation will increase spending to drive transformation.
ReSAKSS
2. Agricultural transformation is a high priority of head of state
Head of state and other top leaders must show high commitment to transformation for true change to occur.
Expert survey
3. Agricultural policy is driven by evidence more than politics
Commitment to agricultural transformation entails difficult trade-offs that may not be made if politics are the main decision driver.
Expert survey
Follo
w-t
hrou
gh
4. Agricultural plan has basic building blocks
Several basic building blocks are critical components of an effective agricultural plan.
Assessment of ag plans
5. High % of agricultural budget disbursed
Countries committed to agricultural transformation follow through on budgetary commitments.
MAFAP
6. High % of budget spent on enablers (public goods such as feeder roads, R&D, etc.)
Infrastructure, R&D and building human capital facilitate transformation more than subsidies, for example.
MAFAP
7. Demonstrated commitment Several basic building blocks are critical components of an effective agricultural plan.
Assessment of ag plans
Resp
onsi
vene
ss
8. Governance model allows agriculture ministry to make policy changes
Agriculture ministry needs a sufficient level of authority to change course when required.
Expert survey
9. Willingness to adapt transformation strategy based on evidence
Transformation relies on decision-makers open to external policy expertise to shape strategy (especially subsidies, tariffs, land, and irrigation) based on evidence.
Expert survey
10. Effective process to coordinate national and local agricultural strategy
Agricultural transformation requires national and local alignment on strategic priorities.
Expert survey
Build
imm
edia
tely
11. Performance tracking exists for country agricultural strategy
For transformation to occur, consequences must exist when agricultural performance targets are not met.
Expert survey
12. Effective delivery of agricultural goods and services
A civil service that effectively delivers public goods and services is a key enabler of agricultural transformation.
Millennium Challenge Corporation and expert survey
13. Consultation process across government, donors and private sector
Government, donors and private sector must work together to facilitate agricultural transformation.
Expert survey
14. Capacity of ministries to coordinate agricultural policies
A demonstrated ability to collaborate across ministries is a key enabler of agricultural transformation.
Expert survey
15. Ability to make evidence-based Agricultural transformation requires national and local alignment on strategic priorities.
Expert survey

137
A P P E N D I CE S
What to look for Hypothesis Data source
Build
imm
edia
tely
16. Presence of sufficient storage infrastructure
Adequate crop storage is a key enabler of agricultural transformation.
EIU
17. Attractive rural business environment
Businesses need to be able to grow and flourish to enable transformation.
IFAD
18. Good legal and regulatory framework for agricultural credit
Credit is an essential ingredient to grow rural business and link small-scales to input/output markets.
World Bank’s Enabling the Business of Agriculture score
19. Good legal and regulatory framework for seed
Smart seed regulation can ensure timely introduction of improved varieties to market.
World Bank’s Enabling the Business of Agriculture score
20. Good legal and regulatory framework for fertilizer
Smart fertilizer regulation can ensure timely marketing of new fertilizers.
World Bank’s Enabling the Business of Agriculture score
Build
ove
r tim
e
21. High rate of literacy Basic education requirements are necessary to facilitate technology adoption and agribusiness development.
UNESCO
22. High rate of rural electrification Reliable electricity in rural areas is a key enabler of agricultural transformation.
WDI
23. High rate of rural telephony infrastructure
The ability to stay connected in a rural setting is an enabler of agricultural transformation.
WDI
24. Sufficient port infrastructure As countries increase commercialization and exports, transformation will slow if ports are poor.
EIU
25. Sufficient road infrastructure Inadequate transportation infrastructure will slow/stall transformation by retarding market performance.
EIU


139
R E F E R E N CE S
R E F E R E N C E S
Note: This set of references should be viewed in conjunction with the broader set of ~250 references in the ASTGS that informed much of the working team analysis that underpins this NAIP
1 Fourth Schedule of the Constitution of Kenya, 20102 Ministry of Agriculture, Livestock and Fisheries, Agriculture Joint Sector Review Assessment for
Kenya, Nov 20173 Expert source, Centre for Agricultural Transformation, January 20184 Kenya Economic Survey 2017, Kenya National Bureau of Statistics (Range is due to use of 2009
constant or 2016 current prices that are still subject to revision)5 Economic Survey 2017, Quarterly Gross Domestic Product Report 2017 Q1 Statistical Release
KNBS; World Bank Development Indicators (2016), http://databank.worldbank.org/data/home.aspx
6 Ibid 7 “Agriculture, Value Added (annual % growth)”, World Development Indicators, https://data.
worldbank.org/; “Country profile – Senegal”, New Agriculturist, http://www.new-ag.info/en/country/profile.php?a=530
8 “Employment in agriculture (% of total employment) (modelled ILO estimate)”, Employment to population ratio, 15+, total (%) (modelled ILO estimate)”, and “Population, total”, World Bank Development Indicators (2016), http://databank.worldbank.org/
9 “Agriculture value added per worker (constant 2010 US$)”, World Development Indicators, World Bank, https://data.worldbank.org/.
10 Kenya Demographic and Health Survey, 201411 Ibid 12 Op cit. Kenya Economic Survey 201713 United Nations Statistical Division. (2013) http://comtrade.un.org/ 14 “Crop Tables”, Africa Postharvest Losses Information System, https://www.aphlis.net15 McKinsey Center for Agricultural Transformation and Food Security, Readiness for Agricultural
Transformation, November 201716 Government expenditure on agriculture, FAO, http://www.fao.org/economic/ess/investment/
expenditure/en/17 “Consolidated County Budget Implementation Review Reports”, Controller of Budget, http://
cob.go.ke/publications/consolidated-county-budget-implementation-review-reports/; Meeting with the County Finance Directors, February 9 2018
18 Kenya Economic Survey 2017; Maize value chain analysis, USAID-KAVES, September 2014; Team Analysis
19 World Bank Development Indicators (2017), https://data.worldbank.org/country/kenya

140
INVESTING IN KENYA’S AGRICULTURAL SECTOR TRANSFORMATION N A I P 2 0 1 9 - 2 0 2 4
20 Nikos Alexandratos and Jelle Bruinsma, World agriculture towards 2030/2050: the 2012 revision; FAO (2006), World agriculture: towards 2030/2050 – Interim Report
21 Amarendra Sahoo and James Thurlow, Identifying Priority Value-Chains in Kenya, IFPRI-IFAD, February 2018, Draft for Comment
22 A CGE analysis to support “The Agriculture Sector Growth and Transformation Strategy”, JRC-MAFAP, February 2018, Draft for Comment
23 “Grain Storage Facilities Within EAC”, Eastern African Grain Council, http://ratin.net/site/grain_storage
24 Cristina Manfre and Caitlin Nordehn, Exploring the Promise of ICT for Women Farmers in Kenya, Feed the Future, Aug 2013
25 “Cost of Tarmac Roads in Kenya”, A4Architect, https://www.a4architect.com/2014/06/cost-tarmac-roads-kenya/
26 Expert interviews, Kenya Power, March 201827 Ministry of Agriculture and Irrigation, 2017 Progress Report to the January 2018 AU Assembly,
Jan 201828 “Shanghai Poverty Conference: Case Study Summary, Mexico’s Oportunidades Program”,
World Bank, http://web.worldbank.org/archive/website00819C/WEB/PDF/CASE_-62.PDF 29 FAO MAFAP Public Expenditure Database (2016), http://www.fao.org/in-action/mafap/home/
en/ 30 TBC, Treasury on cuts. Allocation for 2018/2019 is KES 320 billion for the counties, from a
budget of KES 2.1 trillion – Budget Policy Statement (Draft 2018/2019)31 Agriculture Rural and Urban Development (ARUD) Sector Report, National Treasury, 2012-2017;
Government of Kenya, Budget Policy Statement 2018/1932 The Supplementary Appropriation (No. 3) Act, 2017, Kenya Gazette Supplement No. 159 (Acts
No.33), Nairobi, 16th October 2017