INVESTIGATION OF THE PROPERTIES OF CARBON FIBER
MODIFIED ASPHALT MIXTURES
By
M. AREN CLEVEN
A THESIS
Submitted in partial fulfillment of the
requirements for the degree of
MASTER OF SCIENCE IN CIVIL ENGINEERING
MICHIGAN TECHNOLOGICAL UNIVERSITY
© 2000 M. Aren Cleven

This thesis, “Investigation of the Properties of Carbon Fiber Modified Asphalt Mixtures”
is hereby approved in partial fulfillment of the requirements for the degree of MASTER
OF SCIENCE IN CIVIL ENGINEERING.
DEPARTMENT: Civil and Environmental Engineering
______________________________________________
Thesis Advisor: Thomas J. Van Dam
______________________________________________
Department Chairman: C. Robert Baillod
Date:__________________________________________

ABSTRACT
Scientists and engineers are constantly trying to improve the performance of asphalt
pavements. Modification of the asphalt binder is one approach taken to improve
pavement performance. It is thought that the addition of fibers to asphalt enhances
material strength and fatigue characteristics while adding ductility. Because of their
inherent compatibility with asphalt cement and excellent mechanical properties, carbon
fibers might offer an excellent potential for asphalt modification.
To investigate the behavior of carbon fiber modified asphalt (CFMA) mixtures, a two
phase study sponsored by Conoco, Inc. was conducted at Michigan Technological
University (MTU). The first phase, known as Phase 0, was a preliminary study used to
determine the feasibility of modifying the behavior of a standard asphalt concrete (AC)
mixture through the use of pitch-based carbon fibers. This study focused strictly on the
ability of mixing and compacting mixtures made with CFMA to achieve statistically
significant improvements in the mechanical properties of the mixture.
The second phase in the CFMA study is referred to as Phase 1. The purpose of this phase
was to identify and better understand the factors that affect the behavior of CFMA. Fiber
surface treatment and type were evaluated as well as ways to preserve fiber length.
Carbon fiber modified asphalt mixtures were expected to show increased stiffness and
resistance to permanent deformation. Fatigue characteristics of the mixture were
expected to improve with the addition of discrete carbon fibers, and because of the high
tensile strength of carbon fibers, the cold temperature behavior of CFMA mixtures was
anticipated to improve as well. Carbon fiber modified asphalt was expected to produce a
higher quality AC mixture for pavement applications.
Asphalt concrete samples were prepared and tested to evaluate the various mixture
characteristics that were expected to improve with the addition of carbon fibers. These
results were compiled and statistically analyzed for changes between control and
modified samples. The testing of carbon fiber modified asphalt concluded that:
• Carbon fibers should be blended with asphalt binder before mixing with aggregate to
achieve complete coating and even distribution of fibers throughout the mixture.
• The length of carbon fibers in the final mixture is critical. Methods of preserving the
fiber length while mixing with aggregate must be investigated.
• The quality of the initial asphalt mixture is a key factor. Higher quality base mixtures
showed little to no improvement, while the lower quality mixtures showed significant
improvements in the performed tests.
• Asphalt cement grades may affect the behavior of CFMA mixtures in different ways.
• The addition of carbon fiber improves the high temperature behavior of the asphalt
binder. If the test temperature does not reach the high binder grade temperature, the
effects of the fibers may be masked by binder behavior.
• The low temperature behavior of CFMA mixtures may be dominated by the binder
until it begins to fail, at which time the fibers have an impact on the behavior.
The results and opinions presented in this thesis are those of the author alone and in no
way reflect those of Conoco Incorporated.

i
TABLE OF CONTENTS
TABLE OF CONTENTS ..................................................................................................... i
LIST OF FIGURES............................................................................................................iii
LIST OF TABLES ............................................................................................................. iv
ACKNOWLEDGEMENTS ............................................................................................... iv
CHAPTER 1: INTRODUCTION ....................................................................................... 1
CHAPTER 2: BACKGROUND AND LITERATURE REVIEW...................................... 3
2.1 General Fiber Studies ................................................................................................ 3
2.2 Specific Studies ......................................................................................................... 6
2.2.1 Polypropylene Fiber ........................................................................................... 6
2.2.2 Polyester Fibers .................................................................................................. 6
2.2.3 Asbestos (Mineral) Fiber.................................................................................... 7
2.2.4 Cellulose Fiber ................................................................................................... 7
2.3 Summary of Literature Review ................................................................................. 8
2.4 Carbon Fibers ............................................................................................................ 9
CHAPTER 3: MIXTURE CHARACTERIZATION ........................................................ 10
3.1 Diametral Resilient Modulus Test........................................................................... 10
3.2 Repeated Load Deformation ................................................................................... 13
3.3 Flexural Beam Fatigue Tests................................................................................... 15
3.4 Indirect Tensile Strength Tests................................................................................ 17
CHAPTER 4: CFMA PHASE 0 STUDY ......................................................................... 20
4.1 Experimental Design ............................................................................................... 20
4.2 Mixture Design........................................................................................................ 22
4.3 Mixture Preparation................................................................................................. 24
4.3.1 Fiber Preparation .............................................................................................. 24
4.3.2 Blending of Carbon Fiber and Asphalt Binder................................................. 24
4.3.3 Fiber Length ..................................................................................................... 27
4.3.4 MTU Standard Mixing Procedure.................................................................... 28

ii
4.4 Test Results ............................................................................................................. 30
4.4.1 Diametral Resilient Modulus Test.................................................................... 30
4.4.2. Repeated Load Deformation ........................................................................... 31
4.4.3 Flexural Beam Fatigue ..................................................................................... 33
4.4.4 Indirect Tensile Tests ....................................................................................... 34
4.5 Phase 0 Conclusions................................................................................................ 37
CHAPTER 5: CFMA PHASE 1 STUDY ......................................................................... 39
5.1 Primary Work .......................................................................................................... 39
5.1.1 Primary Experimental Design .......................................................................... 39
5.1.2 Superpave Mix Design ..................................................................................... 40
5.1.3 Mixture Preparation.......................................................................................... 43
5.1.3.1 Fiber Evaluation and Selection ................................................................. 43
5.1.3.2 Blending of Carbon Fibers and Asphalt Binder ........................................ 44
5.1.3.3 Asphalt Concrete Mixing .......................................................................... 46
5.1.4 Test Results ...................................................................................................... 46
5.2 Supplemental Work................................................................................................. 48
5.2.1 Supplemental Experimental Plan ..................................................................... 48
5.2.2 Supplemental Test Results ............................................................................... 50
5.3 Phase 1 Conclusions................................................................................................ 52
CHAPTER 6: RESULTS FROM CFMA FIELD STUDY ............................................... 53
6.1 Field Trials .............................................................................................................. 53
6.2 Fiber Length in Compacted Mixtures ..................................................................... 55
CHAPTER 7: DISCUSSION ............................................................................................ 58
CHAPTER 8: CONCLUSIONS........................................................................................ 62
CHAPTER 9: RECOMMENDATIONS FOR FUTURE WORK .................................... 64
REFERENCES.................................................................................................................. 65
APPENDIX A: SPECIMEN DATA ..............................................................................A-1
APPENDIX B: TEST RESULTS.................................................................................... B-1
APPENDIX C: STATISTICAL RESULTS................................................................... C-1

iii
LIST OF FIGURES
Figure 3.1. Resilient modulus test jig............................................................................... 11
Figure 3.2. Strain vs. pulse graph showing tertiary flow point. ........................................ 13
Figure 3.3 Repeated load deformation set-up. .................................................................. 14
Figure 3.4 Typical repeated load deformation output. ...................................................... 15
Figure 3.5. Beam fatigue jig. ............................................................................................. 16
Figure 3.6. Typical plot of results for beam fatigue. ......................................................... 17
Figure 3.7 Indirect tensile testing device........................................................................... 17
Figure 3.8 Specimen mounted in indirect tensile test jig. ................................................. 18
Figure 4.1 Phase 0 aggregate gradation............................................................................. 23
Figure 4.2. Visual inspection sample with large fiber clump............................................ 25
Figure 4.3. Visual inspection sample with small fiber clumps. ........................................ 25
Figure 4.4. Visual inspection sample of well mixed binder.............................................. 25
Figure 4.5. Modified milkshake mixer.............................................................................. 27
Figure 4.6. Fiber length distribution.................................................................................. 28
Figure 4.7. Bucket mixer in use. ....................................................................................... 29
Figure 4.8. Phase 0 Resilient Modulus Results. ................................................................ 30
Figure 4.9. Phase 0 flexural beam fatigue results.............................................................. 34
Figure 4.10. Phase 0 indirect tensile strength results. ....................................................... 35
Figure 4.11. Phase 0 creep compliance results.................................................................. 36
Figure 5.1. Phase 1 aggregate gradation............................................................................ 41
Figure 5.2. Binder viscosity results. .................................................................................. 42
Figure 5.3. Phase 1 primary resilient modulus results....................................................... 46
Table 5.8. Phase 1 primary fine mix average pulse count at 25,000µε. ............................ 47
Figure 5.4. Phase 1 supplemental resilient modulus results.............................................. 50
Figure 5.5. Supplemental coarse graded resilient modulus results. .................................. 51
iv
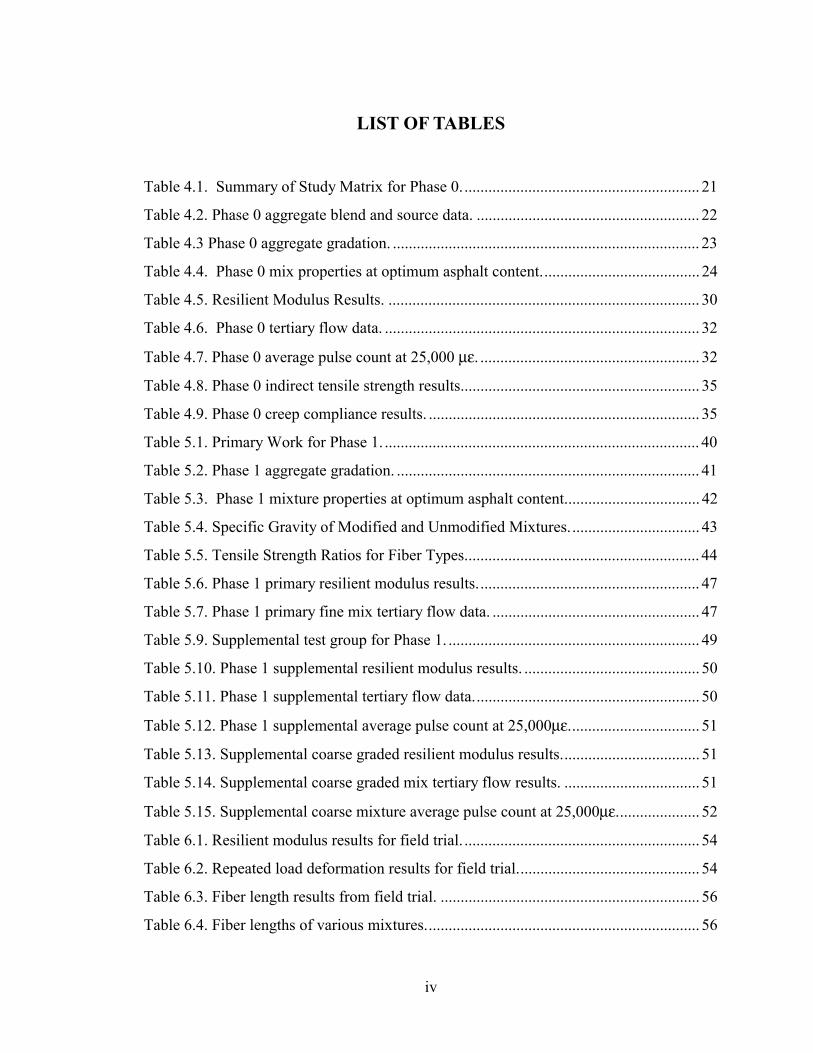
LIST OF TABLES
Table 4.1. Summary of Study Matrix for Phase 0. ........................................................... 21
Table 4.2. Phase 0 aggregate blend and source data. ........................................................ 22
Table 4.3 Phase 0 aggregate gradation. ............................................................................. 23
Table 4.4. Phase 0 mix properties at optimum asphalt content........................................ 24
Table 4.5. Resilient Modulus Results. .............................................................................. 30
Table 4.6. Phase 0 tertiary flow data. ............................................................................... 32
Table 4.7. Phase 0 average pulse count at 25,000 µε. ....................................................... 32
Table 4.8. Phase 0 indirect tensile strength results............................................................ 35
Table 4.9. Phase 0 creep compliance results. .................................................................... 35
Table 5.1. Primary Work for Phase 1. ............................................................................... 40
Table 5.2. Phase 1 aggregate gradation. ............................................................................ 41
Table 5.3. Phase 1 mixture properties at optimum asphalt content.................................. 42
Table 5.4. Specific Gravity of Modified and Unmodified Mixtures................................. 43
Table 5.5. Tensile Strength Ratios for Fiber Types........................................................... 44
Table 5.6. Phase 1 primary resilient modulus results........................................................ 47
Table 5.7. Phase 1 primary fine mix tertiary flow data. .................................................... 47
Table 5.9. Supplemental test group for Phase 1. ............................................................... 49
Table 5.10. Phase 1 supplemental resilient modulus results. ............................................ 50
Table 5.11. Phase 1 supplemental tertiary flow data......................................................... 50
Table 5.12. Phase 1 supplemental average pulse count at 25,000µε................................. 51
Table 5.13. Supplemental coarse graded resilient modulus results................................... 51
Table 5.14. Supplemental coarse graded mix tertiary flow results. .................................. 51
Table 5.15. Supplemental coarse mixture average pulse count at 25,000µε..................... 52
Table 6.1. Resilient modulus results for field trial. ........................................................... 54
Table 6.2. Repeated load deformation results for field trial.............................................. 54
Table 6.3. Fiber length results from field trial. ................................................................. 56
Table 6.4. Fiber lengths of various mixtures..................................................................... 56

v
ACKNOWLEDGEMENTS
My time at Michigan Technological University is coming to an end. I will never forget
the people and places that make this University and the Keweenaw so great. Although I
love this place dearly, I know it is time to move on and start the rest of my life. Before I
go I would like to express my gratitude to those who have helped me along the way.
First, I would like to thank my advisor Dr. Thomas Van Dam for everything he has done
for me in the last 3 years. Without his guidance I would not be where I am today.
I would like to thank my committee members, Tess Ahlborn, Chris Willams, and Todd
King. Your participation is much appreciated. You have all helped me in more ways
than you may know.
This project would not have been possible without the support of Jeff Meyers and the
entire team at Conoco, Inc. Without their support and guidance this project would not
have happened. The project would have never been completed without the help of Karl
Hanson and Chad Seaman in the laboratory.
Finally I would like to thank the people who have helped to keep me sane these last few
months. To girlfriend Erin Naughton, I love you and thanks for putting up with me. To
my fraternity brothers at Tau Kappa Epsilon, thanks for allowing me to vent my anger and
frustrations through this long, strange trip. If not for the Fraternity, my school career
would have ended after the winter of 1995. Everyone there both past and present has
helped me become the man I am today and for that I am truly grateful.
To everyone else who has helped me scholastically and emotionally, THANK YOU.

CHAPTER 1: INTRODUCTION
Today, an estimated 500 million tons of hot mix asphalt is produced and placed in
pavement in the United States alone, costing about $10.5 billion (Roberts 1996).
Scientists and engineers are constantly trying to improve the performance of these
pavements through programs such as the Strategic Highway Research Program (SHRP).
As a result of this program, asphalt binder specifications and asphalt concrete (AC)
mixture design methods have been completely revised and combined in a new system
known as Superpave, which stands for Superior Performing Pavements. Extensive
research continues in an attempt to optimize the Superpave system and construct better
performing, longer lasting asphalt pavements.
Modification of the asphalt binder is one approach taken to improve pavement
performance. Currently the addition of polymers is a common method for binder
modification, although fibers of various types have also been evaluated. It is thought that
the addition of fibers to asphalt enhances material strength and fatigue characteristics
while adding ductility. Because of their inherent compatibility with asphalt cement and
excellent mechanical properties, carbon fibers might offer an excellent potential for
asphalt modification. With new developments in production, a carbon modified asphalt
binder has become cost competitive with polymer modified binder. Based on results
from other fiber-modified composites, it was thought that the incorporation of carbon
fibers into an AC mixture would enhance its tensile strength properties, resulting in a
decrease in cracking due to cold temperatures and repeated loading at intermediate
temperatures, while stiffening the mixture at high temperatures, increasing its resistance
to permanent deformation.
To investigate the behavior of carbon fiber modified asphalt (CFMA) mixtures, a two
phase study sponsored by Conoco, Inc. was conducted at Michigan Technological
University (MTU). The first phase, known as Phase 0, was a preliminary study used to

2
determine the feasibility of modifying the behavior of a standard AC mixture through the
use of pitch-based carbon fibers. This study focused strictly on the ability of mixing and
compacting mixtures made with CFMA to achieve statistically significant improvements
in the mechanical properties of the mixture. No effort was made to optimize fiber
characteristics (type, length, or surface treatment), binder characteristics (performance
grade or content), or the AC mixture characteristics (gradation). Instead, a production
Superpave mixture design was obtained and modified by replacing the conventional
binder with the CFMA binder. All mixtures were tested to measure mixture properties
that are indicative of anticipated field performance.
The second phase in the CFMA study at MTU was referred to as Phase 1. The purpose of
this phase was to identify and better understand the factors that affect the behavior of
CFMA. Fiber surface treatment and type were evaluated as well as ways to preserve fiber
length. Asphalt contents of fiber modified Superpave mixture designs were re-optimized
based on air content, VMA, and VFA. The effect of aggregate gradation is examined in
this phase.
Carbon fiber modified asphalt mixtures were expected to show increased stiffness and
resistance to permanent deformation. Fatigue characteristics of the mixture were
expected to improve with the addition of discrete carbon fibers. Because of the high
tensile strength of carbon fibers, the cold temperature behavior of CFMA mixtures was
anticipated to improve. Carbon fiber modified asphalt was expected to produce a higher
quality AC mixture for pavement applications.
This thesis consists of a literature review, an explanation of the tests and procedures used
to evaluate CFMA, the organization and results of the two phases of the project, and
discussion and conclusions.
The results and opinions presented in this thesis are those of the author alone and in no
way reflect those of Conoco Incorporated.

3
CHAPTER 2: BACKGROUND AND LITERATURE REVIEW
Little published information concerning carbon fiber modified asphalt is available. Most
studies that included fibers in asphalt mixtures had a limited number of trials, and
investigating the effects of fiber modification was, in many cases, secondary to the main
purpose of the studies. Yet, while this study focuses on carbon fiber modification it is
important to understand other research which has utilized different fiber types. These
studies were reviewed to develop performance benchmarks for carbon fiber modified
mixtures and to identify potential problems and solutions observed in using fiber
modified binder.
2.1 General Fiber Studies
Zube (1956) published the earliest known study on the reinforcement of asphalt mixtures.
This study evaluated various types of wire mesh placed under an asphalt overlay in an
attempt to prevent reflection cracking. The study concluded that all types of wire
reinforcement prevented or greatly delayed the formation of longitudinal cracks. Zube
suggests that the use of wire reinforcement would allow the thickness of overlays to be
decreased while still achieving the same performance. No problems were observed with
steel/AC mixture compatibility.
More recently, Serfass and Samanos (1996) presented the results of a study to the
Association of Asphalt Paving Technologists that examined the effects of fiber modified
asphalt utilizing asbestos, rock wool, glass wool, and cellulose fibers. The tests
conducted included resilient modulus, low-temperature direct tension, rutting resistance,
and fatigue resistance. Three studies were performed on a test track in Nantes, France.
The first showed that fiber modified mixtures maintained the highest percentage of voids
after 1.1 million 13 metric ton axle loads as compared to unmodified asphalt and two
elastomer modified mixtures. The authors concluded that this corresponds to better
4
drainage and therefore a decreased susceptibility to moisture related distress in the porous
mixtures tested.
In the second study, 2 million load applications were applied to a fiber modified asphalt
used as an overlay mixture on pavements that exhibited signs of fatigue distress. After
the load applications, the pavement surface was noted to have "a well maintained
macrostructure, and practically no cracking whatsoever, even on the flexible structural
pavement" (Serfass and Samanos 1996). The authors concluded that this proved the
effectiveness of fiber modified asphalt concrete as an overlay mixture. The
macrostructure integrity relates to maintained skid resistance over time, and the lack of
fatigue cracks implies that the fatigue life of the fiber modified overlay is greater than the
fatigued, unmodified pavement underneath.
Fiber modified overlays were also constructed over fatigued pavements in the third study
reported by Serfass and Samanos. After 1.2 million load applications it was observed that
all of the fiber modified overlays showed no sign of fatigue related distresses or rutting
compared to the unmodified samples which did show signs of distress. This
corresponded to the findings of the second study, that the fatigue life of the fiber modified
pavement is improved over unmodified mixtures.
Serfass and Samanos (1996) concluded in all three studies that the addition of fibers to
asphalt concrete improved the fixation of the asphalt binder in the mix. This relates to
less bleeding and improved skid resistance over unmodified mixtures of the same design.
Fiber modification also allowed for an increase in film thickness, resulting in less aging
and improved binder characteristics. The addition of fibers also resulted in the reduction
of temperature susceptibility of asphalt mixtures. "Adding fibers enables developing
mixtures rich in bitumen [asphalt binder], and therefore displaying high resistance to
moisture, aging, fatigue, and cracking." (Serfass and Samanos 1996).
5
In a separate study, a fracture mechanics approach was used to evaluate the effects of
fiber reinforcement on crack resistance. (Jenq et al. 1993) Polyester and polypropylene
fibers were used to modify mixtures that were then tested for modulus of elasticity,
fracture energy, and tensile strength. Fracture energy in modified samples increased by
50 to 100 percent, implying increased toughness. Elasticity and tensile strength results
were not significantly affected.
Simpson et al. (1994) conducted a study of modified bituminous mixtures in Somerset,
Kentucky. Polypropylene and polyester fibers and polymers were used to modify the
asphalt binder. Two proprietary blends of modified binder were also evaluated. An
unmodified mixture was used as a control. Testing included Marshall stability, indirect
tensile strength (IDT), moisture damage susceptibility, freeze/thaw susceptibility, resilient
modulus, and repeated load deformation. Mixtures containing polypropylene fibers were
found to have higher tensile strengths and resistance to cracking. None of the fiber
modified mixtures showed resistance to moisture induced, freeze/thaw damage. Fiber
modified mixtures showed no improvement in stripping potential. IDT results predict
that the control and polypropylene mixtures will not have problems with thermal cracking
whereas the mixtures made with polyester fibers and polymers may. Mid-range
temperature resilient modulus tests show polypropylene fiber modified mixtures were
stiffest, while high temperature resilient modulus testing measured increased stiffness for
all mixtures over the control. Rutting potential as measured by repeated load deformation
testing was found to decrease only in polypropylene modified samples.
Uniform distribution of fibers in a composite mixture is key to mixture performance. In a
study of carbon fiber modified Portland cement concrete, Chen et. al. (1997) concluded
that an even distribution of fibers was essential for the improved performance of
mixtures. Three dispersing agents were used and the concrete mixtures were tested for
flexural strength at different fiber contents. All mixtures containing dispersing agents
resulted in significantly higher flexural strength and toughness than the control mixtures.
It is noted that the fibers used in this study had an average length of 5.1 mm.

6
2.2 Specific Studies
2.2.1 Polypropylene Fiber
Polypropylene fibers were used in a 1993 study by Jiang et al. in an attempt to reduce
reflection cracking in an asphalt overlay. Although crack intensities were less on the
fiber modified overlay sections, a reduction or delay in reflection cracking was not
observed. Sections in which the concrete was cracked and seated before the overlay were
found to have less reflection cracking when fibers were used in either the base or binder
layers.
Huang et al. (1996) conducted a study of asphalt overlays modified with polypropylene
fiber. These mixtures and others containing no fiber were sampled by coring and taken to
the lab for further analysis. It was concluded from the laboratory testing that the fiber
modified mixtures were slightly stiffer and showed improved fatigue life. The biggest
problem encountered with polypropylene fibers is the inherent incompatibility with hot
asphalt binder due to the low melting point of the fiber. Huang also stated that further
research was needed to understand the viscoelastic properties of fiber modified asphalt
mixtures.
2.2.2 Polyester Fibers
Maurer et al. (1989) also studied the impact of loose fibers in overlay mixtures. Polyester
was chosen over polypropylene because of its higher melting point. It was noted that the
construction of the mixture was done without difficulty or extra equipment. The
polyester fiber modified mixture was compared to several types of fiber reinforced
interlays and a control section. Test sections were rated for ease of construction, cost, and
resistance to reflection cracking. The loose fiber modified sections were rated best in the
study in all areas.
7
2.2.3 Asbestos (Mineral) Fiber
In 1990, Huet et al. published the results of a study comparing changes in void contents
and hydraulic properties of plain and modified asphalt mixtures placed on the Nantes
fatigue test track in France. Two of the mixtures used a polymer modifier (SBS) and the
third used a mineral (asbestos) fiber to modify the base mixture. Plain and SBS modified
mixtures showed similar decreases in void content and hydraulic properties after
1,100,000 load cycles. In contrast, Huet concludes that the mixtures modified with fiber
“had undergone no reduction in void content; its drainage properties were practically
unchanged and rutting was minimal” after the same loading.
2.2.4 Cellulose Fiber
Decoene et al. (1990) studied the affects of cellulose fibers on bleeding, void content
reduction, abrasion, and drainage in porous asphalt. Cellulose fibers in the mixture
allowed asphalt contents to be increased while drastically decreasing bleeding of the
binder. No changes were observed in either void content or abrasion with the addition of
cellulose fibers. Full-scale test sections on Belgian roads were monitored for drainage
over a six-month period. Those sections containing fibers retained the same drainage
quality over the six months, while the drainage time doubled in sections without fibers.
Stuart et al. (1994) evaluated two loose cellulose fibers, a pelletized cellulose fiber, and
two polymers. The mixtures were evaluated for binder drain-down and resistance to
rutting, low temperature cracking, aging and moisture damage. Drain-down tests showed
that all mixtures with fiber drained significantly less than those with polymers or the
control. Fiber modified mixtures were the only ones to meet test specifications for drain-
down. The control samples were found to have excellent resistance to rutting and no
significant difference was observed between the control and mixtures with modified
binder. Low temperature and moisture damage results were inconclusive. Polymer
modified mixtures were found to have better resistance to aging.

8
Partl et al. (1994) used various contents of cellulose fibers in one mix in a study of stone
matrix asphalt (SMA). Mixtures were evaluated using thermal stress restrained specimen
tests and indirect tensile tests. Problems with fiber clumping occurred in the mixing
process. Distribution of fibers was improved by increasing mixing temperature and
duration, but some clumps were still present. The study concluded that SMA with
cellulose fiber did not significantly improve the mix based on the two tests conducted.
The authors believe that the poor distribution of fibers may have caused the limited
improvement, but suggest further research to confirm this theory.
Cellulose fibers were used in another study of SMA by Selim et al. (1994). Testing
included binder drain-down, moisture susceptibility (reported as tensile strength ratio),
and static creep modulus and recovery efficiency. Fibers were added to mixtures
containing standard and polymer modified binders. Binder drain-down results show
dramatic improvement in all mixtures containing the cellulose fibers. Mixtures with
plain asphalt binder and fibers exhibited the highest indirect tensile strength and tensile
strength ratio after conditioning compared to polymer modified mixtures containing
fibers that showed the lowest tensile strength and resistance to moisture induced damage
of all the mixtures tested. Although variable, statistical analysis proved that creep
modulus and recovery efficiency were better in mixtures containing fibers and plain
binder rather than with fibers and polymer modifier.
2.3 Summary of Literature Review
Fiber modification of asphalt mixtures has shown mixed results. Fibers appear to
increase the stiffness of the asphalt binder resulting in stiffer mixtures with decreased
binder drain-down and increased fatigue life. Mixtures containing fibers showed less
decrease in void content and increased resistance to permanent deformation. The tensile
strength and related properties of mixtures containing fibers was found to improve in
some cases and not in others.

9
2.4 Carbon Fibers
Carbon fibers are thought to offer advantages over other fiber types for the modification
of asphalt binder. Since the fibers are composed of carbon and asphalt is a hydrocarbon,
they are thought to be inherently compatible. Because carbon fibers are produced at
extremely high temperatures (over 1000°C), fiber melting due to high mixing
temperatures is not an issue. The high tensile strength of carbon fibers should increase
the tensile strength and related properties of AC mixtures, including resistance to thermal
cracking. The stiffening effect showed by the addition of other fibers should also occur
in carbon fiber modified mixtures, increasing the fatigue life of pavements. For these
reasons it was hypothesized that carbon fibers should be the most compatible, best
performing fiber type available for modification of asphalt binder.
Carbon fibers are produced from either polyacrylonitrile (PAN) or pitch precursors.
These precursors are processed into carbon fibers in similar ways. First, the liquid
precursors are spun into fibers. PAN is already in liquid form and is wet spun, while
pitch must first be melted and then spun. To prevent fibers from burning at the high
temperatures required for carbonization (>700°C) they are next placed in an oxidizing
atmosphere. This process is called stabilization for PAN fibers and infusibilization for
pitch-based fibers. The carbonization process follows for both precursor types and is
conducted in an inert atmosphere. Once completed fibers are again placed in an inert
atmosphere and graphitized at greater than 2500°C resulting in the finished carbon fiber
product (Chung 1994).
Chung (1994) lists several types of pitch and PAN-based carbon fibers with typical
properties in a table on page 8. Based on the information in the table, PAN fibers tend to
have higher tensile strengths (2760 – 7060 MPa) than pitch-based (1400 – 3900 MPa).
Pitch-based have a higher tensile modulus of elasticity (140 – 894 GPa) compared to
PAN (228 – 588 GPa). PAN fibers have a smaller diameter (4 – 8 µm) than pitch-based
fibers (9 - 11µm). In general the properties of carbon fibers vary greatly depending on the
manufacturer and their unique production processes.
10
CHAPTER 3: MIXTURE CHARACTERIZATION
A number of tests can be used to characterize the mechanical properties of AC mixtures.
The tests used in this study are resilient modulus, repeated load deformation, flexural
beam fatigue, and indirect tensile tests. Each of these tests are described in detail in the
following sections.
3.1 Diametral Resilient Modulus Test
The resilient modulus of a mixture is a relative measure of mixture stiffness. It is a
commonly run test (ASTM D4123) and was therefore selected as one method to compare
the mixtures in this study. Resilient modulus is useful in measuring a material's
contribution to pavement structure under repeated loading such as that from a moving
wheel load. The use of the resilient modulus provides a basis for comparison of changes
in material stiffness at different fiber levels and temperatures.
The resilient modulus is defined as the ratio of deviator stress to recoverable strain
observed when a sample is exposed to cyclic loading. The test procedure used in this
study was ASTM D 4123 - 82. The machine used was the Universal Testing Machine
(UTM-5P) manufactured by Industrial Process Controls Limited in Melbourne, Australia.
The test was performed by applying five haversine load pulses on one diametral axis and
measuring the deformation on the perpendicular axis. The software package, which
accompanies the test machine, calculates the modulus for each load pulse. The software
then determines the overall modulus by averaging the results of the five pulses.
Equation 3.1 is used to determine the resilient modulus. The actual load, horizontal
deformation, and recovered horizontal deformation are determined for each load pulse.
These measurements are used to calculate the resilient modulus of each load pulse. The
mean, standard deviation, and coefficient of variance of the five individual pulses are
calculated to find the resilient modulus of the sample.
11
M P( 0.27)(t)( H)
r = +µ∆ , eq. 3.1
where:
Mr = Asphalt concrete resilient modulus, MPa
P = Maximum applied force (repeated load), N
µ = Poisson's ratio
t = Thickness of the sample, mm
∆H =Recoverable horizontal deformation, mm.
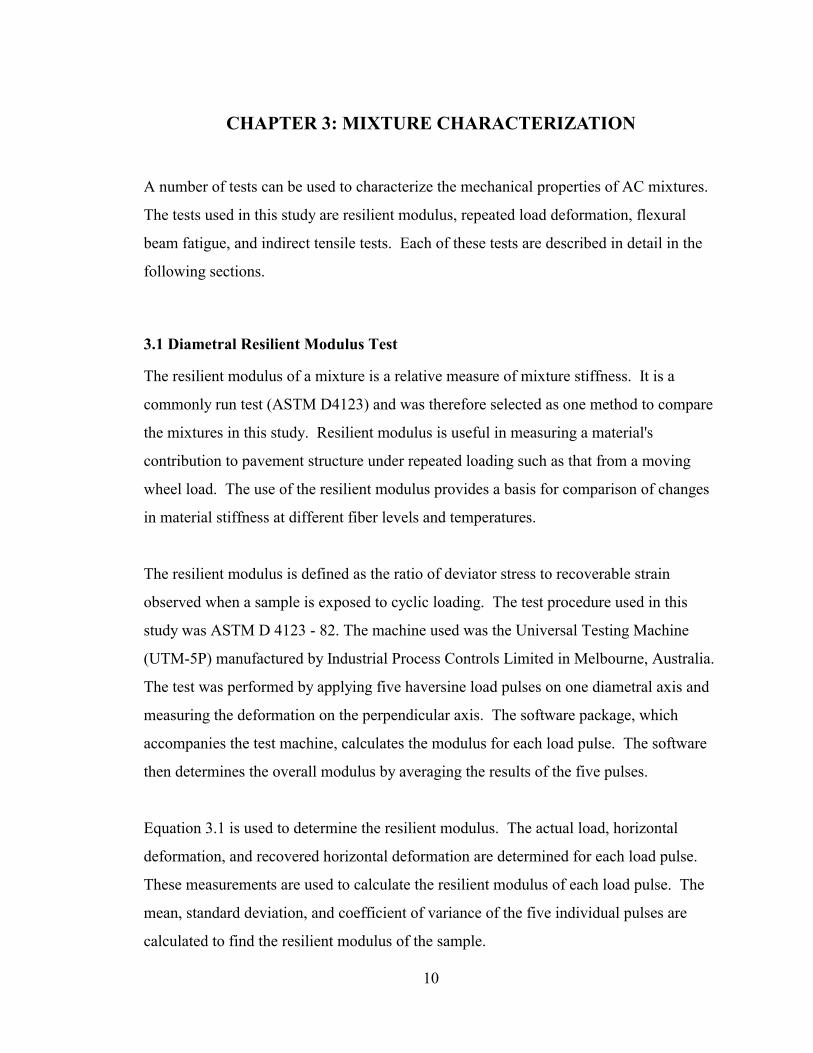
In accordance with the test method, cylindrical compacted samples were prepared by
cutting them to a thickness of 75±2 mm for a 150-mm diameter specimen. Two
perpendicular diameters were marked on the cut surfaces. Samples were then placed in a
temperature control chamber until test temperature was obtained at the core of the sample
as monitored with a dummy sample with a temperature probe inserted into the sample
core. The dummy sample was placed in the temperature control chamber at room
temperature and at the same time as the specimens to be tested. Samples were placed in
the test jig as shown in Figure 3.1.
Figure 3.1. Resilient modulus test jig.

12
Immediately upon completion of the test, samples were rotated 90 degrees from the
original position, re-mounted in the test jig, and tested a second time. The average of the
two moduli results is the reported resilient modulus of the sample. This procedure allows
errors caused by irregularities in the test specimen to be addressed by averaging. The
percent difference between the two results was calculated to insure that major errors did
not occur.
Each sample was also tested at two temperatures: 5°C and 25°C. ASTM recommends
that each sample be tested at three temperatures (5, 25, and 50°C), but for this project, the
samples were not tested above room temperature to avoid damage, which would prohibit
further testing with the same samples.
In this procedure Poisson's ratio is estimated and input during test set up. At 5°C, a
Poisson’s ratio of 0.25 was assumed, and 0.35 was used for the tests conducted at 25°C.
The thickness of each sample was measured and recorded before the first test. This value
was then used during subsequent testing on the same sample. The maximum applied
load, Pe, was estimated using equation 3.2.
610*)27.0(***
+=
µε c
ehDEP , eq. 3.2
where:
Pe = Estimated peak load, N
E = Estimated resilient modulus, MPa
D = Average diameter, mm
hc = Average height, mm
ε = Recovered horizontal strain (assume 50µε)
µ = Poisson’s ratio.

13
3.2 Repeated Load Deformation
One of the most common and easily recognized modes of failure for an asphalt pavement
is rutting; the permanent deformation that occurs in wheel paths due to repeated load
applications. Repeated load deformation tests are useful in comparing the rutting
susceptibility of different mixtures. In most procedures, the point at which tertiary flow
begins is of greatest interest. Tertiary flow is identified as the point at which a mixture
exhibits increasingly higher deformation with each subsequent load application. An
example of the tertiary flow point is shown in Figure 3.2. In the figure, tertiary flow
begins at the point of minimum slope. Once tertiary flow begins the mixture begins to
incur permanent deformation. In this study the load pulses required to reach 25,000
microstrain (µε = 10-6 mm/mm) was used an additional indicator, designated as the cycles
to failure.
Figure 3.2. Strain vs. pulse graph showing tertiary flow point.
Because of the nondestructive nature of resilient modulus testing, the same samples can
be used for repeated load deformation tests as for resilient modulus tests. Therefore, the
samples were already cut and polished to a thickness of 75±1 mm as required. Polishing
was done on a lap wheel using 60, 100, and 200-grit abrasive. The repeated load
deformation tests also utilized the UTM-5P, following the Australian standard test
method AS 2891.12.1-1995. The test applies axial compressive loads to a specimen at a
stress of 200 kPa until failure (denoted as 25,000µε). The load is applied as rectangular
0
5000
10000
15000
20000
25000
30000
0 50 100 150 200 250 300
Pulse Count
Acc
umul
ated
Str
ain
Begin tertiary flow

14
shaped waves with a period of 2 seconds and a width of 0.5 seconds, meaning it is
applied for 0.5 seconds and released. After 1.5 seconds of rest another load cycle began.
The accumulated deformation was measured and the strain calculated using Equation 3.3.
o
hP h
∆=ε , eq. 3.3
where:
εp = Accumulated strain, mm/mm
∆h = Total axial deformation, mm
ho = Original height of sample, mm.
The set-up of the test jig is shown in Figure 3.3.
Figure 3.3 Repeated load deformation set-up.
Specimens were placed in the temperature control cabinet for a minimum of two hours to
increase the core temperature of the dummy specimen to the test temperature of 50°C.
Care was taken to not leave samples in the temperature chamber for more than 18 hours
to prevent the sample from deforming under its own weight. As specified by the test

15
procedure, the cut and polished faces of the samples were covered with silicone
lubricating gel prior to being placed in the test jig.
Parameters for test termination were predetermined and input into the computer software.
The first was deformation beyond the measurable range of the linear variable differential
transducers (LVDTs), signifying sample compression failure. The second criterion for
test termination was accumulated strain greater than 27,000 microstrain. This parameter
ensures that each specimen would be tested into the tertiary flow region. Figure 3.4 is an
example of the typical graphical output from the repeated load deformation tests.
Figure 3.4 Typical repeated load deformation output.
3.3 Flexural Beam Fatigue Tests
The purpose of the flexural beam fatigue tests is to measure the fatigue behavior of the
mixture. Pavements that are experiencing fatigue failure will suffer cracking caused by
repeated traffic loading. These cracks occur in the wheel paths, initiating as longitudinal
cracks and progressing to an alligator crack pattern. The results from a beam fatigue test
can be used to provide an estimation of the number of wheel loads that can be carried by a
pavement before fatigue cracking appears. In this study, the fatigue properties of the
modified and unmodified asphalt mixtures were measured and compared.
0
5000
10000
15000
20000
25000
30000
35000
0 100 200 300 400 500Pulse Count
Acc
umul
ated
Str
ain

16
Each of the asphalt mixtures used for the beam fatigue test was prepared using standard
laboratory procedure. After bucket mixing the uncompacted samples were placed into
clean canvas bags and shipped to the University of Illinois Advanced Transportation
Research and Engineering Laboratory (ATREL) where the testing was conducted. Each
beam fatigue sample was prepared and tested in accordance with AASHTO Provisional
Standard TP8.
The test method begins by bringing the specimen to a temperature of 20°C and clamping
it into the test jig. Linear variable differential transducers are attached to the neutral axis
of each sample. A load is applied in third point loading position at a constant strain. The
initial stiffness is recorded after 50 load applications. Loading is continued until failure,
which is defined as the point where 50 percent of the initial stiffness of the specimen
remains. The test jig set-up, shown in Figure 3.5 was taken from ELE International
www.eleint.co.uk/asph/beam.htm. A typical plot of the results is shown in Figure 3.6.
Figure 3.5. Beam fatigue jig.

17
Figure 3.6. Typical plot of results for beam fatigue.
3.4 Indirect Tensile Strength Tests
The indirect tensile strength test is used to assess the potential cold temperature
performance of the mixture as specified for Superpave intermediate and complete mix
design. The Superpave IDT (Figures 3.7 and 3.8) at the University of Illinois ATREL
facility was used to assess the effect of carbon fibers on low temperature properties of the
asphalt mixture specimens. The indirect tensile test is used to design and analyze asphalt
paving mixtures by measuring creep compliance and tensile strength of asphalt mixtures
at low temperature, which can be used in a mechanics-based model to predict thermal
cracking as a function of pavement age. The creep compliance was used in this study to
compare the relative low temperature behavior of the mixtures.
Figure 3.7 Indirect tensile testing device.
0.0001
0.001
10000 100000 1000000 10000000
Load Repetitions
Tens
ile S
trai
n

18
Figure 3.8 Specimen mounted in indirect tensile test jig.
As illustrated in Figure 3.8, horizontally-oriented tensile stresses are induced in
cylindrical test specimens by applying vertical compressive forces across load platens on
diametrically-opposed locations on the perimeter. Response is measured using vertically-
and horizontally-aligned deflection sensors (LVDT’s) mounted on both sides of the
specimen. Sensors are mounted in the center of the round faces where stress and strain
fields are relatively uniform, and away from loading platens, where damage and non-
linear specimen response is found. By measuring in orthogonal directions, the Poisson’s
ratio is obtained, which is essential for properly interpreting three-dimensional stress,
strain and deflection fields.
The IDT is typically run at three test temperatures (usually 0, -10, and –20°C), where
static creep and strength tests are performed. The creep test involves holding a load of
fixed magnitude for either 100 seconds (production standard) or 1000 seconds (research
standard) and measuring the deflections. The deflections are measured between
nonadjacent strain gauges as shown in Figure 3.8. Creep compliance versus time curves
are obtained, which can be used to create a creep compliance master curve and
temperature-shift factor relationship. Creep compliance is a modulus equal to the
measured strain at various times and temperatures divided by the applied stress in the test.

19
Thus, it is a measure of flexibility, or the inverse of stiffness. The master curve and shift
factors provide a comprehensive viscoelastic characterization of the mixture at low
temperatures, which is used in the Superpave thermal cracking model to convert
thermally-induced pavement strains into thermal stresses. The tensile strength test results
are used in a fracture mechanics model to predict thermal crack growth due to these
pavement stresses.
20
CHAPTER 4: CFMA PHASE 0 STUDY
The initial phase of the CFMA project was intended to determine the feasibility of
modifying the behavior of a standard AC mixture through the use of pitch-based carbon
fibers. Known as Phase 0, this short, narrowly-focused study centered on laboratory work
that began in early July and completed in late August of 1998. Data analysis and the
submission of an unpublished final report to Conoco, Inc. were completed in late October
1998.
4.1 Experimental Design
The four tests previously discussed were used to characterize the AC mixtures produced
in this study. The resilient modulus test was chosen to characterize the relative stiffness
of mixtures. The repeated load deformation test was used to quantify the ability of the
different mixtures to resist permanent deformation and rutting. The flexural beam fatigue
test was applied to quantify the fatigue life of the different mixtures and the indirect
tensile test was selected to evaluate the low temperature behavior of CFMA.
Due to the short duration of this phase, relatively small sample sizes were chosen to allow
for sample preparation and testing to be completed within the limited time-frame. The
fiber contents used were selected arbitrarily and optimization was not considered.
A Michigan Department of Transportation (MDOT) approved Superpave asphalt mix
design was used and materials were obtained from an operational hot-mix asphalt plant.
Once in the laboratory the aggregate was separated into standard size fractions. The
appropriate proportions of each size were recombined to duplicate the mix design
aggregate gradation for each sample. This aggregate was heated, combined with asphalt,
and short-term oven aged in accordance with Superpave guidelines (Anderson 1995).
Each sample was compacted using a Pine gyratory compactor to 93 percent of the
maximum specific gravity, ensuring that all samples would have approximately the same
air void content.

21
The experimental design for this phase consisted of a control group and an experimental
group, each having six replicates to allow for comparison of CFMA versus samples made
with neat (unmodified) asphalt. The test groups were made using the same aggregate and
gradation and identical percent binder contents (measured by weight of total mix). The
binder used was either unmodified or modified with carbon fibers having ozone and PVP
surface treatments. The loading rate of carbon fibers in the modified mixtures was
measured as a percent by weight of binder.
To examine the impact of carbon fiber addition on the physical properties of asphalt
concrete, the results from the experimental groups were statistically compared to those
from the control group. All statistical comparisons of the results were done using a two-
sided t-test. A two-sided test was done to compare sample means, using a 95 percent
level of confidence (α = 0.05) whether or not the results were equal.
A supplementary group of experimental samples was created in addition to the main test
groups to provide a basis for further study and attempt to better understand the behavior
of CFMA with different concentrations of fibers. This subset consisted of samples with
varying fiber contents and surface treatments. These specimens did not undergo the full
regime of tests. Only three replicates were tested for resilient modulus and repeated load
deformation. A complete summary of the experimental design and the tests run in Phase
0 is given in Table 4.1.
Table 4.1. Summary of Study Matrix for Phase 0.
Control Group Experimental GroupTests Replicates Replicates Fiber Content*
6 6 0.5% treated3 0.3% treated3 0.8% treated
Resilient Modulus and
Repeated Load
Deformation** 3 0.5% untreatedIndirect Tensile 6 6 0.5% treatedFlexural Beam Fatigue 6 6 0.5% treated*Measured as percent by weight of asphalt binder.**Modulus samples were reused for deformation tests.
22
4.2 Mixture Design
The materials and mixture design used in Phase 0 were obtained from the Gladstone, MI
office of Payne and Dolan, Inc. The mixture was in production for a Michigan
Department of Transportation rehabilitation project on a major arterial highway, job
number 31059A. The mixture was designed using Superpave procedure for a traffic load
of < 3 million equivalent single axle loads (ESALs) and high and low air temperatures
consistent with Superpave climate data for the Upper Peninsula of Michigan.
Steps were taken to ensure quality control in the procurement of materials from the
mixing plant. Asphalt binder was obtained directly from the holding tank, being placed
into one-gallon cans. The aggregate conveyor leading into the drum mixer was redirected
to obtain the aggregates, which were stored in canvas bags until processing.
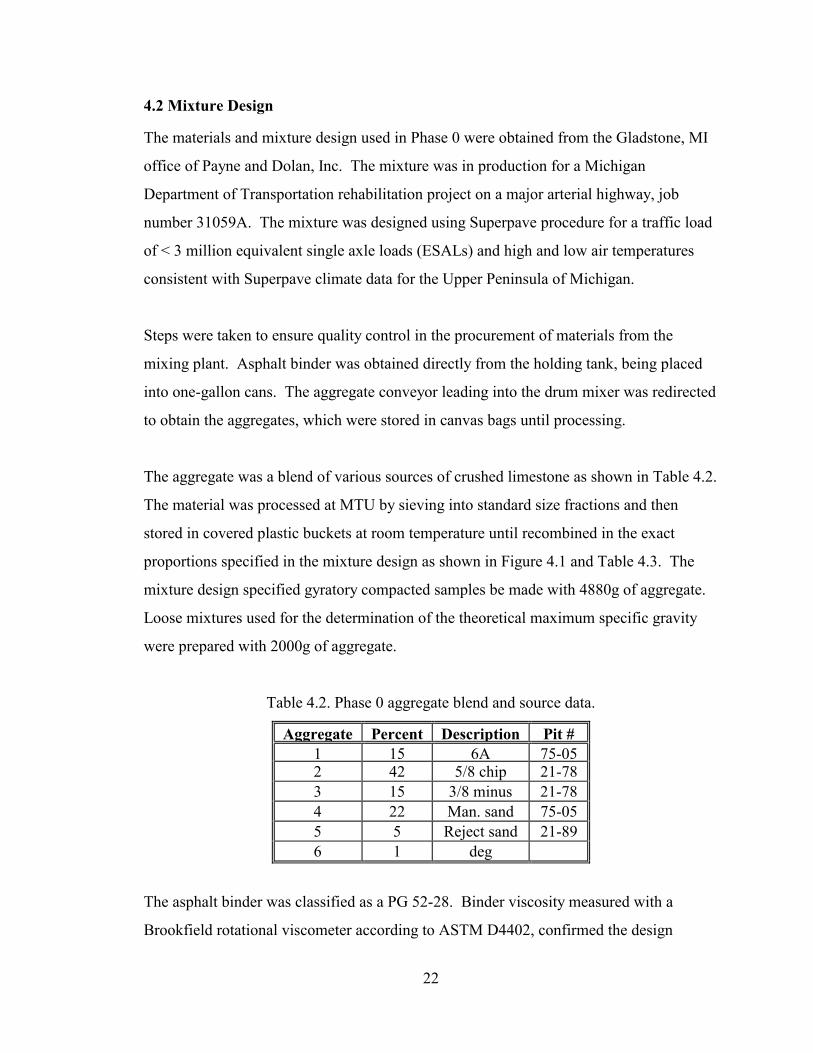
The aggregate was a blend of various sources of crushed limestone as shown in Table 4.2.
The material was processed at MTU by sieving into standard size fractions and then
stored in covered plastic buckets at room temperature until recombined in the exact
proportions specified in the mixture design as shown in Figure 4.1 and Table 4.3. The
mixture design specified gyratory compacted samples be made with 4880g of aggregate.
Loose mixtures used for the determination of the theoretical maximum specific gravity
were prepared with 2000g of aggregate.
Table 4.2. Phase 0 aggregate blend and source data.
Aggregate Percent Description Pit #1 15 6A 75-052 42 5/8 chip 21-783 15 3/8 minus 21-784 22 Man. sand 75-055 5 Reject sand 21-896 1 deg
The asphalt binder was classified as a PG 52-28. Binder viscosity measured with a
Brookfield rotational viscometer according to ASTM D4402, confirmed the design

23
mixing and compaction temperatures to be 132°C and 124°C, respectively. The specific
gravity was 1.019 as determined by water displacement method (ASTM D3289). The
viscosity of fiber modified binder was measured and found to be about ten times that of
the unmodified binder using the rotational viscometer. Based on this viscosity, the
recommended mixing and compaction temperatures would be so high that damage to the
asphalt binder would occur. It is also known that the testing procedure is not designed for
use with fiberized material. Thus, the mixing temperatures for Phase 0 fiber modified
samples were increased by 5°C to aid in mixing.
Figure 4.1 Phase 0 aggregate gradation.
Table 4.3 Phase 0 aggregate gradation.
Sieve Opening (mm) % Passing-1” 25.0 100
-3/4” 19.0 96.9-1/2” 12.5 81.0-3/8” 9.5 63.6No. 4 4.75 42.8No. 8 2.36 28.9No. 16 1.18 18.7No. 30 0.6 12.6No. 50 0.3 8.6No. 100 0.15 5.6No. 200 0.075 4.0
3E3 Mix
0
20
40
60
80
100
120
0 1 2 3 4 5
Seive opening raised to 0.45 power
Perc
ent p
assi
ng
GradationRestricted ZoneMax DensityCtrl Points
24
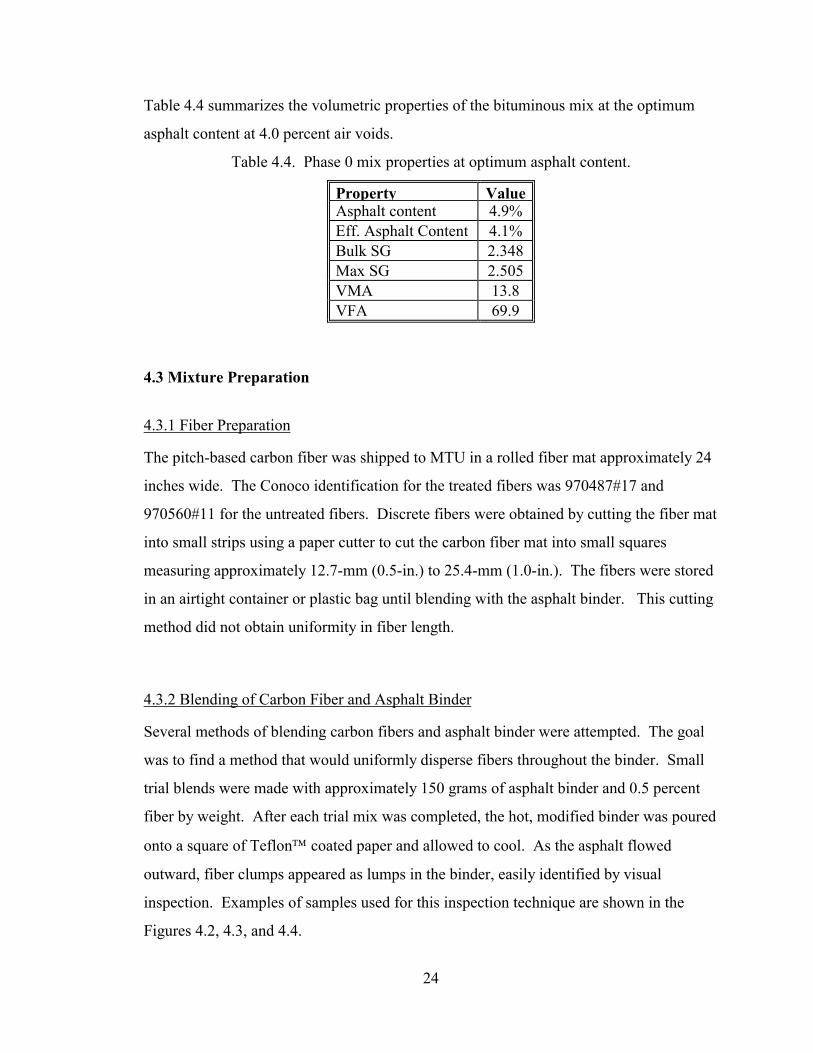
Table 4.4 summarizes the volumetric properties of the bituminous mix at the optimum
asphalt content at 4.0 percent air voids.
Table 4.4. Phase 0 mix properties at optimum asphalt content.
Property ValueAsphalt content 4.9%Eff. Asphalt Content 4.1%Bulk SG 2.348Max SG 2.505VMA 13.8VFA 69.9
4.3 Mixture Preparation
4.3.1 Fiber Preparation
The pitch-based carbon fiber was shipped to MTU in a rolled fiber mat approximately 24
inches wide. The Conoco identification for the treated fibers was 970487#17 and
970560#11 for the untreated fibers. Discrete fibers were obtained by cutting the fiber mat
into small strips using a paper cutter to cut the carbon fiber mat into small squares
measuring approximately 12.7-mm (0.5-in.) to 25.4-mm (1.0-in.). The fibers were stored
in an airtight container or plastic bag until blending with the asphalt binder. This cutting
method did not obtain uniformity in fiber length.
4.3.2 Blending of Carbon Fiber and Asphalt Binder
Several methods of blending carbon fibers and asphalt binder were attempted. The goal
was to find a method that would uniformly disperse fibers throughout the binder. Small
trial blends were made with approximately 150 grams of asphalt binder and 0.5 percent
fiber by weight. After each trial mix was completed, the hot, modified binder was poured
onto a square of Teflon coated paper and allowed to cool. As the asphalt flowed
outward, fiber clumps appeared as lumps in the binder, easily identified by visual
inspection. Examples of samples used for this inspection technique are shown in the
Figures 4.2, 4.3, and 4.4.

25
Figure 4.2. Visual inspection sample with large fiber clump.
Figure 4.3. Visual inspection sample with small fiber clumps.
Figure 4.4. Visual inspection sample of well mixed binder.

26
Developing fiber and binder blending techniques began with the most simplistic
approach. Fibers were added to the binder while it was stirred by hand with a small metal
spatula. The cup containing the binder was heated to keep a relatively constant binder
viscosity. Fiber clumps formed almost immediately. Vigorous hand stirring did not
disperse the clumps of fiber. As a result, this method was abandoned.
A small, variable speed rotary mixer was the next experimental mixing method that was
attempted. This mixer had a propeller style mixing blade that collected the longest fibers
and wrapped them around the mixing spindle. These fibers were scraped off with a metal
spatula and added back into the binder mixture. Mixing continued until the mixture
appeared to be of a uniform consistency. After pouring the modified binder onto
Teflon paper, fiber clumps were easily visible. This method was abandoned after
additional trials with longer mixing times were also unsuccessful in producing a mixture
free of clumping. It was decided that a mixer capable of producing more revolutions per
minute was needed.
The most readily available high rpm mixer was a Hamilton-Beach “milkshake” mixer.
Trials with this mixing method had excellent distribution of fibers, however the process
was so intense that fiber degradation occurred. The intensity of the mixing also trapped
air bubbles in the binder, potentially causing accelerated oxidation of the binder, and
leading to binder hardening. To eliminate these problems, the mixing rate was modified
by connecting the mixer to a rheostat (an adjustable resistor that controls electrical current
output), thereby providing a variable speed mixer. This added control made the modified
milkshake mixer the first viable option for blending carbon fibers and asphalt binder.
The modified mixing apparatus is shown in Figure 4.5.

27
Figure 4.5. Modified milkshake mixer.
4.3.3 Fiber Length
Fiber length is thought to be a critical factor affecting the performance of carbon fiber
modified asphalt mixtures. Therefore, fiber lengths produced by the modified shake
mixer blending method needed to be determined. This was accomplished by sampling
100 grams of modified binder and dissolving the binder in trichloroethylene. Huang and
White (1996) also recommended this method of fiber extraction in a study of
polypropylene fiber modified asphalt overlays. The solution was run through a filter and
dried to constant temperature in a 105°C oven. The filter was ashed and the fibers
collected.
Once extracted from the binder, the fibers were sampled and microscope slides were
made. Microscopic images of the slides were captured and viewed on a monitor, using a
scale to determine actual fiber lengths. A sample of 152 fibers was measured to the
nearest 0.1 mm and a distribution of lengths was plotted as shown in Figure 4.6. The
arithmetic average length of the fibers measured was 4.2 mm (0.17 in), and the geometric
mean length was 3.1 mm (0.12 in).

28
Figure 4.6. Fiber length distribution.
The decrease in fiber length was a direct result of the blending process. The plot shows
that the trend of the size distribution is nearly log normal. It was believed at the time of
this study that this distribution might be related to the critical length between microscopic
flaws on the surface of the fibers. Such flaws would decrease tensile strength and cause
failure in those areas, which would account for the observed fiber length distribution.
4.3.4 MTU Standard Mixing Procedure
All asphalt mixtures were prepared following procedures developed at MTU. Aggregate
blends were heated for a minimum of 12 hours at the mixing temperature to guarantee
that no moisture was present at the time of mixing. Modified or unmodified binder was
heated to mixing temperature for no less than one-half hour, but no more than three hours
so as not to subject the binder to excessive aging. The correct amounts of aggregate and
asphalt were placed in a heated five-gallon metal bucket and mixed by a fixed paddle as
the bucket was rotated by a mechanical motor for a period of 90 seconds. This device is
pictured in Figure 4.7.
0
5
10
15
20
25
30
35
1 2 3 4 5 6 7 8 9 10 11 12 13 14 15 16 17
Size Range (mm)
No.
of O
ccur
ance
s

29
Figure 4.7. Bucket mixer in use.
Following mixing, mixtures were short-term aged in a forced draft oven for a period of
four hours as prescribed by Superpave (AASHTO PP2). This represents the aging that
would occur as asphalt mix is stored and then transported from mixing plant to job site.
Oven temperature is set at 135°C during the aging period. Oven temperature is then
adjusted to the compaction temperature and the mixture allowed to equilibrate for one-
half hour prior to compaction.
Immediately prior to compacting, the mixture weight is recorded. The weight is input
into a spreadsheet, along with the mixture maximum specific gravity, bulk specific
gravity, and the known cross sectional area of the mold to determine the height needed to
achieve 7.0 percent air voids. All samples used for testing were compacted to 7.0±1.0
percent air to effectively eliminate the negative affects of variation in air void content.
After the specimen cooled, the bulk specific gravity of each compacted specimen was
measured (ASTM D2726) to verify that it met air void requirements. The air void data
for each sample is given in Appendix A. The samples were then prepared for testing as
described in Chapter 3 and stored at room temperature.
30
4.4 Test Results
4.4.1 Diametral Resilient Modulus Test
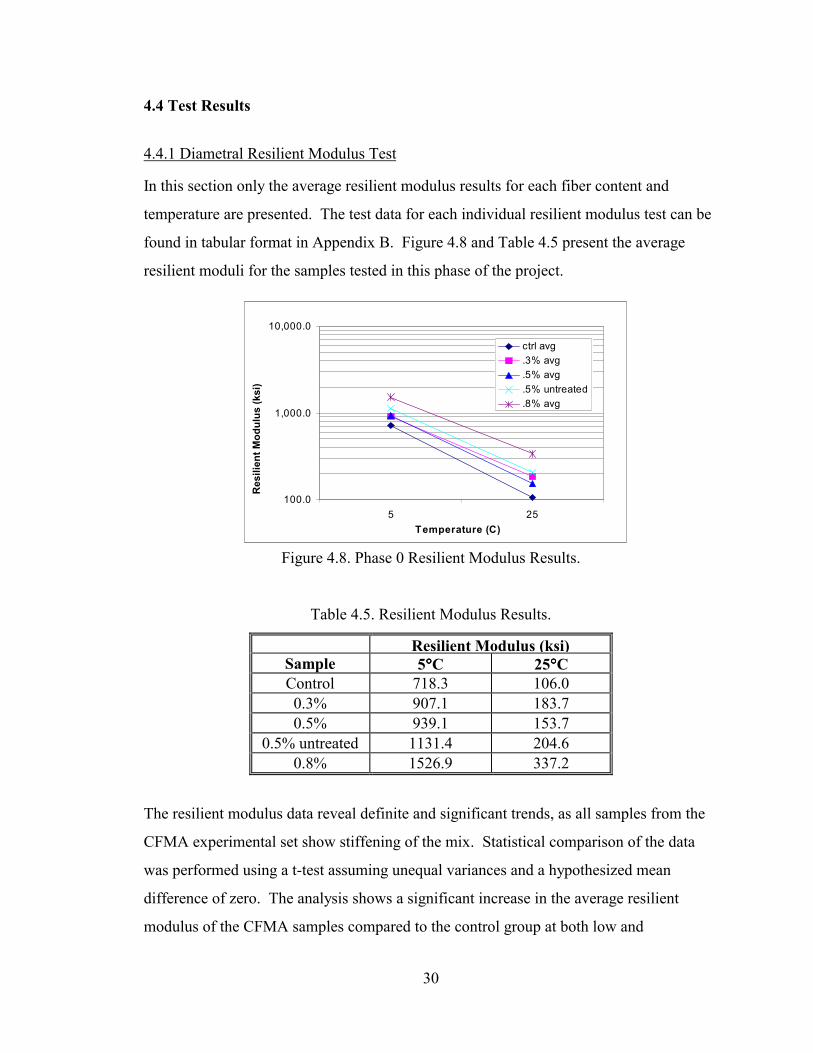
In this section only the average resilient modulus results for each fiber content and
temperature are presented. The test data for each individual resilient modulus test can be
found in tabular format in Appendix B. Figure 4.8 and Table 4.5 present the average
resilient moduli for the samples tested in this phase of the project.
Figure 4.8. Phase 0 Resilient Modulus Results.
Table 4.5. Resilient Modulus Results.
Resilient Modulus (ksi)Sample 5°°°°C 25°°°°CControl 718.3 106.00.3% 907.1 183.70.5% 939.1 153.7
0.5% untreated 1131.4 204.60.8% 1526.9 337.2
The resilient modulus data reveal definite and significant trends, as all samples from the
CFMA experimental set show stiffening of the mix. Statistical comparison of the data
was performed using a t-test assuming unequal variances and a hypothesized mean
difference of zero. The analysis shows a significant increase in the average resilient
modulus of the CFMA samples compared to the control group at both low and
100.0
1,000.0
10,000.0
5 25Temperature (C)
Res
ilien
t Mod
ulus
(ksi
)
ctrl avg.3% avg.5% avg.5% untreated.8% avg

31
intermediate temperatures (5°C and 25°C). It can be stated with 95 percent confidence
that in almost every case, the addition of carbon fibers resulted in an increase in mixture
stiffness regardless of fiber content. Although not statistically significant, there was a
slight increase in stiffness between samples modified with 0.5 percent fiber with no
surface treatment and those with an ozone surface treatment and PVP sizing.
One exception was observed when comparing the 0.8 percent samples and the control at
5°C. Although the average results of the control and 0.8 percent fiber modified samples
showed the largest numerical difference, no statistical difference could be shown between
the two sets of data. The high variance of the modified sample data and low degrees of
freedom in the test were the most probable reasons for this. A larger sample size for the
0.8 percent samples may have lowered the variance and increased the degrees of freedom.
It is noted that the validity of the results from the 0.3 percent samples at high temperature
is questionable. If the trends shown in the low temperature data held true, the stiffness of
the 0.3 percent samples would have been between the control and 0.5 percent samples.
This anomaly is also likely due to the relatively small number of samples.
The observed stiffening is of potential benefit to the performance of carbon fiber
modified mixtures. It will provide an increased resistance to permanent deformation and
rutting. It also contributes to an increase in the fatigue life of the pavement. The
potential for improved performance in these areas is discussed in later sections.
4.4.2. Repeated Load Deformation
The repeated load deformation test is used to assess the rutting potential of AC mixtures.
One of the most important results from repeated load deformation tests is the
determination of the tertiary flow point. The beginning of tertiary flow is defined as the
point when the slope of the strain versus pulse curve reaches its minimum value prior to
failure. Table 4.6 summarizes the tertiary flow data. It provides the average minimum
slope, the average number of load repetitions, and average accumulated strain at the point

32
where tertiary flow begins for each test group. The complete data set for each sample
tested for repeated load deformation can be found in Appendix B.
Table 4.6. Phase 0 tertiary flow data.
Sample Set Avg. Min. Slope Pulse Count Accumulated Strain (µµµµεεεε)Control 76 146 14692
0.3% treated 39.7 242 127240.5% treated 51.7 201 13767
0.5% untreated 42.6 242 144730.8% treated 12.1 412 10058
An arbitrary failure point of 25,000 µε was selected to compare conditions at failure. The
point was selected well beyond the tertiary flow point for all samples. The average pulse
count to 25,000 µε for each specimen, standard deviation, and coefficient of variation
(COV) are given in Table 4.7.
Table 4.7. Phase 0 average pulse count at 25,000 µε.
Sample Set Avg. Pulse Count Stnd. Dev. COV (%)Control 268 38.6 14
0.3% treated 516 130.5 250.5% treated 410 65.0 16
0.5% untreated 449 77.9 170.8% treated 1292 92.3 7
Again, an error seems apparent in the results from the 0.3 percent samples. The trends
established by the other data were not followed by these specimens. In conjunction with
the results of the resilient modulus tests, it is suspected that some sort of error was made
when preparing these samples. Thus, the data from these samples was not considered in
the analysis of results.
Although the pulse count from the repeated load deformation test can not be directly
related to actual wheel load applications, it can be used to compare the potential for
permanent deformation of different mixtures. An increased pulse count before the
beginning of tertiary flow represents more load applications before the initiation of
33
excessive rutting. Each of the CFMA samples exhibits an increased resistance to
permanent deformation. The samples at 0.8 percent fiber content show the greatest
improvement, 182 percent, over the unmodified samples. The smallest increase in
deformation resistance was with the 0.5 percent treated carbon fiber modified samples,
which showed an increase of 38 percent.
The minimum slope value for each specimen also has significance. Presumably, the
lower the minimum slope, the slower the rate at which the pavement will deform. The
results again show a trend in the data. The higher the fiber content, the slower the rate of
permanent deformation. The CFMA mixture with 0.8 percent fibers has a minimum
slope that is 84 percent lower than the unmodified mix.
Modification with 0.5 percent fiber nearly doubled the load applications before the failure
point was reached. The 0.8 percent samples showed the greatest improvement in cycles
to failure. This suggests that the addition of carbon fibers should produce a pavement
that is nearly six times as resistant to permanent deformation and rutting as without.
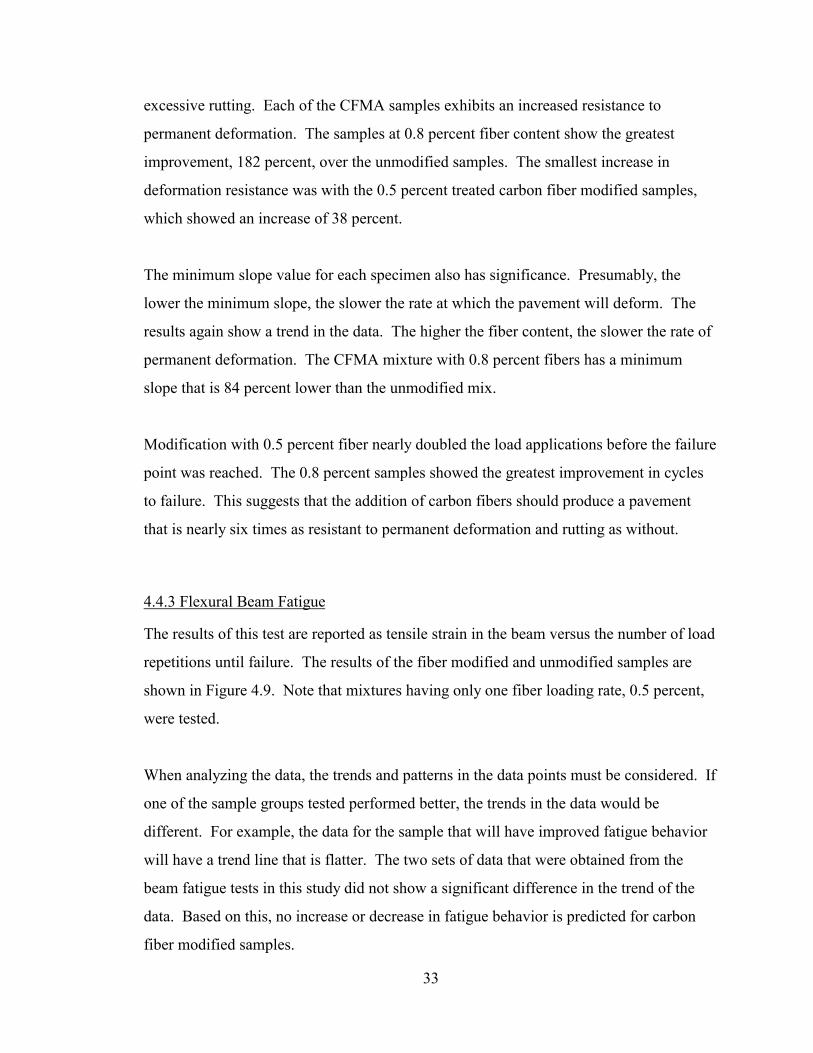
4.4.3 Flexural Beam Fatigue
The results of this test are reported as tensile strain in the beam versus the number of load
repetitions until failure. The results of the fiber modified and unmodified samples are
shown in Figure 4.9. Note that mixtures having only one fiber loading rate, 0.5 percent,
were tested.
When analyzing the data, the trends and patterns in the data points must be considered. If
one of the sample groups tested performed better, the trends in the data would be
different. For example, the data for the sample that will have improved fatigue behavior
will have a trend line that is flatter. The two sets of data that were obtained from the
beam fatigue tests in this study did not show a significant difference in the trend of the
data. Based on this, no increase or decrease in fatigue behavior is predicted for carbon
fiber modified samples.

34
Figure 4.9. Phase 0 flexural beam fatigue results.
The fatigue life of a pavement is determined using both the fatigue characteristics and the
stiffness of the mixture. In most instances a stiffer mixture will result in less tensile strain
at the bottom of the AC pavement layer for a given load and structural section. As
discussed in section 4.4.1, the CFMA mixtures tested in this study were stiffer than the
control mixture; therefore pavements constructed with the CFMA mixtures will have
increased fatigue life. For example, if the fiber modified mix and the control mix were
each constructed over an identical granular base and subgrade, then the fatigue life for a
pavement would be about 25 percent greater for the fiber modified mixture. This is due
to the decrease in tensile strain at the bottom of the asphalt layer resulting from the
increased mixture stiffness.
4.4.4 Indirect Tensile Tests
The Superpave indirect tensile test (IDT) was performed on samples containing neat
binder and those modified with 0.5 percent treated carbon fibers. Tests were conducted at
four test temperatures: 0, -10, -20, and –25°C. The tensile strengths are summarized in
Table 4.8, while selected creep compliance results are given in Table 4.9. These results
have been plotted in Figures 4.10 and 4.11, respectively.
0.0001
0.001
10000 100000 1000000 10000000
Load Repetitions
Tens
ile S
trai
n
0.5% modifiedControlTrend (Fibers)Trend (Non-Fibers)

35
Table 4.8. Phase 0 indirect tensile strength results.
Tensile Strength (MPa)Temperature (C) Control 0.5%Treated Mix
0 1.14 0.98-10 1.84 1.97-20 1.15 1.99-25 1.50 2.21
Table 4.9. Phase 0 creep compliance results.
Creep Compliance (1/GPa)Temperature (C) Control 0.5%Treated Mix
0 14.350 10.621-10 3.991 2.827-20 1.180 0.816-25 0.671 0.212
Figure 4.10. Phase 0 indirect tensile strength results.
0
0.5
1
1.5
2
2.5
-30 -25 -20 -15 -10 -5 0
Temperature (C)
Tens
ile S
trai
n
ControlExperimental
36
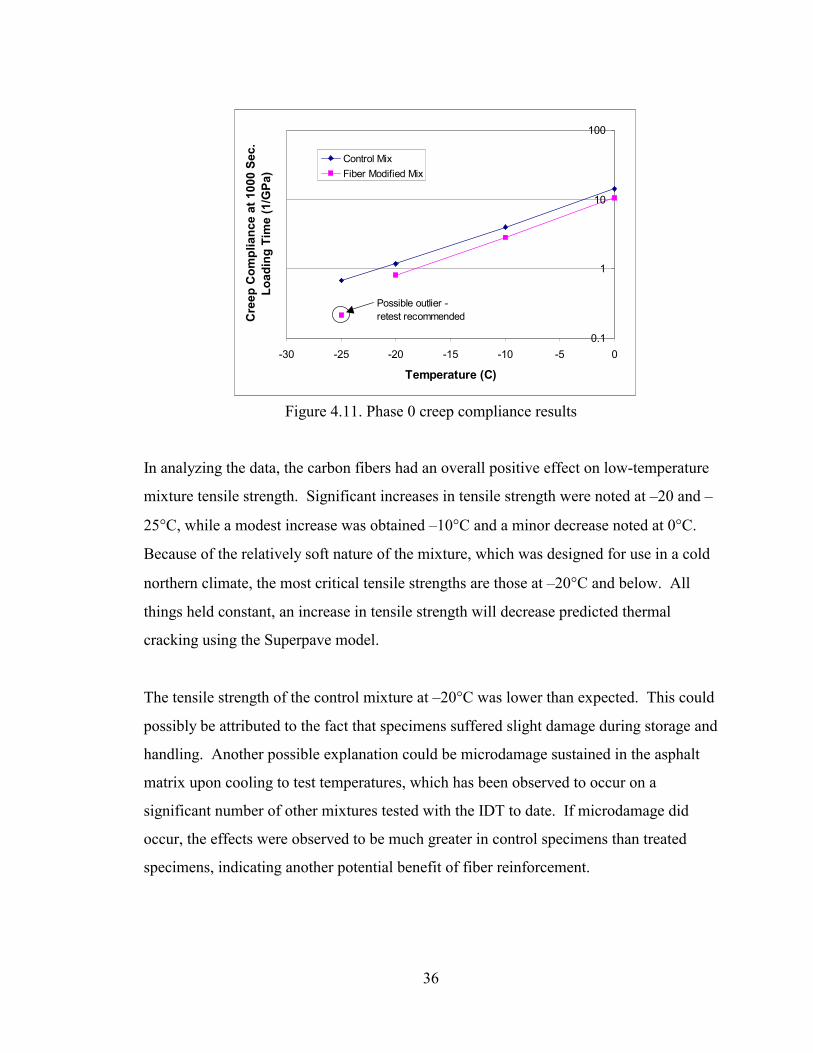
Figure 4.11. Phase 0 creep compliance results
In analyzing the data, the carbon fibers had an overall positive effect on low-temperature
mixture tensile strength. Significant increases in tensile strength were noted at –20 and –
25°C, while a modest increase was obtained –10°C and a minor decrease noted at 0°C.
Because of the relatively soft nature of the mixture, which was designed for use in a cold
northern climate, the most critical tensile strengths are those at –20°C and below. All
things held constant, an increase in tensile strength will decrease predicted thermal
cracking using the Superpave model.
The tensile strength of the control mixture at –20°C was lower than expected. This could
possibly be attributed to the fact that specimens suffered slight damage during storage and
handling. Another possible explanation could be microdamage sustained in the asphalt
matrix upon cooling to test temperatures, which has been observed to occur on a
significant number of other mixtures tested with the IDT to date. If microdamage did
occur, the effects were observed to be much greater in control specimens than treated
specimens, indicating another potential benefit of fiber reinforcement.
0.1
1
10
100
-30 -25 -20 -15 -10 -5 0
Temperature (C)
Cre
ep C
ompl
ianc
e at
100
0 Se
c.Lo
adin
g Ti
me
(1/G
Pa)
Control MixFiber Modified Mix
Possible outlier - retest recommended

37
IDT testing also revealed that carbon fibers had an overall stiffening effect on asphalt
mixtures, as noted by the lower creep compliances at all test temperatures for CFMA
mixtures (Figure 4.11). This is not unexpected, since adding rigid inclusions into a softer
material will always tend to increase the overall modulus of the material. A retest is
suggested for the creep test on the treated mixture at –25°C, as the data was inconsistent
with the other data. The creep compliance at this temperature was observed to be lower
than expected, and did not follow the regular trend observed at warmer temperatures. At
warmer temperatures, a 40 percent decrease in creep compliance was generally observed
for treated specimens. The decrease was much higher at –25°C, where a factor of about
three in compliance was observed between the control and treated mixtures. A retest is
recommended, since only two specimens were available for testing at this temperature,
and the calculated Poisson’s ratio based on test results was not in the typical range for this
temperature. Poor estimates of Poisson’s ratio are a good indicator of a non-
representative test.
4.5 Phase 0 Conclusions
Phase 0 of this study demonstrated that asphalt concrete mixtures can be modified with
pitch based carbon fibers. Modified asphalt mixtures were observed to be stiffer, more
resistant to permanent deformation, and had higher tensile strength at low temperatures.
In a pavement structure, the increase in stiffness would be expected to result in improved
fatigue life. However, the carbon fiber modified samples showed no improvement in
fatigue behavior as measured by the four point beam test or cold temperature creep
compliance test.
In general, the results indicated that stiffening of the modified mixtures was proportional
to fiber loading rate, with increased fiber content resulting in increased stiffness.
Although the sample size tested was small, the carbon fibers with no surface treatment
appear to cause more stiffening than fibers with ozone and PVP surface treatments. Mix
stiffening can enhance pavement behavior in some cases, but if a mix becomes too stiff it
can be detrimental to the performance of the pavement resulting in cracking.

38
The results of Phase 0 were promising, but were based on a relatively limited study with
few variables. As a result, it was felt that a more rigorous experiment was warranted,
which would examine multiple aggregate structures, binder contents, binder types, fiber
contents, and fiber characteristics. This lead to the Phase I study discussed in the next
chapter of this thesis.

39
CHAPTER 5: CFMA PHASE 1 STUDY
Due to the promising results in Phase 0, it was felt that further investigations were
warranted. Phase 1 of the carbon fiber modified asphalt study was intended to be a
detailed study of the effects of asphalt modification with carbon fibers. Laboratory work
for this phase of the project began in early December 1998 and continued through
December 1999. Unfortunately, initial testing did not produce the expected results,
therefore the original work plan was modified as described in this chapter. To describe
the results of the Phase I study, this section is broken down into two parts: the primary
work originally planned and the supplemental work that was undertaken to better
understand the unexpected results encounter in the primary work.
5.1 Primary Work
5.1.1 Primary Experimental Design
The original experimental design for Phase I called for six modified groups to be
compared to the control. Six samples were included in each experimental group,
representing various loading rates of pitch-based carbon fibers, PAN carbon fibers, a
polymer modifier, and a combination of pitch-based fiber and a polymer. Comparisons
between test groups were made using a two-sided t-test of sample means. As in Phase 0,
a reliability of 95 percent (α = 0.05) was chosen for the statistical analysis. The statistical
analysis was done with the statistical functions in Microsoft Excel. Unequal variances
were assumed for all tests.
In this phase of the project, the same four mechanical tests were planned for use in
characterizing the behavior of the mixtures. The resilient modulus was selected to
compare the relative stiffness of mixtures and the potential for rutting in each of these
mixtures would be assessed using the repeated load deformation test. The bending beam

40
fatigue test would be used to examine the fatigue characteristics and the low temperature
behavior of the mixtures would be quantified with the Superpave IDT test.
The mixture design used in this Phase was prepared using a crushed limestone aggregate
similar to that used in Phase 0. Once the mixture analysis was completed with the
limestone aggregate, the experiment was to be duplicated using aggregates composed of
siliceous materials. A crushed granite mixture was selected for the second aggregate
source. The use of a second aggregate was intended to show that carbon fiber
modification would be beneficial for a variety of asphalt mixtures.
As the study progressed, a potential problem became evident. After only four of the
original six modified groups were prepared, before initial test results suggested a
problem. It was observed that the Phase 0 results for the resilient modulus and repeated
load deformation tests were not duplicated in Phase 1. Since one of the main objectives
of this portion of the study was to validate the Phase 0 results, the laboratory work was
redirected to determine why this unexpected outcome occurred. This investigation is
discussed in the next section under supplemental testing. The test groups that were
actually prepared and tested in the primary work in this phase are shown in Table 5.1.
Beam fatigue and IDT tests were postponed and eventually eliminated.
Table 5.1. Primary Work for Phase 1.
Sample ReplicatesControl 6
0.25% Fiber 60.5% Fiber 60.75% Fiber 60.5% PAN 6
5.1.2 Superpave Mix Design
In contrast to Phase 0, which used a production mixture, the asphalt mixture used in
Phase 1 was designed specifically for the project. The design traffic load was selected to
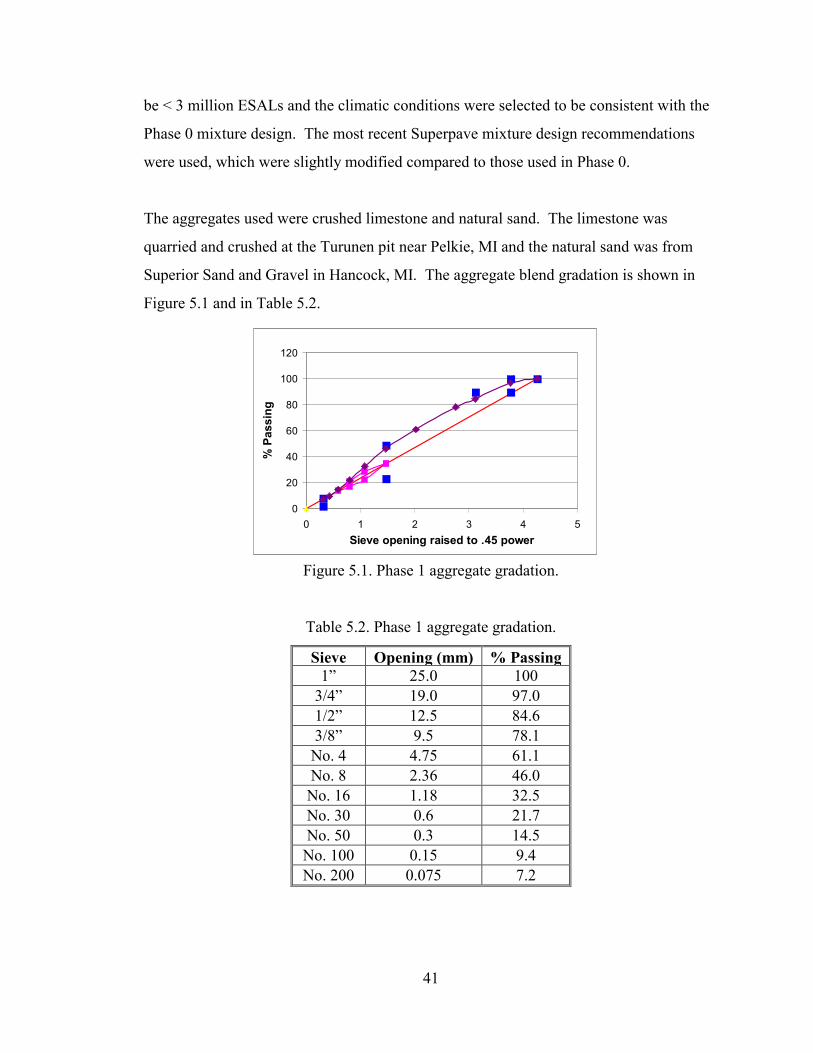
41
be < 3 million ESALs and the climatic conditions were selected to be consistent with the
Phase 0 mixture design. The most recent Superpave mixture design recommendations
were used, which were slightly modified compared to those used in Phase 0.
The aggregates used were crushed limestone and natural sand. The limestone was
quarried and crushed at the Turunen pit near Pelkie, MI and the natural sand was from
Superior Sand and Gravel in Hancock, MI. The aggregate blend gradation is shown in
Figure 5.1 and in Table 5.2.
Figure 5.1. Phase 1 aggregate gradation.
Table 5.2. Phase 1 aggregate gradation.
Sieve Opening (mm) % Passing1” 25.0 100
3/4” 19.0 97.01/2” 12.5 84.63/8” 9.5 78.1No. 4 4.75 61.1No. 8 2.36 46.0No. 16 1.18 32.5No. 30 0.6 21.7No. 50 0.3 14.5No. 100 0.15 9.4No. 200 0.075 7.2
0
20
40
60
80
100
120
0 1 2 3 4 5Sieve opening raised to .45 power
% P
assi
ng

42
The fine aggregate from the No. 8 (2.36 mm) sieve to the No. 100 sieve (0.15 mm) was a
blend of 65 percent limestone and 35 percent sand. The sand was added to decrease the
overall VMA of the mixture. The Phase 1 aggregate is fine graded, as opposed to the
coarse gradation used in Phase 0. When graphed, fine gradations remain above the
maximum density line.
The selected asphalt binder was from the MTU stock of PG 58-28 from Marathon Oil
Company in Detroit, Michigan. Binder was stored at room temperature until use. The
measured specific gravity was 1.016. The viscosity as measured by the Brookfield
viscometer is presented in Figure 5.2, which yields a recommended mixing temperature
of 157°C and a compaction temperature of 145°C. The volumetric properties of the Phase
1 mixture are listed in Table 5.3.
Figure 5.2. Binder viscosity results.
Table 5.3. Phase 1 mixture properties at optimum asphalt content.
Asphalt content 5.6%Eff. Asphalt Content 3.7%Bulk SG 2.418Max SG 2.520VMA 12.7VFA 68.2
PG58-28 Binder
0
0.050.1
0.15
0.2
0.250.3
0.35
0.4
120 130 140 150 160 170 180
Temperature (C)
Visc
osity
(Pa*
s)
ViscosityMixingCompaction

43
The asphalt content for each carbon fiber modified mixture was optimized based on
mixture volumetrics. After compaction, the bulk and maximum specific gravities of
samples containing fiber were determined. Neither value differed significantly from the
specific gravity of the control samples (Table 5.4). Air void content of modified samples
was found to be within 0.1 percent of the unmodified, control samples. This variation
could have easily been caused by experimental and/or rounding error. The optimum
asphalt content of the 0.5 percent fiber modified mix was determined to be the same as
the control (5.6 percent). The 0.75 percent modified mixture was found to have an
optimum asphalt content of 5.65 percent. It was therefore concluded that the optimum
asphalt content for all mixtures was essentially the same.
Table 5.4. Specific Gravity of Modified and Unmodified Mixtures.
Mixture Bulk SG Max SGunmodified 2.346 2.5200.5 % fiber 2.344 2.5220.75 % fiber 2.342 2.515
5.1.3 Mixture Preparation
5.1.3.1 Fiber Evaluation and Selection
To minimize variables in the experimental design, it was decided that a single pitch-based
carbon fiber type should be selected for use in the experiment. The main factor used in
deciding which type of fiber to use was the cohesiveness between the asphalt binder and
fibers having different surface treatments, and the sensitivity of that bond to moisture.
AASHTO T283 “Resistance of Compacted Bituminous Mixture to Moisture Induced
Damage” was selected to evaluate modified mixtures containing fibers without surface
treatment and those made with fibers having an ozone surface treatment. The tensile
strength ratios for the two samples were calculated (Table 5.5).
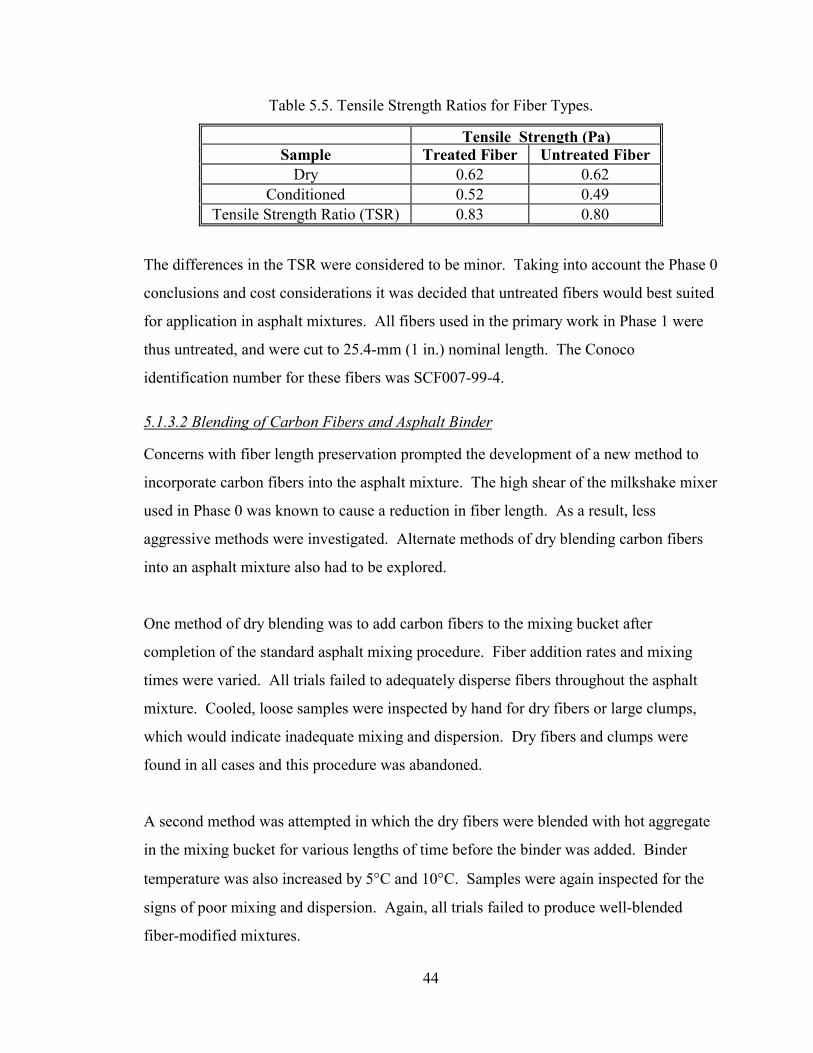
44
Table 5.5. Tensile Strength Ratios for Fiber Types.
Tensile Strength (Pa)Sample Treated Fiber Untreated Fiber
Dry 0.62 0.62Conditioned 0.52 0.49
Tensile Strength Ratio (TSR) 0.83 0.80
The differences in the TSR were considered to be minor. Taking into account the Phase 0
conclusions and cost considerations it was decided that untreated fibers would best suited
for application in asphalt mixtures. All fibers used in the primary work in Phase 1 were
thus untreated, and were cut to 25.4-mm (1 in.) nominal length. The Conoco
identification number for these fibers was SCF007-99-4.
5.1.3.2 Blending of Carbon Fibers and Asphalt Binder
Concerns with fiber length preservation prompted the development of a new method to
incorporate carbon fibers into the asphalt mixture. The high shear of the milkshake mixer
used in Phase 0 was known to cause a reduction in fiber length. As a result, less
aggressive methods were investigated. Alternate methods of dry blending carbon fibers
into an asphalt mixture also had to be explored.
One method of dry blending was to add carbon fibers to the mixing bucket after
completion of the standard asphalt mixing procedure. Fiber addition rates and mixing
times were varied. All trials failed to adequately disperse fibers throughout the asphalt
mixture. Cooled, loose samples were inspected by hand for dry fibers or large clumps,
which would indicate inadequate mixing and dispersion. Dry fibers and clumps were
found in all cases and this procedure was abandoned.
A second method was attempted in which the dry fibers were blended with hot aggregate
in the mixing bucket for various lengths of time before the binder was added. Binder
temperature was also increased by 5°C and 10°C. Samples were again inspected for the
signs of poor mixing and dispersion. Again, all trials failed to produce well-blended
fiber-modified mixtures.

45
Various trials were then undertaken to completely blend the fibers in asphalt binder prior
to mixing with aggregate. This resulted in better fiber dispersion in the overall mixture.
It was decided that the modified binder approach had the most potential to adequately
blend fibers and binder. In early trials, clear liquids having similar viscous properties to
hot binder were used in place of asphalt binder to allow visual observations to be made.
Initially, corn syrup was diluted with water to a viscosity of approximately 170 Pa*s, the
viscosity of asphalt binder at mixing temperature. Polyethyleneglycol with a similar
viscosity was selected for further trials because it possessed wetting characteristics that
more closely resembled those of asphalt.
It was found that kitchen mixers with the standard flat beater attachment could blend
fibers and asphalt binder with little damage to the fibers, causing little to no reduction in
the mean fiber length. A Hobart mixer with a two-quart mixing bowl and the flat beater
was used to blend the fiber and binder. Trials with diluted syrup showed that fibers easily
dispersed with little length degradation, as did trials with polyethyleneglycol. Ten fibers
were selected at random from the 1000-gram trial blends and the length measured. All
fibers from all trials measured 25±1 mm in length. No evidence of smaller fibers could
be found by visual inspection.
As a result of this work, the final procedure used to blend the fiber and binder is
summarized as follows:
1. Heat the mixing bowl, beater, and asphalt binder to the required mixing
temperature.
2. Pour no more than 1500 grams of asphalt binder into the mixing bowl, record
the weight, and return to the oven.
3. Weigh the amount of fiber needed for the desired fiber content to the nearest
0.01 grams.
4. Add the fiber to the mixing bucket using the beater to immerse the fiber in the
asphalt.
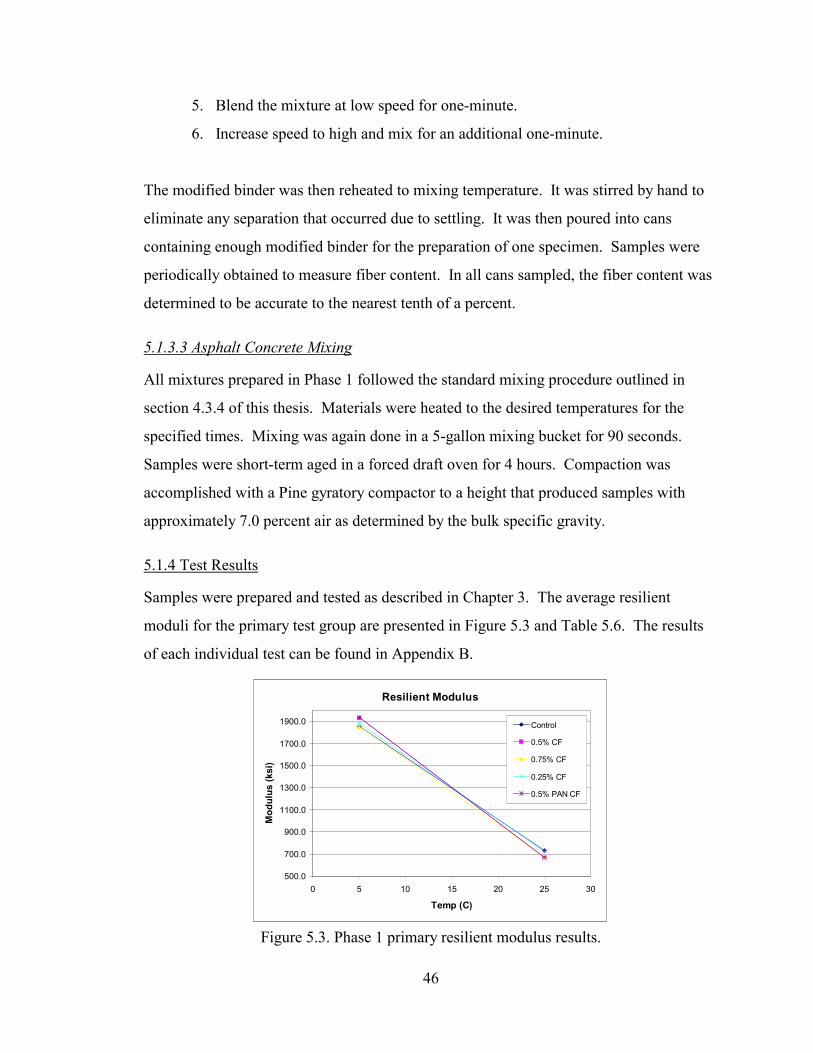
46
5. Blend the mixture at low speed for one-minute.
6. Increase speed to high and mix for an additional one-minute.
The modified binder was then reheated to mixing temperature. It was stirred by hand to
eliminate any separation that occurred due to settling. It was then poured into cans
containing enough modified binder for the preparation of one specimen. Samples were
periodically obtained to measure fiber content. In all cans sampled, the fiber content was
determined to be accurate to the nearest tenth of a percent.
5.1.3.3 Asphalt Concrete Mixing
All mixtures prepared in Phase 1 followed the standard mixing procedure outlined in
section 4.3.4 of this thesis. Materials were heated to the desired temperatures for the
specified times. Mixing was again done in a 5-gallon mixing bucket for 90 seconds.
Samples were short-term aged in a forced draft oven for 4 hours. Compaction was
accomplished with a Pine gyratory compactor to a height that produced samples with
approximately 7.0 percent air as determined by the bulk specific gravity.
5.1.4 Test Results
Samples were prepared and tested as described in Chapter 3. The average resilient
moduli for the primary test group are presented in Figure 5.3 and Table 5.6. The results
of each individual test can be found in Appendix B.
Figure 5.3. Phase 1 primary resilient modulus results.
Resilient Modulus
500.0
700.0
900.0
1100.0
1300.0
1500.0
1700.0
1900.0
0 5 10 15 20 25 30
Temp (C)
Mod
ulus
(ksi
)
Control
0.5% CF
0.75% CF
0.25% CF
0.5% PAN CF

47
Table 5.6. Phase 1 primary resilient modulus results.
Resilient Modulus (ksi)Sample 5°°°°C 25°°°°CControl 1847.6 729.8
0.25% Pitch-Based 1878.6 721.20.5% Pitch-Based 1930.7 663.0
0.5% PAN 1938.4 673.30.75% Pitch-Based 1849.3 668.8
The results of the repeated load deformation tests were analyzed to determine the load
repetitions and accumulated strain at the point of tertiary flow initiation. The results of
the primary work in Phase 1, mixtures made with the fine aggregate gradation, are listed
in Table 5.7. The fine mixture data at the selected failure point of 25,000µε is given in
Table 5.8.
Table 5.7. Phase 1 primary fine mix tertiary flow data.
Sample Set Avg. Min. Slope Pulse Count Accumulated Strain (µµµµεεεε)Control 4.969 1103 9671
0.25% Pitch-Based 4.715 1158 106790.5% Pitch-Based 4.655 1253 9033
0.5% PAN 4.171 1351 108810.75% Pitch-Based 5.036 1165 11266
Table 5.8. Phase 1 primary fine mix average pulse count at 25,000µε.
Sample Set Avg. Pulse Count Stnd. Dev. COV (%)Control 3154 704.7 22.3
0.25% Pitch-Based 3519 1071.0 30.40.5% Pitch-Based 3480 745.7 21.4
0.5% PAN 3754 629.4 16.80.75% Pitch-Based 3334 759.2 22.8
All the resilient modulus and repeated load deformation results from the experimental
groups were statistically compared to the results of the control samples. Like Phase 0,
this was done using a t-test assuming unequal variances and a confidence level of 95

48
percent (α = 0.05). Unlike Phase 0, there was no statistical difference observed between
any of the experimental groups and the control samples. In other words, the addition of
carbon fiber, whether pitch-based or PAN, had no significant stiffening effect on the
asphalt mixtures.
5.2 Supplemental Work
The results and analysis of the specimens as part of the primary experiment in Phase 1
prompted the addition of supplemental experimental groups to the study. The purpose of
these supplemental groups was to examine some of the factors that may have caused the
differences between the Phase 0 results and those from the primary samples in Phase 1.
5.2.1 Supplemental Experimental Plan
Supplemental experimental groups with smaller sample sizes were created to
systematically eliminate variables that may have caused the differences in results between
the phases. The variables considered included the fiber/binder blending process, the fiber
type, and the aggregate gradation. The blending process was the first variable considered.
Three replicates were made using the blending process developed for Phase 0. Samples
were tested for resilient modulus and repeated load deformation. The results were
analyzed and compare to the control.
The second variable examined was the fibers themselves. The fiber manufacturing
process has continued to evolve, and the fibers themselves have changed between the
phases of the project. Consequently, different fibers were used for Phase 1 than in Phase
0. It was necessary to determine if the change in the fibers caused the observed variation
in overall results. Therefore three replicates were made with the untreated fibers that
were used in Phase 0. The resilient modulus of these specimens was then measured.
The third variable considered was the aggregate. Because the main component of each
mixture was crushed limestone, focus was shifted to the aggregate structure. The
aggregate gradation used for the mixture in Phase 0 was duplicated for the supplemental
experimental samples in Phase 1. The gradation of this mixture, when plotted on the 0.45

49
power graph, drops below the maximum density line above restricted zone, therefore the
samples with this gradation are designated as “coarse” samples. The mixture was
checked for compliance with Superpave aggregate consensus properties. The mixture
was prepared assuming the same asphalt content as Phase 0 (4.9 percent). A total of six
replicates were prepared and tested using the resilient modulus and repeated load
deformation tests.
A summary of the samples prepared in the course of this supplemental test group is
shown in Table 5.9. The experimental design of Phase 1 of the CFMA project focused on
the effects of modifying asphalt mixtures with three loading rates of pitch-based carbon
fibers and one loading of PAN-based fibers. A supplemental group of samples were
prepared and tested to examine the effects of the fibers themselves, the fiber/binder
blending process, and the aggregate gradation on the behavior of fiber modified mixtures.
Table 5.9. Supplemental test group for Phase 1.
Samples Replicates0.5% Old Fiber 3
0.5% Shake Mixer 3Coarse – Ctrl 6
Coarse – 0.75% Fiber 6
The mixtures designated “old fibers” and “shake mixer” were prepared with the mixture
design, materials, and procedures described in section 5.1. The raw data from the
supplemental test group are also given in Appendix B. The resilient modulus and
repeated load deformation results from these two groups are compared to the results of
the control mixture of the primary sample group.
Because the coarse graded samples prepared using the Phase 0 aggregates required a new
control group, the results are reported separately. These samples were prepared according
to the procedures outlined in section 5.1 and tested as described in Chapter 3.
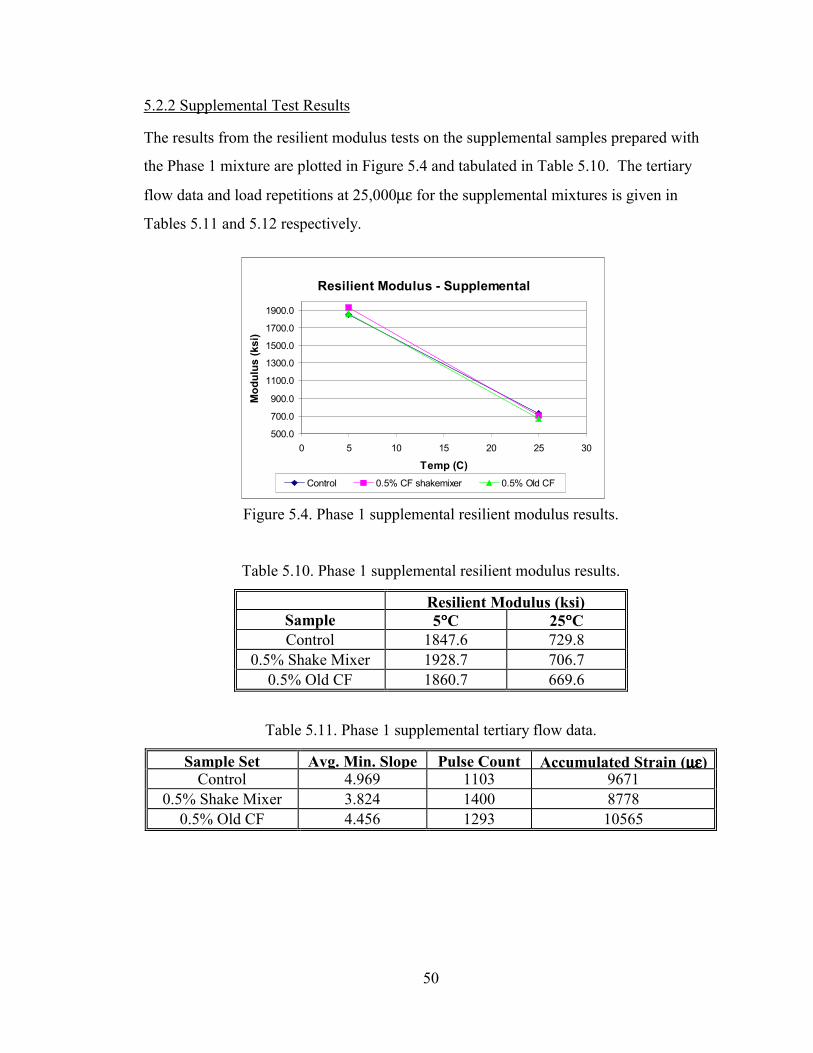
50
5.2.2 Supplemental Test Results
The results from the resilient modulus tests on the supplemental samples prepared with
the Phase 1 mixture are plotted in Figure 5.4 and tabulated in Table 5.10. The tertiary
flow data and load repetitions at 25,000µε for the supplemental mixtures is given in
Tables 5.11 and 5.12 respectively.
Figure 5.4. Phase 1 supplemental resilient modulus results.
Table 5.10. Phase 1 supplemental resilient modulus results.
Resilient Modulus (ksi)Sample 5°°°°C 25°°°°CControl 1847.6 729.8
0.5% Shake Mixer 1928.7 706.70.5% Old CF 1860.7 669.6
Table 5.11. Phase 1 supplemental tertiary flow data.
Sample Set Avg. Min. Slope Pulse Count Accumulated Strain (µµµµεεεε)Control 4.969 1103 9671
0.5% Shake Mixer 3.824 1400 87780.5% Old CF 4.456 1293 10565
Resilient Modulus - Supplemental
500.0
700.0
900.0
1100.0
1300.0
1500.0
1700.0
1900.0
0 5 10 15 20 25 30
Temp (C)
Mod
ulus
(ksi
)
Control 0.5% CF shakemixer 0.5% Old CF

51
Table 5.12. Phase 1 supplemental average pulse count at 25,000µε.
Sample Set Avg. Pulse Count Stnd. Dev. COV (%)Control 3154 704.7 22.3
0.5% Shake Mixer 4549 273.0 6.00.5% Old CF 3795 153.5 4.0
The supplemental mixtures made with the coarse aggregate gradation were tested for
resilient modulus. The results of these tests are given in Figure 5.5 and in Table 5.13.
Figure 5.5. Supplemental coarse graded resilient modulus results.
Table 5.13. Supplemental coarse graded resilient modulus results.
Resilient Modulus (ksi)Sample 5°°°°C 25°°°°CControl 2033.8 663.90.75% 2230.4 714.0
The repeated load deformation results for the coarse graded mixtures are given in Tables
5.14 and 5.15. Table 5.14 gives the tertiary flow data and table 5.15 lists the average
pulse counts at 25,000µε.
Table 5.14. Supplemental coarse graded mix tertiary flow results.
Sample Set Avg. Min. Slope Pulse Count Accumulated Strain (µµµµεεεε)Control 7.551 1010 12452
0.75% CF 6.497 1144 12341
Resilient Modulus - Coarse Mixtures
500.0
1000.0
1500.0
2000.0
2500.0
0 5 10 15 20 25 30
Temp (C)
Mod
ulus
(ksi
)
Control 0.75% CF

52
Table 5.15. Supplemental coarse mixture average pulse count at 25,000µε.
Sample Set Avg. Pulse Count Stnd. Dev. COV (%)Control 2420 52.6 2.20
0.75% CF 2847 785.8 27.6
5.3 Phase 1 Conclusions
The mixture designed for Phase 1 was a high quality mix, as evidenced by the test results.
It had high stiffness and good resistance to permanent deformation compared to the
mixture used in Phase 0. The addition of carbon fibers to the mixture, whether pitch-
based or PAN, had little effect on the measured properties, with differences attributed to
the statistical variability inherent in the tests.
Supplemental mixtures made with a coarse gradation similar to that used in Phase 0
showed that the fibers had some effect on the measured properties. Statistically however
it could not be shown with 95 percent confidence that the average results were different
between the control and the fiber modified mixture.
As a result, Phase 1 of the CFMA project is inconclusive. No statistically significant
changes were observed in any of the mixtures due to modification of the asphalt binder
with carbon fibers. All attempts to duplicate the statistically significant results from
Phase 0 were unsuccessful. The reasons for this are unknown at this time and further
research is required to determine whether carbon fiber modification of asphalt mixtures is
indeed beneficial.

53
CHAPTER 6: RESULTS FROM CFMA FIELD STUDY
In addition to the work described in Phase 0 and Phase 1, an additional study involved the
construction of a CFMA pavement test section in Ponca City, Oklahoma to demonstrate
that large-scale applications were possible. Cores obtained from this study were tested to
assess the mechanical behavior of field constructed CFMA mixtures. An additional
aspect of this study was to evaluate whether fiber length could be maintained through an
actual construction sequence. A method was developed by Conoco, Inc. to measure the
length of fibers extracted from compacted mixtures. This procedure was used to obtain
fiber lengths for samples prepared in the laboratory.
6.1 Field Trials
During the course of the Phase 1 study, Conoco, Inc. and an Oklahoma paving contractor,
conducted field trials of carbon fiber modified asphalt mixtures. Fibers were
incorporated into the mixtures in two ways, being added dry to a pug mill on a batch by
batch basis or blended with the binder in the asphalt holding tank using a recirculating
pump before mixing with aggregate in the pug mill. There were no major problems
observed during mixing with either method. The mixtures were then placed and
compacted using conventional paving equipment as an overlay on an existing asphalt
pavement. The overlay was compacted to a target air void content of four percent. There
were no problems associated with construction of the modified mixtures.
Although the laboratory work failed to conclusively show behavior enhancement for
CFMA mixtures, important lessons were learned from the field trial. First, it
demonstrated that CFMA pavements could be easily constructed with little or no
modification in existing equipment. The mixtures made by dry mixing the fibers showed
evidence of fiber clumping and poor coating of fibers with binder, however this could
have potentially been avoided by increasing mixing time and temperature. The pug mill
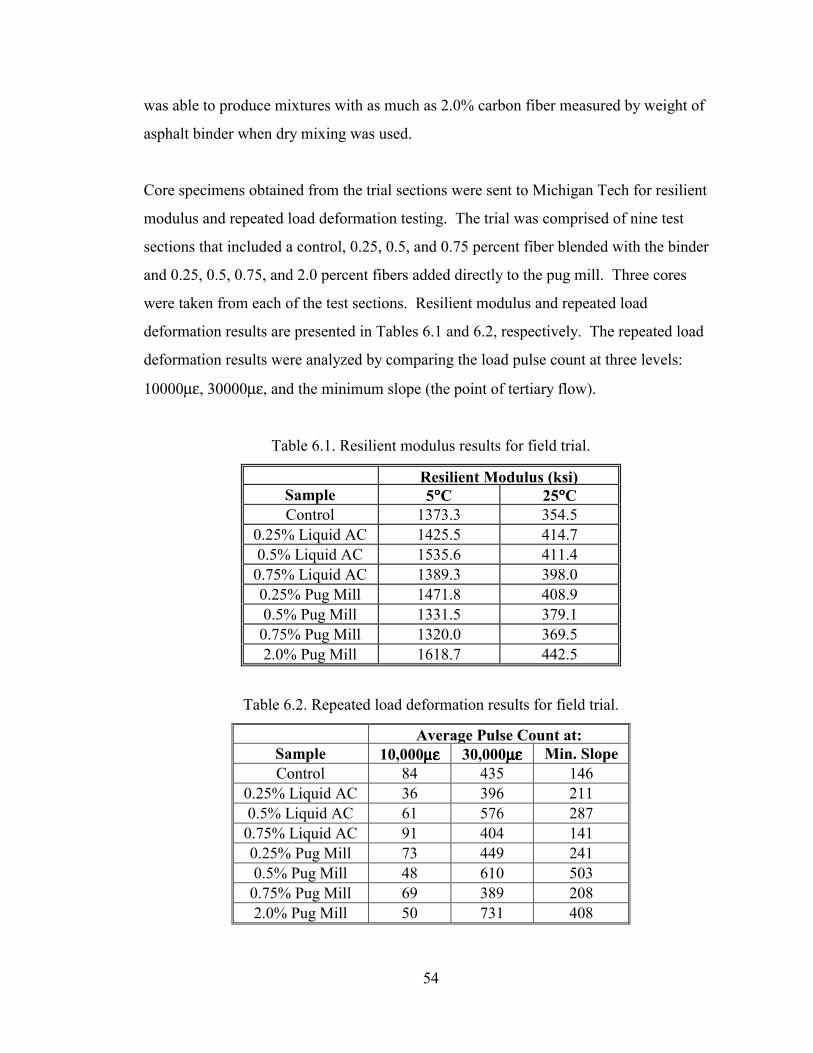
54
was able to produce mixtures with as much as 2.0% carbon fiber measured by weight of
asphalt binder when dry mixing was used.
Core specimens obtained from the trial sections were sent to Michigan Tech for resilient
modulus and repeated load deformation testing. The trial was comprised of nine test
sections that included a control, 0.25, 0.5, and 0.75 percent fiber blended with the binder
and 0.25, 0.5, 0.75, and 2.0 percent fibers added directly to the pug mill. Three cores
were taken from each of the test sections. Resilient modulus and repeated load
deformation results are presented in Tables 6.1 and 6.2, respectively. The repeated load
deformation results were analyzed by comparing the load pulse count at three levels:
10000µε, 30000µε, and the minimum slope (the point of tertiary flow).
Table 6.1. Resilient modulus results for field trial.
Resilient Modulus (ksi)Sample 5°°°°C 25°°°°CControl 1373.3 354.5
0.25% Liquid AC 1425.5 414.70.5% Liquid AC 1535.6 411.40.75% Liquid AC 1389.3 398.00.25% Pug Mill 1471.8 408.90.5% Pug Mill 1331.5 379.10.75% Pug Mill 1320.0 369.52.0% Pug Mill 1618.7 442.5
Table 6.2. Repeated load deformation results for field trial.
Average Pulse Count at:Sample 10,000µµµµεεεε 30,000µµµµεεεε Min. SlopeControl 84 435 146
0.25% Liquid AC 36 396 2110.5% Liquid AC 61 576 2870.75% Liquid AC 91 404 1410.25% Pug Mill 73 449 2410.5% Pug Mill 48 610 5030.75% Pug Mill 69 389 2082.0% Pug Mill 50 731 408
55
Neither the resilient modulus results nor the repeated load deformation results show any
trends that would indicate improved behavior with the addition of carbon fiber to the
asphalt mixtures. Statistical analysis with a two-side t-test at a level of 95 percent
confidence confirmed this conclusion. These results further corroborate the findings of
Phase 1 that the addition of the carbon fibers had no apparent influence on the behavior of
the asphalt mixtures.
When the carbon fiber was pre-blended with the binder, some fiber clumping in the
finished pavement was observed, but not to the same extent as mixing in the pug mill.
The pre-blended fibers were completely coated with asphalt and increasing the mixing
time and temperature most likely would have eliminated the clumps. Samples taken from
the asphalt tank at regular time intervals showed that the fibers were uniformly distributed
throughout. The recirculating pump kept the fibers suspended in the asphalt and was not
clogged with the addition of more fibers.
This field study proved that carbon fiber modified asphalt mixtures could be constructed.
No changes to the standard paving equipment were necessary. The contractor believed
that the modified mixtures actually compacted easier, but this claim can not be proven.
The mixing time and/or temperature of fiber modified mixtures should be increased to
allow fibers to be completely coated with binder and evenly dispersed throughout the
mixture.
6.2 Fiber Length in Compacted Mixtures
From the perspective of past work with fiber composites, it is known that fiber length
plays a critical role in modifying the behavior of the mixture. Early concerns in this study
focused on flaws on the surface of the carbon fibers that were thought to result in the
relatively short fiber length distributions measured in modified binders prior to mixing
with aggregates. In the course of this study it was determined that the mixing process
with the aggregate actually controlled fiber length. A method was developed by Conoco,

56
Inc. to extract fibers from compacted asphalt concrete mixtures, and then determine fiber
length through microscopic analysis.
Samples were taken from the field trial site in Ponca City, Oklahoma for binder
extraction and fiber length determination. The results are presented in Table 6.3. The
compacted mixtures were cored and loose AC mixture was collected during placement
for fiber length determination.
Table 6.3. Fiber length results from field trial.
Mix Type Average Fiber Length (mm) Median Fiber Length (mm)0.25% Liquid AC 0.32 0.260.5% Liquid AC 0.31 0.270.75% Liquid AC 0.45 0.380.25% Pug Mill 0.49 0.380.5% Pug Mill 0.49 0.350.75% Pug Mill 0.65 0.452.0% Pug Mill 0.25 0.20
After Phase 1 laboratory testing, MTU sent five samples to Conoco, Inc. for fiber length
determination. The results are given in Table 6.4.
Table 6.4. Fiber lengths of various mixtures.
Sample ID Sample Type Avg. Fiber Length Standard Deviation7/12-3 0.5% 0.95mm 0.71mm7/16-2 0.75% 0.76mm 0.67mm8/5-3* 0.5% PAN 0.63mm 0.59mm8/18-2 0.5% Old Fiber 0.64mm 0.56mm9/15-3 0.75% Coarse 0.87mm 0.83mm
* Incorrectly reported as sample 8/15-3
The results show that regardless of the fiber loading rate, fiber type, or aggregate
gradation, that the fiber length was significantly degraded to an average length less than 1
mm, a length reduction of as much as 98 percent. Neither fiber type nor content seemed
to affect the final length. Thus it can be concluded that the critical flaws present in the

57
pitch-based carbon fibers do not appear to be the main factor controlling fiber length,
since these flaws are not present on the more ductile PAN-based fibers. These limited
results show that fiber length is controlled by the mixing process with the aggregate. It
needs to be investigated how the maximum aggregate size of the mixture and/or
aggregate angularity influence the final fiber length.
58
CHAPTER 7: DISCUSSION
The study of carbon fiber modified asphalt mixtures at MTU has produced varying results
from Phase 0 and Phase 1, and from the field trial. When data from the three studies are
analyzed together, important results can be concluded. Key factors affecting the mixture
behavior are the method of fiber incorporation and ultimate fiber length. The quality of
the initial AC mixture also appears to be important. Mechanical behavior of CFMA
mixtures may also be dependent upon the stiffness of the asphalt binder and the climate
for which each is designed.
Observations made in each study in this project have shown that carbon fibers disperse in
an AC mixture more evenly and with less effort if they are first blended with the asphalt
binder. In Phase 0, it was shown that a blend of fibers and asphalt binder could be mixed
with aggregate with no major changes to the mixing process. Phase 1 included the
investigation of different methods of incorporating the fibers into mixture. Dry mixing
was inadequate, as were other methods that added dry fiber at various times during the
mixing process. The field trials confirm the conclusion that fiber and binder should be
blended before mixing with the aggregate. Samples of mix from the field trials were
visually inspected for fiber clumping. Some clumps were found in the mixtures made
from the binder modified in the holding tank, but these clumps were small and
completely coated with binder. These would likely be eliminated by a slight increase in
the mixing time or temperature. Mixtures from the trial site that were made by adding the
dry fibers to the pug mill revealed clumps of dry fibers readily visible on the mat surface.
Without the bond between the carbon fibers and the asphalt cement, fiber modification
will not benefit AC pavements.
It is known that for fiber reinforcement to have an impact on material behavior, sufficient
fiber length must be maintained. Thus, the preservation of fiber length in asphalt
mixtures is considered of paramount importance. One of the objectives of Phase 1 was to

59
develop a fiber/binder blending process that would preserve the one-inch nominal fiber
length. As discussed, the blending of the fibers with the binder was ultimately done with
relative ease both in the laboratory using the Hobart mixer and in the field using the
recirculating pump in the asphalt holding tank. However, preserving the fiber length in
the final mixture was found to be extremely difficult. The length data presented in
Chapter 6 show that fibers were reduced in length by as much as 98-percent after mixing
with the aggregate for Phase 1 and field mixtures (no fiber length data is available from
the Phase 0 study specimens). Fiber lengths form laboratory prepared samples are longer
than those from the field trials, likely due to the larger batch size of the field mixtures.
This is true for both pitch-based and PAN-based carbon fibers, suggesting it is not related
to critical flaws, but instead most likely a result of the fiber brittleness. At this time, no
solution to this problem has been found, but it is believed that longer fiber length must be
achieved if carbon fiber modification of asphalt mixtures is to be successful.
The quality of the initial mixture appears to be critical to the degree of which fiber
modification is effective. The Phase 0 mixtures were of relatively poor quality from the
perspective of mechanical behavior, as the control samples had low stiffness and poor
repeated load deformation characteristics. When modified with carbon fibers, these
mixtures showed significant increase in both stiffness and rutting resistance. This
increase in stiffness was directly related to increases in fiber content. On the other hand,
the mixture used in the Phase 1 primary work had substantially improved mechanical
behavior, having higher stiffness and resistance to permanent deformation compared to
the Phase 0 mixture. The addition of carbon fibers to this higher quality mixture showed
no discernable changes in the mechanical behavior of the mixtures, regardless of the fiber
type or loading level.
The results form the field trials and the supplemental Phase 1 testing seem to support the
theory that initial mixture quality is an important factor. The highest quality mixture,
based on the mechanical testing, examined in these studies is the Phase 1 primary
mixture. The next highest quality mixture was the Phase 1 supplemental coarse graded

60
mix, followed by the field trial mixture, with the Phase 0 mixture having the poorest
mechanical behavior. It is noted that the Phase 1 coarse mixture was more temperature
susceptible than other mixtures. This could be due to the asphalt binder controlling the
mechanical behavior rather than aggregate on aggregate contact. The observed
improvement in mixture quality with the addition of carbon fibers was most evident in
the Phase 0 mixture. The least improvement in test results was seen in the Phase 1
primary mixture. Therefore it seems that an inverse relationship between the quality of
the initial mixture and the improvements seen by adding carbon fibers exists. As the
mixture quality decreases, the improvement in mixture behavior resulting from fiber
addition goes up, and vice versa. It is likely that carbon fiber modification may only be
beneficial when the base mix is of lower quality as measured through mechanical testing.
In essence, the Phase 1 mixture may have been “too good”, based on the two tests
performed, to benefit from carbon fiber modification.
Another factor that may be contributing to the inconclusive results is that different asphalt
binders were used in the two laboratory phases. The two binders came from different
sources and were graded differently. A PG52-28 was used in Phase 0, which is less stiff
at higher temperatures than the PG58-28 used in Phase 1. Additionally, not only is there
a difference in the physical properties of the binder, but they are also likely varying in
chemical composition. This may also have an impact on how the fiber and binders
interact. The increase in mixture stiffness observed in Phase 0 could be potentially due to
an increase in binder stiffening for a softer binder resulting from the addition of carbon
fibers. But as the stiffness of the base binder increases, the changes in mixture stiffness
due to fiber addition, as measured by the resilient modulus and repeated load deformation
tests, becomes less obvious. The field trials were constructed using a PG 64-28 asphalt
binder, which is another grade stiffer than the Phase 1 binder. These mixtures also
showed no improvement in the measured mixture characteristics after modification with
carbon fibers. This suggests that the performance of carbon fiber modified mixtures may
be influenced by the stiffness of the base binder, and the impact of fiber addition only
becomes apparent if the base binder is relatively soft at higher temperatures.

61
In Phase 0, resilient modulus results showed more significant improvement at higher
temperatures, while Phase 1 did not. Phase 0 also showed improved behavior of the
CFMA mixtures at the high temperature of the repeated load deformation test. The
PG52-28 binder is not designed for use in climates with relatively high temperatures. The
PG58-28 binder from Phase 1 or the PG64-28 from the field trials are used in these
climates. Carbon fiber modification of the asphalt binder may improve the high
temperature behavior of the binder to a certain point. If the 58-28 binder already exceeds
that point then the effects of the fiber would be masked.
The low temperature results of the IDT testing suggest that the base binder may be the
controlling factor until the samples begin to fail, at which point the carbon fibers have an
impact. The results of modified mixtures at 0 and -10°C showed little difference in
tensile strength compared to the control. This suggests that the binder is controlling the
mixture performance. As the temperature is decreased further, the binder becomes more
brittle. Brittle binder will cause the tensile strength to decrease as shown by the results of
the control mix. But in the fiber modified mixtures, as the binder began to fail, the
effects of the fibers became evident. This is seen in the IDT results at –20 and -25°C,
where the fibers increased the tensile strength of the modified mixtures. The theory that
high tensile strength carbon fibers would slow the propagation of cracks in asphalt
mixtures by bridging and restraining them as they form seems to be supported by this
data, but more data would need to be collected to verify this.
Due to the limited data collected, further research is needed to fully explain the observed
CFMA behavior.

62
CHAPTER 8: CONCLUSIONS
To investigate the behavior of carbon fiber modified asphalt mixtures, a study sponsored
by Conoco, Inc. was conducted at Michigan Technological University that consisted of
two independent phases. The first, known as Phase 0, was a preliminary study used to
determine the feasibility of modifying the behavior of a standard AC mixture through the
use of pitch-based carbon fibers. This study focused strictly on the ability of mixing and
compacting mixtures made with CFMA to achieve statistically significant improvements
in the mechanical properties of the mixture.
The second phase in the CFMA study at MTU was referred to as Phase 1. The purpose of
this phase was to identify and better understand the factors that affect the behavior of
CFMA. Fiber surface treatment and type were evaluated as well as ways to preserve fiber
length.
A field study, conducted by Conoco, was done to identify potential problems with the
mixing and placement of CFMA mixtures. There were no major problems observed
during mixing with either the pug mill method or the recirculating pump method. The
mixtures were then placed and compacted using conventional paving equipment as an
overlay on an existing asphalt pavement. There were no problems associated with
construction of the modified mixtures.
Testing and observations of carbon fiber modified asphalt specimens concluded that:
• Carbon fibers should be blended with asphalt binder before mixing with aggregate to
achieve complete coating and even distribution of fibers throughout the mixture.
• The length of carbon fibers in the final mixture is critical. Ways of preserving the
fiber length while mixing with aggregate must be investigated.

63
• The quality of the initial asphalt mixture is a key factor. Higher quality base mixtures
showed no improvements, while the lower quality mixtures showed significant
improvements in the performed tests.
• Asphalt cement grades may affect the behavior of CFMA mixtures in different ways.
• The addition of carbon fibers improves the high temperature behavior of the asphalt
binder. If the test temperature does not reach the upper binder grade temperature, the
effects of the fibers may be masked by binder behavior.
• The low temperature behavior of CFMA mixtures may be dominated by the binder
until it begins to fail, at which time the fibers dominate the behavior.

64
CHAPTER 9: RECOMMENDATIONS FOR FUTURE WORK
More research is needed to verify the results and conclusions of this thesis. First and
foremost, the fiber length must be maintained during the mixing process with the
aggregate. Without an increased fiber length, the potential benefit of carbon fiber
modified asphalt may never be realized. The maximum aggregate size may play a role in
the final fiber length.
The initial quality of asphalt mixtures and the benefit of adding carbon fibers should also
be studied. The cost of carbon fibers does not warrant their use in only lower quality
asphalt mixtures. Carbon fibers must be found to benefit all asphalt mixtures to gain
wide spread acceptance.
The effects of aggregate gradation on CFMA mixtures must be examined. The limited
results of this study did not adequately determine whether aggregate gradation plays a
major role in the behavior of mixtures containing carbon fibers.
The effects of different binder grades also need to be addressed. Binder grades determine
what climates an asphalt binder can be used in. Whether CFMA is most beneficial in
cold or warm climates must be studied before it can be used in construction.
The ability of carbon fiber to increase the tensile of asphalt mixtures at low temperatures
must be studied in greater detail. Reduced potential for thermal cracking alone could be
enough to give CFMA a place in the market.
Carbon fiber modified asphalt is a relatively new area of study with great potential for
further research. This research should focus on some of the specific properties discussed
in this thesis.

65
REFERENCES
Anderson, R.M.; Robert McGennis, (1995). “Superpave Asphalt Mixture Design
Illustrated, Level 1 Lab Methods”, Federal Highway Administration, p.1-19.
Chen, Pu-Woei; D.D.L.Chung, Xuli Fu, (1997). "Microstructural and Mechanical Effects
of Latex, Methylcellulose and Silica Fume on Carbon Fiber Reinforced Cement", ACI
Material Journal, p.147-155.
D.D.L. Chung, (1994). “Carbon Fiber Composites”, Butterworth-Heinemann Publishing,
Newton, MA, p.4-7.
Decoene, Y. (1990). “Contribution of cellulose fibers to the performance of porous
asphalts” Transportation Research Record n 1265, p. 82.
Huang, Haiming; White, Thomas. (1996). “Dynamic properties of fiber-modified overlay
mixture” Transportation Research Record n 1545 p 98-104.
Huet, M.; A. de Boissoudy, J.C. Gramsammer, A. Bauduin, J. Samanos, (1990).
“Eperiments with porous asphalt on the Nantes fatigue test track” Transportation
Research Record n 1265 p 54-58.
Jenq, Yeou-Shang; Chwen-Jang Liaw, Pei Liu. (1993). “Analysis of crack resistance of
asphalt concrete overlays. A fracture mechanics approach” Transportation Research
Record n 1388 p 160-166.
Jiang, Yi; Rebecca S. McDaniel. (1993). “Application of Cracking and Seating and Use
of Fibers to Control Reflection Cracking.” Transportation Research Record n 1388 p 150-
159.
66
Maurer, Dean A.; Gerald Malasheskie. (1989). “Field performance of fabrics and fibers
to retard reflective cracking” Transportation Research Record n 1248 1989 p 13-23.
Partl, M.N.; T.S. Vinson, R.G. Hicks. (1994). “Mechanical properties of stone mastic
asphalt” Proceedings of the Third Materials Engineering Conference 804 Oct 1994,
ASCE p 849-858.
Roberts, Freddy L. et al. (1996) Hot Mix Asphalt Materials, Mixture Design, and
Construction 2nd edition, NAPA Research and Education Foundation p 1-10.
Selim, Ali A.; Ramzi Taha, Fouad Bayomy. (1994) “Laboratory performance of quartzite
based Stone Matrix Asphalt Mixtures (SMAM)” Proceedings of the Third Materials
Engineering Conference 804 Oct 1994, ASCE p 635-642.
Serfass, J.P.; J. Samanos. (1996) “Fiber-Modified Asphalt Concrete Characteristics,
Applications and Behavior.” Journal of the Association of Asphalt Paving Technologists,
Vol. 65, p 193-230.
Simpson, Amy L.; Kamyar C. Mahboub. (1994) “Case study of modified bituminous
mixtures: Somerset, Kentucky” Proceedings of the Third Materials Engineering
Conference 804 Oct 1994, ASCE p 88-96.
Stuart, Kevin D.; Peter Malmquist. (1994) “Evaluation of using different stabilizers in
the U.S. route 15 (Maryland) stone matrix asphalt” Transportation Research Record
n.1454 p 48-57.
Zube, Ernest. (1956) “Wire Mesh Reinforcement in Bituminous Resurfacing” Highway
Research Record, Bulletin 131, p 1-18.

A-1
APPENDIX A: SPECIMEN DATA
Table A1. Phase 0 Specimen Data.
Sample Mix Type % Air7/7-1* Control 6.47/7-2* " 6.07/7-4* " 6.17/7-5* " 7.67/9-2* " 7.37/9-3* " 6.57/9-4 " 6.17/13-1 " 6.57/13-2 " 7.27/13-3 " 6.87/13-4 " 6.37/14-1 " 6.77/23-1* 0.5% treated fiber 7.37/23-2* " 6.97/23-3* " 7.17/23-4* " 7.47/23-5* " 7.27/23-6* " 7.17/28-1 " 7.87/28-3 " 6.97/28-4 " 7.27/28-5 " 7.27/28-6 " 7.57/31-1 " 7.58/5-1 0.8% treated fiber 8.78/5-2 " 8.28/5-3 " 8.18/6-1 0.3% treated fiber 7.38/6-2 " 7.08/6-3 " 7.18/11-1 0.5% untreated fiber 6.98/11-2 " 7.28/11-3 " 6.8
* Sent to University of Illinois for testing.
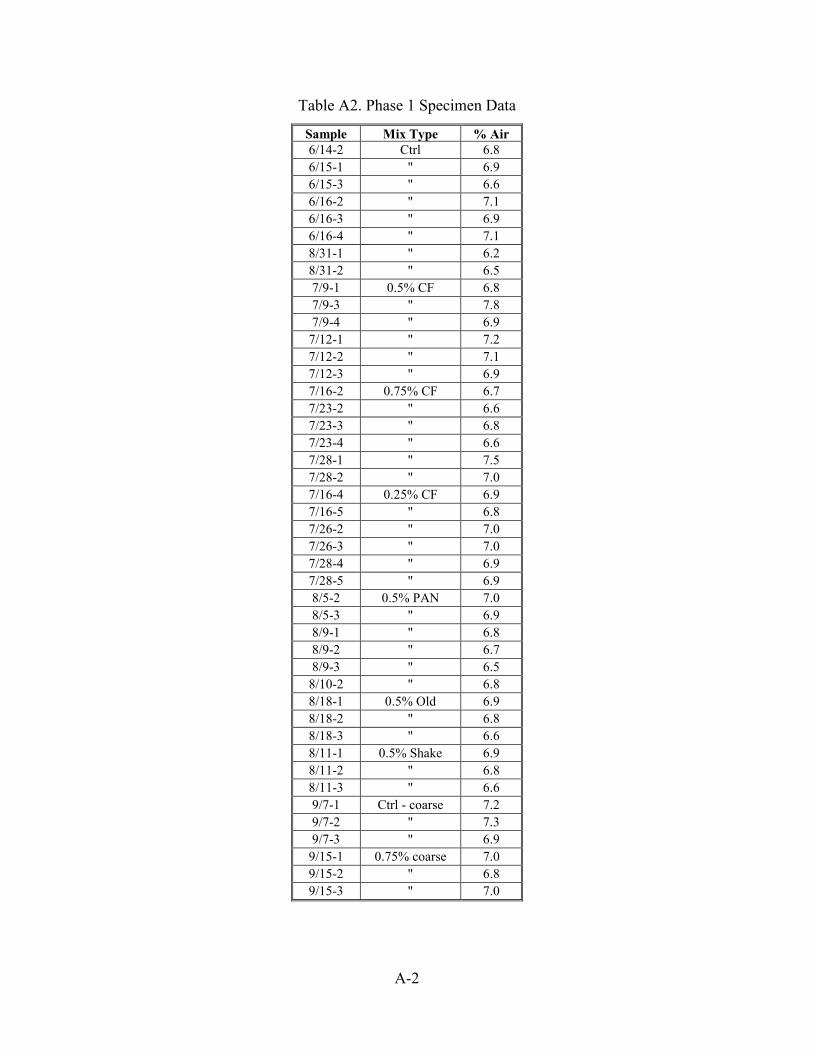
A-2
Table A2. Phase 1 Specimen Data
Sample Mix Type % Air6/14-2 Ctrl 6.86/15-1 " 6.96/15-3 " 6.66/16-2 " 7.16/16-3 " 6.96/16-4 " 7.18/31-1 " 6.28/31-2 " 6.57/9-1 0.5% CF 6.87/9-3 " 7.87/9-4 " 6.9
7/12-1 " 7.27/12-2 " 7.17/12-3 " 6.97/16-2 0.75% CF 6.77/23-2 " 6.67/23-3 " 6.87/23-4 " 6.67/28-1 " 7.57/28-2 " 7.07/16-4 0.25% CF 6.97/16-5 " 6.87/26-2 " 7.07/26-3 " 7.07/28-4 " 6.97/28-5 " 6.98/5-2 0.5% PAN 7.08/5-3 " 6.98/9-1 " 6.88/9-2 " 6.78/9-3 " 6.5
8/10-2 " 6.88/18-1 0.5% Old 6.98/18-2 " 6.88/18-3 " 6.68/11-1 0.5% Shake 6.98/11-2 " 6.88/11-3 " 6.69/7-1 Ctrl - coarse 7.29/7-2 " 7.39/7-3 " 6.9
9/15-1 0.75% coarse 7.09/15-2 " 6.89/15-3 " 7.0

B-1
APPENDIX B: TEST RESULTS
Table B1. Phase 0 Resilient Modulus Results
Mix Type Sample Low Temp (ksi) High Temp (ksi)Control 7/13-1 671.0 107.5
7/13-2 945.4 95.27/13-3 583.8 129.57/13-4 703.6 85.87/14-1 733.2 110.97/9-4 673.1 107.2
0.5% Treated 7/28-1 738.8 133.57/28-3 1070.3 160.07/28-4 1010.2 147.17/28-5 999.9 160.17/28-6 680.2 169.37/31-1 1135.5 152.4
0.8% Treated 8/5-1 1399.3 346.98/5-2 1950.8 358.88/5-3 1230.5 305.9
0.3% Treated 8/6-1 979.0 172.08/6-2 912.4 193.68/6-3 829.8 185.4
0.5% Untreated 8/11-1 1129.3 188.68/11-2 1079.5 197.08/11-3 1185.3 228.1

B-2
Table B2. Phase 0 Repeated Load Deformation Results
Mix Type Sample Pulse Count Strain (µµµµεεεε) Slope (%)Control 7/13-1 160 13839 63.82
7/13-2 134 13828 71.987/13-4 106 13517 95.517/14-1 156 17463 82.387/9-4 172 14812 66.31
0.5% Treated 7/28-1 540 30295 24.367/28-3 248 16115 54.437/28-4 224 13367 47.347/28-5 196 11114 40.497/28-6 188 14582 58.017/31-1 149 12058 55.26
0.8% Treated 8/5-1 342 9998 13.228/5-2 448 10692 11.548/5-3 446 9484 11.4
0.3% Treated 8/6-1 228 15415 50.698/6-2 269 11644 28.688/6-3 229 11113 39.58
0.5% Untreated 8/11-1 303 15818 37.978/11-2 163 12735 52.258/11-3 260 14865 37.71
Table B3. Phase 0 Beam Fatigue Results.
Strain (µε)Load Repetitions 0.50% CF Control
283390 0.00051032520 0.0003519370 0.0008291050 0.0004519380 0.00120520 0.001185890 0.0006251910 0.00051174810 0.0003526450 0.0008385000 0.00045

B-3
Table B4. Phase 0 Indirect Tensile Results.
Tensile Strength (Mpa)Sample 0 C -10 C -20 C -25 CControl 1.19 1.44 1.28 2.28
1.11 2.24 1.3 1.11.11 1.86 0.87 1.1
Control Avg. 1.14 1.84 1.15 1.5
Experimental 0.84 2.42 2.39 2.521.36 1.63 2.06 2.150.73 1.85 1.53 1.95
Experimental Avg. 0.98 1.97 1.99 2.21
Table B5. Phase 0 Creep Compliance Results.
Creep Compliance (1/GPa)Sample Time 0 C -10 C -20 C -25 CControl 1 0.267 0.121 0.066 0.045
2 0.365 0.167 0.089 0.0485 0.557 0.253 0.135 0.10310 0.838 0.375 0.18 0.11520 1.244 0.502 0.236 0.13550 2.18 0.798 0.351 0.195100 3.318 1.117 0.523 0.267200 5.23 1.631 0.773 0.37500 9.347 3.368 1.081 0.5251000 14.35 3.991 1.18 0.671
0.5% CF 1 0.271 0.095 0.068 0.0172 0.365 0.118 0.094 0.025 0.566 0.164 0.138 0.05110 0.833 0.212 0.189 0.04820 1.211 0.309 0.245 0.05450 2.069 0.488 0.36 0.068100 3.146 0.706 0.489 0.091200 4.772 1.007 0.603 0.125500 7.656 1.917 0.738 0.1771000 10.621 2.827 0.816 0.212

B-4
Table B6. Phase 1 Resilient Modulus Results
Mix Type Sample Low Temp (ksi) High Temp (ksi)Control 6-14-2 1801.0 742.6
6-15-1 1882.9 655.26-15-3 1821.1 771.36-16-2 1885.4 750.38-31-1 1855.3 676.58-31-2 1673.2 656.8Avg. 1847.6 729.8
0.5% CF 7-9-1 2058.0 689.27-9-3 1646.6 489.97-9-4 2107.6 680.27-12-1 2026.8 683.27-12-2 1924.6 788.47-12-3 1820.8 646.8Avg. 1930.7 663.0
0.75% CF 7-16-2 1922.6 649.47-23-2 1746.1 636.27-23-3 2036.2 770.67-23-4 1967.7 636.27-28-1 1584.1 562.07-28-2 1839.1 758.4Avg. 1849.3 668.8
0.25% CF 7-16-4 1671.0 765.27-16-5 1886.5 717.47-26-2 2286.6 786.47-26-3 1827.5 672.77-28-4 1863.5 708.27-28-5 1736.4 677.0Avg. 1878.6 721.2
0.5% PAN CF 8-5-2 1910.6 666.18-5-3 2041.8 698.08-9-1 2022.4 728.28-9-2 1989.7 669.88-9-3 1964.3 710.98-10-2 1701.6 567.0Avg. 1938.4 673.3
0.5% shakemixer 8-11-1 1901.2 718.28-11-2 1901.9 684.28-11-3 1983.1 717.6Avg. 1928.7 706.7

B-5
Table B6. Phase 1 Resilient Modulus Results (continued)Mix Type Sample Low Temp (ksi) High Temp (ksi)
0.5% Old CF 8-18-1 1792.9 631.48-18-2 1877.4 628.38-18-3 1911.7 749.0Avg. 1860.7 669.6
Coarse - Ctrl 9-7-1 1822.3 609.99-7-2 1906.1 606.79-7-3 1979.7 633.811-1-1 2296.0 717.411-1-2 1934.1 664.612-10-4 2264.4 751.1
Avg. 2033.8 663.9Coarse - 0.75% 9-15-1 2173.6 760.6
9-15-2 2107.2 756.59-15-3 1994.3 642.212-10-1 2531.9 793.212-10-2 2235.0 603.012-10-3 2340.6 728.8
Avg. 2230.4 714.0
Table B7. Phase 1 Repeated Load Deformation Results
Mix Type Sample Pulse Count Strain (µµµµεεεε) Slope (%)Control 6-14-2 1056 9060 5.327
6-15-1 788 8101 5.5726-15-3 1172 12794 5.0856-16-2 692 7482 6.2718-31-1 1584 10933 3.6568-31-2 1328 9658 3.903Avg 1103 9671 4.969
0.25% 7-16-4 948 11804 5.6747-16-5 1052 9040 4.8677-26-2 1696 10695 3.0977-26-3 1448 10041 3.7747-28-4 936 10112 4.9657-28-5 868 12380 5.912Avg 1158 10679 4.715
0.50% 7-9-1 1208 6990 3.8957-9-3 756 8723 7.7027-9-4 1420 10909 3.898
7-12-1 1544 8309 3.5447-12-2 1012 8391 4.8417-12-3 1580 10878 4.048Avg 1253 9033 4.655

B-6
Table B7. Phase 1 Repeated Load Deformation Results (continued)
Mix Type Sample Pulse Count Strain (µµµµεεεε) Slope (%)0.5% PAN 8-5-2 1372 11333 4.599
8-5-3 1244 11106 4.1418-9-1 1336 8549 3.4078-9-2 1612 11533 3.7038-9-3 1480 11055 3.7158-10-2 1064 11712 5.463Avg 1351 10881 4.171
0.75% 7-16-2 956 9744 5.1337-23-2 1388 11977 4.2237-23-3 1272 11651 4.3427-23-4 1212 9477 4.1547-28-1 996 13482 7.3267-28-2 1248 7565 4.017Avg 1165 11266 5.036
0.5% shake 8-11-1 1296 8800 4.1238-11-2 1368 9837 3.818-11-3 1536 7696 3.539Avg 1400 8778 3.824
0.5% old 8-18-1 1108 8725 4.4378-18-2 1476 11585 4.2128-18-3 1296 11385 4.718Avg 1293 10565 4.456
Coarse - Ctrl 9-7-1 1080 13583 7.9149-7-3 964 10489 8.07411-1-1 1072 12685 7.50812-10-4 924 13051 6.707
Avg 1010 12452 7.551Coarse - 0.75% 9-15-1 1112 13840 7.52
9-15-2 1600 10510 4.3229-15-3 772 10170 7.01712-10-1 1428 13072 5.1412-10-2 848 12349 7.91712-10-3 1104 14107 7.063
Avg 1144 12341 6.497
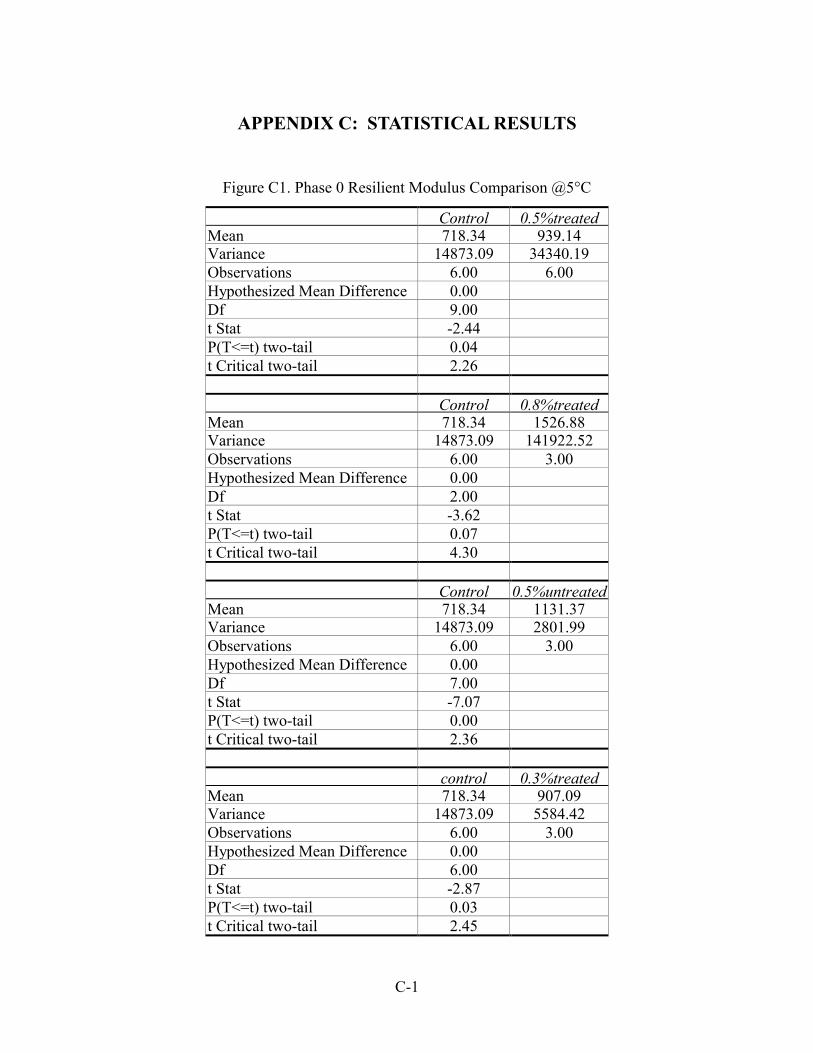
C-1
APPENDIX C: STATISTICAL RESULTS
Figure C1. Phase 0 Resilient Modulus Comparison @5°C
Control 0.5%treatedMean 718.34 939.14Variance 14873.09 34340.19Observations 6.00 6.00Hypothesized Mean Difference 0.00Df 9.00t Stat -2.44P(T<=t) two-tail 0.04t Critical two-tail 2.26
Control 0.8%treatedMean 718.34 1526.88Variance 14873.09 141922.52Observations 6.00 3.00Hypothesized Mean Difference 0.00Df 2.00t Stat -3.62P(T<=t) two-tail 0.07t Critical two-tail 4.30
Control 0.5%untreatedMean 718.34 1131.37Variance 14873.09 2801.99Observations 6.00 3.00Hypothesized Mean Difference 0.00Df 7.00t Stat -7.07P(T<=t) two-tail 0.00t Critical two-tail 2.36
control 0.3%treatedMean 718.34 907.09Variance 14873.09 5584.42Observations 6.00 3.00Hypothesized Mean Difference 0.00Df 6.00t Stat -2.87P(T<=t) two-tail 0.03t Critical two-tail 2.45
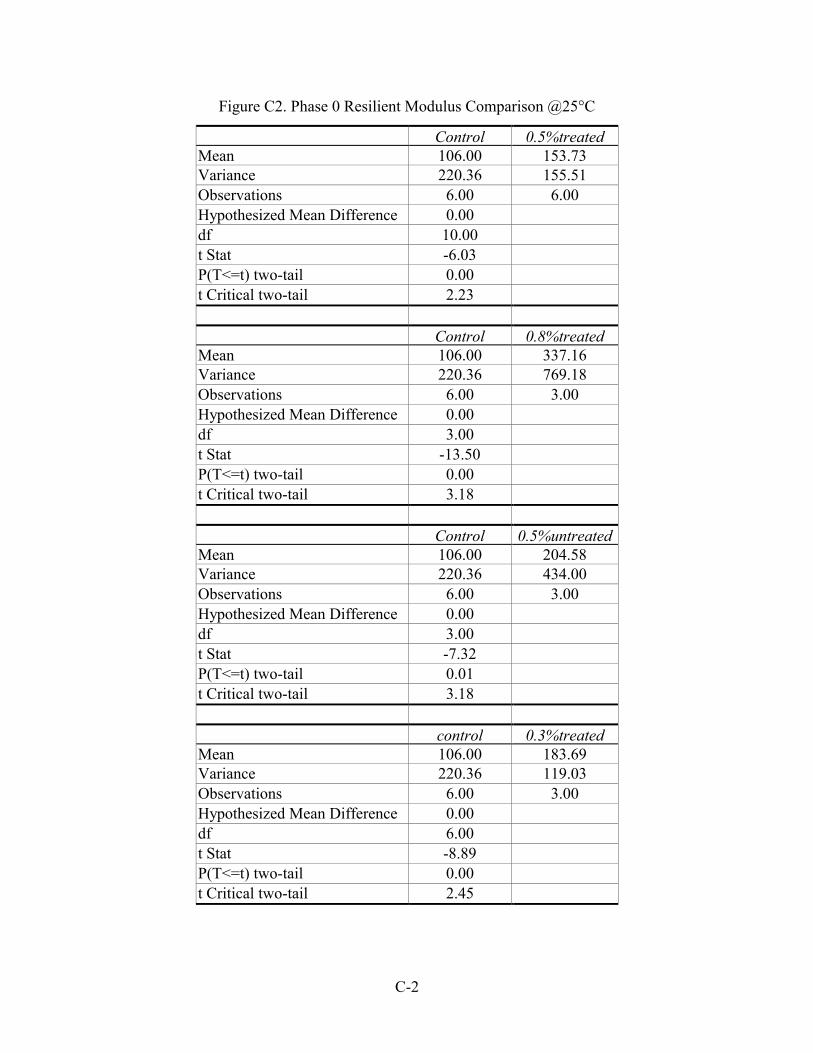
C-2
Figure C2. Phase 0 Resilient Modulus Comparison @25°C
Control 0.5%treatedMean 106.00 153.73Variance 220.36 155.51Observations 6.00 6.00Hypothesized Mean Difference 0.00df 10.00t Stat -6.03P(T<=t) two-tail 0.00t Critical two-tail 2.23
Control 0.8%treatedMean 106.00 337.16Variance 220.36 769.18Observations 6.00 3.00Hypothesized Mean Difference 0.00df 3.00t Stat -13.50P(T<=t) two-tail 0.00t Critical two-tail 3.18
Control 0.5%untreatedMean 106.00 204.58Variance 220.36 434.00Observations 6.00 3.00Hypothesized Mean Difference 0.00df 3.00t Stat -7.32P(T<=t) two-tail 0.01t Critical two-tail 3.18
control 0.3%treatedMean 106.00 183.69Variance 220.36 119.03Observations 6.00 3.00Hypothesized Mean Difference 0.00df 6.00t Stat -8.89P(T<=t) two-tail 0.00t Critical two-tail 2.45

C-3
Figure C3. Phase 0 Repeated Load Strain at Tertiary Flow
Control 0.5%TreatedMean 14691.80 16255.17Variance 2636892.70 50465072.57Observations 5.00 6.00Hypothesized Mean Difference 0.00df 6.00t Stat -0.52P(T<=t) two-tail 0.62t Critical two-tail 2.45
Control 0.8% treatedMean 14691.80 10058.00Variance 2636892.70 367516.00Observations 5.00 3.00Hypothesized Mean Difference 0.00df 5.00t Stat 5.75P(T<=t) two-tail 0.00t Critical two-tail 2.57
Control 0.3% TreatedMean 14691.80 12724.00Variance 2636892.70 5501601.00Observations 5.00 3.00Hypothesized Mean Difference 0.00df 3.00t Stat 1.28P(T<=t) two-tail 0.29t Critical two-tail 3.18
Control 0.5% UntreatedMean 14691.80 14472.67Variance 2636892.70 2491666.33Observations 5.00 3.00Hypothesized Mean Difference 0.00df 4.00t Stat 0.19P(T<=t) two-tail 0.86t Critical two-tail 2.78

C-4
Figure C4. Phase 1 Resilient Modulus Comparison @5°C
Control 0.50%Mean 1819.81 1930.75Variance 6277.64 29919.54Observations 6.00 6.00Hypothesized Mean Difference 0.00df 7.00t Stat -1.43P(T<=t) two-tail 0.20t Critical two-tail 2.36
Control 0.75%Mean 1819.81 1849.30Variance 6277.64 27084.41Observations 6.00 6.00Hypothesized Mean Difference 0.00df 7.00t Stat -0.40P(T<=t) two-tail 0.70t Critical two-tail 2.36
Control 0.25%Mean 1819.81 1878.57Variance 6277.64 46528.96Observations 6.00 6.00Hypothesized Mean Difference 0.00df 6.00t Stat -0.63P(T<=t) two-tail 0.55t Critical two-tail 2.45
Control 0.5% PANMean 1819.81 1938.39Variance 6277.64 15576.04Observations 6.00 6.00Hypothesized Mean Difference 0.00df 8.00t Stat -1.96P(T<=t) two-tail 0.09t Critical two-tail 2.31
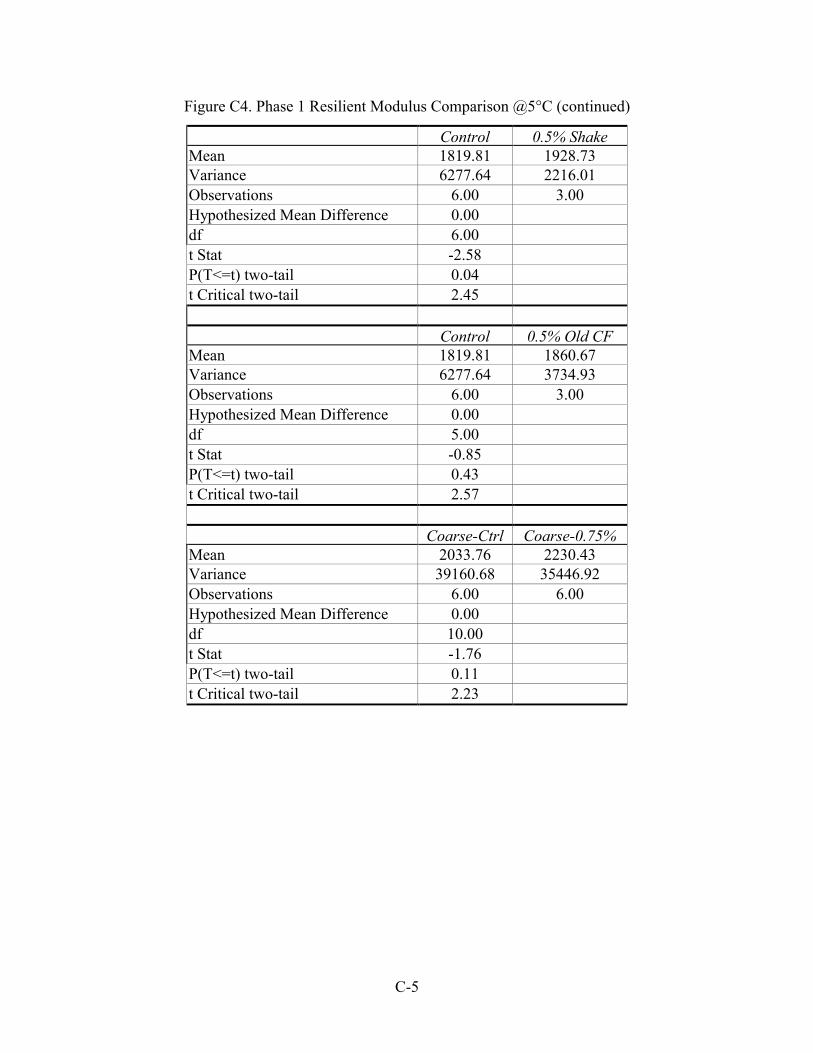
C-5
Figure C4. Phase 1 Resilient Modulus Comparison @5°C (continued)
Control 0.5% ShakeMean 1819.81 1928.73Variance 6277.64 2216.01Observations 6.00 3.00Hypothesized Mean Difference 0.00df 6.00t Stat -2.58P(T<=t) two-tail 0.04t Critical two-tail 2.45
Control 0.5% Old CFMean 1819.81 1860.67Variance 6277.64 3734.93Observations 6.00 3.00Hypothesized Mean Difference 0.00df 5.00t Stat -0.85P(T<=t) two-tail 0.43t Critical two-tail 2.57
Coarse-Ctrl Coarse-0.75%Mean 2033.76 2230.43Variance 39160.68 35446.92Observations 6.00 6.00Hypothesized Mean Difference 0.00df 10.00t Stat -1.76P(T<=t) two-tail 0.11t Critical two-tail 2.23
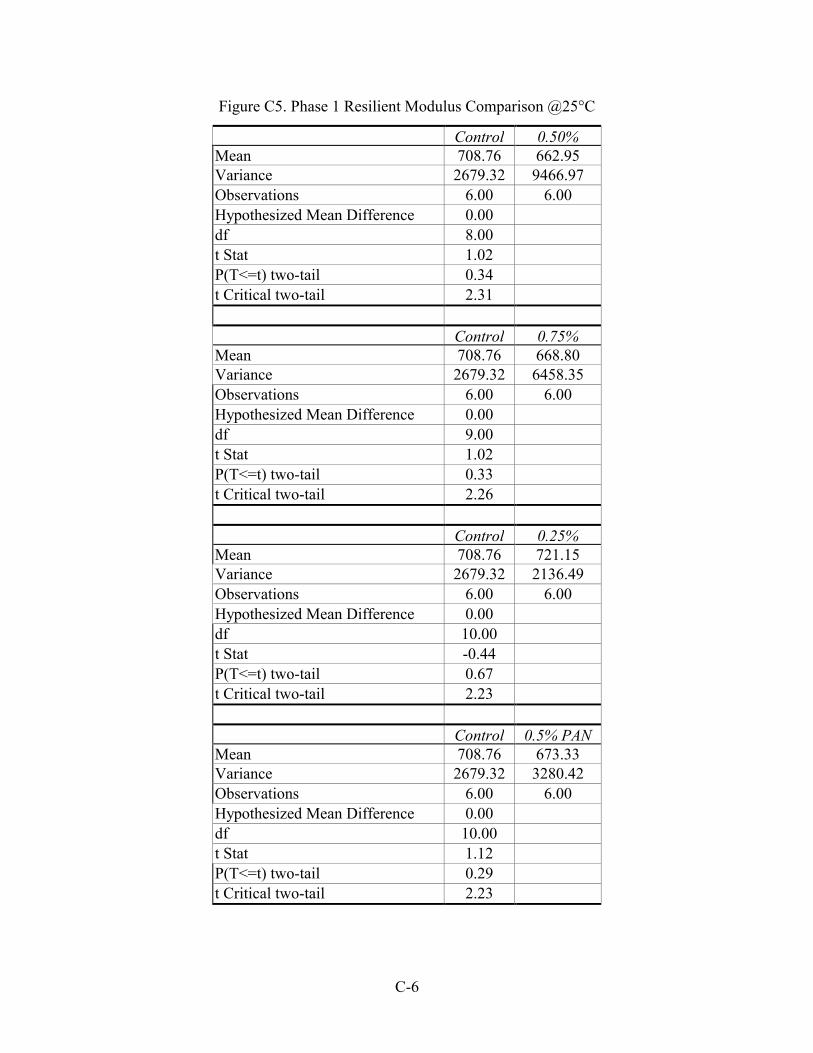
C-6
Figure C5. Phase 1 Resilient Modulus Comparison @25°C
Control 0.50%Mean 708.76 662.95Variance 2679.32 9466.97Observations 6.00 6.00Hypothesized Mean Difference 0.00df 8.00t Stat 1.02P(T<=t) two-tail 0.34t Critical two-tail 2.31
Control 0.75%Mean 708.76 668.80Variance 2679.32 6458.35Observations 6.00 6.00Hypothesized Mean Difference 0.00df 9.00t Stat 1.02P(T<=t) two-tail 0.33t Critical two-tail 2.26
Control 0.25%Mean 708.76 721.15Variance 2679.32 2136.49Observations 6.00 6.00Hypothesized Mean Difference 0.00df 10.00t Stat -0.44P(T<=t) two-tail 0.67t Critical two-tail 2.23
Control 0.5% PANMean 708.76 673.33Variance 2679.32 3280.42Observations 6.00 6.00Hypothesized Mean Difference 0.00df 10.00t Stat 1.12P(T<=t) two-tail 0.29t Critical two-tail 2.23

C-7
Figure C5. Phase 1 Resilient Modulus Comparison @25°C (continued)
Control 0.5% ShakeMean 708.76 706.67Variance 2679.32 377.11Observations 6.00 3.00Hypothesized Mean Difference 0.00df 7.00t Stat 0.09P(T<=t) two-tail 0.93t Critical two-tail 2.36
Control 0.5% Old CFMean 708.76 669.57Variance 2679.32 4738.49Observations 6.00 3.00Hypothesized Mean Difference 0.00df 3.00t Stat 0.87P(T<=t) two-tail 0.45t Critical two-tail 3.18
Coarse-Ctrl 0.75%CoarseMean 663.91 714.05Variance 3513.45 5589.22Observations 6.00 6.00Hypothesized Mean Difference 0.00df 10.00t Stat -1.29P(T<=t) two-tail 0.23t Critical two-tail 2.23

C-8
Figure C6. Phase 1 Repeated Load Strain at Tertiary Flow
Control 0.25%Mean 9671.33 10678.67Variance 3795176.67 1262355.89Observations 6.00 7.00Hypothesized Mean Difference 0.00df 8.00t Stat -1.12P(T<=t) two-tail 0.30t Critical two-tail 2.31
Control 0.50%Mean 9671.33 9033.33Variance 3795176.67 2425937.87Observations 6.00 6.00Hypothesized Mean Difference 0.00df 10.00t Stat 0.63P(T<=t) two-tail 0.54t Critical two-tail 2.23
Control 0.5%PANMean 9671.33 10881.33Variance 3795176.67 1367818.67Observations 6 6Hypothesized Mean Difference 0df 8t Stat -1.30P(T<=t) two-tail 0.23t Critical two-tail 2.31
Control 0.5% ShakeMean 9671.33 8777.67Variance 3795176.67 1146344.33Observations 6.00 3.00Hypothesized Mean Difference 0.00df 7.00t Stat 0.89P(T<=t) two-tail 0.40t Critical two-tail 2.36
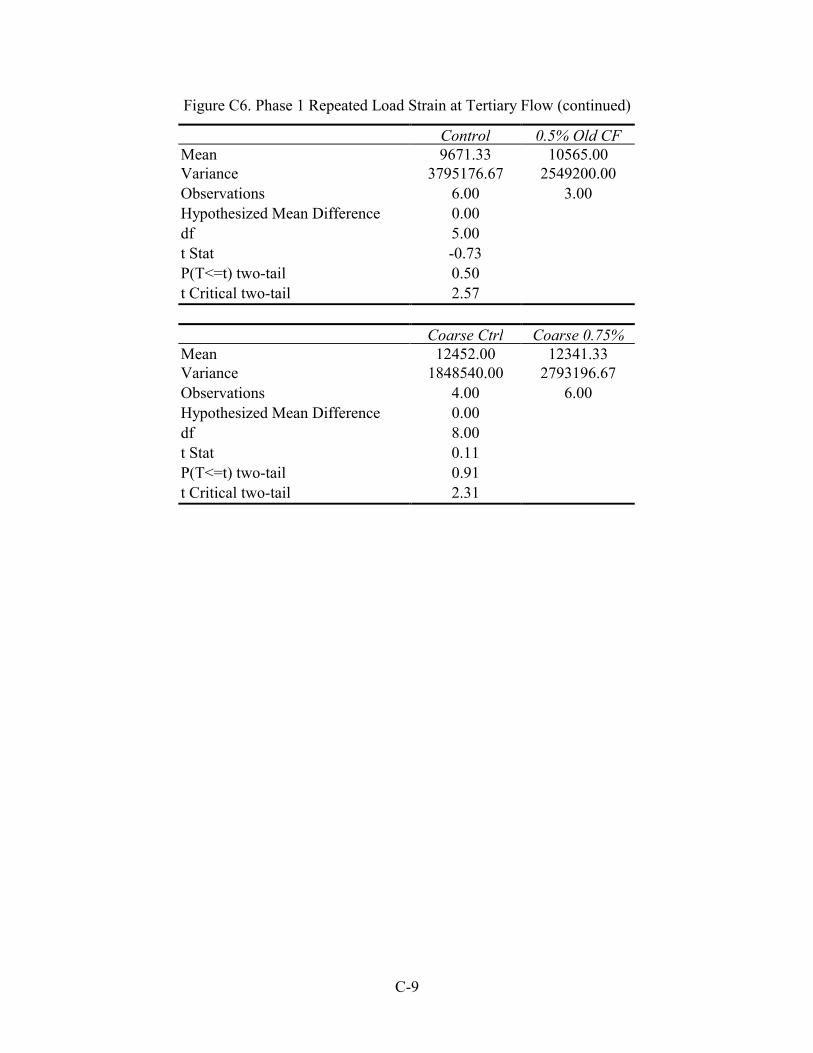
C-9
Figure C6. Phase 1 Repeated Load Strain at Tertiary Flow (continued)
Control 0.5% Old CFMean 9671.33 10565.00Variance 3795176.67 2549200.00Observations 6.00 3.00Hypothesized Mean Difference 0.00df 5.00t Stat -0.73P(T<=t) two-tail 0.50t Critical two-tail 2.57
Coarse Ctrl Coarse 0.75%Mean 12452.00 12341.33Variance 1848540.00 2793196.67Observations 4.00 6.00Hypothesized Mean Difference 0.00df 8.00t Stat 0.11P(T<=t) two-tail 0.91t Critical two-tail 2.31


![Validity of the modified fatigue strength ratio and SWT ... · roving glass fiber-reinforced polyester specimens with [0,90]2 and [±45]2 fiber orientations under torsion fatigue](https://static.cupdf.com/doc/110x72/5fd35085ccf567327e413926/validity-of-the-modified-fatigue-strength-ratio-and-swt-roving-glass-fiber-reinforced.jpg)


![[PPT]Long Carbon Fiber Reinforced Concrete for Blast · Web viewTitle Long Carbon Fiber Reinforced Concrete for Blast Protection: a Research Proposal Author Andrew Coughlin Last modified](https://static.cupdf.com/doc/110x72/5abe945a7f8b9aa3088d094f/pptlong-carbon-fiber-reinforced-concrete-for-blast-viewtitle-long-carbon-fiber.jpg)