Investigation of stress biomarkers in human peripheral
blood mononuclear cells in response to chronic
isoproterenol treatment
Dissertation zur Erlangung des
akademischen Grades eines Doktors der Naturwissenschaften
(Dr. rer. nat.)
vorgelegt von
Palombo, Philipp
an der
Mathematisch-Naturwissenschaftliche Sektion
Fachbereich Biologie
Konstanz, 2018
Konstanzer Online-Publikations-System (KOPS) URL: http://nbn-resolving.de/urn:nbn:de:bsz:352-2-1l2hvr1cqeoof1

Tag der mündlichen Prüfung: 14.12.2018
1. Referent/Referentin: Alexander Bürkle
2. Referent/Referentin: Markus Christmann


“It is not stress that kills us, it is our reaction to it„
-Hans Selye-

“Houston, We`ve Had a Problem”
-James A. Lovell-

Table of content
I
Table of content
CHAPTER I ......................................................................................... 1
1 Introduction ...................................................................................... 1
1.1 Biological background of stress .............................................................................................. 1
Medical significance of stress ......................................................................................... 3 1.1.1
1.2 Adrenergic receptor family...................................................................................................... 6
Signaling of the β2-AR .................................................................................................... 7 1.2.1
1.3 Catecholamines ..................................................................................................................... 13
Effects of catecholamines on immune cells .................................................................. 14 1.3.1
Isoproterenol .................................................................................................................. 16 1.3.2
Poly(ADP-ribose) polymerases and poly(ADP-ribosyl)ation ....................................... 18 1.3.3
1.4 Cellular senescence ............................................................................................................... 21
Senescence marker and characteristics of senescent cells ............................................. 23 1.4.1
β-adrenergic signaling and genomic stability ................................................................ 26 1.4.2
2 Objective ........................................................................................ 28
3 Material and Methods .................................................................... 30
3.1 Material ................................................................................................................................. 30
Chemicals ...................................................................................................................... 30 3.1.1
Laboratory equipment ................................................................................................... 32 3.1.2
Consumables ................................................................................................................. 34 3.1.3
Buffers and solutions ..................................................................................................... 35 3.1.4
Cell lines and cell culture reagents ................................................................................ 39 3.1.5
Antibodies and dyes ...................................................................................................... 40 3.1.6
Kits ................................................................................................................................ 40 3.1.7
Software ......................................................................................................................... 41 3.1.8
3.2 Methods ................................................................................................................................. 41
Table of content
II
General aspects of cell culture ....................................................................................... 41 3.2.1
PBMC isolation ............................................................................................................. 41 3.2.2
Isoproterenol treatment of PBMCs ................................................................................ 42 3.2.3
Analysis of cellular cAMP levels .................................................................................. 43 3.2.4
Analysis of cellular ROS ............................................................................................... 45 3.2.5
NAD+ Cycling assay ...................................................................................................... 46 3.2.6
Analysis of gene transcription by real-time PCR .......................................................... 47 3.2.7
PARP1 activity under NAD+ saturated conditions ........................................................ 53 3.2.8
Sample preparation for Western blotting ....................................................................... 54 3.2.9
4 Results ............................................................................................ 60
4.1 Isoproterenol mediated DNA damage ................................................................................... 61
cAMP-signaling of the β-AR after repeated isoproterenol stimulation ......................... 61 4.1.1
Quantification of the intracellular NAD+
content in PBMCs during and after the 4.1.2
repeated isoproterenol treatment ................................................................................... 63
PAR formation after isoproterenol treatment under NAD+ saturated conditions .......... 64 4.1.3
Formation of intracellular ROS in PBMCs during the repeated isoproterenol treatment . 4.1.4
....................................................................................................................................... 65
4.2 Repeated isoproterenol treatment induced senescence like phenotype ................................. 69
Gene expression in PBMCs after the repeated isoproterenol treatment ........................ 69 4.2.1
p16 protein expression after repeated isoproterenol treatment ...................................... 72 4.2.2
4.3 Degradation of isoproterenol under cell culture conditions .................................................. 73
Detection of isoproterenol by absorbance detector ....................................................... 73 4.3.1
Detection of isoproterenol by the fluorescence detector ............................................... 77 4.3.2
Detection of isoprenochrome by the absorbance detector ............................................. 78 4.3.3
Isoproterenol stability in cell culture media at 4 °C ...................................................... 80 4.3.4
Isoproterenol stability in cell culture media at 37 °C .................................................... 82 4.3.5
Isoproterenol concentration after the single dose treatment of PBMCs ........................ 84 4.3.6
Isoproterenol concentration during and after the four-fold treatment of PBMCs ......... 85 4.3.7
Isoproterenol concentration during and after the eight-fold treatment of PBMCs ........ 87 4.3.8
Isoproterenol concentration in cell culture media after a single administration ............ 90 4.3.9
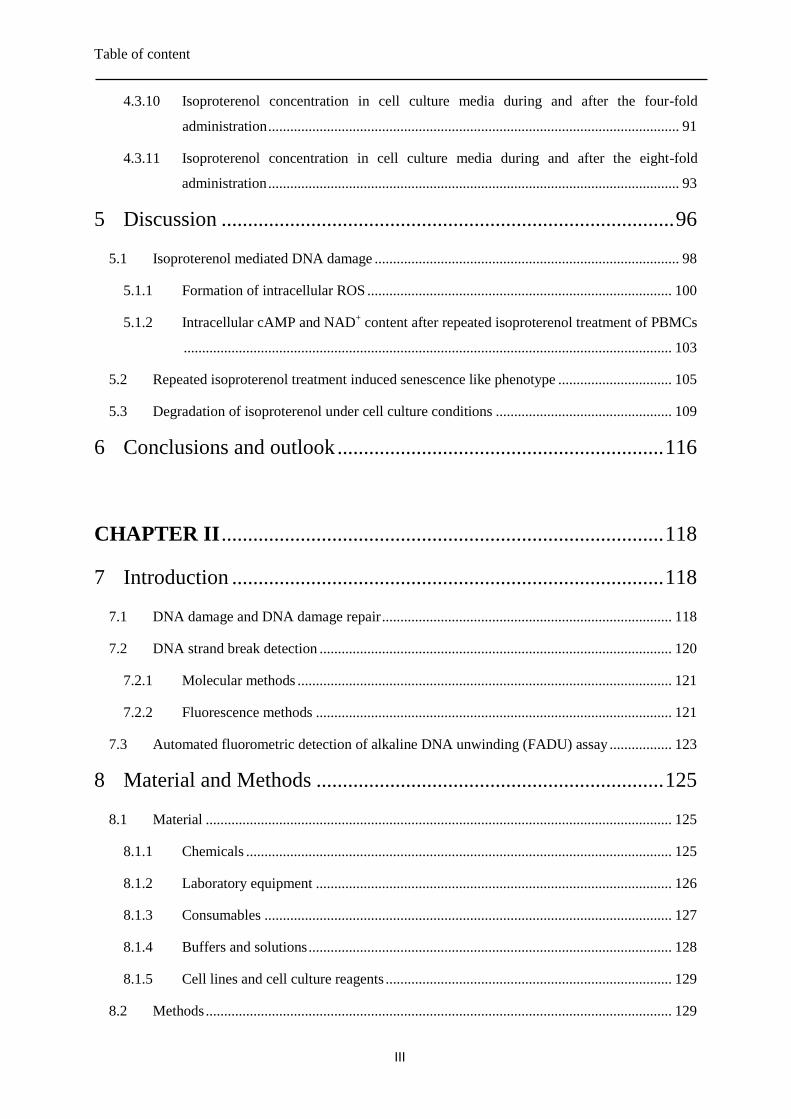
Table of content
III
Isoproterenol concentration in cell culture media during and after the four-fold 4.3.10
administration ................................................................................................................ 91
Isoproterenol concentration in cell culture media during and after the eight-fold 4.3.11
administration ................................................................................................................ 93
5 Discussion ...................................................................................... 96
5.1 Isoproterenol mediated DNA damage ................................................................................... 98
Formation of intracellular ROS ................................................................................... 100 5.1.1
Intracellular cAMP and NAD+ content after repeated isoproterenol treatment of PBMCs5.1.2
..................................................................................................................................... 103
5.2 Repeated isoproterenol treatment induced senescence like phenotype ............................... 105
5.3 Degradation of isoproterenol under cell culture conditions ................................................ 109
6 Conclusions and outlook .............................................................. 116
CHAPTER II .................................................................................... 118
7 Introduction .................................................................................. 118
7.1 DNA damage and DNA damage repair ............................................................................... 118
7.2 DNA strand break detection ................................................................................................ 120
Molecular methods ...................................................................................................... 121 7.2.1
Fluorescence methods ................................................................................................. 121 7.2.2
7.3 Automated fluorometric detection of alkaline DNA unwinding (FADU) assay ................. 123
8 Material and Methods .................................................................. 125
8.1 Material ............................................................................................................................... 125
Chemicals .................................................................................................................... 125 8.1.1
Laboratory equipment ................................................................................................. 126 8.1.2
Consumables ............................................................................................................... 127 8.1.3
Buffers and solutions ................................................................................................... 128 8.1.4
Cell lines and cell culture reagents .............................................................................. 129 8.1.5
8.2 Methods ............................................................................................................................... 129
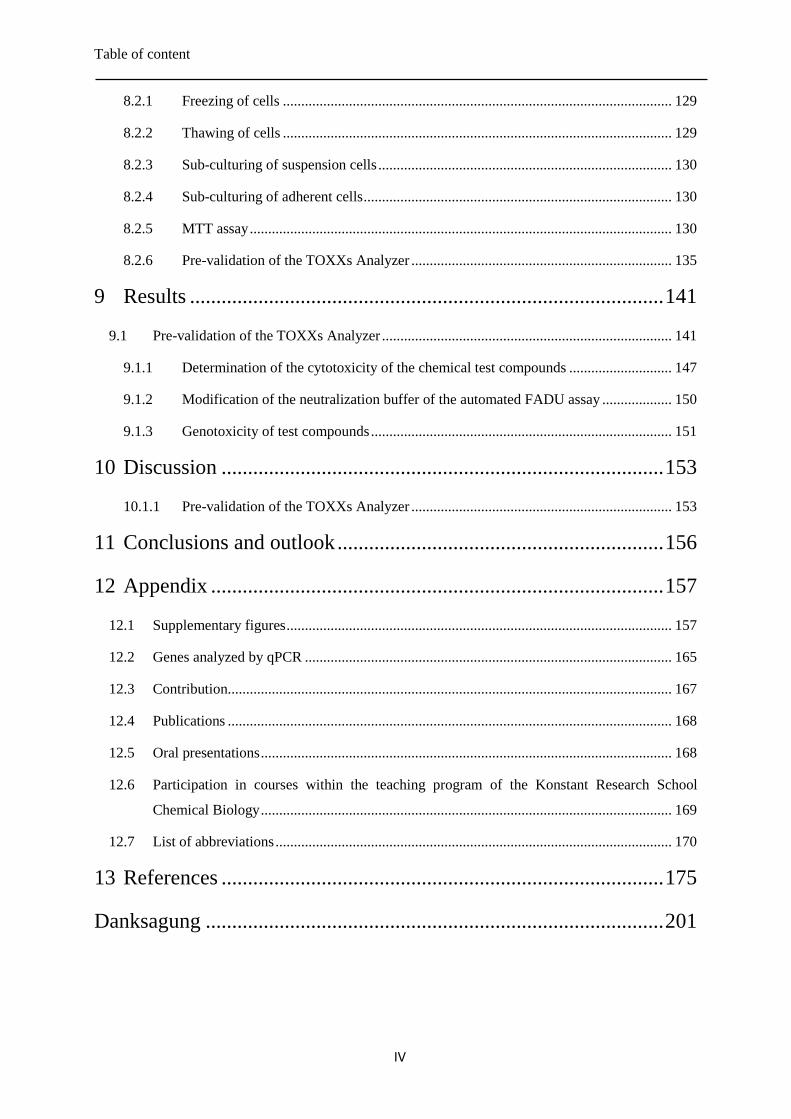
Table of content
IV
Freezing of cells .......................................................................................................... 129 8.2.1
Thawing of cells .......................................................................................................... 129 8.2.2
Sub-culturing of suspension cells ................................................................................ 130 8.2.3
Sub-culturing of adherent cells .................................................................................... 130 8.2.4
MTT assay ................................................................................................................... 130 8.2.5
Pre-validation of the TOXXs Analyzer ....................................................................... 135 8.2.6
9 Results .......................................................................................... 141
9.1 Pre-validation of the TOXXs Analyzer ............................................................................... 141
Determination of the cytotoxicity of the chemical test compounds ............................ 147 9.1.1
Modification of the neutralization buffer of the automated FADU assay ................... 150 9.1.2
Genotoxicity of test compounds .................................................................................. 151 9.1.3
10 Discussion .................................................................................... 153
Pre-validation of the TOXXs Analyzer ....................................................................... 153 10.1.1
11 Conclusions and outlook .............................................................. 156
12 Appendix ...................................................................................... 157
12.1 Supplementary figures ......................................................................................................... 157
12.2 Genes analyzed by qPCR .................................................................................................... 165
12.3 Contribution......................................................................................................................... 167
12.4 Publications ......................................................................................................................... 168
12.5 Oral presentations ................................................................................................................ 168
12.6 Participation in courses within the teaching program of the Konstant Research School
Chemical Biology ................................................................................................................ 169
12.7 List of abbreviations ............................................................................................................ 170
13 References .................................................................................... 175
Danksagung ....................................................................................... 201
Abstract
V
Abstract
Chronic stress is associated with a higher risk for carcinogenesis as well as age-related diseases and
immune dysfunction. There are several indications that repeated or elevated release of stress
hormones, such as catecholamines, can affect the genomic stability of cells. Therefore, catecholamines
appear to be involved in the occurrence of some diseases. Studies with posttraumatic stress disorder
(PTSD) patients have shown an accelerated aging of these patients. Moreover, accumulated DNA
strand breaks and a shortening of telomeres could be observed in peripheral blood mononuclear cells
(PBMCs) of these patients. On a molecular and cellular level it was demonstrated that catecholamines
can induce the formation of reactive oxidative species (ROS) and the formation of DNA strand breaks
via two pathways. On the one hand, catecholamines stimulate the β2-adrenergic receptor and activate
the cyclic adenosine monophosphate/protein kinase A (cAMP/PKA) signaling cascade. On the other
hand, catecholamines undergo oxidative degradation processes that involve the formation of free
radicals and ROS. Moreover, it was shown that the repeated treatment of myocardial cells with
catecholamines induce a senescence like phenotype. In a pilot study, our laboratory established an
ex vivo model to simulate the effect of the elevated and repeated release of catecholamine caused by
chronic stress. Therefore, PBMCs of healthy donors were repeatedly treated 1-fold, 4-fold or 8-fold
with isoproterenol, an epinephrine analog. Our results showed that the repeated administration of
isoproterenol induced the formation of DNA strand breaks in PBMCs, 6 hours after the beginning of
the treatment. These DNA strand breaks could be partially inhibited by the β-blocker propranolol.
24 hours after the first isoproterenol administration, a part of these DNA strand breaks remained
unrepaired. The protein level of poly(ADP-ribose) polymerase-1 (PARP1), an important DNA repair
enzyme which is activated by DNA strand breaks, was reduced by the repeated isoproterenol
treatment. Moreover, the formation of poly(ADP-ribose) (PAR) was reduced in some cells. Also the
intracellular content of the PARP1 substrate nicotinamide adenine dinucleotide (NAD+) decreased in
response to the repeated isoproterenol treatment. However, it was not possible to detect the formation
of intracellular ROS. Additional, the cAMP dependent receptor signalling was also reduced by the
repeated isoproterenol treatment. Therefore, an iterated activation of the β2-adrenergic receptor could
be excluded, at least for the cAMP dependent signalling pathway. In a second parallel performed study
the expression of senescence markers in PBMCs after the repeated isoproterenol treatment was
investigated. The induction of senescence markers in response to a repeated isoproterenol treatment
was observed previously in myocardial cells. The following effects of the repeated isoproterenol
treatment were induced in PBMCs: expression of senescence-associated β-galactosidase, an
enlargement and flattened cell morphology, decreased expression of CCND1, up-regulation of the
expression of VCAN and an inhibition of phytohaemagglutinin (PHA) induced cell proliferation.
Abstract
VI
However, no expression of the senescence markers p16 and p21 could be observed. Taken together,
the results suggested an isoproterenol induce senescence like phenotype in human PBMCs. To our
knowledge, there was no previous investigation of the isoproterenol fate under cell culture conditions.
However, it is known that the degradation of isoproterenol induces the formation of ROS and free
radicals. Therefore, the stability of isoproterenol under cell culture conditions was investigated in third
study. It is known that isoproterenol can be oxidized to isoprenochrome, a cytotoxic aminochrome.
The concentration of isoproterenol and isoprenochrome were measured in three different cell culture
media over a period of 8 h. The determined half-life of isoproterenol ranged between 30 min and 6 h
which were at least about 6-times longer than reported in human studies. The results also showed that
the stability of isoproterenol and the formation of isoprenochrome were influenced by the cell culture
medium. In a second project an inter-laboratory-validation study of a new developed FADU system
was carried out in cooperation with the Swiss Federal Laboratories for Materials Science and
Technology (EMPA) in St.Gallen and the Cetcis GmbH, Esslingen. In a first phase the technical test
of the FADU system was performed. In a second phase the ability of the FADU assay to identify
genotoxic chemicals that induce DNA strand breaks should be proofed. The new FADU platform
should also be used to investigate the influence of isoproterenol on the genomic stability. This task
could never be finished, because of technical difficulties of the new FADU platform.
Zusammenfassung
VII
Zusammenfassung
Chronischer Stress führt zu einem erhöhten Risiko von Karzinogenese, altersbedingten Krankheiten
und Immunschwäche. Es gibt einige Befunde, dass die wiederholte oder erhöhte Freisetzung von
Stresshormonen, wie Katecholaminen, die genomische Stabilität von Zellen beeinträchtigt.
Katecholamine scheinen an der Entstehung von Krankheiten beteiligt zu sein. Studien mit Beteiligung
von Patienten mit posttraumatischer Belastungsstörung (PTSD) zeigten das diese Patienten schneller
altern. Zudem scheinen sich in mononukleäre Zellen des peripheren Blutes (PBMCs) dieser Patienten
DNS Strangbrüche zu akkumulieren, sowie kann eine Verkürzung der Telomere in diesen Zellen
nachgewiesen werden. Auf molekularer und zellulärer Ebene konnte gezeigt werden das
Katecholamine an der Entstehung von reaktiven Sauerstoffverbindungen (ROS) und der Entstehung
von DNS Strangbrüchen beteiligt sind. Dabei spielen zwei Mechanismen eine zentrale Rolle.
Einerseits können Katecholamine den β2-Adrenergen Rezeptor stimulieren und damit die cyclisches
Adenosinmonophosphat/ Proteinkinase A (cAMP/PKA) abhängige Signalkaskade aktivieren. Auf der
anderen Seite können Katecholamine oxidative Abbaumechanismen durchlaufen, bei denen freie
Radikale und ROS gebildet werden. Außerdem wurde gezeigt, dass die wiederholte Behandlung von
Herzmuskelzellen mit Katecholaminen einen Seneszenz-ähnlichen Phänotypen induzieren kann. In
einer Pilotstudie in unserem Labor wurde ein ex vivo Modell zur Simulierung der wiederholten und
erhöhten Freisetzung von Katecholaminen durch chronischen Stress entwickelt. Dafür wurden PBMCs
von gesunden Spendern wiederholt mit einer, vier oder acht Dosen Isoproterenol, einem Adrenalin
Analog, behandelt. Die Ergebnisse zeigten, dass die wiederholte Gabe von Isoproterenol die Bildung
von DNS Strangbrüchen, 6 Stunden nach dem Beginn der Behandlung in PBMCs induzierte. Die
Bildung der DNS Strangbrüche konnte teilweise durch die Gabe des β-Blocker Propranolol inhibiert
werden. 24 Stunden nach der ersten Isoproterenol Gabe war ein Teil der DNS Strangbrüche weiterhin
vorhanden. Die Proteinmenge des DNS Reparaturproteins Poly(ADP-ribose) polymerase-1 (PARP1),
das durch DNS Strangbrüche aktiviert wird, wurde durch die Isoproterenol Behandlung in dem
PBMCs reduziert. Außerdem war die Bildung von poly(ADP-ribose) (PAR) in einigen Zellen und der
intrazelluläre Gehalt des PARP1 Substrates Nicotinamidadenindinukleotid (NAD+) durch die
wiederholte Gabe von Isoproterenol reduziert. Es war aber nicht möglich die Bildung von
intrazellulärem ROS zu messen. Des Weiteren nahm die cAMP vermittelte Signalweiterleitung ab.
Dies deutet darauf hin, dass keine wiederholte Stimulierung des β2-Adrenergen Rezeptors stattfand,
zumindest nicht für den cAMP/PKA Signalweg. In einer zweiten parallel durchgeführten Studie wurde
untersucht ob die wiederholte Isoproterenol Behandlung zur Induktion von Seneszenzmarkern in
PBMCs führt. Da dies bereits in Mäusen beobachtet wurde und persistierende DNS Strangbrüche
Seneszenz auslösen können. In PBMCs konnten folgende Beobachtungen gemacht werden, die
Zusammenfassung
VIII
wiederholte Behandlung mit Isoproterenol führt zu einer Expression von Seneszenz assoziierter β-
Galaktosidase, zu einer abgeflachten und vergrößerten Zellmorphologie, zu einer verminderten
Expression von CCND1, zu einer Erhöhung der Expression von VCAN und zu einer Inhibierung der
durch Phytohämagglutinin (PHA) stimulierten Proliferation. Jedoch konnte keine Expression der
Seneszenzmarkern p16 und p21 beobachtet werde. Dies deutet darauf hin, dass Isoproterenol
möglicherweise einen Seneszenz-ähnlichen Phänotypen in PBMCs induziert. Nach unserer Kenntnis
gibt es keine Daten zur Stabilität von Isoproterenol in der Zellkultur. Es ist aber bekannt, dass sowohl
der enzymatische Abbau als auch die chemische Oxidation von Isoproterenol zu Bildung von freien
Radikalen und ROS führt. Daher wurde in einer dritten Studie die Stabilität von Isoproterenol unter
Zellkulturbedingungen untersucht. Es ist bekannt, dass Isoproterenol zu Isoprenochrome, einem
zytotoxischen Aminochrome, oxidiert werden kann. Daher wurden die Konzentrationen von
Isoproterenol und Isoprenochrome während einer Zeitspanne von 8 Stunden in drei unterschiedlichen
Zellkultur Medien gemessen. Die Halbwertszeit von Isoproterenol lag circa zwischen 30 Minuten und
6 Stunden. Dies entspricht einer mindestens 6-fach längeren Halbwertszeit als die in humanen Studien
gemessene Halbwertszeit. Dabei zeigte sich auch, dass die Zusammensetzung des Zellkulturmediums
einen Einfluss auf den Abbau von Isoproterenol und die Bildung von Isoprenochrome hatte. Im
Rahmen dieser Dissertation wurde noch ein zweites Projekt bearbeitet. Dabei handelte es sich um eine
Inter-Labor-Validierungsstudie eines neu entwickelten FADU-Systems. Diese Studie wurde in
Kooperation mit dem Swiss Federal Laboratories for Materials Science und Technology (EMPA) in
St.Gallen und der Cetcis GmbH in Esslingen durchgeführt. In einer ersten Phase ist eine technische
Testung des FADU-Systems erfolgt. In einer zweiten Phase sollte gezeigt werden das, dass neue
FADU-System DNS Strangbrüche zuverlässig detektieren kann. Das neue FADU-System sollte auch
dazu verwendet werden, um Einflüsse von Isoproterenol auf die genomische Stabilität zu untersuchen.
Dies konnte allerdings nie durchgeführt werden, da die neue FADU-Plattform technische Mängel
aufwies.
Introduction
1
CHAPTER I
1 Introduction
1.1 Biological background of stress
In a biological view, stress is a process that influences the physiology and induces the adaption of
many body functions such as heart rate, blood pressure, blood sugar, respiratory rate, muscle tone,
digestion and immune system. However, the origins of these global adaptions take place on a
molecular and cellular level. Stress can be defined as the response of an organism to stimuli that
represent a threat of the homeostasis [1]. Such stimuli are called stressors. All stressors represent a
challenge for the complex and dynamic equilibrium of the organism, also called homeostasis [2]. Their
origin can be external or internal. A stressor can be physical, like a chemical or biological agent, a
physical force or environmental conditions. But it can also be imaginary, like an idea or emotion [3,
4]. The body needs to respond and induce internal adjustments to the stress signal which induce
adaptions of the body functions to the changed conditions to restore homeostasis. The central nervous
system (CNS) controls and regulates this response. Two pathways, the sympathetic-adrenal-medullary
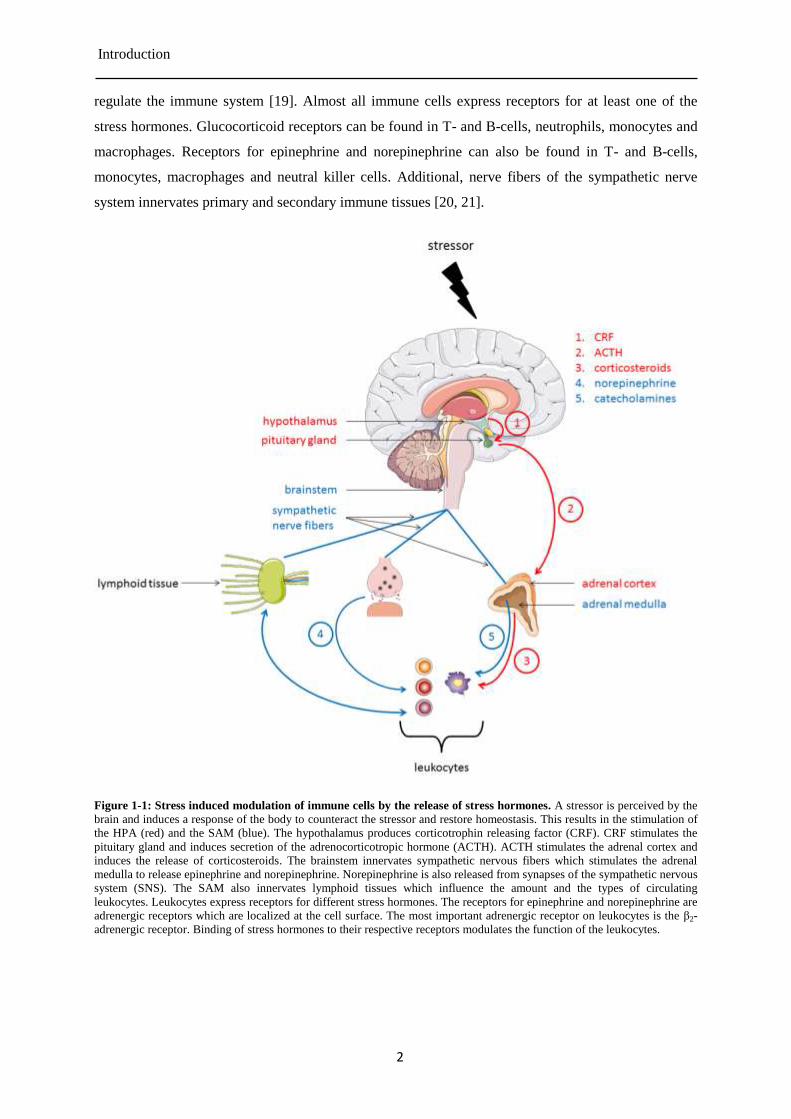
axis (SAM) and the hypothalamic-pituitary-adrenal axis (HPA), are the most important ones, see
Figure 1-1 [5-7]. There is also a crosstalk between both axes, which is important for a correct stress
reaction of the body [5, 8, 9]. The SAM triggers the release of the catecholamines such as epinephrine
and norepinephrine by the adrenal medulla into the bloodstream [10]. Epinephrine and norepinephrine
are two important stress hormones that are indispensable for the “fight-or-flight” response of the body
[11, 12]. The HPA induces the release of glucocorticoid hormones from the adrenal cortex [13]. The
most important glucocorticoid hormone in humans is cortisol. Cortisol and other glucocorticoids
regulate many body functions [14, 15]. Stress hormones also regulate many functions of the immune
system. For example, glucocorticoids have an anti-inflammatory and immunosuppressive function. In
general, the CNS, the endocrine system and the immune system form together a complex network with
reciprocal interactions [16]. All three systems are highly adaptive and can be adjusted as it is required.
The immune system and the CNS use a wide range of chemical messengers for communication.
Therefore, cells and tissues of both systems share the identical receptors for those messengers. This
allows a crosstalk between these two systems. For instance, during infections the immune system uses
cytokines to influence the CNS which leads to a sickness behavior [17]. Moreover, lymphocytes can
produce a variety of hormones and neurotransmitters [18]. On the other way round the CNS can
Introduction
2
regulate the immune system [19]. Almost all immune cells express receptors for at least one of the
stress hormones. Glucocorticoid receptors can be found in T- and B-cells, neutrophils, monocytes and
macrophages. Receptors for epinephrine and norepinephrine can also be found in T- and B-cells,
monocytes, macrophages and neutral killer cells. Additional, nerve fibers of the sympathetic nerve
system innervates primary and secondary immune tissues [20, 21].
Figure 1-1: Stress induced modulation of immune cells by the release of stress hormones. A stressor is perceived by the
brain and induces a response of the body to counteract the stressor and restore homeostasis. This results in the stimulation of
the HPA (red) and the SAM (blue). The hypothalamus produces corticotrophin releasing factor (CRF). CRF stimulates the
pituitary gland and induces secretion of the adrenocorticotropic hormone (ACTH). ACTH stimulates the adrenal cortex and
induces the release of corticosteroids. The brainstem innervates sympathetic nervous fibers which stimulates the adrenal
medulla to release epinephrine and norepinephrine. Norepinephrine is also released from synapses of the sympathetic nervous
system (SNS). The SAM also innervates lymphoid tissues which influence the amount and the types of circulating
leukocytes. Leukocytes express receptors for different stress hormones. The receptors for epinephrine and norepinephrine are
adrenergic receptors which are localized at the cell surface. The most important adrenergic receptor on leukocytes is the β2-
adrenergic receptor. Binding of stress hormones to their respective receptors modulates the function of the leukocytes.
Introduction
3
Medical significance of stress 1.1.1
It is well known that stress impairs the function of the immune system [16]. In addition, stress-induced
processes are also important in the development of cancer [22, 23]. Cancer is the genus for a big
heterogeneous group of diseases. There are many different causes that induce development of cancer
such as chemical and physical agents, diet, physical inactivity, infections, radiations, heredity and
hormones. Some types of cancer can be affected by stress, others not or only slightly. The research
that deals with stress and its molecular and cellular impact on the genomic stability, cancer
development, DNA damage and DNA damage repair is at the beginning. Results of studies that
investigated the influence of stress on the incidence and progression of cancer are inconsistent [24,
25]. The current data suggest that carcinogenesis is less influenced by stressors than the progression of
cancer [26-28].
1.1.1.1 The influence of stress on tumor growth and metastasis
Tumor growth and metastasis are complex processes of high medical relevance. Particularly metastasis
is important, because it is the most common cause of death in cancer patients [29]. Metastasis is a
process of a serial and contiguous, complex steps which include: formation of a primary tumor,
proliferation and angiogenesis, invasion into host tissue, detachment and circulation, followed by
embolization of tumor cells, attachment of circulating tumor cells at new sides of blood vessels,
extravasation into host tissue, proliferation and thereby formation of metastases [29]. Already in the
year 1979 Sklar and Anisman showed in a xenograft mouse model that stress has an influence on the
growth of P815 mastocytoma cells which were transplanted into mice [30]. Mice stressed by
inescapable electroshocks have a faster tumor growth, bigger tumors and a reduced survival time [30].
Rats stressed by electroshocks after a tumor implantation have a 50% lower rejection rate of the tumor
compared to control animals that were not shocked [31]. Social isolation stress could enhance the
tumor metastasis in mice and suppresses the immune response [32]. Furthermore, social isolation
stress increases metastases formation and stressed mice respond weaker to a chemotherapy than
unstressed mice [33]. Human studies showed a correlation between stress and the development of
cancer. A large study in Israel with a cohort of 6284 participants showed that stress has an influence
of the cancer incidence [34]. Stress caused by the dead of an adult son as a result of war or an accident
increases the risk for the development of lymphatic- and hematopoietic malignancies, melanomas or
respiratory cancer in the following life time. These findings are supported by cellular and molecular
biology findings which link the impact of stress to important steps of tumor progression [35].
Angiogenesis is an essential process for the growth of tumors and metastasis. Growth factors such as
vascular endothelial growth factor (VEGF), interleukin 6 (IL-6), transforming growth factor alpha
(TGF-α), transforming growth factor beta (TGF-β) and tumor necrosis factor alpha (TNF-α) are
Introduction
4
important in this process. Expression of VEGF in tumors and in serum of ovarian carcinoma patients
correlates with social stress [36, 37]. Epinephrine, norepinephrine and isoproterenol, a synthetic
sympathomimetic, could induce the expression of VEGF in cell lines. The higher expression of VEGF
could be inhibited by the β-blocker propranolol [38]. The blood concentration of IL-6 positively
correlates with social stress in patients with ovarian cancer [39]. Moreover, stress has also an influence
on tumor and metastasis invasion into the host tissue. For instance, matrix metalloproteinase are
important in the turnover of the extracellular matrix [40]. Norepinephrine could increase the
expression of matrix metalloproteinases in nasopharyngeal carcinoma tumor cells and propranolol
could inhibit the expression of these matrix metalloproteinases [41].
1.1.1.2 Stress mediated DNA damage
On a cellular and molecular level it was demonstrated that stress could induce DNA damage and also
impair the DNA damage repair. Rats which suffer from behavioral stress 24 h prior their scarification
have significantly more sister chromatid exchanges in their bone marrow cells compared to unstressed
animals [42]. A follow-up study demonstrated that rats which are stressed by different stressors have
a significant increase in sister chromatid exchange and also in chromosomal aberrations in their bone
marrow cells [43]. It was also shown that different behavioral stressors can induce chromosomal
alterations. However, the degree of chromosomal alternations depends on the type of the behavioral
stressor. Stress is also linked to oxidative DNA damages. In psychological stressed rats, the amount of
8-hydroxydeoxyguanosine (8-OH-dG) in the DNA isolated from the liver cells is increased compared
to unstressed animals [44]. Rats of a conditioned taste aversion study showed an increase of 8-OH-dG,
a marker for oxidative DNA damage, after receiving the conditioned stimulus compared to rats that
received the unconditioned stimulus [45]. Different types of psychological stressors could induce
oxidative DNA damage in human PBMCs. Although there is no general correlation between
psychological stress and oxidative DNA damage [46]. Some psychological stress parameters
positively correlate with the amount of 8-OH-dG in human PBMCs, for example: the depression-
rejection score, the profile of mood states (POMS) and the center for epidemiological studies
depression scale (CES-D). Moreover, stress can influence the expression of DNA repair enzymes. For
example, the expression of O6-methylguanine DNA methyltransferase is reduced in spleens of stressed
animal after induction of carcinogenic damage [47]. The DNA repair in lymphocytes of stressed non-
psychotic psychiatric inpatients is lower after X-ray irradiation compared to the DNA repair of
lymphocytes of unstressed non-psychotic psychiatric inpatients. Moreover, the depressed inpatients
have a poorer DNA damage repair compared with less depressed inpatients [48]. In contrast, some
studies showed a positive effect of stress on DNA repair. Two studies measured a higher DNA repair
capacity of the nucleotide excision repair pathway in blood cells of students during stress phases
(exam period) compared to unstressed phases (holidays) [49, 50]. Posttraumatic stress disorder
(PTSD) is an example for the link between psychological stress, stress hormones and genomic
Introduction
5
instability. PTSD is a mental disorder that can develop in the aftermath of severe traumatic events
[51]. Today, PTSD is defined as a trauma- and stressor-related disorder according to the “Diagnostic
and Statistical Manual of the Mental Disorder” (fifth edition) (DSM)-5 [51]. The hallmark of a PTSD
diagnosis is the experience of an extraordinarily threatening and distressing event of the person’s own
life or the life of a closely related person [52]. PTSD can be caused by a single traumatic event or by a
prolonged trauma exposure [53]. The prevalence for the PTSD during the lifetime is around 1.9% to
8.8% [51, 54, 55]. In contrast, to normal trauma, PTSD is characterized by a cluster of three long-term
persistent types of symptoms: reminder or re-experience symptoms of the trauma (flashbacks,
nightmares, intrusive images), activation (hyperarousal, insomnia) and deactivation (avoidance of
reminders and withdrawal) [51, 52]. Additionally, to distinguish PTSD from other mental diseases,
these symptoms must not be present prior to the trauma exposure and must persist longer than 1 month
after the traumatic event. Some of the pathophysiology features of PTSD are associated with changes
in the neurobiology including anatomical and endocrinal changes [56]. The endocrinal changes have
an impact on the stress response of the body. For instance, the HPA axis is dysregulated which
elevates the catecholamine and CRF levels in the brain. Furthermore, a sustained hyperactivation of
the sympathetic branch of the autonomic nervous system (ANS) is a cardinal marker for PTSD.
Studies have observed that the catecholamine concentrations as well as the concentrations of their
metabolites are elevated in the blood plasma and in the urine of PTSD patients [57-61]. In contrast, the
cortisol concentrations are lowered in the blood plasma and the urine [58, 62-64]. Studies have also
shown that at the time of exposure to the trauma, the peripheral epinephrine excretion can be used to
predict the possibility of the development for PTSD [65]. Also the administration of propranolol, a β-
adrenergic receptor antagonist, shortly after the exposure to psychological trauma can reduce PTSD
symptoms [66]. PTSD patients have a higher prevalence for somatic comorbidities like: type-2
diabetes, cardiovascular- , respiratory- , gastrointestinal- , inflammatory- and autoimmune diseases
[67-72]. Furthermore, PTSD is also associated with a higher risk of cancer [67, 73-75]. Many of these
comorbidities can be associated with inflammatory processes, genomic instability, increased aging and
senescence of the immune system. The increased stimulation of the sympathetic nervous system (SNS)
together with the dysregulation of the HPA increases the cytokine production, forcing a low-grade
chronic inflammatory character in PTSD patients [76, 77]. On a cellular level a change in the T cell
subset could be observed in PTSD patients [78-80]. PTSD is associated with an aged immune
phenotype of T cells [81]. The N-glycosylation profile of plasma of PTSD patients showed an
accelerated aging process [82]. In addition, it has been shown that PBMCs of PTSD patients have
accumulated DNA strand breaks that can be reversed by narrative therapy [83].
Introduction
6
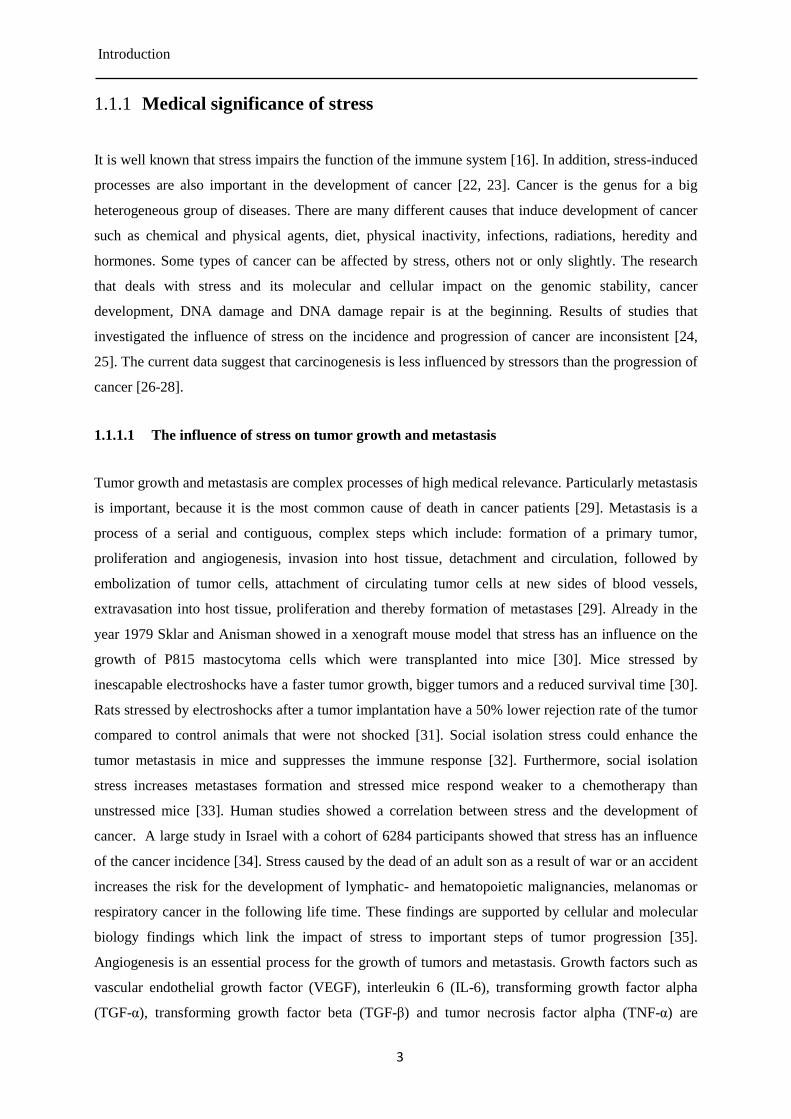
1.2 Adrenergic receptor family
Adrenergic receptors belong to the large family of G protein couple receptors (GPCRs) [84, 85]. The
adrenergic receptor family consists of two alpha receptors (α1 and α2) and three beta receptors (β1, β2
and β3). The natural agonists of the adrenergic receptors are the catecholamines, epinephrine and
norepinephrine. All adrenergic receptor display similar structural features: a single polypeptide chain
with three extracellular and three intracellular loops and seven highly conserved hydrophobic
transmembrane domains, see Figure 1-2 [86]. The α-adrenergic receptors (α-ARs) are important signal
mediator of the CNS and peripheral nervous systems. The β-adrenergic receptor (β-AR) subtypes have
a 65-70% sequence homology [87]. The β1-adrenergic (β1-AR) is predominant and the most important
adrenergic receptor in the heart [88]. The β3-adrenergic receptor (β3-AR) is mainly located in adipose
tissue and involved in the controlling of lipolysis [89]. In contrast, the β2-adrenergic receptor (β2-AR)
is expressed ubiquitous in the most human tissues. The β2-AR induces relaxation of the smooth
muscles. Therefore, β2-sympathomimeticas are used for the treatment of asthma and chronic
obstructive pulmonary disease (COPD).
Figure 1-2: Structure of the β2-adrenergic receptor. A) Schematic representation of the β2-AR, green: consensus positions
for N-glycosylation, blue: homologues residues with rhodopsin, orang: consensus sequence for PKA-phosphorylation, red:
residues for G protein coupled receptor kinase-phosphorylation, adapted from [90].
Introduction
7
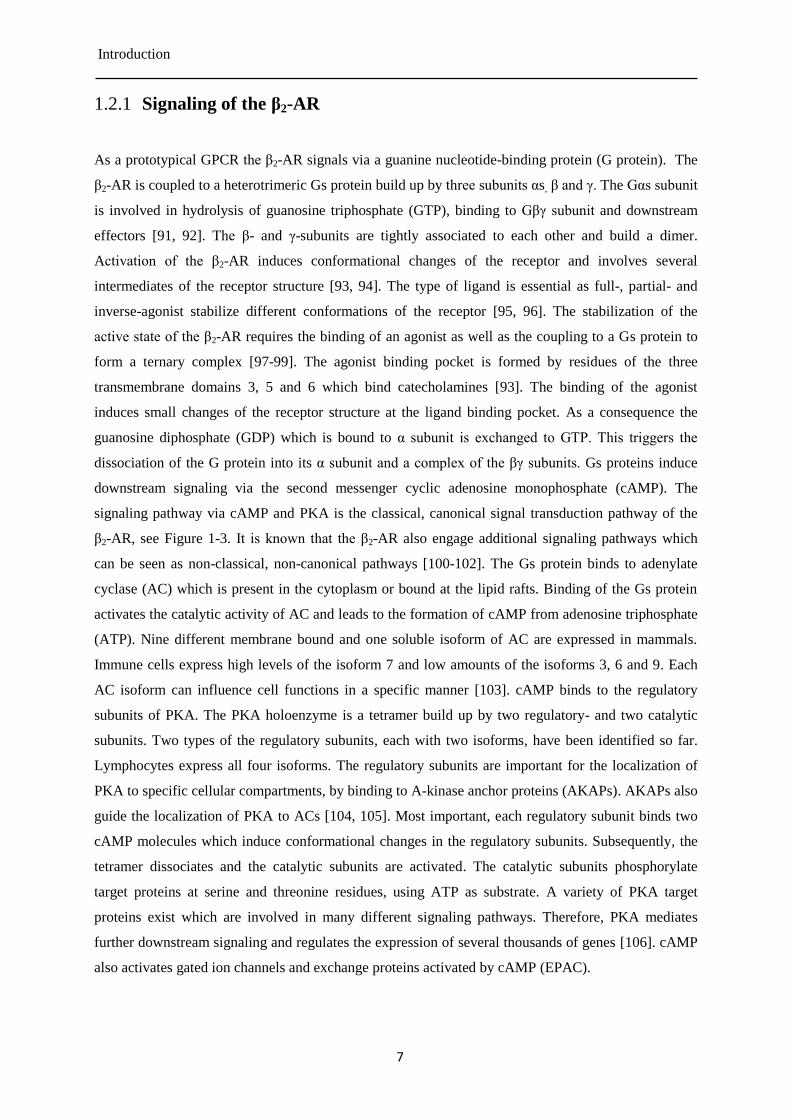
Signaling of the β2-AR 1.2.1
As a prototypical GPCR the β2-AR signals via a guanine nucleotide-binding protein (G protein). The
β2-AR is coupled to a heterotrimeric Gs protein build up by three subunits αs, β and γ. The Gαs subunit
is involved in hydrolysis of guanosine triphosphate (GTP), binding to Gβγ subunit and downstream
effectors [91, 92]. The β- and γ-subunits are tightly associated to each other and build a dimer.
Activation of the β2-AR induces conformational changes of the receptor and involves several
intermediates of the receptor structure [93, 94]. The type of ligand is essential as full-, partial- and
inverse-agonist stabilize different conformations of the receptor [95, 96]. The stabilization of the
active state of the β2-AR requires the binding of an agonist as well as the coupling to a Gs protein to
form a ternary complex [97-99]. The agonist binding pocket is formed by residues of the three
transmembrane domains 3, 5 and 6 which bind catecholamines [93]. The binding of the agonist
induces small changes of the receptor structure at the ligand binding pocket. As a consequence the
guanosine diphosphate (GDP) which is bound to α subunit is exchanged to GTP. This triggers the
dissociation of the G protein into its α subunit and a complex of the βγ subunits. Gs proteins induce
downstream signaling via the second messenger cyclic adenosine monophosphate (cAMP). The
signaling pathway via cAMP and PKA is the classical, canonical signal transduction pathway of the
β2-AR, see Figure 1-3. It is known that the β2-AR also engage additional signaling pathways which
can be seen as non-classical, non-canonical pathways [100-102]. The Gs protein binds to adenylate
cyclase (AC) which is present in the cytoplasm or bound at the lipid rafts. Binding of the Gs protein
activates the catalytic activity of AC and leads to the formation of cAMP from adenosine triphosphate
(ATP). Nine different membrane bound and one soluble isoform of AC are expressed in mammals.
Immune cells express high levels of the isoform 7 and low amounts of the isoforms 3, 6 and 9. Each
AC isoform can influence cell functions in a specific manner [103]. cAMP binds to the regulatory
subunits of PKA. The PKA holoenzyme is a tetramer build up by two regulatory- and two catalytic
subunits. Two types of the regulatory subunits, each with two isoforms, have been identified so far.
Lymphocytes express all four isoforms. The regulatory subunits are important for the localization of
PKA to specific cellular compartments, by binding to A-kinase anchor proteins (AKAPs). AKAPs also
guide the localization of PKA to ACs [104, 105]. Most important, each regulatory subunit binds two
cAMP molecules which induce conformational changes in the regulatory subunits. Subsequently, the
tetramer dissociates and the catalytic subunits are activated. The catalytic subunits phosphorylate
target proteins at serine and threonine residues, using ATP as substrate. A variety of PKA target
proteins exist which are involved in many different signaling pathways. Therefore, PKA mediates
further downstream signaling and regulates the expression of several thousands of genes [106]. cAMP
also activates gated ion channels and exchange proteins activated by cAMP (EPAC).
Introduction
8
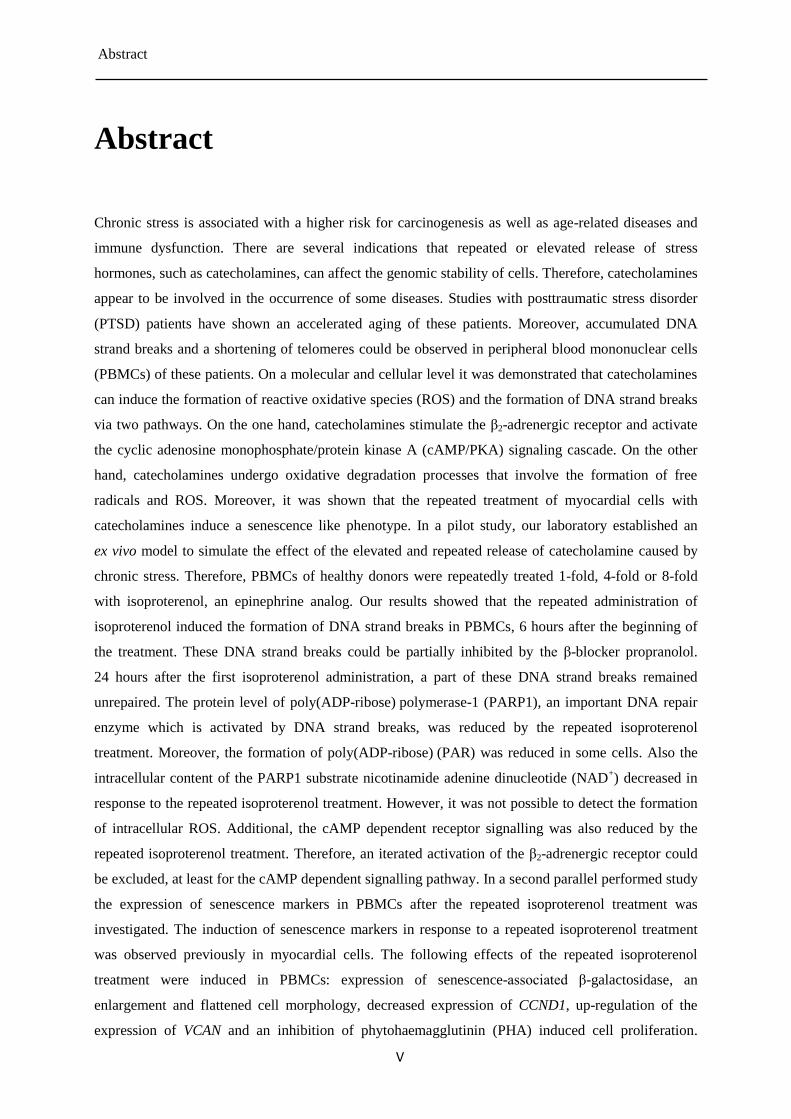
Figure 1-3: The “classical” cAMP/PKA signaling pathway of the β2-AR. Binding of catecholamines to the β2-AR
induces conformational changes of the receptor. Active receptor conformation is stabilized by the bound G protein. The
coupled Gs protein gets also activated and an exchange of GDP to GTP is initiated. This induces the dissociation of the Gs
protein in its α- and βγ-subunits. The Gαs subunit binds to the AC and stimulates the formation of cAMP from ATP. cAMP
binds to the PKA holoenzyme, which consists out of two catalytic subunits (C) and two regulatory subunits (R) and induces
the dissociation and activation. Each regulatory subunit binds two cAMP molecules. The activated catalytic subunits
phosphorylate target proteins. On the one hand, this leads to the activation of transcription factors and modifications of the
gene expression. On the other hand, the β2-AR gets also phosphorylated. Phosphorylation by PKA induces further
phosphorylation of the receptor by G protein coupled receptor kinases (GRKs). These phosphorylations are important for the
recruitment of β-arrestins. Besides the activation of PKA, cAMP also activates EPACs which activates downstream signaling
via the mitogen-activated protein kinase (MAPK) pathway. cAMP gets rapidly degraded within minutes by
phosphodiesterases (PDEs) and leads to termination of the cAMP dependent signaling.
Introduction
9
EPACs are guanine nucleotide exchange factors which induce signaling via the mitogen-activated
protein kinase (MAPK) pathway [100, 107-109]. However, the main signaling pathway is mediated by
PKA. The signaling via cAMP is only transient, because cAMP is degraded by phosphodiesterases
(PDEs). Real time cAMP dynamics measurements showed that the maximum of cAMP formation is
reached after about 0.5-1 min and return back to basal level within a few minutes [110]. PDEs
hydrolyze cAMP to adenosine monophosphate (AMP) by cleaving the phosphodiester bond. The PDE
superfamily contains 11 PDE families, the PDE families 4, 7 and 8 hydrolyze specifically cAMP.
PDE4 is the major expressed PDE family in leukocytes [111, 112]. PDEs are recruited by β-arrestins
to the activated β2-AR [113, 114]. By hydrolyzing the cAMP, PDEs reduce the local cAMP levels and
terminate the second messenger signaling [104]. Additional, the Gα subunit hydrolyses GTP to GDP,
inducing reassociation of the heterotrimeric G protein and termination of the signal transduction. After
activation of the receptor and signal transduction, the signaling process must be terminated to allow
the resensitization of the cell. Different processes are involved in the termination of the β2-AR
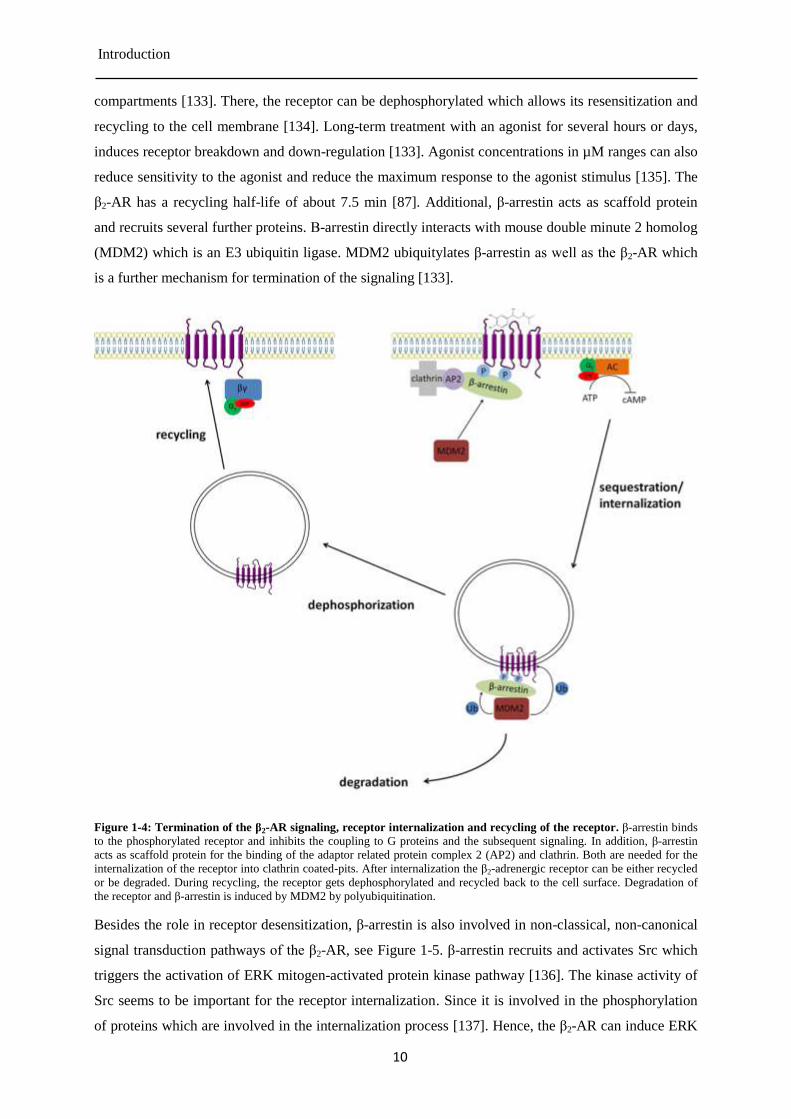
signaling, see Figure 1-4. Moreover, at nearly every stage of the signaling pathway the signal can be
down-regulated or terminated. One of these processes is the receptor desensitization. This is a rapid
process which reduces the signaling, although the receptor is occupied by a ligand. Desensitization of
the β2-AR is a multistep process, involving phosphorylation of the receptor by PKA and GRKs. These
phosphorylations induce the recruitment of β-arrestin to the β2-AR and its internalization [114-116].
Phosphorylation of the receptor induces uncoupling from the Gs protein, forming a negative-feedback
loop. Moreover, phosphorylation of β2-AR serves as a “switch”, because phosphorylated β2-AR
couples predominantly to Gi proteins [117-119]. In contrast to Gs proteins, Gi proteins inhibit the AC.
In addition, a “second signaling wave” can be induced by the Gβγ dimer of the Gi protein, see Figure
1-5. Activating a MAPK signaling pathway, that involves the proto-oncogene tyrosine-protein kinase
Src (Src) and the G protein rat sarcoma (Ras) and results finally in the activation of the extracellular
signal-regulated kinases (ERKs) [117, 119]. PKA mediated phosphorylation of the receptor also
induces further phosphorylation of the β2-AR by GRKs [120, 121]. These phosphorylations then
promote the binding of β-arrestin to the carboxy-terminal tail of the receptor [122, 123]. Mammals
express four arrestin subtypes: arrestin 1, arrestin 2, arrestin 3 and arrestin 4. The expression of
arrestin 1 and arrestin 4 is limited to the retinal rods and cones. In contrast, arrestin 2 and 3 are
ubiquitously expressed. They are also called β-arrestin 1 and 2 [124-126]. The binding of β-arrestins to
the receptor sterically inhibits the coupling to a G protein [127, 128]. Binding of β-arrestins to the
receptor initiates also the internalization of the β2-AR via clathrin-coated vesicles [129]. However, the
binding of β-arrestin to the receptor is only transient, β-arrestin dissociates from the β2-AR. It is
excluded from the endocytic vesicles that sequestered the receptor from the cell membrane [130-132].
After the internalization, the β2-AR can either be recycled or degraded, see Figure 1-4. The duration of
the agonist treatment determines the fate of the receptor. A short-term stimulation, up to 1 h, leads to
sequestering of the receptor from the plasma membrane and its internalization into endocytic
Introduction
10
compartments [133]. There, the receptor can be dephosphorylated which allows its resensitization and
recycling to the cell membrane [134]. Long-term treatment with an agonist for several hours or days,
induces receptor breakdown and down-regulation [133]. Agonist concentrations in µM ranges can also
reduce sensitivity to the agonist and reduce the maximum response to the agonist stimulus [135]. The
β2-AR has a recycling half-life of about 7.5 min [87]. Additional, β-arrestin acts as scaffold protein
and recruits several further proteins. Β-arrestin directly interacts with mouse double minute 2 homolog
(MDM2) which is an E3 ubiquitin ligase. MDM2 ubiquitylates β-arrestin as well as the β2-AR which
is a further mechanism for termination of the signaling [133].
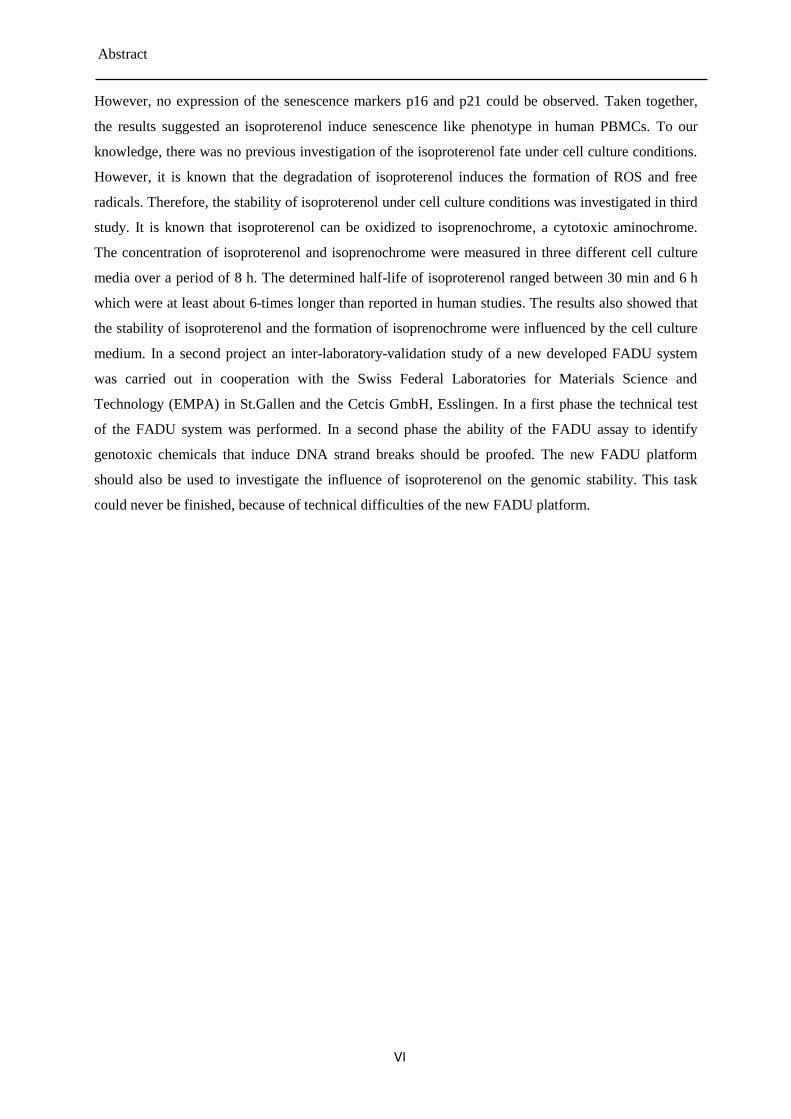
Figure 1-4: Termination of the β2-AR signaling, receptor internalization and recycling of the receptor. β-arrestin binds
to the phosphorylated receptor and inhibits the coupling to G proteins and the subsequent signaling. In addition, β-arrestin
acts as scaffold protein for the binding of the adaptor related protein complex 2 (AP2) and clathrin. Both are needed for the
internalization of the receptor into clathrin coated-pits. After internalization the β2-adrenergic receptor can be either recycled
or be degraded. During recycling, the receptor gets dephosphorylated and recycled back to the cell surface. Degradation of
the receptor and β-arrestin is induced by MDM2 by polyubiquitination.
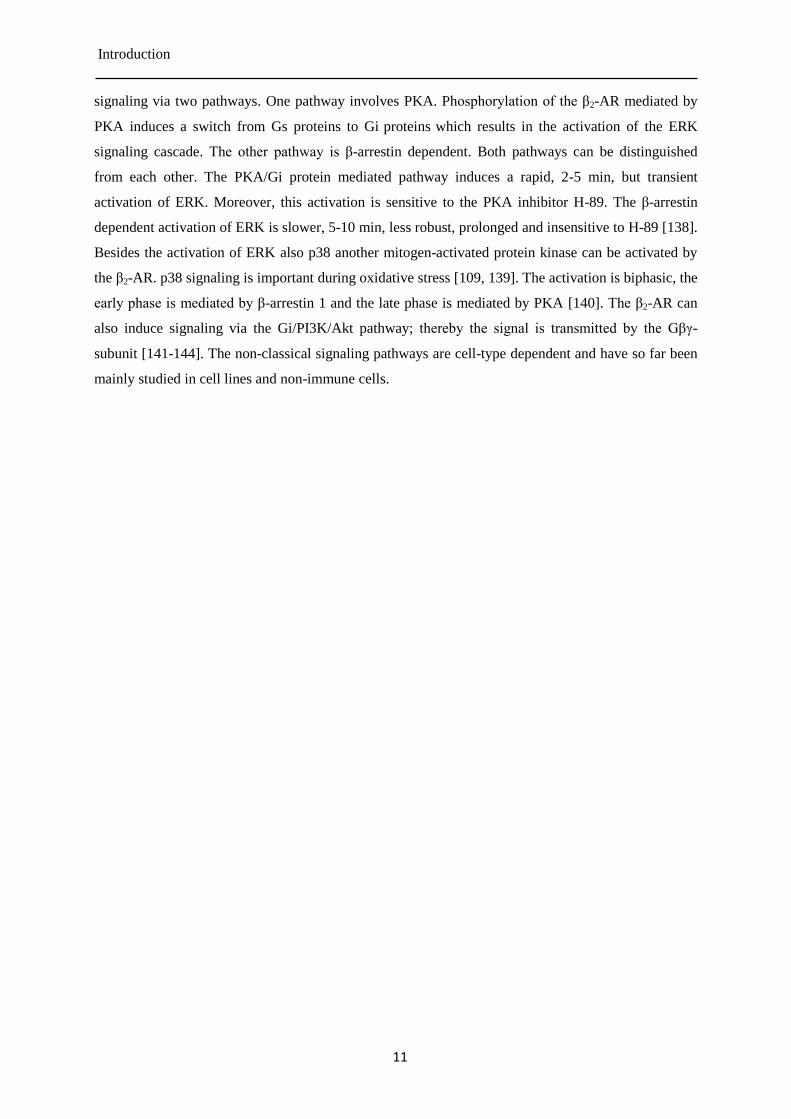
Besides the role in receptor desensitization, β-arrestin is also involved in non-classical, non-canonical
signal transduction pathways of the β2-AR, see Figure 1-5. β-arrestin recruits and activates Src which
triggers the activation of ERK mitogen-activated protein kinase pathway [136]. The kinase activity of
Src seems to be important for the receptor internalization. Since it is involved in the phosphorylation
of proteins which are involved in the internalization process [137]. Hence, the β2-AR can induce ERK
Introduction
11
signaling via two pathways. One pathway involves PKA. Phosphorylation of the β2-AR mediated by
PKA induces a switch from Gs proteins to Gi proteins which results in the activation of the ERK
signaling cascade. The other pathway is β-arrestin dependent. Both pathways can be distinguished
from each other. The PKA/Gi protein mediated pathway induces a rapid, 2-5 min, but transient
activation of ERK. Moreover, this activation is sensitive to the PKA inhibitor H-89. The β-arrestin
dependent activation of ERK is slower, 5-10 min, less robust, prolonged and insensitive to H-89 [138].
Besides the activation of ERK also p38 another mitogen-activated protein kinase can be activated by
the β2-AR. p38 signaling is important during oxidative stress [109, 139]. The activation is biphasic, the
early phase is mediated by β-arrestin 1 and the late phase is mediated by PKA [140]. The β2-AR can
also induce signaling via the Gi/PI3K/Akt pathway; thereby the signal is transmitted by the Gβγ-
subunit [141-144]. The non-classical signaling pathways are cell-type dependent and have so far been
mainly studied in cell lines and non-immune cells.
Introduction
12
Figure 1-5: “Second wave signaling” of the β2-AR. In addition to the cAMP mediated receptor signaling pathway, the β2-
AR is coupled to several other signaling pathways. β-arrestin also binds the protein kinases Src and p38 which induce various
transcription factors via the ERK pathway of the MAPK. The phosphorylated receptor also couples to Gi proteins instead of
Gs proteins. The βγ heterodimer of the Gi protein activates the PI3K/AKT signaling pathway and also the MAPK pathway
via the Src protein kinase. At the same time, the αi subunit of the G protein inhibits the AC and the cAMP mediated
signaling.
There is one more fact that further increases the complexity of the β2-AR signaling, a phenomenon
known as “biased agonism”. This describes the fact that ligands that bind to receptors which are
Introduction
13
coupled to several signaling pathways can activate only distinct pathways and not all pathways. On the
one hand, ligands can be inverse agonist for one signaling pathway and on the other hand, the same
ligands can activate another signaling pathway. This phenomenon can be observed for the β2-AR [145-
148]. For instance, the β-blockers propranolol and ICI118551 are inverse agonists for the Gs protein
pathway but both are agonists for the β-arrestin dependent activation of ERK [147]. In contrast, the
agonist isoproterenol activates both pathways and no biased agonism is known [148, 149].
1.3 Catecholamines
The catecholamines epinephrine and norepinephrine are stress hormones and mediate the stress
response through the whole body. Both are required for the induction of the “fight-or-flight” stress
response. Together with dopamine, epinephrine and norepinephrine they are the most important
naturally occurring catecholamines in the human body. All three catecholamines are synthesized from
the amino acid tyrosine in a serial synthesis pathway of 4 steps [150]. The human plasma contains,
under resting conditions, mainly the following catechols: dopamine, epinephrine, norepinephrine, 3,4-
dihydroxyphenylalanin (DOPA) their precursor and the two metabolites dihydroxyphenylacetic acid
(DOPAC) and dihydoxyphenylgycol (DHPG) [151]. Catecholamines have only a short half-life of a
few minutes after the secretion into the bloodstream. Several enzymes are involved in the degradation
of catecholamines. The expression of these enzymes varies between different tissues and cells. Hence,
the degradation products are different, depending on the cell type and tissue type that metabolizes the
catecholamines [151]. In the following, the focus will be on the degradation of catecholamines that
are secreted into the bloodstream during stress. These are the two catecholamines epinephrine and
norepinephrine. Under resting conditions, the main sources of noradrenalin secretion are the
sympathetic nerves. Under stress conditions, the secretion of norepinephrine is increased by an
additional release of norepinephrine by the adrenal medulla. The plasma concentration of
norepinephrine depends on different factors, such as the rate of release, the body site of sampling, the
reuptake of norepinephrine and the modulation of α2-adrenoreceptors [151]. The human resting plasma
concentration of norepinephrine ranges between 1-1.5 nmol/l [152-154]. In contrast, epinephrine is
released mainly by the adrenal gland. The plasma concentration of epinephrine under resting
conditions is low; it ranges from 0.2 nmol/l to 0.5 nmol/l [152-154]. During stress about 80% of the
chromaffin cells of the adrenal medulla release and synthesize epinephrine. The remaining 20% of the
chromaffin cells release and synthesize norepinephrine [155, 156]. The increase of the epinephrine and
norepinephrine plasma concentrations is influenced by the stress intensity and type of the stressor
[157-159]. After the release catecholamines must be metabolized. This is essential for the organism to
return back to resting conditions. Two enzymes are the key player in the metabolism of
catecholamines, catechol-O-methyltransferase (COMT) and monoamine oxidase (MAO) [160].
Introduction
14
COMT transfers a methyl group of S-adenosylmethionine to one of the hydroxyl groups of the
catechol ring [161]. COMT is expressed in most human tissues but is mostly expressed in the liver,
kidney and gastrointestinal tract [162]. The second key enzyme of the catecholamine metabolism is
MAO [160]. MAO is a mitochondrial enzyme and located at the outer mitochondrial membrane [163,
164]. It is expressed in most cell types but the highest expression, outside of the brain, can be found in
the liver and the kidney [165]. MAOs catalyze the oxidative deamination of primary, secondary and
some tertiary amines [166]. During the oxidative deamination of amines, MAO produces reactive
oxygen species (ROS) in the form of hydrogen peroxide [167, 168]. COMT as well as MAO can
catalyze the initial step of the catecholamine metabolism. But also other enzymes are involved in the
degradation. Besides the breakdown, catecholamines can also be conjugated with sulfate and
glucuronic acid. Both conjugates and metabolites are inactive and cannot further activate adrenergic
receptors (AR).
Effects of catecholamines on immune cells 1.3.1
Catecholamines are important messengers between the immune system and the CNS. Therefore, both
systems need receptors for catecholamines. Indeed receptors for catecholamines can be found in
different types of leukocytes. Moreover, enzymes for the synthesis and degradation of catecholamines
can be found in leukocytes [169]. Sympathetic nerve fibers directly innervate lymphoid organs [170,
171]. Catecholamines can influence immune cell proliferation, differentiation and cytokine production
[150, 172, 173]. The receptor expression on immune cells is dynamic and the expression pattern can
vary. It is known that immune cells such as T cells, B cells, neutral killer cells, monocytes and
macrophages express AR. B cells express approximately a 2.5- to 4-fold bigger amount of β-ARs than
T cells [174, 175]. The different T cell subpopulations show different densities of β-ARs on their cell
surfaces. The most β-ARs are present on T-suppressor cells with about 2900 receptors/cell, followed
by cytotoxic T cells with about 1800 receptors/cell and T-helper cells with about 750 receptors/cell
[176]. Monocytes show a β-AR density of about 2400 receptors/cell [177, 178]. Natural killer cells
express about 1900 β-ARs/cell. During the differentiation of monocytes into macrophages the cells
lose their β-ARs. This is associated with insensitivity to catecholamines [179, 180]. The receptor
densities which are listed above are only approximations. The used methodologies can influence the
determination of receptor density. Also biological process can influence the measured densities. For
example, the density of β2-ARs on the T cells surface can be influenced by IL-2 and
phytohaemagglutinin (PHA) [181, 182]. Agonists of the β2-AR such as epinephrine and
norepinephrine lead to a decrease of the β2-AR density on T cell surface [183]. A reduced receptor
expression can also be observed by culturing the cells without stimulation of the β2-AR [183]. IL-2
prevents this loss of β2-ARs on the cell surface of T-helper cells. Moreover, IL-2 increases the density
of β2-ARs on the plasma membrane of cytotoxic T cells [183]. Treatment of human PBMCs with
Introduction
15
IL1-β induces a transient increase of β2-ARs density within the first 6 hours compared to untreated
cells [184]. The dynamic of β2-AR density can also be seen during physical stress which induces a
significant increase of β2-ARs in T cells, B cells and monocytes. The amount of β2-AR at the cell
surface return back to basal levels after 30 min of the rest [177]. Although, lymphocytes express AR
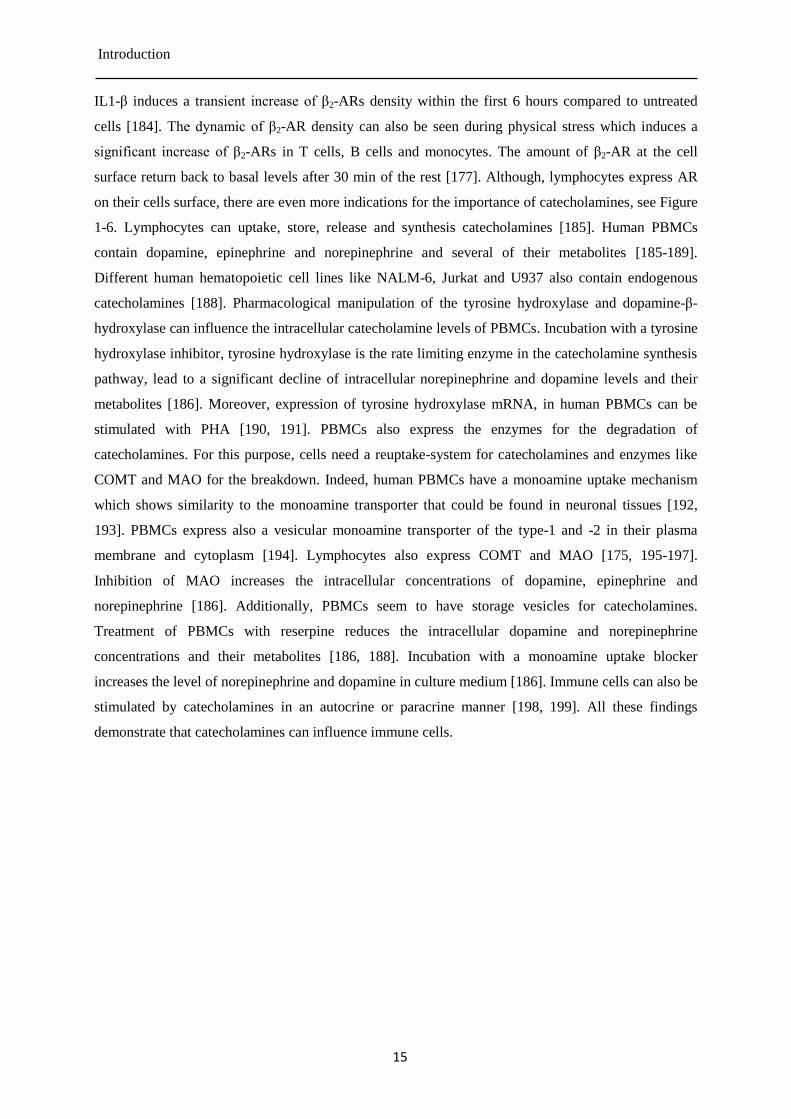
on their cells surface, there are even more indications for the importance of catecholamines, see Figure
1-6. Lymphocytes can uptake, store, release and synthesis catecholamines [185]. Human PBMCs
contain dopamine, epinephrine and norepinephrine and several of their metabolites [185-189].
Different human hematopoietic cell lines like NALM-6, Jurkat and U937 also contain endogenous
catecholamines [188]. Pharmacological manipulation of the tyrosine hydroxylase and dopamine-β-
hydroxylase can influence the intracellular catecholamine levels of PBMCs. Incubation with a tyrosine
hydroxylase inhibitor, tyrosine hydroxylase is the rate limiting enzyme in the catecholamine synthesis
pathway, lead to a significant decline of intracellular norepinephrine and dopamine levels and their
metabolites [186]. Moreover, expression of tyrosine hydroxylase mRNA, in human PBMCs can be
stimulated with PHA [190, 191]. PBMCs also express the enzymes for the degradation of
catecholamines. For this purpose, cells need a reuptake-system for catecholamines and enzymes like
COMT and MAO for the breakdown. Indeed, human PBMCs have a monoamine uptake mechanism
which shows similarity to the monoamine transporter that could be found in neuronal tissues [192,
193]. PBMCs express also a vesicular monoamine transporter of the type-1 and -2 in their plasma
membrane and cytoplasm [194]. Lymphocytes also express COMT and MAO [175, 195-197].
Inhibition of MAO increases the intracellular concentrations of dopamine, epinephrine and
norepinephrine [186]. Additionally, PBMCs seem to have storage vesicles for catecholamines.
Treatment of PBMCs with reserpine reduces the intracellular dopamine and norepinephrine
concentrations and their metabolites [186, 188]. Incubation with a monoamine uptake blocker
increases the level of norepinephrine and dopamine in culture medium [186]. Immune cells can also be
stimulated by catecholamines in an autocrine or paracrine manner [198, 199]. All these findings
demonstrate that catecholamines can influence immune cells.
Introduction
16
Figure 1-6: Summary of catecholamine receptors, uptake mechanisms, synthesis processes and degradation
mechanisms in lymphocytes, adapted from [169]. Lymphocytes contain all important factors that are needed for the
synthesis and metabolism of catecholamines, including MAO and COMT.
Isoproterenol 1.3.2
Isoproterenol is a synthetic catecholamine and a sympathomimetic drug [200]. It is a nonselective β-
AR agonist and an analog of epinephrine. The chemical structure differs from epinephrine by the
substitution of the methyl group at the nitrogen atom by an isopropyl group. This substitution makes it
selective for β-ARs. Furthermore, the isopropyl group inhibits the degradation of isoproterenol by
MAOs [201]. Isoproterenol was used in the medicine for the treatment of bradycardia and heart block
[202]. As aerosol it can be used for the treatment of asthma by relaxing the smooth muscles leading to
bronchodilation via activation of the β2-AR [203, 204]. The route of administration determines the
dose and influences the metabolism and the plasma half-life of isoproterenol. Different routes of
administration in dogs show significant differences in the onset of the heart rate increase, time to
maximal heart rate and duration of the effects. The fastest increase of the heart rate and the highest
response is induced by intravenous injection [205]. Isoproterenol is bound by plasma proteins. The
plasma protein bound fraction of the administered dose ranges from about 40% to 70% [206, 207].
The measured plasma half-lives vary between a few minutes until 7 h [200]. The elimination half-life
of isoproterenol is 2-10 min in rats, measured by micro dialysis sampling [206]. In children a plasma
half-life of about 4.2 min can be detected after intravenous infusion [208]. Studies in adults and
children using tritiated isoproterenol as radioactive tracer have shown that intravenous injected
Introduction
17
isoproterenol exhibits a biphasic elimination profile in the plasma [201, 209]. The first, rapid phase
shows a plasma half-life of about 2.5-5 min. The second, slower phase shows a plasma half-life of
about 2.5-7 h [201, 209, 210]. Follow-up analysis of the plasma radioactivity in the next 6.5 h have
shown the largest amount of the remaining radioactivity is caused by unchanged isoproterenol [201].
The smaller part is caused by 3-O-methyl isoproterenol. No further compounds like conjugated
isoproterenol could be detected [201]. In contrast, after oral dosage only a small amount of unchanged
isoproterenol or 3-O-methyl isoproterenol could be detected [201]. Further analyses of blood plasma
or urine samples have shown that isoproterenol is conjugated with sulfate and this conjugated
isoproterenol is the major metabolite [201, 211]. Inhalation of isoproterenol results in a quite similar
metabolite pattern with sulfated isoproterenol as major compound [211-213]. Isoproterenol is
metabolized primarily in the liver, lung and intestines by COMT and excreted in the urine and bile,
either in conjugated form or free form [205, 208, 214]. The main part, about 50-60%, of the
intravenous applied isoproterenol dose is excreted unchanged [201]. The remaining part, 40-50%, of
the dose is free isoproterenol or conjugated 3-O-methyl isoproterenol. Catecholamines including
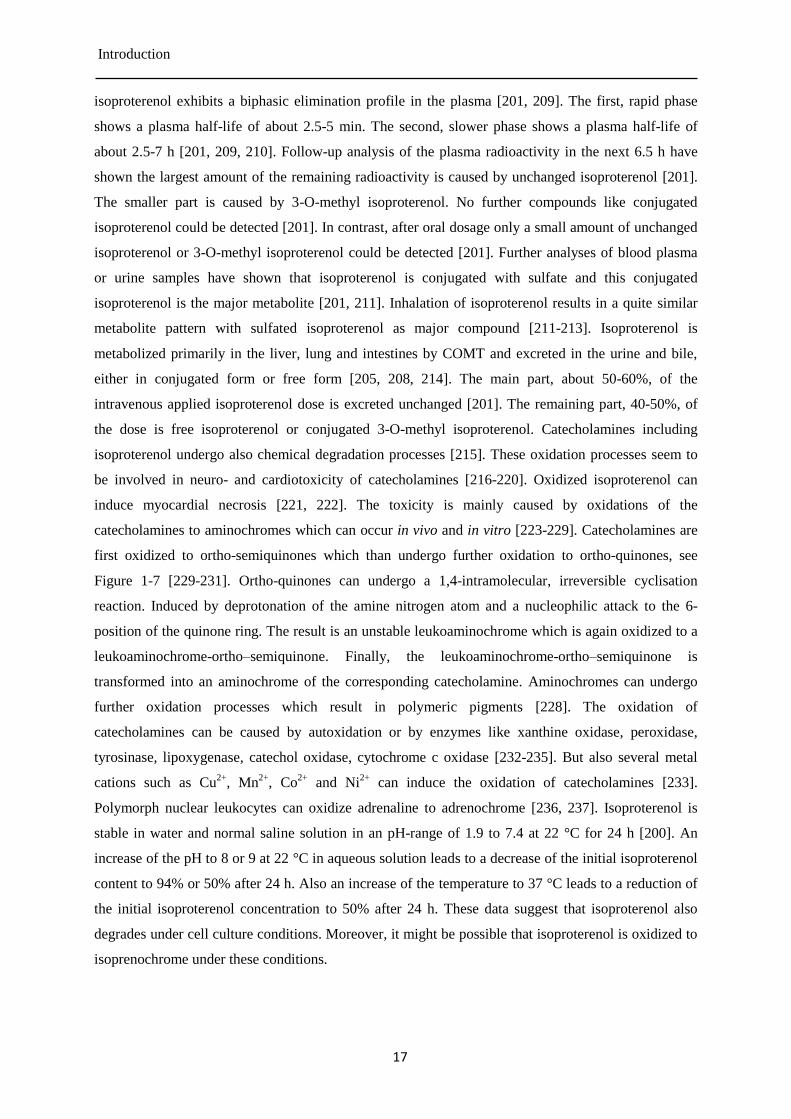
isoproterenol undergo also chemical degradation processes [215]. These oxidation processes seem to
be involved in neuro- and cardiotoxicity of catecholamines [216-220]. Oxidized isoproterenol can
induce myocardial necrosis [221, 222]. The toxicity is mainly caused by oxidations of the
catecholamines to aminochromes which can occur in vivo and in vitro [223-229]. Catecholamines are
first oxidized to ortho-semiquinones which than undergo further oxidation to ortho-quinones, see
Figure 1-7 [229-231]. Ortho-quinones can undergo a 1,4-intramolecular, irreversible cyclisation
reaction. Induced by deprotonation of the amine nitrogen atom and a nucleophilic attack to the 6-
position of the quinone ring. The result is an unstable leukoaminochrome which is again oxidized to a
leukoaminochrome-ortho–semiquinone. Finally, the leukoaminochrome-ortho–semiquinone is
transformed into an aminochrome of the corresponding catecholamine. Aminochromes can undergo
further oxidation processes which result in polymeric pigments [228]. The oxidation of
catecholamines can be caused by autoxidation or by enzymes like xanthine oxidase, peroxidase,
tyrosinase, lipoxygenase, catechol oxidase, cytochrome c oxidase [232-235]. But also several metal
cations such as Cu2+
, Mn2+
, Co2+
and Ni2+
can induce the oxidation of catecholamines [233].
Polymorph nuclear leukocytes can oxidize adrenaline to adrenochrome [236, 237]. Isoproterenol is
stable in water and normal saline solution in an pH-range of 1.9 to 7.4 at 22 °C for 24 h [200]. An
increase of the pH to 8 or 9 at 22 °C in aqueous solution leads to a decrease of the initial isoproterenol
content to 94% or 50% after 24 h. Also an increase of the temperature to 37 °C leads to a reduction of
the initial isoproterenol concentration to 50% after 24 h. These data suggest that isoproterenol also
degrades under cell culture conditions. Moreover, it might be possible that isoproterenol is oxidized to
isoprenochrome under these conditions.
Introduction
18
OH
HO
HO
HN
OH
O
HO
HN-1e-,1H+
-1e-,1H+
OH
NH
O
O
OH
HO
HO N
-1e-,1H+
OH
O
HO N
-1e-,1H+
OH
O
O N
OH
O
O N
isoproterenol isoproterenol-O-semiquinone
isoproterenol-O-quinoneleukoisoprenochrome
leukoisoprenochrome-O-semiquinone
isoprenochrome
Figure 1-7: Isoproterenol oxidation to isoprenochrome, adapted from [228].
Poly(ADP-ribose) polymerases and poly(ADP-ribosyl)ation 1.3.3
The human Poly(ADP-ribose) polymerases (PARPs) are important DNA repair enzymes. PARPs are
involved in the repair of various types of DNA lesions, such as oxidative damage and DNA strand
breaks [238]. As described above, these types of DNA lesions can be caused by several types of
stressors. The PARP enzyme family consists of 17 members which share a conserved catalytic domain
[239]. PARPs use NAD+ as a substrate to catalyze the formation of poly(ADP-ribose) (PAR). PAR is
an important posttranslational modification that is especially important under genotoxic stress. The
best known member of this enzyme family is PARP1, which is responsible for about 90% of the PAR
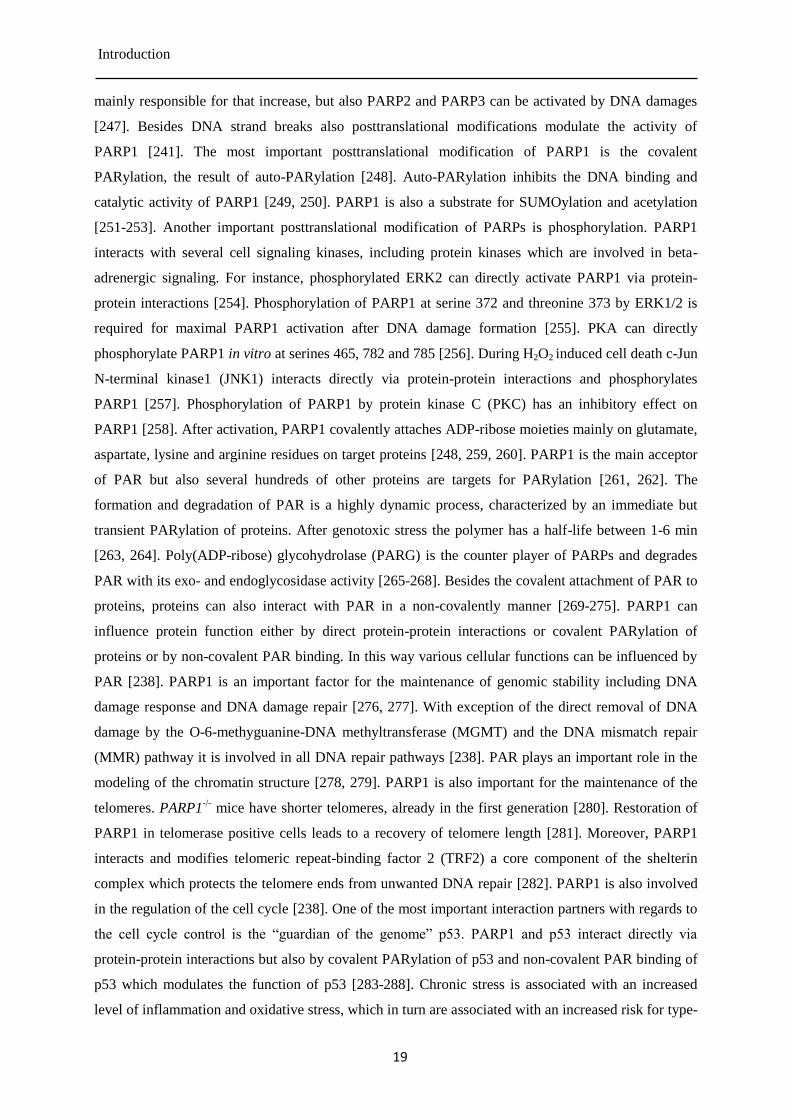
formation in cells under genotoxic conditions. PARP1 is highly conserved and constitutively
expressed. It has a molecular size of about 113 kDa and consists of six major domains, see Figure 1-8
[240, 241]. The activity of PARP1 is regulated by various mechanisms. However, unusual DNA
structures like single-strand breaks, double-strand breaks, three- and four-way junctions and hairpins
are the most important PARP1 activators [242-244]. After the formation of DNA single- or double-
strand breaks, the PAR content in cells increases dramatically to about 100-fold [245, 246]. PARP1 is
Introduction
19
mainly responsible for that increase, but also PARP2 and PARP3 can be activated by DNA damages
[247]. Besides DNA strand breaks also posttranslational modifications modulate the activity of
PARP1 [241]. The most important posttranslational modification of PARP1 is the covalent
PARylation, the result of auto-PARylation [248]. Auto-PARylation inhibits the DNA binding and
catalytic activity of PARP1 [249, 250]. PARP1 is also a substrate for SUMOylation and acetylation
[251-253]. Another important posttranslational modification of PARPs is phosphorylation. PARP1
interacts with several cell signaling kinases, including protein kinases which are involved in beta-
adrenergic signaling. For instance, phosphorylated ERK2 can directly activate PARP1 via protein-
protein interactions [254]. Phosphorylation of PARP1 at serine 372 and threonine 373 by ERK1/2 is
required for maximal PARP1 activation after DNA damage formation [255]. PKA can directly
phosphorylate PARP1 in vitro at serines 465, 782 and 785 [256]. During H2O2 induced cell death c-Jun
N-terminal kinase1 (JNK1) interacts directly via protein-protein interactions and phosphorylates
PARP1 [257]. Phosphorylation of PARP1 by protein kinase C (PKC) has an inhibitory effect on
PARP1 [258]. After activation, PARP1 covalently attaches ADP-ribose moieties mainly on glutamate,
aspartate, lysine and arginine residues on target proteins [248, 259, 260]. PARP1 is the main acceptor
of PAR but also several hundreds of other proteins are targets for PARylation [261, 262]. The
formation and degradation of PAR is a highly dynamic process, characterized by an immediate but
transient PARylation of proteins. After genotoxic stress the polymer has a half-life between 1-6 min
[263, 264]. Poly(ADP-ribose) glycohydrolase (PARG) is the counter player of PARPs and degrades
PAR with its exo- and endoglycosidase activity [265-268]. Besides the covalent attachment of PAR to
proteins, proteins can also interact with PAR in a non-covalently manner [269-275]. PARP1 can
influence protein function either by direct protein-protein interactions or covalent PARylation of
proteins or by non-covalent PAR binding. In this way various cellular functions can be influenced by
PAR [238]. PARP1 is an important factor for the maintenance of genomic stability including DNA
damage response and DNA damage repair [276, 277]. With exception of the direct removal of DNA
damage by the O-6-methyguanine-DNA methyltransferase (MGMT) and the DNA mismatch repair
(MMR) pathway it is involved in all DNA repair pathways [238]. PAR plays an important role in the
modeling of the chromatin structure [278, 279]. PARP1 is also important for the maintenance of the
telomeres. PARP1-/-
mice have shorter telomeres, already in the first generation [280]. Restoration of
PARP1 in telomerase positive cells leads to a recovery of telomere length [281]. Moreover, PARP1
interacts and modifies telomeric repeat-binding factor 2 (TRF2) a core component of the shelterin
complex which protects the telomere ends from unwanted DNA repair [282]. PARP1 is also involved
in the regulation of the cell cycle [238]. One of the most important interaction partners with regards to
the cell cycle control is the “guardian of the genome” p53. PARP1 and p53 interact directly via
protein-protein interactions but also by covalent PARylation of p53 and non-covalent PAR binding of
p53 which modulates the function of p53 [283-288]. Chronic stress is associated with an increased
level of inflammation and oxidative stress, which in turn are associated with an increased risk for type-
Introduction
20
2 diabetes, cardiovascular- and inflammatory diseases [69, 70, 289]. These findings provide a link
between the interactions of chronic stress and PARP1. Since PARP1 contributes to inflammation and
the development of related pathologies by interaction with nuclear factor kappa-light-chain-enhancer
of activated B cells (NF-κB) [238]. NF-κB is an important transcription factor for the regulation of the
gene expression after proinflammatory stimuli [290]. PARP1 interacts with both major NF-κB
subunits, p65 and p55, and is required for the NF-κB induced gene transcription [291]. Acetylation of
PARP1 by the histone acetylase p300/CBP upon inflammatory stimuli, leads to a stronger binding to
NF-κB [253]. PARP1 -/-
mice have an impaired expression of the NF-κB controlled proinflammatory
mediators, such as TNF-α, IL-6 and iNOS [292, 293]. NF-κB signaling is also important for the
promotion of senescence [294]. Several studies have demonstrated that a PARP1 knockout or PARP
inhibitors can be protective against inflammatory conditions and oxidative stress [269, 295, 296]. The
association between PARP1 and chronic stress is further supported by the finding that PARP
inhibition might be a new therapeutic instrument for the treatment of stress related diseases. A mice
study has shown that PARP1-/-
mice are protected against stress induced immune-compromisation
[297]. Mice treated with the PARP inhibitor 3-aminobenzamide are also protected against stress
induced reduction of antibody production in response to a novel antigen [298]. A recent study showed
the potential use of PARP inhibitors as a new class of antidepressants. 3-aminobenzamide and 5-
aminoisoquinolinone were used to treat the effects of repeated physiological (swim test) and
psychological (social defeat stress and chronic unpredictable stress) stress. The results showed an
antidepressant activity and mitigation of the stress symptoms by both PARP inhibitors. Moreover, the
effects were comparable with a fluoxetine treatment. Fluoxetine is a commonly used antidepressant for
the treatment of major depressive disorder [299]. Finally, PARP1 is an important switch between cell
survival and cell death [241]. NAD+ is an essential cofactor of the cellular metabolism and needed for
the maintenance of the redox state of a cell [249]. It is also the substrate of PARPs. PARylation seem
to be the master regulator of the NAD+ catabolism in mammalian cells [300, 301]. Under genotoxic
stress and hyperactivation of PARP1, the half-life of NAD+ decreases from 1 h to 5-15 min. Moreover,
the NAD+ level decrease to about 20% of the basal level [302-304]. Treatment of cells with various
DNA damaging agents have shown that low or moderate doses induce a reduction of the cellular
NAD+ level to 65-75% of the basal level. In contrast, high doses can induce nearly a complete
depletion of the cellular NAD+ pools [303-308]. The NAD
+ depletion results also in a depletion of
ATP pools. The result is an energy crisis which results in necrosis [309].
Introduction
21
Figure 1-8: Schematic representation of PARP1 protein structure. PARP1 is build up by 3 major domains. The DNA
binding domain contains the two homologous zinc fingers (ZnF1 and ZnF2) and the WGR (tryptophan-glycine-arginine)
domain. The nuclear localization sequence (NLS) is localized between ZnF2 and ZnF3. ZnF3 has a different structure
compared to the two other zinc fingers. It is involved in interdomain contacts. The BRCA1 C terminus (BRCT) domain is
important for protein-protein interactions and contains several residues for the automodification. The catalytic domain built
up the helical domain (HD) which has regulatory functions and the ADP-ribosyltransferase (ART) domain. The ART domain
is the catalytic center of the enzyme.
In addition, PAR can induce also cell death. After cleavage, PAR molecules leave the nucleus and
induce the release of apoptosis inducing factor (AIF) from mitochondria. AIF induces a caspase
independent chromatin condensation and large scale DNA fragmentation, this kind of cell death is
called parthanatos [310].
1.4 Cellular senescence
Chronic stress can be linked with an increased risk of several somatic diseases. The same changes can
be observed during aging. Aging can be defined as a process of progressive deterioration of
physiological function at a cellular, tissue and body level [311]. Several hints suggest that stress may
promote earlier onset of age-related diseases that might also be associated with cellular senescence
[312]. Persons with elevated levels of stress hormones have shorter telomeres [313, 314]. PTSD
caused by childhood trauma or rape is associated with an increased telomere shortening in leukocytes
[315, 316]. A study with 650 veterans of US army special operation units deployed during Iraq or
Afghanistan wars showed that participants with PTSD had shorter telomeres than participants without
PTSD [317]. A further study with veterans of the Croatian war could confirm these findings [318].
Additionally, it was shown that the percentage of proliferating cytotoxic T cells and T-helper cells is
lower in an elderly control group. In PTSD patients only the percentage of proliferating cytotoxic T
cells is lowered [318]. A recent study with 3000 participants in south Germany showed shortening of
the telomeres has a dose-dependency. Since the telomeres of subjects with partial PTSD are longer
than telomeres of subjects with full PTSD [319]. One possible explanation for telomere shortening in
PTSD patients is the increased inflammatory activity accompanied with increased oxidative stress.
That is caused by the dysregulation of the HPA and the SNS. Cellular senescence is characterized by
an irreversible arrest of the cell proliferation. It can explain, at least partly, the age-related phenotypes.
Senescent cells may contribute to the imbalance between the rate of cell loss and the rate of cell
Introduction
22
renewal. Insufficient cell renewal leads to deterioration of tissue and organ function and finally results
in their failure [320]. This growth arrest was first described by Hayflick in 1961 as “replicative
senescence” [321, 322]. Replicative senescence is age-related and induced by the shortening of
telomeres. At a critical telomere length, the telomeres become dysfunctional and a persistent DNA
damage response is activated, which results in an inhibition of the cell cycle [323-325]. Human
senescent fibroblasts show a colocalization of phosphorylated γ-H2AX and p53-binding protein 1
(53PB1) in distinct foci, a maker for DNA double-strand breaks, at telomeres [323]. Also
phosphorylated ataxia-telangiectasia mutated (ATM) and ataxia telangiectasia and Rad3-related
protein (ATR) kinases as well as their phosphorylated downstream effector kinases could be detected
in senescent cells [326, 327]. For example, the telomeres of human leukocytes show an age related
shortening [328]. In addition to replicative senescence caused by telomere shortening during aging,
premature senescence is known which is independent from telomere shortening. Premature senescence
can be caused by DNA damage, genotoxic stress, mitogen signalling and activation of tumor
suppressor genes [329-333]. The mitogen signalling and tumor suppressor gene induced senescence is
also called “oncogene-induced senescence” (OIS). The pathways of OIS are complex and not fully
understood. But it is known that the p53 and retinoblastoma protein (RB) pathways are essential [334].
Senescence can also be induced by a persistent DNA damage response (DDR) induced by many
different sub lethal stresses. In this case the senescence is called “stress-induced premature
senescence” (SIPS) [335]. SIPS and replicative senescence share some of the biological features [320].
Both engage the p53/p21 pathway. The DDR that causes SIPS is induced by DNA damage primarily
induced in telomeric DNA and is independent from telomere shortening. It is induced by telomeric
foci containing multiple DNA damage response factors [323, 325, 336]. Cellular senescence is
controlled mainly by two pathways which cross talk to each other, see Figure 1-9 [337-339]. The key
players in these pathways are p53 and p21 on the one hand and p16 and RB on the other hand [340,
341]. p14, also known as alternate reading frame (ARF), is an important linker between both pathways
[342]. p53 and RB are important tumor suppressors, while p16 and p21 are cyclin-dependent kinase
(CDK) inhibitors [340, 343-346]. However, cellular senescence can be induced by one of these two
pathways, which pathway is induced depends also on the cell type and the senescence inducing stimuli
[347]. An age related increase of p53 can be explained by telomere shortening which induces a
persistent DDR [325, 348]. OIS also activates the p53/p21 pathway [332, 349, 350]. The main
regulator of the p53 protein level in cells is MDM2 [351-353]. Breakdown of p53, mediated by
MDM2, suppresses its function as transcription factor. This subsequently inhibits the cell cycle arrest
because p53 is an important regulator for the expression of the cell cycle inhibitor p21 [325, 354]. p21
inhibits all CDK-cyclin complexes and induces a cell cycle arrest [355, 356]. The p16/RB pathway is
the second main pathway that controls cellular senescence [357]. During senescence the RB is
hypophosphorylated. This is the active form of RB and triggers cell cycle arrest at G1 phase. RB
controls DNA replication by binding to transcription factors of the E2F-family [358]. The E2F
Introduction
23
transcription factors control the expression of essential cell cycle regulators, like cyclin E and B [359].
The binding of hypophosphorylated RB to E2F suppresses the activity of E2F. Primarily by the
recruitment of additional co-repressors like histone deacetylases (HDACs) [360]. Phosphorylation of
RB by the CDK4/6/cyclin D complex induces the dissociation of the E2F transcription factors from
the RB protein. This subsequently induces the transcription of genes that drive the cell cycle form G1
phase to S phase [361]. Senescent stimuli like DNA damage response engage also the RB/p16
pathway but only secondarily [355, 362, 363]. However, p21 and p16 are not equivalent [345]. p16
binds only to CDK4 and CDK6 and inhibits the interaction with cyclin D by inducing conformational
changes [364]. Thereby, RB is kept in its active state because its phosphorylation by CDK4/6 is
inhibited [365].
Senescence marker and characteristics of senescent cells 1.4.1
Cellular senescence is not characterized by a single hallmark. Although, cell cycle arrest is evident for
senescence it is not exclusively found in senescent cells. Therefore, senescent cells need to be
identified not only by a single marker, but rather by a combination of markers at the same time. The
most important senescence markers are listed below:
Morphological changes
Cellular senescence is often accompanied by morphological changes of the cell. Most common
changes are enlargement, flattening and multi-nucleation of the cell. The senescence trigger often
determines the morphological changes of the cell. Senescence induced by genotoxic stress or DNA
damage is normally accompanied by a flattened and enlarged phenotype [333, 366].
Senescence-associated heterochromatin foci
Senescence-associated heterochromatin foci (SAHFs) are altered chromatin structures that are
associated with cellular senescence [347]. Normal proliferating cells show a homogenous staining of
the nuclear DNA with DNA-binding dyes. Whereas, senescent cells show an inhomogeneous and
punctual staining of heterochromatin by DNA-binding dyes. SAHFs are found at E2F target genes
[367]. The RB/p16 pathway is essential for the formation of SAHFs and the formation requires several
days.
Senescence-associated β-galactosidase
Senescence-associated β-galactosidase (SA-β-GAL) is a common and often used biomarker to detect
senescent cells [368, 369]. SA-β-GAL is active at a pH of 6.0. This allows the discrimination between
SA-β-GAL and normal β-galactosidase, because normal β-galactosidase activity can be detected at a
pH of 4.0.
Introduction
24
Activation of tumor suppressors
As described above, p21 and p16 are important cell cycle inhibitors and involved in senescence related
cell cycle arrest. Therefore, the expression of them can be used as a marker for senescence.
Senescence-associated secretory phenotype
The senescence-associated secretory phenotype (SASP) is an important and interesting feature of
many but not all senescent cells. The reason for that is, SASP could explain how senescence could be
on the one hand tumor suppressing and on the other hand tumor growth promoting [370]. Several
studies showed that senescent fibroblast could promote the growth of tumors derived from different
tissues [371-373]. SASP is characterized by the secretion of a variety of soluble and insoluble factors
[370, 374]. These factors can influence the local microenvironment of the senescent cell, or even act
on a systemic scale. Components of the SASP are interleukins, inflammatory cytokines, growth
factors, matrix metalloproteinases, serine proteases and their inhibitors [374-378]. The specific
composition of SASP-factors can vary and is dynamic, depending on the cell type and the origin of the
senescence.
Introduction
25
Figure 1-9: Overview of senescence inducer, senescence controlling pathways and senescence markers. Cellular
senescence is caused by various stimuli. These stimuli include dysfunctional telomeres, DNA damage, chromatin
perturbations, active oncogenes and stress. The consequences of senescence are diverse and can be beneficial or detrimental.
Senescence causes a cell cycle arrest. This could have protective effects for a multicellular organism because it suppresses the
growth of degenerated cells. Thus, senescence has a tumor suppressing function. However, senescence can also induce tumor
progression because some senescent cells express a SASP and release growth factors. The senescence inducing signals
engage either the p53/p21 pathway or the p16/RB pathway. Some stimuli also engage both pathways. Senescence stimuli that
activate p53 induce the expression of p21. p21 is a CDK inhibitor, its expression inhibits all CDK/cyclin complexes and
induces a cell cycle arrest. Senescence stimuli can also induce the expression of p14 which is a negative regulator of MDM2.
Under normal conditions p53 is ubiquitylated by MDM2 and degraded. Hence, the p21 expression is suppressed and the cell
cycle is not inhibited. Senescence stimuli can also induce the expression of p16, a further CDK inhibitor. p16 only inhibits
CDK4/6/cyclin D complexes. This inhibits the phosphorylation of RB. The hypophosphorylated RB inhibits the release of the
transcription factor E2F which induces a G1 cell cycle arrest. Senescent cells can be identified by a combination of various
types of senescent markers.
Introduction
26
β-adrenergic signaling and genomic stability 1.4.2
The above described interactions between stress, stress hormones, DNA damage, DNA damage repair,
senescence and AR signaling suggest that β-adrenergic signaling can influence the genomic stability
of cells including leukocytes. β2-ARs can be found in various tissues and their signaling is important
in the regulation of several cellular processes that are essential in carcinogenesis, such as
inflammation, angiogenesis, apoptosis, cell motility and DNA damage repair. Various cancer models,
cellular studies and epidemiologic studies demonstrated these circumstances [379]. However, β-
adrenergic signaling seems to affect mostly the progression of cancer and less the carcinogenesis
[380]. β-adrenergic signaling plays an important role in tumor progression of human prostate cancer
cells in a xenograft mouse model [381]. Moreover, mouse models of breast cancer demonstrated an
increased metastasis induced by β-adrenergic signaling after the exposure to a stressor [382]. Also
behavioral stress increases the growth of malignant melanoma in a dose-dependent manner [383].
Environmental stress or administration of epinephrine increases the mortality rate of rats that were
transplanted with CRNK-16 leukemia cells [384]. Furthermore, all four studies demonstrated that
beta-adrenergic antagonists could be used to diminish or inhibit the stress-related tumor growth or
metastasis. These findings correspond with human studies that showed that a treatment with β-blocker
reduce metastasis, cancer recurrence and mortality in breast cancer patients [385, 386]. A reduced
tumor growth and an increased revival rate of patients with malignant melanoma could be observed
after treatment with β-blocker [387, 388]. Interestingly, it was shown that in ovarian tumor tissue the
norepinephrine concentrations are higher than the norepinephrine concentrations in the blood plasma
of the same patients. Moreover, the catecholamine concentrations in the tumor tissue correlate
positively with psychosocial risk factors, but the catecholamine concentrations in the plasma do not
show this correlation [389, 390]. Besides the xenograft animal models and the epidemiological studies
also molecular biological studies demonstrated that β-adrenergic signaling is involved in the tumor
growth. For instance, invasion of macrophages into the tumor [382], elevated expression of pro
inflammatory cytokines, IL-6 and IL-8, in tumor cells [391-393], vascular endothelial growth factor
(VEGF) mediated increase of angiogenesis of the tumor [41], increased expression of
metalloproteinases accompanied by increased tumor invasion in surrounding tissue [41, 394, 395],
resistance against apoptosis induce by chemotherapeutics [396] are stimulated by β-adrenergic
signaling. The important transcription factor cAMP response element-binding protein (CREB) is
activated by stress hormones and influences the proliferation, migration and angiogenesis of tumor
cells [397, 398]. Epinephrine can induce DNA damage in human lymphocytes [399]. Hara et al.
proposed the following model for the induction of DNA damage in human cancer cell lines and mice
by chronic stress, see Figure 1-10 [400, 401]. Stress hormones, like the catecholamines epinephrine
and norepinephrine but also the synthetic homolog isoproterenol activate the β2-AR and downstream
signaling. Two different signaling pathways get activated. On the one hand, the Gs protein/PKA
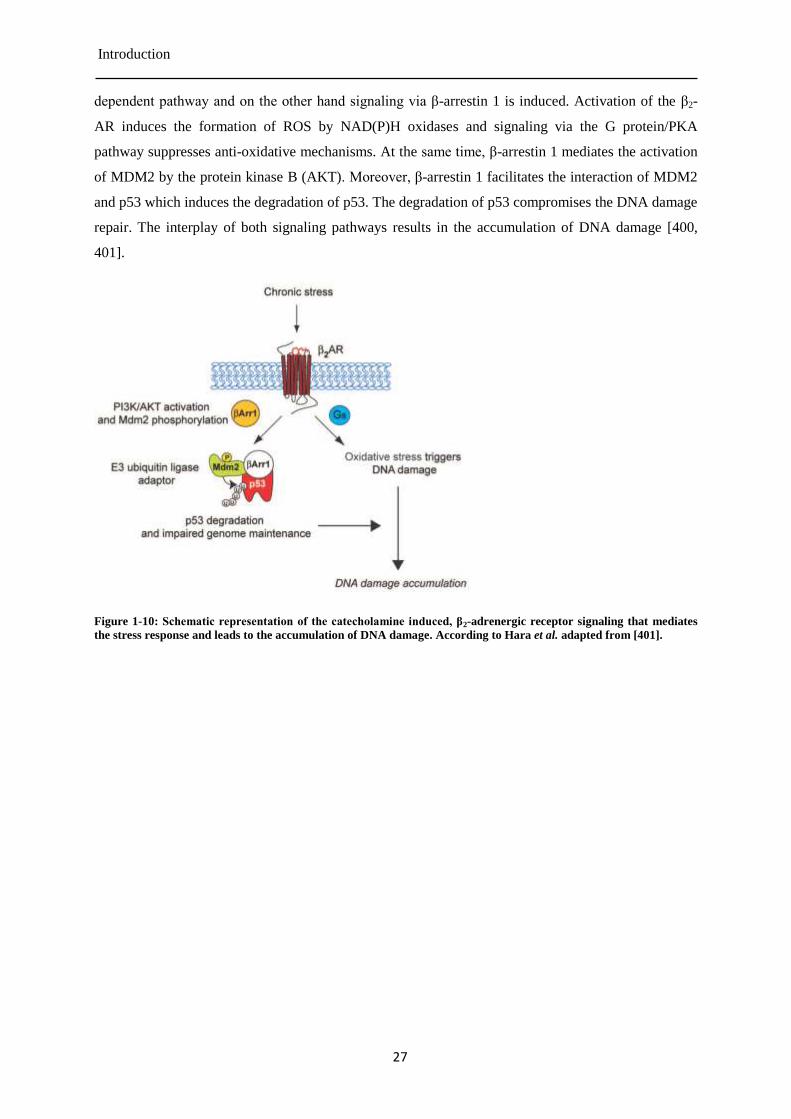
Introduction
27
dependent pathway and on the other hand signaling via β-arrestin 1 is induced. Activation of the β2-
AR induces the formation of ROS by NAD(P)H oxidases and signaling via the G protein/PKA
pathway suppresses anti-oxidative mechanisms. At the same time, β-arrestin 1 mediates the activation
of MDM2 by the protein kinase B (AKT). Moreover, β-arrestin 1 facilitates the interaction of MDM2
and p53 which induces the degradation of p53. The degradation of p53 compromises the DNA damage
repair. The interplay of both signaling pathways results in the accumulation of DNA damage [400,
401].
Figure 1-10: Schematic representation of the catecholamine induced, β2-adrenergic receptor signaling that mediates
the stress response and leads to the accumulation of DNA damage. According to Hara et al. adapted from [401].
Objective
28
2 Objective
Clinical and animal studies have shown that chronic psychological stress impairs the immune system
[16, 77, 79, 402]. For instance, chronically stressed humans have an increased risk to suffer from an
infectious disease. Also the recovery time after an infection is prolonged and the recurrence rate of
latent virus infection is higher [403, 404]. On the other side, chronic stress also induces DNA damage
and affects the DNA damage repair [43, 47, 48, 400, 401]. Previous studies have shown that immune
cells of PTSD patients have an accumulation of DNA strand breaks [83]. Psychotherapy reversed the
PTSD symptoms as well as the accumulation of this DNA strand breaks. Further studies have shown
that PTSD patients have an increased rate of telomere shorting, an accelerated aging rate and an
increased risk for cancer [28, 73, 82, 316, 319]. Moreover, there are some indications that PTSD may
be associated with a phenotype of accelerated senescence [312]. At the molecular level, stress
hormones like catecholamines can induce DNA damage in human cell lines and in mice via the
activation of the β2-AR [400, 401]. On the other hand, the degradation of catecholamines induces the
formation of ROS and free radicals [167, 168, 233]. All results together give an indication that chronic
stress may impair the genomic stability. Therefore, the following hypothesis was raised:
“Catecholamines can induce biomarkers of stress and may impair the genomic stability of human
PBMCs via the β2-AR”. An ex vivo model was established to mimic the repeated release and action of
catecholamines during chronic stress [405]. Pilot experiments have shown that the repeated treatment
of PBMCs with isoproterenol induces DNA strand breaks which were in parts unrepaired after 24 h.
These DNA strand breaks could be partial inhibited by the β-blocker propranolol. Additional, the
protein level of PARP1 and the formation of PAR were reduced by the repeated isoproterenol
treatment [405]. PBMCs incubated over a longer time period (48 h and 72 h) after the isoproterenol
treatment showed the expression of SA-β-GAL. The presented thesis had four main objectives.
The first objective was to complement the pre-existing results. Since cAMP and the downstream
signaling cascade are involved in generation of ROS, the formation of cAMP in response to the
repeated isoproterenol treatment was analyzed. DNA strand breaks induce the activation of PARP1
which depletes cellular NAD+ pools by the formation of PAR. Hence, the cellular NAD
+ and ATP
content were measured. Since the formation of ROS appeared to be the most probable cause for the
induction of DNA strand breaks, the formation of intracellular ROS during the repeated isoproterenol
treatment was analyzed.
The second objective was to complement the pre-existing results with regards to the observed
induction of senescence markers in PBMCS after the repeated isoproterenol treatment. Therefore, the
mRNA expression of several genes which were involved in the cell cycle regulation, DNA damage
response, oxidative stress response, β-adrenergic signaling and in the controlling of senescence was
Objective
29
measured by real-time PCR. The protein level of p16, an important biomarker of aging and inducer of
cellular senescence, was measured.
The third objective was to investigate the stability and degradation of isoproterenol in the used cell
culture media. As the ligand binding pocket of the β2-AR is located extracellular, the concentration of
the ligand in the surround medium is crucial for its stimulation. Therefore, the time course of the
isoproterenol concentration during the treatment and the degradation of the isoproterenol after the
treatment were measured by HPLC. The isoproterenol concentration was measured by its specific
absorbance at 280 nm and at its fluorescence signal at an excitation wavelength of 280 nm and an
emission wavelength of 310 nm. Additional, the formation of isoprenochrome, an oxidation product of
isoproterenol, was measured at its specific absorbance at 490 nm.
The fourth objective was the pre-validation of a new developed FADU system, called TOXXs
Analyzer. The technical pre-validation should be performed in cooperation with two partners, the
EMPA in St. Gallen and the Cetcis GmbH in Esslingen, in the course of an inter-laboratory study. The
aims of this pre-validation were to test and to improve the reproducibility, sensitivity and intra-
laboratory variability of the TOXXs Analyzer.
Material and Methods
30
3 Material and Methods
3.1 Material
Chemicals 3.1.1
Substance Supplier
acetonitrile Carl Roth, Karlsruhe, Germany
acryl-/bisacrylamid Carl Roth, Karlsruhe, Germany
alcoholdehydrogenase Sigma-Aldrich, Steinheim, Germany
ammonium acetate Sigma-Aldrich, Steinheim, Germany
APS Serva, Heidelberg, Germany
bicine Sigma-Aldrich, Steinheim, Germany
Bicoll Biochrome, Berlin, Germany
bromphenol blue Sigma-Aldrich, Steinheim, Germany
BSA Serva, Heidelberg, Germany
caffeine Sigma-Aldrich, Steinheim, Germany
calcium chloride Fluka, Buchs, Switzerland
calf thymus DNA Sigma-Aldrich, Steinheim, Germany
CasyClean OMNI Life Science GmbH, Bremen, Germany
CasyTon OMNI Life Science GmbH, Bremen, Germany
citric acid Sigma-Aldrich, Steinheim, Germany
complete protease inhibitor cocktail Roche, Mannheim, Germany
DCFDA Sigma-Aldrich, Steinheim, Germany
DHE Sigma-Aldrich, Steinheim, Germany
DMSO Merck, Darmstadt, Germany
DNaseI Roche, Mannheim, Germany
ECL solution Lumigen Inc., Michigan, USA
EDTA Sigma-Aldrich, Steinheim, Germany
ethanol pa VWR, Darmstadt, Germany
ethanol tech. Riedel-de Haen, Seelze, Germany
FCS Biochrome, Berlin, Germany
formic acid Merck, Darmstadt, Germany
forskolin Sigma-Aldrich, Steinheim, Germany
glycerol Acros, Geel, Belgium
glycine Carl Roth, Karlsruhe, Germany
Hoechst 33342 Invitrogen, Karlsruhe, Germany
hydrogen chloride Riedel-de Haen, Seelze, Germany
hydrogen peroxide Merck, Darmstadt, Germany
IBMX Sigma-Aldrich, Steinheim, Germany
IMI Sigma-Aldrich, Steinheim, Germany
isopropanol VWR, Darmstadt, Germany
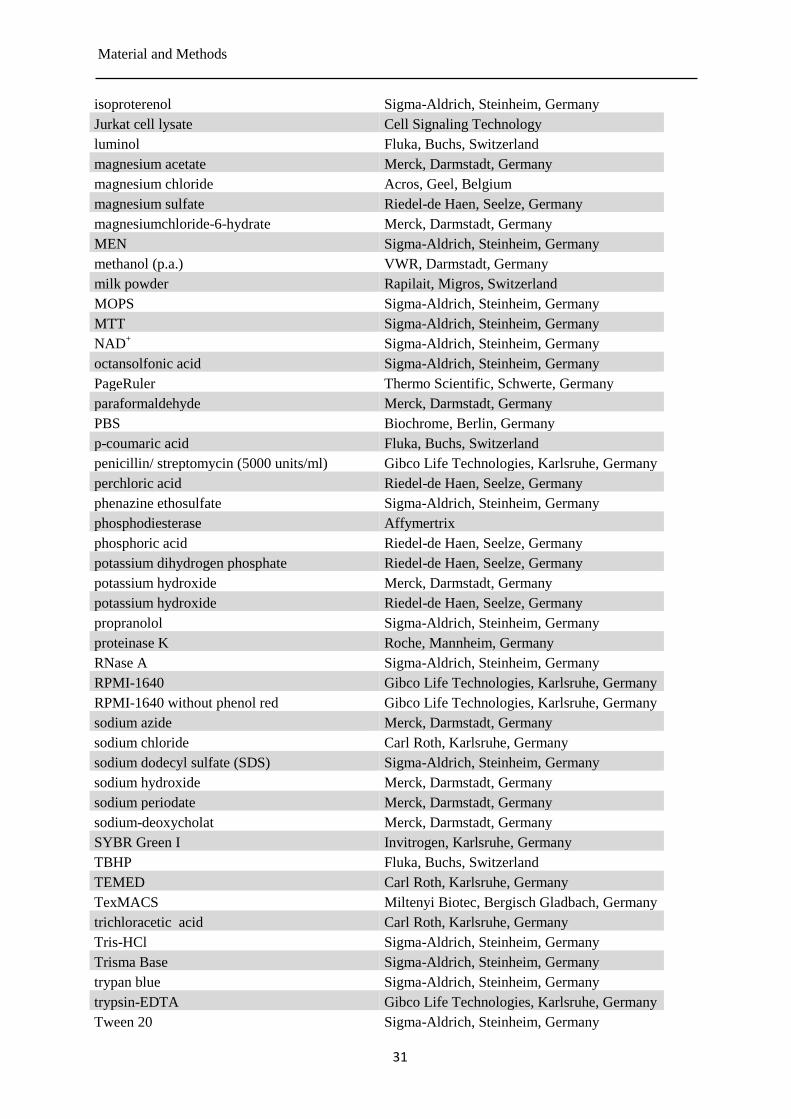
Material and Methods
31
isoproterenol Sigma-Aldrich, Steinheim, Germany
Jurkat cell lysate Cell Signaling Technology
luminol Fluka, Buchs, Switzerland
magnesium acetate Merck, Darmstadt, Germany
magnesium chloride Acros, Geel, Belgium
magnesium sulfate Riedel-de Haen, Seelze, Germany
magnesiumchloride-6-hydrate Merck, Darmstadt, Germany
MEN Sigma-Aldrich, Steinheim, Germany
methanol (p.a.) VWR, Darmstadt, Germany
milk powder Rapilait, Migros, Switzerland
MOPS Sigma-Aldrich, Steinheim, Germany
MTT Sigma-Aldrich, Steinheim, Germany
NAD+ Sigma-Aldrich, Steinheim, Germany
octansolfonic acid Sigma-Aldrich, Steinheim, Germany
PageRuler Thermo Scientific, Schwerte, Germany
paraformaldehyde Merck, Darmstadt, Germany
PBS Biochrome, Berlin, Germany
p-coumaric acid Fluka, Buchs, Switzerland
penicillin/ streptomycin (5000 units/ml) Gibco Life Technologies, Karlsruhe, Germany
perchloric acid Riedel-de Haen, Seelze, Germany
phenazine ethosulfate Sigma-Aldrich, Steinheim, Germany
phosphodiesterase Affymertrix
phosphoric acid Riedel-de Haen, Seelze, Germany
potassium dihydrogen phosphate Riedel-de Haen, Seelze, Germany
potassium hydroxide Merck, Darmstadt, Germany
potassium hydroxide Riedel-de Haen, Seelze, Germany
propranolol Sigma-Aldrich, Steinheim, Germany
proteinase K Roche, Mannheim, Germany
RNase A Sigma-Aldrich, Steinheim, Germany
RPMI-1640 Gibco Life Technologies, Karlsruhe, Germany
RPMI-1640 without phenol red Gibco Life Technologies, Karlsruhe, Germany
sodium azide Merck, Darmstadt, Germany
sodium chloride Carl Roth, Karlsruhe, Germany
sodium dodecyl sulfate (SDS) Sigma-Aldrich, Steinheim, Germany
sodium hydroxide Merck, Darmstadt, Germany
sodium periodate Merck, Darmstadt, Germany
sodium-deoxycholat Merck, Darmstadt, Germany
SYBR Green I Invitrogen, Karlsruhe, Germany
TBHP Fluka, Buchs, Switzerland
TEMED Carl Roth, Karlsruhe, Germany
TexMACS Miltenyi Biotec, Bergisch Gladbach, Germany
trichloracetic acid Carl Roth, Karlsruhe, Germany
Tris-HCl Sigma-Aldrich, Steinheim, Germany
Trisma Base Sigma-Aldrich, Steinheim, Germany
trypan blue Sigma-Aldrich, Steinheim, Germany
trypsin-EDTA Gibco Life Technologies, Karlsruhe, Germany
Tween 20 Sigma-Aldrich, Steinheim, Germany
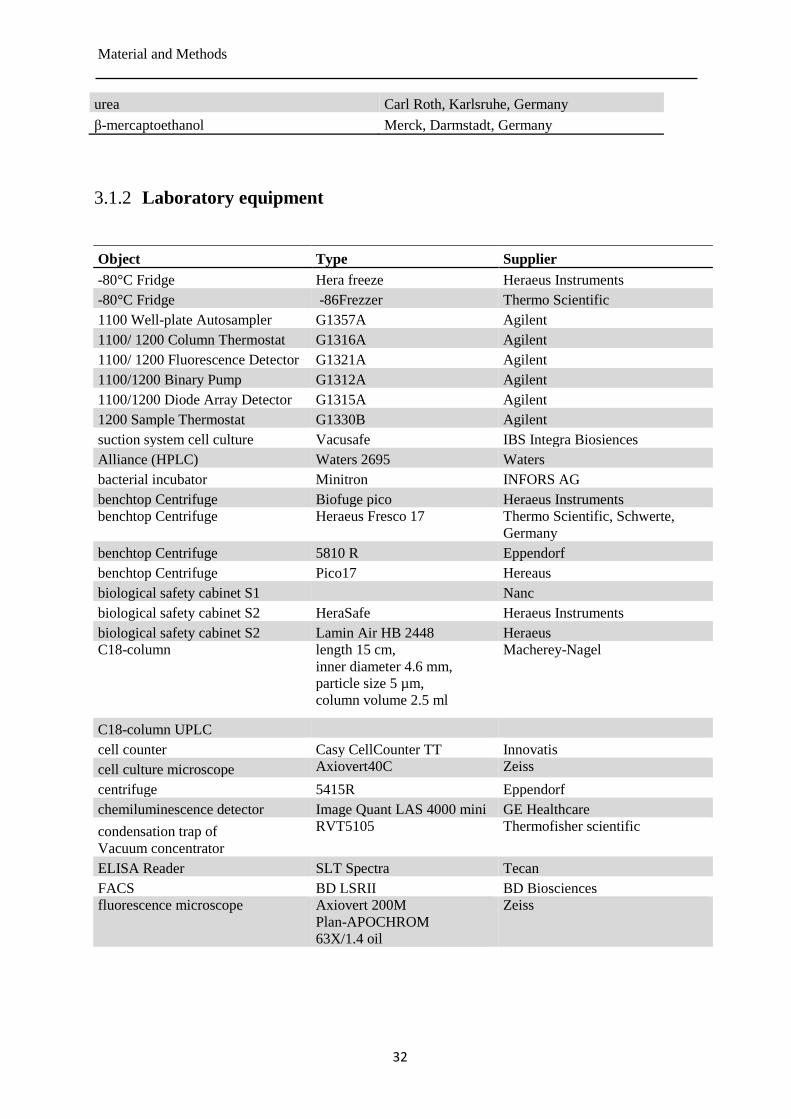
Material and Methods
32
urea Carl Roth, Karlsruhe, Germany
β-mercaptoethanol Merck, Darmstadt, Germany
Laboratory equipment 3.1.2
Object Type Supplier
-80°C Fridge Hera freeze Heraeus Instruments
-80°C Fridge -86Frezzer Thermo Scientific
1100 Well-plate Autosampler G1357A Agilent
1100/ 1200 Column Thermostat G1316A Agilent
1100/ 1200 Fluorescence Detector G1321A Agilent
1100/1200 Binary Pump G1312A Agilent
1100/1200 Diode Array Detector G1315A Agilent
1200 Sample Thermostat G1330B Agilent
suction system cell culture Vacusafe IBS Integra Biosiences
Alliance (HPLC) Waters 2695 Waters
bacterial incubator Minitron INFORS AG
benchtop Centrifuge Biofuge pico Heraeus Instruments
benchtop Centrifuge Heraeus Fresco 17 Thermo Scientific, Schwerte,
Germany
benchtop Centrifuge 5810 R Eppendorf
benchtop Centrifuge Pico17 Hereaus
biological safety cabinet S1 Nanc
biological safety cabinet S2 HeraSafe Heraeus Instruments
biological safety cabinet S2 Lamin Air HB 2448 Heraeus
C18-column length 15 cm,
inner diameter 4.6 mm,
particle size 5 µm,
column volume 2.5 ml
Macherey-Nagel
C18-column UPLC
cell counter Casy CellCounter TT Innovatis
cell culture microscope Axiovert40C Zeiss
centrifuge 5415R Eppendorf
chemiluminescence detector Image Quant LAS 4000 mini GE Healthcare
condensation trap of
Vacuum concentrator
RVT5105 Thermofisher scientific
ELISA Reader SLT Spectra Tecan
FACS BD LSRII BD Biosciences
fluorescence microscope Axiovert 200M
Plan-APOCHROM
63X/1.4 oil
Zeiss

Material and Methods
33
fridge
Premium
Liebherr
glassware Schott
guard column Security Guard Phenomenex
halogenlamp ebq 100 isolated
hemocytometer Casy Innovartis
ice maker AF206 Scotsman
incubator Hera Cell 240 Heraeus Instruments
incubator Hera Cell Heraeus Instruments
magnetic Stirrers IKAM Häberle Labortechnik
magnetic Stirrers MR3001K Heidolph
mass spectrometer Quattro micro Waters
mass spectrometer Xevo TQ-S Waters
micro clear plate 96-well Cellstar ®,96well-Platten,
clear, flat bottom
Greiner Bio-One
micro plate black bottom FluotracTM 200, 96W-
Microplate, medium
binding, black, flat bottom
Greiner Bio-One
micro scales CP2202S Sartorius
micro scales CP225D Sartorius
micropalte reader SLT Tecan
micropalte reader Infinite F200 PRO Tecan
micropalte reader Varioscan flash Thermofisher scientific
microscope Leitz DK IL Leica
MilliQ Reference A+ Millipore
minisaker Duomax 1030 Heidolph
minisaker MTS4 IKA
orbital shaker ROTAMAX 120 Heidolph
PCR thermal cycler Flex Cycler Analytik Jena
pH meter knick
pH meter 605pH Meter Metrohm
pipetboy Pipetboy Comfort IBS Integra Biosiences
pipettes 0,1-2 µl Eppendorf
pipettes 0,5-10 µl Eppendorf
pipettes 2-20 µl Eppendorf
pipettes 10-100 µl Eppendorf
pipettes 20-200 µl Eppendorf
pipettes 100-1000 µl Eppendorf
power supplies Power Pac 200 Bio-Rad, München, Germany
power supplies Electrophoresis power
supply EPS301
Amersham Biosciences
printer C3760dn Dell
pump MS-Reglo Ismatec
Real-time PCR system CFX96 Bio-Rad, München, Germany
roller mixer RS-TR05 Phoenix Instrument
scale AG 204 Delta Range Mettler
scale PM2000 Mettler
semi dry blotting system Bio-Rad, München, Germany
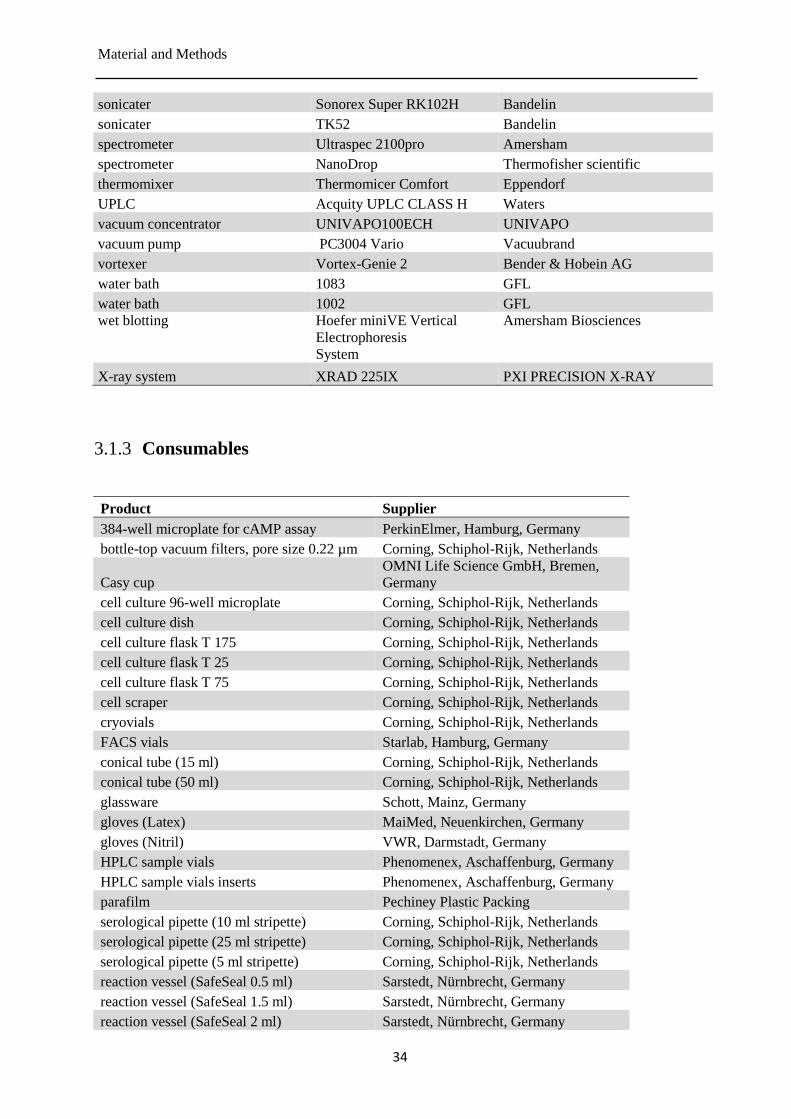
Material and Methods
34
sonicater Sonorex Super RK102H Bandelin
sonicater TK52 Bandelin
spectrometer Ultraspec 2100pro Amersham
spectrometer NanoDrop Thermofisher scientific
thermomixer Thermomicer Comfort Eppendorf
UPLC Acquity UPLC CLASS H Waters
vacuum concentrator UNIVAPO100ECH UNIVAPO
vacuum pump PC3004 Vario Vacuubrand
vortexer Vortex-Genie 2 Bender & Hobein AG
water bath 1083 GFL
water bath 1002 GFL
wet blotting Hoefer miniVE Vertical
Electrophoresis
System
Amersham Biosciences
X-ray system XRAD 225IX PXI PRECISION X-RAY
Consumables 3.1.3
Product Supplier
384-well microplate for cAMP assay PerkinElmer, Hamburg, Germany
bottle-top vacuum filters, pore size 0.22 µm Corning, Schiphol-Rijk, Netherlands
Casy cup
OMNI Life Science GmbH, Bremen,
Germany
cell culture 96-well microplate Corning, Schiphol-Rijk, Netherlands
cell culture dish Corning, Schiphol-Rijk, Netherlands
cell culture flask T 175 Corning, Schiphol-Rijk, Netherlands
cell culture flask T 25 Corning, Schiphol-Rijk, Netherlands
cell culture flask T 75 Corning, Schiphol-Rijk, Netherlands
cell scraper Corning, Schiphol-Rijk, Netherlands
cryovials Corning, Schiphol-Rijk, Netherlands
FACS vials Starlab, Hamburg, Germany
conical tube (15 ml) Corning, Schiphol-Rijk, Netherlands
conical tube (50 ml) Corning, Schiphol-Rijk, Netherlands
glassware Schott, Mainz, Germany
gloves (Latex) MaiMed, Neuenkirchen, Germany
gloves (Nitril) VWR, Darmstadt, Germany
HPLC sample vials Phenomenex, Aschaffenburg, Germany
HPLC sample vials inserts Phenomenex, Aschaffenburg, Germany
parafilm Pechiney Plastic Packing
serological pipette (10 ml stripette) Corning, Schiphol-Rijk, Netherlands
serological pipette (25 ml stripette) Corning, Schiphol-Rijk, Netherlands
serological pipette (5 ml stripette) Corning, Schiphol-Rijk, Netherlands
reaction vessel (SafeSeal 0.5 ml) Sarstedt, Nürnbrecht, Germany
reaction vessel (SafeSeal 1.5 ml) Sarstedt, Nürnbrecht, Germany
reaction vessel (SafeSeal 2 ml) Sarstedt, Nürnbrecht, Germany
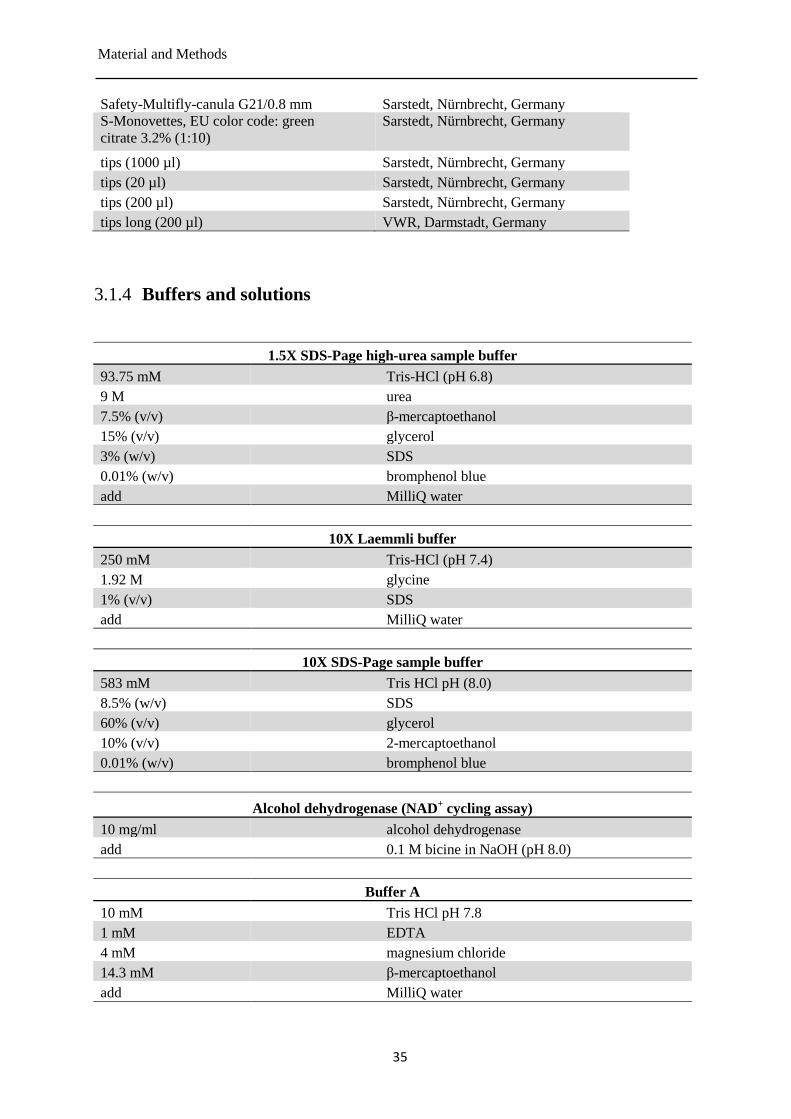
Material and Methods
35
Safety-Multifly-canula G21/0.8 mm Sarstedt, Nürnbrecht, Germany
S-Monovettes, EU color code: green
citrate 3.2% (1:10)
Sarstedt, Nürnbrecht, Germany
tips (1000 µl) Sarstedt, Nürnbrecht, Germany
tips (20 µl) Sarstedt, Nürnbrecht, Germany
tips (200 µl) Sarstedt, Nürnbrecht, Germany
tips long (200 µl) VWR, Darmstadt, Germany
Buffers and solutions 3.1.4
1.5X SDS-Page high-urea sample buffer
93.75 mM Tris-HCl (pH 6.8)
9 M urea
7.5% (v/v) β-mercaptoethanol
15% (v/v) glycerol
3% (w/v) SDS
0.01% (w/v) bromphenol blue
add MilliQ water
10X Laemmli buffer
250 mM Tris-HCl (pH 7.4)
1.92 M glycine
1% (v/v) SDS
add MilliQ water
10X SDS-Page sample buffer
583 mM Tris HCl pH (8.0)
8.5% (w/v) SDS
60% (v/v) glycerol
10% (v/v) 2-mercaptoethanol
0.01% (w/v) bromphenol blue
Alcohol dehydrogenase (NAD
+ cycling assay)
10 mg/ml alcohol dehydrogenase
add 0.1 M bicine in NaOH (pH 8.0)
Buffer A
10 mM Tris HCl pH 7.8
1 mM EDTA
4 mM magnesium chloride
14.3 mM β-mercaptoethanol
add MilliQ water
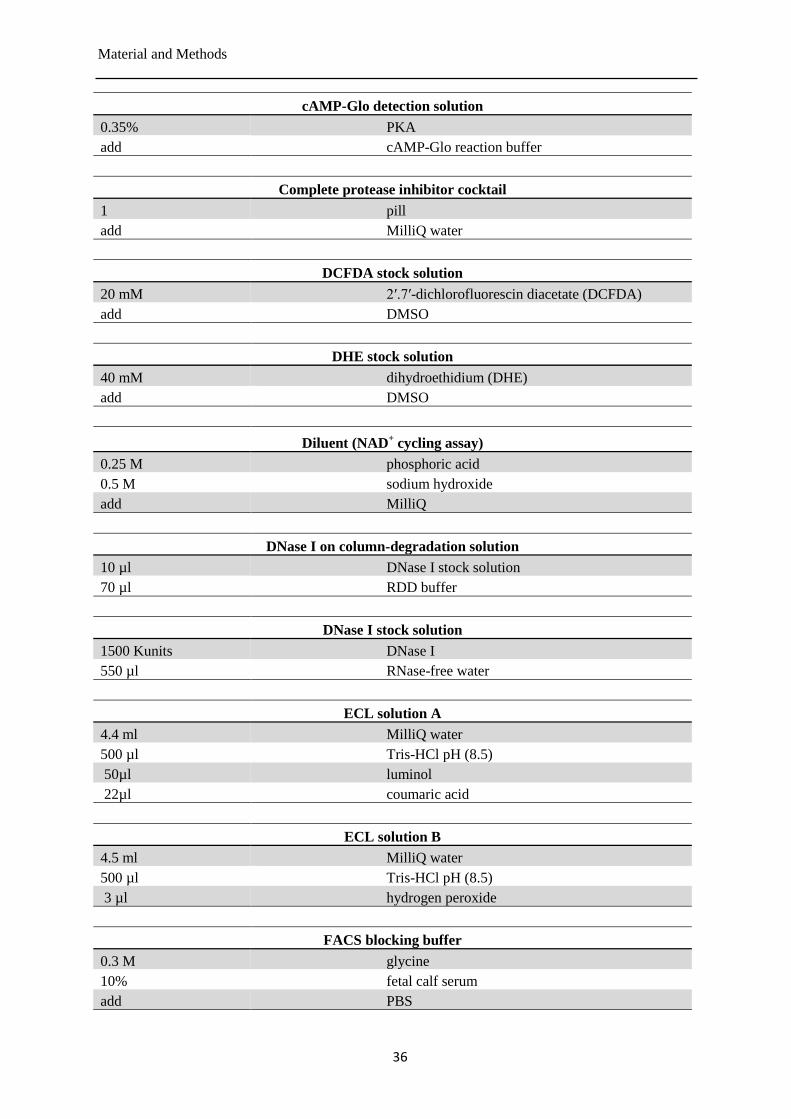
Material and Methods
36
cAMP-Glo detection solution
0.35% PKA
add cAMP-Glo reaction buffer
Complete protease inhibitor cocktail
1 pill
add MilliQ water
DCFDA stock solution
20 mM 2′.7′-dichlorofluorescin diacetate (DCFDA)
add DMSO
DHE stock solution
40 mM dihydroethidium (DHE)
add DMSO
Diluent (NAD
+ cycling assay)
0.25 M phosphoric acid
0.5 M sodium hydroxide
add MilliQ
DNase I on column-degradation solution
10 µl DNase I stock solution
70 µl RDD buffer
DNase I stock solution
1500 Kunits DNase I
550 µl RNase-free water
ECL solution A
4.4 ml MilliQ water
500 µl Tris-HCl pH (8.5)
50µl luminol
22µl coumaric acid
ECL solution B
4.5 ml MilliQ water
500 µl Tris-HCl pH (8.5)
3 µl hydrogen peroxide
FACS blocking buffer
0.3 M glycine
10% fetal calf serum
add PBS
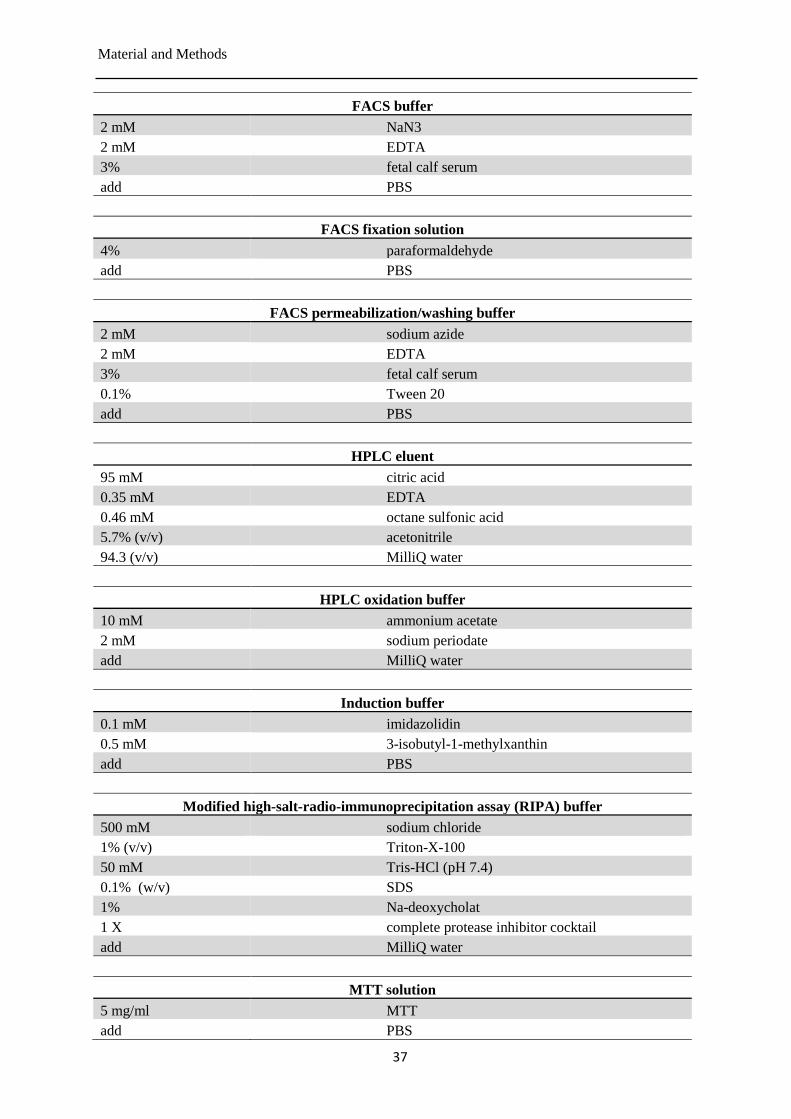
Material and Methods
37
FACS buffer
2 mM NaN3
2 mM EDTA
3% fetal calf serum
add PBS
FACS fixation solution
4% paraformaldehyde
add PBS
FACS permeabilization/washing buffer
2 mM sodium azide
2 mM EDTA
3% fetal calf serum
0.1% Tween 20
add PBS
HPLC eluent
95 mM citric acid
0.35 mM EDTA
0.46 mM octane sulfonic acid
5.7% (v/v) acetonitrile
94.3 (v/v) MilliQ water
HPLC oxidation buffer
10 mM ammonium acetate
2 mM sodium periodate
add MilliQ water
Induction buffer
0.1 mM imidazolidin
0.5 mM 3-isobutyl-1-methylxanthin
add PBS
Modified high-salt-radio-immunoprecipitation assay (RIPA) buffer
500 mM sodium chloride
1% (v/v) Triton-X-100
50 mM Tris-HCl (pH 7.4)
0.1% (w/v) SDS
1% Na-deoxycholat
1 X complete protease inhibitor cocktail
add MilliQ water
MTT solution
5 mg/ml MTT
add PBS
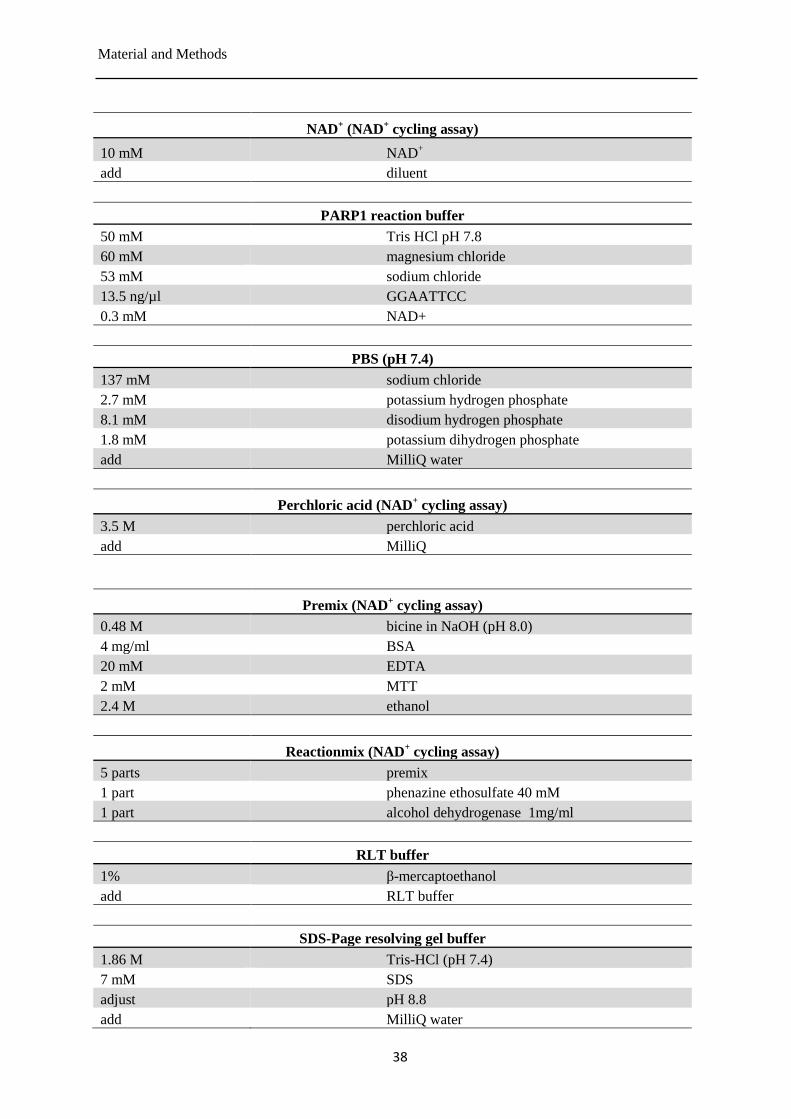
Material and Methods
38
NAD
+ (NAD
+ cycling assay)
10 mM NAD+
add diluent
PARP1 reaction buffer
50 mM Tris HCl pH 7.8
60 mM magnesium chloride
53 mM sodium chloride
13.5 ng/µl GGAATTCC
0.3 mM NAD+
PBS (pH 7.4)
137 mM sodium chloride
2.7 mM potassium hydrogen phosphate
8.1 mM disodium hydrogen phosphate
1.8 mM potassium dihydrogen phosphate
add MilliQ water
Perchloric acid (NAD
+ cycling assay)
3.5 M perchloric acid
add MilliQ
Premix (NAD+ cycling assay)
0.48 M bicine in NaOH (pH 8.0)
4 mg/ml BSA
20 mM EDTA
2 mM MTT
2.4 M ethanol
Reactionmix (NAD
+ cycling assay)
5 parts premix
1 part phenazine ethosulfate 40 mM
1 part alcohol dehydrogenase 1mg/ml
RLT buffer
1% β-mercaptoethanol
add RLT buffer
SDS-Page resolving gel buffer
1.86 M Tris-HCl (pH 7.4)
7 mM SDS
adjust pH 8.8
add MilliQ water
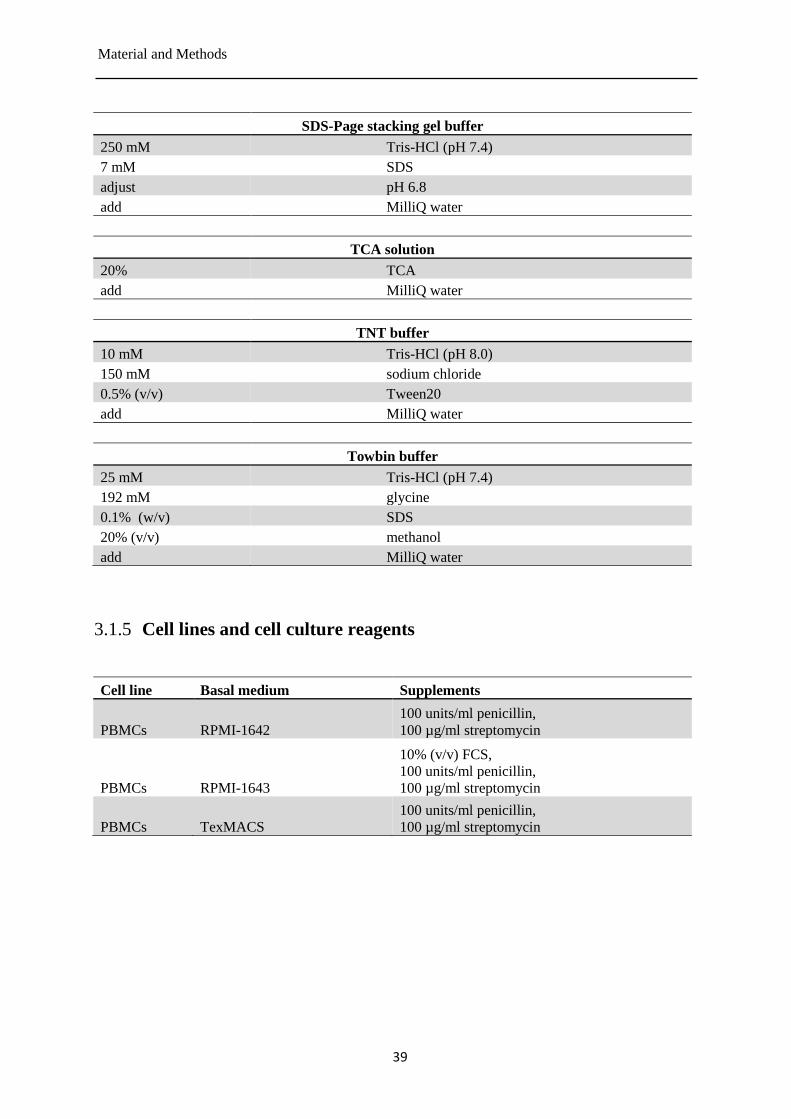
Material and Methods
39
SDS-Page stacking gel buffer
250 mM Tris-HCl (pH 7.4)
7 mM SDS
adjust pH 6.8
add MilliQ water
TCA solution
20% TCA
add MilliQ water
TNT buffer
10 mM Tris-HCl (pH 8.0)
150 mM sodium chloride
0.5% (v/v) Tween20
add MilliQ water
Towbin buffer
25 mM Tris-HCl (pH 7.4)
192 mM glycine
0.1% (w/v) SDS
20% (v/v) methanol
add MilliQ water
Cell lines and cell culture reagents 3.1.5
Cell line Basal medium Supplements
PBMCs RPMI-1642
100 units/ml penicillin,
100 µg/ml streptomycin
PBMCs RPMI-1643
10% (v/v) FCS,
100 units/ml penicillin,
100 µg/ml streptomycin
PBMCs TexMACS
100 units/ml penicillin,
100 µg/ml streptomycin
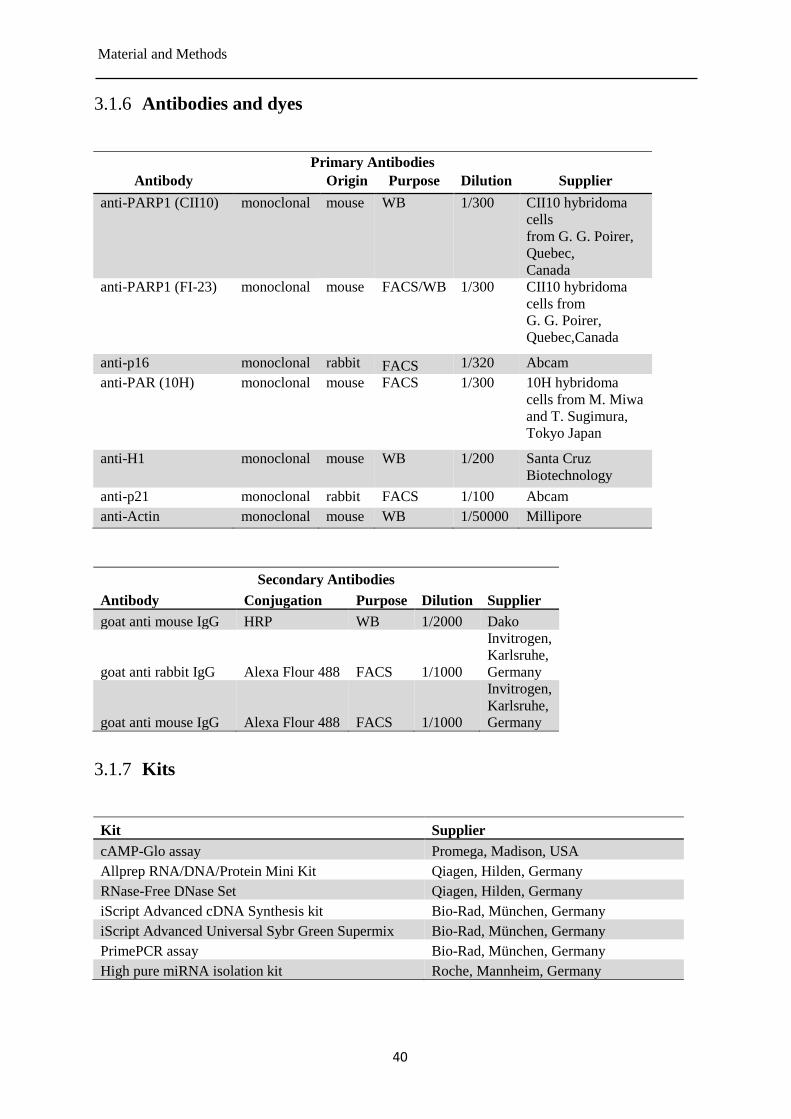
Material and Methods
40
Antibodies and dyes 3.1.6
Primary Antibodies
Antibody Origin Purpose Dilution Supplier
anti-PARP1 (CII10) monoclonal mouse WB 1/300 CII10 hybridoma
cells
from G. G. Poirer,
Quebec,
Canada
anti-PARP1 (FI-23) monoclonal mouse FACS/WB 1/300 CII10 hybridoma
cells from
G. G. Poirer,
Quebec,Canada
anti-p16 monoclonal rabbit FACS 1/320 Abcam
anti-PAR (10H) monoclonal mouse FACS 1/300 10H hybridoma
cells from M. Miwa
and T. Sugimura,
Tokyo Japan
anti-H1 monoclonal mouse WB 1/200 Santa Cruz
Biotechnology
anti-p21 monoclonal rabbit FACS 1/100 Abcam
anti-Actin monoclonal mouse WB 1/50000 Millipore
Secondary Antibodies
Antibody Conjugation Purpose Dilution Supplier
goat anti mouse IgG HRP WB 1/2000 Dako
goat anti rabbit IgG Alexa Flour 488 FACS 1/1000
Invitrogen,
Karlsruhe,
Germany
goat anti mouse IgG Alexa Flour 488 FACS 1/1000
Invitrogen,
Karlsruhe,
Germany
Kits 3.1.7
Kit Supplier
cAMP-Glo assay Promega, Madison, USA
Allprep RNA/DNA/Protein Mini Kit Qiagen, Hilden, Germany
RNase-Free DNase Set Qiagen, Hilden, Germany
iScript Advanced cDNA Synthesis kit Bio-Rad, München, Germany
iScript Advanced Universal Sybr Green Supermix Bio-Rad, München, Germany
PrimePCR assay Bio-Rad, München, Germany
High pure miRNA isolation kit Roche, Mannheim, Germany
Material and Methods
41
Software 3.1.8
Software Source
Agilent ChemStation Rev. B.02.01 Agilent
Bio-Rad CFX Manager 3.1 Bio-Rad
ChemOffice2004 CambridgeSoft Corporation
EndNote X7.7.1 Clarivate Analytics
GraphPad Prism 6 GraphPad Software
ImageJ 1.6.0_20 Wayne Rasband
MassLynx MS-Software Waters
Microsoft Office 2010 Microsoft
3.2 Methods
General aspects of cell culture 3.2.1
Cell lines were cultured according to the “American Type Culture Collection” (ATCC) guidelines. All
cell culture working steps were performed under a laminar flow cabinet (safety class 2). In the
beginning, the laminar flow cabinet was turned on at least 15 min before the actual cell culture work
was started. Then the surface of the cabinet was cleaned with 70% ethanol (v/v) in the beginning as
well as at the end of the cell culture work. All working steps were performed under aseptic conditions.
A cell culture coat and latex or nitrile gloves were worn the whole time. Cell culture plastics were
bought as ready to use sterile packages. Buffers, media and chemicals which were used for culturing
of the cells were bought sterile with cell culture grade. All items and materials used under the laminar
flow cabinet were pre-cleaned with 70% ethanol (v/v) immediately before they were put in the laminar
flow cabinet. Only individual cell lines were processed under the laminar flow cabinet, to avoid cross
contaminations. Between the processing of two or more cell lines the laminar flow cabinet was
cleaned after each processing of a cell line. Cell lines were cultured at 37 °C with 5% CO2 .
PBMC isolation 3.2.2
Venous blood samples were taken from the forearm of healthy volunteers with a 21 G cannula and
collected in S-Monovettes (filled with trisodium citrate-solution 1 ml per tube (0.106 mol/l) as
anticoagulant). For each donor a maximum sample size of ten S-Monovettes with blood were taken.
These samples were combined in three 50 ml conical tubes. PBMCs were isolated according the
following protocol, see Figure 3-1. Blood samples were centrifuged at 300 g, at RT for 10 min without
breaks. The upper plasma layer was carefully removed with serological pipettes and pre-warmed PBS
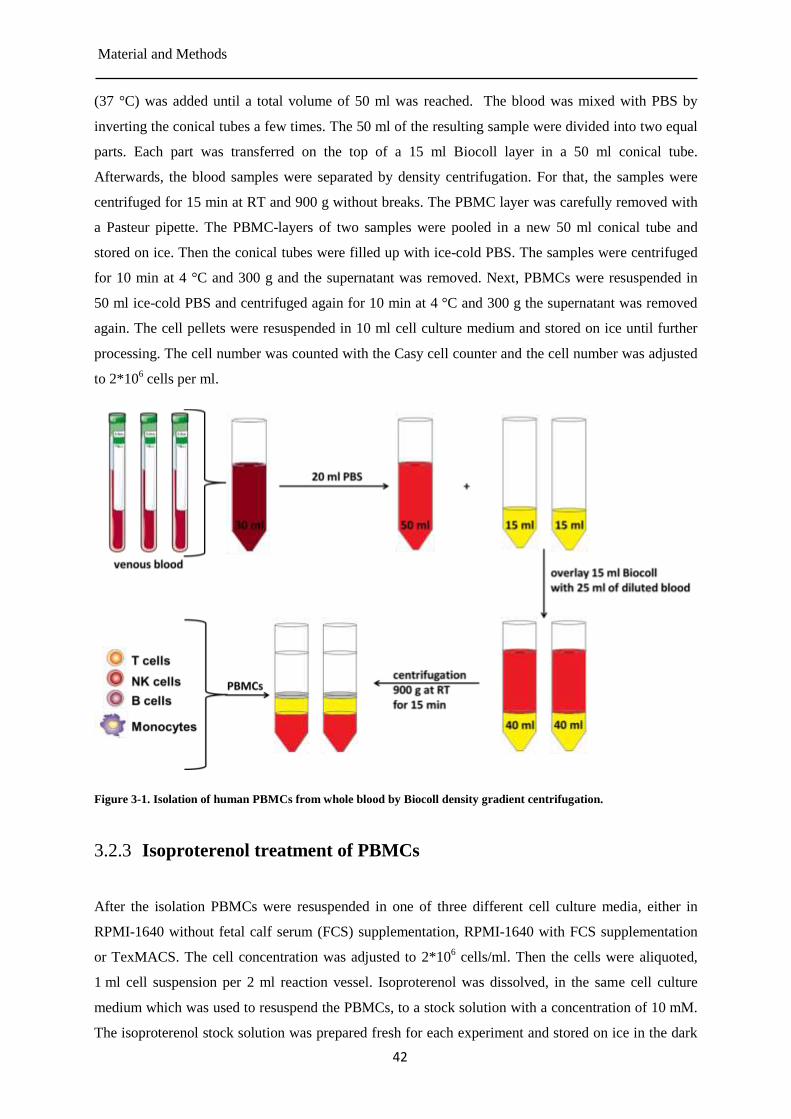
Material and Methods
42
(37 °C) was added until a total volume of 50 ml was reached. The blood was mixed with PBS by
inverting the conical tubes a few times. The 50 ml of the resulting sample were divided into two equal
parts. Each part was transferred on the top of a 15 ml Biocoll layer in a 50 ml conical tube.
Afterwards, the blood samples were separated by density centrifugation. For that, the samples were
centrifuged for 15 min at RT and 900 g without breaks. The PBMC layer was carefully removed with
a Pasteur pipette. The PBMC-layers of two samples were pooled in a new 50 ml conical tube and
stored on ice. Then the conical tubes were filled up with ice-cold PBS. The samples were centrifuged
for 10 min at 4 °C and 300 g and the supernatant was removed. Next, PBMCs were resuspended in
50 ml ice-cold PBS and centrifuged again for 10 min at 4 °C and 300 g the supernatant was removed
again. The cell pellets were resuspended in 10 ml cell culture medium and stored on ice until further
processing. The cell number was counted with the Casy cell counter and the cell number was adjusted
to 2*106 cells per ml.
Figure 3-1. Isolation of human PBMCs from whole blood by Biocoll density gradient centrifugation.
Isoproterenol treatment of PBMCs 3.2.3
After the isolation PBMCs were resuspended in one of three different cell culture media, either in
RPMI-1640 without fetal calf serum (FCS) supplementation, RPMI-1640 with FCS supplementation
or TexMACS. The cell concentration was adjusted to 2*106 cells/ml. Then the cells were aliquoted,
1 ml cell suspension per 2 ml reaction vessel. Isoproterenol was dissolved, in the same cell culture
medium which was used to resuspend the PBMCs, to a stock solution with a concentration of 10 mM.
The isoproterenol stock solution was prepared fresh for each experiment and stored on ice in the dark
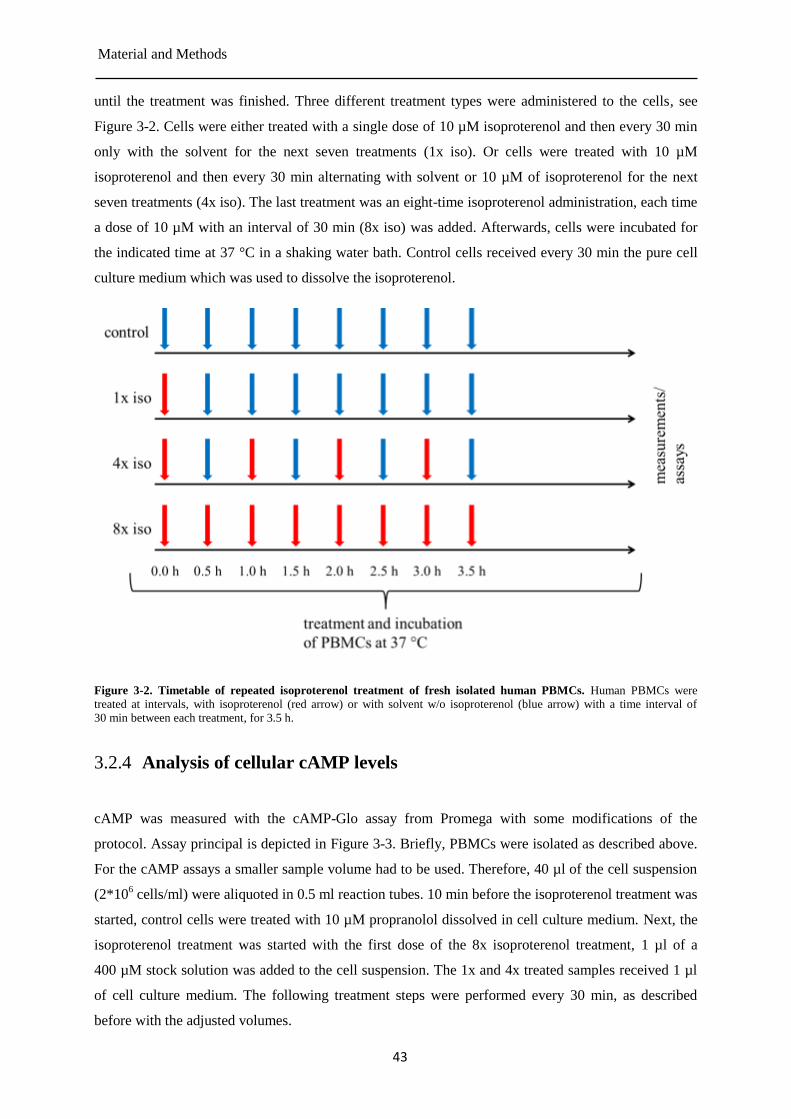
Material and Methods
43
until the treatment was finished. Three different treatment types were administered to the cells, see
Figure 3-2. Cells were either treated with a single dose of 10 µM isoproterenol and then every 30 min
only with the solvent for the next seven treatments (1x iso). Or cells were treated with 10 µM
isoproterenol and then every 30 min alternating with solvent or 10 µM of isoproterenol for the next
seven treatments (4x iso). The last treatment was an eight-time isoproterenol administration, each time
a dose of 10 µM with an interval of 30 min (8x iso) was added. Afterwards, cells were incubated for
the indicated time at 37 °C in a shaking water bath. Control cells received every 30 min the pure cell
culture medium which was used to dissolve the isoproterenol.
Figure 3-2. Timetable of repeated isoproterenol treatment of fresh isolated human PBMCs. Human PBMCs were
treated at intervals, with isoproterenol (red arrow) or with solvent w/o isoproterenol (blue arrow) with a time interval of
30 min between each treatment, for 3.5 h.
Analysis of cellular cAMP levels 3.2.4
cAMP was measured with the cAMP-Glo assay from Promega with some modifications of the
protocol. Assay principal is depicted in Figure 3-3. Briefly, PBMCs were isolated as described above.
For the cAMP assays a smaller sample volume had to be used. Therefore, 40 µl of the cell suspension
(2*106 cells/ml) were aliquoted in 0.5 ml reaction tubes. 10 min before the isoproterenol treatment was
started, control cells were treated with 10 µM propranolol dissolved in cell culture medium. Next, the
isoproterenol treatment was started with the first dose of the 8x isoproterenol treatment, 1 µl of a
400 µM stock solution was added to the cell suspension. The 1x and 4x treated samples received 1 µl
of cell culture medium. The following treatment steps were performed every 30 min, as described
before with the adjusted volumes.
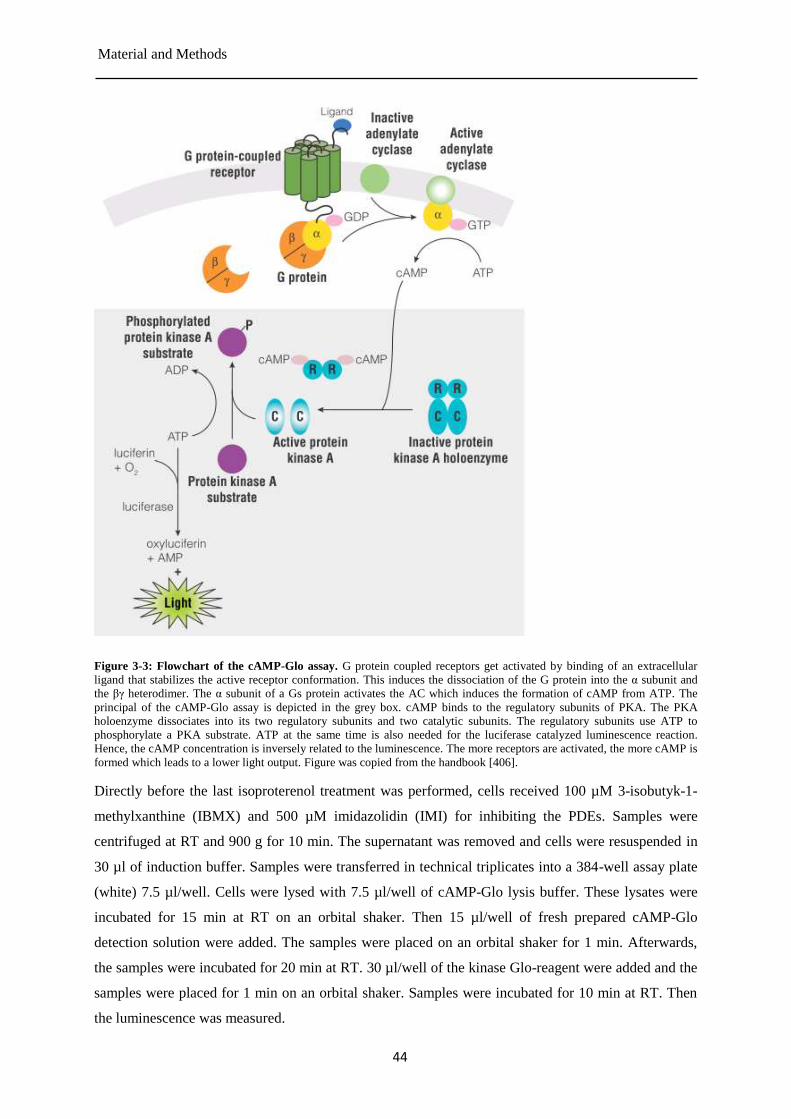
Material and Methods
44
Figure 3-3: Flowchart of the cAMP-Glo assay. G protein coupled receptors get activated by binding of an extracellular
ligand that stabilizes the active receptor conformation. This induces the dissociation of the G protein into the α subunit and
the βγ heterodimer. The α subunit of a Gs protein activates the AC which induces the formation of cAMP from ATP. The
principal of the cAMP-Glo assay is depicted in the grey box. cAMP binds to the regulatory subunits of PKA. The PKA
holoenzyme dissociates into its two regulatory subunits and two catalytic subunits. The regulatory subunits use ATP to
phosphorylate a PKA substrate. ATP at the same time is also needed for the luciferase catalyzed luminescence reaction.
Hence, the cAMP concentration is inversely related to the luminescence. The more receptors are activated, the more cAMP is
formed which leads to a lower light output. Figure was copied from the handbook [406].
Directly before the last isoproterenol treatment was performed, cells received 100 µM 3-isobutyk-1-
methylxanthine (IBMX) and 500 µM imidazolidin (IMI) for inhibiting the PDEs. Samples were
centrifuged at RT and 900 g for 10 min. The supernatant was removed and cells were resuspended in
30 µl of induction buffer. Samples were transferred in technical triplicates into a 384-well assay plate
(white) 7.5 µl/well. Cells were lysed with 7.5 µl/well of cAMP-Glo lysis buffer. These lysates were
incubated for 15 min at RT on an orbital shaker. Then 15 µl/well of fresh prepared cAMP-Glo
detection solution were added. The samples were placed on an orbital shaker for 1 min. Afterwards,
the samples were incubated for 20 min at RT. 30 µl/well of the kinase Glo-reagent were added and the
samples were placed for 1 min on an orbital shaker. Samples were incubated for 10 min at RT. Then
the luminescence was measured.
Material and Methods
45
Analysis of cellular ROS 3.2.5
The formation of intracellular ROS was analysed with the two fluorescence dyes 2′,7′-
dichlorofluorescin diacetate (DCFDA) and Dihydroethidium (hydroethidine) (DHE). DCFDA is a
cell-permeable dye which can be used to determine the overall intracellular oxidative stress [407, 408].
After diffusion into the cell, the acetate groups are cleaved by intracellular esterases. The resulting
product H2DCF is cell membrane-impermeable and can be oxidized to the highly fluorescent 2´,7´-
dichlorofluorescein (DCF). The reactivity of DCFDA is still not completely clarified, but it seems to
have a good specificity for peroxides [408, 409]. DHE is another fluorogenic probe which reacts
rapidly with superoxide anions (O2-)
[407, 410, 411]. After oxidation it intercalates into the DNA
which induces a shift of the fluorescence spectrum. Stock solution of DHE and DCFDA dyes were
prepared in anhydrous dimethyl sulfoxide (DMSO). DHE was solved to a concentration of 40 mM and
DCFDA was solved to a concentration of 20 mM. The stock solutions were frozen and for each
experiment a new aliquot was unfrozen and used only one time. During the use the solutions were
protected from light. Both dyes were used separately to analyse the redox state of PBMCs during the
isoproterenol treatment. Cells were aliquoted in 2 ml reaction tubes, 2*106
cells per tube. First, the
DCFDA staining was performed. The cells were stained with 20 µM of DCFDA, 1 µl of the DCFDA
stock solution was added per reaction tube. The cells without the DCFDA staining received 1 µl of
DMSO. Cells were incubated for 30 min at 37 °C. During this time the cell samples for the DHE
staining were stored on ice. Afterwards, cells of the DCFDA staining were treated with isoproterenol,
as described in section 3.2.3. As positive control, cells were treated with different doses of tert-
butylhydroperoxide (TBHP): 200 µM, 500 µM or 50 mM TBHP. During the isoproterenol treatment
control samples received 1 µl of cell culture medium instead of isoproterenol solution. For the staining
with DHE, control cells were treated with different doses of menadione (MEN): 10 µM, 200 µM,
50 µM and 500 µM MEN. MEN is a free radical generator which can be used to produce O2- in cells
[407]. Samples were treated with isoproterenol as described above; control samples received 1 µl of
cell culture medium instead of isoproterenol solution. After finishing the last isoproterenol treatment,
cells were incubated for further 30 min, reaching a total incubation time of 4 h. This has two reasons:
the formation of ROS may need some time and 4 h after the first isoproterenol dose the formation of
DNA strand breaks began. Furthermore, some experiments were performed with a total incubation
time of 6 hours (2.5 h after the last isoproterenol administration), because at this point in time the
maximum of DNA strand breaks could be observed. Samples were incubated at 37 °C in a water bath,
removed at indicated points of time and centrifuged for 5 min at 600 g. Supernatant was removed and
cells were washed with 1 ml of pre-warmed (37 °C) PBS. Samples of the DHE staining were
resuspended in 1 ml of cell culture medium containing 10 µM DHE (a 1:10 pre-dilution was
performed immediately before the use). Afterwards, the DHE samples were incubated for 30 min at
37 °C. During this time, the DCFDA samples were resuspended in 200 µl of ice-cold RPMI-1640 cell
Material and Methods
46
culture medium without phenolred per sample. For the measurement samples were transferred on 96-
well microplate in triplicates of 50 µl per well. Fluorescence was measured with a plate reader at an
excitation wavelength of 485 nm and an emission wavelength of 535 nm. At the end of the incubation
time of the DHE samples, the cells were centrifuged for 5 min at 600 g and the supernatant was
removed. Then the cells were washed with 1 ml pre-warmed (37 °C) PBS. Next, the cells were also
resuspended in 200 µl of ice-cold RPMI-1640 cell culture medium without phenolred per sample. For
the measurement, samples were transferred on a 96-well microplate in triplicates of 50 µl per well.
Fluorescence was measured in a plate reader at an excitation wavelength of 520 nm and an emission
wavelength of 610 nm.
NAD+ Cycling assay 3.2.6
The influence of the repeated isoproterenol treatment on the cellular NAD+
concentration was analysed
using a modified NAD+ cycling assay protocol according to Jacobson and Jacobson [412], modified by
Weidele et al. [413]. Cells were treated with isoproterenol as descripted in section 3.2.3. Additionally,
cells were treated with 500 µM H2O2 (positive control) for 5 min at 37 °C in PBS to lower intracellular
NAD+ levels (positive control). At each point in time the NAD
+ content of 2*10
6 PBMCs was
extracted and measured. For this purpose, the cell culture medium was removed by centrifugation at
1500 g for 5 min at 4 °C. Then cells were washed with 500 µl of ice-cold PBS. PBMCs were
resuspended in 250 µl of ice-cold PBS. For the lysis of the cells, 12 µl of 0.5 M HClO4 (perchloric
acid) were added and mixed by vortexing. The lysates were placed on ice for 15 min. Afterwards, the
samples were centrifuged at 1500 g for 10 min at 4 °C. The supernatant was transferred into a new
reaction tube and mixed with 175 µl of phosphate buffer and incubated on ice. After 15 min the
precipitated KClO4 (white sediment) was removed by centrifugation at 1500 g for 10 min at 4 °C. The
supernatant was collected in a new reaction tube, snap frozen in liquid nitrogen and stored at -80 °C
for further analysis. For the quantification of the cellular NAD+ content, a fresh prepared NAD
+
standard curve (0 µM, 0.01 µM, 0.02 µM, 0.04 µM, 0.08 µM, 0.12 µM, 0.24 µM NAD+ diluted in
diluent) and samples were transferred into a 96-well microplate. Samples were defrosted on ice and
centrifuged at 1500 g for 10 min at 4 °C to remove insoluble KClO4 carryovers. Then the cellular
samples were transferred in triplicates, 40 µl per well, into a 96-well microplate and were mixed with
160 µl of diluent per well. The standard curve was also measured in triplicates, 200 µl per well (NAD+
stock solution was prepared on ice, by solving NAD+ in ice-cooled diluent with a concentration of
10 mM. Aliquots were snap-frozen and stored at -80 °C. For each experiment a fresh aliquot was used.
The reaction mix for the enzymatic determination of the cellular NAD+
level was prepared fresh.
Therefore, five volumes premix were mixed with one volume phenazine ethosulfate (PES) (40 mM)
and one volume alcoholdehydrogenase (ADH) (1 mg/ml). Then 100 µl of this reaction mix were added
to each well and mixed. The samples were incubated for 30 min at 30 °C. The absorbance was
Material and Methods
47
measured at a wavelength of 550 nm with a reference wavelength of 690 nm. The absorbance of
NAD+ standards was used to calculate a standard curve, which allowed the transformation of the
absorbance of the cellular samples into a cellular NAD+ concentration.
Analysis of gene transcription by real-time PCR 3.2.7
3.2.7.1 General procedure
The mRNA isolation was performed under a laminar flow cabinet (safety class 1). In the beginning,
the laminar flow cabinet was turned on at least 15 min before the actual work was started and a UV-
lamp was used to irradiate the surface. Then the working surface of the cabinet was cleaned with 70%
ethanol (v/v) and additionally with RNase away solution. A lab coat and latex or nitrile gloves were
worn at all times. The workflow contains five steps: isolation of the mRNA, synthesis of cDNA,
preparation of the real-time PCR reactions, running the real-time PCR, analysing the gene expression
data.
3.2.7.2 Cell lyses and mRNA isolation of PBMCs
The mRNA of PBMCs was isolated with the use of the Allprep RNA/DNA/Protein Mini Kit from
Qiagen, according to the handbook only the steps for the mRNA isolation were performed. Therefore,
PBMCs incubated in TexMACS cell culture medium were treated as described above. 24 h after the
first isoproterenol treatment cells were lysed. For this purpose, samples were centrifuged for 5 min at
500 g and 4 °C. The cell culture medium was removed. Afterwards, cells were lysed in fresh prepared
RLT buffer (one part β-mercaptoethanol was added to 100 parts RLT buffer). For the lysis of
6*106 cells, 600 µl of RLT buffer were used, cells were lysed by pipetting up and down. These lysates
were shock frozen in liquid nitrogen and stored at -80 °C until the next working steps were performed.
Cell lysates were thawed at RT and homogenized with QIAshredder spin columns to achieve a
maximum yield of mRNA. Samples were directly transferred into a QIAshredder spin column, which
was placed in a 2 ml collection tube and centrifuged for 2 min at full speed. Then 600 µl of lysate were
mixed with 400 µl of ethanol p.a. (99%) by pipetting up and down. Samples were completely
transferred on an RNeasy spin column placed in a 2 ml collection tube and centrifuged for 15 s, at
10000 g (two steps were needed, because the RNeasy spin column had only a capacity of 700 µl). The
flow-through was removed. Next, the on-column DNase digestion was performed using the RNase-
free DNase Set form Qiagen. This was done to remove genomic DNA residues. First, 350 µl of RW1
buffer were added to an RNeasy spin column and centrifuged for 15 s, at 10000 g, to wash the spin
column membrane. The flow-through was removed and 10 µl DNase I stock solution (1500 Kunitz
solved in 550 µl RNase-free water) were diluted in 70 µl RDD buffer. This solution was added
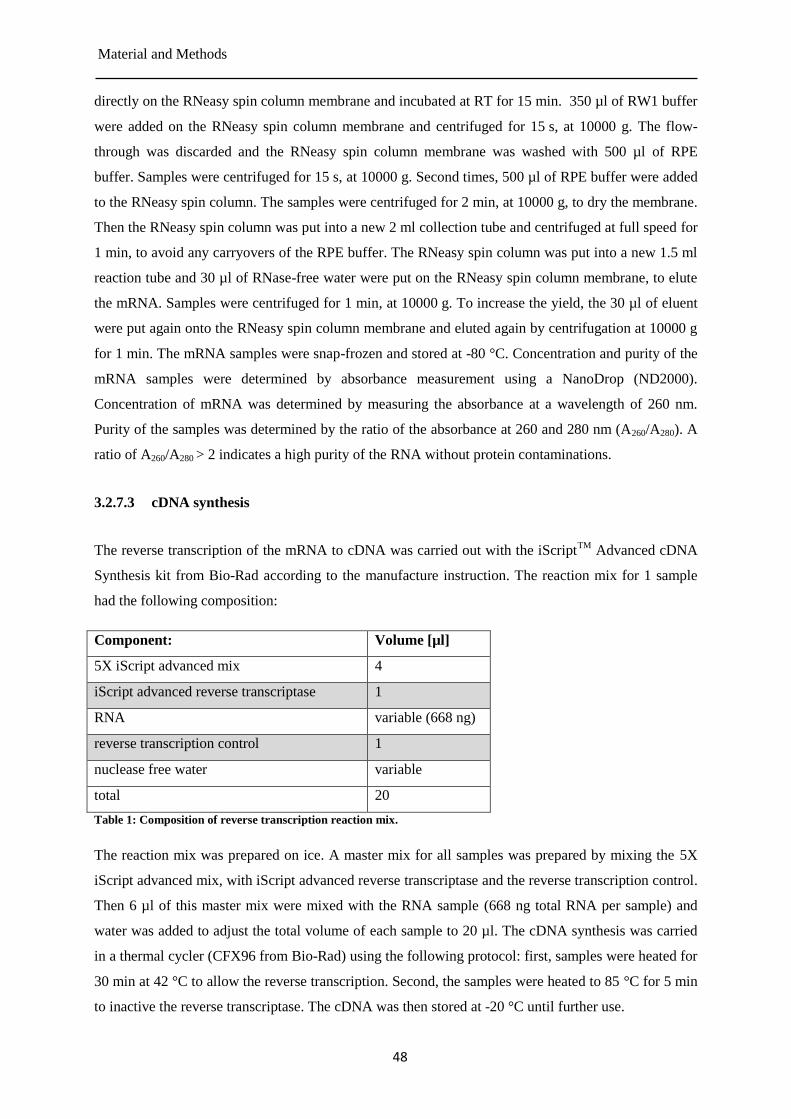
Material and Methods
48
directly on the RNeasy spin column membrane and incubated at RT for 15 min. 350 µl of RW1 buffer
were added on the RNeasy spin column membrane and centrifuged for 15 s, at 10000 g. The flow-
through was discarded and the RNeasy spin column membrane was washed with 500 µl of RPE
buffer. Samples were centrifuged for 15 s, at 10000 g. Second times, 500 µl of RPE buffer were added
to the RNeasy spin column. The samples were centrifuged for 2 min, at 10000 g, to dry the membrane.
Then the RNeasy spin column was put into a new 2 ml collection tube and centrifuged at full speed for
1 min, to avoid any carryovers of the RPE buffer. The RNeasy spin column was put into a new 1.5 ml
reaction tube and 30 µl of RNase-free water were put on the RNeasy spin column membrane, to elute
the mRNA. Samples were centrifuged for 1 min, at 10000 g. To increase the yield, the 30 µl of eluent
were put again onto the RNeasy spin column membrane and eluted again by centrifugation at 10000 g
for 1 min. The mRNA samples were snap-frozen and stored at -80 °C. Concentration and purity of the
mRNA samples were determined by absorbance measurement using a NanoDrop (ND2000).
Concentration of mRNA was determined by measuring the absorbance at a wavelength of 260 nm.
Purity of the samples was determined by the ratio of the absorbance at 260 and 280 nm (A260/A280). A
ratio of A260/A280 > 2 indicates a high purity of the RNA without protein contaminations.
3.2.7.3 cDNA synthesis
The reverse transcription of the mRNA to cDNA was carried out with the iScriptTM
Advanced cDNA
Synthesis kit from Bio-Rad according to the manufacture instruction. The reaction mix for 1 sample
had the following composition:
Component: Volume [µl]
5X iScript advanced mix 4
iScript advanced reverse transcriptase 1
RNA variable (668 ng)
reverse transcription control 1
nuclease free water variable
total 20
Table 1: Composition of reverse transcription reaction mix.
The reaction mix was prepared on ice. A master mix for all samples was prepared by mixing the 5X
iScript advanced mix, with iScript advanced reverse transcriptase and the reverse transcription control.
Then 6 µl of this master mix were mixed with the RNA sample (668 ng total RNA per sample) and
water was added to adjust the total volume of each sample to 20 µl. The cDNA synthesis was carried
in a thermal cycler (CFX96 from Bio-Rad) using the following protocol: first, samples were heated for
30 min at 42 °C to allow the reverse transcription. Second, the samples were heated to 85 °C for 5 min
to inactive the reverse transcriptase. The cDNA was then stored at -20 °C until further use.
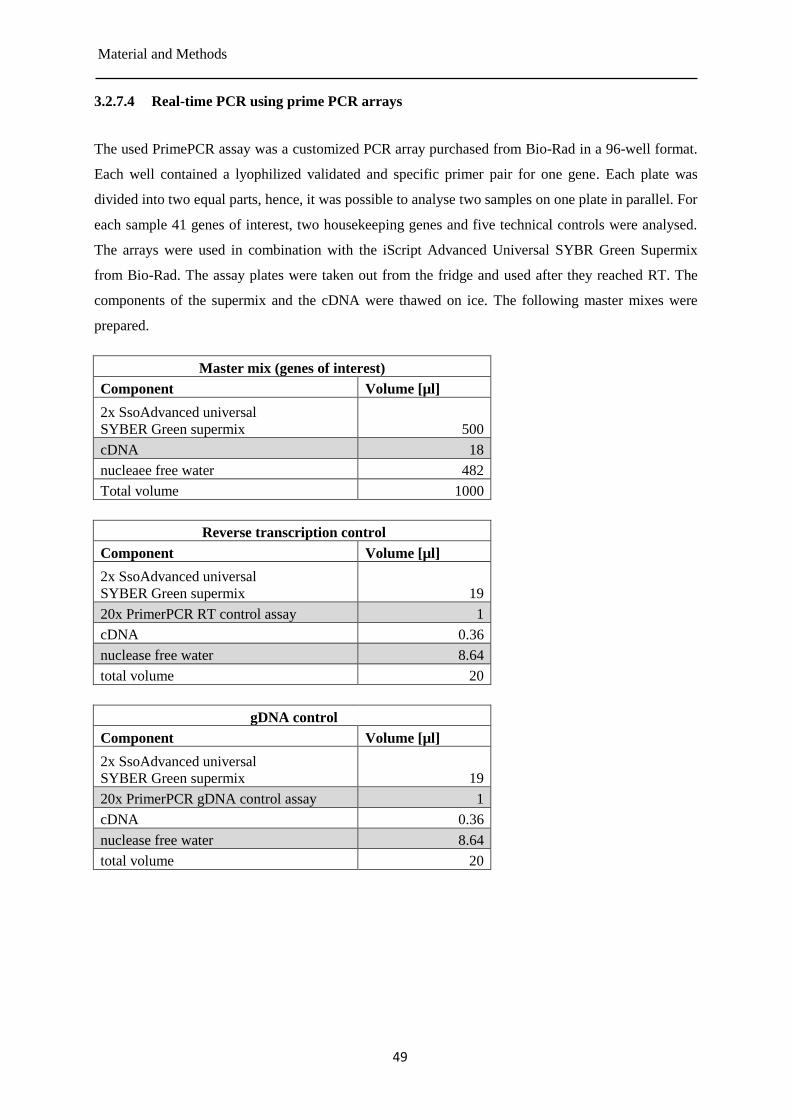
Material and Methods
49
3.2.7.4 Real-time PCR using prime PCR arrays
The used PrimePCR assay was a customized PCR array purchased from Bio-Rad in a 96-well format.
Each well contained a lyophilized validated and specific primer pair for one gene. Each plate was
divided into two equal parts, hence, it was possible to analyse two samples on one plate in parallel. For
each sample 41 genes of interest, two housekeeping genes and five technical controls were analysed.
The arrays were used in combination with the iScript Advanced Universal SYBR Green Supermix
from Bio-Rad. The assay plates were taken out from the fridge and used after they reached RT. The
components of the supermix and the cDNA were thawed on ice. The following master mixes were
prepared.
Master mix (genes of interest)
Component Volume [µl]
2x SsoAdvanced universal
SYBER Green supermix 500
cDNA 18
nucleaee free water 482
Total volume 1000
Reverse transcription control
Component Volume [µl]
2x SsoAdvanced universal
SYBER Green supermix 19
20x PrimerPCR RT control assay 1
cDNA 0.36
nuclease free water 8.64
total volume 20
gDNA control
Component Volume [µl]
2x SsoAdvanced universal
SYBER Green supermix 19
20x PrimerPCR gDNA control assay 1
cDNA 0.36
nuclease free water 8.64
total volume 20
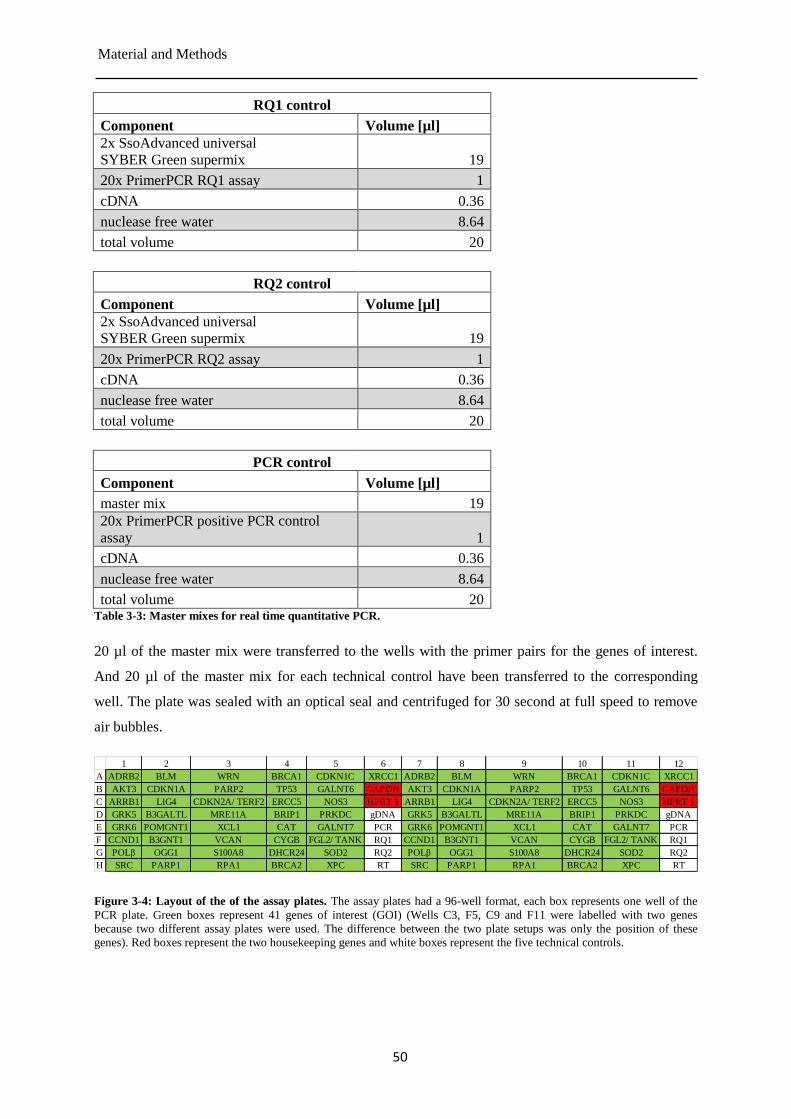
Material and Methods
50
RQ1 control
Component Volume [µl]
2x SsoAdvanced universal
SYBER Green supermix 19
20x PrimerPCR RQ1 assay 1
cDNA 0.36
nuclease free water 8.64
total volume 20
RQ2 control
Component Volume [µl]
2x SsoAdvanced universal
SYBER Green supermix 19
20x PrimerPCR RQ2 assay 1
cDNA 0.36
nuclease free water 8.64
total volume 20
PCR control
Component Volume [µl]
master mix 19
20x PrimerPCR positive PCR control
assay 1
cDNA 0.36
nuclease free water 8.64
total volume 20 Table 3-3: Master mixes for real time quantitative PCR.
20 µl of the master mix were transferred to the wells with the primer pairs for the genes of interest.
And 20 µl of the master mix for each technical control have been transferred to the corresponding
well. The plate was sealed with an optical seal and centrifuged for 30 second at full speed to remove
air bubbles.
Figure 3-4: Layout of the of the assay plates. The assay plates had a 96-well format, each box represents one well of the
PCR plate. Green boxes represent 41 genes of interest (GOI) (Wells C3, F5, C9 and F11 were labelled with two genes
because two different assay plates were used. The difference between the two plate setups was only the position of these
genes). Red boxes represent the two housekeeping genes and white boxes represent the five technical controls.
1 2 3 4 5 6 7 8 9 10 11 12
A ADRB2 BLM WRN BRCA1 CDKN1C XRCC1 ADRB2 BLM WRN BRCA1 CDKN1C XRCC1
B AKT3 CDKN1A PARP2 TP53 GALNT6 GAPDH AKT3 CDKN1A PARP2 TP53 GALNT6 GAPDH
C ARRB1 LIG4 CDKN2A/ TERF2 ERCC5 NOS3 HPRT 1 ARRB1 LIG4 CDKN2A/ TERF2 ERCC5 NOS3 HPRT 1
D GRK5 B3GALTL MRE11A BRIP1 PRKDC gDNA GRK5 B3GALTL MRE11A BRIP1 PRKDC gDNA
E GRK6 POMGNT1 XCL1 CAT GALNT7 PCR GRK6 POMGNT1 XCL1 CAT GALNT7 PCR
F CCND1 B3GNT1 VCAN CYGB FGL2/ TANK RQ1 CCND1 B3GNT1 VCAN CYGB FGL2/ TANK RQ1
G POLβ OGG1 S100A8 DHCR24 SOD2 RQ2 POLβ OGG1 S100A8 DHCR24 SOD2 RQ2
H SRC PARP1 RPA1 BRCA2 XPC RT SRC PARP1 RPA1 BRCA2 XPC RT
Material and Methods
51
DNA contamination control (gDNA control)
This control was used to check for a contamination of the cDNA with genomic DNA (gDNA). A
primer pair (wells D6 and D12) targeting a non-transcribed region of the human genome was used. A
quantification value (CT) lower than 35 indicated a contamination with gDNA. A CT value above 35
showed the absence of any gDNA in the sample.
Positive PCR control (PCR control)
The positive PCR control was used to test if samples contained inhibitors or other compounds that had
a negative effect on the PCR reaction. A synthetic DNA template (PrimePCR control assay) was
added to the reaction mix before this reaction mix was added to the assay plate. Primers for this
synthetic DNA were lyophilized in the respective wells (E6 and E12). The sequence of the synthetic
DNA is not present in the human genome.
RNA quality control (RQ1 and RQ2 control)
These two controls were used to test the quality and integrity of the RNA. This control was designed
as two primer pairs targeting the cDNA of the same RNA template but at different locations within the
cDNA sequence. If the quality of the RNA was good, meaning the RNA was not degraded or
fragmented, the transcribed cDNA should be intact. Since the cDNA concentration in each well is
equal, the CT value of RQ1 (wells F6 and F12) and RQ2 (wells G6 and G12) should also be equal.
Reverse transcription control (RT control)
This assay served as a control for the reverse transcription of the mRNA into cDNA. Therefore, a
synthetic RNA template with a sequence which is not present in the human genome was added to the
cDNA synthesis reaction mix. A primer pair for the amplification of the respective cDNA was
lyophilized on the PCR plate (wells H6 and H12). CT values above 30 indicated poor reverse
transcription reaction performance.
3.2.7.5 Real-time PCR using p16 and p21 primer pairs
To analyze the expression of p21 and p16 genes, validated primer pairs for real-time PCR from
Biomol were purchased. The p21 and p16 primer pairs were ordered together with a primer pair set of
ten housekeeping genes. The required mRNA and cDNA was isolated and transcribed in the same way
as in 3.2.7.2 and 3.2.7.3., real-time PCR was performed as described in 3.2.7.4. .
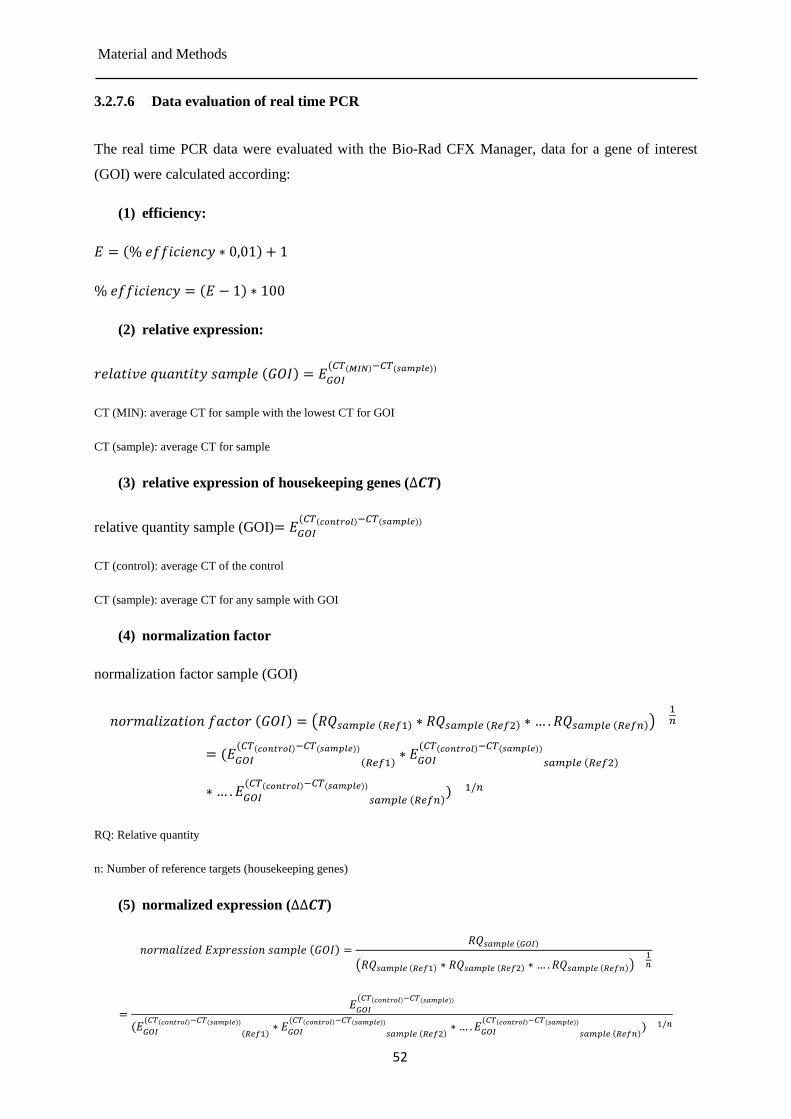
Material and Methods
52
3.2.7.6 Data evaluation of real time PCR
The real time PCR data were evaluated with the Bio-Rad CFX Manager, data for a gene of interest
(GOI) were calculated according:
(1) efficiency:
𝐸 = (% 𝑒𝑓𝑓𝑖𝑐𝑖𝑒𝑛𝑐𝑦 ∗ 0,01) + 1
% 𝑒𝑓𝑓𝑖𝑐𝑖𝑒𝑛𝑐𝑦 = (𝐸 − 1) ∗ 100
(2) relative expression:
𝑟𝑒𝑙𝑎𝑡𝑖𝑣𝑒 𝑞𝑢𝑎𝑛𝑡𝑖𝑡𝑦 𝑠𝑎𝑚𝑝𝑙𝑒 (𝐺𝑂𝐼) = 𝐸𝐺𝑂𝐼
(𝐶𝑇(𝑀𝐼𝑁)−𝐶𝑇(𝑠𝑎𝑚𝑝𝑙𝑒))
CT (MIN): average CT for sample with the lowest CT for GOI
CT (sample): average CT for sample
(3) relative expression of housekeeping genes (∆𝑪𝑻)
relative quantity sample (GOI)= 𝐸𝐺𝑂𝐼
(𝐶𝑇(𝑐𝑜𝑛𝑡𝑟𝑜𝑙)−𝐶𝑇(𝑠𝑎𝑚𝑝𝑙𝑒))
CT (control): average CT of the control
CT (sample): average CT for any sample with GOI
(4) normalization factor
normalization factor sample (GOI)
𝑛𝑜𝑟𝑚𝑎𝑙𝑖𝑧𝑎𝑡𝑖𝑜𝑛 𝑓𝑎𝑐𝑡𝑜𝑟 (𝐺𝑂𝐼) = (𝑅𝑄𝑠𝑎𝑚𝑝𝑙𝑒 (𝑅𝑒𝑓1) ∗ 𝑅𝑄𝑠𝑎𝑚𝑝𝑙𝑒 (𝑅𝑒𝑓2) ∗ … . 𝑅𝑄𝑠𝑎𝑚𝑝𝑙𝑒 (𝑅𝑒𝑓𝑛))1𝑛
= (𝐸𝐺𝑂𝐼
(𝐶𝑇(𝑐𝑜𝑛𝑡𝑟𝑜𝑙)−𝐶𝑇(𝑠𝑎𝑚𝑝𝑙𝑒))
(𝑅𝑒𝑓1)∗ 𝐸𝐺𝑂𝐼
(𝐶𝑇(𝑐𝑜𝑛𝑡𝑟𝑜𝑙)−𝐶𝑇(𝑠𝑎𝑚𝑝𝑙𝑒))
𝑠𝑎𝑚𝑝𝑙𝑒 (𝑅𝑒𝑓2)
∗ … . 𝐸𝐺𝑂𝐼
(𝐶𝑇(𝑐𝑜𝑛𝑡𝑟𝑜𝑙)−𝐶𝑇(𝑠𝑎𝑚𝑝𝑙𝑒))
𝑠𝑎𝑚𝑝𝑙𝑒 (𝑅𝑒𝑓𝑛)) 1/𝑛
RQ: Relative quantity
n: Number of reference targets (housekeeping genes)
(5) normalized expression (∆∆𝑪𝑻)
𝑛𝑜𝑟𝑚𝑎𝑙𝑖𝑧𝑒𝑑 𝐸𝑥𝑝𝑟𝑒𝑠𝑠𝑖𝑜𝑛 𝑠𝑎𝑚𝑝𝑙𝑒 (𝐺𝑂𝐼) =𝑅𝑄𝑠𝑎𝑚𝑝𝑙𝑒 (𝐺𝑂𝐼)
(𝑅𝑄𝑠𝑎𝑚𝑝𝑙𝑒 (𝑅𝑒𝑓1) ∗ 𝑅𝑄𝑠𝑎𝑚𝑝𝑙𝑒 (𝑅𝑒𝑓2) ∗ … . 𝑅𝑄𝑠𝑎𝑚𝑝𝑙𝑒 (𝑅𝑒𝑓𝑛))1𝑛
=𝐸𝐺𝑂𝐼
(𝐶𝑇(𝑐𝑜𝑛𝑡𝑟𝑜𝑙)−𝐶𝑇(𝑠𝑎𝑚𝑝𝑙𝑒))
(𝐸𝐺𝑂𝐼
(𝐶𝑇(𝑐𝑜𝑛𝑡𝑟𝑜𝑙)−𝐶𝑇(𝑠𝑎𝑚𝑝𝑙𝑒))
(𝑅𝑒𝑓1)∗ 𝐸𝐺𝑂𝐼
(𝐶𝑇(𝑐𝑜𝑛𝑡𝑟𝑜𝑙)−𝐶𝑇(𝑠𝑎𝑚𝑝𝑙𝑒))
𝑠𝑎𝑚𝑝𝑙𝑒 (𝑅𝑒𝑓2)∗ … . 𝐸𝐺𝑂𝐼
(𝐶𝑇(𝑐𝑜𝑛𝑡𝑟𝑜𝑙)−𝐶𝑇(𝑠𝑎𝑚𝑝𝑙𝑒))
𝑠𝑎𝑚𝑝𝑙𝑒 (𝑅𝑒𝑓𝑛)) 1/𝑛
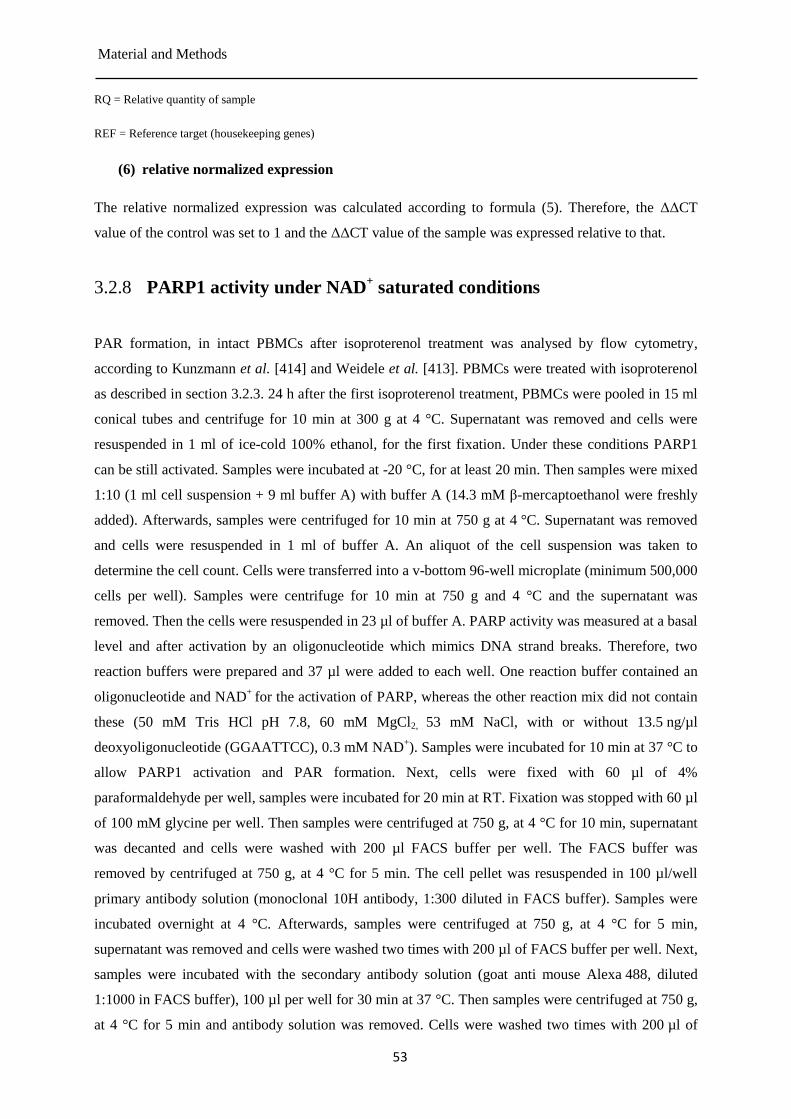
Material and Methods
53
RQ = Relative quantity of sample
REF = Reference target (housekeeping genes)
(6) relative normalized expression
The relative normalized expression was calculated according to formula (5). Therefore, the ΔΔCT
value of the control was set to 1 and the ΔΔCT value of the sample was expressed relative to that.
PARP1 activity under NAD+ saturated conditions 3.2.8
PAR formation, in intact PBMCs after isoproterenol treatment was analysed by flow cytometry,
according to Kunzmann et al. [414] and Weidele et al. [413]. PBMCs were treated with isoproterenol
as described in section 3.2.3. 24 h after the first isoproterenol treatment, PBMCs were pooled in 15 ml
conical tubes and centrifuge for 10 min at 300 g at 4 °C. Supernatant was removed and cells were
resuspended in 1 ml of ice-cold 100% ethanol, for the first fixation. Under these conditions PARP1
can be still activated. Samples were incubated at -20 °C, for at least 20 min. Then samples were mixed
1:10 (1 ml cell suspension + 9 ml buffer A) with buffer A (14.3 mM β-mercaptoethanol were freshly
added). Afterwards, samples were centrifuged for 10 min at 750 g at 4 °C. Supernatant was removed
and cells were resuspended in 1 ml of buffer A. An aliquot of the cell suspension was taken to
determine the cell count. Cells were transferred into a v-bottom 96-well microplate (minimum 500,000
cells per well). Samples were centrifuge for 10 min at 750 g and 4 °C and the supernatant was
removed. Then the cells were resuspended in 23 µl of buffer A. PARP activity was measured at a basal
level and after activation by an oligonucleotide which mimics DNA strand breaks. Therefore, two
reaction buffers were prepared and 37 µl were added to each well. One reaction buffer contained an
oligonucleotide and NAD+
for the activation of PARP, whereas the other reaction mix did not contain
these (50 mM Tris HCl pH 7.8, 60 mM MgCl2, 53 mM NaCl, with or without 13.5 ng/µl
deoxyoligonucleotide (GGAATTCC), 0.3 mM NAD+). Samples were incubated for 10 min at 37 °C to
allow PARP1 activation and PAR formation. Next, cells were fixed with 60 µl of 4%
paraformaldehyde per well, samples were incubated for 20 min at RT. Fixation was stopped with 60 µl
of 100 mM glycine per well. Then samples were centrifuged at 750 g, at 4 °C for 10 min, supernatant
was decanted and cells were washed with 200 µl FACS buffer per well. The FACS buffer was
removed by centrifuged at 750 g, at 4 °C for 5 min. The cell pellet was resuspended in 100 µl/well
primary antibody solution (monoclonal 10H antibody, 1:300 diluted in FACS buffer). Samples were
incubated overnight at 4 °C. Afterwards, samples were centrifuged at 750 g, at 4 °C for 5 min,
supernatant was removed and cells were washed two times with 200 µl of FACS buffer per well. Next,
samples were incubated with the secondary antibody solution (goat anti mouse Alexa 488, diluted
1:1000 in FACS buffer), 100 µl per well for 30 min at 37 °C. Then samples were centrifuged at 750 g,
at 4 °C for 5 min and antibody solution was removed. Cells were washed two times with 200 µl of
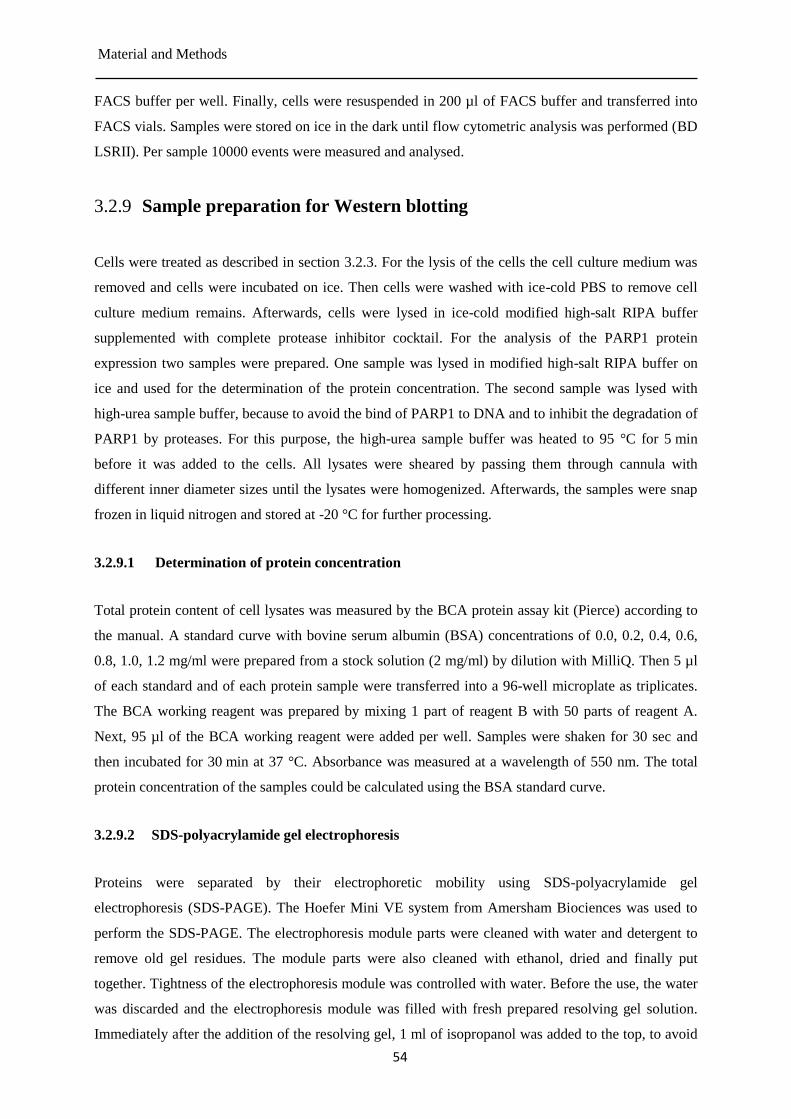
Material and Methods
54
FACS buffer per well. Finally, cells were resuspended in 200 µl of FACS buffer and transferred into
FACS vials. Samples were stored on ice in the dark until flow cytometric analysis was performed (BD
LSRII). Per sample 10000 events were measured and analysed.
Sample preparation for Western blotting 3.2.9
Cells were treated as described in section 3.2.3. For the lysis of the cells the cell culture medium was
removed and cells were incubated on ice. Then cells were washed with ice-cold PBS to remove cell
culture medium remains. Afterwards, cells were lysed in ice-cold modified high-salt RIPA buffer
supplemented with complete protease inhibitor cocktail. For the analysis of the PARP1 protein
expression two samples were prepared. One sample was lysed in modified high-salt RIPA buffer on
ice and used for the determination of the protein concentration. The second sample was lysed with
high-urea sample buffer, because to avoid the bind of PARP1 to DNA and to inhibit the degradation of
PARP1 by proteases. For this purpose, the high-urea sample buffer was heated to 95 °C for 5 min
before it was added to the cells. All lysates were sheared by passing them through cannula with
different inner diameter sizes until the lysates were homogenized. Afterwards, the samples were snap
frozen in liquid nitrogen and stored at -20 °C for further processing.
3.2.9.1 Determination of protein concentration
Total protein content of cell lysates was measured by the BCA protein assay kit (Pierce) according to
the manual. A standard curve with bovine serum albumin (BSA) concentrations of 0.0, 0.2, 0.4, 0.6,
0.8, 1.0, 1.2 mg/ml were prepared from a stock solution (2 mg/ml) by dilution with MilliQ. Then 5 µl
of each standard and of each protein sample were transferred into a 96-well microplate as triplicates.
The BCA working reagent was prepared by mixing 1 part of reagent B with 50 parts of reagent A.
Next, 95 µl of the BCA working reagent were added per well. Samples were shaken for 30 sec and
then incubated for 30 min at 37 °C. Absorbance was measured at a wavelength of 550 nm. The total
protein concentration of the samples could be calculated using the BSA standard curve.
3.2.9.2 SDS-polyacrylamide gel electrophoresis
Proteins were separated by their electrophoretic mobility using SDS-polyacrylamide gel
electrophoresis (SDS-PAGE). The Hoefer Mini VE system from Amersham Biociences was used to
perform the SDS-PAGE. The electrophoresis module parts were cleaned with water and detergent to
remove old gel residues. The module parts were also cleaned with ethanol, dried and finally put
together. Tightness of the electrophoresis module was controlled with water. Before the use, the water
was discarded and the electrophoresis module was filled with fresh prepared resolving gel solution.
Immediately after the addition of the resolving gel, 1 ml of isopropanol was added to the top, to avoid
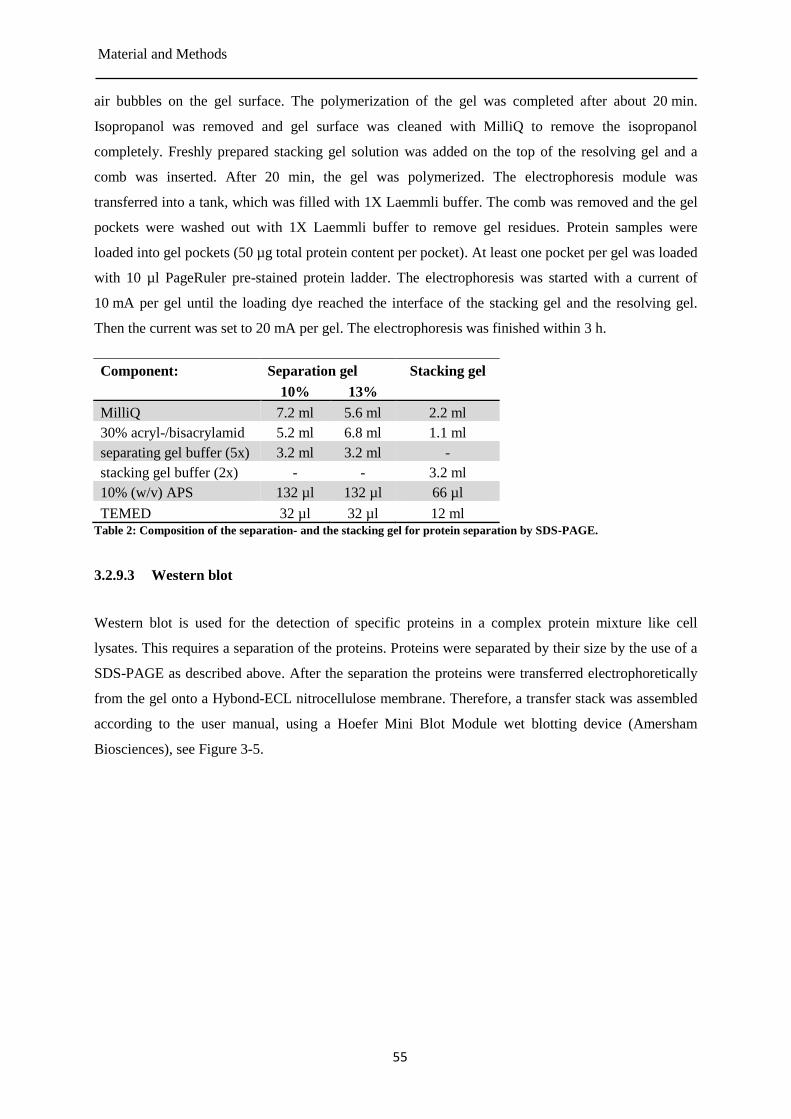
Material and Methods
55
air bubbles on the gel surface. The polymerization of the gel was completed after about 20 min.
Isopropanol was removed and gel surface was cleaned with MilliQ to remove the isopropanol
completely. Freshly prepared stacking gel solution was added on the top of the resolving gel and a
comb was inserted. After 20 min, the gel was polymerized. The electrophoresis module was
transferred into a tank, which was filled with 1X Laemmli buffer. The comb was removed and the gel
pockets were washed out with 1X Laemmli buffer to remove gel residues. Protein samples were
loaded into gel pockets (50 µg total protein content per pocket). At least one pocket per gel was loaded
with 10 µl PageRuler pre-stained protein ladder. The electrophoresis was started with a current of
10 mA per gel until the loading dye reached the interface of the stacking gel and the resolving gel.
Then the current was set to 20 mA per gel. The electrophoresis was finished within 3 h.
Component: Separation gel Stacking gel
10% 13%
MilliQ 7.2 ml 5.6 ml 2.2 ml
30% acryl-/bisacrylamid 5.2 ml 6.8 ml 1.1 ml
separating gel buffer (5x) 3.2 ml 3.2 ml -
stacking gel buffer (2x) - - 3.2 ml
10% (w/v) APS 132 µl 132 µl 66 µl
TEMED 32 µl 32 µl 12 ml Table 2: Composition of the separation- and the stacking gel for protein separation by SDS-PAGE.
3.2.9.3 Western blot
Western blot is used for the detection of specific proteins in a complex protein mixture like cell
lysates. This requires a separation of the proteins. Proteins were separated by their size by the use of a
SDS-PAGE as described above. After the separation the proteins were transferred electrophoretically
from the gel onto a Hybond-ECL nitrocellulose membrane. Therefore, a transfer stack was assembled
according to the user manual, using a Hoefer Mini Blot Module wet blotting device (Amersham
Biosciences), see Figure 3-5.
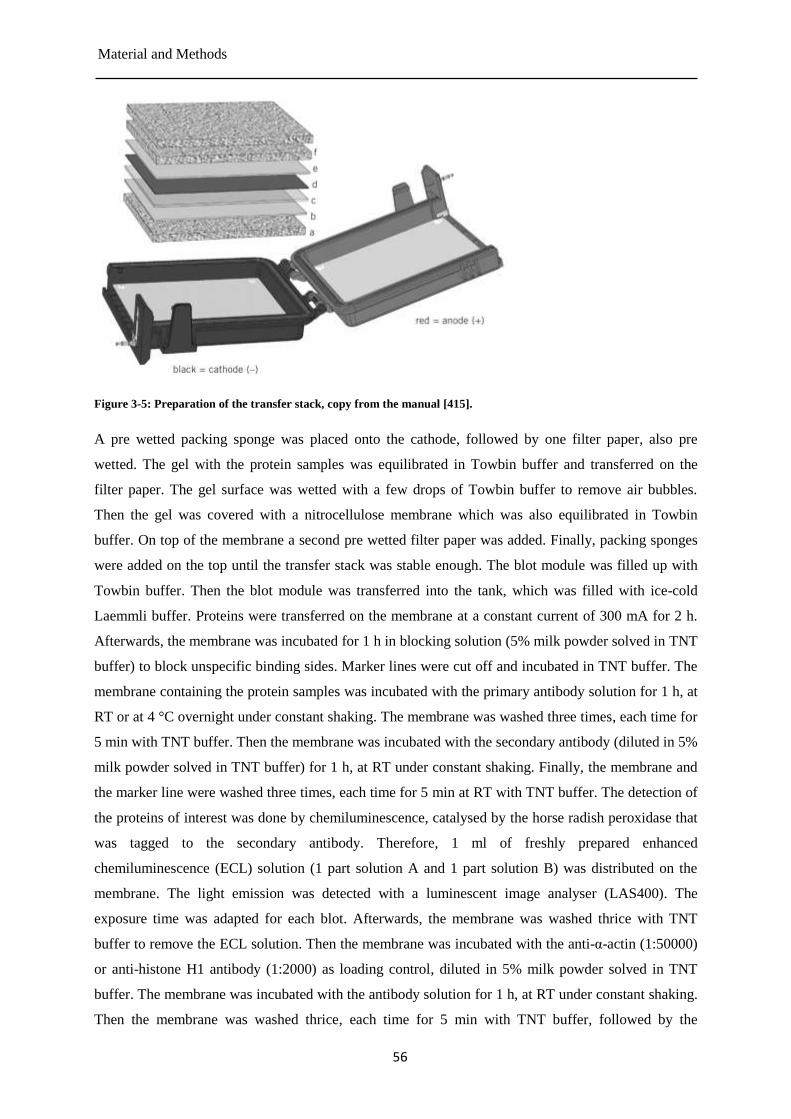
Material and Methods
56
Figure 3-5: Preparation of the transfer stack, copy from the manual [415].
A pre wetted packing sponge was placed onto the cathode, followed by one filter paper, also pre
wetted. The gel with the protein samples was equilibrated in Towbin buffer and transferred on the
filter paper. The gel surface was wetted with a few drops of Towbin buffer to remove air bubbles.
Then the gel was covered with a nitrocellulose membrane which was also equilibrated in Towbin
buffer. On top of the membrane a second pre wetted filter paper was added. Finally, packing sponges
were added on the top until the transfer stack was stable enough. The blot module was filled up with
Towbin buffer. Then the blot module was transferred into the tank, which was filled with ice-cold
Laemmli buffer. Proteins were transferred on the membrane at a constant current of 300 mA for 2 h.
Afterwards, the membrane was incubated for 1 h in blocking solution (5% milk powder solved in TNT
buffer) to block unspecific binding sides. Marker lines were cut off and incubated in TNT buffer. The
membrane containing the protein samples was incubated with the primary antibody solution for 1 h, at
RT or at 4 °C overnight under constant shaking. The membrane was washed three times, each time for
5 min with TNT buffer. Then the membrane was incubated with the secondary antibody (diluted in 5%
milk powder solved in TNT buffer) for 1 h, at RT under constant shaking. Finally, the membrane and
the marker line were washed three times, each time for 5 min at RT with TNT buffer. The detection of
the proteins of interest was done by chemiluminescence, catalysed by the horse radish peroxidase that
was tagged to the secondary antibody. Therefore, 1 ml of freshly prepared enhanced
chemiluminescence (ECL) solution (1 part solution A and 1 part solution B) was distributed on the
membrane. The light emission was detected with a luminescent image analyser (LAS400). The
exposure time was adapted for each blot. Afterwards, the membrane was washed thrice with TNT
buffer to remove the ECL solution. Then the membrane was incubated with the anti-α-actin (1:50000)
or anti-histone H1 antibody (1:2000) as loading control, diluted in 5% milk powder solved in TNT
buffer. The membrane was incubated with the antibody solution for 1 h, at RT under constant shaking.
Then the membrane was washed thrice, each time for 5 min with TNT buffer, followed by the
Material and Methods
57
incubation of the membrane with the secondary antibody for 1 h, at RT under constant shaking.
Finally, the membrane was washed again thrice, each time for 5 min with TNT buffer. The proteins
were detected as described above.
3.2.9.4 p16 and p21 protein expression
p16 and p21 proteins are important in the regulation of cell proliferation. p16 is an inhibitor of the
CDKs. It binds to CDK4/6, this leads to an inhibition of the progression of the cell cycle from the G1
phase to the S phase. PBMCs were isolated and repeatedly treated with isoproterenol as described in
section 3.2.3. The protein expression was measured at indicated points of time after the first
isoproterenol treatment. Afterwards, cells were incubated for 24 h, 48 h in a shaking water bath at
37 °C. At the indicated points of time cells were removed from the water bath and centrifuged at RT
and 600 g for 5 min. The TexMACS cell culture medium was removed and cells were washed with
PBS. Then cells were resuspended in 100 µl PBS. Next, the cells were fixed by adding 100 µl of 4%
PFA to the cell suspension. Cells were incubated for 10 min at RT. Then cells were permeabilized
with the addition of 200 µl of permeabilization buffer to the cell suspension. Cells were incubated in
the dark for 20 min at RT. Cells were centrifuged for 5 min, at 600 g and RT, the supernatant was
removed. Then cells were resuspended in 200 µl of blocking buffer and incubated for 30 min at RT.
Each PBMCs sample was split into two samples. One sample was used for the p16 staining. Cells
were centrifuged for 5 min, at 600 g and RT to remove the blocking solution and washed two times
with permeabilization buffer. Next, the cells were labelled with the primary antibodies. Therefore, the
anti-p16 antibody was diluted 1:320 also in FACS buffer. Cells were resuspended in 100 µl of the
respective antibody solution and incubated for 1 h, at 37 °C. Afterwards, the cells were washed three
times with permeabilization buffer and centrifuged at 600 g for 5 min at RT. Cells were stained with
the secondary antibody, goat anti-rabbit Alexa Fluor 488 diluted 1:1000 in FACS buffer. Therefore,
cells were resuspended in 100 µl of the secondary antibody solution and incubated at RT for 1 h in the
dark. Finally, cells were centrifuged 5 min, at 600 g and RT. The supernatant was removed and cells
were washed three times and resuspended in 200 µl ice-cold FACS buffer and transferred into FACS
vials. Samples were stored on ice in the dark until flow cytometric analysis was performed. Per sample
10000 events were measured and analysed (BD LSRII).
3.2.9.5 Determination of the isoproterenol concentration in cell culture media
In the beginning the dynamic range of the diode array detector and the fluorescence detector was
tested for their suitability for the detection of isoproterenol in cell culture media. For this purpose, a
dilution series of isoproterenol and caffeine was used. Caffeine was chosen, because it is stable under
the used conditions. Hence, the dilution series should be linear. A nonlinearity of the dilution series
would indicate a problem with the HPLC system. The dilution series was prepared by dissolving
Material and Methods
58
caffeine 1 mg/ml (5 mM) in ice-cold RPMI-1640 cell culture medium. Afterwards, isoproterenol was
dissolved in this caffeine solution to a concentration of 10 mM. This stock solution was then further
diluted (1:2, 1:10, 1:20, 1:100 and 1: 200) with ice-cold RPMI-1640 cell culture medium on ice. The
solution was stored on ice in the dark until the HPLC measurement could be performed.
3.2.9.6 Oxidation of isoproterenol
Isoproterenol was chemically oxidized to isoprenochrome. Freshly synthesized isoprenochrome was
used for determination of the UV/VIS spectrum and the retention time of isoprenochrome. The
oxidation of isoproterenol was performed in a 10 mM aqueous ammonium acetate buffer the pH was
adjusted to 5.4 with acetic acid. Potassium periodate solution at a concentration of 2 mM was freshly
dissolved in the oxidation buffer immediately before isoproterenol was added. Isoproterenol (10 mM)
was dissolved in oxidation buffer and mixed for 1 min. The solution recolored immediately into red.
The reaction mix was diluted 1:10 (10 µl reaction mix in 90 µl HPLC eluent).
3.2.9.7 Measurements of isoproterenol and isoprenochrome concentrations
The HPLC system (Agilent) which was used contained the following modules: 1100/1200 binary
pump, 1100 wellplate autosampler, 1100/1200 diode array detector, 1100/ 1200 column thermostat,
1100/ 1200 fluorescence detector, 1200 sample thermostat. Chemical compounds were detected by the
photodiode array detector (absorbance detector). In addition, a more sensitive fluorescence detector
was used as second detector and was direct connected to the photodiode array. As analytical column a
commercial available reverse phase C18-column (length 15 cm, inner diameter 4.6 mm, particle size
5 µm, column volume 2.5 ml) from Macherey-Nagel, was used. The column was equipped with a
guard column (Phenomenex, Aschaffenburg, Germany) containing C18 cartridge (3.0 mm inner
diameter) (Phenomenex, Aschaffenburg, Germany). An isocratic elution was performed at a flow rate
of 2 ml/min; the column temperature was not controlled (RT). The samples were cooled to 4 °C. The
mobile phase was a composition of water/acetonitrile (94.3/5.7 %v/v), 0.095 M citric acid, 350 µM
Na2EDTA and 460 µM octansolfonic acid. The pH was adjusted to 2.3 with ammonium acetate. Prior
to use, the buffer was filtered through a bottle-top vacuum filter with a pore size of 0.22 µm. The run
time was set to 20 min. For the detection of isoproterenol the diode array detector operated with the
following parameters: absorbance wavelength 280 nm with a bandwidth of 30 nm. As reference, a
wavelength of 700 nm with a bandwidth of 100 nm was used. For the detection of isoprenochrome the
diode array detector parameters were set to an absorbance wavelength of 490 nm with a bandwidth of
20 nm and a reference wavelength of 700 nm with a bandwidth of 100 nm. For the identification of the
isoproterenol peak an absorbance spectrum from 190 nm to 900 nm was recorded for each peak of the
chromatogram. The fluorescence detector was calibrated for isoproterenol according the handbook.
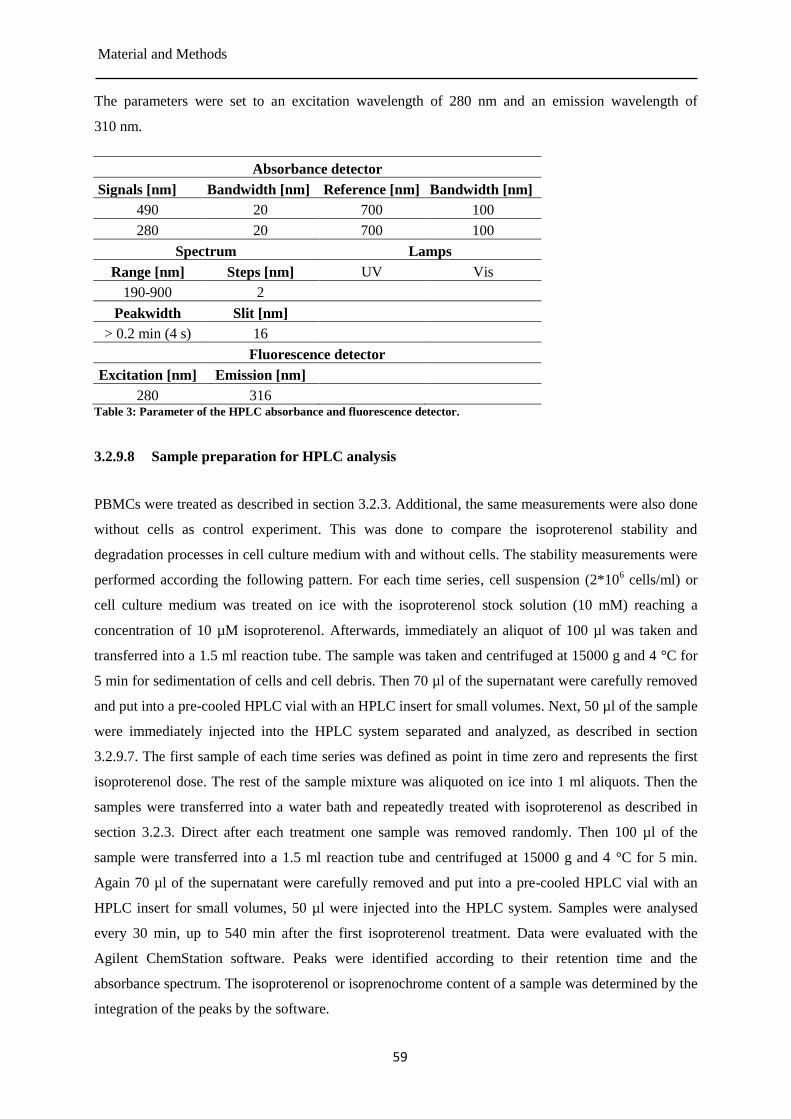
Material and Methods
59
The parameters were set to an excitation wavelength of 280 nm and an emission wavelength of
310 nm.
Absorbance detector
Signals [nm] Bandwidth [nm] Reference [nm] Bandwidth [nm]
490 20 700 100
280 20 700 100
Spectrum Lamps
Range [nm] Steps [nm] UV Vis
190-900 2
Peakwidth Slit [nm]
> 0.2 min (4 s) 16
Fluorescence detector
Excitation [nm] Emission [nm]
280 316 Table 3: Parameter of the HPLC absorbance and fluorescence detector.
3.2.9.8 Sample preparation for HPLC analysis
PBMCs were treated as described in section 3.2.3. Additional, the same measurements were also done
without cells as control experiment. This was done to compare the isoproterenol stability and
degradation processes in cell culture medium with and without cells. The stability measurements were
performed according the following pattern. For each time series, cell suspension (2*106 cells/ml) or
cell culture medium was treated on ice with the isoproterenol stock solution (10 mM) reaching a
concentration of 10 µM isoproterenol. Afterwards, immediately an aliquot of 100 µl was taken and
transferred into a 1.5 ml reaction tube. The sample was taken and centrifuged at 15000 g and 4 °C for
5 min for sedimentation of cells and cell debris. Then 70 µl of the supernatant were carefully removed
and put into a pre-cooled HPLC vial with an HPLC insert for small volumes. Next, 50 µl of the sample
were immediately injected into the HPLC system separated and analyzed, as described in section
3.2.9.7. The first sample of each time series was defined as point in time zero and represents the first
isoproterenol dose. The rest of the sample mixture was aliquoted on ice into 1 ml aliquots. Then the
samples were transferred into a water bath and repeatedly treated with isoproterenol as described in
section 3.2.3. Direct after each treatment one sample was removed randomly. Then 100 µl of the
sample were transferred into a 1.5 ml reaction tube and centrifuged at 15000 g and 4 °C for 5 min.
Again 70 µl of the supernatant were carefully removed and put into a pre-cooled HPLC vial with an
HPLC insert for small volumes, 50 µl were injected into the HPLC system. Samples were analysed
every 30 min, up to 540 min after the first isoproterenol treatment. Data were evaluated with the
Agilent ChemStation software. Peaks were identified according to their retention time and the
absorbance spectrum. The isoproterenol or isoprenochrome content of a sample was determined by the
integration of the peaks by the software.
Results
60
4 Results
Current research indicates that catecholamines can induce the expression of biomarkers of stress. Such
hints can be found in PTSD patients that showed an accelerated aging and an increased amount of
DNA strand breaks [82, 83]. Also on cellular level, catecholamines can induce after repeated dosage,
the accumulation of DNA strand breaks in mice and in human cell lines [399-401]. High doses of
epinephrine can induce DNA damage in human lymphocytes [399]. Additional, repeated dosage of
catecholamines can induce a senescence like phenotype in the myocardium of mice [416]. PTSD
seems also to be associated with a phenotype of accelerated senescence [312]. A pilot study in our
group showed that repeated stimulation of the β2-AR of human PBMCs by isoproterenol induced the
formation of DNA strand breaks. Moreover, the expression of the DNA repair protein PARP1 and the
formation of PAR were affected by the repeated isoproterenol treatment [405]. Based on these
observations an understanding of the responsible mechanisms is needed. To our knowledge
Isoproterenol can induce DNA damage by two different mechanisms. On the one hand, isoproterenol
can induce DNA strand breaks by signaling processes via the Gs protein/PKA pathway of the β2-AR
[400]. On the other hand, isoproterenol can be oxidized which is associated with the formation of free
radicals and ROS [226, 228]. Both mechanisms can induce DNA strand breaks. Moreover, we found
some indications that isoproterenol may induce a senescence like phenotype in human PBMCs [417].
Therefore, a second study investigated whether isoproterenol could induce the expression of
senescence markers in human PBMCs. These experiments required the culturing of PBMCs for
several days. Thus, the RPMI-1640 basal cell culture medium had to be supplemented with FCS or an
optimized cell culture medium, like TexMACS could be used. TexMACS is a FCS-free cell culture
medium developed for the cultivation of immune cells. The use of FCS was avoided because FCS
contains various hormones and growth factors which may influence the PBMCs [418, 419]. FCS as
well as TexMACS contain serum albumin and other factors which may influence the isoproterenol
degradation. To our knowledge no previous studies were performed to investigate the influence on the
stability and degradation of isoproterenol in cell culture. Therefore, a third study was performed to
investigate the isoproterenol stability and degradation under cell culture conditions. Also the influence
of different cell culture media and supplements like FCS were analyzed by HPLC measurements
(Palombo et al., manuscript in preparation) [420].
Results
61
4.1 Isoproterenol mediated DNA damage
cAMP-signaling of the β-AR after repeated isoproterenol stimulation 4.1.1
The β2-AR is a prototypical G protein coupled receptor which is coupled to a Gs protein. After binding
of a ligand such as isoproterenol, the receptor is stabilized in its active conformation. This leads to
formation of the second messenger cAMP, which activates downstream signaling pathways. Signaling
of the β2-AR can be associated with the formation of intracellular ROS which is PKA dependent. After
activation of the AC the cAMP signaling must be terminated. Therefore, the receptor can be uncoupled
from the G protein and internalized into the cell. In the cell, the receptor can either be recycled or
degraded. Varies factors influence the fate of the receptor such as: type of the ligand, concentration of
the ligand, duration of the activation, and cell type. As the ligand binding site of the β2-AR is located
extracellular, the cAMP-dependent signaling pathway can only be stimulated by receptors on the cell
surface. Previous results showed that repeated isoproterenol treatment induced the formation of DNA
strand breaks. These DNA strand breaks could be partial inhibited by pretreatment with the β-AR
antagonist (β-blocker) propranolol, see appendix Figure 12-2 [421]. Propranolol inhibits cAMP-
depended signaling of the β2-AR. The question arises, if the β2-AR can be stimulated and induces
cAMP-dependent signaling after the repeated isoproterenol administration. Thus, the formation of
cAMP in PBMCs after the repeated isoproterenol treatment and the influence of propranolol (prop)
were investigated, see Figure 4-1. Freshly isolated PBMCs were treated either with one dose, four
doses or eight doses of isoproterenol (each dose 10 µM). The receptor was blocked by a pretreatment
of the cells with propranolol. 10 min before the isoproterenol treatment was started cells were treated
with 10 µM propranolol (iso + prop). Since cAMP is degraded within minutes by phosphodiesterases,
the cAMP concentration was measured directly after the last isoproterenol dose. Immediately before
the last isoproterenol dose was applied, cells were treated with phosphodiesterase inhibitors. As
positive control, cells were treated with forskolin, which induces the formation of cAMP, receptor-
independently, by direct activation of the AC. PBMCs were cultured either in RPMI cell culture
medium without FCS (black) or in TexMACS cell culture medium (green). Forskolin induced a
significant increase of the cAMP content in PBMCs, approximately an 8-fold increase of the cAMP
concentration could be observed, see Figure 4-1 B) and D). A single dose of 10 µM isoproterenol
increased the intracellular cAMP content by a factor of approximately two to three. Pretreatment with
10 µM propranolol inhibited the formation of cAMP, see Figure 4-1 A) and C). After the four-fold and
eight-fold administration of isoproterenol, no significant increase of the intracellular cAMP content
compared to control cells could be observed for cells cultured in RPMI cell culture medium. But there
was an increase of the cAMP levels in comparison to the propranolol pretreated cells. PBMCs cultured
in TexMACS cell culture medium showed a three-fold higher intracellular cAMP content after the
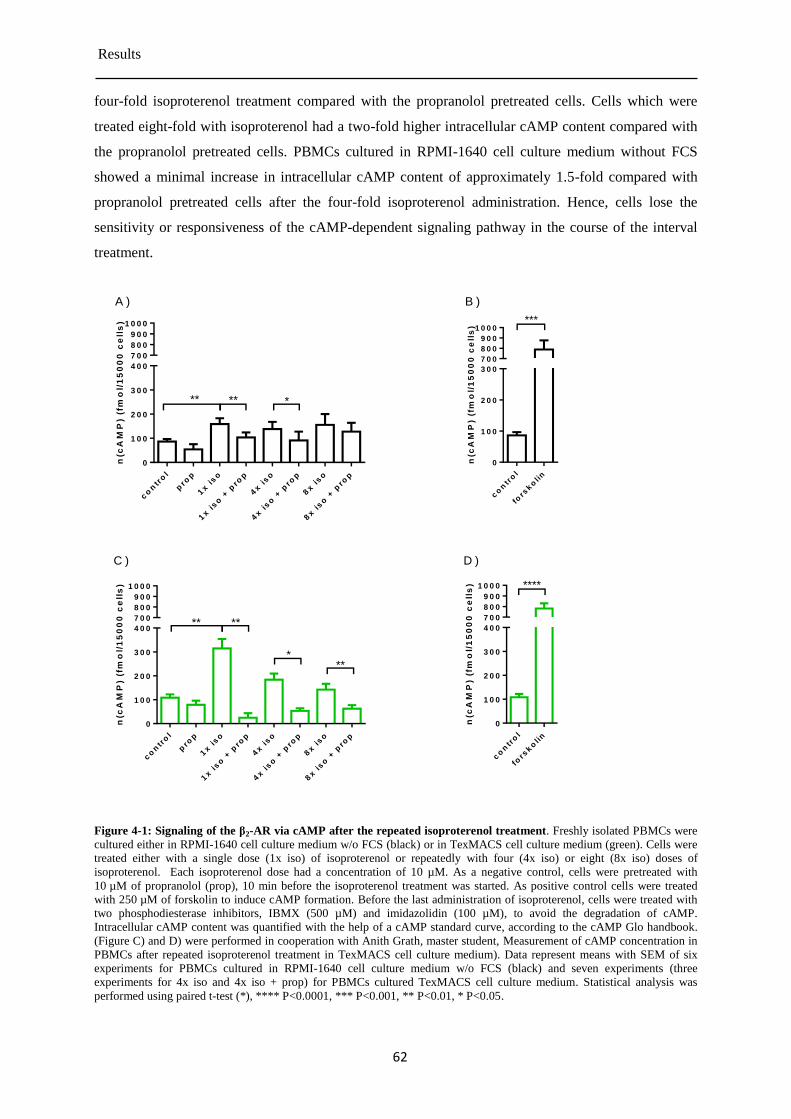
Results
62
four-fold isoproterenol treatment compared with the propranolol pretreated cells. Cells which were
treated eight-fold with isoproterenol had a two-fold higher intracellular cAMP content compared with
the propranolol pretreated cells. PBMCs cultured in RPMI-1640 cell culture medium without FCS
showed a minimal increase in intracellular cAMP content of approximately 1.5-fold compared with
propranolol pretreated cells after the four-fold isoproterenol administration. Hence, cells lose the
sensitivity or responsiveness of the cAMP-dependent signaling pathway in the course of the interval
treatment.
n(c
AM
P)
(fm
ol/
15
00
0 c
ell
s)
co
ntr
ol
pro
p
1x iso
1x iso
+ p
rop
4x iso
4x iso
+ p
rop
8x iso
8x iso
+ p
rop
0
1 0 0
2 0 0
3 0 0
4 0 0
7 0 0
8 0 0
9 0 0
1 0 0 0
** ** *
n(c
AM
P)
(fm
ol/
15
00
0 c
ell
s)
co
ntr
ol
fors
ko
lin
0
1 0 0
2 0 0
3 0 0
7 0 0
8 0 0
9 0 0
1 0 0 0***
A ) B )
n(c
AM
P)
(fm
ol/
15
00
0 c
ell
s)
co
ntr
ol
pro
p
1x iso
1x iso
+ p
rop
4x iso
4x iso
+ p
rop
8x iso
8x iso
+ p
rop
0
1 0 0
2 0 0
3 0 0
4 0 0
7 0 0
8 0 0
9 0 0
1 0 0 0
** **
***
n(c
AM
P)
(fm
ol/
15
00
0 c
ell
s)
co
ntr
ol
fors
ko
lin
0
1 0 0
2 0 0
3 0 0
4 0 0
7 0 0
8 0 0
9 0 0
1 0 0 0 ****
C ) D )
Figure 4-1: Signaling of the β2-AR via cAMP after the repeated isoproterenol treatment. Freshly isolated PBMCs were
cultured either in RPMI-1640 cell culture medium w/o FCS (black) or in TexMACS cell culture medium (green). Cells were
treated either with a single dose (1x iso) of isoproterenol or repeatedly with four (4x iso) or eight (8x iso) doses of
isoproterenol. Each isoproterenol dose had a concentration of 10 µM. As a negative control, cells were pretreated with
10 µM of propranolol (prop), 10 min before the isoproterenol treatment was started. As positive control cells were treated
with 250 µM of forskolin to induce cAMP formation. Before the last administration of isoproterenol, cells were treated with
two phosphodiesterase inhibitors, IBMX (500 µM) and imidazolidin (100 µM), to avoid the degradation of cAMP.
Intracellular cAMP content was quantified with the help of a cAMP standard curve, according to the cAMP Glo handbook.
(Figure C) and D) were performed in cooperation with Anith Grath, master student, Measurement of cAMP concentration in
PBMCs after repeated isoproterenol treatment in TexMACS cell culture medium). Data represent means with SEM of six
experiments for PBMCs cultured in RPMI-1640 cell culture medium w/o FCS (black) and seven experiments (three
experiments for 4x iso and 4x iso + prop) for PBMCs cultured TexMACS cell culture medium. Statistical analysis was
performed using paired t-test (*), **** P<0.0001, *** P<0.001, ** P<0.01, * P<0.05.
Results
63
Quantification of the intracellular NAD+
content in PBMCs during 4.1.2
and after the repeated isoproterenol treatment
The repeated isoproterenol treatment not only induced DNA strand breaks it also led to an increase in
the percentage of cells which had a lower PAR formation ability, see appendix Figure 12-4 [421].
DNA strand breaks are known to activate PARP1. Activated PARP1 uses NAD+ as a substrate for the
formation of PAR. Hence, DNA strand breaks induce the depletion of intracellular NAD+ pools to a
significant degree. The decrease of cellular NAD+ content correlates with the amount of DNA strand
breaks and the resulting PAR formation. The formation of intracellular cAMP was reduced after the
repeated isoproterenol treatment. This could be caused by the internalization of the receptor or by the
uncoupling of the receptor from the Gs protein. These processes were involved in the termination of
the receptor signaling. However, reduced cAMP formation could be also caused by a cellular energy
crisis. Since, the formation of cAMP requires ATP. The intracellular ATP content of isoproterenol
treated cells was negatively correlated with the applied amount of isoproterenol doses, see appendix
Figure 12-3 [421]. Thus, the NAD+ content of PBMCs was analyzed during and after the isoproterenol
treatment by the NAD+ cycling assay. The strongest effects of the isoproterenol treatment could be
observed after the 8-fold isoproterenol treatment. Therefore, the NAD+ content of PBMCs was
measured after each dose during the 8-fold isoproterenol treatment. The NAD+ content was normalized
to an untreated control sample at each point in time, see Figure 4-2 A). During the treatment no
decrease of the cellular NAD+ content could be detected. 6.5 h after the beginning of the isoproterenol
treatment a reduction of the intracellular NAD+ content of about 30% could be observed. The cellular
NAD+ content was also quantified 24 h after the first isoproterenol dose, see Figure 4-2 B). As a
control, PBMCs were lysed direct at the beginning of the treatment without an isoproterenol dose (w/o
iso 0 min) and direct after the first isoproterenol dose (1x iso 0 min). As a positive control, PBMCs
were treated with 500 µM of H2O2 in PBS for 5 min at 37 °C, after the 24 h incubation time. No
significant difference of the NAD+ content between the isoproterenol treated cells (1x iso 0 min) and
the untreated cells (w/o iso 0 min) at the beginning of the treatment could be observed. Hence,
isoproterenol has no immediate effect on the cellular NAD+ content. Also no significant difference of
the cellular NAD+ content between the untreated cells at the beginning and after the 24 h incubation
time could be observed. Indicating, the incubation has no influence on the cellular NAD+ content. The
H2O2 treatment led to a significant decrease of the cellular NAD+ pools. Also the isoproterenol
treatment resulted in a significant decrease of the cellular NAD+
content of PBMCs. The strongest
decrease, about 30%, of the NAD+ content could be observed after the 8-fold isoproterenol treatment.
These results showed that the isoproterenol treatment induced the depletion of NAD+. Moreover, the
reduced NAD+ content could be the reason and the explanation for the reduced PAR formation in
some cell population of the treated PBMCs.
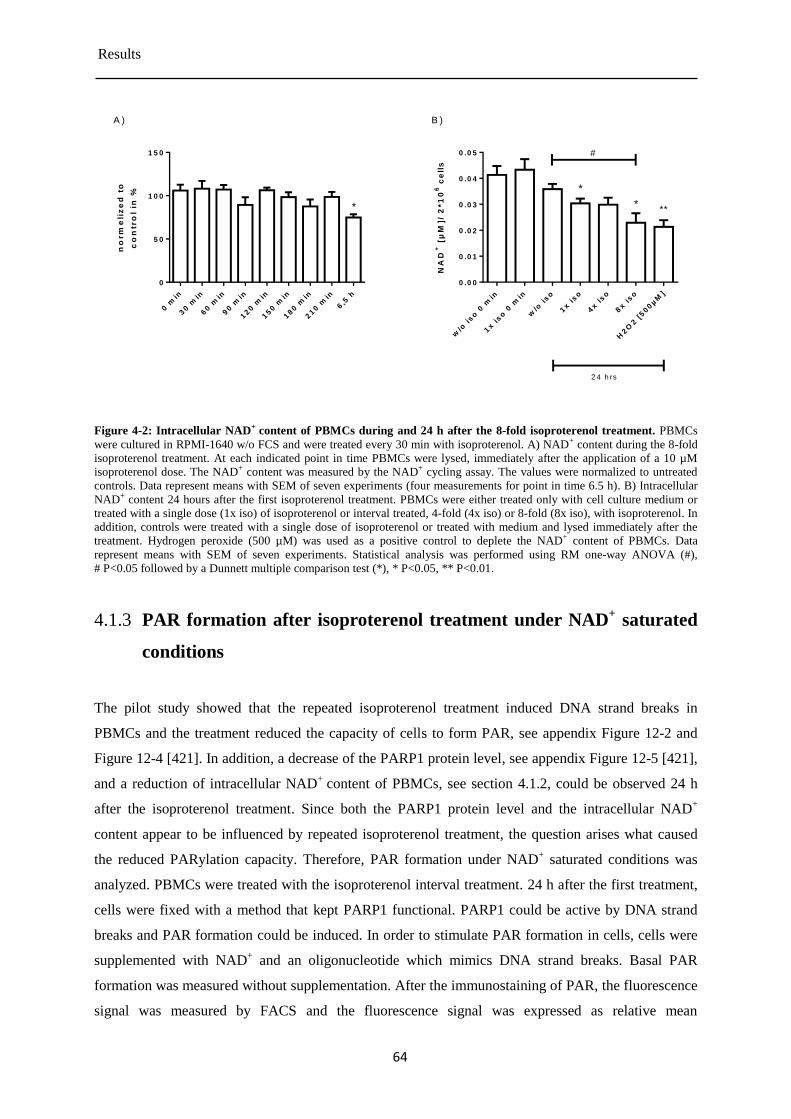
Results
64
NA
D+
[µ
M]/
2*1
06
ce
lls
w/o
iso
0 m
in
1x iso
0 m
in
w/o
iso
1x iso
4x iso
8x iso
H2O
2 [
500µM
]
0 .0 0
0 .0 1
0 .0 2
0 .0 3
0 .0 4
0 .0 5
*
*
B )
**
#
2 4 h rs
no
rm
eli
ze
d t
o
co
ntr
ol
in %
0 m
in
30 m
in
60 m
in
90 m
in
120 m
in
150 m
in
180 m
in
210 m
in
6,5
h
0
5 0
1 0 0
1 5 0
A )
*
Figure 4-2: Intracellular NAD+ content of PBMCs during and 24 h after the 8-fold isoproterenol treatment. PBMCs
were cultured in RPMI-1640 w/o FCS and were treated every 30 min with isoproterenol. A) NAD+ content during the 8-fold
isoproterenol treatment. At each indicated point in time PBMCs were lysed, immediately after the application of a 10 µM
isoproterenol dose. The NAD+ content was measured by the NAD+ cycling assay. The values were normalized to untreated
controls. Data represent means with SEM of seven experiments (four measurements for point in time 6.5 h). B) Intracellular
NAD+ content 24 hours after the first isoproterenol treatment. PBMCs were either treated only with cell culture medium or
treated with a single dose (1x iso) of isoproterenol or interval treated, 4-fold (4x iso) or 8-fold (8x iso), with isoproterenol. In
addition, controls were treated with a single dose of isoproterenol or treated with medium and lysed immediately after the
treatment. Hydrogen peroxide (500 µM) was used as a positive control to deplete the NAD+ content of PBMCs. Data
represent means with SEM of seven experiments. Statistical analysis was performed using RM one-way ANOVA (#),
# P<0.05 followed by a Dunnett multiple comparison test (*), * P<0.05, ** P<0.01.
PAR formation after isoproterenol treatment under NAD+ saturated 4.1.3
conditions
The pilot study showed that the repeated isoproterenol treatment induced DNA strand breaks in
PBMCs and the treatment reduced the capacity of cells to form PAR, see appendix Figure 12-2 and
Figure 12-4 [421]. In addition, a decrease of the PARP1 protein level, see appendix Figure 12-5 [421],
and a reduction of intracellular NAD+
content of PBMCs, see section 4.1.2, could be observed 24 h
after the isoproterenol treatment. Since both the PARP1 protein level and the intracellular NAD+
content appear to be influenced by repeated isoproterenol treatment, the question arises what caused
the reduced PARylation capacity. Therefore, PAR formation under NAD+ saturated conditions was
analyzed. PBMCs were treated with the isoproterenol interval treatment. 24 h after the first treatment,
cells were fixed with a method that kept PARP1 functional. PARP1 could be active by DNA strand
breaks and PAR formation could be induced. In order to stimulate PAR formation in cells, cells were
supplemented with NAD+ and an oligonucleotide which mimics DNA strand breaks. Basal PAR
formation was measured without supplementation. After the immunostaining of PAR, the fluorescence
signal was measured by FACS and the fluorescence signal was expressed as relative mean
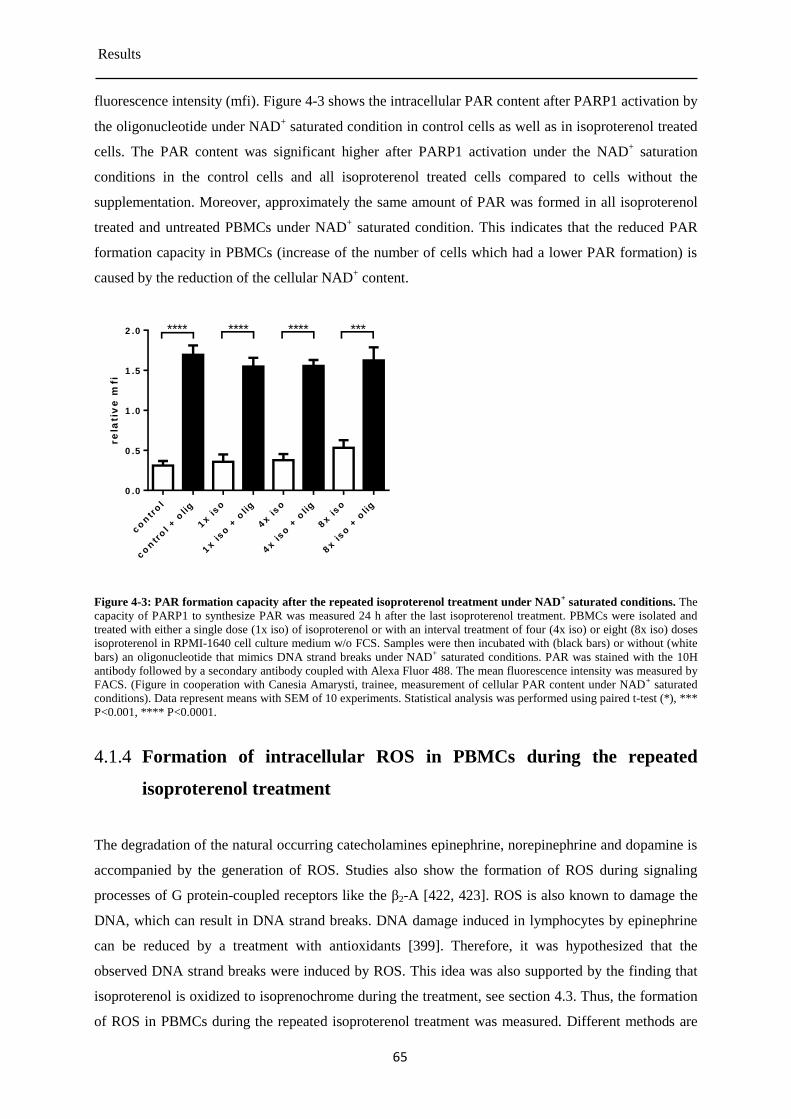
Results
65
fluorescence intensity (mfi). Figure 4-3 shows the intracellular PAR content after PARP1 activation by
the oligonucleotide under NAD+ saturated condition in control cells as well as in isoproterenol treated
cells. The PAR content was significant higher after PARP1 activation under the NAD+ saturation
conditions in the control cells and all isoproterenol treated cells compared to cells without the
supplementation. Moreover, approximately the same amount of PAR was formed in all isoproterenol
treated and untreated PBMCs under NAD+ saturated condition. This indicates that the reduced PAR
formation capacity in PBMCs (increase of the number of cells which had a lower PAR formation) is
caused by the reduction of the cellular NAD+ content.
re
lati
ve
mfi
co
ntr
ol
co
ntr
ol + o
lig
1x iso
1x iso
+ o
lig
4x iso
4x iso
+ o
lig
8x iso
8x iso
+ o
lig
0 .0
0 .5
1 .0
1 .5
2 .0 **** **** *******
Figure 4-3: PAR formation capacity after the repeated isoproterenol treatment under NAD+ saturated conditions. The
capacity of PARP1 to synthesize PAR was measured 24 h after the last isoproterenol treatment. PBMCs were isolated and
treated with either a single dose (1x iso) of isoproterenol or with an interval treatment of four (4x iso) or eight (8x iso) doses
isoproterenol in RPMI-1640 cell culture medium w/o FCS. Samples were then incubated with (black bars) or without (white
bars) an oligonucleotide that mimics DNA strand breaks under NAD+ saturated conditions. PAR was stained with the 10H
antibody followed by a secondary antibody coupled with Alexa Fluor 488. The mean fluorescence intensity was measured by
FACS. (Figure in cooperation with Canesia Amarysti, trainee, measurement of cellular PAR content under NAD+ saturated
conditions). Data represent means with SEM of 10 experiments. Statistical analysis was performed using paired t-test (*), ***
P<0.001, **** P<0.0001.
Formation of intracellular ROS in PBMCs during the repeated 4.1.4
isoproterenol treatment
The degradation of the natural occurring catecholamines epinephrine, norepinephrine and dopamine is
accompanied by the generation of ROS. Studies also show the formation of ROS during signaling
processes of G protein-coupled receptors like the β2-A [422, 423]. ROS is also known to damage the
DNA, which can result in DNA strand breaks. DNA damage induced in lymphocytes by epinephrine
can be reduced by a treatment with antioxidants [399]. Therefore, it was hypothesized that the
observed DNA strand breaks were induced by ROS. This idea was also supported by the finding that
isoproterenol is oxidized to isoprenochrome during the treatment, see section 4.3. Thus, the formation
of ROS in PBMCs during the repeated isoproterenol treatment was measured. Different methods are
Results
66
available for the detection of intracellular ROS. The most commonly used methods are based on the
use of fluorescence probes that change their fluorescence upon oxidation by ROS. Two of the most
used fluorescence probes are DHE and DCFDA. Both are cell-permeable dyes, DHE is specific for the
detection of superoxide, whereas, DCFDA can be oxidized by a broad range of ROS species. Both
dyes can only be used in living cells and cannot be used with fixed cells. Therefore, all experiments
were performed as quickly as possible and the fluorescence was measured immediately after
completion of the assay. Freshly isolated PBMCs were treated with isoproterenol in one of the three
tested cell culture media (RPMI-1640 w/o FCS (black), RPMI-1640 with FCS (grey), TexMACS
(green)). Cells were treated with isoproterenol and stained with DHE (10 µM) or DCFDA (20 µM) as
described in section 3.2.5. The fluorescence signal was measured 4 h after the first treatment (30 min
after the last isoproterenol treatment). This allowed the detection of ROS formed during the
isoproterenol treatment. Unstained cells were used as a control for the staining. MEN and TBHP were
used as positive controls to induce the oxidation of DHE or DCFDA. An increase of the fluorescence
after the DCFDA staining without further treatment was observed in both RPMI-1640 cell culture
media, but not in the TexMACS cell culture medium, see Figure 4-4 A), C) and E). In all three cell
culture media an increase of the fluorescence could be seen after the treatment with TBHP (200 µM,
500 µM or 50 mM). Hence, DCFDA had to be present in these cells. The isoproterenol treatment did
not increase the fluorescence signal. This indicated that the isoproterenol treatment did not induce the
formation of ROS in PBMCs. Or at least this experimental setup was not sensitive enough to detect the
ROS formation. Interestingly, different doses of THBP were needed to induce ROS in PBMCs,
depending on the used cell culture medium. The staining with DHE without further treatment also led
to a significant increase of the fluorescence signal, see Figure 4-4 B), D) and F). This indicated the
intracellular presence of the dye. Also a dose-dependent increase of the fluorescence was seen after the
MEN treatment (10, 50, 200 and 500 µM). However, also with DHE staining no formation of
intracellular ROS could be detected. Again, different concentrations of MEN were needed, depending
on the used cell culture medium, to induce the oxidation of the fluorescence probe. Taken together, the
interval treatment of PBMCs with isoproterenol did not induce the formation of ROS.
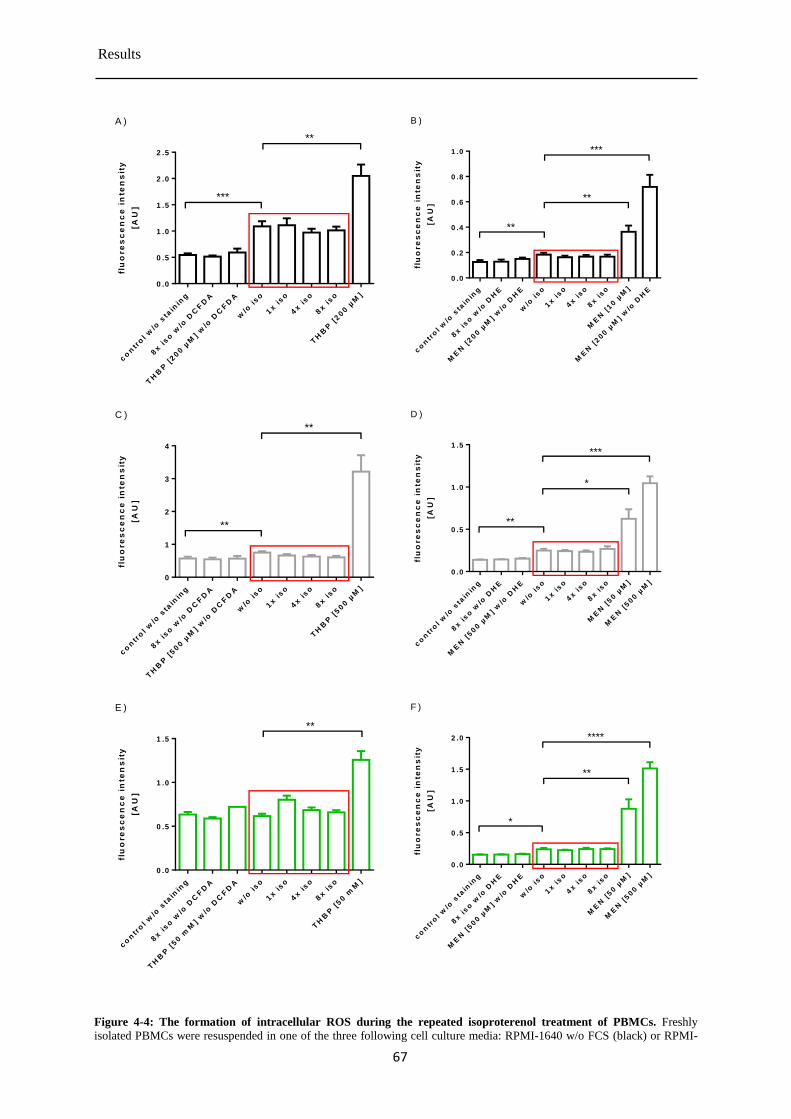
Results
67
flu
ore
sc
en
ce
in
ten
sit
y
[AU
]
co
ntr
ol w
/o s
tain
ing
8x iso
w/o
DC
FD
A
TH
BP
[200 µ
M]
w/o
DC
FD
A
w/o
iso
1x iso
4x iso
8x iso
TH
BP
[200 µ
M]
0 .0
0 .5
1 .0
1 .5
2 .0
2 .5
A )
***
**
flu
ore
sc
en
ce
in
ten
sit
y
[AU
]
co
ntr
ol w
/o s
tain
ing
8x iso
w/o
DH
E
ME
N [
200 µ
M]
w/o
DH
E
w/o
iso
1x iso
4x iso
8x iso
ME
N [
10 µ
M]
ME
N [
200 µ
M]
w/o
DH
E
0 .0
0 .2
0 .4
0 .6
0 .8
1 .0
**
**
***
B )fl
uo
re
sc
en
ce
in
ten
sit
y
[AU
]
co
ntr
ol w
/o s
tain
ing
8x iso
w/o
DC
FD
A
TH
BP
[500 µ
M]
w/o
DC
FD
A
w/o
iso
1x iso
4x iso
8x iso
TH
BP
[500 µ
M]
0
1
2
3
4
**
**
C )fl
uo
re
sc
en
ce
in
ten
sit
y
[AU
]
co
ntr
ol w
/o s
tain
ing
8x iso
w/o
DH
E
ME
N [
500 µ
M]
w/o
DH
E
w/o
iso
1x iso
4x iso
8x iso
ME
N [
50 µ
M]
ME
N [
500 µ
M]
0 .0
0 .5
1 .0
1 .5
D )
**
*
***
flu
ore
sc
en
ce
in
ten
sit
y
[AU
]
co
ntr
ol w
/o s
tain
ing
8x iso
w/o
DC
FD
A
TH
BP
[50 m
M]
w/o
DC
FD
A
w/o
iso
1x iso
4x iso
8x iso
TH
BP
[50 m
M]
0 .0
0 .5
1 .0
1 .5
**
E )
flu
ore
sc
en
ce
in
ten
sit
y
[AU
]
co
ntr
ol w
/o s
tain
ing
8x iso
w/o
DH
E
ME
N [
500 µ
M]
w/o
DH
E
w/o
iso
1x iso
4x iso
8x iso
ME
N [
50 µ
M]
ME
N [
500 µ
M]
0 .0
0 .5
1 .0
1 .5
2 .0
*
**
****
F )
Figure 4-4: The formation of intracellular ROS during the repeated isoproterenol treatment of PBMCs. Freshly
isolated PBMCs were resuspended in one of the three following cell culture media: RPMI-1640 w/o FCS (black) or RPMI-
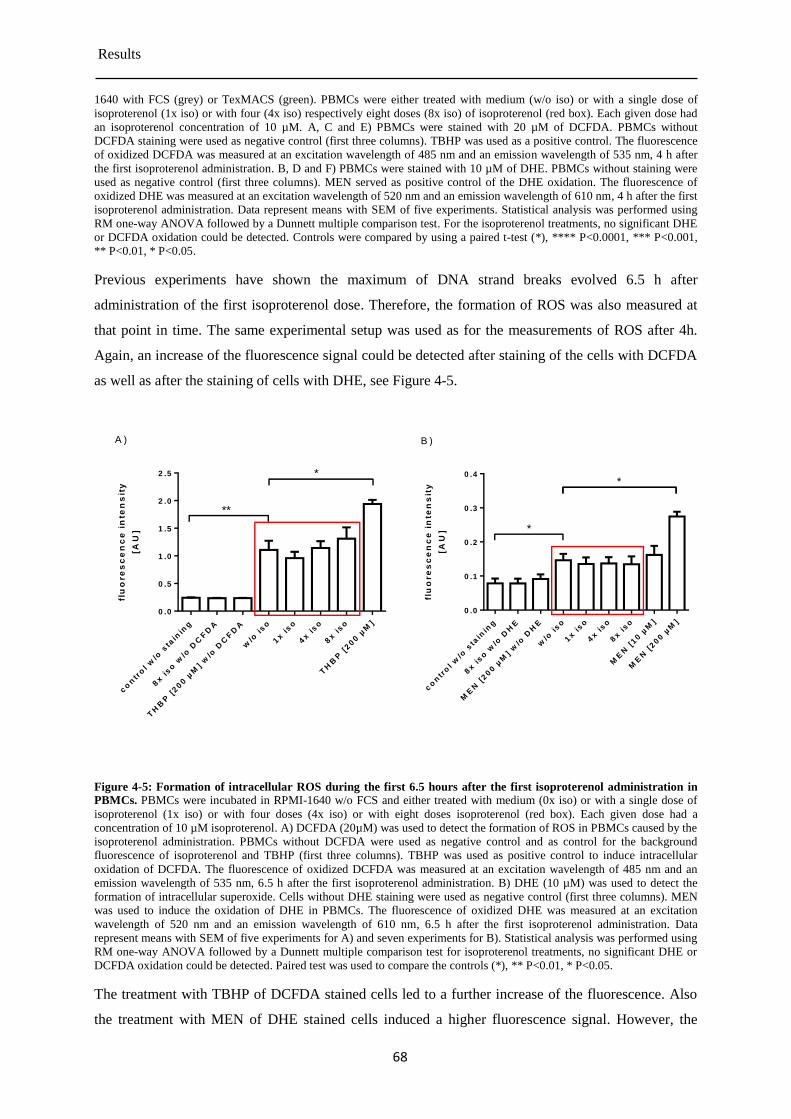
Results
68
1640 with FCS (grey) or TexMACS (green). PBMCs were either treated with medium (w/o iso) or with a single dose of
isoproterenol (1x iso) or with four (4x iso) respectively eight doses (8x iso) of isoproterenol (red box). Each given dose had
an isoproterenol concentration of 10 µM. A, C and E) PBMCs were stained with 20 µM of DCFDA. PBMCs without
DCFDA staining were used as negative control (first three columns). TBHP was used as a positive control. The fluorescence
of oxidized DCFDA was measured at an excitation wavelength of 485 nm and an emission wavelength of 535 nm, 4 h after
the first isoproterenol administration. B, D and F) PBMCs were stained with 10 µM of DHE. PBMCs without staining were
used as negative control (first three columns). MEN served as positive control of the DHE oxidation. The fluorescence of
oxidized DHE was measured at an excitation wavelength of 520 nm and an emission wavelength of 610 nm, 4 h after the first
isoproterenol administration. Data represent means with SEM of five experiments. Statistical analysis was performed using
RM one-way ANOVA followed by a Dunnett multiple comparison test. For the isoproterenol treatments, no significant DHE
or DCFDA oxidation could be detected. Controls were compared by using a paired t-test (*), **** P<0.0001, *** P<0.001,
** P<0.01, * P<0.05.
Previous experiments have shown the maximum of DNA strand breaks evolved 6.5 h after
administration of the first isoproterenol dose. Therefore, the formation of ROS was also measured at
that point in time. The same experimental setup was used as for the measurements of ROS after 4h.
Again, an increase of the fluorescence signal could be detected after staining of the cells with DCFDA
as well as after the staining of cells with DHE, see Figure 4-5.
flu
ore
sc
en
ce
in
ten
sit
y
[AU
]
co
ntr
ol w
/o s
tain
ing
8x iso
w/o
DC
FD
A
TH
BP
[200 µ
M]
w/o
DC
FD
A
w/o
iso
1x iso
4x iso
8x iso
TH
BP
[200 µ
M]
0 .0
0 .5
1 .0
1 .5
2 .0
2 .5
A )
**
*
flu
ore
sc
en
ce
in
ten
sit
y
[AU
]
co
ntr
ol w
/o s
tain
ing
8x iso
w/o
DH
E
ME
N [
200 µ
M]
w/o
DH
E
w/o
iso
1x iso
4x iso
8x iso
ME
N [
10 µ
M]
ME
N [
200 µ
M]
0 .0
0 .1
0 .2
0 .3
0 .4*
*
B )
Figure 4-5: Formation of intracellular ROS during the first 6.5 hours after the first isoproterenol administration in
PBMCs. PBMCs were incubated in RPMI-1640 w/o FCS and either treated with medium (0x iso) or with a single dose of
isoproterenol (1x iso) or with four doses (4x iso) or with eight doses isoproterenol (red box). Each given dose had a
concentration of 10 µM isoproterenol. A) DCFDA (20µM) was used to detect the formation of ROS in PBMCs caused by the
isoproterenol administration. PBMCs without DCFDA were used as negative control and as control for the background
fluorescence of isoproterenol and TBHP (first three columns). TBHP was used as positive control to induce intracellular
oxidation of DCFDA. The fluorescence of oxidized DCFDA was measured at an excitation wavelength of 485 nm and an
emission wavelength of 535 nm, 6.5 h after the first isoproterenol administration. B) DHE (10 µM) was used to detect the
formation of intracellular superoxide. Cells without DHE staining were used as negative control (first three columns). MEN
was used to induce the oxidation of DHE in PBMCs. The fluorescence of oxidized DHE was measured at an excitation
wavelength of 520 nm and an emission wavelength of 610 nm, 6.5 h after the first isoproterenol administration. Data
represent means with SEM of five experiments for A) and seven experiments for B). Statistical analysis was performed using
RM one-way ANOVA followed by a Dunnett multiple comparison test for isoproterenol treatments, no significant DHE or
DCFDA oxidation could be detected. Paired test was used to compare the controls (*), ** P<0.01, * P<0.05.
The treatment with TBHP of DCFDA stained cells led to a further increase of the fluorescence. Also
the treatment with MEN of DHE stained cells induced a higher fluorescence signal. However, the
Results
69
interval treatment with isoproterenol did not induce the formation of ROS in PBMCs during the first
6.5 h. The experiments were performed only in RPMI-1640 cell culture medium w/o FCS, because the
strongest effect could be observed in cells cultured in this cell culture medium.
4.2 Repeated isoproterenol treatment induced senescence
like phenotype
Previous experiments with PBMCs of PTSD patients have shown that several genes involved in β-
adrenergic signaling, cell cycle regulation, DNA damage sensing and DNA damage repair were
transcriptionally dysregulated (Judy Salzwedel, personal communication). Moreover, ex vivo
experiments with PBMCs of healthy volunteers have shown that the repeated treatment with
isoproterenol induced: the formation of DNA strand breaks, the expression of senescence associated
beta-galactosidase, a change of the cell morphology to a senescence like phenotype and the ability of
PBMCs to proliferate after stimulation with PHE was inhibited (Palombo and Grath, manuscript in
preparation) [420]. It was hypothesized that isoproterenol may induce the expression of a senescence
like phenotype also in human PBMCs. This idea was supported by a recent published mice study
which demonstrated that the repeated isoproterenol infusion can induce a senescence like phenotype in
cardiomyocytes [416]. Therefore, further senescence markers were analyzed in PBMCs after the
isoproterenol treatment. Since the expression of senescence markers required some time the culturing
conditions of PBMCs had to be modified. Therefore, the RPMI-1640 cell culture medium was
replaced by the TexMACS cell culture medium. This medium was developed for the culturing of
immune cells. This increased the cell viability and allowed the culturing of PBMCs for several days,
see appendix Figure 12-8.
Gene expression in PBMCs after the repeated isoproterenol 4.2.1
treatment
Gene expression of genes involved in DNA damage signaling, DNA damage repair, cell cycle control,
oxidative stress and β-adrenergic signaling were analyzed by custom made real time quantitative PCR
(qPCR) arrays in PBMCs after the repeated isoproterenol treatment. These arrays were previously
used for the analysis of the gene expression in PBMCs of PTSD patients. The qPCR was performed to
identify genetic markers for a senescence phenotype in the isoproterenol treated PBMCs. PBMCs were
interval treated either with four or eight doses of isoproterenol, control cells were treated with cell
culture medium. 24 h after the first isoproterenol dose cells were lysed and mRNA was isolated and
transcribed into cDNA. The cDNA was used as template for the relative quantification of the gene
Results
70
expression. The expressions of the genes of interest were normalized to the expression of two
reference genes, GAPDH and HPRT1. Data were expressed as relative normalized expression (ΔΔCT).
Figure 4-6 shows the relative normalized gene expression of the 4-fold isoproterenol treated cells on
the left side and the relative normalized gene expression of the 8-fold treated cells on the right side.
The threshold for a down- or up-regulation was set to 2 (dotted lines). Meaning for an up-regulation,
the expression of a gene was two times higher in the treated sample compared to an untreated control.
For down-regulation, the expression of a gene of the treated sample was half of the expression of an
untreated control. Genes which are down-regulated are marked red and genes which are up-regulated
are marked green, unregulated genes are marked grey. Statistical analysis was performed for each gene
by using a two-tailed paired t-test, comparing the untreated control samples to the isoproterenol treated
samples. Several genes showed a significant difference in the expression. However, these differences
were small and the threshold for the regulation was not exceeded. Therefore, it was considered that the
expression of these genes was not regulated by the interval treatment with isoproterenol. After the
repeated four-fold isoproterenol treatment of cells, two genes, VCAN and BRAC2, showed an up-
regulation (6.5- and 2-fold increased expression compared to control cells). The up-regulation of the
BRAC2 gene was not significant. One gene, CCND1 (cyclin D1), was down-regulated by the 4-fold
isoproterenol treatment (2.17-fold decrease in isoproterenol treated cells compared to control cells).
Several other genes showed a significant difference in the expression between the control cells and the
four-fold isoproterenol treated cells such as SRC, GRK6 and ADRB2. An up-regulation of these genes
which was close to the threshold (1.8-, 1.86-, 1.73-fold increase compared to control cells) could be
observed. The eight-fold administration of isoproterenol induced up-regulation of the p16, BRCA2 and
VCAN genes (2.7- , 2.0- and 5.6-fold increase compared to control cells). However, the increase of the
p16 and BRCA2 gene expression was not significant. CCND1 was again down-regulated (3.33-fold
decrease compared to control cells). Some additionally genes were significantly regulated and close to
the threshold like NOS3, CDKN1C, B3GNT1 (1.9-, 1.78 and 1.83-fold incase compared to control
cells). The qPCR showed a down-regulation of the CCND1 gene expression. CCND1 is important for
the G1- to S-phase transition of the cell cycle. Since p16 (CDKN2A) and p21 proteins are key-
regulators of the cell cycle and only p21 was included in the original qPCR array the expression of
both was analyzed with new ordered primer pairs (second used p21 primers are indicated with
CDKN1A*). Therefore, the same cDNA stock was used as before for the qPCR arrays. Both CDKN1A
primer pairs gave the same results. The results of the gene expression with the results mentioned in
section 4.2 indicate that isoproterenol may induce a senescence like phenotype in PBMCs.
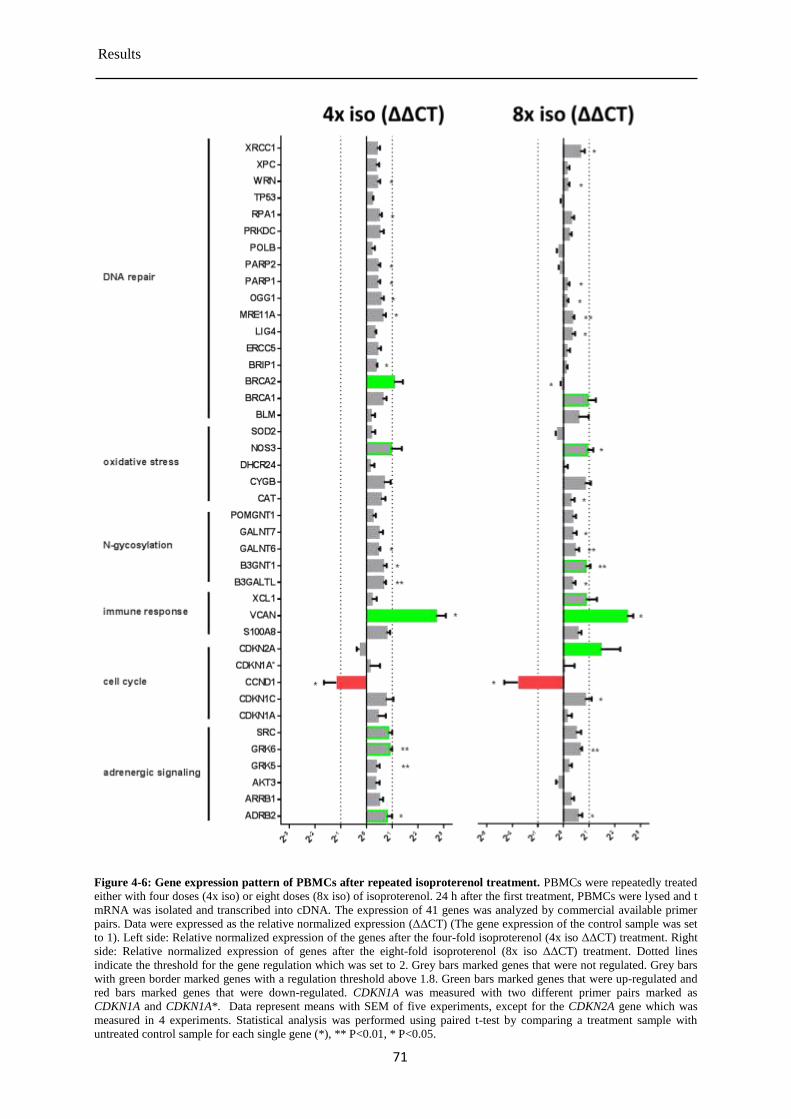
Results
71
Figure 4-6: Gene expression pattern of PBMCs after repeated isoproterenol treatment. PBMCs were repeatedly treated
either with four doses (4x iso) or eight doses (8x iso) of isoproterenol. 24 h after the first treatment, PBMCs were lysed and t
mRNA was isolated and transcribed into cDNA. The expression of 41 genes was analyzed by commercial available primer
pairs. Data were expressed as the relative normalized expression (ΔΔCT) (The gene expression of the control sample was set
to 1). Left side: Relative normalized expression of the genes after the four-fold isoproterenol (4x iso ΔΔCT) treatment. Right
side: Relative normalized expression of genes after the eight-fold isoproterenol (8x iso ΔΔCT) treatment. Dotted lines
indicate the threshold for the gene regulation which was set to 2. Grey bars marked genes that were not regulated. Grey bars
with green border marked genes with a regulation threshold above 1.8. Green bars marked genes that were up-regulated and
red bars marked genes that were down-regulated. CDKN1A was measured with two different primer pairs marked as
CDKN1A and CDKN1A*. Data represent means with SEM of five experiments, except for the CDKN2A gene which was
measured in 4 experiments. Statistical analysis was performed using paired t-test by comparing a treatment sample with
untreated control sample for each single gene (*), ** P<0.01, * P<0.05.
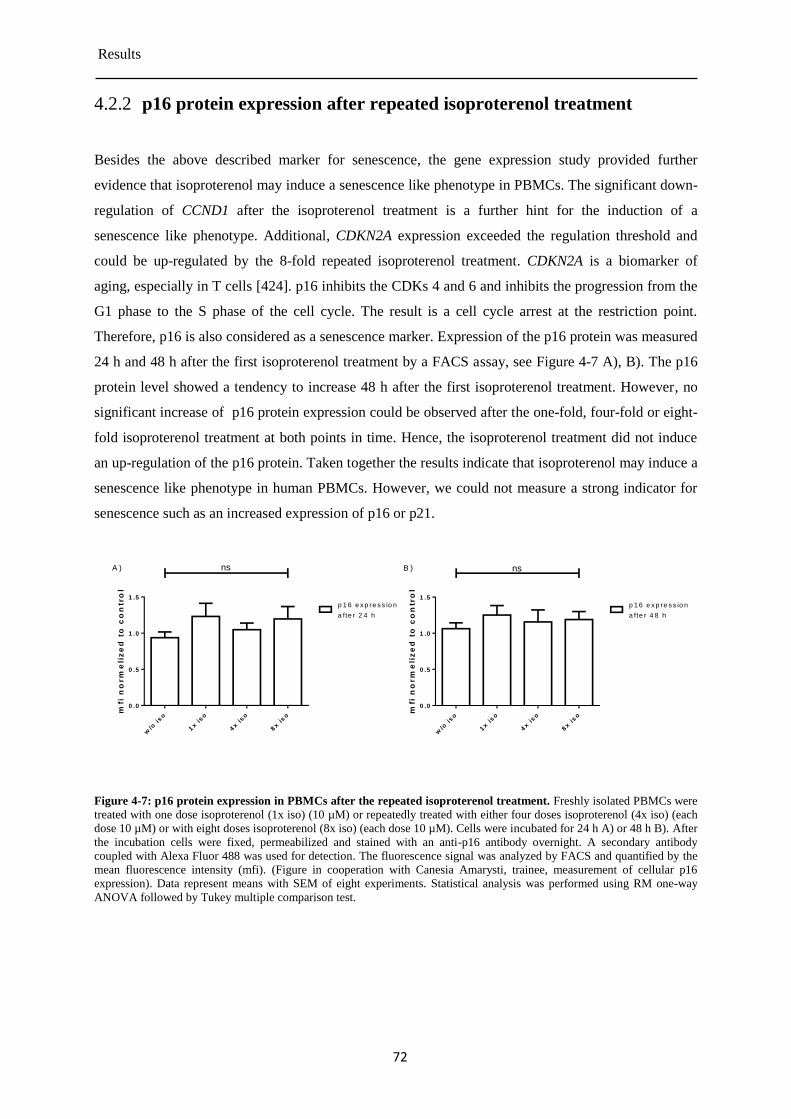
Results
72
p16 protein expression after repeated isoproterenol treatment 4.2.2
Besides the above described marker for senescence, the gene expression study provided further
evidence that isoproterenol may induce a senescence like phenotype in PBMCs. The significant down-
regulation of CCND1 after the isoproterenol treatment is a further hint for the induction of a
senescence like phenotype. Additional, CDKN2A expression exceeded the regulation threshold and
could be up-regulated by the 8-fold repeated isoproterenol treatment. CDKN2A is a biomarker of
aging, especially in T cells [424]. p16 inhibits the CDKs 4 and 6 and inhibits the progression from the
G1 phase to the S phase of the cell cycle. The result is a cell cycle arrest at the restriction point.
Therefore, p16 is also considered as a senescence marker. Expression of the p16 protein was measured
24 h and 48 h after the first isoproterenol treatment by a FACS assay, see Figure 4-7 A), B). The p16
protein level showed a tendency to increase 48 h after the first isoproterenol treatment. However, no
significant increase of p16 protein expression could be observed after the one-fold, four-fold or eight-
fold isoproterenol treatment at both points in time. Hence, the isoproterenol treatment did not induce
an up-regulation of the p16 protein. Taken together the results indicate that isoproterenol may induce a
senescence like phenotype in human PBMCs. However, we could not measure a strong indicator for
senescence such as an increased expression of p16 or p21.
w/o
iso
1x iso
4x iso
8x iso
0 .0
0 .5
1 .0
1 .5
mfi
no
rm
eli
ze
d t
o c
on
tro
l
nsA )
p 1 6 e x p re s s io n
a fte r 2 4 h
w/o
iso
1x iso
4x iso
8x iso
0 .0
0 .5
1 .0
1 .5
mfi
no
rm
eli
ze
d t
o c
on
tro
l
nsB )
p 1 6 e x p re s s io n
a fte r 4 8 h
Figure 4-7: p16 protein expression in PBMCs after the repeated isoproterenol treatment. Freshly isolated PBMCs were
treated with one dose isoproterenol (1x iso) (10 µM) or repeatedly treated with either four doses isoproterenol (4x iso) (each
dose 10 µM) or with eight doses isoproterenol (8x iso) (each dose 10 µM). Cells were incubated for 24 h A) or 48 h B). After
the incubation cells were fixed, permeabilized and stained with an anti-p16 antibody overnight. A secondary antibody
coupled with Alexa Fluor 488 was used for detection. The fluorescence signal was analyzed by FACS and quantified by the
mean fluorescence intensity (mfi). (Figure in cooperation with Canesia Amarysti, trainee, measurement of cellular p16
expression). Data represent means with SEM of eight experiments. Statistical analysis was performed using RM one-way
ANOVA followed by Tukey multiple comparison test.
Results
73
4.3 Degradation of isoproterenol under cell culture
conditions
Isoproterenol is a commonly used β-AR agonist. It is used in medicine for the treatment of
bradycardia, heart block and asthma. Moreover, it is also exploited for the investigation of the
signaling processes of ARs. However, the pharmacodynamics and pharmacokinetics of isoproterenol
have so far been investigated only in different animal models and in humans. These studies
demonstrated big differences in the absorption of isoproterenol depending on the administration route
[201, 205, 425]. The plasma half-life and metabolites of isoproterenol varies between different
administration routs and species. Cellular signaling processes are mostly investigated in cell culture
systems. Therefore, also data for uptake, clearance and breakdown of isoproterenol under cell culture
conditions are needed. For instance, it was shown that PBMCs can uptake, synthesis, metabolize and
store catecholamines [169]. One objective of this thesis was to investigate the stability and degradation
of isoproterenol in cell culture with PBMCs. A HPLC system was used to investigate the isoproterenol
concentration in cell culture medium during and after the interval treatment of PBMCs with
isoproterenol. We were interested in the isoproterenol concentration in cell culture medium, because
β-ARs are located at the cell membrane. Moreover, it is known that FCS and serum albumin binds
isoproterenol and increases the anti-oxidative capacity of the cell culture medium [426, 427]. This may
influence the oxidative degradation of isoproterenol. The ligand binding pocket of these receptors is
located on the extra cellular side [428]. Measurements of the intracellular isoproterenol concentrations
were not possible, because of the insufficient sensitivity of the available detectors. Therefore, we
investigated the stability of isoproterenol and its oxidation into isoprenochrome in basal cell culture
medium RPMI-1640 and also in the RPMI-1640 supplemented with 10% FCS. Moreover, the same
experiments were performed with TexMACS cell culture medium which is used for the culturing of
immune cells. TexMACS is FCS-free but contains serum albumin.
Detection of isoproterenol by absorbance detector 4.3.1
To investigate the fate of isoproterenol under cell culture conditions, the amount of isoproterenol was
measured by a HPLC. Isoproterenol was detected by its characteristic absorbance peak of 280 nm or
its fluorescence at an excitation wavelength of 280 nm and an emission wavelength of 316 nm.
Additionally, the amount of isoprenochrome was measured. Isoprenochrome is the aminochrome of
isoproterenol. It is a cytotoxic oxidation product and can be detected by its characteristic absorbance
peak at a wavelength of 490 nm. No further metabolites of isoproterenol in cell culture medium could
be measured, because the detectors were not sensitive enough. Samples were first centrifuged (5 min,
4 °C at 15000 g) to remove cells and cell debris, to avoid clogging of the HPLC. Samples were
Results
74
separated on a C18 column and relatively quantified. Previous studies showed a short plasma half-life
of isoproterenol of about 5 min [201, 208-210]. According to this plasma half-life, isoproterenol
should be degraded between two dosages during the repeated treatment. Since the time interval
between each dose was at least 30 min. To check this hypothesis, both detectors were calibrated and
optimized for the detection of isoproterenol and isoprenochrome. Therefore, a dilution series of
isoproterenol in cell culture medium was prepared on ice to avoid the degradation of isoproterenol.
Additionally, the isoproterenol stock was mixed with caffeine. Caffeine can be used for the calibration
of the diode array detector and is stable under the experimental conditions. Both substances could be
separated and detected, see Figure 4-8. Isoproterenol (X) was detected at a retention time of about
8 min. Caffeine (#) was detected at a retention time of about 21 min. Furthermore, unidentified
compounds of the cell culture medium (M) were detected in addition to isoproterenol and caffeine.
However, these compound peaks were separated from the isoproterenol and caffeine peaks. The peak
area of the isoproterenol peak and the peak area of the caffeine peak correlated linear with the
increasing concentrations of both substances, see Figure 4-8 I) and J). A tailing effect of the peaks
could be observed at higher concentration of isoproterenol and at higher concentrations of caffeine.
However, this effect could only be observed at concentrations above the experimental concentrations.
The linear correlation between the peak area and the concentration was still given.
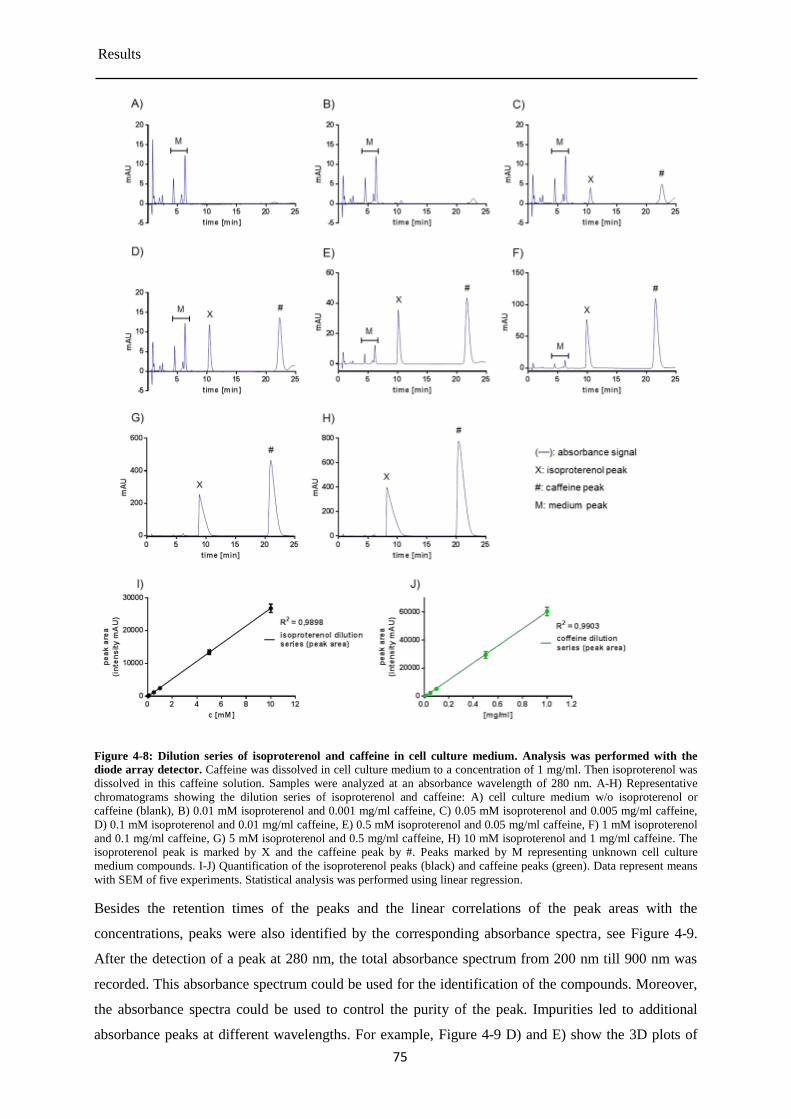
Results
75
Figure 4-8: Dilution series of isoproterenol and caffeine in cell culture medium. Analysis was performed with the
diode array detector. Caffeine was dissolved in cell culture medium to a concentration of 1 mg/ml. Then isoproterenol was
dissolved in this caffeine solution. Samples were analyzed at an absorbance wavelength of 280 nm. A-H) Representative
chromatograms showing the dilution series of isoproterenol and caffeine: A) cell culture medium w/o isoproterenol or
caffeine (blank), B) 0.01 mM isoproterenol and 0.001 mg/ml caffeine, C) 0.05 mM isoproterenol and 0.005 mg/ml caffeine,
D) 0.1 mM isoproterenol and 0.01 mg/ml caffeine, E) 0.5 mM isoproterenol and 0.05 mg/ml caffeine, F) 1 mM isoproterenol
and 0.1 mg/ml caffeine, G) 5 mM isoproterenol and 0.5 mg/ml caffeine, H) 10 mM isoproterenol and 1 mg/ml caffeine. The
isoproterenol peak is marked by X and the caffeine peak by #. Peaks marked by M representing unknown cell culture
medium compounds. I-J) Quantification of the isoproterenol peaks (black) and caffeine peaks (green). Data represent means
with SEM of five experiments. Statistical analysis was performed using linear regression.
Besides the retention times of the peaks and the linear correlations of the peak areas with the
concentrations, peaks were also identified by the corresponding absorbance spectra, see Figure 4-9.
After the detection of a peak at 280 nm, the total absorbance spectrum from 200 nm till 900 nm was
recorded. This absorbance spectrum could be used for the identification of the compounds. Moreover,
the absorbance spectra could be used to control the purity of the peak. Impurities led to additional
absorbance peaks at different wavelengths. For example, Figure 4-9 D) and E) show the 3D plots of
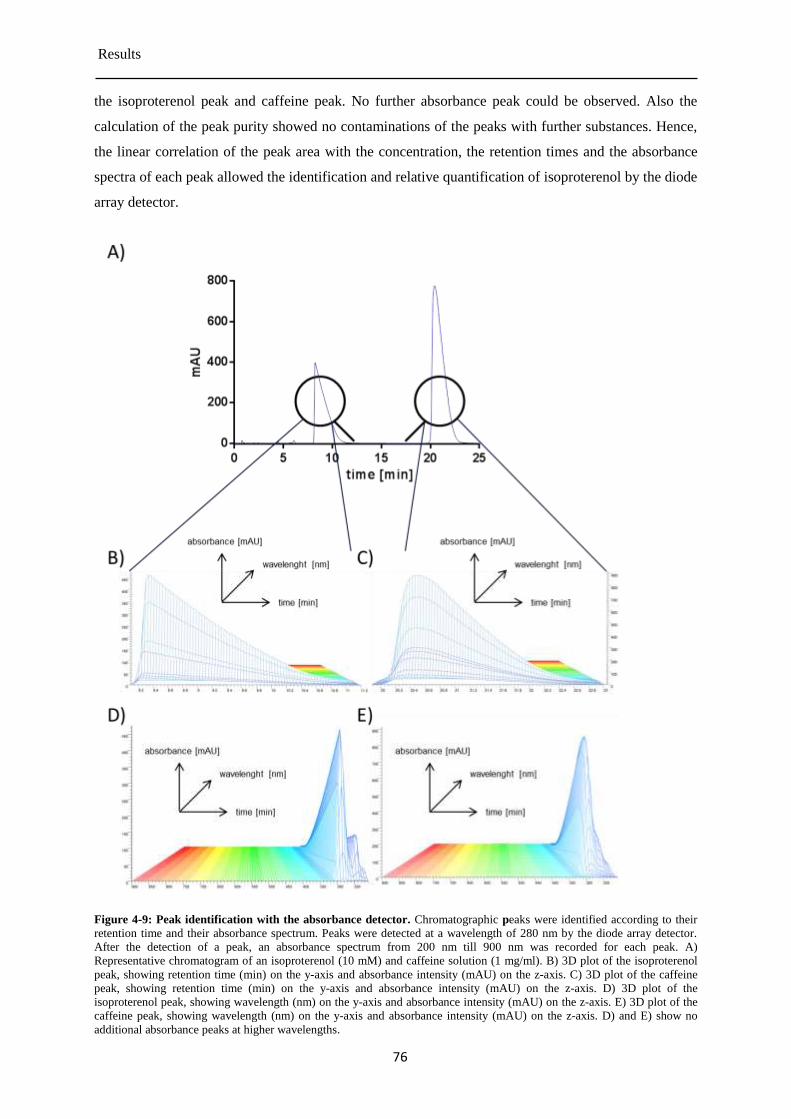
Results
76
the isoproterenol peak and caffeine peak. No further absorbance peak could be observed. Also the
calculation of the peak purity showed no contaminations of the peaks with further substances. Hence,
the linear correlation of the peak area with the concentration, the retention times and the absorbance
spectra of each peak allowed the identification and relative quantification of isoproterenol by the diode
array detector.
Figure 4-9: Peak identification with the absorbance detector. Chromatographic peaks were identified according to their
retention time and their absorbance spectrum. Peaks were detected at a wavelength of 280 nm by the diode array detector.
After the detection of a peak, an absorbance spectrum from 200 nm till 900 nm was recorded for each peak. A)
Representative chromatogram of an isoproterenol (10 mM) and caffeine solution (1 mg/ml). B) 3D plot of the isoproterenol
peak, showing retention time (min) on the y-axis and absorbance intensity (mAU) on the z-axis. C) 3D plot of the caffeine
peak, showing retention time (min) on the y-axis and absorbance intensity (mAU) on the z-axis. D) 3D plot of the
isoproterenol peak, showing wavelength (nm) on the y-axis and absorbance intensity (mAU) on the z-axis. E) 3D plot of the
caffeine peak, showing wavelength (nm) on the y-axis and absorbance intensity (mAU) on the z-axis. D) and E) show no
additional absorbance peaks at higher wavelengths.
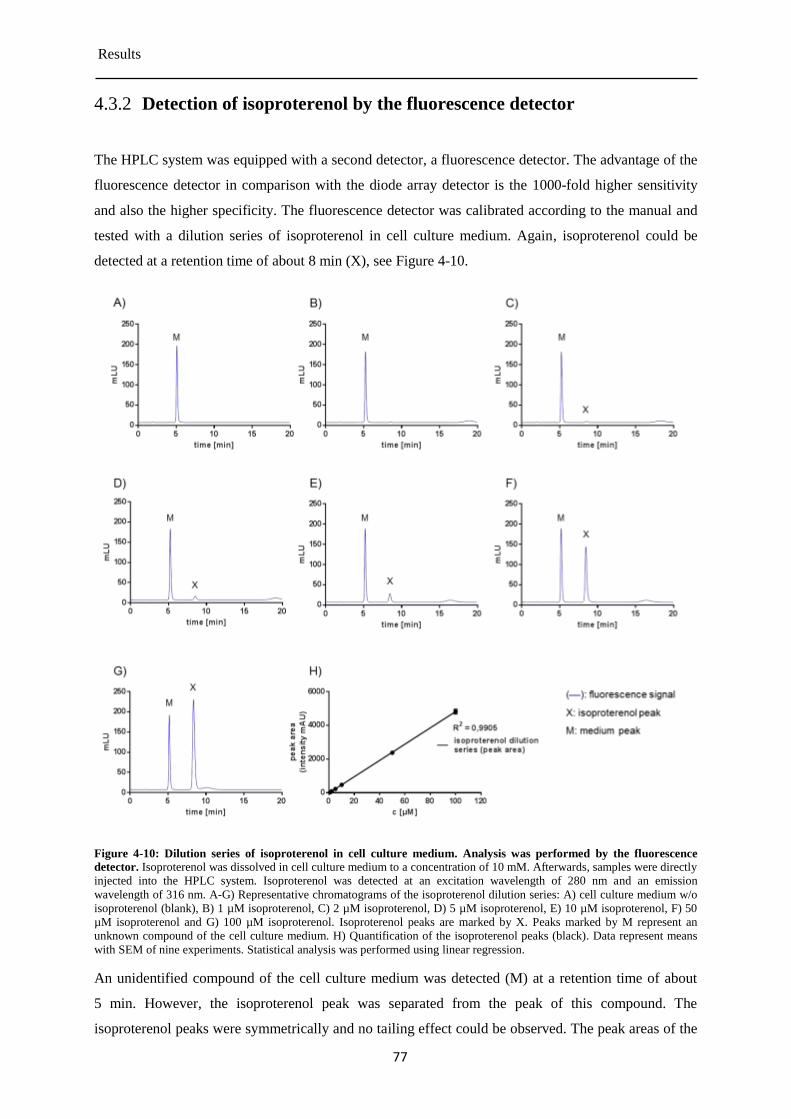
Results
77
Detection of isoproterenol by the fluorescence detector 4.3.2
The HPLC system was equipped with a second detector, a fluorescence detector. The advantage of the
fluorescence detector in comparison with the diode array detector is the 1000-fold higher sensitivity
and also the higher specificity. The fluorescence detector was calibrated according to the manual and
tested with a dilution series of isoproterenol in cell culture medium. Again, isoproterenol could be
detected at a retention time of about 8 min (X), see Figure 4-10.
Figure 4-10: Dilution series of isoproterenol in cell culture medium. Analysis was performed by the fluorescence
detector. Isoproterenol was dissolved in cell culture medium to a concentration of 10 mM. Afterwards, samples were directly
injected into the HPLC system. Isoproterenol was detected at an excitation wavelength of 280 nm and an emission
wavelength of 316 nm. A-G) Representative chromatograms of the isoproterenol dilution series: A) cell culture medium w/o
isoproterenol (blank), B) 1 µM isoproterenol, C) 2 µM isoproterenol, D) 5 µM isoproterenol, E) 10 µM isoproterenol, F) 50
µM isoproterenol and G) 100 µM isoproterenol. Isoproterenol peaks are marked by X. Peaks marked by M represent an
unknown compound of the cell culture medium. H) Quantification of the isoproterenol peaks (black). Data represent means
with SEM of nine experiments. Statistical analysis was performed using linear regression.
An unidentified compound of the cell culture medium was detected (M) at a retention time of about
5 min. However, the isoproterenol peak was separated from the peak of this compound. The
isoproterenol peaks were symmetrically and no tailing effect could be observed. The peak areas of the
Results
78
isoproterenol peaks correlated linear with the isoproterenol concentrations, see Figure 4-10 H). The
measured retention time of the isoproterenol peak was coincident with the retention time measured by
the diode array detector. However, it was not possible to calibrate the fluorescence detector for the
detection of isoprenochrome. The fluorescence detector did not provide further information’s on the
peak composition. Therefore, peaks had to be identified according to the retention times and their
relative retention times to the cell culture medium peak and if possible, by correlation with
information of the diode array detector.
Detection of isoprenochrome by the absorbance detector 4.3.3
Isoprenochrome is the aminochrome of isoproterenol. Aminochromes are oxidation products of
catecholamines and exhibit neuro- and cytotoxic properties. The formation of aminochromes involves
different oxidation steps with instable intermediates, including the formation of highly reactive
radicals. However, aminochromes are unstable and, therefore, must be synthesized in situ.
Catecholamines, including isoproterenol, can be chemically oxidized to the corresponding
aminochromes. The characteristic absorbance maxima at a wavelength of 490 nm distinguish them
from the catecholamines. To calibrate the diode array detector isoproterenol was oxidized with
different concentrations of sodium periodate (NaIO4), see Figure 4-11. On the one hand, increasing
concentrations of NaIO4 led to a decrease of the peak area of the isoproterenol peak (X), see Figure
4-11 left side (blue). On the other hand, increasing concentrations of NaIO4 led to an increase of the
peak area of the isoprenochrome peak, see Figure 4-11 left side (green).
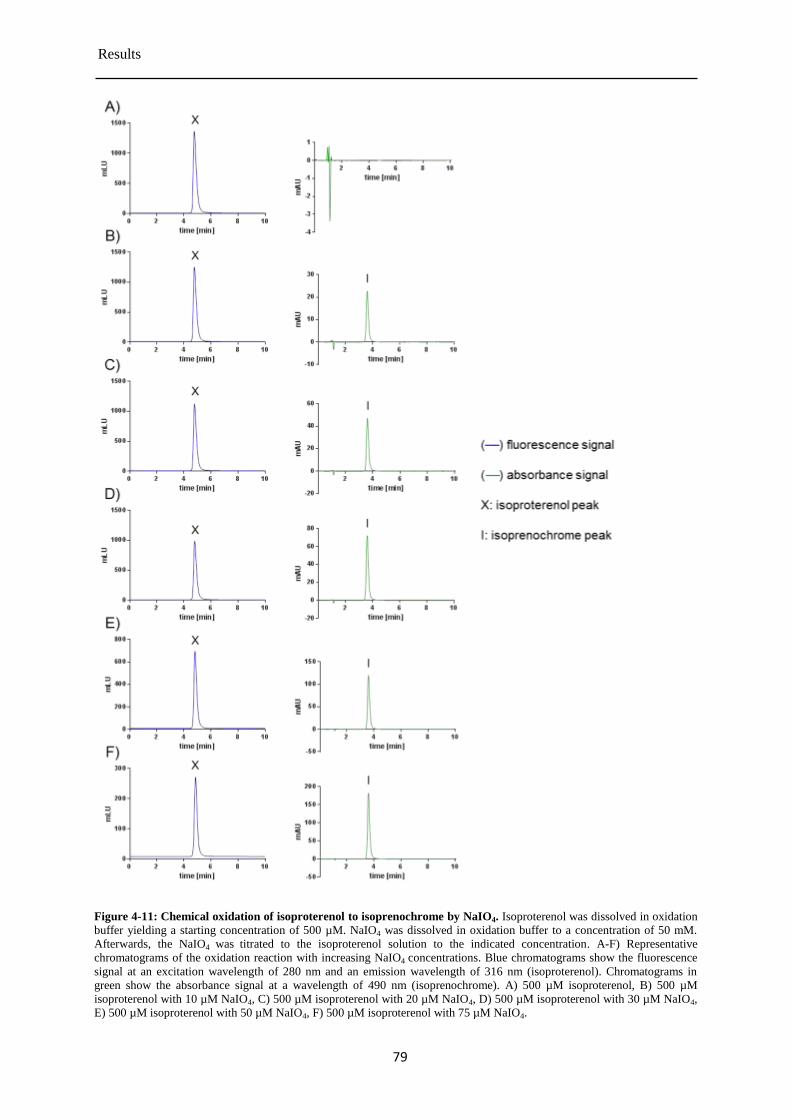
Results
79
Figure 4-11: Chemical oxidation of isoproterenol to isoprenochrome by NaIO4. Isoproterenol was dissolved in oxidation
buffer yielding a starting concentration of 500 µM. NaIO4 was dissolved in oxidation buffer to a concentration of 50 mM.
Afterwards, the NaIO4 was titrated to the isoproterenol solution to the indicated concentration. A-F) Representative
chromatograms of the oxidation reaction with increasing NaIO4 concentrations. Blue chromatograms show the fluorescence
signal at an excitation wavelength of 280 nm and an emission wavelength of 316 nm (isoproterenol). Chromatograms in
green show the absorbance signal at a wavelength of 490 nm (isoprenochrome). A) 500 µM isoproterenol, B) 500 µM
isoproterenol with 10 µM NaIO4, C) 500 µM isoproterenol with 20 µM NaIO4, D) 500 µM isoproterenol with 30 µM NaIO4,
E) 500 µM isoproterenol with 50 µM NaIO4, F) 500 µM isoproterenol with 75 µM NaIO4.
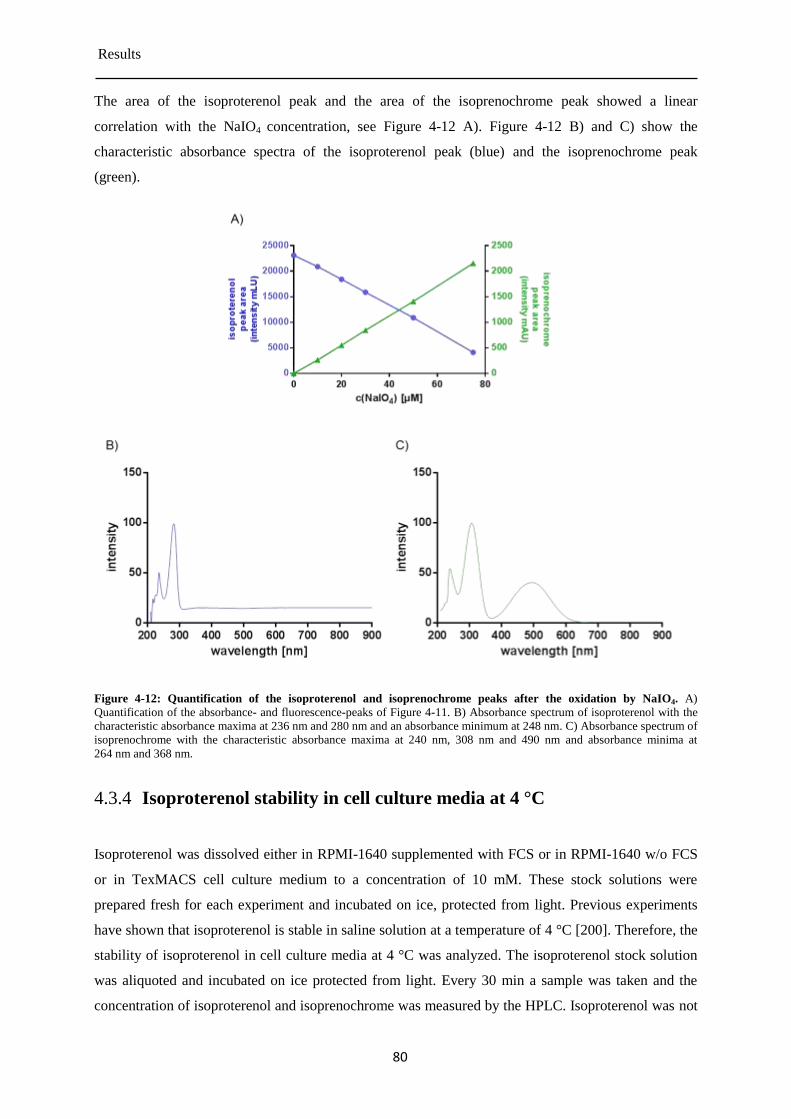
Results
80
The area of the isoproterenol peak and the area of the isoprenochrome peak showed a linear
correlation with the NaIO4 concentration, see Figure 4-12 A). Figure 4-12 B) and C) show the
characteristic absorbance spectra of the isoproterenol peak (blue) and the isoprenochrome peak
(green).
Figure 4-12: Quantification of the isoproterenol and isoprenochrome peaks after the oxidation by NaIO4. A)
Quantification of the absorbance- and fluorescence-peaks of Figure 4-11. B) Absorbance spectrum of isoproterenol with the
characteristic absorbance maxima at 236 nm and 280 nm and an absorbance minimum at 248 nm. C) Absorbance spectrum of
isoprenochrome with the characteristic absorbance maxima at 240 nm, 308 nm and 490 nm and absorbance minima at
264 nm and 368 nm.
Isoproterenol stability in cell culture media at 4 °C 4.3.4
Isoproterenol was dissolved either in RPMI-1640 supplemented with FCS or in RPMI-1640 w/o FCS
or in TexMACS cell culture medium to a concentration of 10 mM. These stock solutions were
prepared fresh for each experiment and incubated on ice, protected from light. Previous experiments
have shown that isoproterenol is stable in saline solution at a temperature of 4 °C [200]. Therefore, the
stability of isoproterenol in cell culture media at 4 °C was analyzed. The isoproterenol stock solution
was aliquoted and incubated on ice protected from light. Every 30 min a sample was taken and the
concentration of isoproterenol and isoprenochrome was measured by the HPLC. Isoproterenol was not
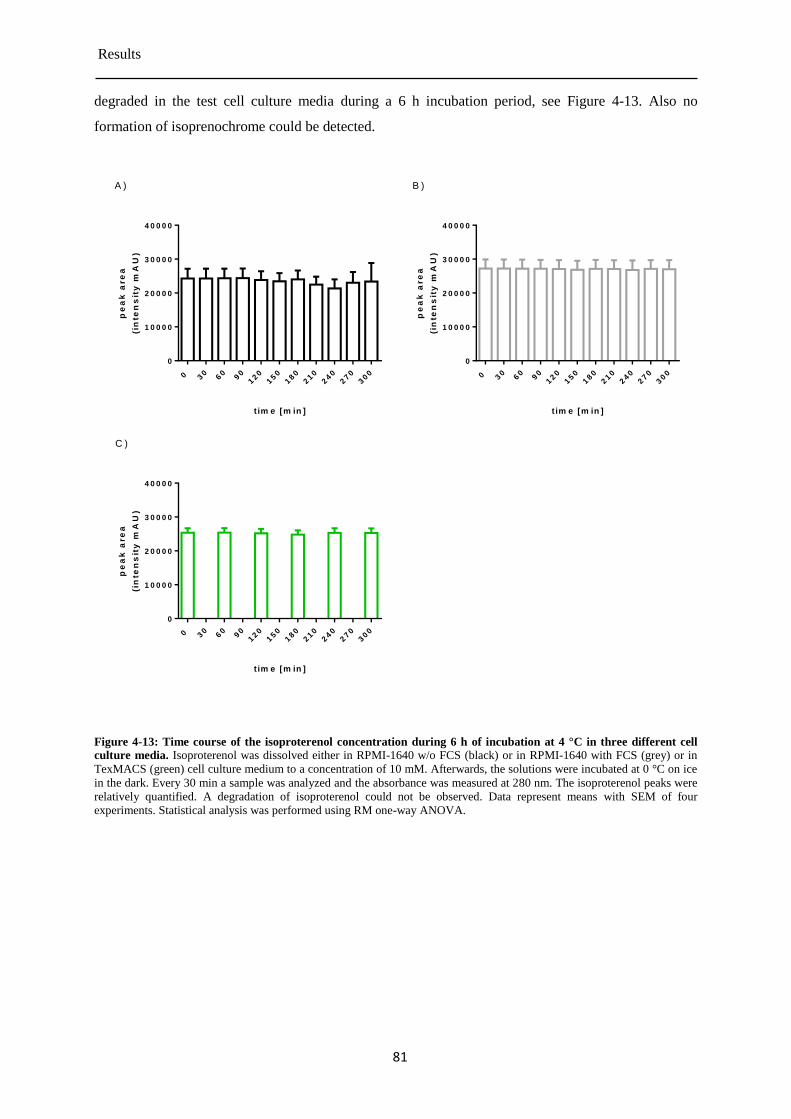
Results
81
degraded in the test cell culture media during a 6 h incubation period, see Figure 4-13. Also no
formation of isoprenochrome could be detected.
t im e [m in ]
pe
ak
are
a
(in
ten
sit
y m
AU
)
0
30
60
90
120
150
180
210
240
270
300
0
1 0 0 0 0
2 0 0 0 0
3 0 0 0 0
4 0 0 0 0
A )
t im e [m in ]p
ea
k a
re
a
(in
ten
sit
y m
AU
)
0
30
60
90
120
150
180
210
240
270
300
0
1 0 0 0 0
2 0 0 0 0
3 0 0 0 0
4 0 0 0 0
B )
t im e [m in ]
pe
ak
are
a
(in
ten
sit
y m
AU
)
0
30
60
90
120
150
180
210
240
270
300
0
1 0 0 0 0
2 0 0 0 0
3 0 0 0 0
4 0 0 0 0
C )
Figure 4-13: Time course of the isoproterenol concentration during 6 h of incubation at 4 °C in three different cell
culture media. Isoproterenol was dissolved either in RPMI-1640 w/o FCS (black) or in RPMI-1640 with FCS (grey) or in
TexMACS (green) cell culture medium to a concentration of 10 mM. Afterwards, the solutions were incubated at 0 °C on ice
in the dark. Every 30 min a sample was analyzed and the absorbance was measured at 280 nm. The isoproterenol peaks were
relatively quantified. A degradation of isoproterenol could not be observed. Data represent means with SEM of four
experiments. Statistical analysis was performed using RM one-way ANOVA.
Results
82
Isoproterenol stability in cell culture media at 37 °C 4.3.5
The HPLC system was used to investigate the isoproterenol stability under cell culture conditions and
to analyze the oxidation of isoproterenol. It is known that isoproterenol degrades in saline solution at
37 °C [200]. To test whether isoproterenol degrades also in cell culture medium and isoprenochrome is
formed, isoproterenol was dissolved in three different cell culture media. These three culture media
were RPMI-1640 supplemented with 10% FCS, RPMI-1640 w/o FCS and TexMACS. RPMI-1640 is a
basal cell culture medium which is commonly used for the cultivation of PBMCs. However, for long-
term culturing of cells supplementation with FCS is required. This has the following disadvantages:
first, the exact chemical composition of FCS is unknown and may vary between different lots [419].
Second, the growth factors and hormones present in FCS can stimulate receptors and induce signaling
processes [418]. This may interfere with signaling processes induced by the stimulation of the β2-AR.
Third, it is known that isoproterenol is bound by serum albumin, which is also present in FCS [207].
Therefore, RPMI-1640 was used with and without (w/o) supplementation of FCS. TexMACS is a cell
culture medium with a defined chemical composition. It was evolved for the culturing of immune cells
in a serum-free cell culture medium. Isoproterenol was dissolved to a concentration of 500 µM in each
of these cell culture media and incubated at 37 °C. At the beginning of the incubation and every 30
min after the start of the incubation, samples were analyzed by HPLC. The isoproterenol content
showed a significant degradation during six hours of incubation in RPMI-1640 cell culture medium
with FCS as well as in RPMI-1640 cell culture medium w/o FCS, see Figure 4-14 A) and C). In
contrast, isoproterenol incubated in TexMACS cell culture medium was minimally degraded, see
Figure 4-14 E). Samples prepared in RPMI-1640 cell culture medium with FCS and RPMI-1640 cell
culture medium w/o FCS showed an increase of isoprenochrome during the incubation time, see
Figure 4-14 B) and D). At point of time 0 min, no isoprenochrome could be detected. After 30 min of
incubation, isoprenochrome could be detected. After additional 150 min of incubation, the formation
of isoprenochrome reached a maximum. Afterwards, the amount of isoprenochrome decreases. This
indicats a degradation of isoprenochrome. Although there was no significant decrease of isoproterenol
in the TexMACS cell culture medium during the incubation period, a small amount of isoprenochrome
was formed, see Figure 4-14 F). In contrast to the RPMI-1640 cell culture medium with and w/o FCS,
the amount of isoprenochrome was quite stable during the six hour incubation period. Taken together
the HPLC setup can be used for the detection, identification and relative quantification of
isoproterenol and isoprenochrome in cell culture media.
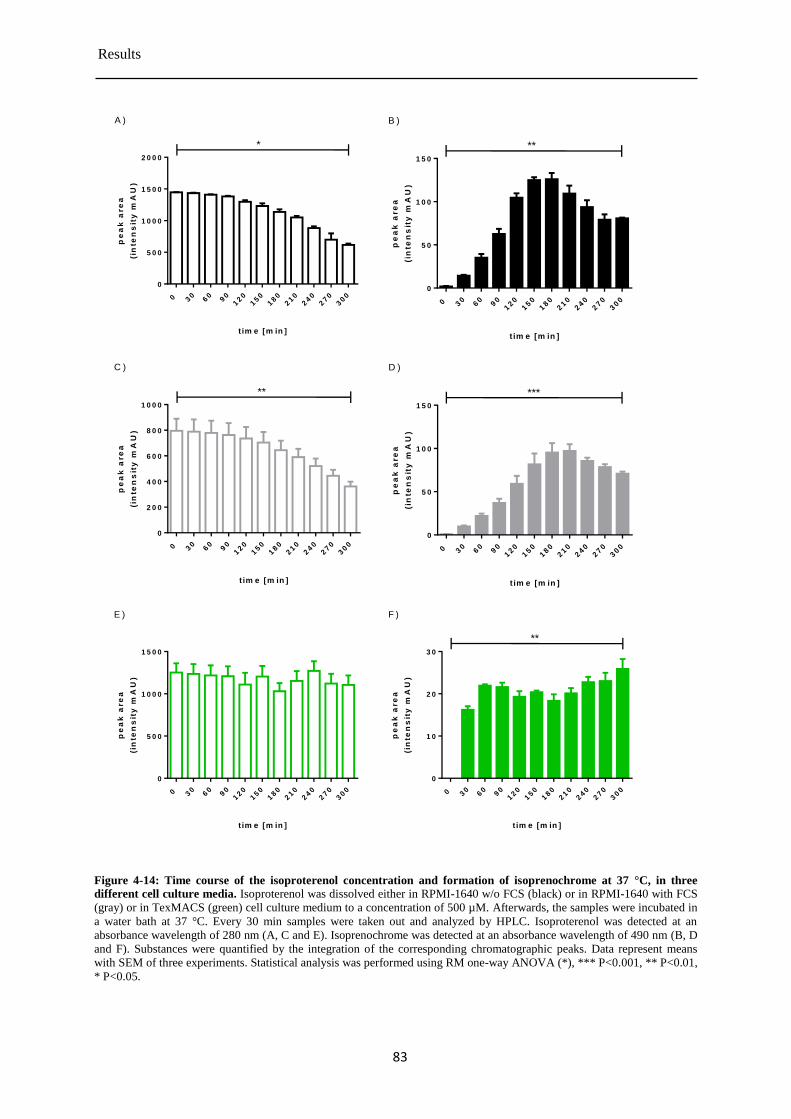
Results
83
t im e [m in ]
pe
ak
are
a
(in
ten
sit
y m
AU
)
0
30
60
90
120
150
180
210
240
270
300
0
5 0 0
1 0 0 0
1 5 0 0
2 0 0 0
*
A )
t im e [m in ]
pe
ak
are
a
(in
ten
sit
y m
AU
)
0
30
60
90
120
150
180
210
240
270
300
0
5 0
1 0 0
1 5 0
**
B )
t im e [m in ]
pe
ak
are
a
(in
ten
sit
y m
AU
)
0
30
60
90
120
150
180
210
240
270
300
0
2 0 0
4 0 0
6 0 0
8 0 0
1 0 0 0
**
C )
t im e [m in ]
pe
ak
are
a
(in
ten
sit
y m
AU
)
0
30
60
90
120
150
180
210
240
270
300
0
5 0
1 0 0
1 5 0
***
D )
t im e [m in ]
pe
ak
are
a
(in
ten
sit
y m
AU
)
0
30
60
90
120
150
180
210
240
270
300
0
5 0 0
1 0 0 0
1 5 0 0
E )
t im e [m in ]
pe
ak
are
a
(in
ten
sit
y m
AU
)
0
30
60
90
120
150
180
210
240
270
300
0
1 0
2 0
3 0
**
F )
Figure 4-14: Time course of the isoproterenol concentration and formation of isoprenochrome at 37 °C, in three
different cell culture media. Isoproterenol was dissolved either in RPMI-1640 w/o FCS (black) or in RPMI-1640 with FCS
(gray) or in TexMACS (green) cell culture medium to a concentration of 500 µM. Afterwards, the samples were incubated in
a water bath at 37 °C. Every 30 min samples were taken out and analyzed by HPLC. Isoproterenol was detected at an
absorbance wavelength of 280 nm (A, C and E). Isoprenochrome was detected at an absorbance wavelength of 490 nm (B, D
and F). Substances were quantified by the integration of the corresponding chromatographic peaks. Data represent means
with SEM of three experiments. Statistical analysis was performed using RM one-way ANOVA (*), *** P<0.001, ** P<0.01,
* P<0.05.
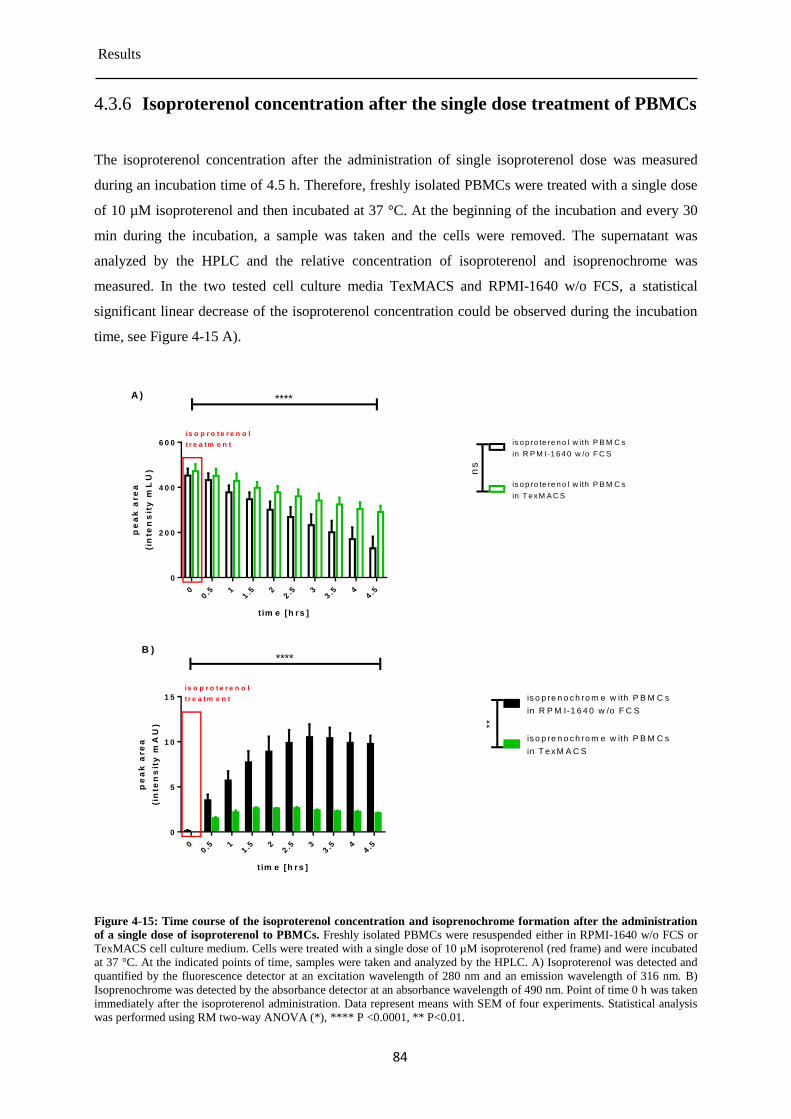
Results
84
Isoproterenol concentration after the single dose treatment of PBMCs 4.3.6
The isoproterenol concentration after the administration of single isoproterenol dose was measured
during an incubation time of 4.5 h. Therefore, freshly isolated PBMCs were treated with a single dose
of 10 µM isoproterenol and then incubated at 37 °C. At the beginning of the incubation and every 30
min during the incubation, a sample was taken and the cells were removed. The supernatant was
analyzed by the HPLC and the relative concentration of isoproterenol and isoprenochrome was
measured. In the two tested cell culture media TexMACS and RPMI-1640 w/o FCS, a statistical
significant linear decrease of the isoproterenol concentration could be observed during the incubation
time, see Figure 4-15 A).
t im e [h rs ]
pe
ak
are
a
(in
ten
sit
y m
LU
)
00.5 1
1.5 2
2.5 3
3.5 4
4.5
0
2 0 0
4 0 0
6 0 0 is o p ro te re n o l w ith P B M C s
in R P M I-1 6 4 0 w /o F C S
is o p ro te re n o l w ith P B M C s
in T exM A C S
ns
A )
is o p r o t e r e n o l
t r e a tm e n t
****
t im e [h rs ]
pe
ak
are
a
(in
ten
sit
y m
AU
)
00.5 1
1.5 2
2.5 3
3.5 4
4.5
0
5
1 0
1 5 is o p re n o c h ro m e w ith P B M C s
in R P M I-1 6 4 0 w /o F C S
is o p re n o c h ro m e w ith P B M C s
in T e x M A C S
B )
is o p r o t e r e n o l
t r e a tm e n t
**
****
Figure 4-15: Time course of the isoproterenol concentration and isoprenochrome formation after the administration
of a single dose of isoproterenol to PBMCs. Freshly isolated PBMCs were resuspended either in RPMI-1640 w/o FCS or
TexMACS cell culture medium. Cells were treated with a single dose of 10 µM isoproterenol (red frame) and were incubated
at 37 °C. At the indicated points of time, samples were taken and analyzed by the HPLC. A) Isoproterenol was detected and
quantified by the fluorescence detector at an excitation wavelength of 280 nm and an emission wavelength of 316 nm. B)
Isoprenochrome was detected by the absorbance detector at an absorbance wavelength of 490 nm. Point of time 0 h was taken
immediately after the isoproterenol administration. Data represent means with SEM of four experiments. Statistical analysis
was performed using RM two-way ANOVA (*), **** P <0.0001, ** P<0.01.
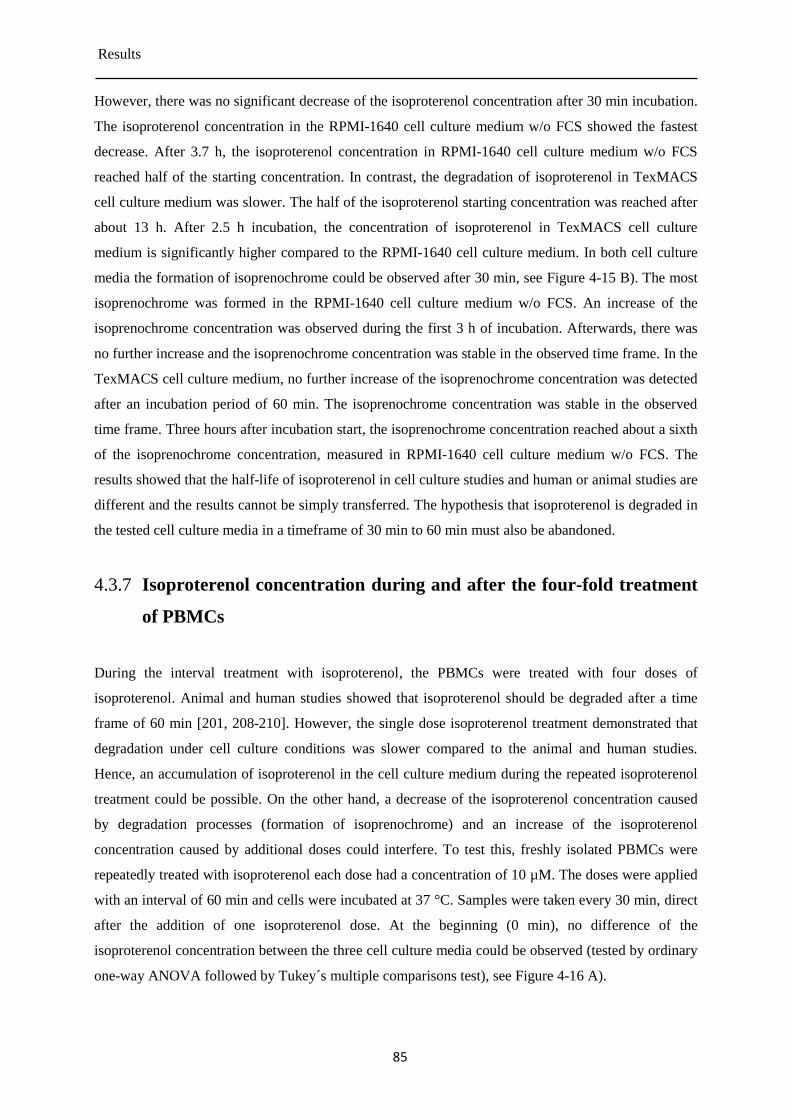
Results
85
However, there was no significant decrease of the isoproterenol concentration after 30 min incubation.
The isoproterenol concentration in the RPMI-1640 cell culture medium w/o FCS showed the fastest
decrease. After 3.7 h, the isoproterenol concentration in RPMI-1640 cell culture medium w/o FCS
reached half of the starting concentration. In contrast, the degradation of isoproterenol in TexMACS
cell culture medium was slower. The half of the isoproterenol starting concentration was reached after
about 13 h. After 2.5 h incubation, the concentration of isoproterenol in TexMACS cell culture
medium is significantly higher compared to the RPMI-1640 cell culture medium. In both cell culture
media the formation of isoprenochrome could be observed after 30 min, see Figure 4-15 B). The most
isoprenochrome was formed in the RPMI-1640 cell culture medium w/o FCS. An increase of the
isoprenochrome concentration was observed during the first 3 h of incubation. Afterwards, there was
no further increase and the isoprenochrome concentration was stable in the observed time frame. In the
TexMACS cell culture medium, no further increase of the isoprenochrome concentration was detected
after an incubation period of 60 min. The isoprenochrome concentration was stable in the observed
time frame. Three hours after incubation start, the isoprenochrome concentration reached about a sixth
of the isoprenochrome concentration, measured in RPMI-1640 cell culture medium w/o FCS. The
results showed that the half-life of isoproterenol in cell culture studies and human or animal studies are
different and the results cannot be simply transferred. The hypothesis that isoproterenol is degraded in
the tested cell culture media in a timeframe of 30 min to 60 min must also be abandoned.
Isoproterenol concentration during and after the four-fold treatment 4.3.7
of PBMCs
During the interval treatment with isoproterenol, the PBMCs were treated with four doses of
isoproterenol. Animal and human studies showed that isoproterenol should be degraded after a time
frame of 60 min [201, 208-210]. However, the single dose isoproterenol treatment demonstrated that
degradation under cell culture conditions was slower compared to the animal and human studies.
Hence, an accumulation of isoproterenol in the cell culture medium during the repeated isoproterenol
treatment could be possible. On the other hand, a decrease of the isoproterenol concentration caused
by degradation processes (formation of isoprenochrome) and an increase of the isoproterenol
concentration caused by additional doses could interfere. To test this, freshly isolated PBMCs were
repeatedly treated with isoproterenol each dose had a concentration of 10 µM. The doses were applied
with an interval of 60 min and cells were incubated at 37 °C. Samples were taken every 30 min, direct
after the addition of one isoproterenol dose. At the beginning (0 min), no difference of the
isoproterenol concentration between the three cell culture media could be observed (tested by ordinary
one-way ANOVA followed by Tukey´s multiple comparisons test), see Figure 4-16 A).
Results
86
t im e [h rs ]
pe
ak
are
a
(in
ten
sit
y m
LU
)
00.5 1
1.5 2
2.5 3
3.5 4
4.5 5
5.5 6
6.5 7
7.5 8
0
1 0 0 0
2 0 0 0
3 0 0 0
****
A )
is o p r o t e r e n o l
t r e a tm e n t
t im e [h rs ]
pe
ak
are
a
(on
ten
sit
y m
LU
)
00.5 1
1.5 2
2.5 3
3.5 4
4.5 5
5.5 6
6.5 7
7.5 8
0
1 0
2 0
3 0
4 0
is o p r o t e r e n o l
t r e a tm e n t
****B )
isopre
noc h
rom
e w
ith P
BM
Cs
in R
PM
I-1640 w
ith F
CS
isopre
noc h
rom
e w
ith P
BM
Cs
in T
exM
AC
S
isopre
noc h
rom
e w
ith P
BM
Cs
in R
PM
I-1640 w
/o F
CS
**
n s**
isopro
tere
nol w
ith P
BM
Cs
in R
PM
I-1640 w
ith F
CS
isopro
tere
nol w
ith P
BM
Cs
in T
exM
AC
S
isopro
tere
nol w
ith P
BM
Cs
in R
PM
I-1640 w
/o F
CS
**
n s*
Figure 4-16: Time course of the isoproterenol concentration and isoprenochrome formation during and after the four-
fold isoproterenol treatment of PBMCs. Freshly isolated PBMCs were resuspended either in RPMI-1640 w/o FCS or in
RPMI-1640 with FCS or TexMACS cell culture medium. Cells received an interval treatment with isoproterenol. Therefore,
cells were treated at the beginning and then at one-hour intervals with isoproterenol, each dose 10 µM (red frame). PBMCs
were incubated at 37 °C during the treatment. At the indicated points of time samples were analyzed by the HPLC. A)
Isoproterenol was detected and quantified by the fluorescence detector at an excitation wavelength of 280 nm and an
emission wavelength of 316 nm. B) Isoprenochrome was detected by the absorbance detector at an absorbance wavelength of
490 nm. Data represent means with SEM of four experiments. Statistical analysis was performed using RM two-way
ANOVA (*), comparing two cell culture conditions with each other, **** P <0.0001, ** P<0.01, * P<0.05.
Results
87
An increase of the isoproterenol concentration could be observed after each isoproterenol
administration (at 1 h, 2 h and 3 h, red boxes) in all tested cell culture media. A statistically significant
decrease of the isoproterenol concentration between isoproterenol administrations (at points in time
0.5, 1.5 and 2.5 h) could not be observed in the TexMACS as well as in the RPMI-1640 cell culture
medium with FCS. In contrast, the isoproterenol concentration in RPMI-1640 cell culture medium w/o
FCS showed a tendency to decrease. However, this decrease was statistical not significant. The
maximum of the isoproterenol concentration was reached after the fourth dosage in all three cell
culture media. The increase of the isoproterenol concentration in RPMI-1640 cell culture medium w/o
FCS was significantly lower compared to the isoproterenol concentration in the two other cell culture
media. The isoproterenol concentration decreased in all three culture media after 3 h. The decrease of
the isoproterenol concentration was uniformly in the TexMACS as well as in the RPMI-1640 cell
culture media with FCS, in the observed timeframe. In the RPMI-1640 w/o FCS the decline was
reduced after 7 h. The isoproterenol stability in TexMACS and in RPMI-1640 cell culture medium
with FCS was significantly higher compared with the isoproterenol stability in RPMI-1640 without
FCS. The formation of isoprenochrome showed some difference between the three cell culture media,
see Figure 4-16 B). The formation of isoprenochrome could be detected 30 min after the first
isoproterenol dosage. Also an increase during the isoproterenol treatment could be observed in all
three cell culture media. The maximum of the isoprenochrome concentration was observed 4.5 h after
the first isoproterenol administration, 1.5 h after the last isoproterenol administration. The increase of
the isoprenochrome concentration in the RPMI-1640 cell culture medium w/o FCS was higher
compared to the two other cell culture media. 4.5 h after the first isoproterenol administration the
isoprenochrome concentration in RPMI-1640 cell culture medium w/o FCS was about three times
higher compared with the isoprenochrome concentration in the two other cell culture media. In RPMI-
1640 cell culture medium w/o FCS a decline of the isoprenochrome concentration could be observed
after 4.5 h. In TexMACS and in RPMI-1640 cell culture medium with FCS this was not the case. The
results showed that during the isoproterenol administration no significant breakdown of the
isoproterenol was detected. Therefore, isoproterenol accumulated in the cell culture media. The
accumulation of isoproterenol in the cell culture medium should cause a constant stimulation of the β2-
AR instead of a repeated stimulation of the receptor.
Isoproterenol concentration during and after the eight-fold 4.3.8
treatment of PBMCs
Additional to the four-time interval isoproterenol treatment, PBMCs were also repeatedly stimulated
with eight doses of isoproterenol and the isoproterenol concentration was analyzed, see Figure 4-17.
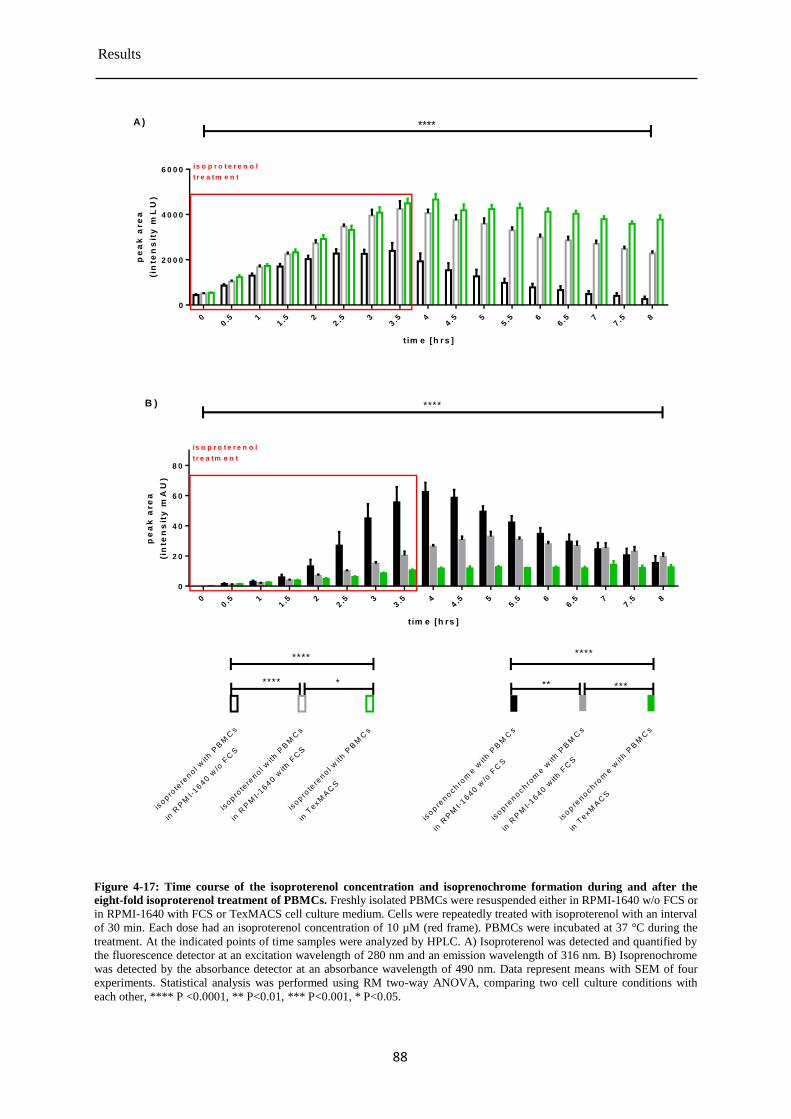
Results
88
t im e [h rs ]
pe
ak
are
a
(in
ten
sit
y m
LU
)
00.5 1
1.5 2
2.5 3
3.5 4
4.5 5
5.5 6
6.5 7
7.5 8
0
2 0 0 0
4 0 0 0
6 0 0 0is o p r o t e r e n o l
t r e a tm e n t
A ) ****
t im e [h rs ]
pe
ak
are
a
(in
ten
sit
y m
AU
)
00.5 1
1.5 2
2.5 3
3.5 4
4.5 5
5.5 6
6.5 7
7.5 8
0
2 0
4 0
6 0
8 0
is o p r o t e r e n o l
t r e a tm e n t
B ) ****
isopre
noc h
rom
e w
ith P
BM
Cs
in R
PM
I-1640 w
ith F
CS
isopre
noc h
rom
e w
ith P
BM
Cs
in T
exM
AC
S
isopre
noc h
rom
e w
ith P
BM
Cs
in R
PM
I-1640 w
/o F
CS
****
*****
isopro
tere
nol w
ith P
BM
Cs
in R
PM
I-1640 w
ith F
CS
isopro
tere
nol w
ith P
BM
Cs
in T
exM
AC
S
isopro
tere
nol w
ith P
BM
Cs
in R
PM
I-1640 w
/o F
CS
****
*****
Figure 4-17: Time course of the isoproterenol concentration and isoprenochrome formation during and after the
eight-fold isoproterenol treatment of PBMCs. Freshly isolated PBMCs were resuspended either in RPMI-1640 w/o FCS or
in RPMI-1640 with FCS or TexMACS cell culture medium. Cells were repeatedly treated with isoproterenol with an interval
of 30 min. Each dose had an isoproterenol concentration of 10 µM (red frame). PBMCs were incubated at 37 °C during the
treatment. At the indicated points of time samples were analyzed by HPLC. A) Isoproterenol was detected and quantified by
the fluorescence detector at an excitation wavelength of 280 nm and an emission wavelength of 316 nm. B) Isoprenochrome
was detected by the absorbance detector at an absorbance wavelength of 490 nm. Data represent means with SEM of four
experiments. Statistical analysis was performed using RM two-way ANOVA, comparing two cell culture conditions with
each other, **** P <0.0001, ** P<0.01, *** P<0.001, * P<0.05.
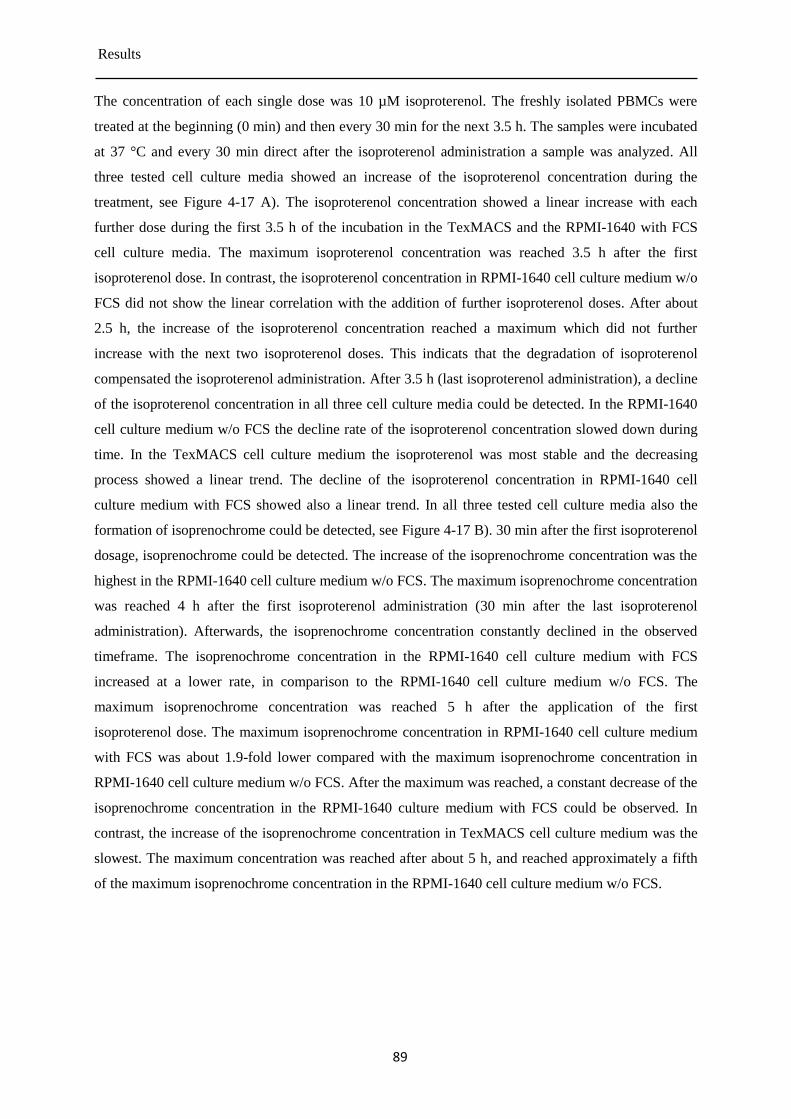
Results
89
The concentration of each single dose was 10 µM isoproterenol. The freshly isolated PBMCs were
treated at the beginning (0 min) and then every 30 min for the next 3.5 h. The samples were incubated
at 37 °C and every 30 min direct after the isoproterenol administration a sample was analyzed. All
three tested cell culture media showed an increase of the isoproterenol concentration during the
treatment, see Figure 4-17 A). The isoproterenol concentration showed a linear increase with each
further dose during the first 3.5 h of the incubation in the TexMACS and the RPMI-1640 with FCS
cell culture media. The maximum isoproterenol concentration was reached 3.5 h after the first
isoproterenol dose. In contrast, the isoproterenol concentration in RPMI-1640 cell culture medium w/o
FCS did not show the linear correlation with the addition of further isoproterenol doses. After about
2.5 h, the increase of the isoproterenol concentration reached a maximum which did not further
increase with the next two isoproterenol doses. This indicats that the degradation of isoproterenol
compensated the isoproterenol administration. After 3.5 h (last isoproterenol administration), a decline
of the isoproterenol concentration in all three cell culture media could be detected. In the RPMI-1640
cell culture medium w/o FCS the decline rate of the isoproterenol concentration slowed down during
time. In the TexMACS cell culture medium the isoproterenol was most stable and the decreasing
process showed a linear trend. The decline of the isoproterenol concentration in RPMI-1640 cell
culture medium with FCS showed also a linear trend. In all three tested cell culture media also the
formation of isoprenochrome could be detected, see Figure 4-17 B). 30 min after the first isoproterenol
dosage, isoprenochrome could be detected. The increase of the isoprenochrome concentration was the
highest in the RPMI-1640 cell culture medium w/o FCS. The maximum isoprenochrome concentration
was reached 4 h after the first isoproterenol administration (30 min after the last isoproterenol
administration). Afterwards, the isoprenochrome concentration constantly declined in the observed
timeframe. The isoprenochrome concentration in the RPMI-1640 cell culture medium with FCS
increased at a lower rate, in comparison to the RPMI-1640 cell culture medium w/o FCS. The
maximum isoprenochrome concentration was reached 5 h after the application of the first
isoproterenol dose. The maximum isoprenochrome concentration in RPMI-1640 cell culture medium
with FCS was about 1.9-fold lower compared with the maximum isoprenochrome concentration in
RPMI-1640 cell culture medium w/o FCS. After the maximum was reached, a constant decrease of the
isoprenochrome concentration in the RPMI-1640 culture medium with FCS could be observed. In
contrast, the increase of the isoprenochrome concentration in TexMACS cell culture medium was the
slowest. The maximum concentration was reached after about 5 h, and reached approximately a fifth
of the maximum isoprenochrome concentration in the RPMI-1640 cell culture medium w/o FCS.
Results
90
Isoproterenol concentration in cell culture media after a single 4.3.9
administration
Since PBMCs are able to take up, metabolize, store and syntheses catecholamines their influence on
the isoproterenol concentration and formation of isoprenochrome was analyzed. Therefore, the
experiments were repeated w/o PBMCs. 10 µM of isoproterenol were dissolved in the respective cell
culture medium and aliquoted like it was done before with the cell suspensions. The samples were
incubated at 37 °C, at indicated points in time samples were analyzed by the HPLC. In both cell
culture media a linear decrease of the isoproterenol concentration could be observed during the
incubation, see Figure 4-18.
t im e [h rs ]
pe
ak
are
a
(in
ten
sit
y m
LU
)
00.5 1
1.5 2
2.5 3
3.5 4
4.5
0
2 0 0
4 0 0
6 0 0 is o p ro te re n o l w /o P B M C s
in R P M I-1 6 4 0 w /o F C S
A )
is o p r o t e r e n o l
t r e a tm e n t
is o p ro te re n o l w /o P B M C s
in T e x M A C S w /o F C S
ns
****
t im e [h rs ]
pe
ak
are
a
(in
ten
sit
y m
AU
)
00.5 1
1.5 2
2.5 3
3.5 4
4.5
0
5
1 0
1 5 is o p re n o c h ro m e w /o P B M C s
in R P M I-1 6 4 0 w /o F C S
is o p re n o c h ro m e w /o P B M C s
in T e x M A C S
B )
is o p r o t e r e n o l
t r e a tm e n t
*
****
Figure 4-18: Time course of the isoproterenol concentration and isoprenochrome formation after the administration
of a single isoproterenol dose, in two different cell culture media RPMI-1640 w/o FCS and TexMACS. Isoproterenol
was dissolved either in RPMI-1640 w/o FCS or in TexMACS cell culture medium. A single dose of 10 µM isoproterenol (red
frame) was added to the respective cell culture medium and incubated at 37 °C. At indicated points of time samples were
taken and analyzed by the HPLC. A) Isoproterenol was detected and quantified by the fluorescence detector at an excitation
wavelength of 280 nm and an emission wavelength of 316 nm. B) Isoprenochrome was detected by the absorbance detector
at an absorbance wavelength of 490 nm. Point of time 0 h was taken immediately after the first isoproterenol administration.
Data represent means with SEM of four experiments. Statistical analysis was performed using RM two-way ANOVA (*),
comparing two cell culture conditions with each other, **** P <0.0001, ** P<0.01, * P<0.05.
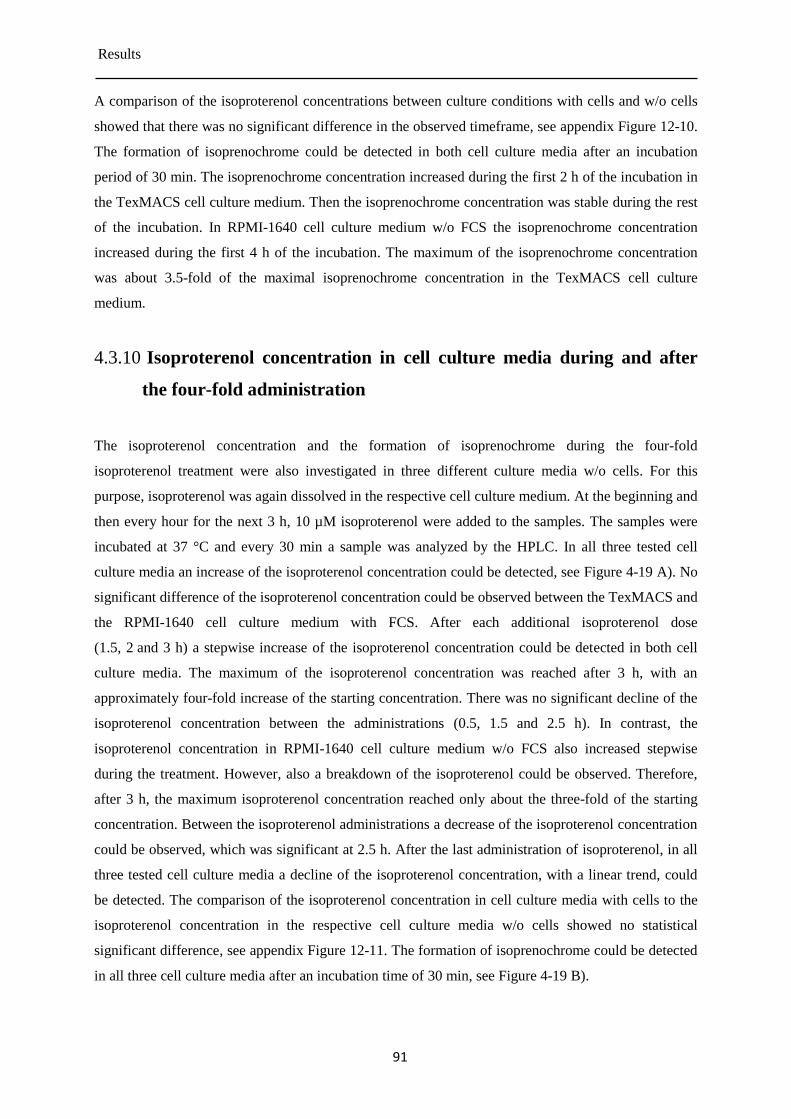
Results
91
A comparison of the isoproterenol concentrations between culture conditions with cells and w/o cells
showed that there was no significant difference in the observed timeframe, see appendix Figure 12-10.
The formation of isoprenochrome could be detected in both cell culture media after an incubation
period of 30 min. The isoprenochrome concentration increased during the first 2 h of the incubation in
the TexMACS cell culture medium. Then the isoprenochrome concentration was stable during the rest
of the incubation. In RPMI-1640 cell culture medium w/o FCS the isoprenochrome concentration
increased during the first 4 h of the incubation. The maximum of the isoprenochrome concentration
was about 3.5-fold of the maximal isoprenochrome concentration in the TexMACS cell culture
medium.
Isoproterenol concentration in cell culture media during and after 4.3.10
the four-fold administration
The isoproterenol concentration and the formation of isoprenochrome during the four-fold
isoproterenol treatment were also investigated in three different culture media w/o cells. For this
purpose, isoproterenol was again dissolved in the respective cell culture medium. At the beginning and
then every hour for the next 3 h, 10 µM isoproterenol were added to the samples. The samples were
incubated at 37 °C and every 30 min a sample was analyzed by the HPLC. In all three tested cell
culture media an increase of the isoproterenol concentration could be detected, see Figure 4-19 A). No
significant difference of the isoproterenol concentration could be observed between the TexMACS and
the RPMI-1640 cell culture medium with FCS. After each additional isoproterenol dose
(1.5, 2 and 3 h) a stepwise increase of the isoproterenol concentration could be detected in both cell
culture media. The maximum of the isoproterenol concentration was reached after 3 h, with an
approximately four-fold increase of the starting concentration. There was no significant decline of the
isoproterenol concentration between the administrations (0.5, 1.5 and 2.5 h). In contrast, the
isoproterenol concentration in RPMI-1640 cell culture medium w/o FCS also increased stepwise
during the treatment. However, also a breakdown of the isoproterenol could be observed. Therefore,
after 3 h, the maximum isoproterenol concentration reached only about the three-fold of the starting
concentration. Between the isoproterenol administrations a decrease of the isoproterenol concentration
could be observed, which was significant at 2.5 h. After the last administration of isoproterenol, in all
three tested cell culture media a decline of the isoproterenol concentration, with a linear trend, could
be detected. The comparison of the isoproterenol concentration in cell culture media with cells to the
isoproterenol concentration in the respective cell culture media w/o cells showed no statistical
significant difference, see appendix Figure 12-11. The formation of isoprenochrome could be detected
in all three cell culture media after an incubation time of 30 min, see Figure 4-19 B).
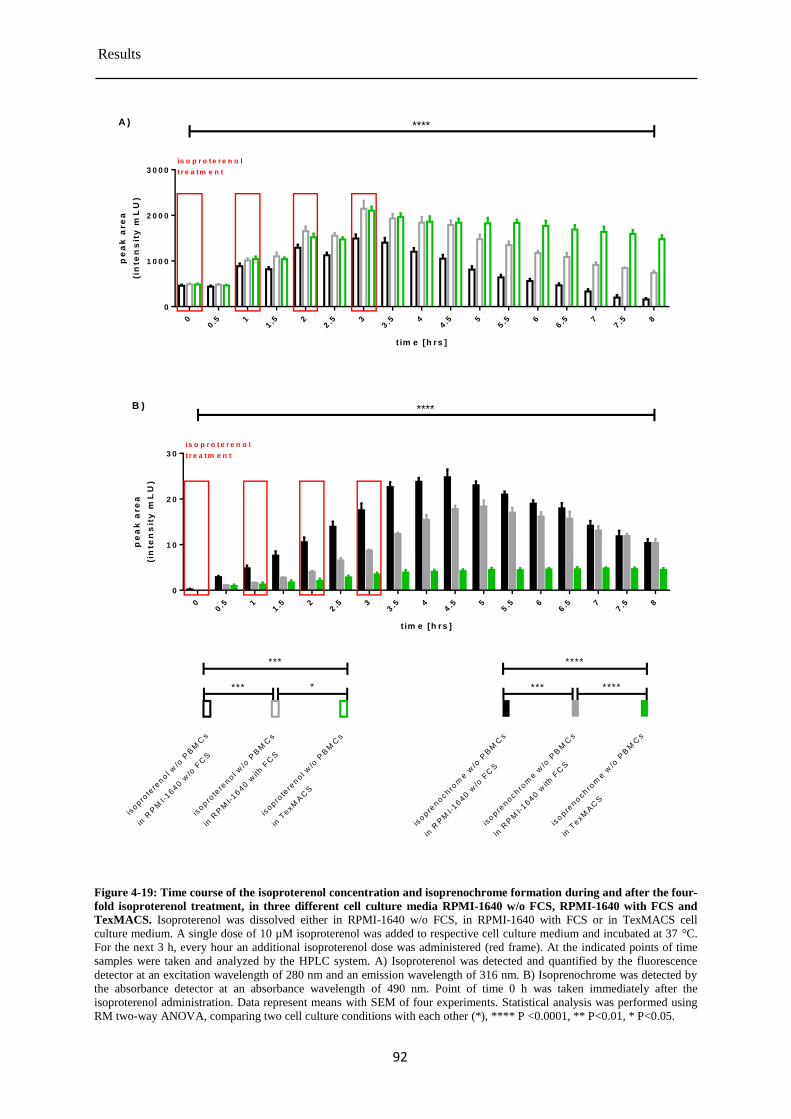
Results
92
t im e [h rs ]
pe
ak
are
a
(in
ten
sit
y m
LU
)
00.5 1
1.5 2
2.5 3
3.5 4
4.5 5
5.5 6
6.5 7
7.5 8
0
1 0 0 0
2 0 0 0
3 0 0 0
is o p r o t e r e n o l
t r e a tm e n t
****A )
t im e [h rs ]
pe
ak
are
a
(in
ten
sit
y m
LU
)
00.5 1
1.5 2
2.5 3
3.5 4
4.5 5
5.5 6
6.5 7
7.5 8
0
1 0
2 0
3 0
is o p r o t e r e n o l
t r e a tm e n t
****B )
isopre
noch
rom
e w
/o P
BM
Cs
in R
PM
I-1640 w
ith F
CS
isopre
noch
rom
e w
/o P
BM
Cs
in T
exM
AC
S
isopre
noch
rom
e w
/o P
BM
Cs
in R
PM
I-1640 w
/o F
CS
****
*******
isopro
tere
nol w
/o P
BM
Cs
in R
PM
I-1640 w
ith F
CS
isopro
tere
nol w
/o P
BM
Cs
in T
exM
AC
S
isopro
tere
nol w
/o P
BM
Cs
in R
PM
I-1640 w
/o F
CS
***
*** *
Figure 4-19: Time course of the isoproterenol concentration and isoprenochrome formation during and after the four-
fold isoproterenol treatment, in three different cell culture media RPMI-1640 w/o FCS, RPMI-1640 with FCS and
TexMACS. Isoproterenol was dissolved either in RPMI-1640 w/o FCS, in RPMI-1640 with FCS or in TexMACS cell
culture medium. A single dose of 10 µM isoproterenol was added to respective cell culture medium and incubated at 37 °C.
For the next 3 h, every hour an additional isoproterenol dose was administered (red frame). At the indicated points of time
samples were taken and analyzed by the HPLC system. A) Isoproterenol was detected and quantified by the fluorescence
detector at an excitation wavelength of 280 nm and an emission wavelength of 316 nm. B) Isoprenochrome was detected by
the absorbance detector at an absorbance wavelength of 490 nm. Point of time 0 h was taken immediately after the
isoproterenol administration. Data represent means with SEM of four experiments. Statistical analysis was performed using
RM two-way ANOVA, comparing two cell culture conditions with each other (*), **** P <0.0001, ** P<0.01, * P<0.05.
Results
93
The isoprenochrome concentration in TexMACS cell culture medium increased until 5 h after the
beginning of the incubation. Then it was stable until the end of the measurement. In both RPMI-1640
cell culture media a more rapid increase of the isoprenochrome concentration could be detected. In
RPMI-1640 cell culture medium w/o FCS the maximum of the isoprenochrome concentration could be
detected 4.5 h after the beginning of the incubation. It was about 5.6-fold higher compared with the
maximal concentration of isoprenochrome in the TexMACS cell culture medium. The maximal
isoprenochrome concentration in RPMI-1640 cell culture medium with FCS was achieved 30 min
later, 5 h after the first isoproterenol dose. It was about 4-fold higher compared with the maximal
isoprenochrome concentration in the TexMACS cell culture medium.
Isoproterenol concentration in cell culture media during and after 4.3.11
the eight-fold administration
The eight-fold interval treatment was also repeated w/o PBMCs, to investigate the isoproterenol
concentration and the formation of isoprenochrome during the treatment. The isoproterenol was
dissolved in one of the three cell culture media. Afterwards, a 10 µM dose was added to the respective
medium and samples were incubated at 37 °C. Every 30 min an additional 10 µM isoproterenol dose
was applied until the last dose was given after 3.5 h. Samples were analyzed every 30 min after the
beginning, by HPLC. In all three cell culture media a linear increase of the isoproterenol concentration
during the treatment could be observed, see Figure 4-20 A). During the first 3.5 h of the isoproterenol
treatment, no significant difference of the isoproterenol concentration in the cell culture media
TexMACS and RPMI-1640 with FCS could be detected. The maximum concentration was reached
after the last treatment, after 3.5 h. The maximal concentration in both cell culture media reached
about the 8-fold of the starting concentration. In RPMI-1640 cell culture media w/o FCS the increase
of the isoproterenol concentration was slower. The maximal concentration was also reached after the
last isoproterenol dosage. The highest isoproterenol concentration was reached with a 6-fold increase
of the starting concentration. This indicated a significant degradation of isoproterenol during the
treatment. After 3.5 h, a linear decrease of the isoproterenol concentration could be detected in both
RPMI-1640 media. In the TexMACS cell culture medium a small decline could be observed. At later
points in time, the isoproterenol concentration was stable until the end of the measurements. For none
of the three cell culture media, a difference of the isoproterenol concentration could be detected in the
presence of PBMCs compared with the respective cell culture medium in the absence of PBMCs.
After an incubation time of 0.5 h, the formation of isoprenochrome could be observed in all three cell
culture media, see Figure 4-20 B).The isoprenochrome concentration increased linear and reach a
maximum after 4 h in the RPMI-1640 cell culture medium w/o FCS. Afterwards, a constantly decline
of the isoprenochrome concentration could be observed until the end of the measurement. In the
RPMI-1640 cell culture medium with FCS only a small increase of the isoprenochrome concentration
Results
94
could be observed for the first 3 h of incubation. Between 3.5 and 6 h an increase of the isoproterenol
concentration could be observed. No decline of the isoprenochrome concentration could be detected
until the end of the measurement. A slow increase of the isoprenochrome concentration in TexMACS
cell culture medium could be detected. The maximal isoprenochrome concentration reached about a
fifth of the maximal isoprenochrome concentration in RPMI-1640 cell culture medium w/o FCS. This
maximum was achieved after 4.5 h of incubation time. Afterwards, the isoprenochrome content was
stable until the end of the measurement. Taken together the HPLC measurements demonstrated that
the half-life of isoproterenol under cell culture conditions is higher compared to the reported half-life
in animal and human studies. This also causes an accumulation of the isoproterenol in the cell culture
media during the repeated treatment. The degradation of isoproterenol in cell culture media is
associated with the formation of isoprenochrome. During this oxidation process free radicals and ROS
can be formed. The consequences of the formation of isoprenochrome and the unexpected high half-
life of isoproterenol on the performed studies will be discussed in the next section.
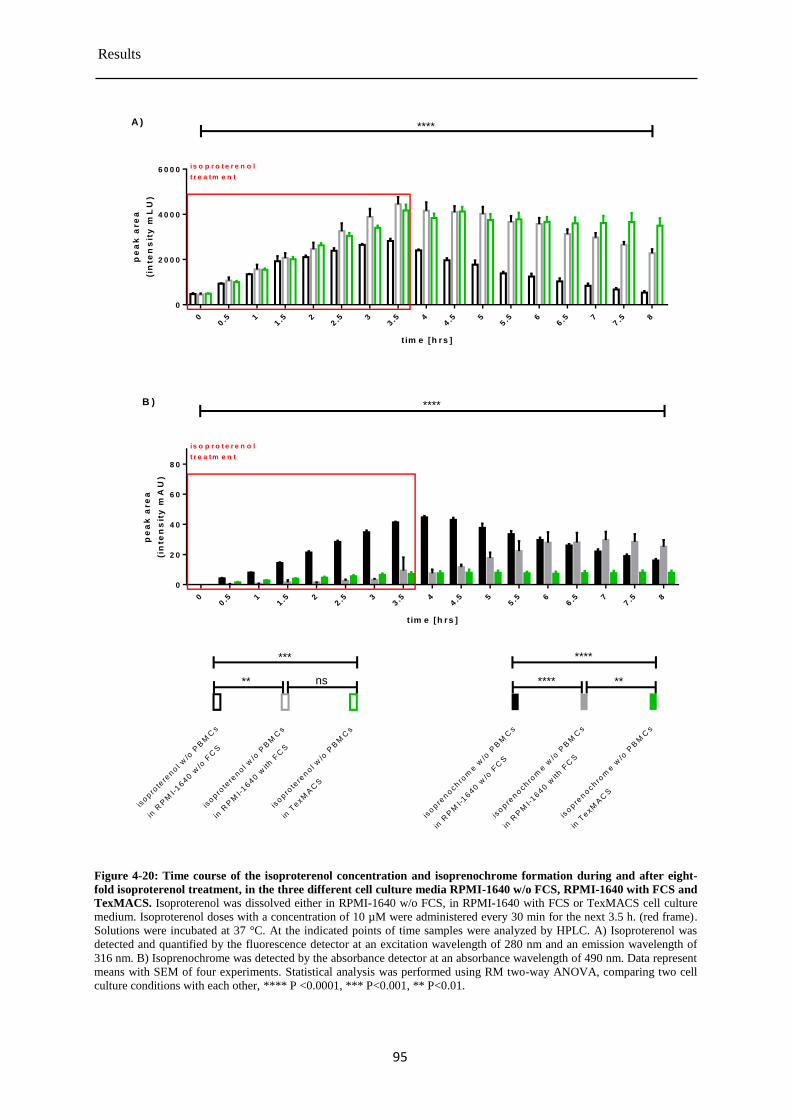
Results
95
t im e [h rs ]
pe
ak
are
a
(in
ten
sit
y m
LU
)
00.5 1
1.5 2
2.5 3
3.5 4
4.5 5
5.5 6
6.5 7
7.5 8
0
2 0 0 0
4 0 0 0
6 0 0 0is o p r o t e r e n o l
t r e a tm e n t
A ) ****
t im e [h rs ]
pe
ak
are
a
(in
ten
sit
y m
AU
)
00.5 1
1.5 2
2.5 3
3.5 4
4.5 5
5.5 6
6.5 7
7.5 8
0
2 0
4 0
6 0
8 0
is o p r o t e r e n o l
t r e a tm e n t
B )
isopre
noch
rom
e w
/o P
BM
Cs
in R
PM
I-1640 w
ith F
CS
isopre
noch
rom
e w
/o P
BM
Cs
in T
exM
AC
S
isopre
noch
rom
e w
/o P
BM
Cs
in R
PM
I-1640 w
/o F
CS
**** **
****
****
isopro
tere
nol w
/o P
BM
Cs
in R
PM
I-1640 w
ith F
CS
isopro
tere
nol w
/o P
BM
Cs
in T
exM
AC
S
isopro
tere
nol w
/o P
BM
Cs
in R
PM
I-1640 w
/o F
CS
***
ns**
Figure 4-20: Time course of the isoproterenol concentration and isoprenochrome formation during and after eight-
fold isoproterenol treatment, in the three different cell culture media RPMI-1640 w/o FCS, RPMI-1640 with FCS and
TexMACS. Isoproterenol was dissolved either in RPMI-1640 w/o FCS, in RPMI-1640 with FCS or TexMACS cell culture
medium. Isoproterenol doses with a concentration of 10 µM were administered every 30 min for the next 3.5 h. (red frame).
Solutions were incubated at 37 °C. At the indicated points of time samples were analyzed by HPLC. A) Isoproterenol was
detected and quantified by the fluorescence detector at an excitation wavelength of 280 nm and an emission wavelength of
316 nm. B) Isoprenochrome was detected by the absorbance detector at an absorbance wavelength of 490 nm. Data represent
means with SEM of four experiments. Statistical analysis was performed using RM two-way ANOVA, comparing two cell
culture conditions with each other, **** P <0.0001, *** P<0.001, ** P<0.01.
Discussion
96
5 Discussion
In the last decades, it became clear that psychological stress can influence many physiological
functions of the human body [4, 25, 152]. Especially, studies which investigated the influence of
chronic stress could demonstrate, at least partially, the adverse effect of stress on the human health
[71, 72, 83, 429]. In particular, the influence of chronic stress on the immune system is of special
interest. Although the connection between stress and the immune system is under investigation and
many lessons have been learned at the last decades, there are still open questions. The influence of
stress on the genomic stability becomes a new interesting research field. Several human-, animal- and
cell studies demonstrate the influence of stress on the genomic stability and its association with the
development and progression of cancer [27, 30, 32, 73, 379, 400, 401]. For instance, previous studies
suggest an accelerated aging of PTSD patients [82]. PBMCs isolated from PTSD patients have an
accumulation of DNA strand breaks [83]. Furthermore, dysregulation of DNA repair genes could be
observed in PBMCs of PTSD patients (Judy Salzwedel, personal communication). PTSD can be
considered as chronic stress model because PTSD patients have a chronically elevated level of stress
compared to healthy people. On a molecular level, an increase of catecholamine levels in the blood
and urine is observed in PTSD patients [57, 59-61]. Stress hormones, especially catecholamines, can
influence the genomic stability [399]. Catecholamines bind to ARs which are present on various cell
types, including immune cells. The subsequent downstream signaling influence physiological
processes which influence the cancer progression. Moreover, catecholamine can induce DNA damage
by various mechanisms, such as chemical or enzymatically degradation processes, but also by
signaling processes of the β2-AR [400, 401]. The combination of the following findings leads to the
hypothesis that “chronic stress induces DNA damage via the repeated stimulation of the β2-AR by
catecholamines”: PBMCs of PTSD patients have more DNA damage compared to healthy control
persons, animal- and human studies of chronic stress showed an increase of DNA damage in stressed
subjects, catecholamines can induce DNA damage by the formation of ROS and repeated stimulation
of the β2-AR by catecholamines can induce the accumulation of DNA strand breaks in human cancer
cell lines, repeated treatment of mice with isoproterenol could induce a senescence like phenotype in
myocardiac cells. To prove this hypothesis and to identify biomarkers of stress in PBMCs, an ex vivo
model for the repeated release of catecholamines was previously established by Schumacher and
Moreno-Villanueva [405]. Therefore, PBMCs of healthy volunteers were isolated and repeatedly
treated with isoproterenol, a synthetic sympathomimetic drug. PBMCs were chosen because of the
pervious findings in PTSD patients. Moreover, PBMCs are primary human immune cells which can
easily be obtained by a minimal invasive procedure. PBMCs of PTSD patients were not selected for
several reasons: PTSD patients have a high rate of comorbidities which can influence immune cells,
available cell material is limited, and diagnosis of PTSD is based on an assessment of the subject by a
Discussion
97
medical psychotherapist and not by the investigation of biomarkers. Moreover, PBMCs are primary
cells, therefore, they are closer related to the in vivo situation than cell lines. Cell lines often have a
different functional phenotype compared to their cognate primary cells [430]. However, the use of
primary cells also has some disadvantages, which must be taken into account. For example, the cell
material is more limited, the genomic variability between donors can influence the statistical power of
the experiments and the results. Additional, PBMCs are no homogenous cell population. They consist
out of different subpopulations, such as T cells, B cells, natural killer cells and monocytes. The exact
composition of the subpopulation can vary between donors and also between sample points of time.
PBMCs can be affected by diet, life style and medication of the donor and also by environmental
influences which could not be controlled in this study. The common used density centrifugation
method for isolation of PBMCs allows not the complete removal of other blood cells like erythrocytes
and thrombocytes. Hence, these cells can contaminate the isolated PBMCs. Isoproterenol was chosen
instead of epinephrine to stimulate the β2-AR, because it is often used in cell studies, unlike to
epinephrine, it selectively binds to β-ARs. Isolated PBMCs were cultured in a standard RPMI-1640
cell culture medium w/o the supplementation of fetal calf serum. Since FCS is a complex and
undefined mixture of various proteins, hormones, and growth factors which can affect the signaling
processes of the β2-AR. Investigation of the signaling pathways usually requires a serum starvation,
because many of the signal transducers, such as kinases, are shared by many different signaling
pathways. Hence, the simultaneously activation of signaling pathways by different stimuli can induce
an overlay of the different signal processes. This makes it difficult or impossible to analyze the signal
of interest. Additional, one of the main components of FCS is serum albumin which is known to bind
various small molecules, including isoproterenol [207, 431]. Moreover, FCS can stimulate the
cytokine production of PBMCs, especially the production of IL-2 was increased, and change their
immune response [418]. Withdrawal of FCS has also same adverse effect, because the cell tended to
adhere [405]. Therefore, the cells were incubated in a shaking water bath which reduced the observed
adherence. Only a small reduction of the cell viability of approximately 6% could be observed under
these culture conditions after 24 h of incubation, see appendix Figure 10Figure 12-1 [421]. Longer
incubation times of 48 h or 72 h, under serum starvation, reduced the cell viability (data not shown).
Therefore, experiments with longer incubation times than 24 h were not performed in RPMI-1640 cell
culture medium w/o FCS. In order to overcome this problem in experiments which required a longer
incubation period, PBMCs were cultured in TexMACS cell culture medium. TexMACS is a cell
culture medium that was developed for the culturing of immune cells without the supplementation of
FCS [432]. However, TexMACS cell culture medium contains human serum albumin. For some
comparative experiments (HPLC measurements) also RPMI-1640 cell culture medium supplemented
with FCS was used. Hara et al. used subcutaneously implanted osmotic pumps for the continuously
infusion of isoproterenol 30 mg kg-1
d-1
for 28 days in mice to simulate chronic stress and the repeated
release of catecholamines [400]. Cell lines were treated every 12 h with 10 µM isoproterenol for
Discussion
98
3 days. This treatment protocol was not feasible for the treatment of PBMCs, because of the long
incubation time. Therefore, a new treatment protocol was used. PBMCs were treated either with a
single dose of isoproterenol (10 µM), or with four doses of isoproterenol (10 µM each dose) with an
interval of 1 h between each dose, or with eight doses of isoproterenol (10 µM each dose) with an
interval of 30 min between each dose. Each sample was treated every 30 min until the last
isoproterenol dose was administered. At points in time when the samples were not treated with
isoproterenol, 1-fold and 4-fold treatments, samples got the solvent administered. An administration of
10 µM isoproterenol is a commonly used dose in cell culture experiments. Since this dose leads to a
maximum cAMP response in the cells, including PBMCs [433]. Using this ex vivo model of the
release of catecholamines during chronic stress, some interesting findings have been obtained which
prepared the basis of the presented thesis. The repeated 8-fold isoproterenol treatment induced the
formation of DNA strand breaks 6.5 h after the first isoproterenol administration, see appendix Figure
12-2 [421]. The treatment of PBMCs with a dose of 10 µM propranolol alone, a dose which is
sufficient to block the cAMP signaling of the β2-AR (see Figure 4-1), did not induce the formation of
DNA strand breaks. In contrast, the administration of 10 µM of propranolol 10 min before the start of
the repeated isoproterenol treatment could significantly reduce the amount of DNA strand breaks, see
appendix Figure 12-2 [421].
5.1 Isoproterenol mediated DNA damage
Pretreatment with propranolol could not completely inhibit the formation of DNA strand breaks. This
indicates that additional processes must be responsible for the formation of DNA strand breaks. Hara
et al. hypothesized the formation of DNA strand breaks is caused by the cAMP/PKA signaling
pathway which causes the generation of ROS [400]. According to this hypothesis, the ROS formation
and the resulting DNA damage should be completely blocked by the propranolol which is not the case
in our experiments. However, there are other mechanisms for the formation of ROS that could not be
inhibited by propranolol. Isoproterenol can be oxidized to isoprenochrome extracellular as well as
intracellular. In both cases the formation of free radicals and ROS could be observed, discussed in
section 5.1.1. Recent data indicate that isoproterenol may act as biased agonist of α-ARs [434].
Although the presence of α-ARs at the surface of immune cells is still under discussion, there is some
evidence for their presence. For example, the selective and potent α2-AR antagonist, yohimbine, binds
to human lymphocytes [435]. T cells express the mRNA of α-ARs [436]. Natural killer cells express
α1- as well as α2-adrenergic receptors [437]. Activation of β2-AR by agonists can induce the expression
of α-ARs at monocytes [438, 439]. However, ROS can induce DNA single as well as double-strand
breaks which are well known to activate PARP1. The binding to DNA strand breaks activates the
enzymatically activity of PARP1 and leads to the formation of PAR. PARP1 as well as PAR are
Discussion
99
important for the repair of the DNA strand breaks, because both recruit and modulate the activity of
further DNA repair factors. Therefore, the capacity of PARPs to form PAR was measured 24 h after
the first isoproterenol administration, see appendix Figure 12-4 [421]. The repeated isoproterenol
treatment affected the capacity of PARP1 to form PAR in some cells. The more isoproterenol doses
were administered, the more cells showed a lower capacity to form PAR. In addition to DNA strand
breaks, there are two main factors that influence the PAR formation. On the one hand the expression
of PARP1 as the main contributor to the PAR formation. On the other hand, the cellular NAD+
content, because NAD+ is the substrate for PAR formation [440]. Therefore, the intracellular NAD
+
content was measured during the 8-fold isoproterenol treatment and 24 h after administration of the
first isoproterenol dose, see Figure 4-2. The 8-fold repeated isoproterenol treatment induced a
reduction of the cellular NAD+
content, discussed in section 5.1.2. However, also the PARP1 protein
level decreased after the repeated isoproterenol treatment, see appendix Figure 12-5 [421]. PARP1 is
known to be constitutive expressed in cells. The expression of the PARP1 mRNA was not regulated
by the repeated isoproterenol. However, a donor dependent decrease of the PARP1 protein level could
be observed, see appendix Figure 12-6 [421]. The PARP1 protein level was repeatedly measured in
three different subjects at different days. For each donor the measurement was repeated at least three
times. The results of the measurements for each subject were repeatable. Demonstrating the
differences of the PARP1 protein expression was no side effect of the experimental conditions. Hence,
the observed reduced PARP1 protein level must be caused by a breakdown of the protein. PARP1 can
be degraded by various types of enzymes which produce a specific pattern of protein fragments [441,
442]. A time course analysis of the PARP1 protein and posttranslational modifications and eventual
evolving protein fragments could give further information about the decrease. Moreover, the
fragmentation patterns can be associated with different kinds of cell death. An intra-individual
variability of the poly(ADP-ribosyl)ation capacity was observed in other studies [414]. To determine
whether the cellular NAD+ content or the PARP1 protein level is the limiting factor of the poly(ADP-
ribosyl)ation capacity of PBMCs, the PAR formation was analyzed under NAD+ saturated conditions.
This assay was developed earlier in the group by Kunzmann et al. [414]. The assay allows the
detection of the maximum intracellular PAR capacity in permeabilized cells. Since an oligonucleotide
mimics DNA strand breaks under saturated NAD+ concentrations. Using these conditions, no
difference of the PAR formation between control cells and isoproterenol treated cells could be
observed, see Figure 4-3. Therefore, the cellular NAD+ pools seem to be the limiting factor and not the
PARP1 protein level. However, it is possible that the influence of slightly reduced PARP1 protein
level could not be detected. Or the reduction of the PARP1 protein is compensated by other PARPs.
PARP2 and PARP3 can also be activated by DNA damages. PARP1 and PAR play also an important
role in the induction of apoptosis. Hyperactivation of PARP1 by DNA strand breaks induces a
depletion of cellular NAD+ and ATP pools. This leads to an energy crisis and subsequently to cell
death. Therefore, during apoptosis PARP1 is cleaved by caspases to preserve the NAD+ and ATP
Discussion
100
pools. However, there was no detectable caspase 3 or caspase 7 activity (data not shown), suggesting a
caspase independent apoptosis induction. The repeated isoproterenol treatment induced apoptosis in
treated PBMCs, see appendix Figure 12-7 [421]. Interestingly, as for the PARP1 protein level, also for
the isoproterenol-mediated apoptosis, a strong inter-individual variability could be observed. The
PBMCs of some donors undergo apoptosis, while the PBMCs of other donors seem to be more
resistant. It was previously shown that dobutamine, a synthetic catecholamine, can induce apoptosis in
PBMCs in a dose-dependent manner after 24 h and 48 h incubation, which was partially mediated by
the β2-AR [443]. In this study it was not possible to measure all of the biomarkers: DNA strand breaks,
NAD+ and ATP levels, PAR formation capacity, and apoptosis within the same subject. Therefore, it is
not possible to correlate the PARP1 protein level with the PAR capacity or the induction of apoptosis.
Follow-up studies should be performed to do this. Moreover, the kinetics of these biomarkers should
be measured between the 3.5 h and 24 h after the first isoproterenol treatment, in order to obtain
information on the timing of the cellular events. Since different scenarios could explain the observed
results. The isoproterenol induced DNA strand breaks could stimulate the PARP1 activity over longer
time periods. Resulting in a NAD+ pool depletion and subsequent in an energy crisis and apoptosis
[444]. The formed PAR polymer is degraded by PARG and the free PAR polymers can induce the
release of apoptosis-inducing factor (AIF) from the mitochondria and subsequently induce cell death
(Parthanatos) [310, 445-447]. Therefore, also the temporal and spatial cellular localization of the AIF
should be measured. An investigation of the DNA fragmentation pattern, small-scale vs. large-scale
fragmentation, could give further information with regard to cell death. Investigations of the timing of
the cellular process could also help to pinpoint the cause of the DNA strand breaks, which were
detected 24 h after the first isoproterenol dose. Since the DNA strand breaks could be a result of
isoproterenol treatment itself or caused secondary by apoptosis. The results show indications for an
apoptotic cell death as well as for necrotic cell death (energy depletion). PBMCs are a mixture of
different cell types. It may be possible that a cell type undergoes necrosis while other cell types
undergo apoptosis in response of the isoproterenol treatment.
Formation of intracellular ROS 5.1.1
The levels of intracellular ROS were measured, because ROS could be responsible for the formation
of the observed DNA strand breaks. Catecholamines can induce the formation of ROS. However, the
most human and animal studies showed only an indirect correlation between catecholamines and ROS
mediated DNA damage, no direct measurement of ROS was performed [400, 401]. ROS should be
detected intracellular if it is responsible for the induction of DNA damage. The different origins of
ROS in the reported setup can be the chemical degradation of isoproterenol to isoprenochrome, the
intracellular breakdown of isoproterenol, the formation of ROS induced by the β2-adregernic signaling
or indirect secondary effects. The formation of intracellular ROS can be detected by various methods.
Discussion
101
The most common used methods in cell biology are fluorescence probes which interact with ROS. In
this study DCFDA and DHE were used in single staining’s for the detection of ROS during the
repeated isoproterenol treatment, 4 h and 6.5 h, after the first isoproterenol dose. The 6.5 h point in
time was selected, because at this point in time the formation of DNA strand breaks had peaked.
However, the results showed that the detection of ROS was not possible after 4 hours of incubation or
after 6.5 h of incubation. Since, the cell culture medium have an influence on the formation of ROS,
see section 4.3, the ROS measurements were performed in all three used cell culture media for an
incubation time of 4 h. The ROS measurement of the 6.5 h point in time was only performed in RPMI-
1640 cell culture medium w/o FCS. Since the results were negative and the strongest effects were
expected in RPMI-1640 cell culture medium w/o FCS. Although, the measurements of intracellular
ROS indicate no formation of ROS, see Figure 4-4, this should be critically considered for several
reasons. DCFDA is a generalized oxidative stress indicator which reacts with various ROS. However,
it can detect intracellular peroxides only efficiently after their decomposition into radicals [448].
DCFDA is a cell-permeable, non-fluorescent dye which must be deacetylated by intracellular
esterases. The hydrolysis of the two acetyl-groups creates 2´,7´-dichlordihydrofluorescein (H2DCF).
H2DCF is cell membrane impermeable and accumulates in the cell, it can be oxidized by ROS which
creates the highly fluorescent DCF compound. DCF can pass the cell membrane and can leak out of a
cell over the time [448, 449]. According to the supplier Abcam, DCF should be retained in cells for
the observed time period. However, a leakage could not be completely excluded, because no data were
available with regards of PBMCs. Therefore, control samples were included which were not stained
with DCFDA. In all measurement series, except for the measurements in TexMACS cell culture
medium, see Figure 4-4 E) a significant increase of the fluorescence could be observed after the
DCFDA staining. This indicates the presence of a fluorogenic compound in the cells. Moreover, the
fluorescence signal increased after the treatment with TBHP which is used as positive control. The
fluorescence of the cells was not influenced by isoproterenol or TBHP treatment alone. DHE is also a
cell membrane permeable dye which reacts specifically with the superoxide radical anion [450]. The
oxidation product is ethidium which intercalates into DNA. As for DCFDA measurements, an increase
of the fluorescence signal could be observed after the DHE staining compared with DHE unstained
cells. This demonstrates that a fluorogenic substance was taken up by the cells. The fluorescence
signal was not increased by the isoproterenol or MEN treatment alone. The positive control, MEN,
further increased the fluorescence signal of DHE stained cells. Hence, it should have been possible to
detect ROS during the 4 h as well as during the 6.5 h incubation period. An additional problem could
have been the sensitivity of the used experimental setup. The increase of the fluorescence signal after
treatment with the positive control was statistical significant but low, 2- to 3-fold for the DCFDA
staining and up to 4-fold for the DHE staining. This detection range might be too small and therefore
too insensitive to detect the ROS formation induced by isoproterenol in PBMCs. For example,
fluorescence microscopy or flow cytometry measurements showed an increase of the fluorescence
Discussion
102
signal of DCFDA induced by ROS to only about 1.5-fold after the treatment of HEK cells with
isoproterenol or other catecholamines [422, 423, 451]. Moreover, HEK cells are human embryonic
kidney cells which represent, unlike PBMCS, a homogenous cell population. Additional, the most
reactive oxygen species have a short half-life ranging from nanoseconds to milliseconds [452]. The
large time differences between the half-life of the reactive oxygen species and the observed time frame
which is several hours could be a limiting factor. As already mentioned, there are several sources for
the ROS formation in the used assay setup. The HPLC experiments showed the oxidation of
isoproterenol to isoprenochrome. This is an indirect indication that ROS or free radicals are formed
extracellular by chemical reactions. Some reactive oxygen species, like peroxides can diffuse into the
cells and damage cell components, including the DNA. Electron paramagnetic resonance spectrometry
(EPR) could be used for the detection of ROS and free radicals in the cell culture medium [453, 454].
Another source of ROS could be the intracellular degradation of isoproterenol. In contrast to
epinephrine and norepinephrine, isoproterenol is no substrate for MAO [201, 455]. The degradation of
catecholamines by MAOs induces the formation of hydrogen peroxide and is a main source of the
catecholamine induced ROS formation. However, other enzymes like oxidases could catalyze the
oxidation of isoproterenol and subsequent induce the formation of ROS. In cell lines, mainly HEK 293
cells, and animal models it was demonstrated that ROS play a role in cell signaling processes [451].
Also the signaling of the β2-AR was linked to the formation of ROS via the cAMP/PKA signaling
pathway [400, 401]. The NADPH oxidase is important in the receptor signaling induced ROS
formation. NADPH oxidase can be found in human PBMCs [456]. However, this signaling induced
ROS formation has not been demonstrated previously in PBMCs. Hara et al. demonstrated the
formation of ROS only indirectly by the formation of DNA strand breaks, analyzed by γ-H2AX foci
[400]. The partial inhibition of the DNA strand break formation by a pretreatment of the PBMCs with
propranolol also indicates that the ROS formation is not only mediated by the cAMP/PKA signaling
pathway. Since propranolol inhibits the cAMP formation. Other receptors like the α-AR could be
responsible for the formation of ROS. Norepinephrine induces the formation of ROS via α-ARs in
human PBMCs [457]. Additional, it was shown that persistent activation of the β2-AR protects
myocardiac cells from apoptosis which was induced by ROS [141, 143, 458]. Therefore, the
performed ROS measurements should be repeated using other strategies and methods. For example,
the measurement of a time series after each isoproterenol administration could improve the time
resolution and reduce the probability of a leakage of the fluorescence dyes from the cells. However,
this would require a lot of experiments, because both dyes cannot be used with fixed cells and both
dyes are not resistant against detergents [459]. Hence, the measurement and staining must be
performed for each point in time separately. Chemical improved versions of DCFDA and DHE are
available which can overcome these limitations. Moreover, some fluorescence probes are specific for
cellular compartments, allowing a higher spatial resolution of the ROS detection. Additionally, the use
of fluorescence microscopy for the detection of the fluorescence signals could improve the sensitivity
Discussion
103
for the ROS detection. EPR spectrometry could be used for the detection of intracellular ROS. Finally,
an increase of the oxidative stress could be measured indirectly. ROS can damage various cellular
macromolecules. These oxidized macromolecules can be used as a marker for oxidative stress. This
markers can be oxidized lipids (lipid peroxidation), oxidized proteins and oxidative DNA lesions
[452]. The most interesting marker with regards to the study topic would be the oxidative DNA
damage. For instance, the quantification of 8-oxoguanine which is one of the most common oxidative
DNA lesion could be used [460-462].
Intracellular cAMP and NAD+ content after repeated isoproterenol 5.1.2
treatment of PBMCs
The “classical” signaling pathway of the β2-AR is the cAMP/PKA signaling pathway. The formation
of the second messenger cAMP is an immediate and transient response of the cell induced by the
binding of an agonist to the β2-AR. The receptor must be present at the cell surface and must be
coupled to the Gs protein for the activation of the cAMP signaling. The cAMP content in PBMCs was
measured directly after the administration of the last isoproterenol dose. Forskolin was used as
positive control. Propranolol was used to block the β2-AR and as inhibitor of the cAMP formation.
Forskolin binds to the AC and increases the intracellular cAMP levels independently from the
receptor. The treatment of PBMCs with forskolin induces an approximately 8-fold increase of the
intracellular cAMP content, see Figure 4-2. This demonstrates that the PBMCs are able to induce the
formation of cAMP after the incubation. Interestingly, the forskolin treatment of PBMCs in the
TexMACS cell culture medium as well as in the RPMI-1640 cell culture medium w/o FCS showed no
differences of the cAMP induction. Treatment of cells with propranolol alone slight reduces the
intracellular cAMP levels, see Figure 4-2. Since propranolol is an inverse agonist, a reduction of the
cAMP level below the basal levels is expected [463, 464]. An increase of the intracellular cAMP
content could be observed after the isoproterenol treatment. This increase was inhibited by a
pretreatment with propranolol, with one exception, after the 8-fold isoproterenol treatment in the
RPMI-1640 cell culture medium. The increase of the cAMP content was the strongest after the 1-fold
isoproterenol administration. The observed increase of the intracellular cAMP content was
approximately 2-fold higher in the TexMACS cell culture medium compared to the RPMI-1640 cell
culture medium w/o FCS. Some substances of the TexMACS cell culture medium seem to synergize
the isoproterenol induced cAMP formation. Since the direct and maximal activation of the AC by
forskolin induced the formation of cAMP to the same quantity in both cell culture media. And the
TexMACS cell culture medium alone did not induce the stimulation of the β2-AR. During the
isoproterenol treatment, with the administration of further isoproterenol doses, the increase of the
cAMP content was lowered. Several mechanisms could explain these results. The repeated stimulation
of the receptor could induce its internalization and subsequently a down-regulation of the β2-AR.
Discussion
104
Moreover, repeated stimulation of the β2-AR changes the kinetics of the β-arrestin binding to the
receptor and leads to a faster internalization [123]. This reduces the isoproterenol binding sites at the
cell surface and the ability to activate the downstream cAMP signaling. For example, a long term
infusion of isoproterenol in man induced an up-regulation of β-ARs during the first hour of infusion.
After 4-6 h a decrease below the basal amount of β-ARs could be observed [465]. Also an uncoupling
of the Gs protein from the β2-AR which is observed after agonist binding could reduce the cAMP
dependent downstream signaling. Therefore, the β2-AR density at the cell surface should be measured
during and after the repeated isoproterenol treatment. Moreover, a time series of immunopurification
of the β2-AR could be used to investigate the quantity and the type of G proteins which are bound to
the receptor during and after interval treatment. A forskolin treatment directly after the 8-fold
isoproterenol treatment that increases the cAMP level to the same extant than the forskolin treatment
alone, would exclude a depletion of the cellular ATP pools. However, the results showed that the β2-
AR is stimulated and the downstream cAMP-signaling pathway is activated. Moreover, pretreatment
of cells with propranolol block the cAMP downstream signaling. The repeated treatment of PBMCs
with isoproterenol induced the formation of DNA strand breaks. This treatment also increased the
percentage of cells which showed a lower PAR content. Since the repair of DNA strand breaks and the
formation of PAR require energy, in the form of NAD+, the cellular NAD
+ content was measured
[249]. During the 8-fold isoproterenol treatment no reduction of the intracellular NAD+ content of
PBMCs could be detected, see Figure 4-2 A). This indicates that during this time period no significant
amount of DNA strand breaks occur, because DNA strand breaks activate PARP1. Activated PARP1
uses NAD+ as substrate for the PAR formation. This leads to the depletion of the cellular NAD
+
content. Poly(ADP-ribosyl)ation is the most important catabolic pathway of NAD+ in mammalian cells
[249]. However, during this early time period, during the isoproterenol treatment, no formation of
DNA strand breaks could be observed [466]. But 24 h after the first isoproterenol dosage a treatment
dependent decrease of the cellular NAD+ could be observed, see Figure 4-2 B). Cells lysed directly
after the isolation without incubation were used as a negative control. These cells showed a slightly
but not significant higher NAD+ content than PBMCs which were lysed after an incubation of 24 h.
The 8-fold isoproterenol treatment reduced the NAD+ content of PBMCs by approximately 30%.
Hence, in a time frame between 3.5 h and 24 h after the first isoproterenol administration, the cause for
the NAD+ depletion must occur. The FADU experiments showed 6 h after the first isoproterenol
treatment DNA strand breaks evolve. At this point in time also a reduction of the intracellular NAD+
content could be detected, see Figure 4-2 A). The observed DNA strand breaks explain the depletion
of the cellular NAD+
pools.
Discussion
105
5.2 Repeated isoproterenol treatment induced senescence
like phenotype
An emerging body of evidence demonstrates that psychological stress can affect the immune system.
Many results showed that age-associated changes of the immune system can be exacerbated by
psychological stress. Epidemiological studies have shown that stress increases the expression of
inflammatory markers (cytokines), the susceptibility to virus infections and reactivation rate of latent
virus infections [16, 403, 467-469]. Many of these detrimental effects could be correlated with a
senescence phenotype of immune cells. In particular T cells might have a senescence phenotype.
Senescence could be observed in human CD8 as well as in CD4 T cells [470]. T cells which have
reached replicative senescence in cell culture could still retain normal functions [471, 472].
Senescence of T cells can be induced by an inflammatory environment. For instance, the inflammatory
cytokines TNFα and IFNγ can induce senescence in CD8 T cells [473]. Also a shortening of telomeres
could be observed in T cells [470, 474]. Senescent T cells also loss the expression of the surface
protein CD28, a co-stimulatory protein essential for optimal T cell activation [475]. Beside T cells,
late memory B cells showed characteristics of cellular senescence, like the expression of SASP and
p16 [476, 477]. A senescence phenotype can also be induced in natural killer cells by DNA damage
response signaling. Induced by the activation of CD158d which is associated with the expression of
SASP [478]. The telomeres of PBMCs isolated from PTSD patients were shortened compared to
healthy age matched controls. Also some genes which are important in DNA damage repair and cell
cycle control were dysregulated in these PTSD patients (Judy Salzwedel, personal communication).
Telomere shortening or the accumulation of DNA strand breaks that induce a long-lasting DNA
damage response are cardinal markers for replicative senescence [479, 480]. Besides these correlations
between chronic stress and senescence, a recent mice study demonstrated that isoproterenol could
induce a senescence like phenotype in mouse cardiomyocytes [416]. Long-term (7 day) subcutaneous
injections of isoproterenol were used in a model for the induction of pathological induced cardiac
hypertrophy. The protein levels of p16, p21 and p53 were significantly higher in the cardiomyocytes
of isoproterenol treated animals compared to control animals. Moreover, cultured neonatal
cardiomyocytes treated for 48 h with isoproterenol showed a senescence like phenotype. The cells
were positive for SA-β-GAL and showed an accumulation of lipofuscin [416]. We observed the
infliction of DNA damage after the isoproterenol treatment of PBMCs. Activation of the DNA damage
response might contribute to the induction of senescence. The question arose whether isoproterenol
would induce biomarkers of senescence in PBMCs. Depending on the cell type and the trigger of the
senescence it takes several days to induce a senescence phenotype in cells [335]. As mentioned above,
the before used experimental setup was not appropriate for the incubation of PBMCs longer than 24 h.
Because the viability of PBMCs incubated longer than 24 h in FCS free medium was too low.
Discussion
106
Therefore, different cell culture media were tested to increase the cell viability. The highest cell
viability of PBMCs were observed in the TexMACS cell culture medium [417]. At the beginning of
the incubation, cell viability was approximately 85%, see appendix Figure 12-8 A). After 24 h of
incubation, cell viability slightly decreased to approximately 78%. Also no apoptotic PARP1 cleavage
could be detected, see appendix Figure 12-9. Afterwards, cell viability was stable and no further
significant cell loss could be observed until 120 h of incubation, see appendix Figure 12-8 A). Also no
significant difference of the cell viability between untreated and 8-fold isoproterenol treated PBMCs
during the incubation time of 120 h could be observed, see appendix Figure 12-8 B). Prior to the
presented study, several additional experiments in our group indicated a correlation between the
repeated isoproterenol treatment and the induction of cellular senescence. For example, the 8-fold
isoproterenol treatment induced the expression of SA-β-GAL in PBMCs, especially in T cells [417].
The cell morphology of PBMCs changed to a phenotype associated with cellular senescence, cells
were enlarged and flattened [417]. Finally, the isoproterenol pretreatment inhibited the proliferation of
lymphocytes after the stimulation with PHA (Palombo and Grath, manuscript in preparation) [420].
Based on these findings the expression of 41 genes was analyzed by quantitative real-time PCR.
Therefore, custom made real-time PCR arrays were used. The investigated genes can be clustered into
8 groups: adrenergic signaling, cell cycle control, immune response, N-glycosylation, oxidative stress,
DNA repair and telomeric regulation. The selected genes showed a dysregulation in a previous
performed transcriptome study with PBMCs of PTSD patients (Judy Salzwedel, personal
communication). The mRNA expression profile of treated PBMCs was normalized to the mRNA
expression profile of untreated PBMCs. In the view of the fact that PBMCs are a heterogeneous cell
population and the heterogeneity between different donors, the regulation threshold was set to a 2–fold
change. After the 4-fold isoproterenol treatment 3 genes, VCAN, CCND1 and BRCA2 exceeded the
regulation threshold and were significantly regulated, see Figure 4-6. Versican (VCAN) is a matrix
proteoglycan and belongs to the lectican protein family. It is involved in cellular adhesion, migration
and proliferation. The expression of VCAN positively correlates with the cellular inflammatory
response [481]. It is also important in the activation and adhesion of T cells [482]. The observed
cellular adhesion and the morphological changes after the isoproterenol treatment of the PBMCs are in
accordance with the VCAN up-regulation. Moreover, it was demonstrated that versican protects cells
from oxidative stress-induced apoptosis [483]. The expression of VCAN is regulated by various
cytokines, transcription factors and signaling pathways such as TGFβ, IL-1α, IL-1β, CREB, p53 and
the PI3K/PKB signaling pathway, which are also regulated by β-adrenergic signaling [484, 485].
However, the long-acting β2-adrenergic agonists, formoterol and salmeterol alone did not affect the
expression of VCAN [486, 487]. Besides VCAN also BRCA2 exceeded the regulation threshold but the
difference between the 4-fold isoproterenol treated PBMCs and the untreated control PBMCs was not
significant. BRCA2 is an important DNA repair protein involved the repair of DNA double-strand
breaks by homologous recombination [488, 489]. BRCA2 is a tumor suppressor gene with very high
Discussion
107
importance with regards to breast- or ovarian cancer [490]. The most interesting result with regards of
the cell cycle control is the down-regulation of CCNA1 (cyclin D1) after the 4-fold isoproterenol
treatment. Cyclin D1 is a key regulator of the cell cycle. It is a sensor and integrator of extra cellular
stimuli in the G1 phase of the cell cycle. Cyclin D1 is essential for the progression of the G1 phase
into the S phase, mediated by binding to CDKs, histone acetylase and histone deacetylase. PBMCs are
non-proliferating (quiescent) cells without an external stimulation. However, they express the cyclin
D1 protein and mRNA with approximately the same quantity as PHA-stimulated lymphocytes and
malignant lymphocytes [491, 492]. The cyclin D1/CDK4/6 complex, together with a complex of
cyclin E/CDK2, phosphorylates the RB protein which inhibits its function and induces the release of
E2F transcription factors. E2F transcription factors are essential for the transcription of genes needed
for entering the S phase of the cell cycle. Hence, a down-regulation of CCNA1 induces a cell cycle
arrest at the restriction point in the G1 phase. The down-regulation of the expression of CCNA1 by β2-
adrenergic receptor signaling was also shown for other cell types. The treatment of human airway
smooth muscle cells with the β2-AR agonist salbutamol reduces the expression cyclin D1 and blocks
the cell cycle at the restriction point [493]. The expression of cyclin D1 is also inhibited by cAMP in
fibroblast cell lines and induces a cell cycle arrest in the G1 phase [494]. The differences in the gene
expression pattern between the 4-fold and the 8-fold isoproterenol treatment are low, see Figure 4-6. In
both cases only VCAN and CCNA1 showed a significant regulation that exceeded the threshold.
Interestingly, after the 8-fold isoproterenol treatment an increase of the CDKN2A (p16) expression
could be observed. However, this up-regulation was not significant. p16 is an important cell CDK
inhibitor which specifically inhibits the progression from the G1 phase into the S phase. The p16
expression in peripheral blood T cells is a biomarker for aging and replicative senescence [424, 495,
496]. p16 binds to CDK4 as well as to CDK6 which blocks the interactions with cyclin D. Hence, RB
is not phosphorylated by the complex of cyclinD1/CDK4/6 and is retained in its active, transcription
repressing form. Taking together, the results of the gene expression analysis showed that the
expression of CCND1 is influenced by the repeated isoproterenol treatment and the expression of
CDKN2A might be influenced by the repeated isoproterenol treatment. The down-regulation of the
CCND1 expression and a higher expression of CDKN2A might indicate a cell cycle arrest at the G1
phase of the cell cycle restriction point. Besides the p16/RB pathway also the p53/p21 pathway is
important for the induction of senescence. The expression of p21 was measured by two different
primer pairs (CDKN1A and CDKN1A * (Biorad and Biomol)). However, the isoproterenol treatment
induced no changes in the CDKN1A expression pattern under this culture conditions, see Figure 4-6.
Since expression of CDKN2A might be up-regulated after the 8-fold isoproterenol treatment, the p16
protein level was measured in PBMCs treated with one, four or eight doses of isoproterenol after 24 h
and 48 h. The results showed no significant increase of the p16 protein levels, see Figure 4-7. The p16
protein levels were slightly higher after the isoproterenol treatment. In general, senescent cells cannot
be identified by a single marker instead of a combination of several senescence markers must be used
Discussion
108
for the identification of senescent cells. Today, many such senescence markers are known, see section
1.4. However, a given cell type will not express all of them, the detectable senescence markers are
dependent on the cell type, the cause of senescence and the time frame which has passed after the
senescence induction. Two major molecular senescence markers are the expression of p16 and p21.
Both are cell cycle inhibitors and induce a cell cycle rest, a cardinal feature of senescent cells. In the
case of immune cells, p16 is considered as possible biomarker of aging and senescence marker.
However, immune cells express different p16 protein levels. T cells are the cell type of PBMCs with
the highest expression of p16 compared to the other cell types B cells, monocytes and naturel killer
cells. They express only 30% or less of the p16 protein level of T cells [424]. A senescence like
phenotype is observed for T-helper cells as well as for cytotoxic T cells. The other cell types of
PBMCs natural killer cells, B cells, and monocytes, show no clear indication of a senescence like
phenotype. Either only a sub-cell population shows a senescence like phenotype, in the case of B cells
the late memory B cells [477]. Or only special stimuli induce a senescence like phenotype, like the
activation of CD158d in the case of natural killer cells [478]. Therefore, further studies should be
performed with purified sub-cell populations. The measurement of senescence markers in a specific
cell type should give clearer results compared to the measurements in a cell mixture such as PBMCs.
For example, the express of SA-β-GAL in T cells showed a clear treatment-dependency [417]. T cells
are the most interesting cell type in PBMCs with regards to senescence, because T cells are part of the
adaptive immune response. After T cell activation via the T cell receptor and co-stimulatory molecules
by the specific antigen, presented by antigen-presenting cells (APCs), T cells start to proliferate and
undergo clonal expansion [467]. Moreover, additional senescent markers which are specific for T cells
could be analyzed, like a down-regulation of CD28 and a lower expression of the heat shock protein
HSP70 [475, 497, 498]. Taken together, the results give the indications that the isoproterenol might
induce a senescence like phenotype in PBMCs, at least in T cells. Although an increase of the p16 or
p21 protein expression, two strong senescence markers, was not observed. The reason for that could be
the short incubation times before the measurements. Since the mouse study which used isoproterenol
to induce senescence in cardiomyocytes showed an increase of SA-β-GAL within 2 days of the
isoproterenol treatment. In contrast, the higher expression of p16 and p21 was observed 7 days after
the first isoproterenol infusion [416]. T cells could be used to investigate longer treatments with
isoproterenol, because normal human T cells can be cultured ex-vivo for at least 25 population
doublings using a constant expose to IL-2 [499-501]. A IL-2 treatment has the disadvantage that it
may influences the β2-AR density at the T cell surface [183]. In this study replicative senescence does
not play an important role. Because blood was draw from young subjects and cells were not stimulated
to proliferate during the incubation this could explain the lack of p16 upregulation in our experiments.
Discussion
109
5.3 Degradation of isoproterenol under cell culture
conditions
In our studies, a treatment protocol with repeated administrations of isoproterenol was used. This
treatment protocol was established as a model system to simulate the repeated release of stress
hormones during chronic stress. Isoproterenol is a synthetic catecholamine which is often used in
science because of its selectivity for β-ARs. The natural catecholamines epinephrine and
norepinephrine bind to α- and to β-ARs. Although isoproterenol is often used in cell culture models for
the investigation of signaling processes, its metabolism in cell lines in the cell culture is not known to
our knowledge. However, studies in animals and humans have shown that the isoproterenol
degradation depends strongly on the administration route [211-213]. Catecholamines circulating in the
blood system are metabolized mainly in the liver. Most studies measured a plasma half-life of natural
catecholamines of only several minutes in humans. However, the half-life which was found for
isoproterenol ranges from several minutes to hours [205, 208, 214]. The two most important enzymes
of the catecholamine metabolism are MAO and COMT [160]. Isoproterenol is no substrate for MAO
because of its isopropyl group at the nitrogen atom of the amine [201]. PBMCs express MAO, COMT,
uptake enzymes, and storage vesicles for catecholamines [169]. Therefore, they might be also able to
metabolize isoproterenol. Moreover, beside the enzymatic degradation of isoproterenol, it undergoes
chemical degradation processes [232-235]. Therefore, it was expected that the isoproterenol in the cell
culture medium was degraded within a 30 min. At least, a timeframe of 1 h should be enough for the
breakdown of the isoproterenol and the recycling of the β2-AR. As the β2-AR is stimulated by
extracellular ligands, the main interest was to determine the isoproterenol concentration in the cell
culture medium. Additional, we were interested in the formation of isoprenochrome an oxidation
product which is known to be cytotoxic [221, 222]. In the two studies that were performed in parallel,
we used two different cell culture media in otherwise identical conditions. The chemical composition
of cell culture media and supplements like FCS and serum albumin can influence signaling processes
and the stability of chemicals like isoproterenol [207, 418, 419, 427, 502, 503]. Therefore, the stability
of isoproterenol, the formation of isoprenochrome and the influence of the cell culture media were
investigated. Therefore, a HPLC protocol for the measurement of catecholamines and aminochromes
in blood was adopted. This allowed the detection and relative quantification of isoproterenol and
isoprenochrome in an easy way. Only the cells and suspended particles had to be removed by
centrifugation to avoid the clogging of the HPLC. No purification steps were needed that could
influence the recovery of the substances. Also the quick procedure avoids the degradation of
isoproterenol or isoprenochrome. Hence, it was possible to investigate the concentration of both
substances in “real time”. Samples were taken and analyzed every 30 min, although the retention times
were lower than 10 min, because to have enough time to complete the treatment and the sampling.
Discussion
110
And the cell culture media RPMI-1640 with FCS and the TexMACS contained substances that had
high retention times, about 20 till 25 min. These substances could cause ghost-peaks which could
overlay with the isoproterenol and isoprenochrome peaks of the next run. Therefore, the time was used
to elute these substances before the next run was started. It was possible to detect isoproterenol with
the diode array detector and with the fluorescence detector. A combination of both detectors increases
the reliability and the sensitivity of the measurements. The absorbance detector is less sensitive and
less specific than the fluorescence detector. However, the absorbance detector allows after the
detection of substance at a specific wavelength, in this case 280 nm for isoproterenol and 490 nm for
isoprenochrome, an absorbance scan from a wavelength of 200 nm till 900 nm of the substance peak.
The absorbance spectrum was used for the identification of the isoproterenol or isoprenochrome peak
in the chromatogram by comparing the absorbance spectra with spectra in literature [504]. Additional,
an absorbance spectrum of pure isoproterenol was recorded in PBS buffer and HPLC eluent by a
spectrometer and used for comparison. Moreover, the recording of the absorbance spectra of each peak
allowed the software (ChemStation, Agilent) to calculate the purity of a chromatographic peak and to
project a 3D plot. The calculated purity as well as the 3D plot showed that the chromatography peaks
of isoproterenol and isoprenochrome were pure. There was no additional substance peak with an
absorbance maxima of 280 nm or 490 nm and an equal or similar retention time that could overlay
either with the isoproterenol or isoprenochrome peak. The fluorescence detector has a higher
specificity and sensitivity compared with the absorbance detector. However, it was not possible to
obtain a fluorescence spectrum of isoprenochrome by attempting to calibrate the detector for
isoprenochrome according to the manufacturer´s handbook. The broad absorbance peak at 490 nm of
isoprenochrome could be an explanation. In the literature no fluorescence spectrum of isoprenochrome
could be found. Hence, isoprenochrome could only be detected by the diode array detector. For both
detectors a linear correlation between the peak area of the isoproterenol peaks and the dissolved
isoproterenol concentration could be observed, see Figure 4-8 and Figure 4-10. A tailing effect could
be observed at higher isoproterenol concentrations that is an indication for an overload of the column.
However, these concentrations were not reached during the experiments and there was no interference
with adjacent peaks. Therefore, this was accepted. Also a negative correlation of the isoproterenol
peak area and an increase of the NaIO4 concentration could be observed. And at the same time a
positive correlation between the isoprenochrome peak area and the NaIO4 concentration could be seen.
The dilution series of isoproterenol prepared either in RPMI-1640 cell culture medium w/o FCS,
RPMI-1640 cell culture medium with FCS or TexMACS showed the same slopes and y-interceptions.
It is well known that isoproterenol binds to plasma proteins [206, 207]. The identical slopes and y-
interceptions indicated no differences in the isoproterenol concentrations. However, this did not
exclude the binding of isoproterenol to proteins. Since the binding of isoproterenol to a protein could
be reversed by the HPLC eluent during the separation. If isoproterenol is bound under cell culture
conditions by proteins which are part of the FCS or the TexMACS cell culture medium should be
Discussion
111
analyzed in the future. The binding to proteins could influence the degradation and oxidation
processes of catecholamines [234]. Therefore, isoproterenol could be dissolved in the respective
medium and the proteins could be removed, for example by ultrafiltration before the HPLC run. If
isoproterenol is bound by proteins, the isoproterenol concentration should be lower in the cell culture
medium after filtration of proteins. Also the chemical composition of the solvent influences the
isoproterenol concentration. Isoproterenol, dissolved in phosphate buffer or water, is stable when it is
stored at 4 °C and protected from light [200]. However, different metal cations and enzymes can
catalyze the oxidation of catecholamines [232-235]. Since cell culture media contain such factors, the
stability of isoproterenol has been tested in cell culture media at 4 °C. At 4 °C, no degradation of
isoproterenol was observed in each tested cell culture medium during a time span of 6 h. Hence,
freshly prepared stock solutions could be used for the interval treatment. In contrast, at 37 °C, a
decrease of the isoproterenol concentration could be observed during a time span of 6 h in all culture
media. The formation of isoprenochrome could be observed in all three cell culture media. The
isoprenochrome concentration in the TexMACS cell culture medium was only approximately a sixth
compared with the isoprenochrome concentration in both RPMI-1640 cell culture media. Indicating
that isoproterenol is most stable in the TexMACS cell culture medium. However, the degradation of
isoproterenol under cell culture conditions seemed to be slower compared to the degradation in
humans and animals. This was confirmed by the measurements of the isoproterenol stability after a
single administration of 10 µM to PBMCs. In contrast to the initial hypothesis, there was nearly no
degradation of isoproterenol detectable after 30 min of incubation. Also after 60 min only a small
decrease of the isoproterenol concentration could be observed. However, in both tested cell culture
media a linear decrease of the isoproterenol concentration could be observed. Linear regressions were
used to determine the degradation rates of isoproterenol. The following degradation rates were
determined, in RPMI-1640 cell culture medium w/o FCS 72.69 ± 8,23 𝑚𝐿𝑈
ℎ (or 1.6 ± 0.18
µ𝑚𝑜𝑙
𝑙
ℎ ), in
TexMACS cell culture medium 40.83 ± 6.04 𝑚𝐿𝑈
ℎ (or 0.87 ± 0.13
µ𝑚𝑜𝑙
𝑙
ℎ ). TexMACS do not contain
FCS, but it contains human serum albumin. Albumin is a major component of FCS and the main
component of plasma proteins [419]. Albumin or a unknown other substance of TexMACS could
increase the isoproterenol stability. This could be tested by incubating isoproterenol in RPMI-1640
cell culture medium that contains different concentrations of albumin. In contrast to the chemical
composition of the cell culture medium, the presents of PBMCs in the cell culture media had no
significant influence of the isoproterenol degradation, see appendix Figure 12-10. Therefore, the
degradation of isoproterenol must be due to chemical processes. It is well known that catecholamines
undergo different oxidation processes. Different metal ions catalyze the oxidation of catecholamines in
aqueous buffers at intermediate pH 6-8 [234]. The products of these oxidation processes are
aminochromes. They are chemical unstable and undergo further oxidation processes. The degradation
of isoproterenol is accompanied in both cell culture media with PBMCs or w/o PBMCs by the
Discussion
112
formation of isoprenochrome. The formation of isoprenochrome is induced during the incubation
because at the point in time 0 min no isoprenochrome could be detected. After 30 min at 37 °C, the
formation of isoprenochrome could be observed. The highest degradation rate of isoproterenol was
measured in the RPMI-1640 cell culture medium w/o FCS. This suggested the formation of
isoprenochrome was the fastest in the RPMI-1640 cell culture medium w/o FCS and the lowest
TexMACS cell culture medium. Indeed, the lower formation rate of isoprenochrome could be seen in
TexMACS cell culture medium. During the first 2.5 to 3 h the increase of isoprenochrome seems to be
linear with the time, in the RPMI-1640 cell culture medium w/o FCS. Then the concentration of
isoprenochrome was constant, indicating that isoprenochrome undergoes further reactions. The slow
degradation rates of isoproterenol indicated that isoproterenol will accumulate in the cell culture
medium during the repeated treatment. In fact, the accumulation of isoproterenol could be observed
for the 4-fold as well as for the 8-fold isoproterenol treatment in all tested culture media. During the 4-
fold isoproterenol treatment a stepwise increase could be detected for the TexMACS and the RPMI-
1640 cell culture medium with FCS. In contrast, in the RPMI-1640 cell culture medium w/o FCS a
small decrease of the isoproterenol concentration could be observed. After 3 h, about 19% of the total
administered isoproterenol dose had been degraded. The highest isoproterenol concentration could be
observed after the last treatment in all three cell culture media. Afterwards, a liner decrease of the
isoproterenol concentration could be observed. Linear regressions were used to determine the
degradation rats. The following degradation rates were determined, in RPMI-1640 cell culture medium
w/o FCS 230.7 ± 31.28 𝑚𝐿𝑈
ℎ (or 5 ± 0.68
µ𝑚𝑜𝑙
𝑙
ℎ ), in TexMACS cell culture medium
192.6 ± 24.01 𝑚𝐿𝑈
ℎ (or 3.92 ± 0.46
µ𝑚𝑜𝑙
𝑙
ℎ ), RPMI-1640 cell culture medium with FCS
168.2 ± 29.36 𝑚𝐿𝑈
ℎ (or 3.72 ± 0.65
µ𝑚𝑜𝑙
𝑙
ℎ ).The degradation rates after the 4-fold isoproterenol treatment
were faster compared with the 1-fold treatment. Again the formation of isoprenochrome could be
observed after 30 min of incubation in all three cell culture media. In TexMACS and in RPMI-1640
cell culture medium with FCS a slow increase could be observed. In contrast, in RPMI-1640 cell
culture medium w/o FCS a faster formation of isoprenochrome could be observed. The peak of the
isoprenochrome concentration could be observed 1 h after the maximum isoproterenol concentration.
Isoprenochrome undergoes also degradation in RPMI-1640 cell culture medium w/o FCS, as the
concentration that could be detected decreased after 4.5 h. This decrease could not be observed for the
other two other cell culture media. During the 8-fold isoproterenol treatment, a stronger overlay
between degradation processes of isoproterenol and increase of isoproterenol caused by additional
doses could be observed. This could be observed in particular for the RPMI-1640 cell culture medium
w/o FCS. After 2.5 h (administration of six doses) till 3.5 h (administration of 8 doses) no further
increase of the isoproterenol concentration could be detected. Hence, the degradation rate was about
880 𝑚𝐿𝑈
ℎ (or 20
µ𝑚𝑜𝑙
𝑙
ℎ ). As the isoproterenol degradation slowed down during time, there is no linear
Discussion
113
correlation between the isoproterenol concentration and the incubation time. Hence, a linear regression
cannot be used for the approximation of the degradation rate between 4 h and 8 h. In the two other cell
culture media a linear increase of the isoproterenol concentrations with additional doses could be
observed. The degradation of isoproterenol also appeared to be linear in the both cell culture media.
Again a linear regression was used to determine the isoproterenol degradation rates. In RPMI-1640
cell culture medium with FCS the degradation rate was in RPMI-1640 cell culture medium with FCS
440.1 ± 39.23 𝑚𝐿𝑈
ℎ (or 8.64 ± 0.77
µ𝑚𝑜𝑙
𝑙
ℎ ) and in TexMACS cell culture medium 216.5 ± 46.21
𝑚𝐿𝑈
ℎ (or
4.02 ± 0.86
µ𝑚𝑜𝑙
𝑙
ℎ . The formation of isoprenochrome could be observed again after 30 min of
incubation. The increase of the isoprenochrome concentration was the strongest in the RPMI-1640 cell
culture medium w/o FCS. The maximal concentration was reached 30 min after the last treatment.
Afterwards, a decrease of the isoprenochrome concentration indicates that also the isoprenochrome
undergoes degradation processes. In contrast to the 4-fold isoproterenol treatment, during the 8-fold
treatment in RPMI-1640 cell culture medium with FCS a decrease of the isoprenochrome
concentration could be observed. The peak concentration was reached after about 5 h of incubation. In
contrast, the isoprenochrome concentration in TexMACS cell culture medium was constant after
reaching the maximum concentration. The 4-fold and the 8-fold isoproterenol treatments were also
repeated without PBMCs. Again no significant differences between the experiments with and w/o cells
were observed. In all measurement series the fastest decrease of isoproterenol could be observed in the
RPMI-1640 cell culture medium w/o FCS. The slowest decrease could be observed in the TexMACS
cell culture medium. No statistical significant influence of PBMCs with regards on the isoproterenol
degradation could be observed. Nevertheless, this cannot be excluded because these effects can be
small and isoproterenol was administered in excess for a maximal stimulation. Such small effects can
be obscured by other influences, for example the variation caused by multiple dose administration
could be bigger than the effects caused by PBMCs. Moreover, the detectors could be not sensitive
enough to detect such small differences. In all measurement series, an increase of the isoproterenol
degradation rate could be observed with increased isoproterenol concentrations. Also the formation of
isoprenochrome increased with the number of administrations. Isoprenochrome is formed by oxidation
processes of isoproterenol, supporting the idea of a chemical degradation. Moreover, the oxidation of
isoproterenol to isoprenochrome contains several intermediates and is associated with the generation
of free radicals and ROS [233]. These intermediates are an unstable and undergo further oxidation.
These oxidations may be caused by various chemical species like ROS or free radicals but also by
other reaction intermediates like ortho-quinones or semiquinones [229, 231]. This might explain an
increased oxidation rate of isoproterenol during the repeated treatment. Intermediates such as o-
quinones, semiquinones or radicals that were formed after the first isoproterenol dose can increase the
oxidation rate of the following isoproterenol doses. Also the further oxidation of isoprenochrome to
melanin-like products could shift the reaction equilibrium and increase the oxidation rate of
Discussion
114
isoproterenol [228]. In addition to oxidation reactions, isoprenochrome undergoes also rearrangements
and other redox reactions. This might also explain the different isoproterenol degradation rates in the
different cell culture media. The chemical composition of a cell culture medium has an influence on
the lifetime of chemical compounds, especially with regards to ROS [505]. For instance, high
concentrations of dopamine (> 250 µM) induce cell death. Cell death is caused by H2O2 which is
formed during oxidation processes of dopamine in the cell culture medium [506]. It is well know, that
cell culture medium contains anti-oxidative substances, FCS increases the antioxidant capacity of a
cell culture medium [507]. Also albumin which is a compound of the TexMACS cell culture medium
acts as an antioxidant [426]. Isoproterenol has a high affinity for serum proteins [206, 207]. The
binding of isoproterenol to such proteins could reduce its reactivity and reduce the oxidation rate of it.
Such proteins can also bind metal ions and prevent that they undergo redox-reactions [427]. This could
also slow down the oxidation of isoproterenol because metal ions can oxidize catecholamines [226,
233]. The main goal was to determine the concentration of isoproterenol during the repeated treatment,
especially if isoproterenol was degraded between two administrations. The measurements of the
isoproterenol concentration showed that the degradation of isoproterenol is slower as initially thought.
No significant degradation between two doses during the 8-fold and during the 4-fold treatment could
be observed, at least in the beginning. Instead an accumulation of isoproterenol could be observed in
all cell culture media. As PBMCs could take up catecholamines and are able to store them in vesicles,
it would be interesting to measure also the intracellular isoproterenol concentration during and after
the treatment. Also the measurement of intracellular concentrations of isoprenochrome and further
metabolites would be interesting. In principle, the same protocol could be used but more sensitive
detectors would be needed. After centrifugation an adequate cell number could be lysed by the
addition of perchloric acid. The supernatant could be analyzed by LC-MS/MS or an HPLC equipped
with an electrochemical detector. The intracellular isoprenochrome concentration and the intracellular
concentration of other metabolites could give interesting information with regard to intracellular ROS
or free radicals. If isoprenochrome could be detected intracellular, it would be plausible to find
intracellular ROS or free radicals as well. However, the question arises how an accumulation of
isoproterenol could influence the PBMCs and how could this explain the influence of the cell culture
medium? It is known that long-term stimulation of cells with a β2-AR agonist induces a down-
regulation of the β2-AR. The long-term infusion (6 h) of isoproterenol in humans had a biphasic effect
on the β2-AR density on the cell surface of leukocytes. After 30 min, an up-regulation of the receptor
density at the cell surface could be observed. Afterwards, the receptor density was down-regulated
[179, 465]. In TexMACS cell culture medium the highest accumulation of isoproterenol could be
observed. These might lead to a stronger down-regulation of the β2-AR compared to the other culture
media. The reduced amount of receptors would also reduce the activity of intracellular signaling
pathways and the associated formation of ROS. The reduced ROS formation could lower the effects of
catecholamine, such as the formation of DNA damage. The high concentrations of isoproterenol

Discussion
115
caused by the accumulation during the repeated treatment seemed not to be responsible for the
observed effects in the two other studies. Already a single dose of 10 µM induced the maximum
cAMP response. However, this might be not true for the other signaling pathways of the β2-AR.
Therefore, an investigation of the other signaling pathways of the β2-AR must be taken into account
for a better understanding of the observed outcomes. Summing up the results of all three studies the
most plausible explanation for the observed isoproterenol induced effects is caused by two
mechanisms. On the one hand, isoproterenol induces signaling of the β-ARs. On the other hand, the
oxidation of isoproterenol and the formation of isoprenochrome seemed also to be involved in the
observed effects.
Conclusions and outlook
116
6 Conclusions and outlook
Our studies have been designed with regards to findings that chronic stress on the one hand can impair
immune cells and on the other hand induce DNA damage. Several cell and animal studies of chronic
stress showed a decrease of the genomic instability in stressed subjects [399-401]. Especially, several
studies with PBMCs of chronically stressed PTSD patients showed an accelerated aging, an
accumulation of DNA strand breaks and an impairment of the DNA repair in these cells [82, 83].
These patients have also elevated blood plasma catecholamine concentrations [57-61]. Besides that,
catecholamines can induce the formation of ROS which induce DNA damage in mouse as well as in
human cell lines [399-401]. Therefore, the hypothesis was raised that repeated stimulation of the β2-
AR by catecholamines can induce DNA strand breaks in human PBMCs. To test this hypothesis an ex
vivo model was established [405]. PBMCs of healthy donors were isolated and repeatedly treated with
isoproterenol to mimic the increased and repeated secretion of catecholamines during chronic stress.
The experiments showed that repeated isoproterenol treatment induced the formation of β2-AR-
dependent and β2-AR-independent formation of DNA strand breaks [421]. These DNA strand breaks
were only partially repaired after 24 h. The responsiveness of the cAMP/PKA signaling pathway
decreased during the repeated stimulation of the β2-AR. Additional, the formation of the DNA strand
breaks could only be partially inhibited by the β-blocker propranolol. Both findings are indications
that additional processes must be involved in the induction of DNA strand breaks. Moreover, no
formation of intracellular ROS induced by the repeated isoproterenol treatment could be detected. The
formation of DNA strand breaks was accompanied by a decrease of intracellular NAD+ as well as ATP
pools. The repeated isoproterenol treatment reduced the PARP1 activity as well as the PARP1 protein
level and increased the number of apoptotic cells. The PARP1 protein expression as well as the
apoptosis rate seems to be subject-dependent. However, further studies are needed which measure all
parameters in the same subject at different points in time to order the effects and to determine the
mechanisms. Furthermore, the PBMCs are a heterogeneous cell population, consisting out of different
cell types. Since the different cell types respond differently to the isoproterenol treatment and the
composition of PBMCs varies between subjects, also the composition of the PBMCs could be
responsible for the observed variations. The data in literature indicated that half-life of isoproterenol
strongly depends on the administration route and has a plasma half-life of several minutes [205, 206,
208, 214]. Therefore, the initial hypothesis was that the isoproterenol was degraded between two
isoproterenol administrations and the cells had enough time for resensation of the receptor. In contrast
to that, measurements of the isoproterenol concentration in cell culture media revealed an
accumulation of the isoproterenol in the cell culture media. The degradation rate of isoproterenol
increased with further applications. Moreover, the degradation rate was highly influenced by the
composition of the cell culture media. The decrease of the isoproterenol content was accompanied by
Conclusions and outlook
117
the formation of isoprenochrome. Isoprenochrome is formed by the oxidation of isoproterenol. During
this oxidation processes ROS and free radicals are formed. If the oxidation of isoproterenol,
intracellular as well as extracellular, is the cause for the DNA strand breaks must be investigated by
further studies. Taken together the results indicate that isoproterenol under cell culture conditions is
mainly degraded by chemical processes and the degradation is mainly influence by the cell culture
medium. The data in literature also indicate the long-term treatment of myocardia cells with
isoproterenol induce a senescence like phenotype [416]. Our results, like the expression of SA-β-GAL,
higher mRNA expression of CCND1 and VCAN, morphological changes of the cells and the
impairment of cells to proliferate after PHA indicate that the repeated isoproterenol treatment can
induce a senescence like phenotype in human PBMCs. Moreover, the results indicated that mainly
T cells are responsible for the observed senescence phenotype. Further studies with purified cell
populations are required to confirm this and for further mechanistic studies. Our studies give some
indications that the repeatedly treatment of PBMCs with isoproterenol induces the expression of stress
biomarkers. But we couldn’t clarify the underlying mechanisms. For this purpose, further studies are
required which measure all parameters in a single subject for correlations. Moreover, a higher
temporal resolution is required, because also the additional signaling pathways of the β2-AR must be
taken into account. The phosphorylation processes responsible for the signal transduction are only
transient. Hence, the signaling cascades must be investigated with a high temporal resolution, at least
with 5 min steps after each isoproterenol treatment. Further, investigations of the cellular senescence
should focus on the T cell subset. Depending on the outcome of these studies, specific inhibitors for
the phosphorylation cascades of the β2-AR, treatments with antioxidants and β-blocker may be
considered as adjuvant therapeutics to reduce the adverse effect of chronic stress on the immune
system.
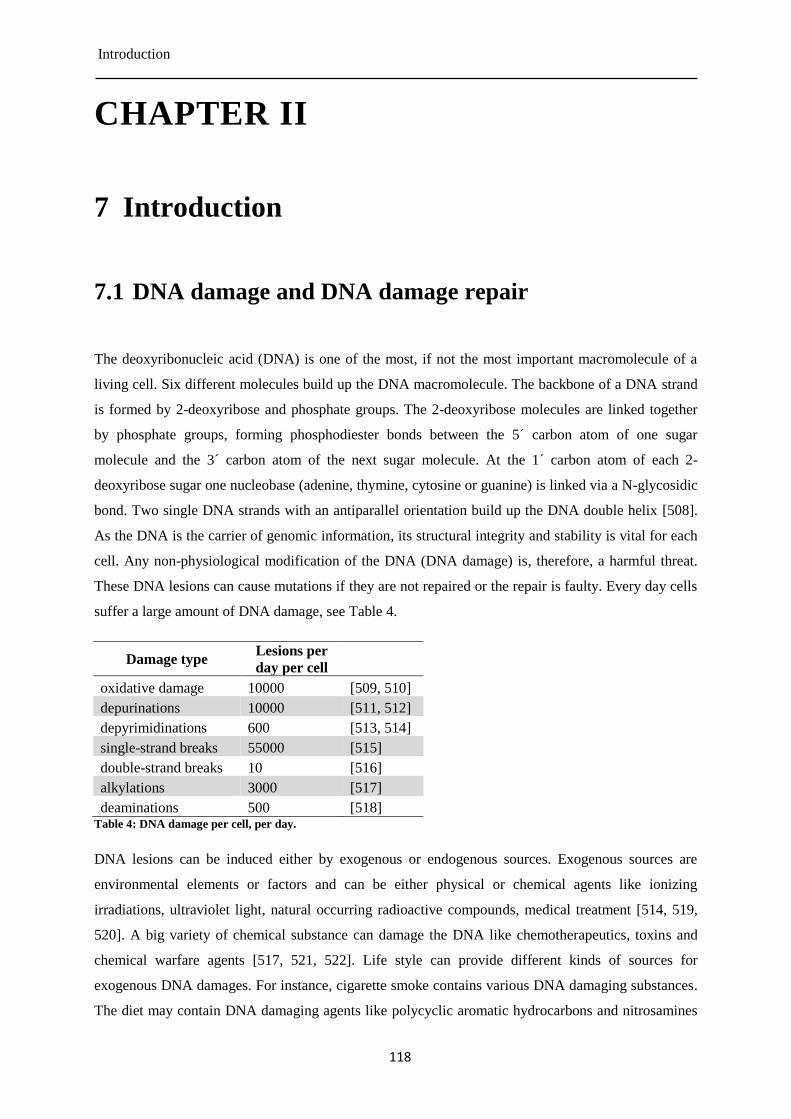
Introduction
118
CHAPTER II
7 Introduction
7.1 DNA damage and DNA damage repair
The deoxyribonucleic acid (DNA) is one of the most, if not the most important macromolecule of a
living cell. Six different molecules build up the DNA macromolecule. The backbone of a DNA strand
is formed by 2-deoxyribose and phosphate groups. The 2-deoxyribose molecules are linked together
by phosphate groups, forming phosphodiester bonds between the 5´ carbon atom of one sugar
molecule and the 3´ carbon atom of the next sugar molecule. At the 1´ carbon atom of each 2-
deoxyribose sugar one nucleobase (adenine, thymine, cytosine or guanine) is linked via a N-glycosidic
bond. Two single DNA strands with an antiparallel orientation build up the DNA double helix [508].
As the DNA is the carrier of genomic information, its structural integrity and stability is vital for each
cell. Any non-physiological modification of the DNA (DNA damage) is, therefore, a harmful threat.
These DNA lesions can cause mutations if they are not repaired or the repair is faulty. Every day cells
suffer a large amount of DNA damage, see Table 4.
Damage type Lesions per
day per cell
oxidative damage 10000 [509, 510]
depurinations 10000 [511, 512]
depyrimidinations 600 [513, 514]
single-strand breaks 55000 [515]
double-strand breaks 10 [516]
alkylations 3000 [517]
deaminations 500 [518] Table 4: DNA damage per cell, per day.
DNA lesions can be induced either by exogenous or endogenous sources. Exogenous sources are
environmental elements or factors and can be either physical or chemical agents like ionizing
irradiations, ultraviolet light, natural occurring radioactive compounds, medical treatment [514, 519,
520]. A big variety of chemical substance can damage the DNA like chemotherapeutics, toxins and
chemical warfare agents [517, 521, 522]. Life style can provide different kinds of sources for
exogenous DNA damages. For instance, cigarette smoke contains various DNA damaging substances.
The diet may contain DNA damaging agents like polycyclic aromatic hydrocarbons and nitrosamines
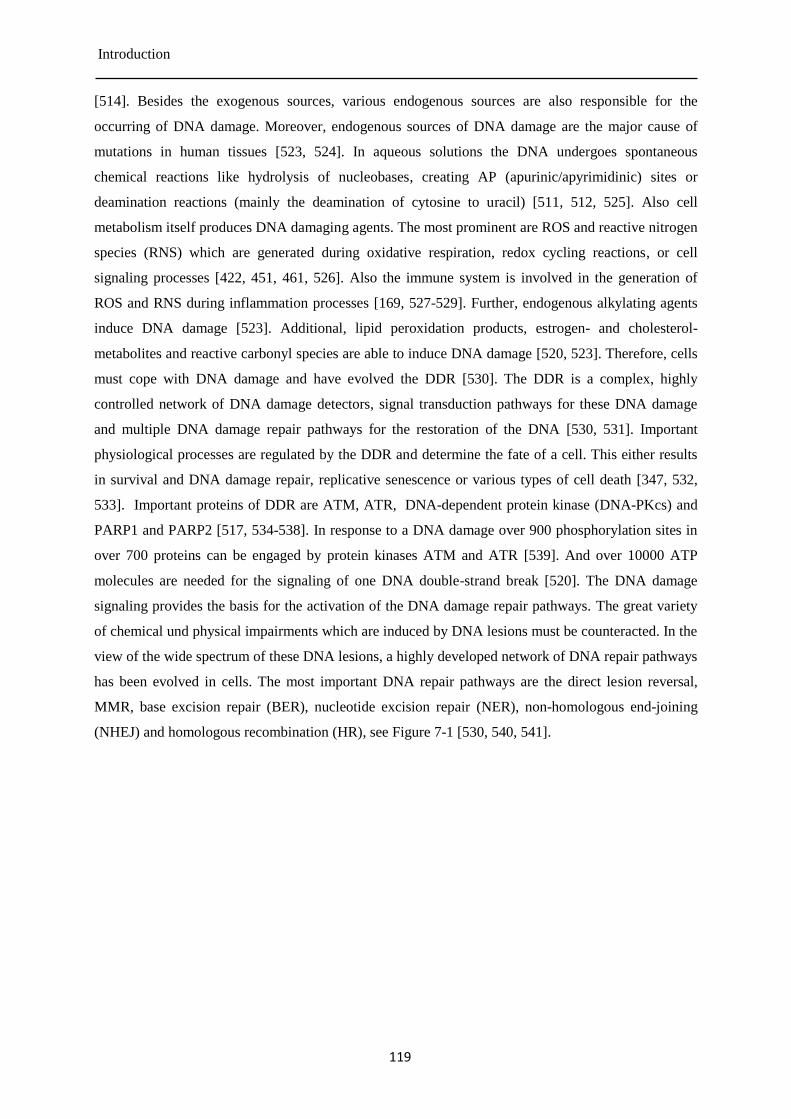
Introduction
119
[514]. Besides the exogenous sources, various endogenous sources are also responsible for the
occurring of DNA damage. Moreover, endogenous sources of DNA damage are the major cause of
mutations in human tissues [523, 524]. In aqueous solutions the DNA undergoes spontaneous
chemical reactions like hydrolysis of nucleobases, creating AP (apurinic/apyrimidinic) sites or
deamination reactions (mainly the deamination of cytosine to uracil) [511, 512, 525]. Also cell
metabolism itself produces DNA damaging agents. The most prominent are ROS and reactive nitrogen
species (RNS) which are generated during oxidative respiration, redox cycling reactions, or cell
signaling processes [422, 451, 461, 526]. Also the immune system is involved in the generation of
ROS and RNS during inflammation processes [169, 527-529]. Further, endogenous alkylating agents
induce DNA damage [523]. Additional, lipid peroxidation products, estrogen- and cholesterol-
metabolites and reactive carbonyl species are able to induce DNA damage [520, 523]. Therefore, cells
must cope with DNA damage and have evolved the DDR [530]. The DDR is a complex, highly
controlled network of DNA damage detectors, signal transduction pathways for these DNA damage
and multiple DNA damage repair pathways for the restoration of the DNA [530, 531]. Important
physiological processes are regulated by the DDR and determine the fate of a cell. This either results
in survival and DNA damage repair, replicative senescence or various types of cell death [347, 532,
533]. Important proteins of DDR are ATM, ATR, DNA-dependent protein kinase (DNA-PKcs) and
PARP1 and PARP2 [517, 534-538]. In response to a DNA damage over 900 phosphorylation sites in
over 700 proteins can be engaged by protein kinases ATM and ATR [539]. And over 10000 ATP
molecules are needed for the signaling of one DNA double-strand break [520]. The DNA damage
signaling provides the basis for the activation of the DNA damage repair pathways. The great variety
of chemical und physical impairments which are induced by DNA lesions must be counteracted. In the
view of the wide spectrum of these DNA lesions, a highly developed network of DNA repair pathways
has been evolved in cells. The most important DNA repair pathways are the direct lesion reversal,
MMR, base excision repair (BER), nucleotide excision repair (NER), non-homologous end-joining
(NHEJ) and homologous recombination (HR), see Figure 7-1 [530, 540, 541].
Introduction
120
Figure 7-1: Overview of DNA lesions and DNA damage repair pathways. Human cells have six main DNA repair
pathway: direct lesion reversal, mismatch repair (MMR), base excision repair (BER), nucleotide excision repair (NER), non-
homologous end joining (NHEJ) and homologous recombination (HR). Each repair pathway is specialized in the removal of
specific DNA lesions which can be inflicted by various sources.
7.2 DNA strand break detection
The high abundance of DNA damage and its threat to health makes it a highly interesting research
area. In a clinical perspective, DNA lesions may be the starting point in carcinogenesis and, therefore,
life-threatening. Otherwise, the majority of therapies to treat cancer are genotoxic agents that kill
cancer cells by inducing DNA damage. Besides the medical aspect, there is a general interest of the
public, authorities and companies in the genotoxic properties of chemical and biological agents. The
exact knowledge of the genotoxic properties of a substance are important for a correct risk assessment,
a harmless production and placing on the market of the substance, but also for a correct use and
disposal of the substance. Therefore, a number of methods for the detection, analysis and
quantification of DNA damage and DNA damage repair have been developed. For some DNA lesions
such as oxidative DNA damage, there is a broad range of methods available for a direct or indirect
detection. However, a highly sensitive, robust, economical and easy-to-implement method for
detection of DNA single- and double-strand breaks is needed. The most common methods for
detection of DNA strand breaks are briefly described below. Based on the used technology the assays
can be divided in molecular and fluorescence methods [542].
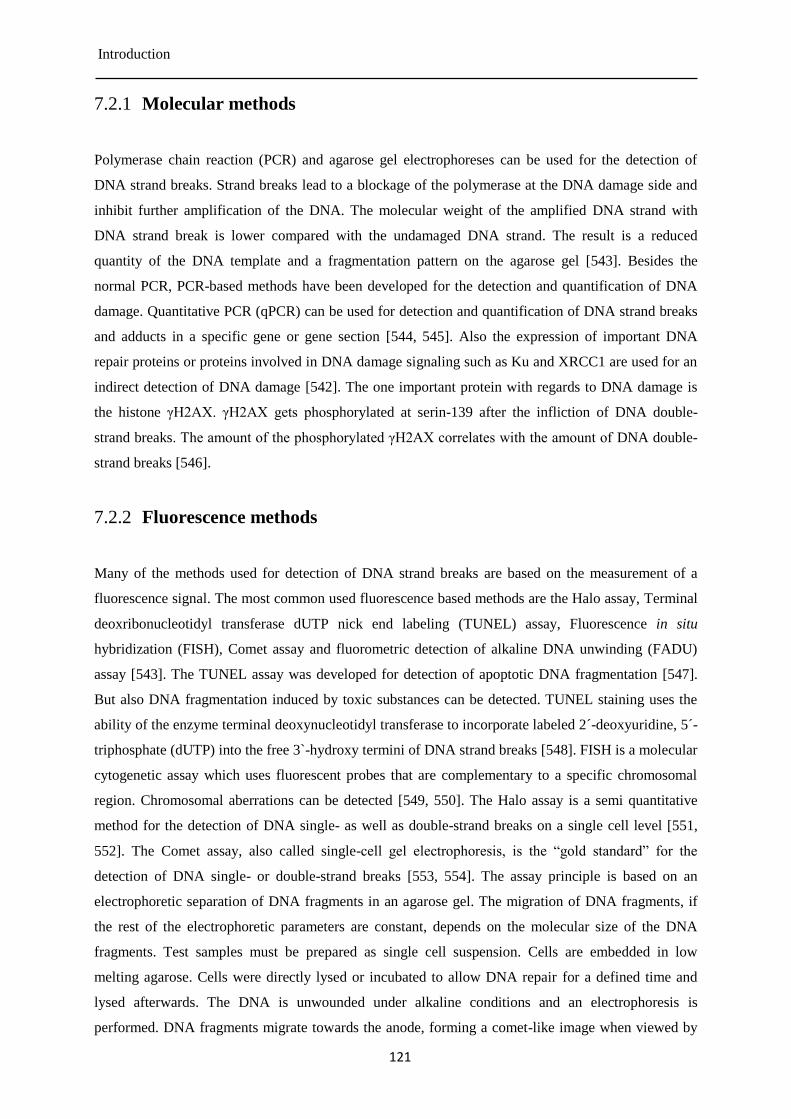
Introduction
121
Molecular methods 7.2.1
Polymerase chain reaction (PCR) and agarose gel electrophoreses can be used for the detection of
DNA strand breaks. Strand breaks lead to a blockage of the polymerase at the DNA damage side and
inhibit further amplification of the DNA. The molecular weight of the amplified DNA strand with
DNA strand break is lower compared with the undamaged DNA strand. The result is a reduced
quantity of the DNA template and a fragmentation pattern on the agarose gel [543]. Besides the
normal PCR, PCR-based methods have been developed for the detection and quantification of DNA
damage. Quantitative PCR (qPCR) can be used for detection and quantification of DNA strand breaks
and adducts in a specific gene or gene section [544, 545]. Also the expression of important DNA
repair proteins or proteins involved in DNA damage signaling such as Ku and XRCC1 are used for an
indirect detection of DNA damage [542]. The one important protein with regards to DNA damage is
the histone γH2AX. γH2AX gets phosphorylated at serin-139 after the infliction of DNA double-
strand breaks. The amount of the phosphorylated γH2AX correlates with the amount of DNA double-
strand breaks [546].
Fluorescence methods 7.2.2
Many of the methods used for detection of DNA strand breaks are based on the measurement of a
fluorescence signal. The most common used fluorescence based methods are the Halo assay, Terminal
deoxribonucleotidyl transferase dUTP nick end labeling (TUNEL) assay, Fluorescence in situ
hybridization (FISH), Comet assay and fluorometric detection of alkaline DNA unwinding (FADU)
assay [543]. The TUNEL assay was developed for detection of apoptotic DNA fragmentation [547].
But also DNA fragmentation induced by toxic substances can be detected. TUNEL staining uses the
ability of the enzyme terminal deoxynucleotidyl transferase to incorporate labeled 2´-deoxyuridine, 5´-
triphosphate (dUTP) into the free 3`-hydroxy termini of DNA strand breaks [548]. FISH is a molecular
cytogenetic assay which uses fluorescent probes that are complementary to a specific chromosomal
region. Chromosomal aberrations can be detected [549, 550]. The Halo assay is a semi quantitative
method for the detection of DNA single- as well as double-strand breaks on a single cell level [551,
552]. The Comet assay, also called single-cell gel electrophoresis, is the “gold standard” for the
detection of DNA single- or double-strand breaks [553, 554]. The assay principle is based on an
electrophoretic separation of DNA fragments in an agarose gel. The migration of DNA fragments, if
the rest of the electrophoretic parameters are constant, depends on the molecular size of the DNA
fragments. Test samples must be prepared as single cell suspension. Cells are embedded in low
melting agarose. Cells were directly lysed or incubated to allow DNA repair for a defined time and
lysed afterwards. The DNA is unwounded under alkaline conditions and an electrophoresis is
performed. DNA fragments migrate towards the anode, forming a comet-like image when viewed by

Introduction
122
fluorescence imaging after staining with a fluorescence dye. The head is formed by the nuclear region
and the tail by DNA fragments. Although the assay principle seems to be simple, various parameters
can influence the results of a Comet assay such as concentration of the agarose, the pH, temperature,
duration of alkaline DNA unwinding, pH of the unwinding buffer, temperature used for the unwinding
and the electrophoretic parameter (voltage, current direct at the sample not measured at the power
supply) [555, 556]. Besides the technical variations, there are also various methods for analyzing the
extant of DNA damage, such as visual scoring, percentage of DNA in the tail (%T), tail length, and
tail moment [557-560]. These variations make the interpretation of results of different laboratories
difficult. Today there are modified Comet assays for the detection of specific DNA lesions. The most
common is the adaption for the detection of oxidative DNA damage, but also assay modifications for
the detection of other DNA lesions are established [561-564]. Several inter-laboratory studies which
have been performed to validate the Comet assay for its reproducibility, showed a high variability
between these laboratories. The first inter-laboratory trail to attempt a standardization of the Comet
assay was performed by the European Standards Committee on Oxidative DNA Damage (ESCOOD).
The goal of one of their studies was to establish the background level of oxidative base damage in
human lymphocyte. Therefore, the Comet assay and HPLC combined with electrochemical detection
were used. The HPLC measured values for oxidative base lesions were about 6-12-fold higher
compared with the values detected by the Comet assay [562]. Moreover, only half of the laboratories
detected a dose response in standardized HeLa cell samples treated with a photosensitizer and light
[561]. The next attempt was an inter-laboratory validation study performed by the European Comet
Assay Validation Group (ECVAG). The study was conducted in 12 laboratories showed overt
differences in the reported DNA damage in standardized samples. All laboratories detected a dose-
response relationship, but the coefficient of variation of the reported DNA damage was 47%.
Normalization by a calibration curve prepared in each laboratory reduced the coefficient of variation
to 28% [558]. To solve such inter-laboratory variability Azqueta et al. and Ersson e. al. demonstrated
the importance of standardized protocols and equipment for the reproducibility of the Comet assay
[556, 565]. Based on these experiences, the Japanese Center for the Validation of Alternative Methods
(JaCVAM) started a new international validation study in 2006 [566]. The objectives of the study were
to demonstrate acceptable intra- and inter-laboratory reproducibility and to demonstrate the ability of
the Comet assay to identify reliable genotoxic chemicals in rodents. The ultimate goal was to establish
an Organization for Economic Co-operation and Development (OECD) guideline for the Comet assay
[566]. Moreover, the performance of the Comet assay was compared with the rat liver unscheduled
DNA synthesis (UDS) assay. Therefore, the genotoxic features of 40 reference chemicals were tested
in rats by the Comet assay [567]. In a pre-validation study a standardized protocol of the Comet assay
was created and reproducibility of the Comet assay was evaluated in five lead laboratories [568]. In
the main validation the 40 selected chemicals were tested in a blind study in 14 laboratories with the
standardized protocol. The results of the validation showed that the Comet assay fulfills the main task,
Introduction
123
the detection of genotoxic and carcinogenic chemicals that induce DNA damage. The results also
showed that the Comet assay could be at least equal to or maybe more sensitive in the detection of
genotoxic carcinogens than the UDS assay [569]. The JaCVAM study finally lead to the release of the
OECD guideline “guideline for the testing of chemicals In vivo mammalian alkaline comet assay”
(OECD/OCDE 489). However, the guideline also mentioned drawbacks of the current Comet assay
protocol such as: the Comet assay is not suitable for the detection of DNA damage in germ cells,
cross-link DNA damage cannot be detected, the protocol is only validated for rodent and only for liver
and stomach tissues, methodological aspects and experience of the experimenter have a critical impact
on reliability and reproducibility on the result, based on the present data, no cytotoxicity pre-test was
recommended [570]. Based on the major drawbacks of the Comet assay, the influence of the
experimenter on the results, the difficulties in intra- and inter-laboratory reproducibility and the time-
consumption of the Comet assay an automated version of the FADU assay was developed in our lab
[571].
7.3 Automated fluorometric detection of alkaline DNA
unwinding (FADU) assay
The FADU method was original described in 1981 by Birmboim and Jevcak [572]. The method is
based on the principle that the ends of DNA strands are starting points for the unwinding of the DNA
double helix into single stranded DNA. Such “ends” can either be natural, like chromosome ends,
replication forks or can be caused by DNA damaging agents, like X-rays or chemical agents. The
unwinding of the DNA is depending on the pH, temperature, and time. It is detected with the help of
fluorescence dyes that binds to double-stranded DNA. The more double-stranded DNA is present in a
sample, the higher the fluorescence signal is. DNA single- and double-strand breaks reduce the
fluorescence signal, because they are additional starting points for the unwinding of the DNA. The
amount of unwound DNA in a defined period of time depends on the amount of DNA strand breaks.
Hence, the fluorescence signal is inversely proportional to the amount of DNA strand breaks. Moreno-
Villanueva et al. introduced an automated form of the FADU assay, based on a liquid handling device
[571, 573]. This allows an accurate controlling of all important parameter and leads to an increase in
the reproducibility, sensitivity, and reduces the duration of the assay. The main advantages of the
automated FADU assay compared with the Comet assay are, all critical assay steps are automized and
the FADU assay takes only 174 min, while the Comet assay takes up to 715 min, see Figure 7-2 [574].
Furthermore, SYBR Green I is used for the detection of double-stranded DNA. In general, the
automated FADU assay consists of the following steps: first, cells are harvested and prepared for the
assay. Second, cells are treated with the test compound for a desired period of time. Optionally, the
chemical agent can be removed and cells can be cultured for a desired period of time. This allows cells
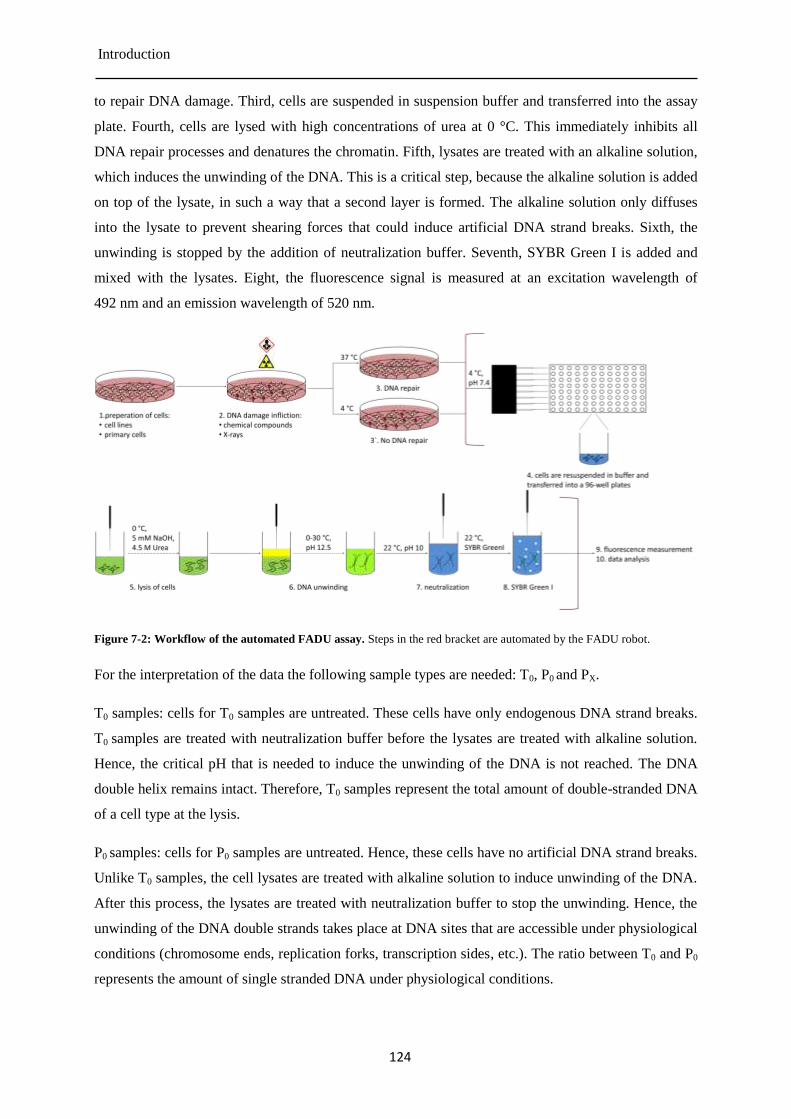
Introduction
124
to repair DNA damage. Third, cells are suspended in suspension buffer and transferred into the assay
plate. Fourth, cells are lysed with high concentrations of urea at 0 °C. This immediately inhibits all
DNA repair processes and denatures the chromatin. Fifth, lysates are treated with an alkaline solution,
which induces the unwinding of the DNA. This is a critical step, because the alkaline solution is added
on top of the lysate, in such a way that a second layer is formed. The alkaline solution only diffuses
into the lysate to prevent shearing forces that could induce artificial DNA strand breaks. Sixth, the
unwinding is stopped by the addition of neutralization buffer. Seventh, SYBR Green I is added and
mixed with the lysates. Eight, the fluorescence signal is measured at an excitation wavelength of
492 nm and an emission wavelength of 520 nm.
Figure 7-2: Workflow of the automated FADU assay. Steps in the red bracket are automated by the FADU robot.
For the interpretation of the data the following sample types are needed: T0, P0 and PX.
T0 samples: cells for T0 samples are untreated. These cells have only endogenous DNA strand breaks.
T0 samples are treated with neutralization buffer before the lysates are treated with alkaline solution.
Hence, the critical pH that is needed to induce the unwinding of the DNA is not reached. The DNA
double helix remains intact. Therefore, T0 samples represent the total amount of double-stranded DNA
of a cell type at the lysis.
P0 samples: cells for P0 samples are untreated. Hence, these cells have no artificial DNA strand breaks.
Unlike T0 samples, the cell lysates are treated with alkaline solution to induce unwinding of the DNA.
After this process, the lysates are treated with neutralization buffer to stop the unwinding. Hence, the
unwinding of the DNA double strands takes place at DNA sites that are accessible under physiological
conditions (chromosome ends, replication forks, transcription sides, etc.). The ratio between T0 and P0
represents the amount of single stranded DNA under physiological conditions.
Material and Methods
125
PX samples: cells for PX samples are treated by a chemical test compound or by irradiation. Depending
on the test compound, this treatment can induce exogenous DNA strand breaks. The ratio between P0
and PX represents the extent of the induced DNA strand breaks. Based on the automated FADU assay
developed by the Bürkle laboratory, a commercially available version should be developed [571].
Moreover, the new FADU platform should be used in the parallel conducted studies with isoproterenol
to measure DNA strand breaks in human PBMCs.
8 Material and Methods
8.1 Material
Chemicals 8.1.1
Substance Supplier
4-nitrophenol Sigma-Aldrich, Steinheim, Germany
8-hydroxyquinoline Sigma-Aldrich, Steinheim, Germany
CasyClean OMNI Life Science GmbH, Bremen, Germany
CasyTon OMNI Life Science GmbH, Bremen, Germany
cyclohexyl-diaminetetraacetate Sigma-Aldrich, Steinheim, Germany
D-(+)-glucose-monohydrate Merck, Darmstadt, Germany
DMEM Gibco Life Technologies, Karlsruhe, Germany
DMSO Merck, Darmstadt, Germany
DTT Sigma-Aldrich, Steinheim, Germany
EDTA Sigma-Aldrich, Steinheim, Germany
ethanol pa VWR, Darmstadt, Germany
etoposide Sigma-Aldrich, Steinheim, Germany
eugenol Sigma-Aldrich, Steinheim, Germany
FCS Biochrome, Berlin, Germany
HCl 37% Riedel-de Haen, Seelze, Germany
menthol Sigma-Aldrich, Steinheim, Germany
MTT Sigma-Aldrich, Steinheim, Germany
myo-inositol Sigma-Aldrich, Steinheim, Germany
PBS Biochrome, Berlin, Germany
penicillin/streptomycin (5000 units/ml) Gibco Life Technologies, Karlsruhe, Germany
p-nitrophenol Sigma-Aldrich, Steinheim, Germany
potassium dihydrogen phosphate Riedel-de Haen, Seelze, Germany
RPMI-1640 Gibco Life Technologies, Karlsruhe, Germany
saccharin Sigma-Aldrich, Steinheim, Germany
SDS Sigma-Aldrich, Steinheim, Germany
Material and Methods
126
sodium chloride Carl Roth, Karlsruhe, Germany
sodium hydroxide Merck, Darmstadt, Germany
sodium-deoxycholat Merck, Darmstadt, Germany
SYBER Green I Sigma-Aldrich, Steinheim, Germany
SYBR Green I Invitrogen, Karlsruhe, Germany
Tris-HCl Sigma-Aldrich, Steinheim, Germany
Trypan blue Sigma-Aldrich, Steinheim, Germany
trypsin-EDTA Gibco Life Technologies, Karlsruhe, Germany
urea Carl Roth, Karlsruhe, Germany
β-mercaptoethanol Merck, Darmstadt, Germany
Laboratory equipment 8.1.2
Object Type Supplier
384-Deep well microplates 384er Deep-well BRAND
96-Deep well microplates 96er Deep-well Greiner Bio-One
benchtop centrifuge Biofuge pico Heraeus Instruments
benchtop centrifuge Heraeus Fresco 17 Thermo Scientific,
Schwerte, Germany
benchtop centrifuge 5810 R Eppendorf
benchtop centrifuge Pico17 Hereaus
biological safety cabinet S2 HeraSafe Heraeus Instruments
biological safety cabinet S2 Lamin Air HB 2448 Heraeus
cell counter Casy CellCounter TT Innovatis
cell culture microscope Axiovert40C Zeiss
centrifuge 5810R Eppendorf
dosimeter UNIDOSE PTW
FADU-assay 96-well plate 96er Deep-well Greiner Bio-One
fluorescence reader FL600 Bio-TEK
fridge Premium Liebherr
glassware Schott, Mainz, Germany
hemocytometer Casy Innovartis
ice maker AF206 Scotsman
incubator Hera Cell 240 Heraeus Instruments
incubator Hera Cell Heraeus Instruments
magnetic stirrers IKAM Häberle Labortechnik
magnetic stirrers MR3001K Heidolph
micro clear platte 96-well for TOXXs Analyzer Greiner Bio-One
micro platte black bottom for TOXXs Analyzer Greiner Bio-One
micro scales CP2202S Sartorius
micro scales CP225D Sartorius
microscope Leitz DK IL Leica
MilliQ Reference A+ Millipore
minisaker Duomax 1030 Heidolph
minisaker MTS4 IKA
Material and Methods
127
pipetboy Pipetboy Comfort IBS Integra Biosiences
pipettes 0,1-2 µl Eppendorf
pipettes 0,5-10 µl Eppendorf
pipettes 2-20 µl Eppendorf
pipettes 10-100 µl Eppendorf
pipettes 20-200 µl Eppendorf
pipettes 100-1000 µl Eppendorf
pipetting head for
TOXXs Analyzer
R96/250 S/N CyBio AG
pipetting robot Genesis RSP 100 Tecan
pipetting robot Genesis RSP 150 Tecan
printer C3760dn Dell
scale AG 204 Delta Range Mettler
scale PM2000 Mettler
sonicater Sonorex Super RK102H Bandelin
sonicater TK52 Bandelin
thermostat Lauda cooler R204 Lauda cooler
thermostat for
TOXXs Analyzer
PelTherm 3T GmbH & Co. KG
thermostat Ecoline RE204 Lauda
TOXXs Analyzer
TOXXs Analyze
(based on the CyBio Felix)
Cetics GmbH/ Analytik
Jena AG
vortexer Vortex-Genie 2 Bender & Hobein AG
water bath 1083 GFL
water bath 1002 GFL
X-ray system XRAD 225IX PXI PRECISION X-
RAY
Consumables 8.1.3
Product Supplier
384-well microplate for cAMP assay Perkinelmer
Casy cup
OMNI Life Science GmbH, Bremen,
Germany
cell culture 96-well microplate Corning, Schiphol-Rijk, Netherlands
cell culture flask T 175 Corning, Schiphol-Rijk, Netherlands
cell culture flask T 25 Corning, Schiphol-Rijk, Netherlands
cell culture flask T 75 Corning, Schiphol-Rijk, Netherlands
cryovials Corning, Schiphol-Rijk, Netherlands
conical tube (15 ml) Corning, Schiphol-Rijk, Netherlands
conical tube (50 ml) Corning, Schiphol-Rijk, Netherlands
glassware Schott, Mainz, Germany
gloves (Latex) MaiMed, Neuenkirchen, Germany
gloves (Nitril) VWR, Darmstadt, Germany
serological pipette (10 ml stripette) Corning, Schiphol-Rijk, Netherlands
serological pipette (25 ml stripette) Corning, Schiphol-Rijk, Netherlands
Material and Methods
128
serological pipette (5 ml stripette) Corning, Schiphol-Rijk, Netherlands
reaction vessel (SafeSeal 0.5 ml) Sarstedt, Nürnbrecht, Germany
reaction vessel (SafeSeal 1.5 ml) Sarstedt, Nürnbrecht, Germany
reaction vessel (SafeSeal 2 ml) Sarstedt, Nürnbrecht, Germany
Safety-Multifly-canula G21/0.8 mm Sarstedt, Nürnbrecht, Germany
tips (1000 µl) Sarstedt, Nürnbrecht, Germany
tips (20 µl) Sarstedt, Nürnbrecht, Germany
tips (200 µl) Sarstedt, Nürnbrecht, Germany
tips long (200 µl) VWR, Darmstadt, Germany
Buffers and solutions 8.1.4
FADU suspension buffer
0.25 M myo-inositol
10 mM sodium phosphate
1 mM magnesium chloride
add MilliQ water
adjust pH (7.4)
FADU neutralization buffer
1 M D-(+)-glucose-monohydrate
14 mM β-mercapthoethanol
add MilliQ water
"modified" FADU neutralization buffer
1 M D-(+)-glucose-monohydrate
7 mM DTT
add MilliQ water
FADU lysis buffer
9 M urea
10 mM sodium hydroxide
2.5 mM cyclohexyl-diaminetetraacetate
0.1% (w/v) SDS
add MilliQ water
FADU alkaline unwinding buffer
42.5% FADU lysis buffer
0.2 M sodium hydroxide
add MilliQ water
PBS (pH 7.4)
137 mM sodium chloride
2.7 mM potassium hydrogen phosphate
8.1 mM disodium hydrogen phosphate
Material and Methods
129
1.8 mM potassium dihydrogen phosphate
add MilliQ water
MTT solution (MTT assay)
5 mg/ml MTT
add PBS
MTT solubilisation solution (MTT assay)
10% (w/v) SDS
10 mM HCl
Cell lines and cell culture reagents 8.1.5
Cell line Basal medium Supplements
Jurkat RPMI-1640
10% (v/v) FCS,
50 units/ml penicillin,
5 µg/ml streptomycin, 10 µg/ml neomycin
A549 RPMI-1641
10% (v/v) FCS,
50 units/ml penicillin,
5 µg/ml streptomycin,
10 µg/ml neomycin
8.2 Methods
Freezing of cells 8.2.1
For long time storage cells were frozen and kept in liquid nitrogen. Cells were passaged as described
below. The cell number was adjusted to 2*106 cells/ml. This cell suspension was mixed (1:1) with pre-
cooled (4 °C) two-fold freezing medium (cell culture medium, 20% DMSO and 30% FCS). The cell
suspension was aliquoted in cryovials, 1 ml per vial. The cryovials were put into a freezing container
filled with isopropanol and incubated at -80 °C overnight. On the next day the cryovials were
transferred into a cryotank filled with liquid nitrogen for long term storage.
Thawing of cells 8.2.2
Cell culture medium was pre-warmed to 37 °C in the water bath. For each cell aliquot, one 15 ml
conical tube was filled with 9 ml pre-warmed cell culture medium. The cryovials with cell aliquots
were taken from the liquid nitrogen storage (-197 °C) and cells were thawed in a water bath at 37 °C.
Immediately after the last ice crystals were melted, the cell suspension was transferred into a 15 ml
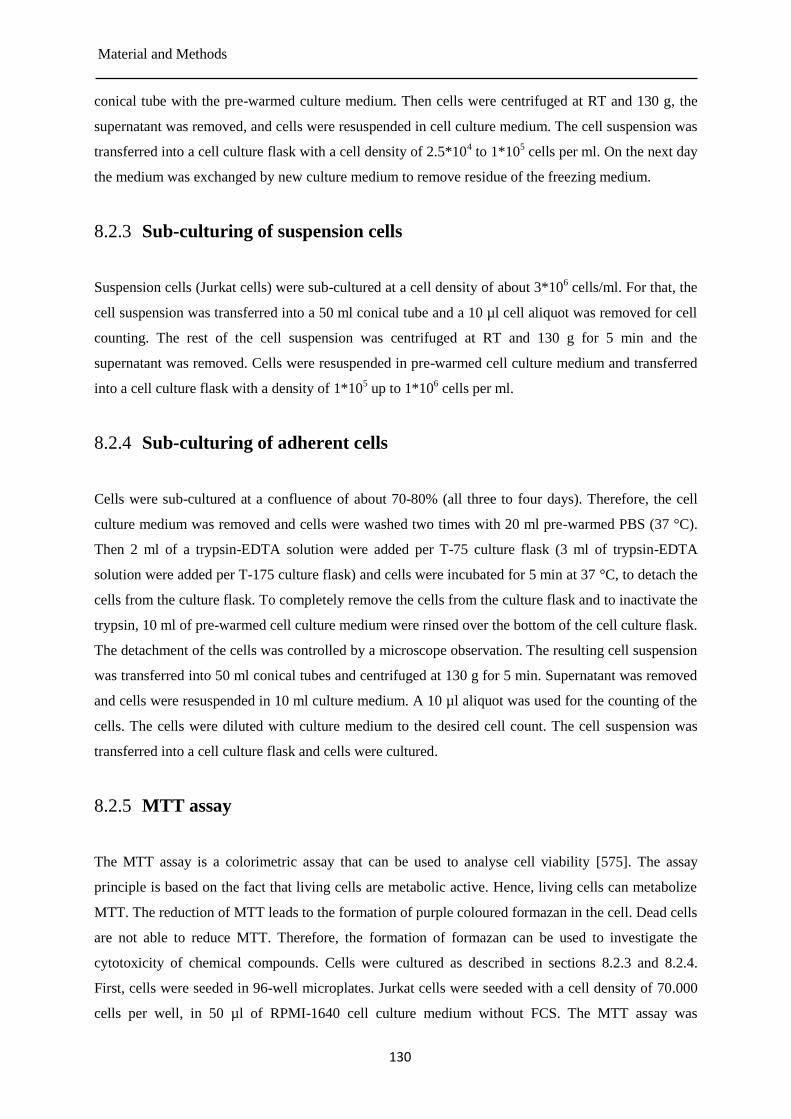
Material and Methods
130
conical tube with the pre-warmed culture medium. Then cells were centrifuged at RT and 130 g, the
supernatant was removed, and cells were resuspended in cell culture medium. The cell suspension was
transferred into a cell culture flask with a cell density of 2.5*104 to 1*10
5 cells per ml. On the next day
the medium was exchanged by new culture medium to remove residue of the freezing medium.
Sub-culturing of suspension cells 8.2.3
Suspension cells (Jurkat cells) were sub-cultured at a cell density of about 3*106 cells/ml. For that, the
cell suspension was transferred into a 50 ml conical tube and a 10 µl cell aliquot was removed for cell
counting. The rest of the cell suspension was centrifuged at RT and 130 g for 5 min and the
supernatant was removed. Cells were resuspended in pre-warmed cell culture medium and transferred
into a cell culture flask with a density of 1*105 up to 1*10
6 cells per ml.
Sub-culturing of adherent cells 8.2.4
Cells were sub-cultured at a confluence of about 70-80% (all three to four days). Therefore, the cell
culture medium was removed and cells were washed two times with 20 ml pre-warmed PBS (37 °C).
Then 2 ml of a trypsin-EDTA solution were added per T-75 culture flask (3 ml of trypsin-EDTA
solution were added per T-175 culture flask) and cells were incubated for 5 min at 37 °C, to detach the
cells from the culture flask. To completely remove the cells from the culture flask and to inactivate the
trypsin, 10 ml of pre-warmed cell culture medium were rinsed over the bottom of the cell culture flask.
The detachment of the cells was controlled by a microscope observation. The resulting cell suspension
was transferred into 50 ml conical tubes and centrifuged at 130 g for 5 min. Supernatant was removed
and cells were resuspended in 10 ml culture medium. A 10 µl aliquot was used for the counting of the
cells. The cells were diluted with culture medium to the desired cell count. The cell suspension was
transferred into a cell culture flask and cells were cultured.
MTT assay 8.2.5
The MTT assay is a colorimetric assay that can be used to analyse cell viability [575]. The assay
principle is based on the fact that living cells are metabolic active. Hence, living cells can metabolize
MTT. The reduction of MTT leads to the formation of purple coloured formazan in the cell. Dead cells
are not able to reduce MTT. Therefore, the formation of formazan can be used to investigate the
cytotoxicity of chemical compounds. Cells were cultured as described in sections 8.2.3 and 8.2.4.
First, cells were seeded in 96-well microplates. Jurkat cells were seeded with a cell density of 70.000
cells per well, in 50 µl of RPMI-1640 cell culture medium without FCS. The MTT assay was
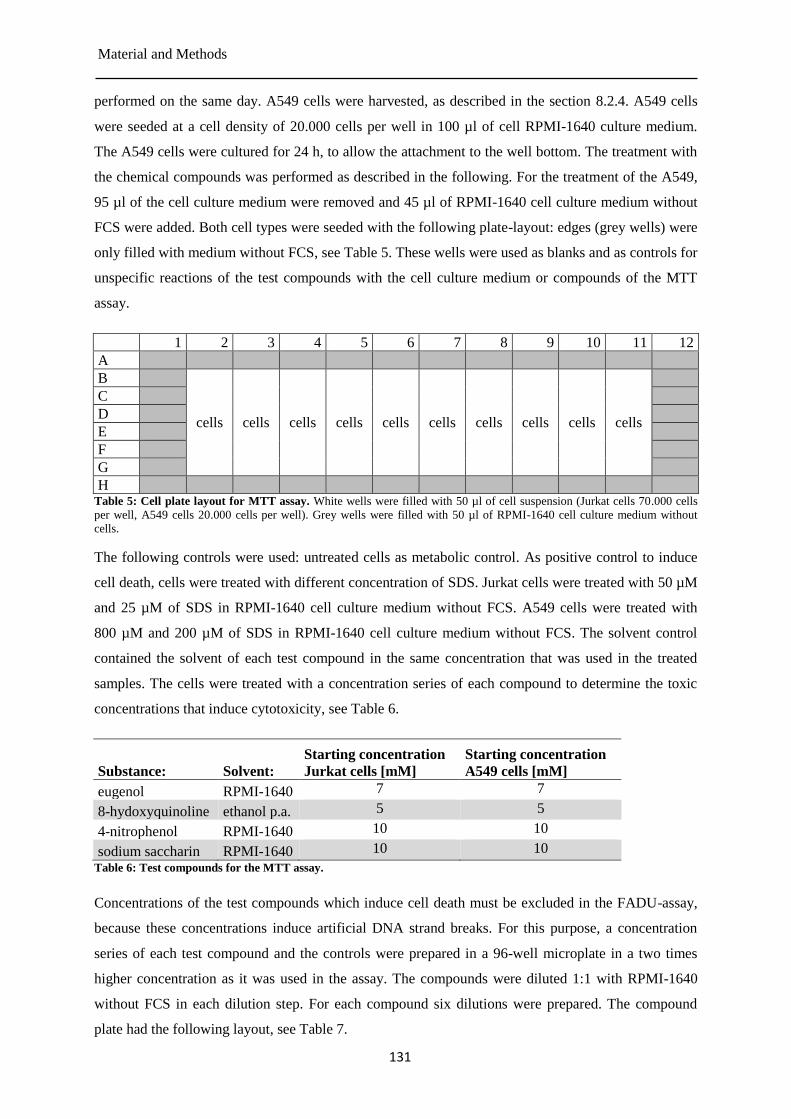
Material and Methods
131
performed on the same day. A549 cells were harvested, as described in the section 8.2.4. A549 cells
were seeded at a cell density of 20.000 cells per well in 100 µl of cell RPMI-1640 culture medium.
The A549 cells were cultured for 24 h, to allow the attachment to the well bottom. The treatment with
the chemical compounds was performed as described in the following. For the treatment of the A549,
95 µl of the cell culture medium were removed and 45 µl of RPMI-1640 cell culture medium without
FCS were added. Both cell types were seeded with the following plate-layout: edges (grey wells) were
only filled with medium without FCS, see Table 5. These wells were used as blanks and as controls for
unspecific reactions of the test compounds with the cell culture medium or compounds of the MTT
assay.
1 2 3 4 5 6 7 8 9 10 11 12
A
B
cells cells cells cells cells cells cells cells cells cells
C
D
E
F
G
H Table 5: Cell plate layout for MTT assay. White wells were filled with 50 µl of cell suspension (Jurkat cells 70.000 cells
per well, A549 cells 20.000 cells per well). Grey wells were filled with 50 µl of RPMI-1640 cell culture medium without
cells.
The following controls were used: untreated cells as metabolic control. As positive control to induce
cell death, cells were treated with different concentration of SDS. Jurkat cells were treated with 50 µM
and 25 µM of SDS in RPMI-1640 cell culture medium without FCS. A549 cells were treated with
800 µM and 200 µM of SDS in RPMI-1640 cell culture medium without FCS. The solvent control
contained the solvent of each test compound in the same concentration that was used in the treated
samples. The cells were treated with a concentration series of each compound to determine the toxic
concentrations that induce cytotoxicity, see Table 6.
Substance: Solvent:
Starting concentration
Jurkat cells [mM]
Starting concentration
A549 cells [mM]
eugenol RPMI-1640 7 7
8-hydoxyquinoline ethanol p.a. 5 5
4-nitrophenol RPMI-1640 10 10
sodium saccharin RPMI-1640 10 10
Table 6: Test compounds for the MTT assay.
Concentrations of the test compounds which induce cell death must be excluded in the FADU-assay,
because these concentrations induce artificial DNA strand breaks. For this purpose, a concentration
series of each test compound and the controls were prepared in a 96-well microplate in a two times
higher concentration as it was used in the assay. The compounds were diluted 1:1 with RPMI-1640
without FCS in each dilution step. For each compound six dilutions were prepared. The compound
plate had the following layout, see Table 7.
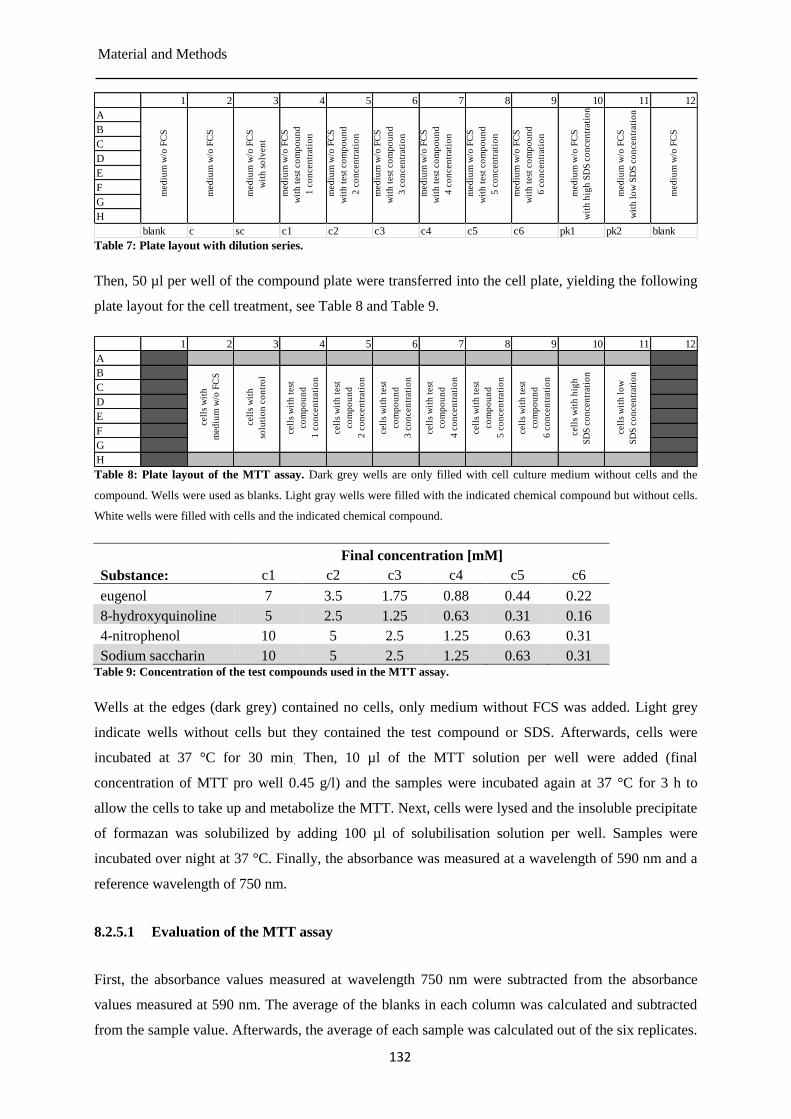
Material and Methods
132
Table 7: Plate layout with dilution series.
Then, 50 µl per well of the compound plate were transferred into the cell plate, yielding the following
plate layout for the cell treatment, see Table 8 and Table 9.
Table 8: Plate layout of the MTT assay. Dark grey wells are only filled with cell culture medium without cells and the
compound. Wells were used as blanks. Light gray wells were filled with the indicated chemical compound but without cells.
White wells were filled with cells and the indicated chemical compound.
Final concentration [mM]
Substance: c1 c2 c3 c4 c5 c6
eugenol 7 3.5 1.75 0.88 0.44 0.22
8-hydroxyquinoline 5 2.5 1.25 0.63 0.31 0.16
4-nitrophenol 10 5 2.5 1.25 0.63 0.31
Sodium saccharin 10 5 2.5 1.25 0.63 0.31 Table 9: Concentration of the test compounds used in the MTT assay.
Wells at the edges (dark grey) contained no cells, only medium without FCS was added. Light grey
indicate wells without cells but they contained the test compound or SDS. Afterwards, cells were
incubated at 37 °C for 30 min. Then, 10 µl of the MTT solution per well were added (final
concentration of MTT pro well 0.45 g/l) and the samples were incubated again at 37 °C for 3 h to
allow the cells to take up and metabolize the MTT. Next, cells were lysed and the insoluble precipitate
of formazan was solubilized by adding 100 µl of solubilisation solution per well. Samples were
incubated over night at 37 °C. Finally, the absorbance was measured at a wavelength of 590 nm and a
reference wavelength of 750 nm.
8.2.5.1 Evaluation of the MTT assay
First, the absorbance values measured at wavelength 750 nm were subtracted from the absorbance
values measured at 590 nm. The average of the blanks in each column was calculated and subtracted
from the sample value. Afterwards, the average of each sample was calculated out of the six replicates.
1 2 3 4 5 6 7 8 9 10 11 12
A
B
C
D
E
F
G
H
blank c sc c1 c2 c3 c4 c5 c6 pk1 pk2 blank
med
ium
w/o
FC
S
wit
h t
est
co
mp
ou
nd
3 c
on
cen
trati
on
med
ium
w/o
FC
S
wit
h t
est
co
mp
ou
nd
4 c
on
cen
trati
on
med
ium
w/o
FC
S
wit
h t
est
co
mp
ou
nd
5 c
on
cen
trati
on
med
ium
w/o
FC
S
med
ium
w/o
FC
S
med
ium
w/o
FC
S
wit
h s
olv
en
t
med
ium
w/o
FC
S
wit
h t
est
co
mp
ou
nd
1 c
on
cen
trati
on
med
ium
w/o
FC
S
wit
h t
est
co
mp
ou
nd
2 c
on
cen
trati
on
med
ium
w/o
FC
S
wit
h t
est
co
mp
ou
nd
6 c
on
cen
trati
on
med
ium
w/o
FC
S
wit
h h
igh
SD
S c
on
cen
trati
on
med
ium
w/o
FC
S
wit
h l
ow
SD
S c
on
cen
trati
on
med
ium
w/o
FC
S
1 2 3 4 5 6 7 8 9 10 11 12
A
B
C
D
E
F
G
H
cell
s w
ith
med
ium
w/o
FC
S
cell
s w
ith
solu
tio
n c
on
tro
l
cell
s w
ith
test
co
mp
ou
nd
1 c
on
cen
trati
on
cell
s w
ith
test
co
mp
ou
nd
2 c
on
cen
trati
on
cell
s w
ith
test
co
mp
ou
nd
3 c
on
cen
trati
on
cell
s w
ith
test
co
mp
ou
nd
4 c
on
cen
trati
on
cell
s w
ith
test
co
mp
ou
nd
5 c
on
cen
trati
on
cell
s w
ith
test
co
mp
ou
nd
6 c
on
cen
trati
on
cell
s w
ith
hig
h
SD
S c
on
cen
trati
on
cell
s w
ith
lo
w
SD
S c
on
cen
trati
on
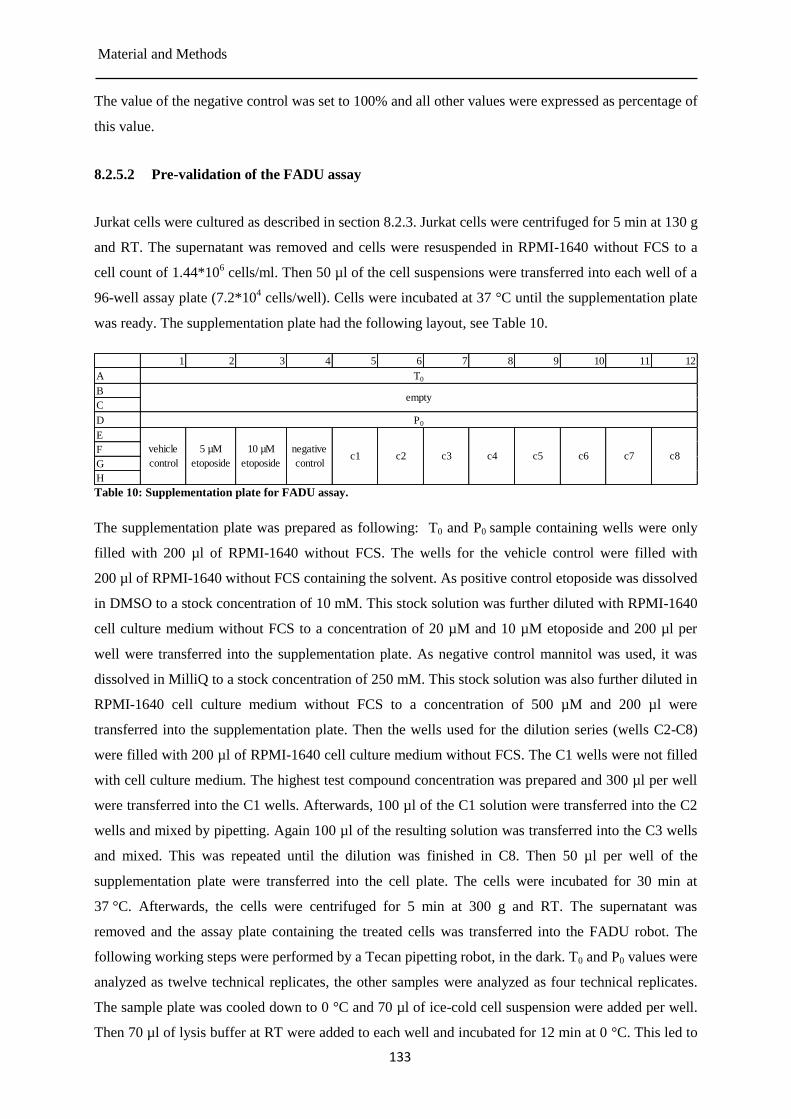
Material and Methods
133
The value of the negative control was set to 100% and all other values were expressed as percentage of
this value.
8.2.5.2 Pre-validation of the FADU assay
Jurkat cells were cultured as described in section 8.2.3. Jurkat cells were centrifuged for 5 min at 130 g
and RT. The supernatant was removed and cells were resuspended in RPMI-1640 without FCS to a
cell count of 1.44*106 cells/ml. Then 50 µl of the cell suspensions were transferred into each well of a
96-well assay plate (7.2*104 cells/well). Cells were incubated at 37 °C until the supplementation plate
was ready. The supplementation plate had the following layout, see Table 10.
Table 10: Supplementation plate for FADU assay.
The supplementation plate was prepared as following: T0 and P0 sample containing wells were only
filled with 200 µl of RPMI-1640 without FCS. The wells for the vehicle control were filled with
200 µl of RPMI-1640 without FCS containing the solvent. As positive control etoposide was dissolved
in DMSO to a stock concentration of 10 mM. This stock solution was further diluted with RPMI-1640
cell culture medium without FCS to a concentration of 20 µM and 10 µM etoposide and 200 µl per
well were transferred into the supplementation plate. As negative control mannitol was used, it was
dissolved in MilliQ to a stock concentration of 250 mM. This stock solution was also further diluted in
RPMI-1640 cell culture medium without FCS to a concentration of 500 µM and 200 µl were
transferred into the supplementation plate. Then the wells used for the dilution series (wells C2-C8)
were filled with 200 µl of RPMI-1640 cell culture medium without FCS. The C1 wells were not filled
with cell culture medium. The highest test compound concentration was prepared and 300 µl per well
were transferred into the C1 wells. Afterwards, 100 µl of the C1 solution were transferred into the C2
wells and mixed by pipetting. Again 100 µl of the resulting solution was transferred into the C3 wells
and mixed. This was repeated until the dilution was finished in C8. Then 50 µl per well of the
supplementation plate were transferred into the cell plate. The cells were incubated for 30 min at
37 °C. Afterwards, the cells were centrifuged for 5 min at 300 g and RT. The supernatant was
removed and the assay plate containing the treated cells was transferred into the FADU robot. The
following working steps were performed by a Tecan pipetting robot, in the dark. T0 and P0 values were
analyzed as twelve technical replicates, the other samples were analyzed as four technical replicates.
The sample plate was cooled down to 0 °C and 70 µl of ice-cold cell suspension were added per well.
Then 70 µl of lysis buffer at RT were added to each well and incubated for 12 min at 0 °C. This led to
1 2 3 4 5 6 7 8 9 10 11 12
A
B
C
D
E
F
G
H
c4 c5 c6 c7 c8
T0
empty
P0
vehicle
control
5 µM
etoposide
10 µM
etoposide
negative
controlc1 c2 c3
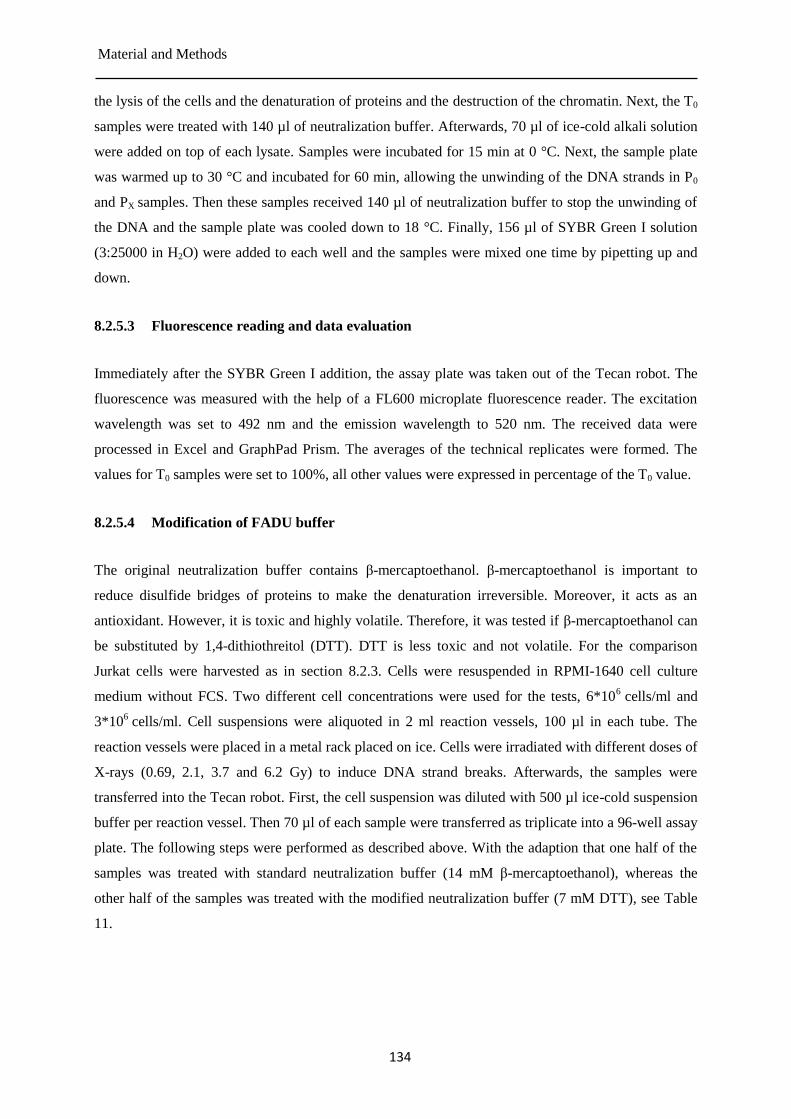
Material and Methods
134
the lysis of the cells and the denaturation of proteins and the destruction of the chromatin. Next, the T0
samples were treated with 140 µl of neutralization buffer. Afterwards, 70 µl of ice-cold alkali solution
were added on top of each lysate. Samples were incubated for 15 min at 0 °C. Next, the sample plate
was warmed up to 30 °C and incubated for 60 min, allowing the unwinding of the DNA strands in P0
and PX samples. Then these samples received 140 µl of neutralization buffer to stop the unwinding of
the DNA and the sample plate was cooled down to 18 °C. Finally, 156 µl of SYBR Green I solution
(3:25000 in H2O) were added to each well and the samples were mixed one time by pipetting up and
down.
8.2.5.3 Fluorescence reading and data evaluation
Immediately after the SYBR Green I addition, the assay plate was taken out of the Tecan robot. The
fluorescence was measured with the help of a FL600 microplate fluorescence reader. The excitation
wavelength was set to 492 nm and the emission wavelength to 520 nm. The received data were
processed in Excel and GraphPad Prism. The averages of the technical replicates were formed. The
values for T0 samples were set to 100%, all other values were expressed in percentage of the T0 value.
8.2.5.4 Modification of FADU buffer
The original neutralization buffer contains β-mercaptoethanol. β-mercaptoethanol is important to
reduce disulfide bridges of proteins to make the denaturation irreversible. Moreover, it acts as an
antioxidant. However, it is toxic and highly volatile. Therefore, it was tested if β-mercaptoethanol can
be substituted by 1,4-dithiothreitol (DTT). DTT is less toxic and not volatile. For the comparison
Jurkat cells were harvested as in section 8.2.3. Cells were resuspended in RPMI-1640 cell culture
medium without FCS. Two different cell concentrations were used for the tests, 6*106
cells/ml and
3*106 cells/ml. Cell suspensions were aliquoted in 2 ml reaction vessels, 100 µl in each tube. The
reaction vessels were placed in a metal rack placed on ice. Cells were irradiated with different doses of
X-rays (0.69, 2.1, 3.7 and 6.2 Gy) to induce DNA strand breaks. Afterwards, the samples were
transferred into the Tecan robot. First, the cell suspension was diluted with 500 µl ice-cold suspension
buffer per reaction vessel. Then 70 µl of each sample were transferred as triplicate into a 96-well assay
plate. The following steps were performed as described above. With the adaption that one half of the
samples was treated with standard neutralization buffer (14 mM β-mercaptoethanol), whereas the
other half of the samples was treated with the modified neutralization buffer (7 mM DTT), see Table
11.
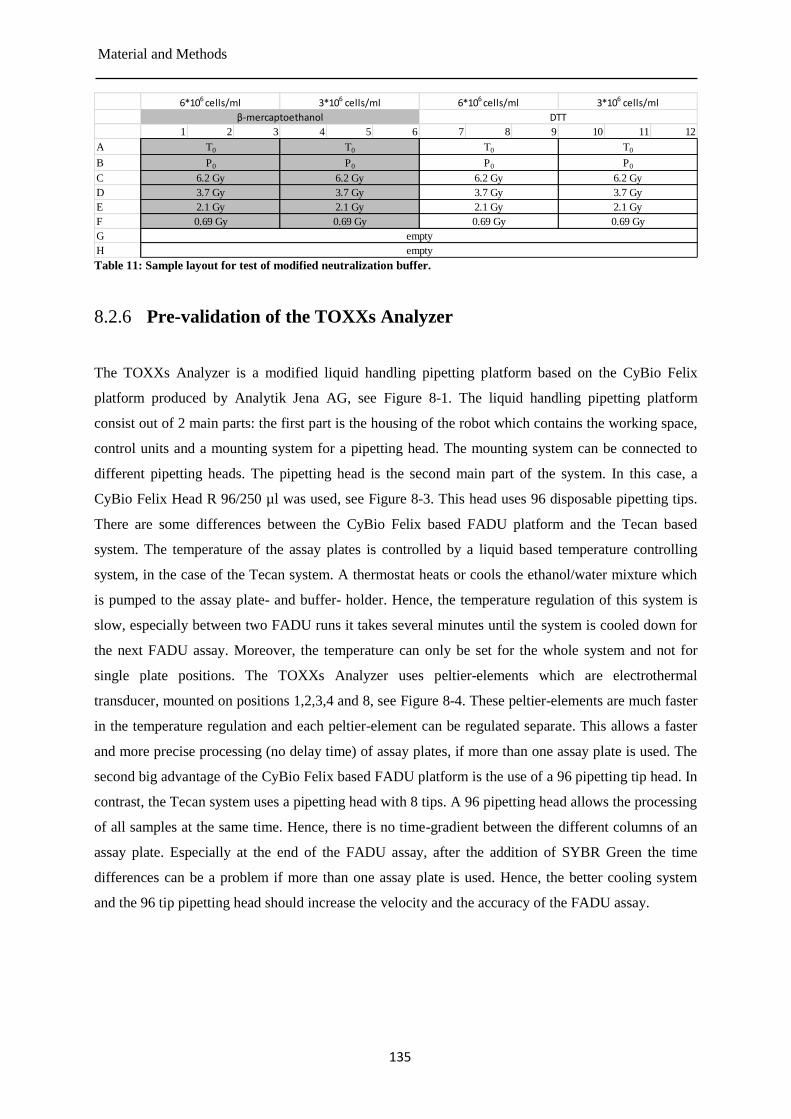
Material and Methods
135
Table 11: Sample layout for test of modified neutralization buffer.
Pre-validation of the TOXXs Analyzer 8.2.6
The TOXXs Analyzer is a modified liquid handling pipetting platform based on the CyBio Felix
platform produced by Analytik Jena AG, see Figure 8-1. The liquid handling pipetting platform
consist out of 2 main parts: the first part is the housing of the robot which contains the working space,
control units and a mounting system for a pipetting head. The mounting system can be connected to
different pipetting heads. The pipetting head is the second main part of the system. In this case, a
CyBio Felix Head R 96/250 µl was used, see Figure 8-3. This head uses 96 disposable pipetting tips.
There are some differences between the CyBio Felix based FADU platform and the Tecan based
system. The temperature of the assay plates is controlled by a liquid based temperature controlling
system, in the case of the Tecan system. A thermostat heats or cools the ethanol/water mixture which
is pumped to the assay plate- and buffer- holder. Hence, the temperature regulation of this system is
slow, especially between two FADU runs it takes several minutes until the system is cooled down for
the next FADU assay. Moreover, the temperature can only be set for the whole system and not for
single plate positions. The TOXXs Analyzer uses peltier-elements which are electrothermal
transducer, mounted on positions 1,2,3,4 and 8, see Figure 8-4. These peltier-elements are much faster
in the temperature regulation and each peltier-element can be regulated separate. This allows a faster
and more precise processing (no delay time) of assay plates, if more than one assay plate is used. The
second big advantage of the CyBio Felix based FADU platform is the use of a 96 pipetting tip head. In
contrast, the Tecan system uses a pipetting head with 8 tips. A 96 pipetting head allows the processing
of all samples at the same time. Hence, there is no time-gradient between the different columns of an
assay plate. Especially at the end of the FADU assay, after the addition of SYBR Green the time
differences can be a problem if more than one assay plate is used. Hence, the better cooling system
and the 96 tip pipetting head should increase the velocity and the accuracy of the FADU assay.
1 2 3 4 5 6 7 8 9 10 11 12
A
B
C
D
E
F
G
H empty
empty
β-mercaptoethanol DTT
6*106 cells/ml 3*106 cells/ml 6*106 cells/ml 3*106 cells/ml
T0
P0
6.2 Gy
3.7 Gy
2.1 Gy
0.69 Gy
T0
P0
6.2 Gy
3.7 Gy
2.1 Gy
0.69 Gy
T0
P0
6.2 Gy
3.7 Gy
2.1 Gy
0.69 Gy
T0
P0
6.2 Gy
3.7 Gy
2.1 Gy
0.69 Gy
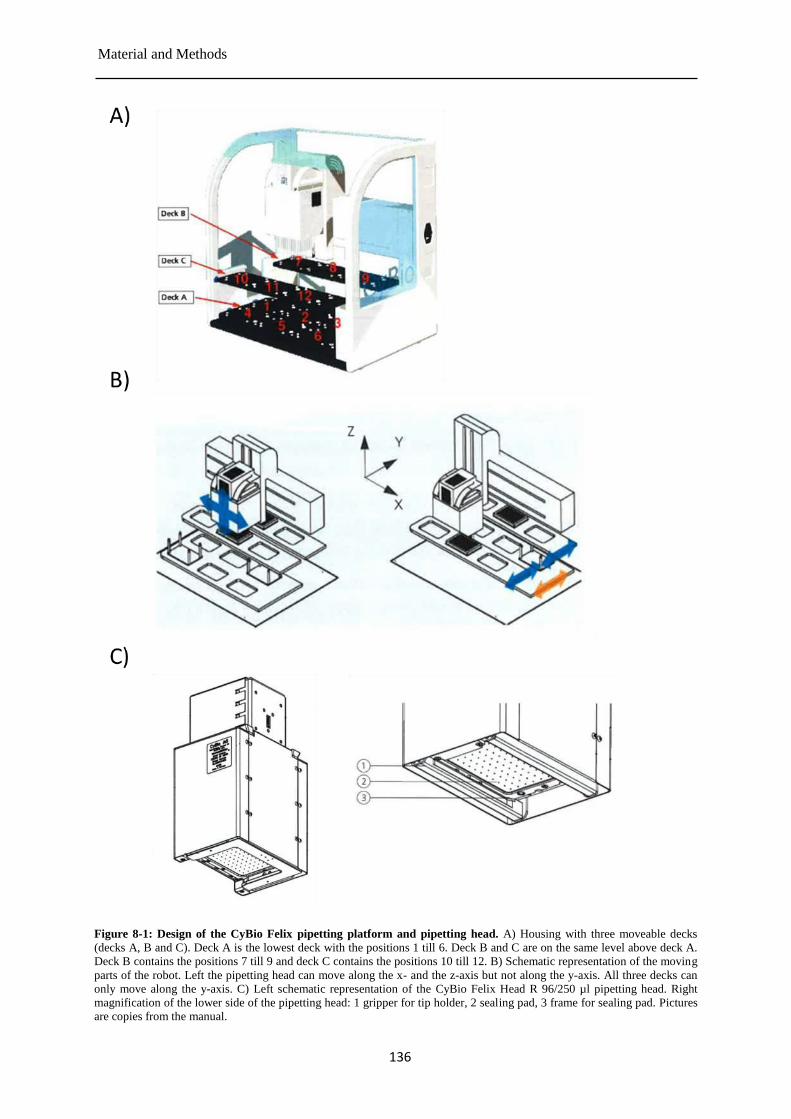
Material and Methods
136
Figure 8-1: Design of the CyBio Felix pipetting platform and pipetting head. A) Housing with three moveable decks
(decks A, B and C). Deck A is the lowest deck with the positions 1 till 6. Deck B and C are on the same level above deck A.
Deck B contains the positions 7 till 9 and deck C contains the positions 10 till 12. B) Schematic representation of the moving
parts of the robot. Left the pipetting head can move along the x- and the z-axis but not along the y-axis. All three decks can
only move along the y-axis. C) Left schematic representation of the CyBio Felix Head R 96/250 µl pipetting head. Right
magnification of the lower side of the pipetting head: 1 gripper for tip holder, 2 sealing pad, 3 frame for sealing pad. Pictures
are copies from the manual.
Material and Methods
137
8.2.6.1 Technical data of the housing and pipetting head of the TOXXs Analyzer
Figure 8-2: Original technical data sheet of the CyBio Felix pipetting platform in German.
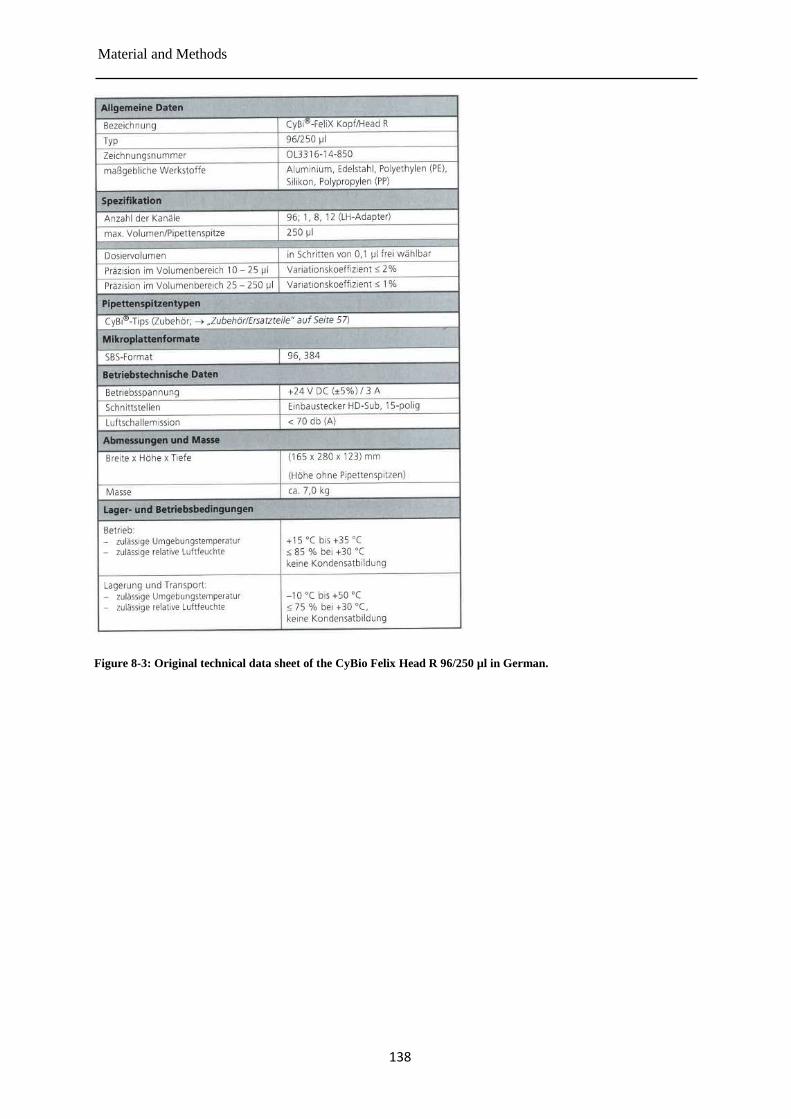
Material and Methods
138
Figure 8-3: Original technical data sheet of the CyBio Felix Head R 96/250 µl in German.
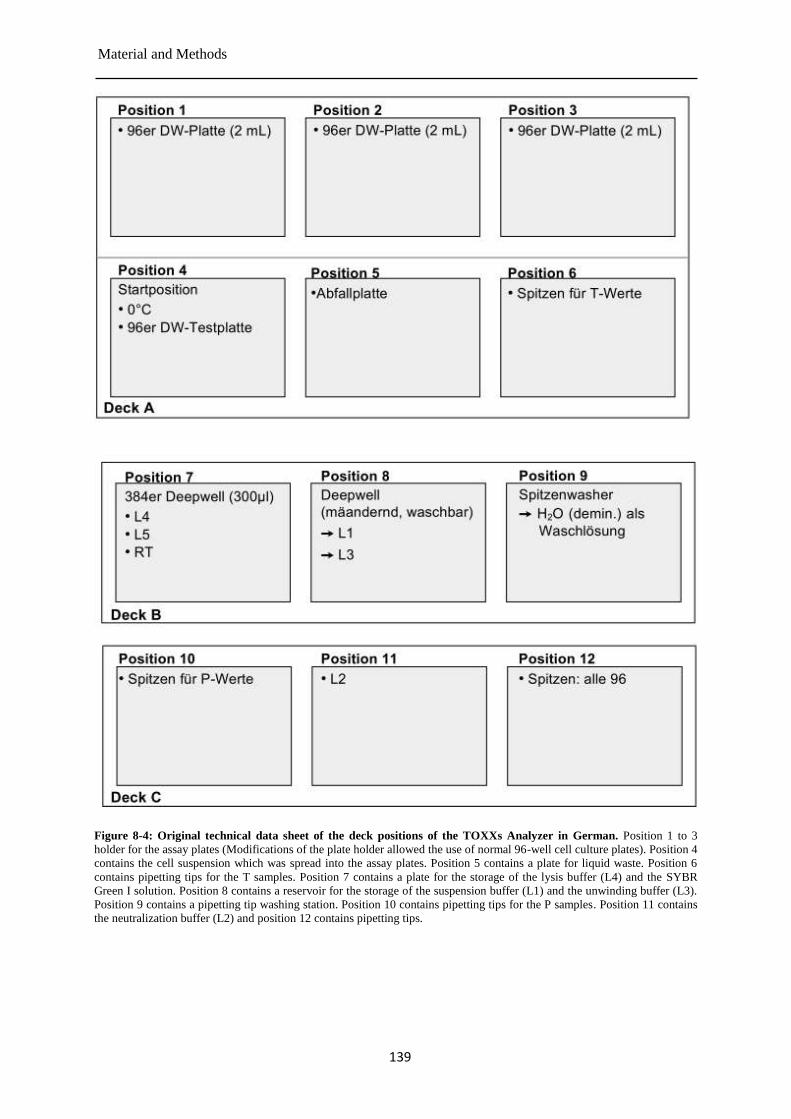
Material and Methods
139
Figure 8-4: Original technical data sheet of the deck positions of the TOXXs Analyzer in German. Position 1 to 3
holder for the assay plates (Modifications of the plate holder allowed the use of normal 96-well cell culture plates). Position 4
contains the cell suspension which was spread into the assay plates. Position 5 contains a plate for liquid waste. Position 6
contains pipetting tips for the T samples. Position 7 contains a plate for the storage of the lysis buffer (L4) and the SYBR
Green I solution. Position 8 contains a reservoir for the storage of the suspension buffer (L1) and the unwinding buffer (L3).
Position 9 contains a pipetting tip washing station. Position 10 contains pipetting tips for the P samples. Position 11 contains
the neutralization buffer (L2) and position 12 contains pipetting tips.
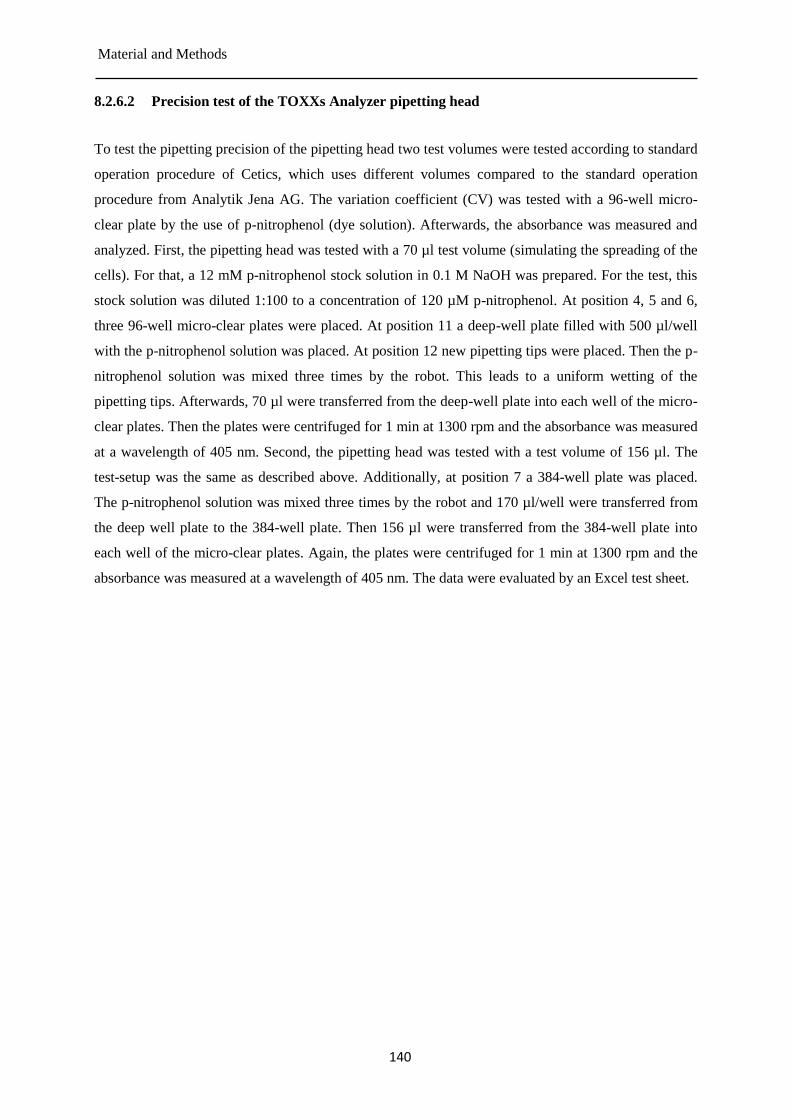
Material and Methods
140
8.2.6.2 Precision test of the TOXXs Analyzer pipetting head
To test the pipetting precision of the pipetting head two test volumes were tested according to standard
operation procedure of Cetics, which uses different volumes compared to the standard operation
procedure from Analytik Jena AG. The variation coefficient (CV) was tested with a 96-well micro-
clear plate by the use of p-nitrophenol (dye solution). Afterwards, the absorbance was measured and
analyzed. First, the pipetting head was tested with a 70 µl test volume (simulating the spreading of the
cells). For that, a 12 mM p-nitrophenol stock solution in 0.1 M NaOH was prepared. For the test, this
stock solution was diluted 1:100 to a concentration of 120 µM p-nitrophenol. At position 4, 5 and 6,
three 96-well micro-clear plates were placed. At position 11 a deep-well plate filled with 500 µl/well
with the p-nitrophenol solution was placed. At position 12 new pipetting tips were placed. Then the p-
nitrophenol solution was mixed three times by the robot. This leads to a uniform wetting of the
pipetting tips. Afterwards, 70 µl were transferred from the deep-well plate into each well of the micro-
clear plates. Then the plates were centrifuged for 1 min at 1300 rpm and the absorbance was measured
at a wavelength of 405 nm. Second, the pipetting head was tested with a test volume of 156 µl. The
test-setup was the same as described above. Additionally, at position 7 a 384-well plate was placed.
The p-nitrophenol solution was mixed three times by the robot and 170 µl/well were transferred from
the deep well plate to the 384-well plate. Then 156 µl were transferred from the 384-well plate into
each well of the micro-clear plates. Again, the plates were centrifuged for 1 min at 1300 rpm and the
absorbance was measured at a wavelength of 405 nm. The data were evaluated by an Excel test sheet.
Results
141
9 Results
9.1 Pre-validation of the TOXXs Analyzer
The second project in this thesis was to support the further development of the automated FADU assay
as part of a cooperation project together with three partner institutions. These partners were the Cetics
Healthcare Technologies GmbH from Esslingen (Germany), the Eidgenössische Materialprüfungs-
und Forschungsanstalt (EMPA) from St. Gallen (Switzerland) and the University of Konstanz
(Germany). The project was financed by the Cetics GmbH, which had the leadership of the total
project. The other partners were part of the inter-laboratory validation of the automated FADU assay
device. Therefore, a completely new FADU platform was developed by Cetics GmbH in cooperation
with Dr. Maria Moreno-Villanueva in advance of this thesis. Three prototypes, called “TOXXs
Analyzer” were produced. Each partner obtained one prototype for the inter-laboratory validation. The
first step was to perform a pre-validation of these prototypes. The main objective of the pre-validation
was a technical test of the new FADU-platform. Depending on the results, technical adjustments
should be performed to increase the assay speed, reduce the assay volume and increase the assay
sensitivity. The technical support and development was performed by the Cetics GmbH. The final goal
of this project was the development of a market maturity version of the automated FADU assay.
Therefore, following workflow was used, see Figure 9-1.
Figure 9-1: Validation-workflow of the TOXXs Analyzer development.
For the validation of the TOXXs Analyzer two different human cell lines were chosen. On the one
hand, Jurkat cells (clone E6-1) and on the other hand A549 cells were selected. Both cells lines are
p53 and cytochrome P450 positive [576]. These proteins are important in the genotoxic response
[577]. Two cell lines were selected because the TOXXs Analyzer should be tested with an adherent
cell line, A549 cells, and with a suspension cell line, Jurkat cells. The automated FADU assay
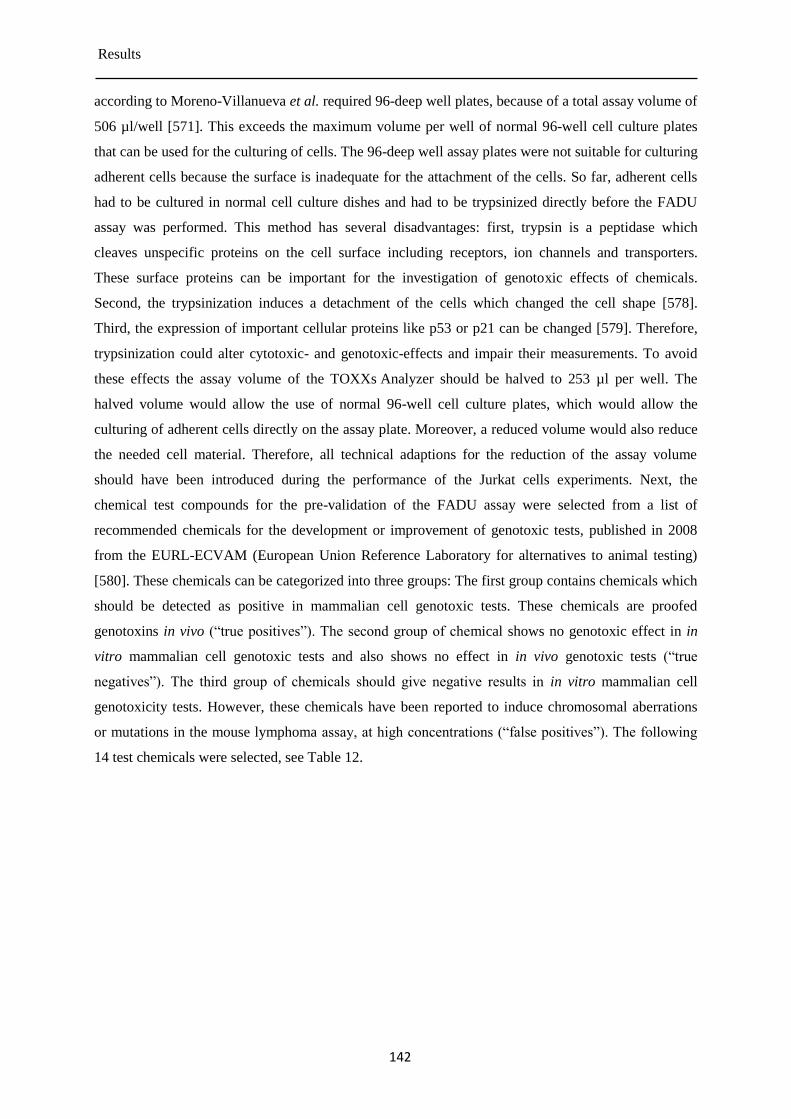
Results
142
according to Moreno-Villanueva et al. required 96-deep well plates, because of a total assay volume of
506 µl/well [571]. This exceeds the maximum volume per well of normal 96-well cell culture plates
that can be used for the culturing of cells. The 96-deep well assay plates were not suitable for culturing
adherent cells because the surface is inadequate for the attachment of the cells. So far, adherent cells
had to be cultured in normal cell culture dishes and had to be trypsinized directly before the FADU
assay was performed. This method has several disadvantages: first, trypsin is a peptidase which
cleaves unspecific proteins on the cell surface including receptors, ion channels and transporters.
These surface proteins can be important for the investigation of genotoxic effects of chemicals.
Second, the trypsinization induces a detachment of the cells which changed the cell shape [578].
Third, the expression of important cellular proteins like p53 or p21 can be changed [579]. Therefore,
trypsinization could alter cytotoxic- and genotoxic-effects and impair their measurements. To avoid
these effects the assay volume of the TOXXs Analyzer should be halved to 253 µl per well. The
halved volume would allow the use of normal 96-well cell culture plates, which would allow the
culturing of adherent cells directly on the assay plate. Moreover, a reduced volume would also reduce
the needed cell material. Therefore, all technical adaptions for the reduction of the assay volume
should have been introduced during the performance of the Jurkat cells experiments. Next, the
chemical test compounds for the pre-validation of the FADU assay were selected from a list of
recommended chemicals for the development or improvement of genotoxic tests, published in 2008
from the EURL-ECVAM (European Union Reference Laboratory for alternatives to animal testing)
[580]. These chemicals can be categorized into three groups: The first group contains chemicals which
should be detected as positive in mammalian cell genotoxic tests. These chemicals are proofed
genotoxins in vivo (“true positives”). The second group of chemical shows no genotoxic effect in in
vitro mammalian cell genotoxic tests and also shows no effect in in vivo genotoxic tests (“true
negatives”). The third group of chemicals should give negative results in in vitro mammalian cell
genotoxicity tests. However, these chemicals have been reported to induce chromosomal aberrations
or mutations in the mouse lymphoma assay, at high concentrations (“false positives”). The following
14 test chemicals were selected, see Table 12.
Results
143
Compound: Group: Mode of action:
methylnitronitrosoguanidine (MNNG) 1 O6 and N
7 alkylator
4-nitroquinoline-1-oxide 1 aromatic amine
etoposide 1 topoisomerase inhibitor
camptothecin 1 topoisomerase inhibitor
D-mannitol 2 non-DNA-reactive
ethylenediaminetetraavetic acid trisodium salt
trihydrate 2 non-DNA-reactive
diethanolamine 2 non-DNA-reactive
D/L-menthol 3 non-DNA-reactive
phthalic anhydride 3 non-DNA-reactive
urea 3 non-DNA-reactive
sodium saccharin 3 non-DNA-reactive
4-nitrophenol 3 non-DNA-reactive
eugenol 3 non-DNA-reactive
8-hydroxyquinoline 3 non-DNA-reactive Table 12: Test chemicals for TOXXs Analyzer pre-validation.
Before the chemical substances could be used to test the TOXXs Analyzer, they had to be tested for
their cytotoxicity. Cytotoxic effects must be excluded, because cytotoxicity would impair the cell
viability and induce cell death, for example apoptosis or necrosis. Apoptosis as well as necrosis induce
a DNA breakdown, meaning additional DNA strand breaks would be evolved. The FADU assay is not
able to differentiate between DNA strand breaks induced by cytotoxic cell death and DNA strand
breaks induced by genotoxicity. Therefore, a cytotoxic compound could be identified falsely as a
genotoxin by the FADU assay. Hence, an MTT assay was used to determine a dose-range for each
chemical without cytotoxic effects. The MTT assay should be included as pre-test for the FADU assay
and, therefore, performed by the TOXX Analyzer. The pre-validation of the FADU assay should be
performed with all 14 test chemicals in each lab in three independent experiments. The first tests
should be performed with the Jurkat cell line. During this test series, all technical adjustments which
were necessary to reduce the assay volume to the half should be introduced by the Cetics GmbH.
Subsequently, all three prototypes should be adapted to these modifications and the test series with the
A549 cell lines should be performed. The resulting data of the TOXXs Analyzer pre-validation should
be used for the control of the specificity (detection of DNA strand breaks induced by the positive
controls), sensitivity (comparison with data in the literature and data of the old FADU system) and
most important for the technical pre-validation, the inter-laboratory and intra-laboratory variability
should be determined. However, this study could not be performed in the planned form due to
technical problems with the TOXXs Analyzer. These problems caused non-senses results of the
FADU assay, meaning there was no fluorescence signal detectable above the background fluorescence
signal (data not shown). Moreover, buffer residues and cell culture medium residues could be
observed on the sealing pad of the pipetting head after the run of a FADU assay. These residues were
an indication of a pipetting problem and could indicate a problem with the pipetting head. Therefore,
Results
144
the pipetting head was sent to the supplier for a revision. During the meantime the MTT assays were
performed without the TOXXs Analyzer manually. Moreover, the adjustments for the reduced assay
volume were introduced by the Cetics GmbH. These modifications should also solve the pipetting
problems of the TOXXs Analyzer. After the revision of the pipetting head and the introduction of the
modifications to reduce the assay volume, the results were still inacceptable. A precision test for the
pipetting head, designed by Cetics GmbH was performed to identify possible problems during the
FADU assay. Therefore, the spreading of the cells into the three assay plates and the addition of the
SYBR Green solution were simulated by the use of a p-nitrophenol solution. An absorbance
measurement was used as readout. The results of the pipetting precision test can be seen in Figure 9-2
and Figure 9-3. The pipetting precision test of the cell spreading showed that the values at plate
position 1 and plate position 3 were outside the acceptable limits. Only the values of plate position 2
were inside the limits. The pipetting precision test of the SYBR Green addition showed that the values
of all three plate positions were within acceptable limits. The results of the precision tests indicated
that the pipetting head was in principle functional. The cause for the insufficient performance of the
TOXXs Analyzer could so far not be determined. Hence, the pre-validation of the TOXXs Analyzer
could not be completed. The following sections display the achieved results during the pre-validation
in the course of the presented thesis at the University of Konstanz. All FADU assays were performed
with the old FADU system based on a TECAN handling device [571].
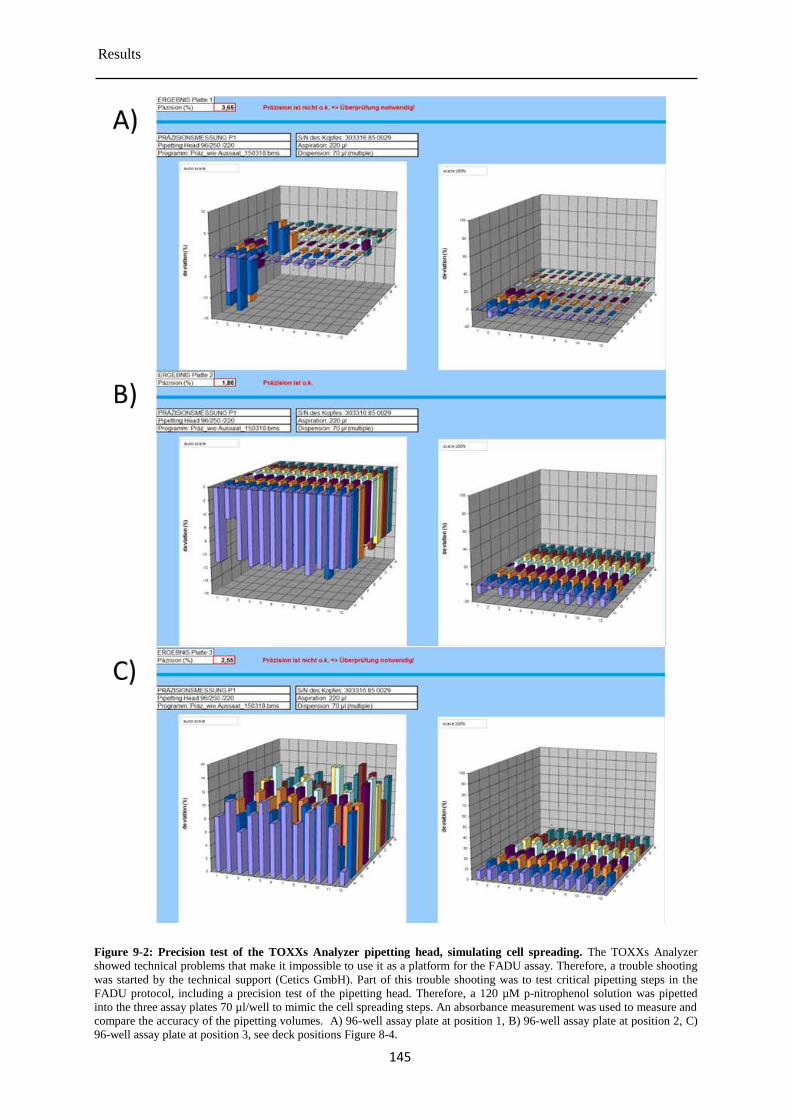
Results
145
Figure 9-2: Precision test of the TOXXs Analyzer pipetting head, simulating cell spreading. The TOXXs Analyzer
showed technical problems that make it impossible to use it as a platform for the FADU assay. Therefore, a trouble shooting
was started by the technical support (Cetics GmbH). Part of this trouble shooting was to test critical pipetting steps in the
FADU protocol, including a precision test of the pipetting head. Therefore, a 120 µM p-nitrophenol solution was pipetted
into the three assay plates 70 µl/well to mimic the cell spreading steps. An absorbance measurement was used to measure and
compare the accuracy of the pipetting volumes. A) 96-well assay plate at position 1, B) 96-well assay plate at position 2, C)
96-well assay plate at position 3, see deck positions Figure 8-4.
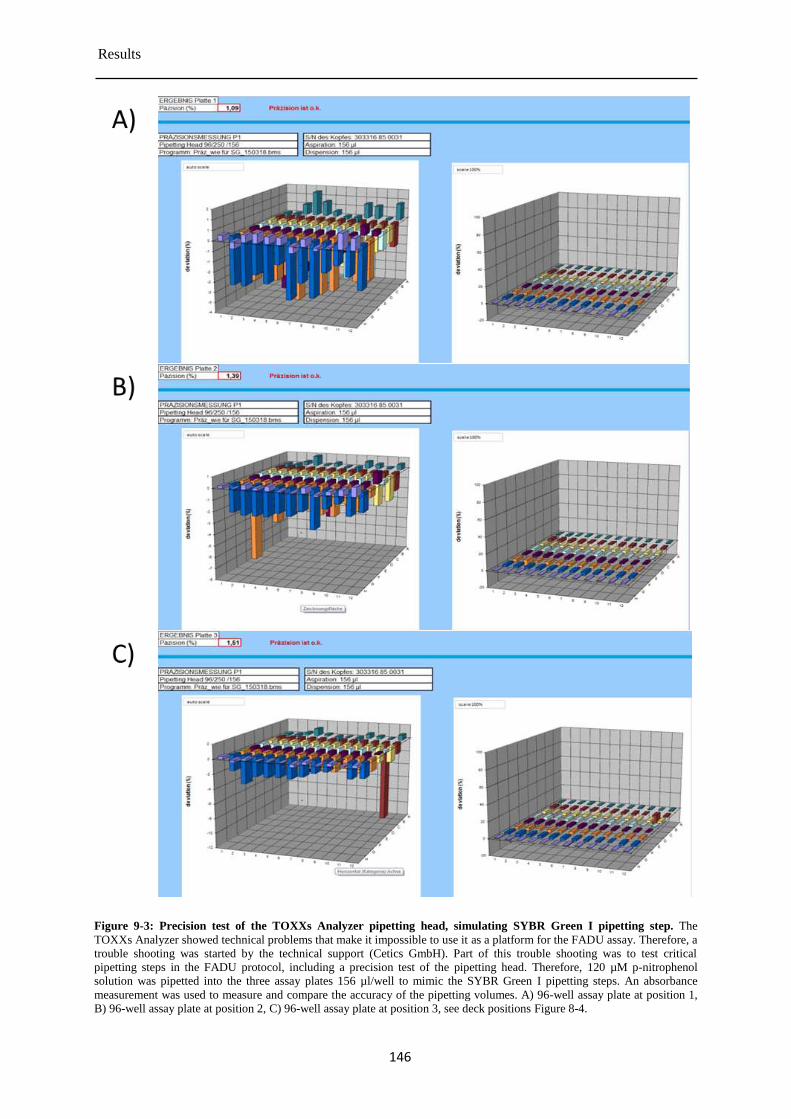
Results
146
Figure 9-3: Precision test of the TOXXs Analyzer pipetting head, simulating SYBR Green I pipetting step. The
TOXXs Analyzer showed technical problems that make it impossible to use it as a platform for the FADU assay. Therefore, a
trouble shooting was started by the technical support (Cetics GmbH). Part of this trouble shooting was to test critical
pipetting steps in the FADU protocol, including a precision test of the pipetting head. Therefore, 120 µM p-nitrophenol
solution was pipetted into the three assay plates 156 µl/well to mimic the SYBR Green I pipetting steps. An absorbance
measurement was used to measure and compare the accuracy of the pipetting volumes. A) 96-well assay plate at position 1,
B) 96-well assay plate at position 2, C) 96-well assay plate at position 3, see deck positions Figure 8-4.
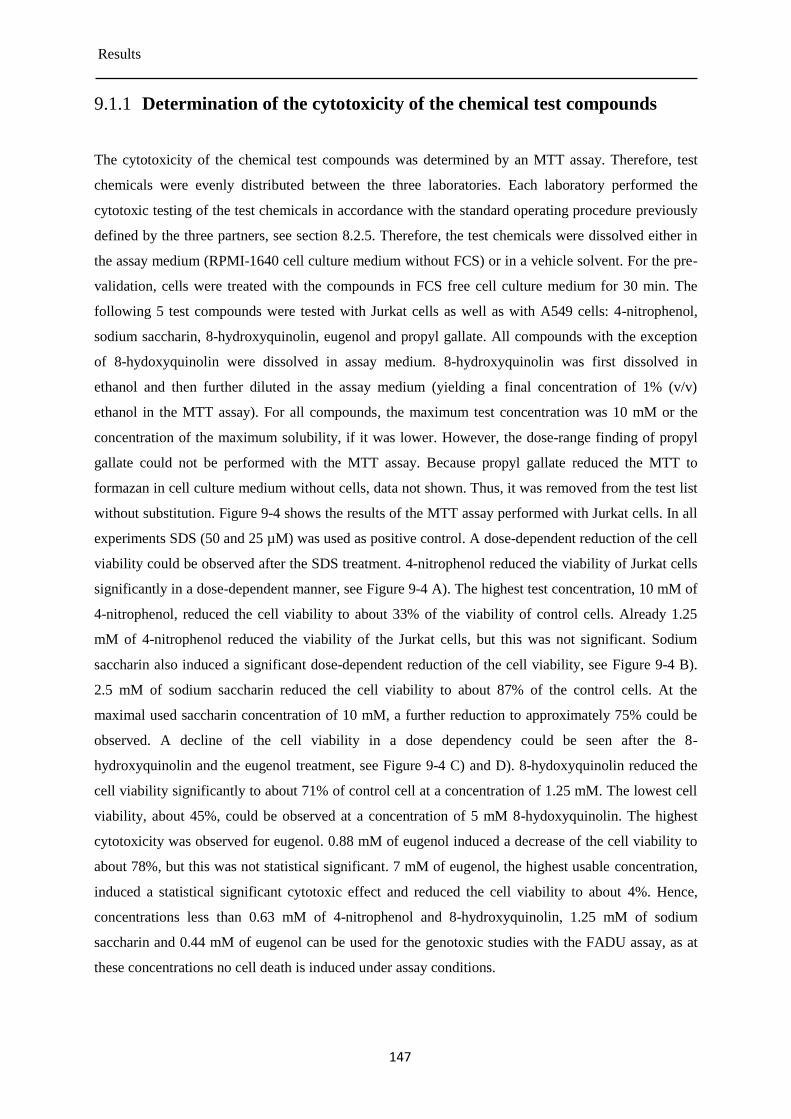
Results
147
Determination of the cytotoxicity of the chemical test compounds 9.1.1
The cytotoxicity of the chemical test compounds was determined by an MTT assay. Therefore, test
chemicals were evenly distributed between the three laboratories. Each laboratory performed the
cytotoxic testing of the test chemicals in accordance with the standard operating procedure previously
defined by the three partners, see section 8.2.5. Therefore, the test chemicals were dissolved either in
the assay medium (RPMI-1640 cell culture medium without FCS) or in a vehicle solvent. For the pre-
validation, cells were treated with the compounds in FCS free cell culture medium for 30 min. The
following 5 test compounds were tested with Jurkat cells as well as with A549 cells: 4-nitrophenol,
sodium saccharin, 8-hydroxyquinolin, eugenol and propyl gallate. All compounds with the exception
of 8-hydoxyquinolin were dissolved in assay medium. 8-hydroxyquinolin was first dissolved in
ethanol and then further diluted in the assay medium (yielding a final concentration of 1% (v/v)
ethanol in the MTT assay). For all compounds, the maximum test concentration was 10 mM or the
concentration of the maximum solubility, if it was lower. However, the dose-range finding of propyl
gallate could not be performed with the MTT assay. Because propyl gallate reduced the MTT to
formazan in cell culture medium without cells, data not shown. Thus, it was removed from the test list
without substitution. Figure 9-4 shows the results of the MTT assay performed with Jurkat cells. In all
experiments SDS (50 and 25 µM) was used as positive control. A dose-dependent reduction of the cell
viability could be observed after the SDS treatment. 4-nitrophenol reduced the viability of Jurkat cells
significantly in a dose-dependent manner, see Figure 9-4 A). The highest test concentration, 10 mM of
4-nitrophenol, reduced the cell viability to about 33% of the viability of control cells. Already 1.25
mM of 4-nitrophenol reduced the viability of the Jurkat cells, but this was not significant. Sodium
saccharin also induced a significant dose-dependent reduction of the cell viability, see Figure 9-4 B).
2.5 mM of sodium saccharin reduced the cell viability to about 87% of the control cells. At the
maximal used saccharin concentration of 10 mM, a further reduction to approximately 75% could be
observed. A decline of the cell viability in a dose dependency could be seen after the 8-
hydroxyquinolin and the eugenol treatment, see Figure 9-4 C) and D). 8-hydoxyquinolin reduced the
cell viability significantly to about 71% of control cell at a concentration of 1.25 mM. The lowest cell
viability, about 45%, could be observed at a concentration of 5 mM 8-hydoxyquinolin. The highest
cytotoxicity was observed for eugenol. 0.88 mM of eugenol induced a decrease of the cell viability to
about 78%, but this was not statistical significant. 7 mM of eugenol, the highest usable concentration,
induced a statistical significant cytotoxic effect and reduced the cell viability to about 4%. Hence,
concentrations less than 0.63 mM of 4-nitrophenol and 8-hydroxyquinolin, 1.25 mM of sodium
saccharin and 0.44 mM of eugenol can be used for the genotoxic studies with the FADU assay, as at
these concentrations no cell death is induced under assay conditions.
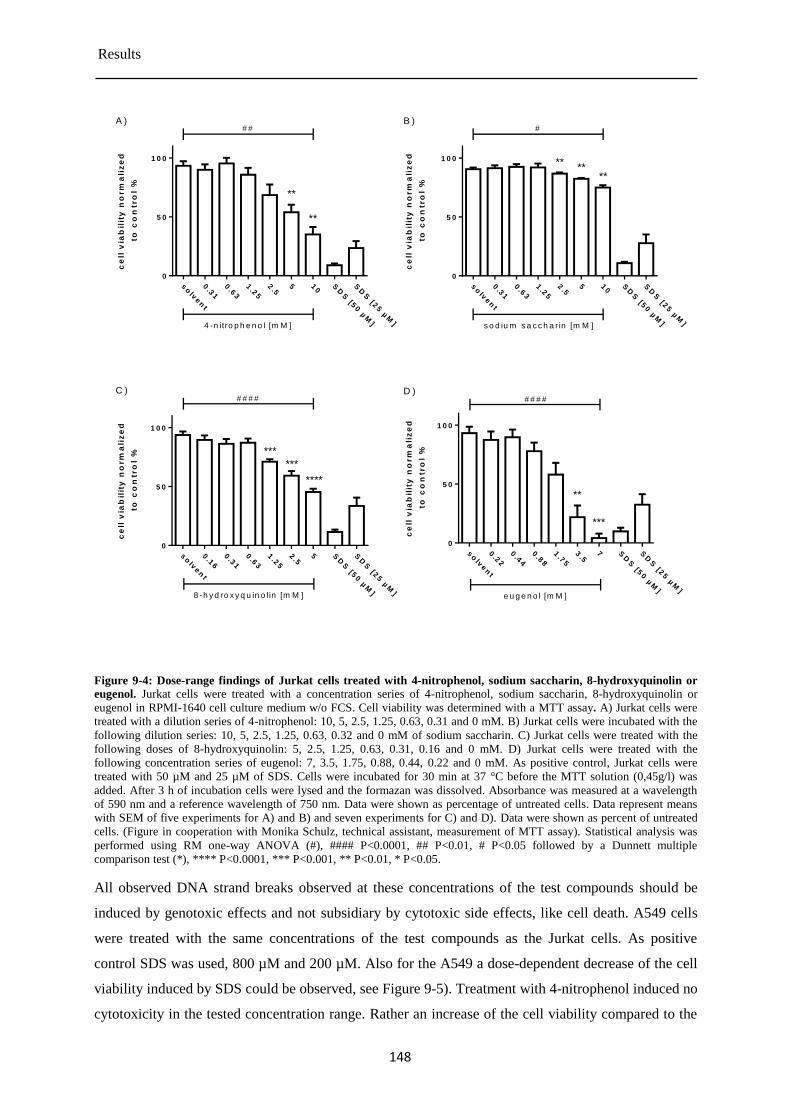
Results
148
ce
ll v
iab
ilit
y n
orm
ali
ze
d
to
co
ntr
ol
%
so
lven
t
0.3
1
0.6
3
1.2
5
2.5
5 10
SD
S [5
0 µ
M]
SD
S [2
5 µ
M]
0
5 0
1 0 0
**
**
4 -n itro p h e n o l [m M ]
A )# #
ce
ll v
iab
ilit
y n
orm
ali
ze
d
to
co
ntr
ol
%
so
lven
t
0.3
1
0.6
3
1.2
5
2.5
5 10
SD
S [5
0 µ
M]
SD
S [2
5 µ
M]
0
5 0
1 0 0 ****
**
s o d iu m s a c c h a r in [m M ]
B )#
ce
ll v
iab
ilit
y n
orm
ali
ze
d
to
co
ntr
ol
%
so
lven
t
0.1
6
0.3
1
0.6
3
1.2
5
2.5
5 SD
S [5
0 µ
M]
SD
S [2
5 µ
M]
0
5 0
1 0 0
***
***
****
8 -h y d ro x y q u in o lin [m M ]
C )# # # #
ce
ll v
iab
ilit
y n
orm
ali
ze
d
to
co
ntr
ol
%
so
lven
t
0.2
2
0.4
4
0.8
8
1.7
5
3.5
7 SD
S [5
0 µ
M]
SD
S [2
5 µ
M]
0
5 0
1 0 0
**
***
e u g e n o l [m M ]
D )# # # #
Figure 9-4: Dose-range findings of Jurkat cells treated with 4-nitrophenol, sodium saccharin, 8-hydroxyquinolin or
eugenol. Jurkat cells were treated with a concentration series of 4-nitrophenol, sodium saccharin, 8-hydroxyquinolin or
eugenol in RPMI-1640 cell culture medium w/o FCS. Cell viability was determined with a MTT assay. A) Jurkat cells were
treated with a dilution series of 4-nitrophenol: 10, 5, 2.5, 1.25, 0.63, 0.31 and 0 mM. B) Jurkat cells were incubated with the
following dilution series: 10, 5, 2.5, 1.25, 0.63, 0.32 and 0 mM of sodium saccharin. C) Jurkat cells were treated with the
following doses of 8-hydroxyquinolin: 5, 2.5, 1.25, 0.63, 0.31, 0.16 and 0 mM. D) Jurkat cells were treated with the
following concentration series of eugenol: 7, 3.5, 1.75, 0.88, 0.44, 0.22 and 0 mM. As positive control, Jurkat cells were
treated with 50 µM and 25 µM of SDS. Cells were incubated for 30 min at 37 °C before the MTT solution (0,45g/l) was
added. After 3 h of incubation cells were lysed and the formazan was dissolved. Absorbance was measured at a wavelength
of 590 nm and a reference wavelength of 750 nm. Data were shown as percentage of untreated cells. Data represent means
with SEM of five experiments for A) and B) and seven experiments for C) and D). Data were shown as percent of untreated
cells. (Figure in cooperation with Monika Schulz, technical assistant, measurement of MTT assay). Statistical analysis was
performed using RM one-way ANOVA (#), #### P<0.0001, ## P<0.01, # P<0.05 followed by a Dunnett multiple
comparison test (*), **** P<0.0001, *** P<0.001, ** P<0.01, * P<0.05.
All observed DNA strand breaks observed at these concentrations of the test compounds should be
induced by genotoxic effects and not subsidiary by cytotoxic side effects, like cell death. A549 cells
were treated with the same concentrations of the test compounds as the Jurkat cells. As positive
control SDS was used, 800 µM and 200 µM. Also for the A549 a dose-dependent decrease of the cell
viability induced by SDS could be observed, see Figure 9-5). Treatment with 4-nitrophenol induced no
cytotoxicity in the tested concentration range. Rather an increase of the cell viability compared to the
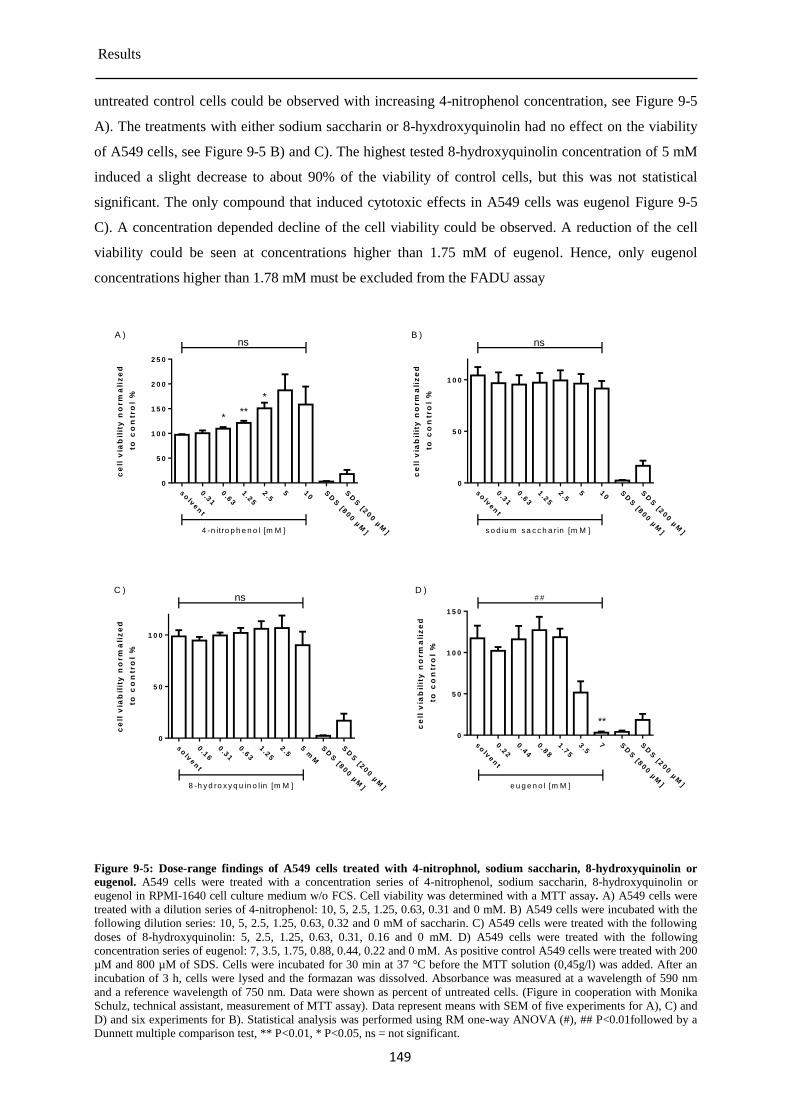
Results
149
untreated control cells could be observed with increasing 4-nitrophenol concentration, see Figure 9-5
A). The treatments with either sodium saccharin or 8-hyxdroxyquinolin had no effect on the viability
of A549 cells, see Figure 9-5 B) and C). The highest tested 8-hydroxyquinolin concentration of 5 mM
induced a slight decrease to about 90% of the viability of control cells, but this was not statistical
significant. The only compound that induced cytotoxic effects in A549 cells was eugenol Figure 9-5
C). A concentration depended decline of the cell viability could be observed. A reduction of the cell
viability could be seen at concentrations higher than 1.75 mM of eugenol. Hence, only eugenol
concentrations higher than 1.78 mM must be excluded from the FADU assay
ce
ll v
iab
ilit
y n
orm
ali
ze
d
to
co
ntr
ol
%
so
lven
t
0.3
1
0.6
3
1.2
5
2.5
5 10
SD
S [8
00 µ
M]
SD
S [2
00 µ
M]
0
5 0
1 0 0
1 5 0
2 0 0
2 5 0
ns
***
*
4 -n itro p h e n o l [m M ]
A )
ce
ll v
iab
ilit
y n
orm
ali
ze
d
to
co
ntr
ol
%
so
lven
t
0.3
1
0.6
3
1.2
5
2.5
5 10
SD
S [8
00 µ
M]
SD
S [2
00 µ
M]
0
5 0
1 0 0
ns
s o d iu m s a c c h a r in [m M ]
B )
ce
ll v
iab
ilit
y n
orm
ali
ze
d
to
co
ntr
ol
%
so
lven
t
0.1
6
0.3
1
0.6
3
1.2
5
2.5
5 m
M
SD
S [8
00 µ
M]
SD
S [2
00 µ
M]
0
5 0
1 0 0
ns
8 -h y d ro x y q u in o lin [m M ]
C )
ce
ll v
iab
ilit
y n
orm
ali
ze
d
to
co
ntr
ol
%
so
lven
t
0.2
2
0.4
4
0.8
8
1.7
5
3.5
7 SD
S [8
00 µ
M]
SD
S [2
00 µ
M]
0
5 0
1 0 0
1 5 0
**
e u g e n o l [m M ]
D )# #
Figure 9-5: Dose-range findings of A549 cells treated with 4-nitrophnol, sodium saccharin, 8-hydroxyquinolin or
eugenol. A549 cells were treated with a concentration series of 4-nitrophenol, sodium saccharin, 8-hydroxyquinolin or
eugenol in RPMI-1640 cell culture medium w/o FCS. Cell viability was determined with a MTT assay. A) A549 cells were
treated with a dilution series of 4-nitrophenol: 10, 5, 2.5, 1.25, 0.63, 0.31 and 0 mM. B) A549 cells were incubated with the
following dilution series: 10, 5, 2.5, 1.25, 0.63, 0.32 and 0 mM of saccharin. C) A549 cells were treated with the following
doses of 8-hydroxyquinolin: 5, 2.5, 1.25, 0.63, 0.31, 0.16 and 0 mM. D) A549 cells were treated with the following
concentration series of eugenol: 7, 3.5, 1.75, 0.88, 0.44, 0.22 and 0 mM. As positive control A549 cells were treated with 200
µM and 800 µM of SDS. Cells were incubated for 30 min at 37 °C before the MTT solution (0,45g/l) was added. After an
incubation of 3 h, cells were lysed and the formazan was dissolved. Absorbance was measured at a wavelength of 590 nm
and a reference wavelength of 750 nm. Data were shown as percent of untreated cells. (Figure in cooperation with Monika
Schulz, technical assistant, measurement of MTT assay). Data represent means with SEM of five experiments for A), C) and
D) and six experiments for B). Statistical analysis was performed using RM one-way ANOVA (#), ## P<0.01followed by a
Dunnett multiple comparison test, ** P<0.01, * P<0.05, ns = not significant.
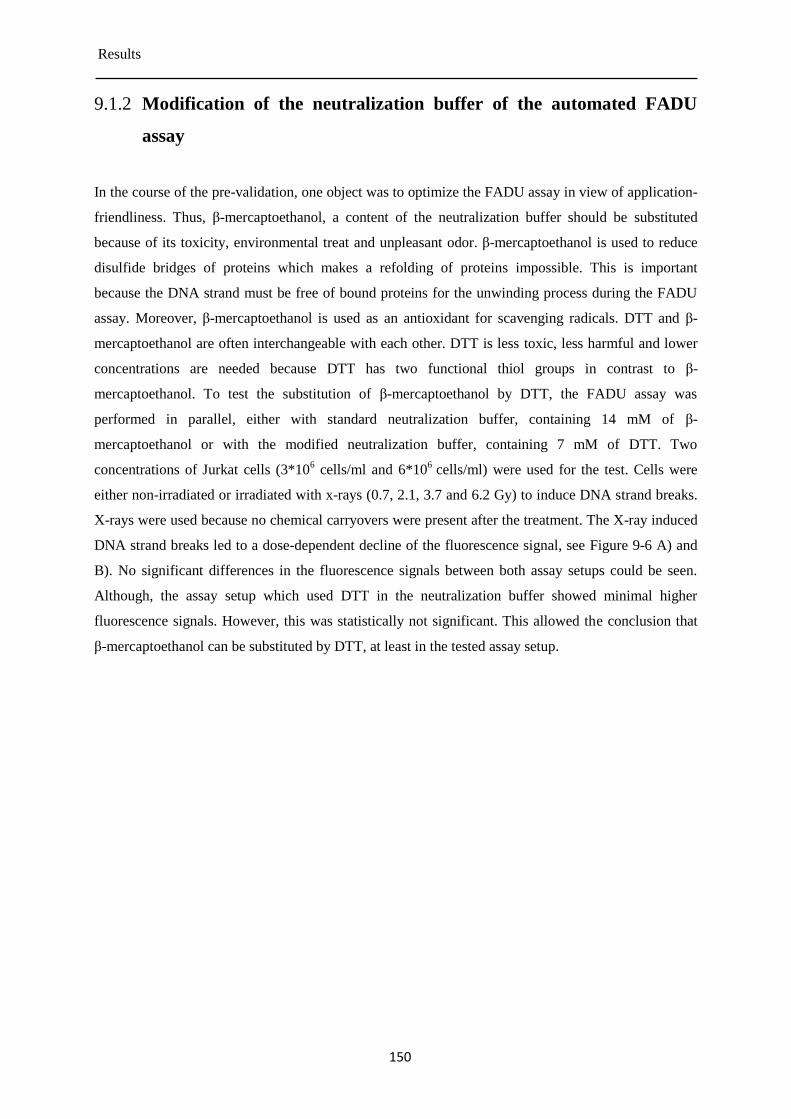
Results
150
Modification of the neutralization buffer of the automated FADU 9.1.2
assay
In the course of the pre-validation, one object was to optimize the FADU assay in view of application-
friendliness. Thus, β-mercaptoethanol, a content of the neutralization buffer should be substituted
because of its toxicity, environmental treat and unpleasant odor. β-mercaptoethanol is used to reduce
disulfide bridges of proteins which makes a refolding of proteins impossible. This is important
because the DNA strand must be free of bound proteins for the unwinding process during the FADU
assay. Moreover, β-mercaptoethanol is used as an antioxidant for scavenging radicals. DTT and β-
mercaptoethanol are often interchangeable with each other. DTT is less toxic, less harmful and lower
concentrations are needed because DTT has two functional thiol groups in contrast to β-
mercaptoethanol. To test the substitution of β-mercaptoethanol by DTT, the FADU assay was
performed in parallel, either with standard neutralization buffer, containing 14 mM of β-
mercaptoethanol or with the modified neutralization buffer, containing 7 mM of DTT. Two
concentrations of Jurkat cells (3*106 cells/ml and 6*10
6 cells/ml) were used for the test. Cells were
either non-irradiated or irradiated with x-rays (0.7, 2.1, 3.7 and 6.2 Gy) to induce DNA strand breaks.
X-rays were used because no chemical carryovers were present after the treatment. The X-ray induced
DNA strand breaks led to a dose-dependent decline of the fluorescence signal, see Figure 9-6 A) and
B). No significant differences in the fluorescence signals between both assay setups could be seen.
Although, the assay setup which used DTT in the neutralization buffer showed minimal higher
fluorescence signals. However, this was statistically not significant. This allowed the conclusion that
β-mercaptoethanol can be substituted by DTT, at least in the tested assay setup.
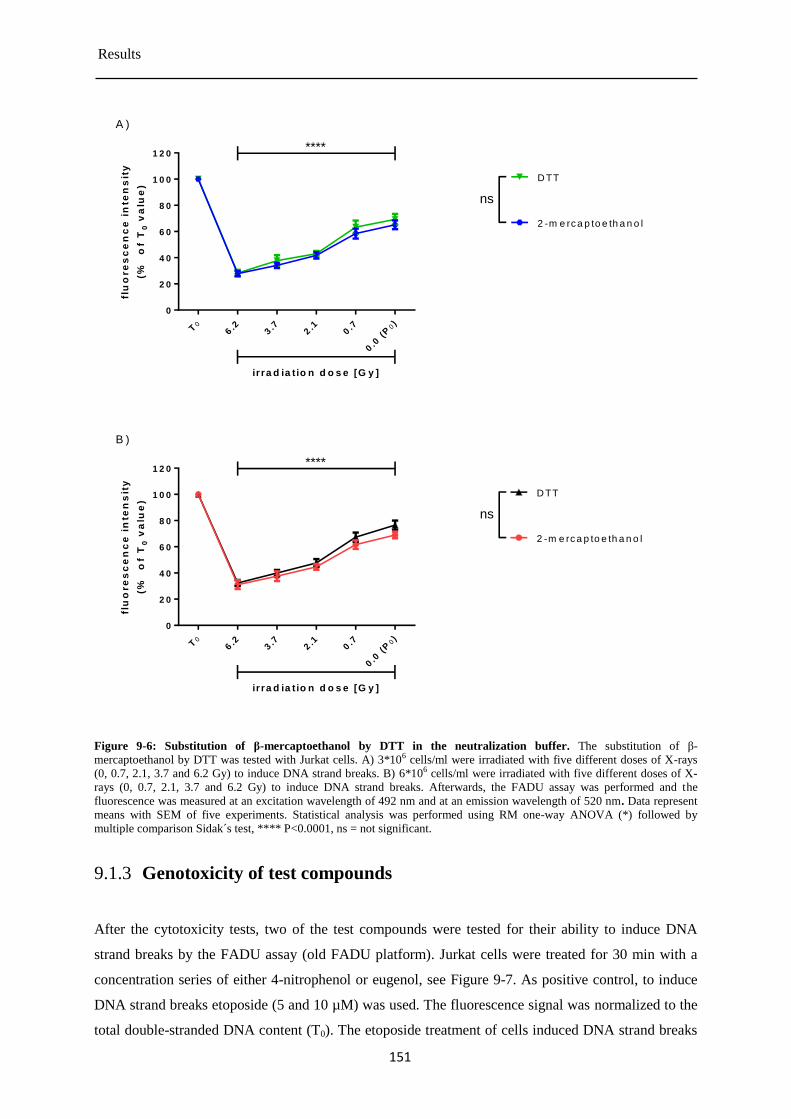
Results
151
flu
ore
sc
en
ce
in
ten
sit
y
(%
of
T0
va
lue
)
T0
6.2
3.7
2.1
0.7
0.0
(P
0)
0
2 0
4 0
6 0
8 0
1 0 0
1 2 0
2 -m e rc a p to e th a n o l
D TT
****
ir ra d ia t io n d o s e [G y ]
A )
ns
flu
ore
sc
en
ce
in
ten
sit
y
(%
of
T0
va
lue
)
T0
6.2
3.7
2.1
0.7
0.0
(P
0)
0
2 0
4 0
6 0
8 0
1 0 0
1 2 0
2 -m e rc a p to e th a n o l
D TT
****
ir ra d ia t io n d o s e [G y ]
B )
ns
Figure 9-6: Substitution of β-mercaptoethanol by DTT in the neutralization buffer. The substitution of β-
mercaptoethanol by DTT was tested with Jurkat cells. A) 3*106 cells/ml were irradiated with five different doses of X-rays
(0, 0.7, 2.1, 3.7 and 6.2 Gy) to induce DNA strand breaks. B) 6*106 cells/ml were irradiated with five different doses of X-
rays (0, 0.7, 2.1, 3.7 and 6.2 Gy) to induce DNA strand breaks. Afterwards, the FADU assay was performed and the
fluorescence was measured at an excitation wavelength of 492 nm and at an emission wavelength of 520 nm. Data represent
means with SEM of five experiments. Statistical analysis was performed using RM one-way ANOVA (*) followed by
multiple comparison Sidak´s test, **** P<0.0001, ns = not significant.
Genotoxicity of test compounds 9.1.3
After the cytotoxicity tests, two of the test compounds were tested for their ability to induce DNA
strand breaks by the FADU assay (old FADU platform). Jurkat cells were treated for 30 min with a
concentration series of either 4-nitrophenol or eugenol, see Figure 9-7. As positive control, to induce
DNA strand breaks etoposide (5 and 10 µM) was used. The fluorescence signal was normalized to the
total double-stranded DNA content (T0). The etoposide treatment of cells induced DNA strand breaks
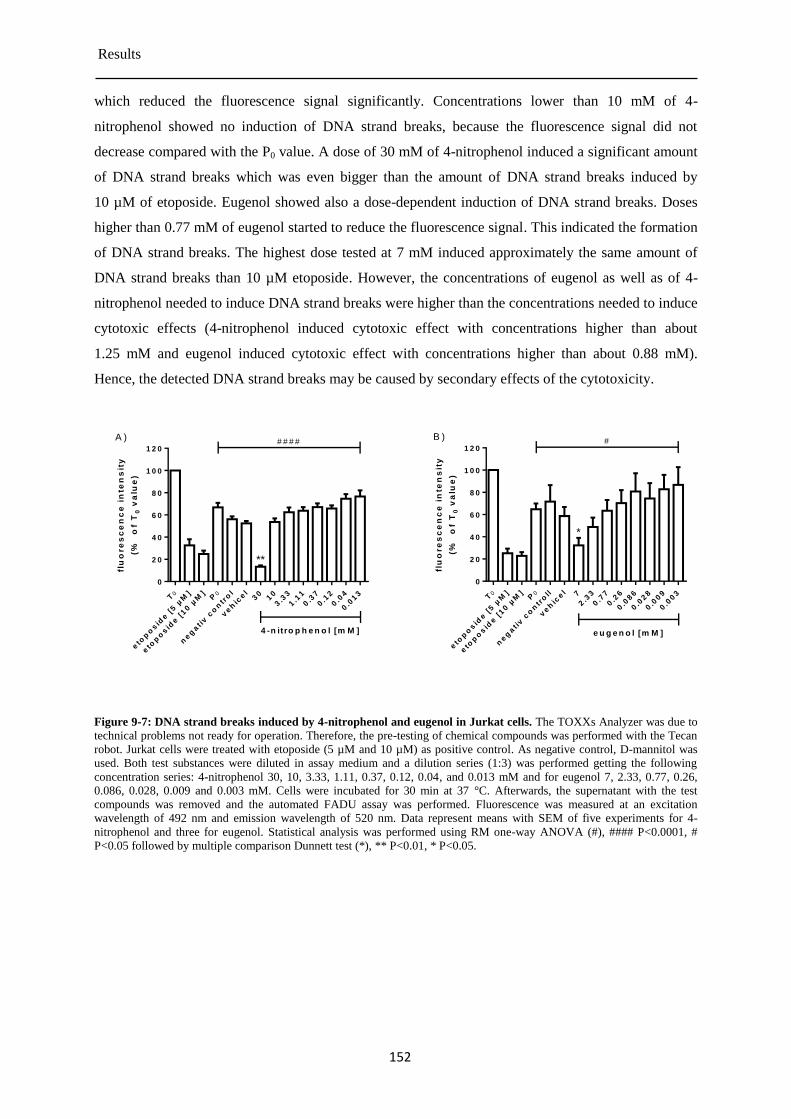
Results
152
which reduced the fluorescence signal significantly. Concentrations lower than 10 mM of 4-
nitrophenol showed no induction of DNA strand breaks, because the fluorescence signal did not
decrease compared with the P0 value. A dose of 30 mM of 4-nitrophenol induced a significant amount
of DNA strand breaks which was even bigger than the amount of DNA strand breaks induced by
10 µM of etoposide. Eugenol showed also a dose-dependent induction of DNA strand breaks. Doses
higher than 0.77 mM of eugenol started to reduce the fluorescence signal. This indicated the formation
of DNA strand breaks. The highest dose tested at 7 mM induced approximately the same amount of
DNA strand breaks than 10 µM etoposide. However, the concentrations of eugenol as well as of 4-
nitrophenol needed to induce DNA strand breaks were higher than the concentrations needed to induce
cytotoxic effects (4-nitrophenol induced cytotoxic effect with concentrations higher than about
1.25 mM and eugenol induced cytotoxic effect with concentrations higher than about 0.88 mM).
Hence, the detected DNA strand breaks may be caused by secondary effects of the cytotoxicity.
flu
ore
sc
en
ce
in
ten
sit
y
(%
of
T0
va
lue
)
T0
eto
po
sid
e [
5 µ
M]
eto
po
sid
e [
10 µ
M]
P0
neg
at i
v c
on
tro
l
veh
icel
30
10
3.3
3
1.1
1
0.3
7
0.1
2
0.0
4
0.0
13
0
2 0
4 0
6 0
8 0
1 0 0
1 2 0
4 -n itro p h e n o l [m M ]
A )
**
# # # #fl
uo
re
sc
en
ce
in
ten
sit
y
(%
of
T0
va
lue
)
T0
eto
po
sid
e [
5 µ
M]
eto
po
sid
e [
10 µ
M]
P0
neg
at i
v c
on
tro
ll
veh
icel 7
2.3
3
0.7
7
0.2
6
0.0
86
0.0
28
0.0
09
0.0
03
0
2 0
4 0
6 0
8 0
1 0 0
1 2 0
e u g e n o l [m M ]
B )
*
#
Figure 9-7: DNA strand breaks induced by 4-nitrophenol and eugenol in Jurkat cells. The TOXXs Analyzer was due to
technical problems not ready for operation. Therefore, the pre-testing of chemical compounds was performed with the Tecan
robot. Jurkat cells were treated with etoposide (5 µM and 10 µM) as positive control. As negative control, D-mannitol was
used. Both test substances were diluted in assay medium and a dilution series (1:3) was performed getting the following
concentration series: 4-nitrophenol 30, 10, 3.33, 1.11, 0.37, 0.12, 0.04, and 0.013 mM and for eugenol 7, 2.33, 0.77, 0.26,
0.086, 0.028, 0.009 and 0.003 mM. Cells were incubated for 30 min at 37 °C. Afterwards, the supernatant with the test
compounds was removed and the automated FADU assay was performed. Fluorescence was measured at an excitation
wavelength of 492 nm and emission wavelength of 520 nm. Data represent means with SEM of five experiments for 4-
nitrophenol and three for eugenol. Statistical analysis was performed using RM one-way ANOVA (#), #### P<0.0001, #
P<0.05 followed by multiple comparison Dunnett test (*), ** P<0.01, * P<0.05.
Discussion
153
10 Discussion
Pre-validation of the TOXXs Analyzer 10.1.1
The TOXXs Analyzer represents the next generation of the automated FADU assay. In principle, the
TOXXs Analyzer is a fully automated pipetting platform which is commercially available (Analytik
Jena AG, CyBio Felix). The pipetting platform was modified by Cetics according to the requirements
of the FADU assay. This new platform has some technical advantages compared to the old automated
FADU system. This includes improvements in the software as well as in the hardware. The software of
the TOXXs Analyzer is more complex compared to the software of the old FADU system (Tecan).
However, it enables the parallel execution of processes independently of each other. The most
important improvements of the hardware are the reduction of the assay volume and in combination
with the software the reduction of the assay duration and an increase of the assay throughput. The old
FADU system allows only linear processes. This means the system can perform assay steps only in a
sequential order. A process must be completed for all assay plates before the next process can be
started. This limitation is caused by the software as well as by the hardware. The temperature system
can adjust and control the temperature of all assay plates only at once and not separately for each plate.
In contrast, the TOXXs Analyzer can perform parallel operations. Meaning, when one operating step
is completed for one assay plate, the next step can be started while the processing of the rest of the
assay plates is not completed. This required an autonomous regulation of the temperature for each
assay plate which was achieved by the use of peltier-elements. Moreover, these electrothermal
convertors are faster in the temperature regulation and more precise in the regulation of the
temperature then the water cooling system of the old FADU system. The pipetting steps are faster
compared to the old system, because of the use of a 96-tip pipetting head. In contrast, the old system
has an 8-tip pipetting head. The use of a 96-tip pipetting head also increases the accuracy of the
measurements, because all samples of an assay plate are processed at once. Therefore, there is no time
delay in the pipetting steps between different columns of an assay plate. This is important at the last
step of the FADU assay, the addition of the SYBR Green solution, because there is no time frame to
compensate the time delay of the previous pipetting steps. Finally, the reduction of the assay volume
allowed the use of normal 96-well plates. This has the advantage that adherent cells can grow directly
onto the assay plates, making trypsinization of the cells dispensable. Since trypsinization can affect
cellular processes by altering the cell shape, degradation of surface proteins and changing the
expression pattern of proteins, it can influence the outcome of a genotoxic analysis. The pre-validation
was designed to technically test the TOXXs Analyzer and verify it´s functionality and reliability. It
was not designed for the investigation of chemical compounds to generate new data about their
genotoxicity. Therefore, the test compounds are well known and had been tested before for their
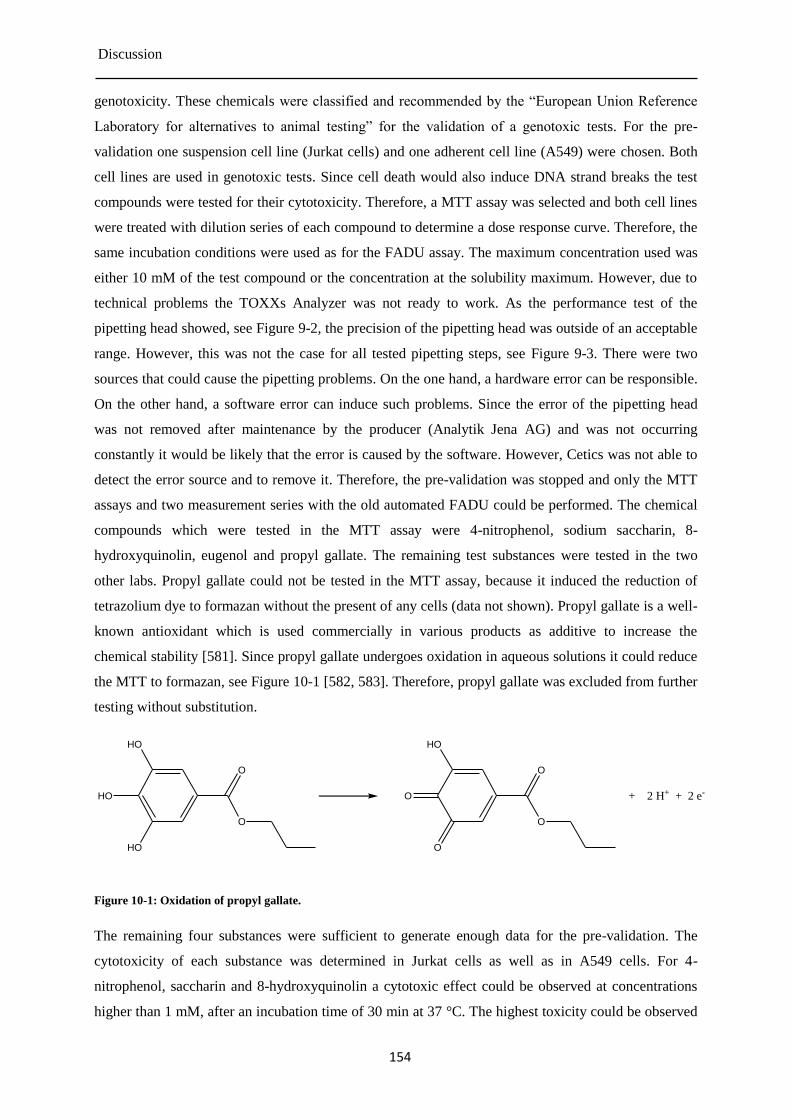
Discussion
154
genotoxicity. These chemicals were classified and recommended by the “European Union Reference
Laboratory for alternatives to animal testing” for the validation of a genotoxic tests. For the pre-
validation one suspension cell line (Jurkat cells) and one adherent cell line (A549) were chosen. Both
cell lines are used in genotoxic tests. Since cell death would also induce DNA strand breaks the test
compounds were tested for their cytotoxicity. Therefore, a MTT assay was selected and both cell lines
were treated with dilution series of each compound to determine a dose response curve. Therefore, the
same incubation conditions were used as for the FADU assay. The maximum concentration used was
either 10 mM of the test compound or the concentration at the solubility maximum. However, due to
technical problems the TOXXs Analyzer was not ready to work. As the performance test of the
pipetting head showed, see Figure 9-2, the precision of the pipetting head was outside of an acceptable
range. However, this was not the case for all tested pipetting steps, see Figure 9-3. There were two
sources that could cause the pipetting problems. On the one hand, a hardware error can be responsible.
On the other hand, a software error can induce such problems. Since the error of the pipetting head
was not removed after maintenance by the producer (Analytik Jena AG) and was not occurring
constantly it would be likely that the error is caused by the software. However, Cetics was not able to
detect the error source and to remove it. Therefore, the pre-validation was stopped and only the MTT
assays and two measurement series with the old automated FADU could be performed. The chemical
compounds which were tested in the MTT assay were 4-nitrophenol, sodium saccharin, 8-
hydroxyquinolin, eugenol and propyl gallate. The remaining test substances were tested in the two
other labs. Propyl gallate could not be tested in the MTT assay, because it induced the reduction of
tetrazolium dye to formazan without the present of any cells (data not shown). Propyl gallate is a well-
known antioxidant which is used commercially in various products as additive to increase the
chemical stability [581]. Since propyl gallate undergoes oxidation in aqueous solutions it could reduce
the MTT to formazan, see Figure 10-1 [582, 583]. Therefore, propyl gallate was excluded from further
testing without substitution.
HO
HO
HO
O
O
+ 2 H+ + 2 e-O
HO
O
O
O
Figure 10-1: Oxidation of propyl gallate.
The remaining four substances were sufficient to generate enough data for the pre-validation. The
cytotoxicity of each substance was determined in Jurkat cells as well as in A549 cells. For 4-
nitrophenol, saccharin and 8-hydroxyquinolin a cytotoxic effect could be observed at concentrations
higher than 1 mM, after an incubation time of 30 min at 37 °C. The highest toxicity could be observed
Discussion
155
for eugenol which reduced the viability of Jurkat cells at lower concentrations. In contrast, a cytotoxic
effect in A549 cells could only be observed for eugenol at concentrations higher than 1.75 mM.
Saccharin and 8-hydroxyquinolin showed no cytotoxic effects in A549 cells. During the treatment
with 4-nitrophenol, a positive correlation between the increasing 4-nitrophenol concentration and an
increase of the reduction of MTT to formazan could be observed. This reduction was not caused by
redox reaction between the MTT and the 4-nitrophenol. Since blanks which contain both substances in
the same solvent and the same concentrations as the wells with cells showed no formation of
formazan. Hence, 4-nitrophenol had to influence cellular processes of A549 cells, which increased the
intracellular formation of formazan. The MTT assay is a metabolic assay which determines the
reduction of MTT by the mitochondrial electron transporting chain and by oxidoreductases. A cell
viability assay which is not based on the measurement of the metabolism could be used to confirm the
results [584, 585]. For example, the neutral red up-take assay or propidium iodide staining can be
used. In general, A549 cells seem to be more resistant against cytotoxic chemicals compared to Jurkat
cells. Since higher concentrations of SDS were needed to reduce the viability of A549 cells compared
to Jurkat cells. As the TOXXs Analyzer was defect, the old FADU system was used for the testing of
the chemicals and the treatment protocol. The old FADU system could only run with deep-well plates,
therefore, all experiments were performed with Jurkat cells. First, a modified neutralization buffer was
tested. The 14 µM of β-mercaptoethanol were substituted by 7 µM of DTT. This was done, because
DTT is more user-friendly than β-mercaptoethanol, it is less toxic and volatile. Two different cell
numbers and 5 doses of X-rays were used for a side by side comparison of the two neutralization
buffers. After normalization to the T0 values no statistical significant difference could be observed. All
four conditions showed the same dose response curve. Hence, DTT can be used as a substitute for β-
mercaptoethanol. The last experiment was a test of the protocol used for the pre-validation of the
TOXXs Analyzer. However, it was performed with the old FADU system. Etoposide was used as
positive control to induce DNA strand breaks via inhibition of topoisomerase 2. A dilution series of 4-
nitrophenol from 40 mM to 0.013 mM was used as well as a dilution series of eugenol from 7 to
0.003 mM. Both dilution series showed a dose response, increasing concentrations of 4-nitropehneol
as well as increasing concentrations of eugenol induced the formation of DNA strand breaks.
However, only the highest doses 30 mM of 4-nitrophenol and 7 mM of eugenol induced a statistical
significant formation of DNA strand breaks. These concentrations were higher than the concentration
used in the MTT assay that already reduced significantly the cell viability, 5 mM of 4-nitrophenol and
3.5 mM of eugenol. Hence, at these concentrations it is not possible to exclude a cytotoxic effect. The
detected DNA strand breaks could be caused by cell death which induces the breakdown of the DNA.
At lower concentrations which did not reduced the cell viability, no DNA strand breaks could be
observed. However, these findings confirm the literature, because 4-nitrophenol and eugenol are
classified as non-DNA reactive [580].
Conclusions and outlook
156
11 Conclusions and outlook
The pre-validation have shown that the TOXXs Analyzer had serious technical issues. Several
attempts by the Cetics GmbH were conducted to identify and to fix the malfunction. However, these
attempts were unsuccessful. Therefore, it must be concluded that at the current development stage the
TOXXs Analyzer is no reliable platform for the FADU assay. Nevertheless, the source of the
malfunction seemed to be caused by the software rather than by the hardware. Since all hardware parts
of the TOXXs Analyzer were fully functional and errors seemed to occur only at certain assay steps.
Also during a revision by the supplier of the robot (Analytik Jena AG) no hardware defects were
recognized. Therefore, the trouble shooting should be focused on the software of the TOXXs
Analyzer. The performed experiments showed that chosen chemical test substances, cell lines and
SOPs are in principal working and can be used for the test of the TOXXs Analyzer.
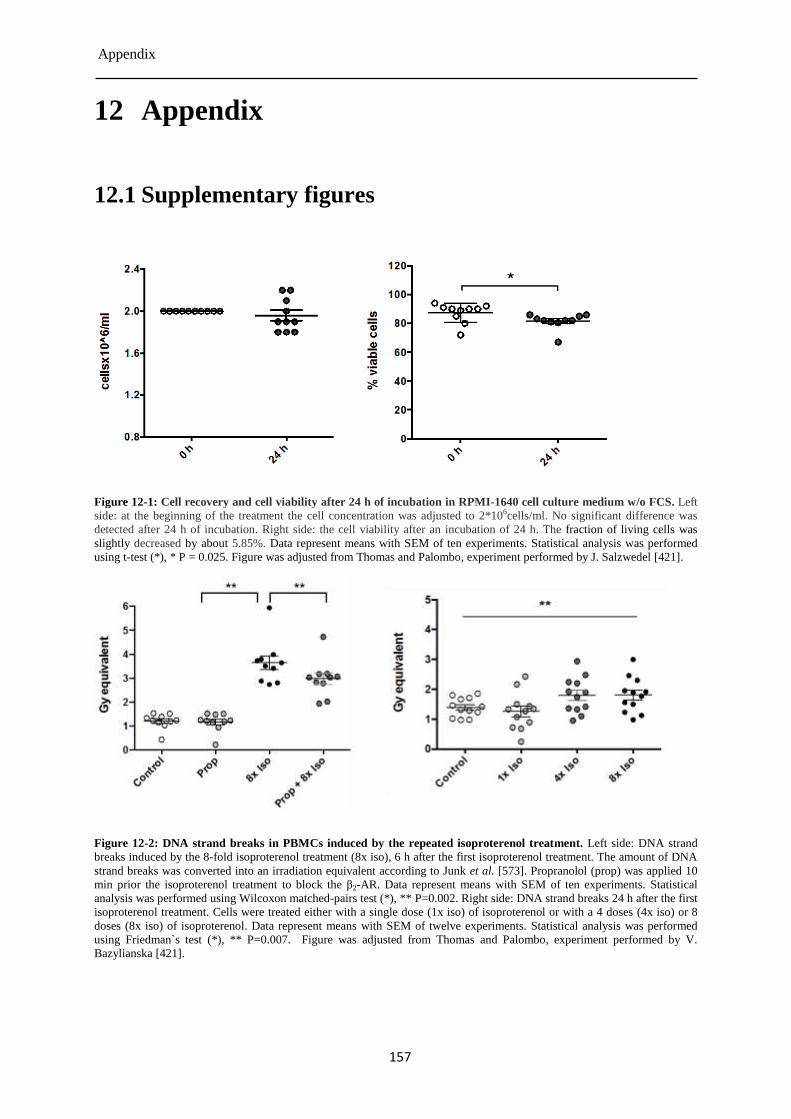
Appendix
157
12 Appendix
12.1 Supplementary figures
Figure 12-1: Cell recovery and cell viability after 24 h of incubation in RPMI-1640 cell culture medium w/o FCS. Left
side: at the beginning of the treatment the cell concentration was adjusted to 2*106cells/ml. No significant difference was
detected after 24 h of incubation. Right side: the cell viability after an incubation of 24 h. The fraction of living cells was
slightly decreased by about 5.85%. Data represent means with SEM of ten experiments. Statistical analysis was performed
using t-test (*), * P = 0.025. Figure was adjusted from Thomas and Palombo, experiment performed by J. Salzwedel [421].
Figure 12-2: DNA strand breaks in PBMCs induced by the repeated isoproterenol treatment. Left side: DNA strand
breaks induced by the 8-fold isoproterenol treatment (8x iso), 6 h after the first isoproterenol treatment. The amount of DNA
strand breaks was converted into an irradiation equivalent according to Junk et al. [573]. Propranolol (prop) was applied 10
min prior the isoproterenol treatment to block the β2-AR. Data represent means with SEM of ten experiments. Statistical
analysis was performed using Wilcoxon matched-pairs test (*), ** P=0.002. Right side: DNA strand breaks 24 h after the first
isoproterenol treatment. Cells were treated either with a single dose (1x iso) of isoproterenol or with a 4 doses (4x iso) or 8
doses (8x iso) of isoproterenol. Data represent means with SEM of twelve experiments. Statistical analysis was performed
using Friedman`s test (*), ** P=0.007. Figure was adjusted from Thomas and Palombo, experiment performed by V.
Bazylianska [421].
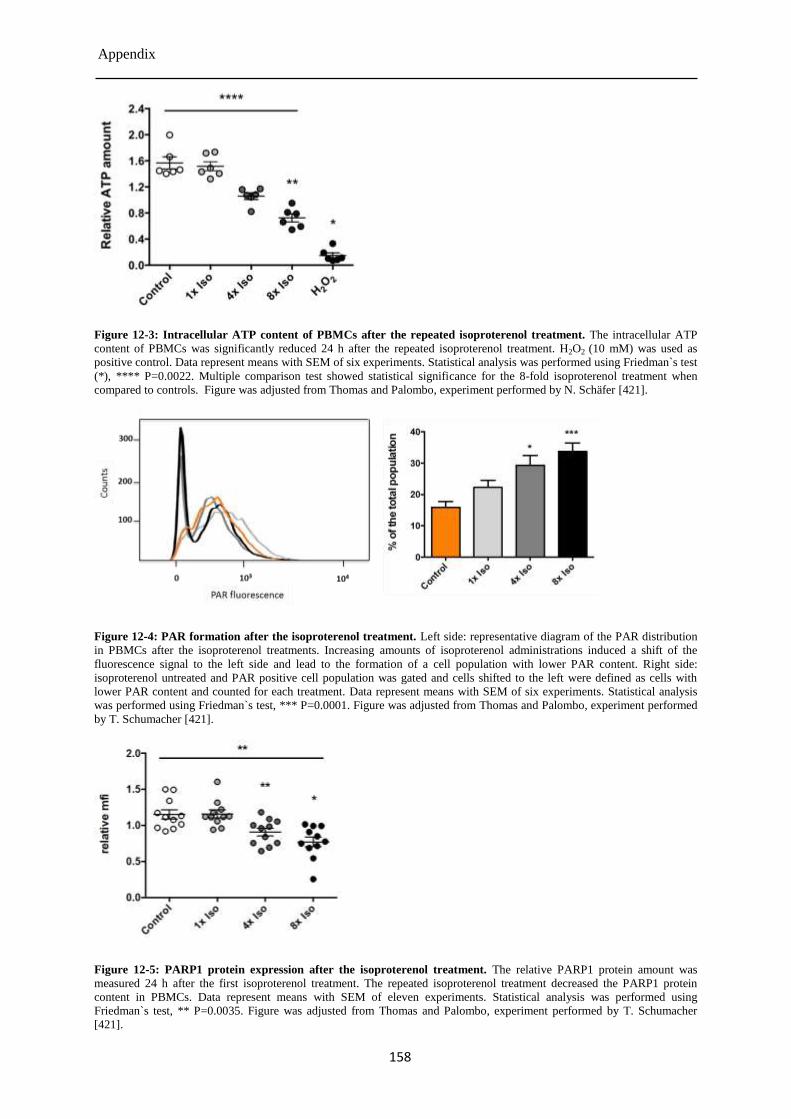
Appendix
158
Figure 12-3: Intracellular ATP content of PBMCs after the repeated isoproterenol treatment. The intracellular ATP
content of PBMCs was significantly reduced 24 h after the repeated isoproterenol treatment. H2O2 (10 mM) was used as
positive control. Data represent means with SEM of six experiments. Statistical analysis was performed using Friedman`s test
(*), **** P=0.0022. Multiple comparison test showed statistical significance for the 8-fold isoproterenol treatment when
compared to controls. Figure was adjusted from Thomas and Palombo, experiment performed by N. Schäfer [421].
Figure 12-4: PAR formation after the isoproterenol treatment. Left side: representative diagram of the PAR distribution
in PBMCs after the isoproterenol treatments. Increasing amounts of isoproterenol administrations induced a shift of the
fluorescence signal to the left side and lead to the formation of a cell population with lower PAR content. Right side:
isoproterenol untreated and PAR positive cell population was gated and cells shifted to the left were defined as cells with
lower PAR content and counted for each treatment. Data represent means with SEM of six experiments. Statistical analysis
was performed using Friedman`s test, *** P=0.0001. Figure was adjusted from Thomas and Palombo, experiment performed
by T. Schumacher [421].
Figure 12-5: PARP1 protein expression after the isoproterenol treatment. The relative PARP1 protein amount was
measured 24 h after the first isoproterenol treatment. The repeated isoproterenol treatment decreased the PARP1 protein
content in PBMCs. Data represent means with SEM of eleven experiments. Statistical analysis was performed using
Friedman`s test, ** P=0.0035. Figure was adjusted from Thomas and Palombo, experiment performed by T. Schumacher
[421].
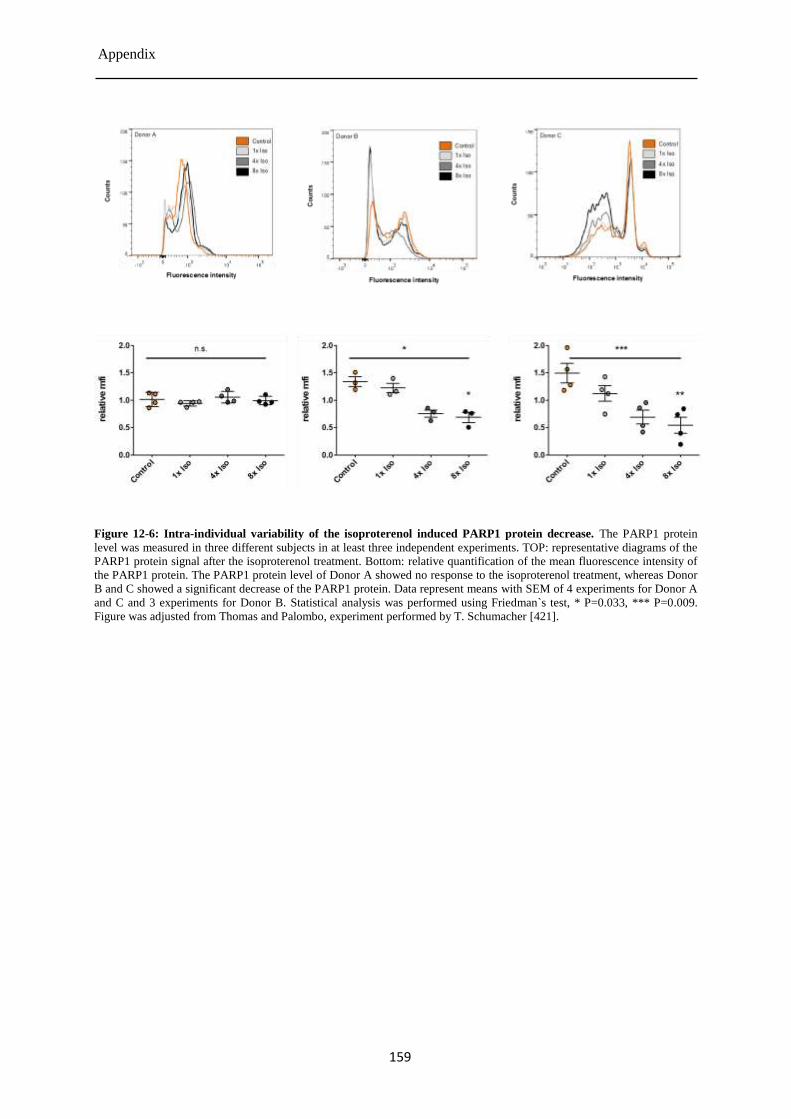
Appendix
159
Figure 12-6: Intra-individual variability of the isoproterenol induced PARP1 protein decrease. The PARP1 protein
level was measured in three different subjects in at least three independent experiments. TOP: representative diagrams of the
PARP1 protein signal after the isoproterenol treatment. Bottom: relative quantification of the mean fluorescence intensity of
the PARP1 protein. The PARP1 protein level of Donor A showed no response to the isoproterenol treatment, whereas Donor
B and C showed a significant decrease of the PARP1 protein. Data represent means with SEM of 4 experiments for Donor A
and C and 3 experiments for Donor B. Statistical analysis was performed using Friedman`s test, * P=0.033, *** P=0.009.
Figure was adjusted from Thomas and Palombo, experiment performed by T. Schumacher [421].
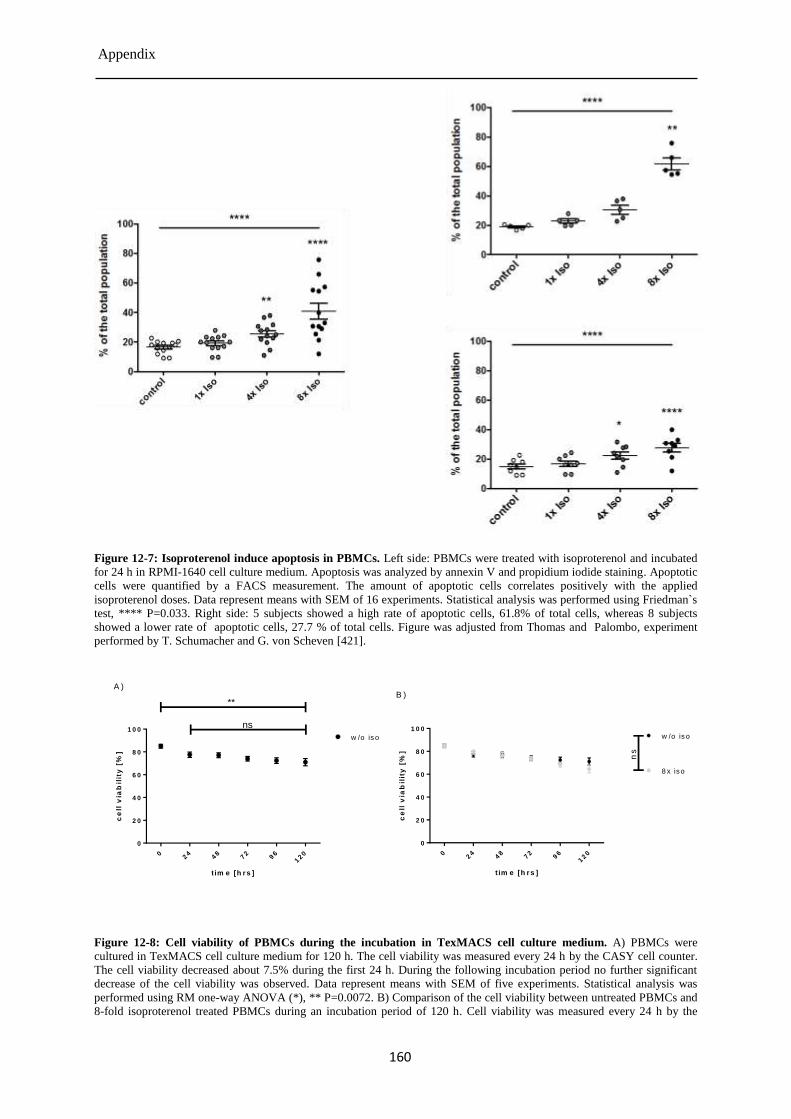
Appendix
160
Figure 12-7: Isoproterenol induce apoptosis in PBMCs. Left side: PBMCs were treated with isoproterenol and incubated
for 24 h in RPMI-1640 cell culture medium. Apoptosis was analyzed by annexin V and propidium iodide staining. Apoptotic
cells were quantified by a FACS measurement. The amount of apoptotic cells correlates positively with the applied
isoproterenol doses. Data represent means with SEM of 16 experiments. Statistical analysis was performed using Friedman`s
test, **** P=0.033. Right side: 5 subjects showed a high rate of apoptotic cells, 61.8% of total cells, whereas 8 subjects
showed a lower rate of apoptotic cells, 27.7 % of total cells. Figure was adjusted from Thomas and Palombo, experiment
performed by T. Schumacher and G. von Scheven [421].
t im e [h rs ]
ce
ll v
iab
ilit
y [
%]
024
48
72
96
120
0
2 0
4 0
6 0
8 0
1 0 0
w /o is o
**
ns
A )
t im e [h rs ]
ce
ll v
iab
ilit
y [
%]
024
48
72
96
120
0
2 0
4 0
6 0
8 0
1 0 0
8 x iso
w /o is o
ns
B )
Figure 12-8: Cell viability of PBMCs during the incubation in TexMACS cell culture medium. A) PBMCs were
cultured in TexMACS cell culture medium for 120 h. The cell viability was measured every 24 h by the CASY cell counter.
The cell viability decreased about 7.5% during the first 24 h. During the following incubation period no further significant
decrease of the cell viability was observed. Data represent means with SEM of five experiments. Statistical analysis was
performed using RM one-way ANOVA (*), ** P=0.0072. B) Comparison of the cell viability between untreated PBMCs and
8-fold isoproterenol treated PBMCs during an incubation period of 120 h. Cell viability was measured every 24 h by the
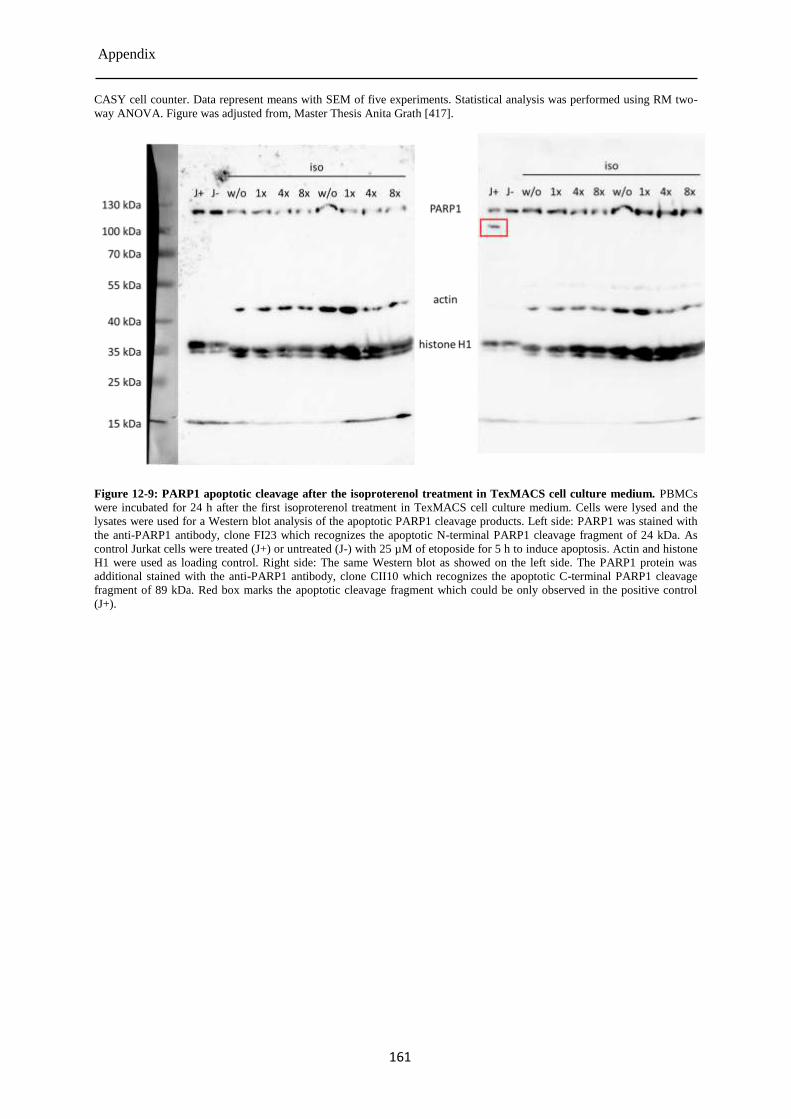
Appendix
161
CASY cell counter. Data represent means with SEM of five experiments. Statistical analysis was performed using RM two-
way ANOVA. Figure was adjusted from, Master Thesis Anita Grath [417].
Figure 12-9: PARP1 apoptotic cleavage after the isoproterenol treatment in TexMACS cell culture medium. PBMCs
were incubated for 24 h after the first isoproterenol treatment in TexMACS cell culture medium. Cells were lysed and the
lysates were used for a Western blot analysis of the apoptotic PARP1 cleavage products. Left side: PARP1 was stained with
the anti-PARP1 antibody, clone FI23 which recognizes the apoptotic N-terminal PARP1 cleavage fragment of 24 kDa. As
control Jurkat cells were treated (J+) or untreated (J-) with 25 µM of etoposide for 5 h to induce apoptosis. Actin and histone
H1 were used as loading control. Right side: The same Western blot as showed on the left side. The PARP1 protein was
additional stained with the anti-PARP1 antibody, clone CII10 which recognizes the apoptotic C-terminal PARP1 cleavage
fragment of 89 kDa. Red box marks the apoptotic cleavage fragment which could be only observed in the positive control
(J+).
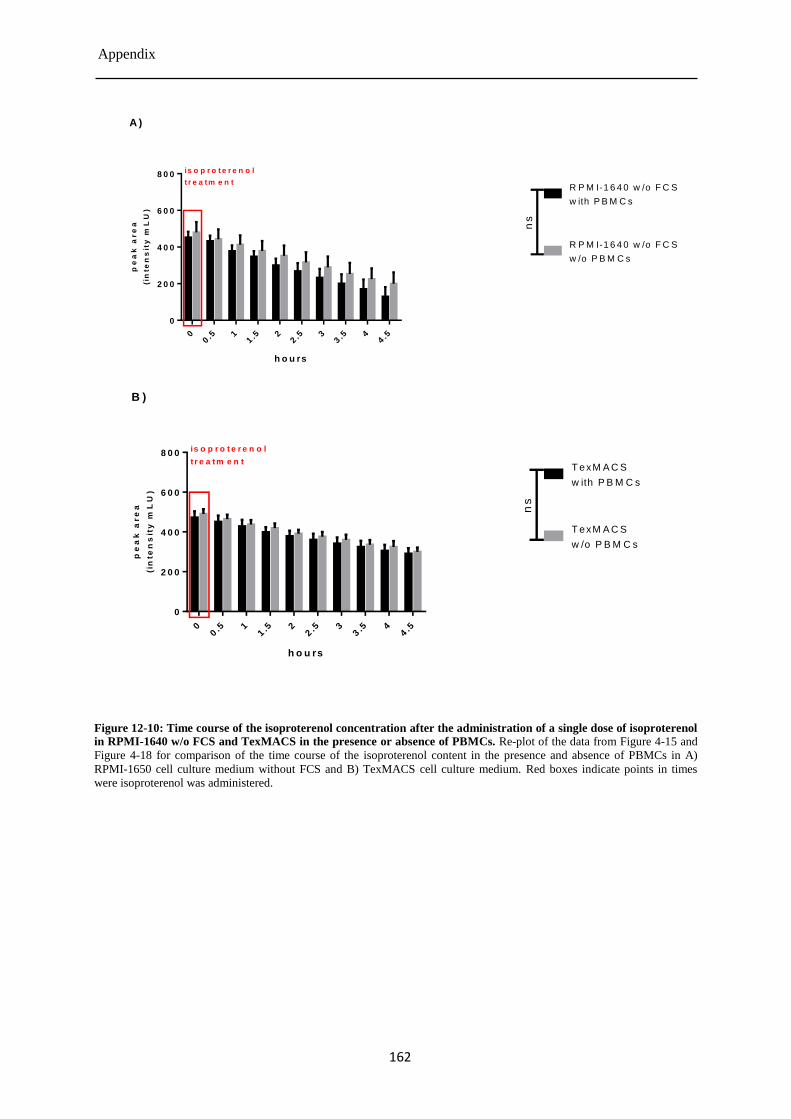
Appendix
162
h o u rs
pe
ak
ar
ea
(in
ten
sit
y m
LU
)
00.5 1
1.5 2
2.5 3
3.5 4
4.5
0
2 0 0
4 0 0
6 0 0
8 0 0is o p r o t e r e n o l
t r e a tm e n tR P M I-1 6 4 0 w /o F C S
w ith P B M C s
A )
ns
R P M I-1 6 4 0 w /o F C S
w /o P B M C s
h o u rs
pe
ak
ar
ea
(in
ten
sit
y m
LU
)
00.5 1
1.5 2
2.5 3
3.5 4
4.5
0
2 0 0
4 0 0
6 0 0
8 0 0
T exM A C S
w ith P B M C s
is o p r o t e r e n o l
t r e a tm e n t
B )
ns
T exM A C S
w /o P B M C s
Figure 12-10: Time course of the isoproterenol concentration after the administration of a single dose of isoproterenol
in RPMI-1640 w/o FCS and TexMACS in the presence or absence of PBMCs. Re-plot of the data from Figure 4-15 and
Figure 4-18 for comparison of the time course of the isoproterenol content in the presence and absence of PBMCs in A)
RPMI-1650 cell culture medium without FCS and B) TexMACS cell culture medium. Red boxes indicate points in times
were isoproterenol was administered.
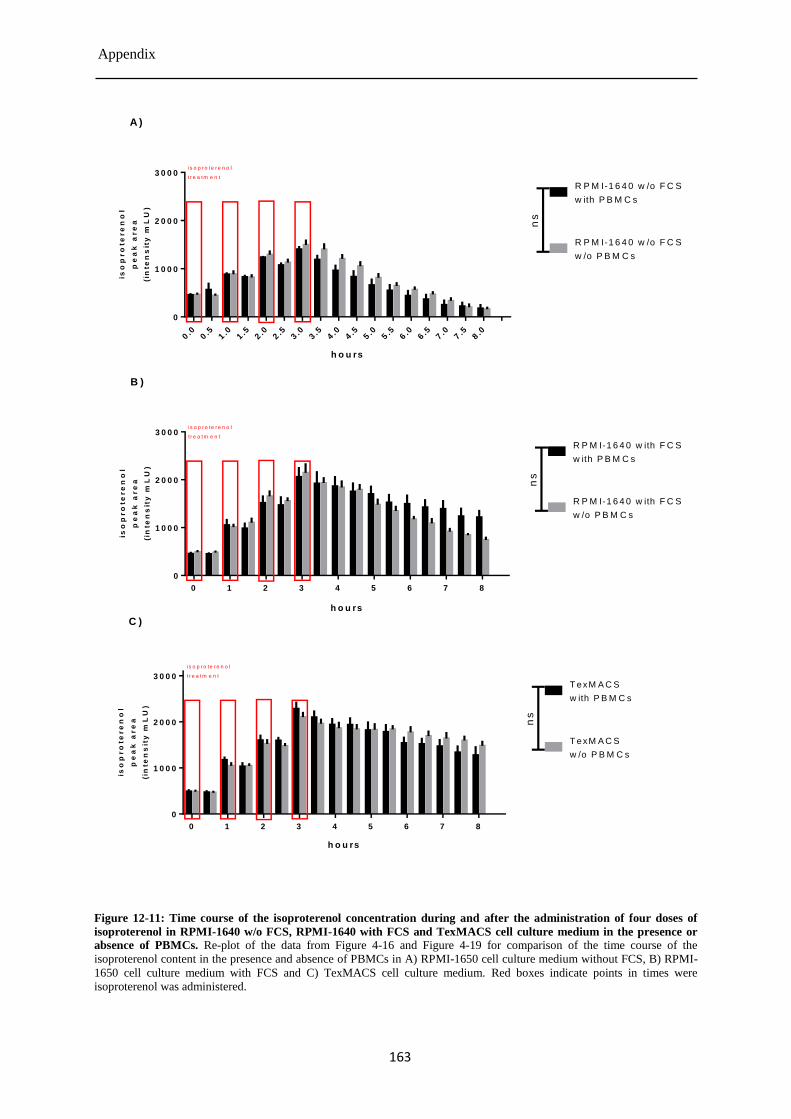
Appendix
163
h o u rs
iso
pr
ote
re
no
l
pe
ak
ar
ea
(in
ten
sit
y m
LU
)
0.0
0.5
1.0
1.5
2.0
2.5
3.0
3.5
4.0
4.5
5.0
5.5
6.0
6.5
7.0
7.5
8.0
0
1 0 0 0
2 0 0 0
3 0 0 0
R P M I-1 6 4 0 w /o F C S
w ith P B M C s
R P M I-1 6 4 0 w /o F C S
w /o P B M C s
is o p r o te r e n o l
t r e a tm e n t
ns
A )
h o u rs
iso
pr
ote
re
no
l
pe
ak
ar
ea
(in
ten
sit
y m
LU
)
0 1 2 3 4 5 6 7 8
0
1 0 0 0
2 0 0 0
3 0 0 0
R P M I-1 6 4 0 w ith F C S
w ith P B M C s
R P M I-1 6 4 0 w ith F C S
w /o P B M C s
is o p r o te r e n o l
t r e a tm e n t
ns
B )
h o u rs
iso
pr
ote
re
no
l
pe
ak
ar
ea
(in
ten
sit
y m
LU
)
0 1 2 3 4 5 6 7 8
0
1 0 0 0
2 0 0 0
3 0 0 0T exM A C S
w ith P B M C s
T exM A C S
w /o P B M C s
is o p r o te r e n o l
t r e a tm e n t
ns
C )
Figure 12-11: Time course of the isoproterenol concentration during and after the administration of four doses of
isoproterenol in RPMI-1640 w/o FCS, RPMI-1640 with FCS and TexMACS cell culture medium in the presence or
absence of PBMCs. Re-plot of the data from Figure 4-16 and Figure 4-19 for comparison of the time course of the
isoproterenol content in the presence and absence of PBMCs in A) RPMI-1650 cell culture medium without FCS, B) RPMI-
1650 cell culture medium with FCS and C) TexMACS cell culture medium. Red boxes indicate points in times were
isoproterenol was administered.
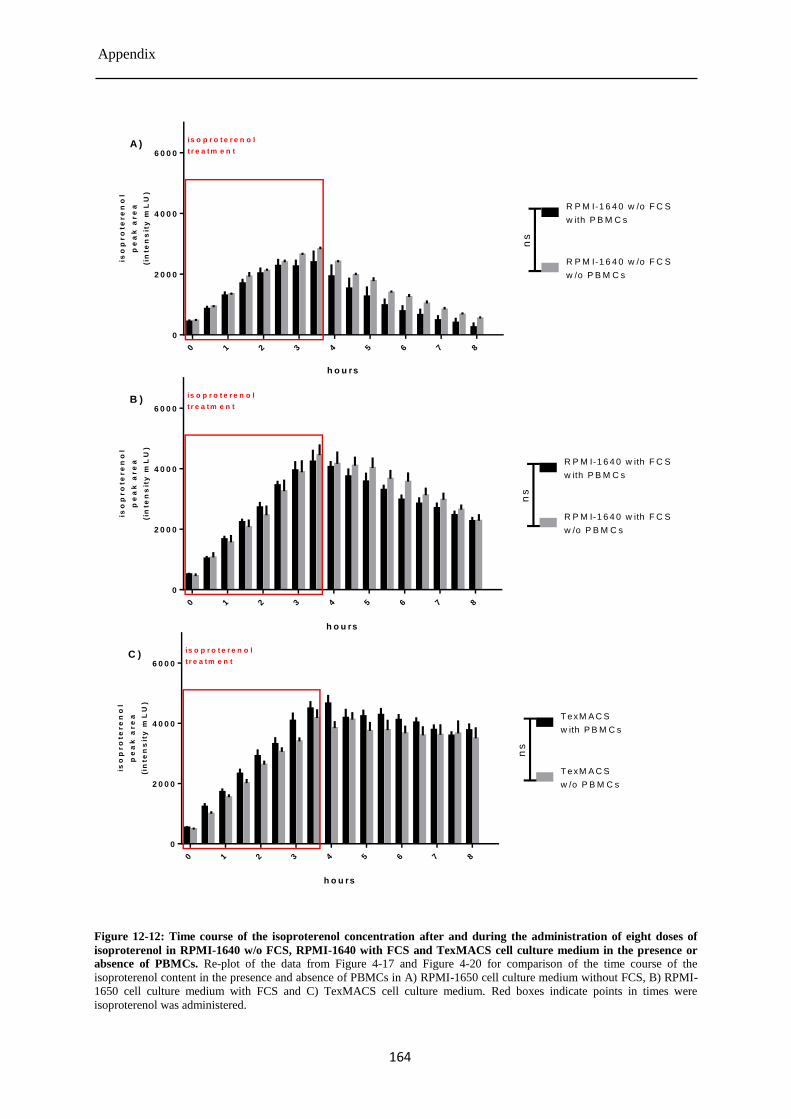
Appendix
164
h o u rs
iso
pr
ote
re
no
l
pe
ak
ar
ea
(in
ten
sit
y m
LU
)
0 1 2 3 4 5 6 7 8
0
2 0 0 0
4 0 0 0
6 0 0 0
R P M I-1 6 4 0 w /o F C S
w ith P B M C s
R P M I-1 6 4 0 w /o F C S
w /o P B M C s
ns
A )is o p r o t e r e n o l
t r e a tm e n t
h o u rs
iso
pr
ote
re
no
l
pe
ak
ar
ea
(in
ten
sit
y m
LU
)
0 1 2 3 4 5 6 7 8
0
2 0 0 0
4 0 0 0
6 0 0 0
R P M I-1 6 4 0 w ith F C S
w ith P B M C s
R P M I-1 6 4 0 w ith F C S
w /o P B M C sn
s
B )is o p r o t e r e n o l
t r e a tm e n t
h o u rs
iso
pr
ote
re
no
l
pe
ak
ar
ea
(in
ten
sit
y m
LU
)
0 1 2 3 4 5 6 7 8
0
2 0 0 0
4 0 0 0
6 0 0 0
T exM A C S
w ith P B M C s
T exM A C S
w /o P B M C s
is o p r o t e r e n o l
t r e a tm e n t
ns
C )
Figure 12-12: Time course of the isoproterenol concentration after and during the administration of eight doses of
isoproterenol in RPMI-1640 w/o FCS, RPMI-1640 with FCS and TexMACS cell culture medium in the presence or
absence of PBMCs. Re-plot of the data from Figure 4-17 and Figure 4-20 for comparison of the time course of the
isoproterenol content in the presence and absence of PBMCs in A) RPMI-1650 cell culture medium without FCS, B) RPMI-
1650 cell culture medium with FCS and C) TexMACS cell culture medium. Red boxes indicate points in times were
isoproterenol was administered.
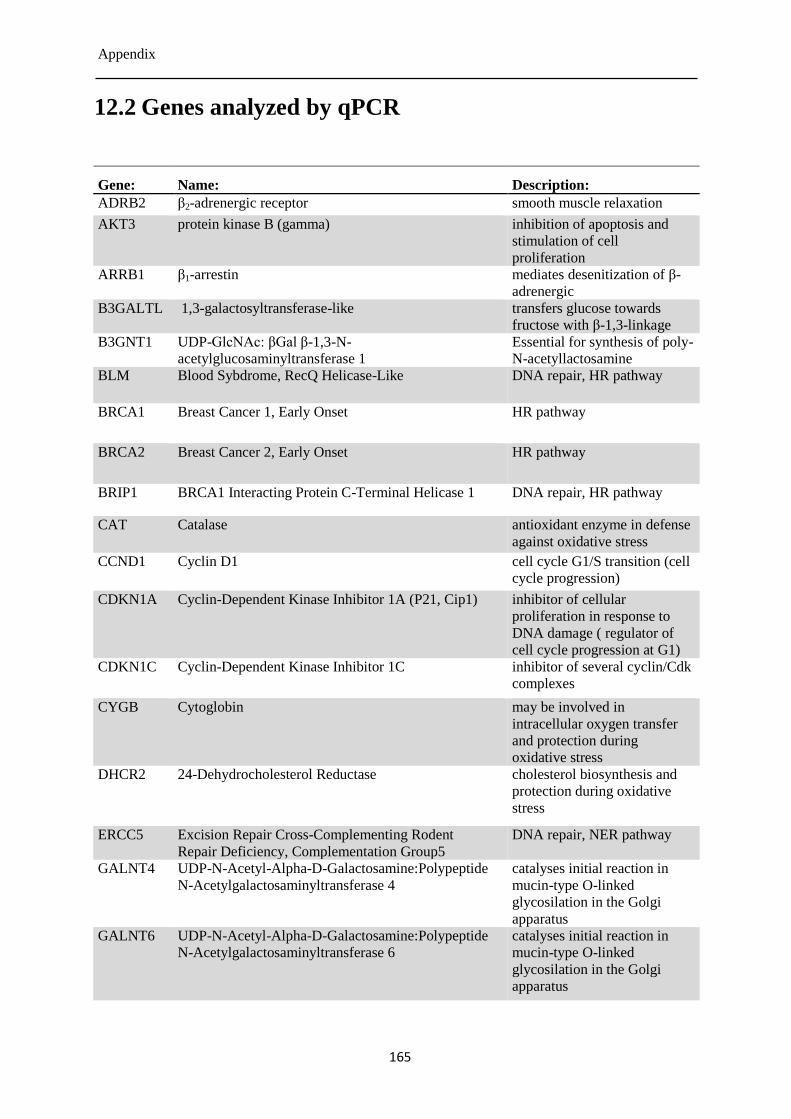
Appendix
165
12.2 Genes analyzed by qPCR
Gene: Name: Description:
ADRB2 β2-adrenergic receptor smooth muscle relaxation
AKT3 protein kinase B (gamma) inhibition of apoptosis and
stimulation of cell
proliferation
ARRB1 β1-arrestin mediates desenitization of β-
adrenergic
B3GALTL 1,3-galactosyltransferase-like transfers glucose towards
fructose with β-1,3-linkage
B3GNT1 UDP-GlcNAc: βGal β-1,3-N-
acetylglucosaminyltransferase 1
Essential for synthesis of poly-
N-acetyllactosamine
BLM Blood Sybdrome, RecQ Helicase-Like DNA repair, HR pathway
BRCA1 Breast Cancer 1, Early Onset HR pathway
BRCA2 Breast Cancer 2, Early Onset HR pathway
BRIP1 BRCA1 Interacting Protein C-Terminal Helicase 1 DNA repair, HR pathway
CAT Catalase antioxidant enzyme in defense
against oxidative stress
CCND1 Cyclin D1 cell cycle G1/S transition (cell
cycle progression)
CDKN1A Cyclin-Dependent Kinase Inhibitor 1A (P21, Cip1) inhibitor of cellular
proliferation in response to
DNA damage ( regulator of
cell cycle progression at G1)
CDKN1C Cyclin-Dependent Kinase Inhibitor 1C inhibitor of several cyclin/Cdk
complexes
CYGB Cytoglobin may be involved in
intracellular oxygen transfer
and protection during
oxidative stress
DHCR2 24-Dehydrocholesterol Reductase cholesterol biosynthesis and
protection during oxidative
stress
ERCC5 Excision Repair Cross-Complementing Rodent
Repair Deficiency, Complementation Group5
DNA repair, NER pathway
GALNT4 UDP-N-Acetyl-Alpha-D-Galactosamine:Polypeptide
N-Acetylgalactosaminyltransferase 4
catalyses initial reaction in
mucin-type O-linked
glycosilation in the Golgi
apparatus
GALNT6 UDP-N-Acetyl-Alpha-D-Galactosamine:Polypeptide
N-Acetylgalactosaminyltransferase 6
catalyses initial reaction in
mucin-type O-linked
glycosilation in the Golgi
apparatus
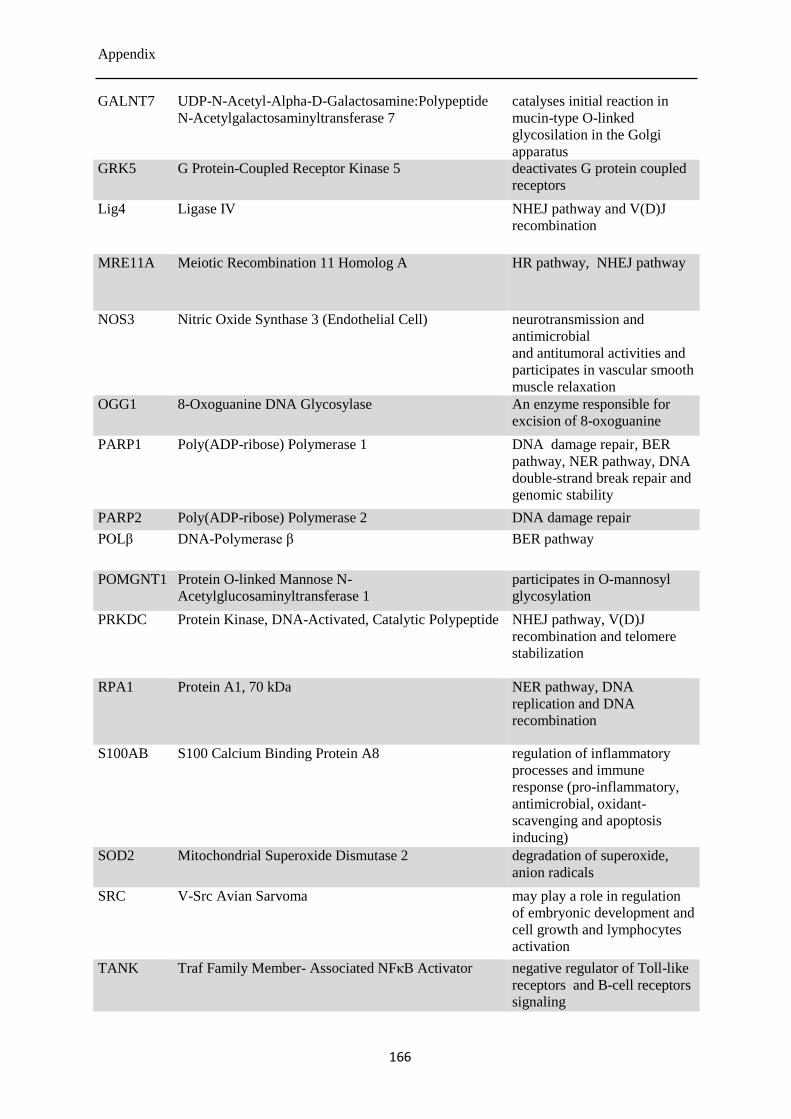
Appendix
166
GALNT7 UDP-N-Acetyl-Alpha-D-Galactosamine:Polypeptide
N-Acetylgalactosaminyltransferase 7
catalyses initial reaction in
mucin-type O-linked
glycosilation in the Golgi
apparatus
GRK5 G Protein-Coupled Receptor Kinase 5 deactivates G protein coupled
receptors
Lig4 Ligase IV NHEJ pathway and V(D)J
recombination
MRE11A Meiotic Recombination 11 Homolog A HR pathway, NHEJ pathway
NOS3 Nitric Oxide Synthase 3 (Endothelial Cell) neurotransmission and
antimicrobial
and antitumoral activities and
participates in vascular smooth
muscle relaxation
OGG1 8-Oxoguanine DNA Glycosylase An enzyme responsible for
excision of 8-oxoguanine
PARP1 Poly(ADP-ribose) Polymerase 1 DNA damage repair, BER
pathway, NER pathway, DNA
double-strand break repair and
genomic stability
PARP2 Poly(ADP-ribose) Polymerase 2 DNA damage repair
POLβ DNA-Polymerase β BER pathway
POMGNT1 Protein O-linked Mannose N-
Acetylglucosaminyltransferase 1
participates in O-mannosyl
glycosylation
PRKDC Protein Kinase, DNA-Activated, Catalytic Polypeptide NHEJ pathway, V(D)J
recombination and telomere
stabilization
RPA1 Protein A1, 70 kDa NER pathway, DNA
replication and DNA
recombination
S100AB S100 Calcium Binding Protein A8 regulation of inflammatory
processes and immune
response (pro-inflammatory,
antimicrobial, oxidant-
scavenging and apoptosis
inducing)
SOD2 Mitochondrial Superoxide Dismutase 2 degradation of superoxide,
anion radicals
SRC V-Src Avian Sarvoma may play a role in regulation
of embryonic development and
cell growth and lymphocytes
activation
TANK Traf Family Member- Associated NFκB Activator negative regulator of Toll-like
receptors and B-cell receptors
signaling
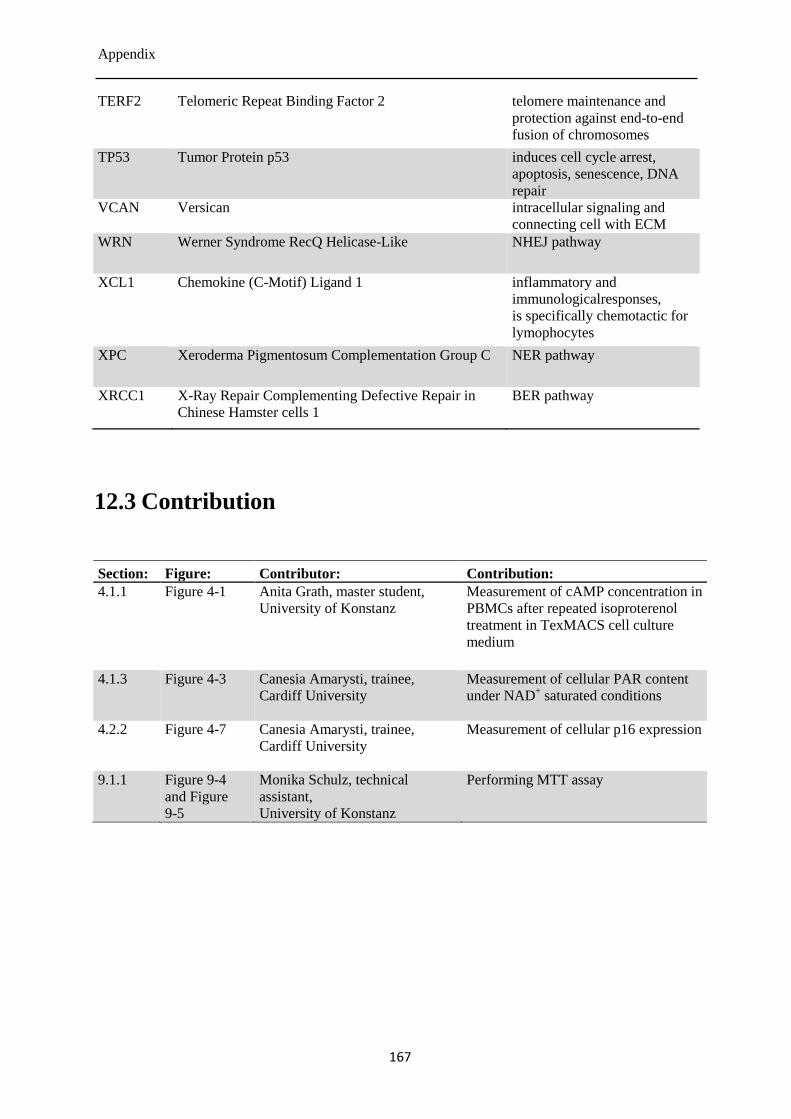
Appendix
167
TERF2 Telomeric Repeat Binding Factor 2 telomere maintenance and
protection against end-to-end
fusion of chromosomes
TP53 Tumor Protein p53 induces cell cycle arrest,
apoptosis, senescence, DNA
repair
VCAN Versican intracellular signaling and
connecting cell with ECM
WRN Werner Syndrome RecQ Helicase-Like NHEJ pathway
XCL1 Chemokine (C-Motif) Ligand 1 inflammatory and
immunologicalresponses,
is specifically chemotactic for
lymophocytes
XPC Xeroderma Pigmentosum Complementation Group C NER pathway
XRCC1 X-Ray Repair Complementing Defective Repair in
Chinese Hamster cells 1
BER pathway
12.3 Contribution
Section: Figure: Contributor: Contribution:
4.1.1 Figure 4-1 Anita Grath, master student,
University of Konstanz
Measurement of cAMP concentration in
PBMCs after repeated isoproterenol
treatment in TexMACS cell culture
medium
4.1.3 Figure 4-3 Canesia Amarysti, trainee,
Cardiff University
Measurement of cellular PAR content
under NAD+ saturated conditions
4.2.2 Figure 4-7 Canesia Amarysti, trainee,
Cardiff University
Measurement of cellular p16 expression
9.1.1 Figure 9-4
and Figure
9-5
Monika Schulz, technical
assistant,
University of Konstanz
Performing MTT assay
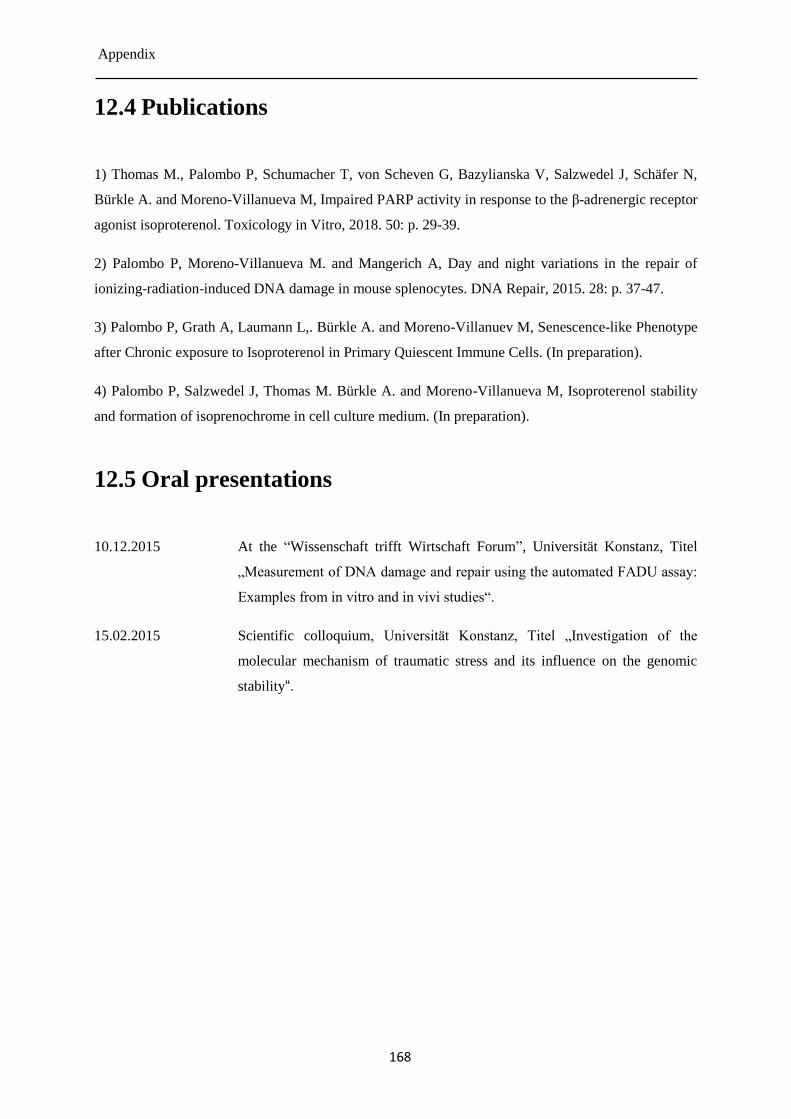
Appendix
168
12.4 Publications
1) Thomas M., Palombo P, Schumacher T, von Scheven G, Bazylianska V, Salzwedel J, Schäfer N,
Bürkle A. and Moreno-Villanueva M, Impaired PARP activity in response to the β-adrenergic receptor
agonist isoproterenol. Toxicology in Vitro, 2018. 50: p. 29-39.
2) Palombo P, Moreno-Villanueva M. and Mangerich A, Day and night variations in the repair of
ionizing-radiation-induced DNA damage in mouse splenocytes. DNA Repair, 2015. 28: p. 37-47.
3) Palombo P, Grath A, Laumann L,. Bürkle A. and Moreno-Villanuev M, Senescence-like Phenotype
after Chronic exposure to Isoproterenol in Primary Quiescent Immune Cells. (In preparation).
4) Palombo P, Salzwedel J, Thomas M. Bürkle A. and Moreno-Villanueva M, Isoproterenol stability
and formation of isoprenochrome in cell culture medium. (In preparation).
12.5 Oral presentations
10.12.2015 At the “Wissenschaft trifft Wirtschaft Forum”, Universität Konstanz, Titel
„Measurement of DNA damage and repair using the automated FADU assay:
Examples from in vitro and in vivi studies“.
15.02.2015 Scientific colloquium, Universität Konstanz, Titel „Investigation of the
molecular mechanism of traumatic stress and its influence on the genomic
stability“.
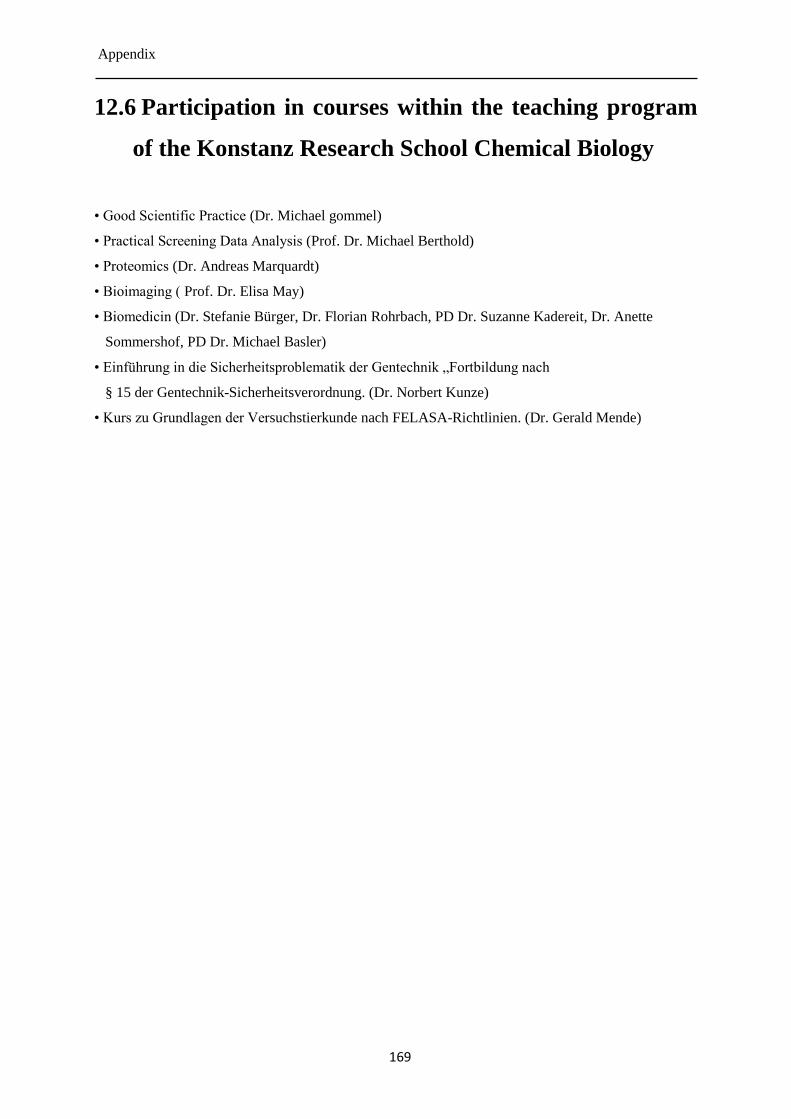
Appendix
169
12.6 Participation in courses within the teaching program
of the Konstanz Research School Chemical Biology
• Good Scientific Practice (Dr. Michael gommel)
• Practical Screening Data Analysis (Prof. Dr. Michael Berthold)
• Proteomics (Dr. Andreas Marquardt)
• Bioimaging ( Prof. Dr. Elisa May)
• Biomedicin (Dr. Stefanie Bürger, Dr. Florian Rohrbach, PD Dr. Suzanne Kadereit, Dr. Anette
Sommershof, PD Dr. Michael Basler)
• Einführung in die Sicherheitsproblematik der Gentechnik „Fortbildung nach
§ 15 der Gentechnik-Sicherheitsverordnung. (Dr. Norbert Kunze)
• Kurs zu Grundlagen der Versuchstierkunde nach FELASA-Richtlinien. (Dr. Gerald Mende)
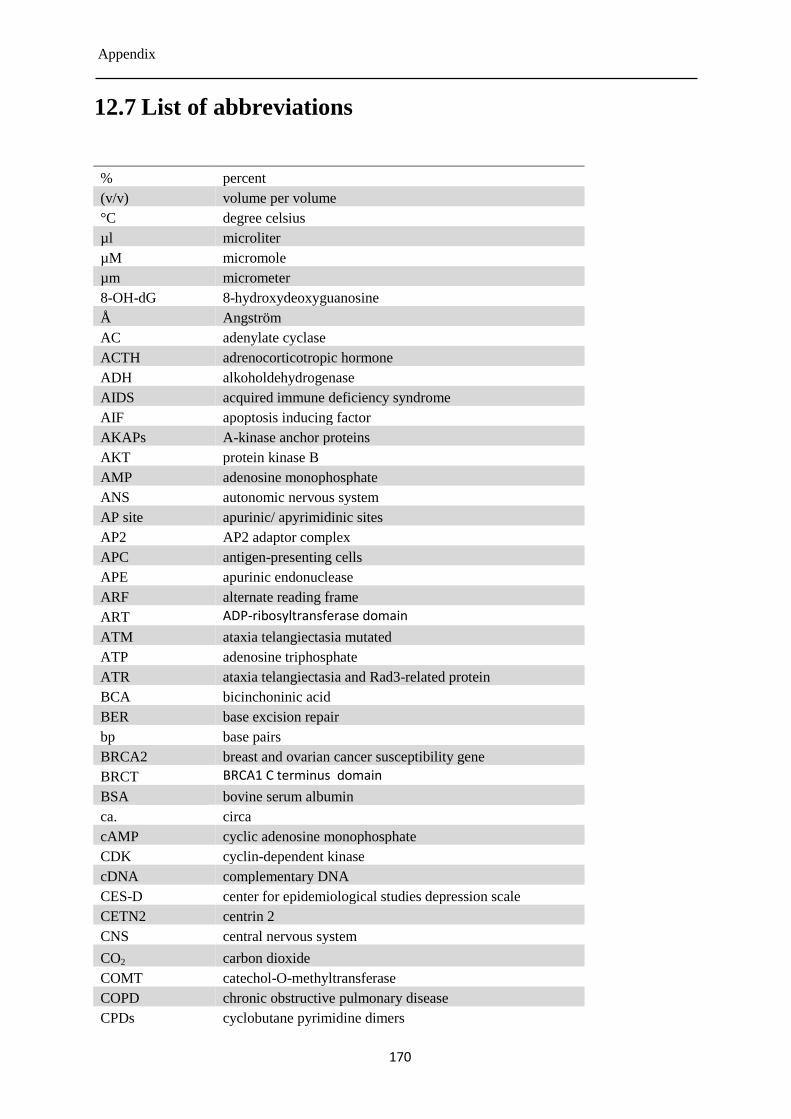
Appendix
170
12.7 List of abbreviations
% percent
(v/v) volume per volume
°C degree celsius
µl microliter
µM micromole
µm micrometer
8-OH-dG 8-hydroxydeoxyguanosine
Å Angström
AC adenylate cyclase
ACTH adrenocorticotropic hormone
ADH alkoholdehydrogenase
AIDS acquired immune deficiency syndrome
AIF apoptosis inducing factor
AKAPs A-kinase anchor proteins
AKT protein kinase B
AMP adenosine monophosphate
ANS autonomic nervous system
AP site apurinic/ apyrimidinic sites
AP2 AP2 adaptor complex
APC antigen-presenting cells
APE apurinic endonuclease
ARF alternate reading frame
ART ADP-ribosyltransferase domain
ATM ataxia telangiectasia mutated
ATP adenosine triphosphate
ATR ataxia telangiectasia and Rad3-related protein
BCA bicinchoninic acid
BER base excision repair
bp base pairs
BRCA2 breast and ovarian cancer susceptibility gene
BRCT BRCA1 C terminus domain
BSA bovine serum albumin
ca. circa
cAMP cyclic adenosine monophosphate
CDK cyclin-dependent kinase
cDNA complementary DNA
CES-D center for epidemiological studies depression scale
CETN2 centrin 2
CNS central nervous system
CO2 carbon dioxide
COMT catechol-O-methyltransferase
COPD chronic obstructive pulmonary disease
CPDs cyclobutane pyrimidine dimers
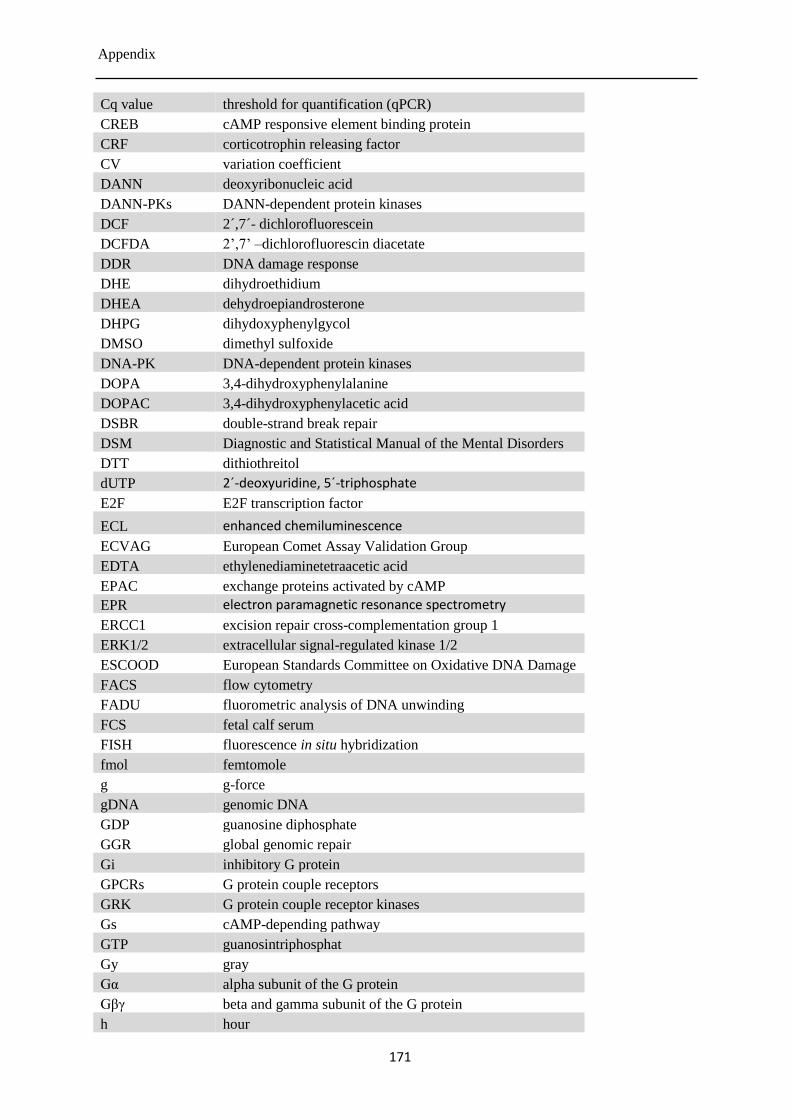
Appendix
171
Cq value threshold for quantification (qPCR)
CREB cAMP responsive element binding protein
CRF corticotrophin releasing factor
CV variation coefficient
DANN deoxyribonucleic acid
DANN-PKs DANN-dependent protein kinases
DCF 2´,7´- dichlorofluorescein
DCFDA 2’,7’ –dichlorofluorescin diacetate
DDR DNA damage response
DHE dihydroethidium
DHEA dehydroepiandrosterone
DHPG dihydoxyphenylgycol
DMSO dimethyl sulfoxide
DNA-PK DNA-dependent protein kinases
DOPA 3,4-dihydroxyphenylalanine
DOPAC 3,4-dihydroxyphenylacetic acid
DSBR double-strand break repair
DSM Diagnostic and Statistical Manual of the Mental Disorders
DTT dithiothreitol
dUTP 2´-deoxyuridine, 5´-triphosphate
E2F E2F transcription factor
ECL enhanced chemiluminescence
ECVAG European Comet Assay Validation Group
EDTA ethylenediaminetetraacetic acid
EPAC exchange proteins activated by cAMP
EPR electron paramagnetic resonance spectrometry
ERCC1 excision repair cross-complementation group 1
ERK1/2 extracellular signal-regulated kinase 1/2
ESCOOD European Standards Committee on Oxidative DNA Damage
FACS flow cytometry
FADU fluorometric analysis of DNA unwinding
FCS fetal calf serum
FISH fluorescence in situ hybridization
fmol femtomole
g g-force
gDNA genomic DNA
GDP guanosine diphosphate
GGR global genomic repair
Gi inhibitory G protein
GPCRs G protein couple receptors
GRK G protein couple receptor kinases
Gs cAMP-depending pathway
GTP guanosintriphosphat
Gy gray
Gα alpha subunit of the G protein
Gβγ beta and gamma subunit of the G protein
h hour
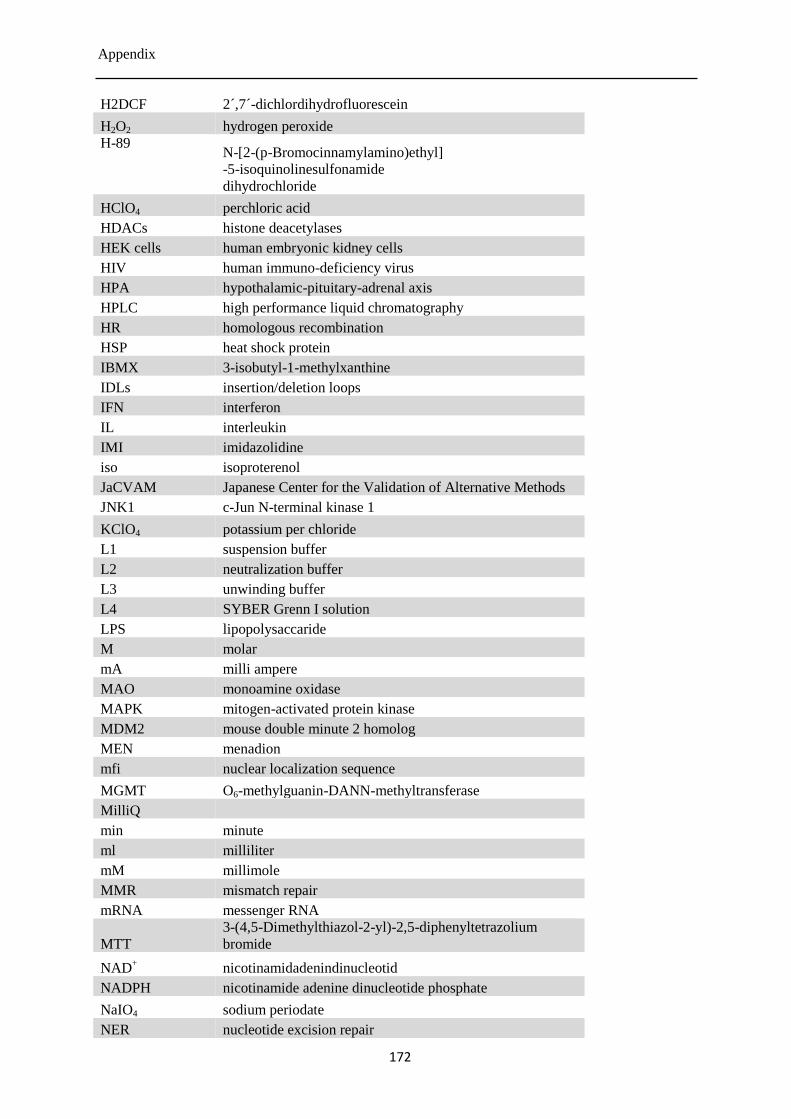
Appendix
172
H2DCF 2´,7´-dichlordihydrofluorescein
H2O2 hydrogen peroxide
H-89 N-[2-(p-Bromocinnamylamino)ethyl]
-5-isoquinolinesulfonamide
dihydrochloride
HClO4 perchloric acid
HDACs histone deacetylases
HEK cells human embryonic kidney cells
HIV human immuno-deficiency virus
HPA hypothalamic-pituitary-adrenal axis
HPLC high performance liquid chromatography
HR homologous recombination
HSP heat shock protein
IBMX 3-isobutyl-1-methylxanthine
IDLs insertion/deletion loops
IFN interferon
IL interleukin
IMI imidazolidine
iso isoproterenol
JaCVAM Japanese Center for the Validation of Alternative Methods
JNK1 c-Jun N-terminal kinase 1
KClO4 potassium per chloride
L1 suspension buffer
L2 neutralization buffer
L3 unwinding buffer
L4 SYBER Grenn I solution
LPS lipopolysaccaride
M molar
mA milli ampere
MAO monoamine oxidase
MAPK mitogen-activated protein kinase
MDM2 mouse double minute 2 homolog
MEN menadion
mfi nuclear localization sequence
MGMT O6-methylguanin-DANN-methyltransferase
MilliQ
min minute
ml milliliter
mM millimole
MMR mismatch repair
mRNA messenger RNA
MTT
3-(4,5-Dimethylthiazol-2-yl)-2,5-diphenyltetrazolium
bromide
NAD+ nicotinamidadenindinucleotid
NADPH nicotinamide adenine dinucleotide phosphate
NaIO4 sodium periodate
NER nucleotide excision repair
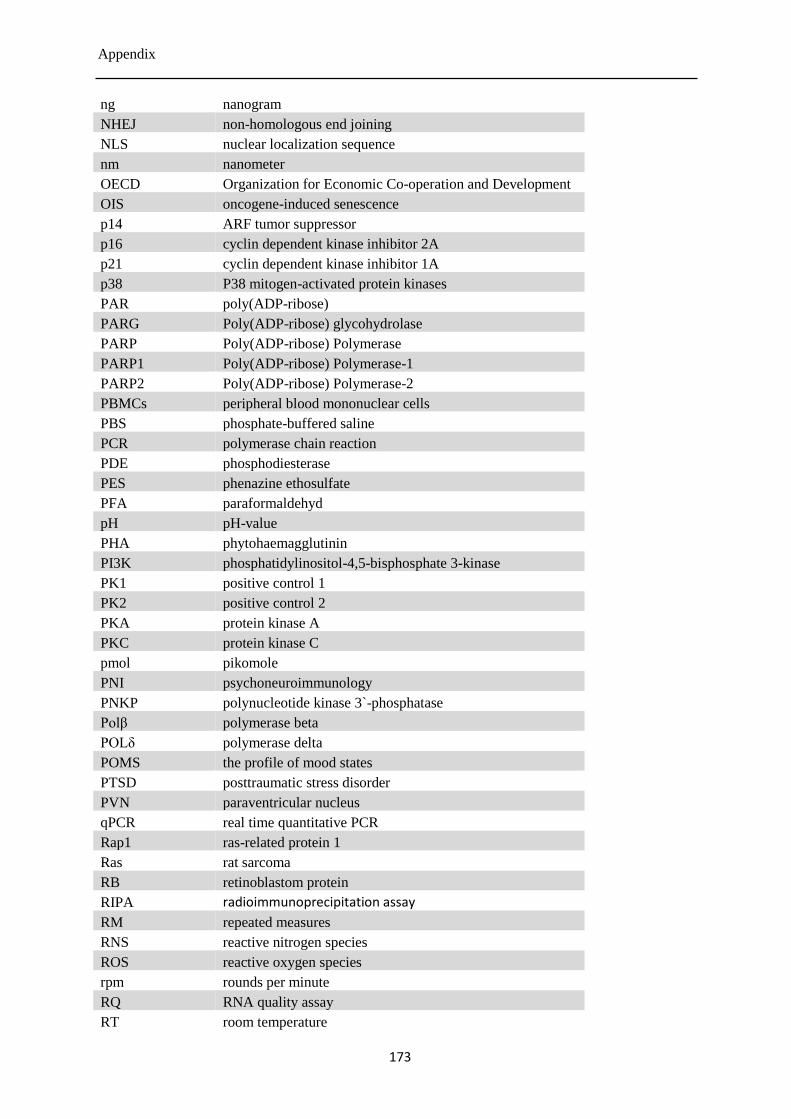
Appendix
173
ng nanogram
NHEJ non-homologous end joining
NLS nuclear localization sequence
nm nanometer
OECD Organization for Economic Co-operation and Development
OIS oncogene-induced senescence
p14 ARF tumor suppressor
p16 cyclin dependent kinase inhibitor 2A
p21 cyclin dependent kinase inhibitor 1A
p38 P38 mitogen-activated protein kinases
PAR poly(ADP-ribose)
PARG Poly(ADP-ribose) glycohydrolase
PARP Poly(ADP-ribose) Polymerase
PARP1 Poly(ADP-ribose) Polymerase-1
PARP2 Poly(ADP-ribose) Polymerase-2
PBMCs peripheral blood mononuclear cells
PBS phosphate-buffered saline
PCR polymerase chain reaction
PDE phosphodiesterase
PES phenazine ethosulfate
PFA paraformaldehyd
pH pH-value
PHA phytohaemagglutinin
PI3K phosphatidylinositol-4,5-bisphosphate 3-kinase
PK1 positive control 1
PK2 positive control 2
PKA protein kinase A
PKC protein kinase C
pmol pikomole
PNI psychoneuroimmunology
PNKP polynucleotide kinase 3`-phosphatase
Polβ polymerase beta
POLδ polymerase delta
POMS the profile of mood states
PTSD posttraumatic stress disorder
PVN paraventricular nucleus
qPCR real time quantitative PCR
Rap1 ras-related protein 1
Ras rat sarcoma
RB retinoblastom protein
RIPA radioimmunoprecipitation assay
RM repeated measures
RNS reactive nitrogen species
ROS reactive oxygen species
rpm rounds per minute
RQ RNA quality assay
RT room temperature
Appendix
174
s second
SAHF senescence-associated heterochromatin foci
SAM sympathetic-adrenal-medullary axis
SASP senescence-associated secretory phenotype
SA-β-
galactosidase
senescence-associated beta-galactosidase
SDS sodium dodecyl sulfate
SDSA synthesis-dependent strand annealing
SDS-PAGE sodium dodecyl sulfate-polyacrylamide gel electrophoresis
SEM standard error of the mean
SIPS stress-induced premature senescence
SNS sympathetic nervous system
Src proto-Oncogene Tyrosine-Protein Kinase Src
TBHP tert-butylhydroperoxid
TNF tumor necrosis factor
UV ultraviolet
UV-light ultraviolet light
w/o without
α-AR alpha-adrenergic receptor
β2-AR beta2-adrenergic receptor
β-AR beta-adrenergic receptor
References
175
13 References
1. Goldstein, D.S. and I.J. Kopin, Evolution of concepts of stress. Stress, 2007. 10(2): p. 109-
120.
2. Chrousos GP, G.P., The concepts of stress and stress system disorders: Overview of physical
and behavioral homeostasis. JAMA, 1992. 267(9): p. 12.
3. Dayas, C.V., et al., Stressor categorization: acute physical and psychological stressors elicit
distinctive recruitment patterns in the amygdala and in medullary noradrenergic cell groups.
European Journal of Neuroscience, 2001. 14(7): p. 1143-1152.
4. Schneiderman, N., G. Ironson, and S.D. Siegel, STRESS AND HEALTH: Psychological,
Behavioral, and Biological Determinants. Annual review of clinical psychology, 2005. 1: p.
607-628.
5. Cunningham, E.T., M.C. Bohn, and P.E. Sawchenko, Organization of adrenergic inputs to the
paraventricular and supraoptic nuclei of the hypothalamus in the rat. The Journal of
Comparative Neurology, 1990. 292(4): p. 651-667.
6. Goldstein, D.S., Stress-induced activation of the sympathetic nervous system. Baillière's
Clinical Endocrinology and Metabolism, 1987. 1(2): p. 253-278.
7. Wehrwein, E.A., H.S. Orer, and S.M. Barman, Overview of the Anatomy, Physiology, and
Pharmacology of the Autonomic Nervous System, in Comprehensive Physiology. 2011, John
Wiley & Sons, Inc.
8. Ulrich-Lai, Y.M. and W.C. Engeland, Chapter 4.2 - Sympatho-adrenal activity and
hypothalamic–pituitary–adrenal axis regulation, in Techniques in the Behavioral and Neural
Sciences, N.H.K. T. Steckler and J.M.H.M. Reul, Editors. 2005, Elsevier. p. 419-435.
9. Plotsky, P.M., J.E.T. Cunningham, and E.P. Widmaier, Catecholaminergic Modulation of
Corticotropin-Releasing Factor and Adrenocorticotropin Secretion. Endocrine Reviews,
1989. 10(4): p. 437-458.
10. Wortsman, J., S. Frank, and P.E. Cryer, Adrenomedullary response to maximal stress in
humans. The American Journal of Medicine, 1984. 77(5): p. 779-784.
11. Jansen, A.S.P., et al., Central Command Neurons of the Sympathetic Nervous System: Basis of
the Fight-or-Flight Response. Science, 1995. 270(5236): p. 644-646.
12. Cannon, W.B., Bodily changes in pain, hunger, fear, and rage; an account of recent
researches into the function of emotional excitement. New York and London, D. Appleton and
Co., 1915.
13. Dempsher, D.P., D.S. Gann, and R.D. Phair, A mechanistic model of ACTH-stimulated
cortisol secretion. American Journal of Physiology - Regulatory, Integrative and Comparative
Physiology, 1984. 246(4): p. R587-R596.
14. Munck, A., P.M. Guyre, and N.J. Holbrook, Physiological Functions of Glucocorticoids in
Stress and Their Relation to Pharmacological Actions*. Endocrine Reviews, 1984. 5(1): p.
25-44.
15. Sapolsky, R.M., L.M. Romero, and A.U. Munck, How Do Glucocorticoids Influence Stress
Responses? Integrating Permissive, Suppressive, Stimulatory, and Preparative Actions*.
Endocrine Reviews, 2000. 21(1): p. 55-89.
16. Glaser, R. and J.K. Kiecolt-Glaser, Stress-induced immune dysfunction: implications for
health. Nat Rev Immunol, 2005. 5(3): p. 243-251.
17. Dantzer, R., Cytokine-induced sickness behaviour: a neuroimmune response to activation of
innate immunity. European Journal of Pharmacology, 2004. 500(1–3): p. 399-411.
18. J.E., W.D.A.B., Production of Peptide Hormones and Neurotransmitters by the Immune
System. Chem Immunol., 1997. 69: p. 30.
19. Steinman, L., Elaborate interactions between the immune and nervous systems. Nat Immunol,
2004. 5(6): p. 575-581.
20. Felten, D.L. and S.Y. Felten, Sympathetic noradrenergic innervation of immune organs.
Brain, Behavior, and Immunity, 1988. 2(4): p. 293-300.
References
176
21. Felten, D.L., et al., Noradrenergic Sympathetic Neural Interactions with the Immune System:
Structure and Function. Immunological Reviews, 1987. 100(1): p. 225-260.
22. Hanahan, D. and Robert A. Weinberg, Hallmarks of Cancer: The Next Generation. Cell.
144(5): p. 646-674.
23. Moreno-Smith, M., S.K. Lutgendorf, and A.K. Sood, Impact of stress on cancer metastasis.
Future oncology (London, England), 2010. 6(12): p. 1863-1881.
24. Michael J. Forlenza, A.B., Psychosocial influences on cancer progression: alternative cellular
and molecular mechanisms. Current Opinion in Psychiatry, 2000. 13: p. 6.
25. Reiche, E.M.V., S.O.V. Nunes, and H.K. Morimoto, Stress, depression, the immune system,
and cancer. The Lancet Oncology, 2004. 5(10): p. 617-625.
26. Spiegel, D. and J. Giese-Davis, Depression and cancer: mechanisms and disease progression.
Biological Psychiatry, 2003. 54(3): p. 269-282.
27. Palesh, O., et al., Stress History and Breast Cancer Recurrence. Journal of psychosomatic
research, 2007. 63(3): p. 233-239.
28. Chida, Y., et al., Do stress-related psychosocial factors contribute to cancer incidence and
survival? Nat Clin Prac Oncol, 2008. 5(8): p. 466-475.
29. Fidler, I.J., The pathogenesis of cancer metastasis: the 'seed and soil' hypothesis revisited. Nat
Rev Cancer, 2003. 3(6): p. 453-458.
30. Sklar, L. and H. Anisman, Stress and coping factors influence tumor growth. Science, 1979.
205(4405): p. 513-515.
31. Visintainer, M., Volpicelli, and M. Seligman, Tumor rejection in rats after inescapable or
escapable shock. Science, 1982. 216(4544): p. 437-439.
32. Wu, W., et al., Social isolation stress enhanced liver metastasis of murine colon 26-L5
carcinoma cells by suppressing immune responses in mice. Life Sciences, 2000. 66(19): p.
1827-1838.
33. Wu, W., et al., Social Isolation Stress Impairs the Resistance of Mice to Experimental Liver
Metastasis of Murine Colon 26-L5 Carcinoma Cells. Biological and Pharmaceutical Bulletin,
2001. 24(7): p. 772-776.
34. Levav, I., et al., Cancer incidence and survival following bereavement. American Journal of
Public Health, 2000. 90(10): p. 1601-1607.
35. Lutgendorf, S.K., A.K. Sood, and M.H. Antoni, Host Factors and Cancer Progression:
Biobehavioral Signaling Pathways and Interventions. Journal of Clinical Oncology, 2010.
28(26): p. 4094-4099.
36. Lutgendorf, S.K., et al., Vascular endothelial growth factor and social support in patients with
ovarian carcinoma. Cancer, 2002. 95(4): p. 808-815.
37. Lutgendorf, S.K., et al., Biobehavioral Influences on Matrix Metalloproteinase Expression in
Ovarian Carcinoma. Clinical cancer research : an official journal of the American Association
for Cancer Research, 2008. 14(21): p. 6839-6846.
38. Lutgendorf, S.K., et al., Stress-Related Mediators Stimulate Vascular Endothelial Growth
Factor Secretion by Two Ovarian Cancer Cell Lines. Clinical Cancer Research, 2003. 9(12):
p. 4514-4521.
39. Costanzo, E.S., et al., Psychosocial factors and interleukin-6 among women with advanced
ovarian cancer. Cancer, 2005. 104(2): p. 305-313.
40. Yang, E.V., et al., Stress-related modulation of matrix metalloproteinase expression. Journal
of Neuroimmunology, 2002. 133(1–2): p. 144-150.
41. Yang, E.V., et al., Norepinephrine Up-regulates the Expression of Vascular Endothelial
Growth Factor, Matrix Metalloproteinase (MMP)-2, and MMP-9 in Nasopharyngeal
Carcinoma Tumor Cells. Cancer Research, 2006. 66(21): p. 10357-10364.
42. Fischman, H.K. and D.D. Kelly, Sister Chromatid Exchanges Induced by Behavioral Stressa.
Annals of the New York Academy of Sciences, 1987. 496(1): p. 426-435.
43. Fischman, H.K., R.W. Pero, and D.D. Kelly, Psychogenic Stress Induces Chromosomal and
Dna Damage. International Journal of Neuroscience, 1996. 84(1-4): p. 219-227.
44. Adachi, S., K. Kawamura, and K. Takemoto, Oxidative Damage of Nuclear DNA in Liver of
Rats Exposed to Psychological Stress. Cancer Research, 1993. 53(18): p. 4153-4155.
45. Irie, M., et al., Classical conditioning of oxidative DNA damage in rats. Neuroscience Letters,
2000. 288(1): p. 13-16.
References
177
46. Irie, M., et al., Psychological Mediation of a Type of Oxidative DNA Damage, 8-
Hydroxydeoxyguanosine, in Peripheral Blood Leukocytes of Non-Smoking and Non-Drinking
Workers. Psychotherapy and Psychosomatics, 2002. 71(2): p. 90-96.
47. Glaser R, T.B., Tarr KL, Kiecolt-Glaser JK, D'Ambrosio SM., Effects of stress on
methyltransferase synthesis: an important DNA repair enzyme. Health Psychol., 1985. 4(5): p.
9.
48. Kiecolt-Glaser, J.K., et al., Distress and DNA repair in human lymphocytes. Journal of
Behavioral Medicine, 1985. 8(4): p. 311-320.
49. Cohen, L., et al., DNA Repair Capacity in Healthy Medical Students During and After Exam
Stress. Journal of Behavioral Medicine, 2000. 23(6): p. 531-544.
50. Forlenza, M.J., J.J. Latimer, and A. Baum, THE EFFECTS OF STRESS ON DNA REPAIR
CAPACITY. Psychology & health, 2000. 15(6): p. 881-891.
51. Diagnostic and statistical manual of mental disorders (5th ed.). American Psychiatric
Association, 2013.
52. Organization., W.H., The ICD-10 classification of mental and behavioural disorders: clinical
descriptions and diagnostic guidelines. WHO, 1992.
53. Bisson, J.I., et al., Post-traumatic stress disorder. The BMJ, 2015. 351: p. h6161.
54. Alonso, J., M.C. Angermeyer, and J.P. Lépine, The European Study of the Epidemiology of
Mental Disorders (ESEMeD) project: an epidemiological basis for informing mental health
policies in Europe. Acta Psychiatrica Scandinavica, 2004. 109.
55. ferry, f., et al., Economic impact of post traumatic stress in Northern Ireland. Northern Ireland
Centre for Trauma and Transformation and University of Ulster Psychology Research
Institute, 2010.
56. Jonathan E. Sherin, C.B.N., Post-traumatic stress disorder: the neurobiological impact of
psychological trauma. Dialogues Clin Neurosci, 2011. 13(3): p. 16.
57. Kosten, T.R., et al., Sustained urinary norepinephrine and epinephrine elevation in post-
traumatic stress disorder. Psychoneuroendocrinology, 1987. 12(1): p. 13-20.
58. MASON, J.W., et al., Elevation of Urinary Norepinephrine/Cortisol Ratio in Posttraumatic
Stress Disorder. The Journal of Nervous and Mental Disease, 1988. 176(8): p. 498-502.
59. Yehuda R, S.S., Giller EL, Ma X, Mason JW., Urinary catecholamine excretion and severity
of PTSD symptoms in Vietnam combat veterans. J Nerv Ment Dis. , 1992. 180(5): p. 4.
60. Spivak, B., et al., Low platelet-poor plasma concentrations of serotonin in patients with
combat-related posttraumatic stress disorder. Biological Psychiatry, 1999. 45(7): p. 840-845.
61. BLANCHARD, E.B., et al., Changes in Plasma Norepinephrine to Combat-Related Stimuli
among Vietnam Veterans with Posttraumatic Stress Disorder. The Journal of Nervous and
Mental Disease, 1991. 179(6): p. 371-373.
62. YEHUDA, R., et al., Low Urinary Cortisol Excretion in Patients with Posttraumatic Stress
Disorder. The Journal of Nervous and Mental Disease, 1990. 178(6): p. 366-369.
63. Boscarino, J.A., Posttraumatic stress disorder, exposure to combat, and lower plasma cortisol
among Vietnam veterans: Findings and clinical implications. Journal of Consulting and
Clinical Psychology, 1996. 64(1): p. 10.
64. Stein, M.B., et al., Enhanced Dexamethasone Suppression of Plasma Cortisol in Adult Women
Traumatized by Childhood Sexual Abuse. Biological Psychiatry, 1997. 42(8): p. 680-686.
65. Yehuda, R., A.C. McFarlane, and A.Y. Shalev, Predicting the development of posttraumatic
stress disorder from the acute response to a traumatic event. Biol Psychiatry, 1998. 44(12): p.
1305-13.
66. Pitman, R.K., et al., Pilot study of secondary prevention of posttraumatic stress disorder with
propranolol. Biol Psychiatry, 2002. 51(2): p. 189-92.
67. Boscarino, J.A., Posttraumatic stress disorder and physical illness: results from clinical and
epidemiologic studies. Ann N Y Acad Sci, 2004. 1032: p. 141-53.
68. Hassan, S., et al., Behavioral stress accelerates prostate cancer development in mice. The
Journal of Clinical Investigation, 2013. 123(2): p. 874-886.
69. Cavalcanti-Ribeiro, P., et al., Post-traumatic stress disorder as a comorbidity: impact on
disease outcomes. Expert Review of Neurotherapeutics, 2012. 12(8): p. 1023-1037.
References
178
70. Burg, M.M. and R. Soufer, Post-traumatic Stress Disorder and Cardiovascular Disease.
Current Cardiology Reports, 2016. 18(10): p. 94.
71. O’Donovan, A., et al., ELEVATED RISK FOR AUTOIMMUNE DISORDERS IN IRAQ AND
AFGHANISTAN VETERANS WITH POSTTRAUMATIC STRESS DISORDER. Biological
psychiatry, 2015. 77(4): p. 365-374.
72. Lukaschek, K., et al., Relationship between posttraumatic stress disorder and Type 2 Diabetes
in a population-based cross-sectional study with 2970 participants. Journal of Psychosomatic
Research, 2013. 74(4): p. 340-345.
73. Brown, D.W., et al., Adverse childhood experiences are associated with the risk of lung
cancer: a prospective cohort study. BMC Public Health, 2010. 10: p. 20-20.
74. Glaesmer, H., et al., The Association of Traumatic Experiences and Posttraumatic Stress
Disorder With Physical Morbidity in Old Age: A German Population-Based Study.
Psychosomatic Medicine, 2011. 73(5): p. 401-406.
75. Fagundes, C.P., et al., B=Basal Cell Carcinoma: Stressful Life Events and the Tumor
Environment. Archives of general psychiatry, 2012. 69(6): p. 618-626.
76. Neigh, G.N. and F.F. Ali, Co-morbidity of PTSD and immune system dysfunction:
opportunities for treatment. Current Opinion in Pharmacology, 2016. 29: p. 104-110.
77. Hoge, E.A., et al., Broad spectrum of cytokine abnormalities in panic disorder and
posttraumatic stress disorder. Depression and Anxiety, 2009. 26(5): p. 447-455.
78. Morath, J., et al., The effect of trauma-focused therapy on the altered T cell distribution in
individuals with PTSD: Evidence from a randomized controlled trial. Journal of Psychiatric
Research, 2014. 54: p. 1-10.
79. Jergović, M., et al., Patients with posttraumatic stress disorder exhibit an altered phenotype of
regulatory T cells. Allergy, Asthma, and Clinical Immunology : Official Journal of the
Canadian Society of Allergy and Clinical Immunology, 2014. 10(1): p. 43-43.
80. Sommershof, A., et al., Substantial reduction of naïve and regulatory T cells following
traumatic stress. Brain, Behavior, and Immunity, 2009. 23(8): p. 1117-1124.
81. Aiello, A.E., et al., PTSD is associated with an increase in aged T cell phenotypes in adults
living in Detroit. Psychoneuroendocrinology, 2016. 67: p. 133-141.
82. Moreno-Villanueva, M., et al., N-glycosylation profiling of plasma provides evidence for
accelerated physiological aging in post-traumatic stress disorder. Transl Psychiatry, 2013. 3:
p. e320.
83. Morath, J., et al., Effects of psychotherapy on DNA strand break accumulation originating
from traumatic stress. Psychother Psychosom, 2014. 83(5): p. 289-97.
84. Bjarnadóttir, T.K., et al., Comprehensive repertoire and phylogenetic analysis of the G
protein-coupled receptors in human and mouse. Genomics, 2006. 88(3): p. 263-273.
85. Fredriksson, R., et al., The G-Protein-Coupled Receptors in the Human Genome Form Five
Main Families. Phylogenetic Analysis, Paralogon Groups, and Fingerprints. Molecular
Pharmacology, 2003. 63(6): p. 1256-1272.
86. Strosberg, A.D., Structure, function, and regulation of adrenergic receptors. Protein Science :
A Publication of the Protein Society, 1993. 2(8): p. 1198-1209.
87. JOHNSON, M., The β -Adrenoceptor. American Journal of Respiratory and Critical Care
Medicine, 1998. 158(supplement_2): p. S146-S153.
88. Jahns, R., V. Boivin, and M.J. Lohse, β1-Adrenergic Receptor Function, Autoimmunity, and
Pathogenesis of Dilated Cardiomyopathy. Trends in Cardiovascular Medicine, 2006. 16(1): p.
20-24.
89. Ferrer-Lorente, R., et al., Combined effects of oleoyl-estrone and a β3-adrenergic agonist
(CL316,243) on lipid stores of diet-induced overweight male Wistar rats. Life Sciences, 2005.
77(16): p. 2051-2058.
90. Lefkowitz, R.J., Eine kurze Geschichte der G-Protein-gekoppelten Rezeptoren (Nobel-
Aufsatz). Angewandte Chemie, 2013. 125(25): p. 6494-6507.
91. Sprang, S.R., Z. Chen, and X. Du, Structural Basis of Effector Regulation and Signal
Termination in Heterotrimeric Gα Proteins. Advances in Protein Chemistry, 2007. 74: p. 1-
65.
92. Sprang, S.R., G Protein Mechanisms: Insights from Structural Analysis. Annual Review of
Biochemistry, 1997. 66(1): p. 639-678.
References
179
93. Swaminath, G., et al., Sequential Binding of Agonists to the β2 Adrenoceptor: KINETIC
EVIDENCE FOR INTERMEDIATE CONFORMATIONAL STATES. Journal of Biological
Chemistry, 2004. 279(1): p. 686-691.
94. Deupi, X. and B.K. Kobilka, Energy landscapes as a tool to integrate GPCR structure,
dynamics and function. Physiology (Bethesda, Md.), 2010. 25(5): p. 293-303.
95. Swaminath, G., et al., Probing the β2 Adrenoceptor Binding Site with Catechol Reveals
Differences in Binding and Activation by Agonists and Partial Agonists. Journal of Biological
Chemistry, 2005. 280(23): p. 22165-22171.
96. Nygaard, R., et al., The Dynamic Process of β2-Adrenergic Receptor Activation. Cell, 2013.
152(3): p. 532-542.
97. Rosenbaum, D.M., et al., Structure and Function of an Irreversible Agonist-β(2) Adrenoceptor
complex. Nature, 2011. 469(7329): p. 236-240.
98. Yao, X.J., et al., The effect of ligand efficacy on the formation and stability of a GPCR-G
protein complex. Proceedings of the National Academy of Sciences, 2009. 106(23): p. 9501-
9506.
99. Cerione, R.A., et al., Reconstitution of a hormone-sensitive adenylate cyclase system. The pure
beta-adrenergic receptor and guanine nucleotide regulatory protein confer hormone
responsiveness on the resolved catalytic unit. Journal of Biological Chemistry, 1984. 259(16):
p. 9979-9982.
100. Lorton, D. and D. Bellinger, Molecular Mechanisms Underlying β-Adrenergic Receptor-
Mediated Cross-Talk between Sympathetic Neurons and Immune Cells. International Journal
of Molecular Sciences, 2015. 16(3): p. 5635.
101. Pierce, K.L., R.T. Premont, and R.J. Lefkowitz, Seven-transmembrane receptors. Nat Rev
Mol Cell Biol, 2002. 3(9): p. 639-650.
102. Shukla, A.K., K. Xiao, and R.J. Lefkowitz, Emerging paradigms of β-arrestin-dependent
seven transmembrane receptor signaling. Trends in Biochemical Sciences, 2011. 36(9): p.
457-469.
103. Dessauer, C.W., Adenylyl Cyclase–A-kinase Anchoring Protein Complexes: The Next
Dimension in cAMP Signaling. Molecular Pharmacology, 2009. 76(5): p. 935-941.
104. Vandamme, J., D. Castermans, and J.M. Thevelein, Molecular mechanisms of feedback
inhibition of protein kinase A on intracellular cAMP accumulation. Cellular Signalling, 2012.
24(8): p. 1610-1618.
105. Colledge, M. and J.D. Scott, AKAPs: from structure to function. Trends in Cell Biology. 9(6):
p. 216-221.
106. Zhang, X., et al., Genome-wide analysis of cAMP-response element binding protein
occupancy, phosphorylation, and target gene activation in human tissues. Proceedings of the
National Academy of Sciences of the United States of America, 2005. 102(12): p. 4459-4464.
107. de Rooij, J., et al., Epac is a Rap1 guanine-nucleotide-exchange factor directly activated by
cyclic AMP. Nature, 1998. 396(6710): p. 474-477.
108. Shirshev, S.V., Role of Epac proteins in mechanisms of cAMP-dependent immunoregulation.
Biochemistry (Moscow), 2011. 76(9): p. 981.
109. Yin, F., et al., Noncanonical cAMP pathway and p38 MAPK mediate
β<sub>2</sub>-adrenergic receptor-induced IL-6 production
in neonatal mouse cardiac fibroblasts. Journal of Molecular and Cellular Cardiology.
40(3): p. 384-393.
110. Violin, J.D., et al., β2-Adrenergic Receptor Signaling and Desensitization Elucidated by
Quantitative Modeling of Real Time cAMP Dynamics. Journal of Biological Chemistry, 2008.
283(5): p. 2949-2961.
111. Essayan, D.M., Cyclic nucleotide phosphodiesterases. Journal of Allergy and Clinical
Immunology. 108(5): p. 671-680.
112. Francis, S.H., M.A. Blount, and J.D. Corbin, Mammalian Cyclic Nucleotide
Phosphodiesterases: Molecular Mechanisms and Physiological Functions. Physiological
Reviews, 2011. 91(2): p. 651-690.
113. Perry, S.J., et al., Targeting of Cyclic AMP Degradation to β2-Adrenergic Receptors by β-
Arrestins. Science, 2002. 298(5594): p. 834-836.
References
180
114. Baillie, G.S., et al., β-Arrestin-mediated PDE4 cAMP phosphodiesterase recruitment
regulates β-adrenoceptor switching from G(s) to G(i). Proceedings of the National Academy
of Sciences of the United States of America, 2003. 100(3): p. 940-945.
115. Chuang, T.T., H. LeVine, and A. De Blasi, Phosphorylation and Activation of β-Adrenergic
Receptor Kinase by Protein Kinase C. Journal of Biological Chemistry, 1995. 270(31): p.
18660-18665.
116. Bouvier, M., et al., Regulation of adrenergic receptor function by phosphorylation. II. Effects
of agonist occupancy on phosphorylation of alpha 1- and beta 2-adrenergic receptors by
protein kinase C and the cyclic AMP-dependent protein kinase. Journal of Biological
Chemistry, 1987. 262(7): p. 3106-3113.
117. Daaka, Y., L.M. Luttrell, and R.J. Lefkowitz, Switching of the coupling of the [beta]2-
adrenergic receptor to different G proteins by protein kinase A. Nature, 1997. 390(6655): p.
88-91.
118. Zamah, A.M., et al., Protein Kinase A-mediated Phosphorylation of the β2-Adrenergic
Receptor Regulates Its Coupling to Gs and Gi : DEMONSTRATION IN A RECONSTITUTED
SYSTEM. Journal of Biological Chemistry, 2002. 277(34): p. 31249-31256.
119. Lefkowitz, R.J., K.L. Pierce, and L.M. Luttrell, Dancing with Different Partners: Protein
Kinase A Phosphorylation of Seven Membrane-Spanning Receptors Regulates Their G
Protein-Coupling Specificity. Molecular Pharmacology, 2002. 62(5): p. 971-974.
120. Moffett, S., et al., The palmitoylation state of the β2-adrenergic receptor regulates the
synergistic action of cyclic AMP-dependent protein kinase and β-adrenergic receptor kinase
involved in its phosphorylation and desensitization. Journal of Neurochemistry, 2001. 76(1):
p. 269-279.
121. Nobles, K.N., et al., Distinct Phosphorylation Sites on the β2-Adrenergic Receptor Establish a
Barcode That Encodes Differential Functions of β-Arrestin. Vol. 4. 2011. ra51-ra51.
122. Violin, J.D., X.-R. Ren, and R.J. Lefkowitz, G-protein-coupled Receptor Kinase Specificity
for β-Arrestin Recruitment to the β2-Adrenergic Receptor Revealed by Fluorescence
Resonance Energy Transfer. Journal of Biological Chemistry, 2006. 281(29): p. 20577-20588.
123. Krasel, C., et al., β-Arrestin Binding to the β2-Adrenergic Receptor Requires Both Receptor
Phosphorylation and Receptor Activation. Journal of Biological Chemistry, 2005. 280(10): p.
9528-9535.
124. Barki-Harrington, L. and H.A. Rockman, β-Arrestins: Multifunctional Cellular Mediators.
Vol. 23. 2008. 17-22.
125. Attramadal, H., et al., Beta-arrestin2, a novel member of the arrestin/beta-arrestin gene
family. Journal of Biological Chemistry, 1992. 267(25): p. 17882-17890.
126. Lefkowitz, R., Introduction to Special Section on β-Arrestins. Annual Review of Physiology,
2007. 69(1): p. null.
127. Lohse, M., et al., beta-Arrestin: a protein that regulates beta-adrenergic receptor function.
Science, 1990. 248(4962): p. 1547-1550.
128. Krupnick, J.G. and J.L. Benovic, THE ROLE OF RECEPTOR KINASES AND ARRESTINS IN
G PROTEIN–COUPLED RECEPTOR REGULATION. Annual Review of Pharmacology and
Toxicology, 1998. 38(1): p. 289-319.
129. Goodman, O.B., et al., [beta]-Arrestin acts as a clathrin adaptor in endocytosis of the
[beta]2-adrenergic receptor. Nature, 1996. 383(6599): p. 447-450.
130. Oakley, R.H., et al., Association of β-Arrestin with G Protein-coupled Receptors during
Clathrin-mediated Endocytosis Dictates the Profile of Receptor Resensitization. Journal of
Biological Chemistry, 1999. 274(45): p. 32248-32257.
131. Zhang, J., et al., Cellular Trafficking of G Protein-coupled Receptor/β-Arrestin Endocytic
Complexes. Journal of Biological Chemistry, 1999. 274(16): p. 10999-11006.
132. von Zastrow, M. and B.K. Kobilka, Ligand-regulated internalization and recycling of human
beta 2-adrenergic receptors between the plasma membrane and endosomes containing
transferrin receptors. Journal of Biological Chemistry, 1992. 267(5): p. 3530-3538.
133. Shenoy, S.K., et al., Regulation of Receptor Fate by Ubiquitination of Activated β2-
Adrenergic Receptor and β-Arrestin. Science, 2001. 294(5545): p. 1307-1313.
134. Zhang, J., et al., A Central Role for β-Arrestins and Clathrin-coated Vesicle-mediated
Endocytosis in β2-Adrenergic Receptor Resensitization: DIFFERENTIAL REGULATION OF
References
181
RECEPTOR RESENSITIZATION IN TWO DISTINCT CELL TYPES. Journal of Biological
Chemistry, 1997. 272(43): p. 27005-27014.
135. Hausdorff, W.P., et al., Phosphorylation sites on two domains of the beta 2-adrenergic
receptor are involved in distinct pathways of receptor desensitization. Journal of Biological
Chemistry, 1989. 264(21): p. 12657-12665.
136. Luttrell, L.M., et al., β-Arrestin-Dependent Formation of β2 Adrenergic Receptor-Src Protein
Kinase Complexes. Science, 1999. 283(5402): p. 655-661.
137. Miller, W.E., et al., β-Arrestin1 Interacts with the Catalytic Domain of the Tyrosine Kinase c-
SRC: ROLE OF β-ARRESTIN1-DEPENDENT TARGETING OF c-SRC IN RECEPTOR
ENDOCYTOSIS. Journal of Biological Chemistry, 2000. 275(15): p. 11312-11319.
138. Shenoy, S.K., et al., β-Arrestin-dependent, G Protein-independent ERK1/2 Activation by the
β2 Adrenergic Receptor. Journal of Biological Chemistry, 2006. 281(2): p. 1261-1273.
139. Zheng, M., et al., β2-Adrenergic Receptor-induced p38 MAPK Activation Is Mediated by
Protein Kinase A Rather than by Gi or Gβγ in Adult Mouse Cardiomyocytes. Journal of
Biological Chemistry, 2000. 275(51): p. 40635-40640.
140. Gong, K., et al., A Novel Protein Kinase A-independent, β-Arrestin-1-dependent Signaling
Pathway for p38 Mitogen-activated Protein Kinase Activation by β2-Adrenergic Receptors.
Journal of Biological Chemistry, 2008. 283(43): p. 29028-29036.
141. Zhu, W.-Z., et al., Dual modulation of cell survival and cell death by β2-adrenergic signaling
in adult mouse cardiac myocytes. Proceedings of the National Academy of Sciences, 2001.
98(4): p. 1607-1612.
142. Jo, S.-H., et al., Phosphatidylinositol 3-Kinase Functionally Compartmentalizes the
Concurrent G<sub>s</sub> Signaling During β<sub>2</sub>-Adrenergic Stimulation.
Circulation Research, 2002. 91(1): p. 46-53.
143. Chesley, A., et al., The β<sub>2</sub>-Adrenergic Receptor Delivers an Antiapoptotic
Signal to Cardiac Myocytes Through G<sub>i</sub>-Dependent Coupling to
Phosphatidylinositol 3′-Kinase. Circulation Research, 2000. 87(12): p. 1172-1179.
144. Chandrasekar, B., et al., β-Adrenergic stimulation induces interleukin-18 expression via β2-
AR, PI3K, Akt, IKK, and NF-κB. Biochemical and Biophysical Research Communications,
2004. 319(2): p. 304-311.
145. Drake, M.T., et al., β-Arrestin-biased Agonism at the β2-Adrenergic Receptor. Journal of
Biological Chemistry, 2008. 283(9): p. 5669-5676.
146. Baker, J.G., I.P. Hall, and S.J. Hill, Agonist and Inverse Agonist Actions of β-Blockers at the
Human β<sub>2</sub>-Adrenoceptor Provide Evidence for Agonist-Directed Signaling.
Molecular Pharmacology, 2003. 64(6): p. 1357-1369.
147. Azzi, M., et al., β-Arrestin-mediated activation of MAPK by inverse agonists reveals distinct
active conformations for G protein-coupled receptors. Proceedings of the National Academy
of Sciences, 2003. 100(20): p. 11406-11411.
148. Rajagopal, S., et al., Quantifying Ligand Bias at Seven-Transmembrane Receptors. Molecular
Pharmacology, 2011. 80(3): p. 367-377.
149. Galandrin, S. and M. Bouvier, Distinct Signaling Profiles of β<sub>1</sub> and
β<sub>2</sub> Adrenergic Receptor Ligands toward Adenylyl Cyclase and Mitogen-
Activated Protein Kinase Reveals the Pluridimensionality of Efficacy. Molecular
Pharmacology, 2006. 70(5): p. 1575-1584.
150. Marino, F. and M. Cosentino, Adrenergic modulation of immune cells: an update. Amino
Acids, 2013. 45(1): p. 55-71.
151. Goldstein, D.S., G. Eisenhofer, and I.J. Kopin, Sources and Significance of Plasma Levels of
Catechols and Their Metabolites in Humans. Journal of Pharmacology and Experimental
Therapeutics, 2003. 305(3): p. 800-811.
152. William Tank, A. and D. Lee Wong, Peripheral and Central Effects of Circulating
Catecholamines, in Comprehensive Physiology. 2011, John Wiley & Sons, Inc.
153. Bühler, H.U., et al., Plasma adrenaline, noradrenaline and dopamine in man and different
animal species. The Journal of Physiology, 1978. 276(1): p. 311-320.
154. Johnson, D.G., et al., Plasma norepinephrine responses of man in cold water. Journal of
Applied Physiology, 1977. 43(2): p. 216-220.
References
182
155. Hillarp, N.-A. and B. HÖKfelt, Evidence of Adrenaline and Noradrennline in Separate
Adrenal Medullary Cells1. Acta Physiologica Scandinavica, 1954. 30(1): p. 55-68.
156. Coupland, R.E., A.S. Pyper, and D. Hopwood, A Method for Differentiating between
Noradrenaline- and Adrenaline-storing Cells in the Light and Electron Microscope. Nature,
1964. 201(4925): p. 1240-1242.
157. Blandini, F., et al., Combined response of plasma and platelet catecholamines to different
types of short-term stress. Life Sciences, 1995. 56(13): p. 1113-1120.
158. Elman, I., et al., Inverse relationship between plasma epinephrine and testosterone levels
during acute glucoprivation in healthy men. Life Sciences, 2001. 68(16): p. 1889-1898.
159. Brenner IK, Z.J., Shek PN, Shephard RJ., The impact of heat exposure and repeated exercise
on circulating stress hormones. Eur J Appl Physiol Occup Physiol. . 76(5): p. 9.
160. Kopin, I.J., Catecholamine metabolism: basic aspects and clinical significance.
Pharmacological Reviews, 1985. 37(4): p. 333-364.
161. Axelrod, J. and R. Tomchick, Enzymatic O-Methylation of Epinephrine and Other Catechols.
Journal of Biological Chemistry, 1958. 233(3): p. 702-705.
162. Nissinen, E., et al., Catechol-O-methyltransferase activity in human and rat small intestine.
Life Sciences, 1988. 42(25): p. 2609-2614.
163. Greenawalt, J.W. and C. Schnaitman, AN APPRAISAL OF THE USE OF MONOAMINE
OXIDASE AS AN ENZYME MARKER FOR THE OUTER MEMBRANE OF RAT LIVER
MITOCHONDRIA. The Journal of Cell Biology, 1970. 46(1): p. 173-179.
164. Schnaitman, C., V.G. Erwin, and J.W. Greenawalt, THE SUBMITOCHONDRIAL
LOCALIZATION OF MONOAMINE OXIDASE. An Enzymatic Marker for the Outer
Membrane of Rat Liver Mitochondria, 1967. 32(3): p. 719-735.
165. Shih, J.C., K. Chen, and M.J. Ridd, MONOAMINE OXIDASE: From Genes to Behavior.
Annual review of neuroscience, 1999. 22: p. 197-217.
166. Kalgutkar, A.S., et al., Interactions of Nitrogen-Containing Xenobiotics with Monoamine
Oxidase (MAO) Isozymes A and B: SAR Studies on MAO Substrates and Inhibitors. Chemical
Research in Toxicology, 2001. 14(9): p. 1139-1162.
167. Simonson, S.G., et al., Hydrogen Peroxide Production by Monoamine Oxidase during
Ischemia-Reperfusion in the Rat Brain. Journal of Cerebral Blood Flow & Metabolism, 1993.
13(1): p. 125-134.
168. Pizzinat, N., et al., Reactive oxygen species production by monoamine oxidases in intact cells.
Naunyn-Schmiedeberg's Archives of Pharmacology, 1999. 359(5): p. 428-431.
169. Flierl MA, R.D., Huber-Lang M, Sarma JV, Ward PA., Catecholamines-crafty weapons in the
inflammatory arsenal of immune/inflammatory cells or opening pandora's box? Molecular
Medicine, 2008. 14: p. 10.
170. Elenkov, I.J., et al., The Sympathetic Nerve—An Integrative Interface between Two
Supersystems: The Brain and the Immune System. Pharmacological Reviews, 2000. 52(4): p.
595-638.
171. Straub, R.H., Complexity of the bi-directional neuroimmune junction in the spleen. Trends in
Pharmacological Sciences, 2004. 25(12): p. 640-646.
172. Torres, K.C.L., et al., Norepinephrine, dopamine and dexamethasone modulate discrete
leukocyte subpopulations and cytokine profiles from human PBMC. Journal of
Neuroimmunology, 2005. 166(1–2): p. 144-157.
173. Williams, L.T., R. Snyderman, and R.J. Lefkowitz, Identification of beta-adrenergic receptors
in human lymphocytes by (-) (3H) alprenolol binding. The Journal of Clinical Investigation,
1976. 57(1): p. 149-155.
174. Paietta, E. and J.D. Schwarzmeier, Differences in β-adrenergic receptor density and adenylate
cyclase activity between normal and leukaemic leukocytes. European Journal of Clinical
Investigation, 1983. 13(4): p. 339-346.
175. Bidart, J.M., et al., Catechol-O-methyltransferase activity and aminergic binding sites
distribution in human peripheral blood lymphocyte subpopulations. Clinical Immunology and
Immunopathology, 1983. 26(1): p. 1-9.
176. Khan, M.M., et al., Beta-adrenergic receptors on human suppressor, helper, and cytolytic
lymphocytes. Biochemical Pharmacology, 1986. 35(7): p. 1137-1142.
References
183
177. Ratge, D., et al., ALTERATIONS OF β-ADRENOCEPTORS ON HUMAN LEUKOCYTE
SUBSETS INDUCED BY DYNAMIC EXERCISE: EFFECT OF PREDNISONE. Clinical and
Experimental Pharmacology and Physiology, 1988. 15(1): p. 43-53.
178. Maisel, A.S., et al., Beta-adrenergic receptors in lymphocyte subsets after exercise.
Alterations in normal individuals and patients with congestive heart failure. Circulation, 1990.
82(6): p. 2003-2010.
179. Ezeamuzie, C.I., P.K. Shihab, and R. Al-Radwan, Loss of surface beta-2 adrenoceptors
accounts for the insensitivity of cultured human monocytes to beta-2 adrenoceptor agonists.
International Immunopharmacology, 2011. 11(9): p. 1189-1194.
180. Baker, A.J. and R.W. Fuller, Loss of response to beta-adrenoceptor agonists during the
maturation of human monocytes to macrophages in vitro. Journal of Leukocyte Biology,
1995. 57(3): p. 395-400.
181. Korichneva, I.L. and V.A. Tkachuk, Alterations in beta-adrenoceptor density on T-
lymphocytes upon activation with interleukin-2 and phytohaemagglutinin. Biomedical science,
1990. 1(1): p. 84-88.
182. Carlson, S.L., et al., Enhancement of β-Adrenergic-induced cAMP accumulation in activated
T-Cells. Journal of Cellular Physiology, 1994. 161(1): p. 39-48.
183. Wahle, M., et al., REGULATION OF BETA2-ADRENERGIC RECEPTORS ON CD4 AND
CD8 POSITIVE LYMPHOCYTES BY CYTOKINES IN VITRO. Cytokine, 2001. 16(6): p. 205-
209.
184. Krause, A., et al., Influence of cytokines on the density of beta 2-adrenergic receptors on
peripheral blood mononuclear cells in vitro. Cytokine, 1995. 7(3): p. 273-276.
185. Bergquist, J., et al., Discovery of endogenous catecholamines in lymphocytes and evidence for
catecholamine regulation of lymphocyte function via an autocrine loop. Proceedings of the
National Academy of Sciences, 1994. 91(26): p. 12912-12916.
186. Marino, F., et al., Endogenous catecholamine synthesis, metabolism, storage, and uptake in
human peripheral blood mononuclear cells. Experimental Hematology, 1999. 27(3): p. 489-
495.
187. Bergquist, J. and J. Silberring, Identification of catecholamines in the immune system by
electrospray ionization mass spectrometry. Rapid Communications in Mass Spectrometry,
1998. 12(11): p. 683-688.
188. Cosentino, M., et al., HPLC-ED measurement of endogenous catecholamines in human
immune cells and hematopoietic cell lines. Life Sciences, 2000. 68(3): p. 283-295.
189. Musso, N.R., et al., Catecholamine content and in vitro catecholamine synthesis in peripheral
human lymphocytes. The Journal of Clinical Endocrinology & Metabolism, 1996. 81(10): p.
3553-3557.
190. Cosentino, M., et al., Stimulation with phytohaemagglutinin induces the synthesis of
catecholamines in human peripheral blood mononuclear cells: role of protein kinase C and
contribution of intracellular calcium. Journal of Neuroimmunology, 2002. 125(1–2): p. 125-
133.
191. Reguzzoni, M., et al., Ultrastructural localization of tyrosine hydroxylase in human
peripheral blood mononuclear cells: effect of stimulation with phytohaemagglutinin. Cell and
Tissue Research, 2002. 310(3): p. 297-304.
192. R.T., F.B.A.O.Z.L.J., Binding of [3H]-Dopamine to Human Lymphocytes: Possible
Relationship to Neurotransmitter Uptake Sites. Pharmacology, 1991. 42(2): p. 6.
193. Faraj, B.A., Z.L. Olkowski, and R.T. Jackson, A cocaine-sensitive active dopamine transport
in human lymphocytes. Biochemical Pharmacology, 1995. 50(7): p. 1007-1014.
194. Amenta, F., et al., Identification of dopamine plasma membrane and vesicular transporters in
human peripheral blood lymphocytes. Journal of Neuroimmunology, 2001. 117(1–2): p. 133-
142.
195. Balsa, M.D., N. Gómez, and M. Unzeta, Characterization of monoamine oxidase activity
present in human granulocytes and lymphocytes. Biochimica et Biophysica Acta (BBA) -
General Subjects, 1989. 992(2): p. 140-144.
196. Sladek-Chelgren, S. and R.M. Weinshilboum, Catechol-O-methyltransferase biochemical
genetics: Human lymphocyte enzyme. Biochemical Genetics, 1981. 19(11): p. 1037-1053.
References
184
197. Thorpe, L.W., et al., Immunocytochemical localization of monoamine oxidases A and B in
human peripheral tissues and brain. Journal of Histochemistry & Cytochemistry, 1987. 35(1):
p. 23-32.
198. Engler, K.L., et al., Autocrine actions of macrophage-derived catecholamines on interleukin-
1β. Journal of Neuroimmunology, 2005. 160(1–2): p. 87-91.
199. Spengler, R.N., et al., Endogenous norepinephrine regulates tumor necrosis factor-alpha
production from macrophages in vitro. The Journal of Immunology, 1994. 152(6): p. 3024-
3031.
200. Patel, R.A. and R.C. Vasavada, Transdermal Delivery of Isoproterenol HC1: An Investigation
of Stability, Solubility, Partition Coefficient, and Vehicle Effects. Pharmaceutical Research,
1988. 5(2): p. 116-119.
201. Conolly, M.E., et al., Metabolism of isoprenaline in dog and man. British Journal of
Pharmacology, 1972. 46(3): p. 458-472.
202. Goldstein, D.S., et al., Plasma catecholamine and hemodynamic responses during
isoproterenol infusions in humans. Clinical Pharmacology & Therapeutics, 1986. 40(2): p.
233-238.
203. Gay, L.N. and J.W. Long, Clinical evaluation of isopropylepinephrine in management of
bronchial asthma. Journal of the American Medical Association, 1949. 139(7): p. 452-457.
204. Lowell , F.C., J.J. Curry , and I.W. Schiller A Clinical and Experimental Study of Isuprel in
Spontaneous and Induced Asthma. New England Journal of Medicine, 1949. 240(2): p. 45-51.
205. Portmann, G.A., H. Minatoya, and A.M. Lands, Absorption and Elimination Profile of
Isoproterenol II. Journal of Pharmaceutical Sciences, 1965. 54(7): p. 973-978.
206. Hadwiger, M.E., et al., Simultaneous determination of the elimination profiles of the
individual enantiomers of racemic isoproterenol using capillary electrophoresis and
microdialysis sampling. Journal of Pharmaceutical and Biomedical Analysis, 1997. 15(5): p.
621-629.
207. Kelly, J.G. and D.G. McDevitt, Plasma protein binding of propranolol and isoprenaline in
hyperthyroidism and hypothyroidism. British Journal of Clinical Pharmacology, 1978. 6(2): p.
123-127.
208. Reyes, G., et al., The Pharmacokinetics of Isoproterenol in Critically Ill Pediatric Patients.
The Journal of Clinical Pharmacology, 1993. 33(1): p. 29-34.
209. Kadar, D., H.Y. Tang, and A.W. Conn, Isoproterenol metabolism in children after
intravenous administration. Clinical Pharmacology & Therapeutics, 1974. 16(5part1): p. 789-
795.
210. Goldstein, D.S., et al., Plasma l-[3H]norepinephrine, d-[14C]norepinephrine, and d,l-
[3H]isoproterenol kinetics in essential hypertension. Journal of Clinical Investigation, 1983.
72(5): p. 1748-1758.
211. c. Diana Morgan, C.R.J.R., M. Sandler, The quantitative assessment of isoprenaline
metabolism in man. Clinica Chimica Acta, 1669. 26: p. 6.
212. Blackwell, E.W., et al., METABOLISM OF ISOPRENALINE AFTER AEROSOL AND
DIRECT INTRABRONCHIAL ADMINISTRATION IN MAN AND DOG. British Journal of
Pharmacology, 1974. 50(4): p. 587-591.
213. Blackwell, E.W., et al., The fate of isoprenaline administered by pressurized aerosols. British
Journal of Pharmacology, 1970. 39(1): p. 194P-195P.
214. George, C.F., E.W. Blackwell, and D.S. Davies, Metabolism of isoprenaline in the intestine.
Journal of Pharmacy and Pharmacology, 1974. 26(4): p. 265-267.
215. Rona, G., et al., An infarct-like myocardial lesion and other toxic manifestations produced by
isoproterenol in the rat. A.M.A. archives of pathology, 1959. 67(4): p. 443-455.
216. Behonick, G.S., et al., Toxicology update: the cardiotoxicity of the oxidative stress metabolites
of catecholamines (aminochromes). Journal of Applied Toxicology, 2001. 21(S1): p. S15-S22.
217. Keller, J.N., et al., Dopamine induces proteasome inhibition in neural PC12 cell line. Free
Radical Biology and Medicine, 2000. 29(10): p. 1037-1042.
218. Smythies, J. and L. Galzigna, The oxidative metabolism of catecholamines in the brain: a
review. Biochimica et Biophysica Acta (BBA) - General Subjects, 1998. 1380(2): p. 159-162.
219. Riobó, N.A., et al., The reaction of nitric oxide with 6-hydroxydopamine: implications for
Parkinson’s disease. Free Radical Biology and Medicine, 2002. 32(2): p. 115-121.
References
185
220. Kassim, T., et al., Catecholamine-Induced Cardiomyopathy. Endocrine Practice, 2008. 14(9):
p. 1137-1149.
221. Yates, J.C. and N.S. Dhalla, Induction of necrosis and failure in the isolated perfused rat
heart with oxidized isoproterenol. Journal of Molecular and Cellular Cardiology, 1975. 7(11):
p. 807-816.
222. Dhalla, N.S., et al., Functional and subcellular changes in the isolated rat heart perfused with
oxidized isoproterenol. Journal of Molecular and Cellular Cardiology, 1978. 10(1): p. 31-41.
223. Rupp, H., K.S. Dhalla, and N.S. Dhalla, Mechanisms of Cardiac Cell Damage Due to
Catecholamines: Significance of Drugs Regulating Central Sympathetic Outflow. Journal of
Cardiovascular Pharmacology, 1994. 24: p. S16-S24.
224. Dhalla, K.S., et al., Mechanisms of alterations in cardiac membrane Ca2+ transport due to
excess catecholamines. Cardiovascular Drugs and Therapy, 1996. 10(1): p. 231-238.
225. Tappia, P.S., et al., Role of Oxidative Stress in Catecholamine-Induced Changes in Cardiac
Sarcolemmal Ca2+ Transport. Archives of Biochemistry and Biophysics, 2001. 387(1): p. 85-
92.
226. Remião, F., et al., Synthesis and analysis of aminochromes by HPLC-photodiode array.
Adrenochrome evaluation in rat blood. Biomedical Chromatography, 2003. 17(1): p. 6-13.
227. Lemos-Amado, F., et al., Electrospray tandem mass spectrometry of aminochromes. Rapid
Communications in Mass Spectrometry, 2001. 15(24): p. 2466-2471.
228. Bindoli, A., M.P. Rigobello, and L. Galzigna, Toxicity of aminochromes. Toxicology letters,
1989. 48(1): p. 3-20.
229. Hawley MD, T.S., Piekarski S, Adams RN., Electrochemical studies of the oxidation
pathways of catecholamines. journal of the American Chemical Society, 1967. 89: p. 4.
230. Kalyanaraman, B., C.C. Felix, and R.C. Sealy, Electron spin resonance-spin stabilization of
semiquinones produced during oxidation of epinephrine and its analogues. Journal of
Biological Chemistry, 1984. 259(1): p. 354-358.
231. Bors, W., et al., Pulse-radiolytic Investigations of Catechols and Catecholamines.
International Journal of Radiation Biology and Related Studies in Physics, Chemistry and
Medicine, 1975. 28(4): p. 353-371.
232. Foppoli, C., et al., Catecholamines oxidation by xanthine oxidase. Biochimica et Biophysica
Acta (BBA) - General Subjects, 1997. 1334(2–3): p. 200-206.
233. Bindoli, A., M.P. Rigobello, and D.J. Deeble, Biochemical and toxicological properties of the
oxidation products of catecholamines. Free Radical Biology and Medicine, 1992. 13(4): p.
391-405.
234. Heacock, R.A., The Chemistry Of Adrenochrome And Related Compounds. Chemical
Reviews, 1959. 59(2): p. 181-237.
235. Núñez-Delicado, E., et al., Hydroperoxidase activity of lipoxygenase: a kinetic study of
isoproterenol oxidation. Biochimica et Biophysica Acta (BBA) - Protein Structure and
Molecular Enzymology, 1996. 1293(1): p. 17-22.
236. MATTHEWS, S.B., A.H. HENDERSON, and A.K. CAMPBELL, The oxidation of
adrenaline to adrenochrome by polymorphonuclear leucocytes. Biochemical Society
Transactions, 1983. 11(2): p. 191-191.
237. Matthews, S.B., A.H. Henderson, and A.K. Campbell, The adrenochrome pathway: The major
route for adrenalin catabolism by polymorphonuclear leucocytes. Journal of Molecular and
Cellular Cardiology, 1985. 17(4): p. 339-348.
238. Mangerich, A. and A. Bürkle, Pleiotropic Cellular Functions of PARP1 in Longevity and
Aging: Genome Maintenance Meets Inflammation. Oxidative Medicine and Cellular
Longevity, 2012. 2012: p. 321653.
239. Hottiger, M.O., et al., Toward a unified nomenclature for mammalian ADP-
ribosyltransferases. Trends in Biochemical Sciences, 2010. 35(4): p. 208-219.
240. Kurosaki, T., et al., Primary structure of human poly(ADP-ribose) synthetase as deduced from
cDNA sequence. Journal of Biological Chemistry, 1987. 262(33): p. 15990-15997.
241. Bürkle, A. and L. Virág, Poly(ADP-ribose): PARadigms and PARadoxes. Molecular Aspects
of Medicine, 2013. 34(6): p. 1046-1065.
242. Pion, E., et al., Poly(ADP-ribose) Polymerase-1 Dimerizes at a 5‘ Recessed DNA End in
Vitro: A Fluorescence Study. Biochemistry, 2003. 42(42): p. 12409-12417.
References
186
243. D’Silva, I., et al., Relative affinities of poly(ADP-ribose) polymerase and DNA-dependent
protein kinase for DNA strand interruptions. Biochimica et Biophysica Acta (BBA) - Protein
Structure and Molecular Enzymology, 1999. 1430(1): p. 119-126.
244. Lonskaya, I., et al., Regulation of Poly(ADP-ribose) Polymerase-1 by DNA Structure-specific
Binding. Journal of Biological Chemistry, 2005. 280(17): p. 17076-17083.
245. Martello, R., et al., Quantification of Cellular Poly(ADP-ribosyl)ation by Stable Isotope
Dilution Mass Spectrometry Reveals Tissue- and Drug-Dependent Stress Response Dynamics.
ACS Chemical Biology, 2013. 8(7): p. 1567-1575.
246. El-Khamisy, S.F., et al., A requirement for PARP-1 for the assembly or stability of XRCC1
nuclear foci at sites of oxidative DNA damage. Nucleic Acids Research, 2003. 31(19): p.
5526-5533.
247. Robert, I., et al., Functional aspects of PARylation in induced and programmed DNA repair
processes: Preserving genome integrity and modulating physiological events. Molecular
Aspects of Medicine, 2013. 34(6): p. 1138-1152.
248. Altmeyer, M., et al., Molecular mechanism of poly(ADP-ribosyl)ation by PARP1 and
identification of lysine residues as ADP-ribose acceptor sites. Nucleic Acids Research, 2009.
37(11): p. 3723-3738.
249. D'Amours, D., et al., Poly(ADP-ribosyl)ation reactions in the regulation of nuclear functions.
Biochemical Journal, 1999. 342(Pt 2): p. 249-268.
250. Ferro, A.M. and B.M. Olivera, Poly(ADP-ribosylation) in vitro. Reaction parameters and
enzyme mechanism. Journal of Biological Chemistry, 1982. 257(13): p. 7808-13.
251. Messner, S., et al., Sumoylation of poly(ADP-ribose) polymerase 1 inhibits its acetylation and
restrains transcriptional coactivator function. The FASEB Journal, 2009. 23(11): p. 3978-
3989.
252. Martin, N., et al., PARP‐1 transcriptional activity is regulated by sumoylation upon heat
shock. The EMBO Journal, 2009. 28(22): p. 3534-3548.
253. Hassa, P.O., et al., Acetylation of Poly(ADP-ribose) Polymerase-1 by p300/CREB-binding
Protein Regulates Coactivation of NF-κB-dependent Transcription. Journal of Biological
Chemistry, 2005. 280(49): p. 40450-40464.
254. Cohen-Armon, M., et al., DNA-Independent PARP-1 Activation by Phosphorylated ERK2
Increases Elk1 Activity: A Link to Histone Acetylation. Molecular Cell. 25(2): p. 297-308.
255. Kauppinen, T.M., et al., Direct phosphorylation and regulation of poly(ADP-ribose)
polymerase-1 by extracellular signal-regulated kinases 1/2. Proceedings of the National
Academy of Sciences of the United States of America, 2006. 103(18): p. 7136-7141.
256. Brunyanszki, A., et al., Regulation of Mitochondrial poly(ADP-ribose) Polymerase Activation
by the β-adrenoceptor / cAMP / Protein Kinase A Axis During Oxidative Stress. Molecular
Pharmacology, 2014.
257. Zhang, S., et al., c-Jun N-terminal kinase mediates hydrogen peroxide-induced cell death via
sustained poly(ADP-ribose) polymerase-1 activation. Cell Death Differ, 2007. 14(5): p. 1001-
1010.
258. Hegedűs, C., et al., Protein kinase C protects from DNA damage-induced necrotic cell death
by inhibiting poly(ADP-ribose) polymerase-1. FEBS Letters, 2008. 582(12): p. 1672-1678.
259. Zhang, Y., et al., Site-specific characterization of the Asp- and Glu-ADP-ribosylated
proteome. Nat Meth, 2013. 10(10): p. 981-984.
260. Laing, S., et al., Strategies for the identification of arginine ADP-ribosylation sites. Journal of
Proteomics, 2011. 75(1): p. 169-176.
261. Jungmichel, S., et al., Proteome-wide Identification of Poly(ADP-Ribosyl)ation Targets in
Different Genotoxic Stress Responses. Molecular Cell, 2013. 52(2): p. 272-285.
262. Vivelo, C.A., et al., ADPriboDB: The database of ADP-ribosylated proteins. Nucleic Acids
Research, 2017. 45(Database issue): p. D204-D209.
263. Alvarez-Gonzalez, R. and F.R. Althaus, Poly(ADP-ribose) catabolism in mammalian cells
exposed to DNA-damaging agents. Mutation Research/DNA Repair, 1989. 218(2): p. 67-74.
264. Jacobson, E.L., et al., Poly(ADP-ribose) metabolism in ultraviolet irradiated human
fibroblasts. Journal of Biological Chemistry, 1983. 258(1): p. 103-107.
265. Davidovic, L., et al., Importance of Poly(ADP-Ribose) Glycohydrolase in the Control of
Poly(ADP-Ribose) Metabolism. Experimental Cell Research, 2001. 268(1): p. 7-13.
References
187
266. BRAUN, S.A., et al., Endoglycosidic cleavage of branched polymers by poly(ADP-ribose)
glycohydrolase. European Journal of Biochemistry, 1994. 220(2): p. 6.
267. Hatakeyama, K., et al., Purification and characterization of poly(ADP-ribose) glycohydrolase.
Different modes of action on large and small poly(ADP-ribose). Journal of Biological
Chemistry, 1986. 261(32): p. 14902-11.
268. Barkauskaite, E., et al., Visualization of poly(ADP-ribose) bound to PARG reveals inherent
balance between exo- and endo-glycohydrolase activities. Nature Communications, 2013. 4:
p. 2164.
269. Gibson, B.A. and W.L. Kraus, New insights into the molecular and cellular functions of
poly(ADP-ribose) and PARPs. Nat Rev Mol Cell Biol, 2012. 13(7): p. 411-424.
270. Ahel, I., et al., Poly(ADP-ribose)-binding zinc finger motifs in DNA repair/checkpoint
proteins. Nature, 2008. 451(7174): p. 81-85.
271. Karras, G.I., et al., The macro domain is an ADP-ribose binding module. The EMBO Journal,
2005. 24(11): p. 9.
272. Pleschke, J.M., et al., Poly(ADP-ribose) Binds to Specific Domains in DNA Damage
Checkpoint Proteins. Journal of Biological Chemistry, 2000. 275(52): p. 40974-40980.
273. Wang, Z., et al., Recognition of the iso-ADP-ribose moiety in poly(ADP-ribose) by WWE
domains suggests a general mechanism for poly(ADP-ribosyl)ation-dependent ubiquitination.
Genes & Development, 2012. 26(3): p. 235-240.
274. Zhang, F., et al., The oligonucleotide/oligosaccharide-binding fold motif is a poly(ADP-
ribose)-binding domain that mediates DNA damage response. Proceedings of the National
Academy of Sciences of the United States of America, 2014. 111(20): p. 7278-7283.
275. Min, W., et al., Poly(ADP-ribose) binding to Chk1 at stalled replication forks is required for
S-phase checkpoint activation. Nature Communications, 2013. 4: p. 2993.
276. Mortusewicz, O., et al., Feedback-regulated poly(ADP-ribosyl)ation by PARP-1 is required
for rapid response to DNA damage in living cells. Nucleic Acids Research, 2007. 35(22): p.
7665-7675.
277. De Vos, M., V. Schreiber, and F. Dantzer, The diverse roles and clinical relevance of PARPs
in DNA damage repair: Current state of the art. Biochemical Pharmacology, 2012. 84(2): p.
137-146.
278. Messner, S., et al., PARP1 ADP-ribosylates lysine residues of the core histone tails. Nucleic
Acids Research, 2010. 38(19): p. 6350-6362.
279. Rouleau, M., R.A. Aubin, and G.G. Poirier, Poly(ADP-ribosyl)ated chromatin domains:
access granted. Journal of Cell Science, 2004. 117(6): p. 815-825.
280. Fagagna, F.d.A.d., et al., Functions of poly(ADP-ribose) polymerase in controlling telomere
length and chromosomal stability. Nat Genet, 1999. 23(1): p. 76-80.
281. Beneke, S., et al., Rapid regulation of telomere length is mediated by poly(ADP-ribose)
polymerase-1. Nucleic Acids Research, 2008. 36(19): p. 6309-6317.
282. Gomez, M., et al., PARP1 Is a TRF2-associated Poly(ADP-Ribose)Polymerase and Protects
Eroded Telomeres. Molecular Biology of the Cell, 2006. 17(4): p. 1686-1696.
283. Vaziri, H., et al., ATM‐dependent telomere loss in aging human diploid fibroblasts and DNA
damage lead to the post‐translational activation of p53 protein involving poly(ADP‐ribose)
polymerase. The EMBO Journal, 1997. 16(19): p. 6018-6033.
284. Kumari, S.R., H. Mendoza-Alvarez, and R. Alvarez-Gonzalez, Functional Interactions of p53
with Poly(ADP-ribose) Polymerase (PARP) during Apoptosis following DNA Damage:
Covalent Poly(ADP-ribosyl)ation of p53 by Exogenous PARP and Noncovalent Binding of
p53 to the <em>M</em><sub>r</sub> 85,000 Proteolytic Fragment. Cancer Research,
1998. 58(22): p. 5075-5078.
285. Simbulan-Rosenthal, C.M., et al., Poly(ADP-ribosyl)ation of p53 during Apoptosis in Human
Osteosarcoma Cells. Cancer Research, 1999. 59(9): p. 2190-2194.
286. Węsierska-Gądek, J., G. Schmid, and C. Cerni, ADP-Ribosylation of Wild-Type p53in
Vitro:Binding of p53 Protein to Specific p53 Consensus Sequence Prevents Its Modification.
Biochemical and Biophysical Research Communications, 1996. 224(1): p. 96-102.
287. Fahrer, J., et al., Quantitative analysis of the binding affinity of poly(ADP-ribose) to specific
binding proteins as a function of chain length. Nucleic Acids Research, 2007. 35(21): p. e143-
e143.
References
188
288. Fischbach, A., Physical and functional interactions of the tumor suppressor protein p53 with
poly(ADP-ribose) polymerase-1 and its enzymatic product poly(ADP-ribose). Dissertation
Universität Konstanz, 2017.
289. Wilson, C.B., et al., Inflammation and Oxidative Stress Are Elevated in the Brain, Blood, and
Adrenal Glands during the Progression of Post-Traumatic Stress Disorder in a Predator
Exposure Animal Model. PLOS ONE, 2013. 8(10): p. e76146.
290. Hayden, M.S. and S. Ghosh, Shared Principles in NF-κB Signaling. Cell, 2008. 132(3): p.
344-362.
291. Hassa, P.O. and M.O. Hottiger, A Role of Poly (ADP-Ribose) Polymerase in NF- B
Transcriptional Activation, in Biological Chemistry. 1999. p. 953.
292. Hassa, P.O. and M.O. Hottiger, The functional role of poly(ADP-ribose)polymerase 1 as novel
coactivator of NF-κB in inflammatory disorders. Cellular and Molecular Life Sciences CMLS,
2002. 59(9): p. 1534-1553.
293. Oliver, F.J., et al., Resistance to endotoxic shock as a consequence of defective NF-kappaB
activation in poly (ADP-ribose) polymerase-1 deficient mice. The EMBO Journal, 1999.
18(16): p. 4446-4454.
294. Rovillain, E., et al., Activation of nuclear factor-kappa B signalling promotes cellular
senescence. Oncogene, 2011. 30(20): p. 2356-2366.
295. Giansanti, V., et al., PARP inhibitors: New tools to protect from inflammation. Biochemical
Pharmacology, 2010. 80(12): p. 1869-1877.
296. Shall, S. and G. de Murcia, Poly(ADP-ribose) polymerase-1: what have we learned from the
deficient mouse model? Mutation Research/DNA Repair, 2000. 460(1): p. 1-15.
297. Drazen, D.L., et al., Disruption of poly (ADP-ribose) polymerase (PARP) protects against
stress-evoked immunocompromise. Molecular Medicine, 2001. 7(11): p. 761-766.
298. Neigh, G.N., et al., 3-Aminobenzamide prevents restraint-evoked immunocompromise. Brain,
Behavior, and Immunity, 2005. 19(4): p. 351-356.
299. Ordway, G.A., et al., Antidepressant-Like Actions of Inhibitors of Poly(ADP-Ribose)
Polymerase in Rodent Models. International Journal of Neuropsychopharmacology, 2017.
20(12): p. 994-1004.
300. Hillyard, D., et al., The pyridine nucleotide cycle. Studies in Escherichia coli and the human
cell line D98/AH2. Journal of Biological Chemistry, 1981. 256(16): p. 8491-8497.
301. Carson, D.A., et al., DNA strand breaks, NAD metabolism, and programmed cell death.
Experimental Cell Research, 1986. 164(2): p. 273-281.
302. Rechsteiner, M., D. Hillyard, and B.M. Olivera, Magnitude and significance of NAD turnover
in human cell line D98/AH2. Nature, 1976. 259(5545): p. 695-696.
303. Goodwin, P.M., et al., The effect of gamma radiation and neocarzinostatin of NAD and ATP
levels in mouse leukaemia cells. Biochimica et Biophysica Acta (BBA) - General Subjects,
1978. 543(4): p. 576-582.
304. Skidmore, C.J., et al., The Involvement of Poly(ADP-ribose) Polymerase in the Degradation of
NAD Caused by γ-Radiation and N-Methyl-N-Nitrosourea. European Journal of Biochemistry,
1979. 101(1): p. 135-142.
305. Stubberfield, C.R. and G.M. Cohen, Nad+ depletion and cytotoxicity in isolated hepatocytes.
Biochemical Pharmacology, 1988. 37(20): p. 3967-3974.
306. Jacobson, M.K., et al., Effect of Carcinogenic N-Alkyl-N-nitroso Compounds on Nicotinamide
Adenine Dinucleotide Metabolism. Cancer Research, 1980. 40(6): p. 1797-1802.
307. Das, S.K. and N.A. Berger, Alterations in deoxynucleoside triphosphate metabolism in DNA
damaged cells: Identification and consequences of poly(ADP-ribose) polymerase dependent
and independent processes. Biochemical and Biophysical Research Communications, 1986.
137(3): p. 1153-1158.
308. Jonsson, G.G., E.L. Jacobson, and M.K. Jacobson, Mechanism of Alteration of
Poly(Adenosine Diphosphate-Ribose) Metabolism by Hyperthermia. Cancer Research, 1988.
48(15): p. 4233-4239.
309. Virág, L., et al., Poly(ADP-ribose) signaling in cell death. Molecular Aspects of Medicine,
2013. 34(6): p. 1153-1167.
References
189
310. Fatokun, A.A., V.L. Dawson, and T.M. Dawson, Parthanatos: mitochondrial-linked
mechanisms and therapeutic opportunities. British Journal of Pharmacology, 2014. 171(8): p.
2000-2016.
311. López-Otín, C., et al., The Hallmarks of Aging. Cell, 2013. 153(6): p. 1194-1217.
312. Lohr, J.B., et al., Is Post-Traumatic Stress Disorder Associated with Premature Senescence? A
Review of the Literature. The American Journal of Geriatric Psychiatry, 2015. 23(7): p. 709-
725.
313. Parks, C.G., et al., Telomere Length, Current Perceived Stress, and Urinary Stress Hormones
in Women. Cancer Epidemiology Biomarkers & Prevention, 2009. 18(2): p. 551-560.
314. Epel, E.S., et al., Cell aging in relation to stress arousal and cardiovascular disease risk
factors. Psychoneuroendocrinology, 2006. 31(3): p. 277-287.
315. Malan, S., et al., Investigation of telomere length and psychological stress in rape victims.
Depression and Anxiety, 2011. 28(12): p. 1081-1085.
316. O'Donovan, A., et al., Childhood Trauma Associated with Short Leukocyte Telomere Length
in Posttraumatic Stress Disorder. Biological Psychiatry, 2011. 70(5): p. 465-471.
317. Zhang, L., et al., The interaction between stressful life events and leukocyte telomere length is
associated with PTSD. Mol Psychiatry, 2014. 19(8): p. 856-857.
318. Jergović, M., et al., Telomere shortening and immune activity in war veterans with
posttraumatic stress disorder. Progress in Neuro-Psychopharmacology and Biological
Psychiatry, 2014. 54: p. 275-283.
319. Ladwig, K.-H., et al., Posttraumatic Stress Disorder and Not Depression Is Associated with
Shorter Leukocyte Telomere Length: Findings from 3,000 Participants in the Population-
Based KORA F4 Study. PLOS ONE, 2013. 8(7): p. e64762.
320. Zhang, H., Molecular signaling and genetic pathways of senescence: Its role in tumorigenesis
and aging. Journal of Cellular Physiology, 2007. 210(3): p. 567-574.
321. Hayflick, L. and P.S. Moorhead, The serial cultivation of human diploid cell strains. Exp Cell
Res, 1961. 25: p. 585-621.
322. Hayflick, L., THE LIMITED IN VITRO LIFETIME OF HUMAN DIPLOID CELL STRAINS.
Exp Cell Res, 1965. 37: p. 614-36.
323. Fagagna, F.d.A.d., et al., A DNA damage checkpoint response in telomere-initiated
senescence. Nature, 2003. 426(6963): p. 194-198.
324. Takai, H., A. Smogorzewska, and T. de Lange, DNA Damage Foci at Dysfunctional
Telomeres. Current Biology, 2003. 13(17): p. 1549-1556.
325. Herbig, U., et al., Telomere shortening triggers senescence of human cells through a pathway
involving ATM, p53, and p21(CIP1), but not p16(INK4a). Mol Cell, 2004. 14(4): p. 501-13.
326. Shiloh, Y., ATM and related protein kinases: safeguarding genome integrity. Nat Rev Cancer,
2003. 3(3): p. 155-168.
327. Jackson, S.P., Sensing and repairing DNA double-strand breaks. Carcinogenesis, 2002. 23(5):
p. 687-696.
328. Frenck, R.W., E.H. Blackburn, and K.M. Shannon, The rate of telomere sequence loss in
human leukocytes varies with age. Proceedings of the National Academy of Sciences, 1998.
95(10): p. 5607-5610.
329. Campisi, J., Aging, Cellular Senescence, and Cancer. Annual Review of Physiology, 2013.
75(1): p. 685-705.
330. Ramirez, R.D., et al., Putative telomere-independent mechanisms of replicative aging reflect
inadequate growth conditions. Genes & Development, 2001. 15(4): p. 398-403.
331. Shay, J.W. and I.B. Roninson, Hallmarks of senescence in carcinogenesis and cancer therapy.
Oncogene, 0000. 23(16): p. 2919-2933.
332. Serrano, M., et al., Oncogenic ras Provokes Premature Cell Senescence Associated with
Accumulation of p53 and p16INK4a. Cell, 1997. 88(5): p. 593-602.
333. Chen, Q. and B.N. Ames, Senescence-like growth arrest induced by hydrogen peroxide in
human diploid fibroblast F65 cells. Proceedings of the National Academy of Sciences of the
United States of America, 1994. 91(10): p. 4130-4134.
334. Chandeck, C. and W.J. Mooi, Oncogene-induced Cellular Senescence. Advances in Anatomic
Pathology, 2010. 17(1): p. 42-48.
References
190
335. Toussaint, O., E.E. Medrano, and T. von Zglinicki, Cellular and molecular mechanisms of
stress-induced premature senescence (SIPS) of human diploid fibroblasts and melanocytes.
Exp Gerontol, 2000. 35(8): p. 927-45.
336. Nakamura, A.J., et al., Both telomeric and non-telomeric DNA damage are determinants of
mammalian cellular senescence. Epigenetics & Chromatin, 2008. 1(1): p. 6.
337. Ben-Porath, I. and R.A. Weinberg, The signals and pathways activating cellular senescence.
The International Journal of Biochemistry & Cell Biology, 2005. 37(5): p. 961-976.
338. Takeuchi, S., et al., Intrinsic Cooperation between p16<sup>INK4a</sup> and
p21<sup>Waf1/Cip1</sup> in the Onset of Cellular Senescence and Tumor Suppression
<em>In vivo</em>. Cancer Research, 2010. 70(22): p. 9381-9390.
339. Zhang, J., et al., p16<sup>INK4a</sup> Modulates p53 in Primary Human Mammary
Epithelial Cells. Cancer Research, 2006. 66(21): p. 10325-10331.
340. Sherr, C.J. and F. McCormick, The RB and p53 pathways in cancer. Cancer Cell. 2(2): p. 103-
112.
341. Ruas, M. and G. Peters, The p16INK4a/CDKN2A tumor suppressor and its relatives.
Biochimica et Biophysica Acta (BBA) - Reviews on Cancer, 1998. 1378(2): p. F115-F177.
342. Collins, C.J. and J.M. Sedivy, Involvement of the INK4a/Arf gene locus in senescence. Aging
Cell, 2003. 2(3): p. 145-50.
343. Levine, A.J. and M. Oren, The first 30 years of p53: growing ever more complex. Nat Rev
Cancer, 2009. 9(10): p. 749-758.
344. Chau, B.N. and J.Y.J. Wang, Coordinated regulation of life and death by RB. Nat Rev Cancer,
2003. 3(2): p. 130-138.
345. Sherr, C.J. and J.M. Roberts, CDK inhibitors: positive and negative regulators of G1-phase
progression. Genes & Development, 1999. 13(12): p. 1501-1512.
346. Kamijo, T., et al., Tumor Suppression at the Mouse INK4a Locus Mediated by the Alternative
Reading Frame Product p19 ARF. Cell, 1997. 91(5): p. 649-659.
347. Campisi, J. and F. d'Adda di Fagagna, Cellular senescence: when bad things happen to good
cells. Molecular Cell Biology, 2007. 8: p. 11.
348. Kulju, K.S. and J.M. Lehman, Increased p53 Protein Associated with Aging in Human
Diploid Fibroblasts. Experimental Cell Research, 1995. 217(2): p. 336-345.
349. Ferbeyre, G., et al., PML is induced by oncogenic ras and promotes premature senescence.
Genes & Development, 2000. 14(16): p. 2015-2027.
350. Pearson, M., et al., PML regulates p53 acetylation and premature senescence induced by
oncogenic Ras. Nature, 2000. 406(6792): p. 207-210.
351. Haupt, Y., et al., Mdm2 promotes the rapid degradation of p53. Nature, 1997. 387(6630): p.
296-299.
352. Kubbutat, M.H.G., S.N. Jones, and K.H. Vousden, Regulation of p53 stability by Mdm2.
Nature, 1997. 387(6630): p. 299-303.
353. Momand, J., et al., The mdm-2 oncogene product forms a complex with the p53 protein and
inhibits p53-mediated transactivation. Cell, 1992. 69(7): p. 1237-1245.
354. Brown, J.P., W. Wei, and J.M. Sedivy, Bypass of Senescence After Disruption of
p21<sup><em>CIP1/WAF1</em></sup> Gene in Normal Diploid Human Fibroblasts.
Science, 1997. 277(5327): p. 831-834.
355. Stein, G.H., et al., Differential Roles for Cyclin-Dependent Kinase Inhibitors p21 and p16 in
the Mechanisms of Senescence and Differentiation in Human Fibroblasts. Molecular and
Cellular Biology, 1999. 19(3): p. 2109-2117.
356. Xiong, Y., et al., p21 is a universal inhibitor of cyclin kinases. Nature, 1993. 366(6456): p.
701-704.
357. Beauséjour, C.M., et al., Reversal of human cellular senescence: roles of the p53 and p16
pathways. EMBO J, 2003. 22(16): p. 4212-22.
358. Dyson, N., The regulation of E2F by pRB-family proteins. Genes & Development, 1998.
12(15): p. 2245-2262.
359. Trimarchi, J.M. and J.A. Lees, Sibling rivalry in the E2F family. Nat Rev Mol Cell Biol, 2002.
3(1): p. 11-20.
References
191
360. Rayman, J.B., et al., E2F mediates cell cycle-dependent transcriptional repression in vivo by
recruitment of an HDAC1/mSin3B corepressor complex. Genes & Development, 2002. 16(8):
p. 933-947.
361. Chicas, A., et al., Dissecting the Unique Role of the Retinoblastoma Tumor Suppressor during
Cellular Senescence. Cancer Cell, 2010. 17(4): p. 376-387.
362. Jacobs, J.J.L. and T. de Lange, Significant Role for p16INK4a in p53-Independent Telomere-
Directed Senescence. Current Biology, 2004. 14(24): p. 2302-2308.
363. Smogorzewska, A. and T. de Lange, Different telomere damage signaling pathways in human
and mouse cells. The EMBO Journal, 2002. 21(16): p. 4338-4348.
364. Pavletich, N.P., Mechanisms of cyclin-dependent kinase regulation: structures of cdks, their
cyclin activators, and cip and INK4 inhibitors1,2. Journal of Molecular Biology, 1999.
287(5): p. 821-828.
365. Ezhevsky, S.A., et al., Differential Regulation of Retinoblastoma Tumor Suppressor Protein
by G1 Cyclin-Dependent Kinase Complexes In Vivo. Molecular and Cellular Biology, 2001.
21(14): p. 4773-4784.
366. Chen, Q.M., et al., Uncoupling the Senescent Phenotype from Telomere Shortening in
Hydrogen Peroxide-Treated Fibroblasts. Experimental Cell Research, 2001. 265(2): p. 294-
303.
367. Narita, M., et al., Rb-Mediated Heterochromatin Formation and Silencing of E2F Target
Genes during Cellular Senescence. Cell, 2003. 113(6): p. 703-716.
368. Dimri, G.P., et al., A biomarker that identifies senescent human cells in culture and in aging
skin in vivo. Proc Natl Acad Sci U S A, 1995. 92(20): p. 9363-7.
369. Debacq-Chainiaux, F., et al., Protocols to detect senescence-associated beta-galactosidase
(SA-[beta]gal) activity, a biomarker of senescent cells in culture and in vivo. Nat. Protocols,
2009. 4(12): p. 1798-1806.
370. Coppe, J.P., et al., The senescence-associated secretory phenotype: the dark side of tumor
suppression. Annu Rev Pathol, 2010. 5: p. 99-118.
371. Krtolica, A., et al., Senescent fibroblasts promote epithelial cell growth and tumorigenesis: A
link between cancer and aging. Proceedings of the National Academy of Sciences, 2001.
98(21): p. 12072-12077.
372. Coppe, J.-P., et al., A Role for Fibroblasts in Mediating the Effects of Tobacco-Induced
Epithelial Cell Growth and Invasion. Molecular Cancer Research, 2008. 6(7): p. 1085-1098.
373. Kuilman, T., et al., Oncogene-Induced Senescence Relayed by an Interleukin-Dependent
Inflammatory Network. Cell, 2008. 133(6): p. 1019-1031.
374. Coppé, J.-P., et al., Senescence-Associated Secretory Phenotypes Reveal Cell-Nonautonomous
Functions of Oncogenic RAS and the p53 Tumor Suppressor. PLOS Biology, 2008. 6(12): p.
e301.
375. West, M.D., O.M. Pereira-Smith, and J.R. Smith, Replicative senescence of human skin
fibroblasts correlates with a loss of regulation and overexpression of collagenase activity.
Experimental Cell Research, 1989. 184(1): p. 138-147.
376. Liu, D. and P.J. Hornsby, Senescent Human Fibroblasts Increase the Early Growth of
Xenograft Tumors via Matrix Metalloproteinase Secretion. Cancer Research, 2007. 67(7): p.
3117-3126.
377. West, M.D., et al., Altered expression of plasminogen activator and plasminogen activator
inhibitor during cellular senescence. Experimental Gerontology, 1996. 31(1–2): p. 175-193.
378. Kortlever, R.M., P.J. Higgins, and R. Bernards, Plasminogen activator inhibitor-1 is a critical
downstream target of p53 in the induction of replicative senescence. Nat Cell Biol, 2006. 8(8):
p. 877-884.
379. Cole, S.W. and A.K. Sood, Molecular Pathways: Beta-Adrenergic Signaling in Cancer.
Clinical Cancer Research, 2012. 18(5): p. 1201-1206.
380. Antoni, M.H., et al., The influence of bio-behavioural factors on tumour biology: pathways
and mechanisms. Nat Rev Cancer, 2006. 6(3): p. 240-248.
381. Palm, D., et al., The norepinephrine-driven metastasis development of PC-3 human prostate
cancer cells in BALB/c nude mice is inhibited by β-blockers. International Journal of Cancer,
2006. 118(11): p. 2744-2749.
References
192
382. Sloan, E.K., et al., The Sympathetic Nervous System Induces a Metastatic Switch in Primary
Breast Cancer. Cancer Research, 2010. 70(18): p. 7042-7052.
383. Hasegawa, H. and I. Saiki, Psychosocial Stress Augments Tumor Development through β-
Adrenergic Activation in Mice. Japanese Journal of Cancer Research, 2002. 93(7): p. 729-735.
384. Inbar, S., et al., Do Stress Responses Promote Leukemia Progression? An Animal Study
Suggesting a Role for Epinephrine and Prostaglandin-E2 through Reduced NK Activity. PLOS
ONE, 2011. 6(4): p. e19246.
385. Powe, D.G., et al., Beta-Blocker Drug Therapy Reduces Secondary Cancer Formation in
Breast Cancer and Improves Cancer Specific Survival. Oncotarget, 2010. 1(7).
386. Barron, T.I., et al., Beta Blockers and Breast Cancer Mortality: A Population- Based Study.
Journal of Clinical Oncology, 2011. 29(19): p. 2635-2644.
387. De Giorgi, V., et al., Treatment with β-blockers and reduced disease progression in patients
with thick melanoma. Archives of Internal Medicine, 2011. 171(8): p. 779-781.
388. Lemeshow, S., et al., β-Blockers and Survival among Danish Patients with Malignant
Melanoma: A Population-Based Cohort Study. Cancer epidemiology, biomarkers &
prevention : a publication of the American Association for Cancer Research, cosponsored by
the American Society of Preventive Oncology, 2011. 20(10): p. 2273-2279.
389. Kulik, G.A., et al., Abstract SY04-01: Behavioral stress protects prostate cancer cells from
apoptosis. Cancer Research, 2011. 71(8 Supplement): p. SY04-01-SY04-01.
390. Lutgendorf, S.K., et al., Depression, social support, and beta-adrenergic transcription control
in human ovarian cancer. Brain, Behavior, and Immunity, 2009. 23(2): p. 176-183.
391. Nilsson, M.B., et al., Stress Hormones Regulate Interleukin-6 Expression by Human Ovarian
Carcinoma Cells through a Src-dependent Mechanism. Journal of Biological Chemistry,
2007. 282(41): p. 29919-29926.
392. Cole, S.W., et al., Computational identification of gene–social environment interaction at the
human IL6 locus. Proceedings of the National Academy of Sciences, 2010. 107(12): p. 5681-
5686.
393. Shahzad, M.M.K., et al., Stress Effects on FosB- and Interleukin-8 (IL8)-driven Ovarian
Cancer Growth and Metastasis. Journal of Biological Chemistry, 2010. 285(46): p. 35462-
35470.
394. Landen, C.N., et al., Neuroendocrine Modulation of Signal Transducer and Activator of
Transcription-3 in Ovarian Cancer. Cancer Research, 2007. 67(21): p. 10389-10396.
395. Sood, A.K., et al., Stress Hormone–Mediated Invasion of Ovarian Cancer Cells. Clinical
Cancer Research, 2006. 12(2): p. 369-375.
396. Sastry, K.S.R., et al., Epinephrine Protects Cancer Cells from Apoptosis via Activation of
cAMP-dependent Protein Kinase and BAD Phosphorylation. Journal of Biological Chemistry,
2007. 282(19): p. 14094-14100.
397. Abramovitch, R., et al., A Pivotal Role of Cyclic AMP-Responsive Element Binding Protein in
Tumor Progression. Cancer Research, 2004. 64(4): p. 1338-1346.
398. Lang, K., et al., Induction of a metastatogenic tumor cell type by neurotransmitters and its
pharmacological inhibition by established drugs. International Journal of Cancer, 2004.
112(2): p. 231-238.
399. Djelić, N., et al., Evaluation of cytogenetic and DNA damage in human lymphocytes treated
with adrenaline in vitro. Toxicology in Vitro, 2015. 29(1): p. 27-33.
400. Hara, M.R., et al., A stress response pathway regulates DNA damage through beta2-
adrenoreceptors and beta-arrestin-1. Nature, 2011. 477(7364): p. 349-53.
401. Hara, M.R., et al., Pharmacological blockade of a β<sub>2</sub>AR-β-arrestin-1 signaling
cascade prevents the accumulation of DNA damage in a behavioral stress model. Cell Cycle,
2013. 12(2): p. 219-224.
402. Hovhannisyan, L.P., et al., Alterations in the complement cascade in post-traumatic stress
disorder. Allergy, Asthma & Clinical Immunology, 2010. 6(1): p. 3.
403. Leserman, J., et al., Progression to AIDS: The Effects of Stress, Depressive Symptoms, and
Social Support. Psychosomatic Medicine, 1999. 61(3): p. 397-406.
404. Cohen, F., et al., Persistent stress as a predictor of genital herpes recurrence. Archives of
Internal Medicine, 1999. 159(20): p. 2430-2436.
References
193
405. Schumacher, T., Studies on the Effect of Isoproterenol on Poly-ADP-Ribose Polymerase and
Poly-ADP-Ribosylation in Human Peripheral Blood Mononuclear Cells. 2013.
406. cAMP-GLO Assay Technical Bulletin. Promega. TB357.
407. Cossarizza, A., et al., Simultaneous analysis of reactive oxygen species and reduced
glutathione content in living cells by polychromatic flow cytometry. Nat. Protocols, 2009.
4(12): p. 1790-1797.
408. Myhre, O., et al., Evaluation of the probes 2′,7′-dichlorofluorescin diacetate, luminol, and
lucigenin as indicators of reactive species formation. Biochemical Pharmacology, 2003.
65(10): p. 1575-1582.
409. Wojtala, A., et al., Chapter Thirteen - Methods to Monitor ROS Production by Fluorescence
Microscopy and Fluorometry, in Methods in Enzymology, G. Lorenzo and K. Guido, Editors.
2014, Academic Press. p. 243-262.
410. Carter, W.O., P.K. Narayanan, and J.P. Robinson, Intracellular hydrogen peroxide and
superoxide anion detection in endothelial cells. Journal of Leukocyte Biology, 1994. 55(2): p.
253-8.
411. Zielonka, J., J. Vasquez-Vivar, and B. Kalyanaraman, Detection of 2-hydroxyethidium in
cellular systems: a unique marker product of superoxide and hydroethidine. Nat. Protocols,
2008. 3(1): p. 8-21.
412. Jacobson, E.L. and M.K. Jacobson, Pyridine nucleotide levels as a function of growth in
normal and transformed 3T3 cells. Archives of Biochemistry and Biophysics, 1976. 175(2): p.
627-634.
413. Weidele, K., et al., Ex vivo supplementation with nicotinic acid enhances cellular poly(ADP-
ribosyl)ation and improves cell viability in human peripheral blood mononuclear cells.
Biochemical Pharmacology, 2010. 80(7): p. 1103-1112.
414. Kunzmann, A., et al., Flow-cytometric assessment of cellular poly(ADP-ribosyl)ation capacity
in peripheral blood lymphocytes. Immunity & Ageing, 2006. 3: p. 8-8.
415. user manual miniVE. SE300-IM/Rev. A0/05-04.
416. Sun, R., et al., Senescence as a novel mechanism involved in β-adrenergic receptor mediated
cardiac hypertrophy. PLOS ONE, 2017. 12(8): p. e0182668.
417. Grath, A., Assessment of cellular senescence after chronic adrenergic receptor stimulation.
Universität Konstanz, 2015.
418. Fujii, M., T. Abo, and K. Kumagai, Cytokines produced by blood mononuclear cells
stimulated with the streptococcal preparation OK-432: effect on production by supplementing
the medium with xenogeneic serum. Cancer Immunology, Immunotherapy, 1988. 27(2): p. 97-
102.
419. Xiaoyang, Z., et al., Proteomic Analysis for the Assessment of Different Lots of Fetal Bovine
Serum as a Raw Material for Cell Culture. Part IV. Application of Proteomics to the
Manufacture of Biological Drugs. Biotechnology Progress, 2006. 22(5): p. 1294-1300.
420. Philipp Palombo, J.S., Mara Thomas Alexander Bürkle and Maria Moreno-Villanueva,
Isoproterenol stability and degradation in cell culture medium. Manuscript in preperation,
2018.
421. Thomas, M., et al., Impaired PARP activity in response to the β-adrenergic receptor agonist
isoproterenol. Toxicology in Vitro, 2018. 50: p. 29-39.
422. Moniri, N.H. and Y. Daaka, Agonist-stimulated reactive oxygen species formation regulates
β2-adrenergic receptor signal transduction. Biochemical Pharmacology, 2007. 74(1): p. 64-
73.
423. Singh, M. and N.H. Moniri, Reactive oxygen species are required for β2 adrenergic receptor–
β-arrestin interactions and signaling to ERK1/2. Biochemical Pharmacology, 2012. 84(5): p.
661-669.
424. Liu, Y., et al., Expression of p16INK4a in peripheral blood T-cells is a biomarker of human
aging. Aging Cell, 2009. 8(4): p. 439-448.
425. Conway, W.D., et al., Absorption and elimination profile of isoproterenol III. The metabolic
fate of dl-isoproterenol-7-3H in the dog. J. Pharm. Sci., 1968. 57(1): p. 6.
426. Halliwell, B., Albumin—An important extracellular antioxidant? Biochemical Pharmacology,
1988. 37(4): p. 569-571.
References
194
427. Halliwell, B. and J.M.C. Gutteridge, The antioxidants of human extracellular fluids. Archives
of Biochemistry and Biophysics, 1990. 280(1): p. 1-8.
428. Rasmussen, S.G.F., et al., Crystal structure of the [bgr]2 adrenergic receptor-Gs protein
complex. Nature, 2011. 477(7366): p. 549-555.
429. Vitlic, A., J. Lord, and A. Phillips, Stress, ageing and their influence on functional, cellular
and molecular aspects of the immune system. AGE, 2014. 36(3): p. 1169-1185.
430. Pan, C., et al., Comparative Proteomic Phenotyping of Cell Lines and Primary Cells to Assess
Preservation of Cell Type-specific Functions. Molecular & Cellular Proteomics : MCP, 2009.
8(3): p. 443-450.
431. Sager, G., et al., Adrenergic ligand binding in human serum. Biochemical Pharmacology,
1985. 34(15): p. 2812-2815.
432. GmbH, M.B., TexMACSTM
Medium research grade. 2013.
433. Dooper, M.W.S.M., et al., Potentiation of adenylyl cyclase in human peripheral blood
mononuclear cells by cell-activating stimuli. Biochemical Pharmacology, 1994. 47(2): p. 289-
294.
434. Copik, A.J., et al., Isoproterenol Acts as a Biased Agonist of the Alpha-1A-Adrenoceptor that
Selectively Activates the MAPK/ERK Pathway. PLoS ONE, 2015. 10(1): p. e0115701.
435. Titinchi, S.a. and B. Clark, Alpha2-adrenoceptors in human lymphocytes: Direct
characterisation by [3H]yohimbine binding. Biochemical and Biophysical Research
Communications, 1984. 121(1): p. 1-7.
436. Cosentino, M., et al., Human CD4<sup>+</sup>CD25<sup>+</sup> regulatory T cells
selectively express tyrosine hydroxylase and contain endogenous catecholamines subserving
an autocrine/paracrine inhibitory functional loop. Blood, 2007. 109(2): p. 632-642.
437. Jetschmann, J.-U., et al., Expression and in-vivo modulation of α- and β-adrenoceptors on
human natural killer (CD16+) cells. Journal of Neuroimmunology, 1997. 74(1–2): p. 159-
164.
438. Kavelaars, A., Regulated expression of α-1 adrenergic receptors in the immune system. Brain,
Behavior, and Immunity, 2002. 16(6): p. 799-807.
439. Rouppe van der Voort C, K.A., van de Pol M, Heijnen CJ., Neuroendocrine mediators up-
regulate alpha1b- and alpha1d-adrenergic receptor subtypes in human monocytes. J
Neuroimmunol. , 1999. 95(1): p. 8.
440. Surjana, D., G.M. Halliday, and D.L. Damian, Role of Nicotinamide in DNA Damage,
Mutagenesis, and DNA Repair. Journal of Nucleic Acids, 2010. 2010: p. 13.
441. Gobeil, S., et al., Characterization of the necrotic cleavage of poly(ADP-ribose) polymerase
(PARP-1): implication of lysosomal proteases. Cell Death And Differentiation, 2001. 8: p.
588.
442. Chaitanya, G.V., J.S. Alexander, and P.P. Babu, PARP-1 cleavage fragments: signatures of
cell-death proteases in neurodegeneration. Cell Communication and Signaling : CCS, 2010.
8: p. 31-31.
443. Daniel Petru, C., W. Noboru, and I. Mitsuaki, Apoptosis of Peripheral Blood Lymphocytes is
Induced by Catecholamines. Japanese Heart Journal, 2000. 41(3): p. 385-398.
444. Galluzzi, L., et al., Molecular definitions of cell death subroutines: recommendations of the
Nomenclature Committee on Cell Death 2012. Cell Death And Differentiation, 2011. 19: p.
107.
445. Andrabi, S.A., et al., Poly(ADP-ribose) (PAR) polymer is a death signal. Proceedings of the
National Academy of Sciences of the United States of America, 2006. 103(48): p. 18308-
18313.
446. Yu, S.-W., et al., Apoptosis-inducing factor mediates poly(ADP-ribose) (PAR) polymer-
induced cell death. Proceedings of the National Academy of Sciences of the United States of
America, 2006. 103(48): p. 18314-18319.
447. Yu, S.-W., et al., Mediation of Poly(ADP-Ribose) Polymerase-1-Dependent Cell Death by
Apoptosis-Inducing Factor. Science, 2002. 297(5579): p. 259-263.
448. Eruslanov, E. and S. Kusmartsev, Identification of ROS Using Oxidized DCFDA and Flow-
Cytometry, in Advanced Protocols in Oxidative Stress II, D. Armstrong, Editor. 2010, Humana
Press: Totowa, NJ. p. 57-72.
References
195
449. PAOLO, et al., Flow cytometric detection of hydrogen peroxide production induced by
doxorubicin in cancer cells. Free Radical Biology and Medicine, 1994. 16(4): p. 7.
450. Zielonka, J. and B. Kalyanaraman, Hydroethidine- and Mito-SOX-derived red fluorescence is
not a reliable indicator of intracellular superoxide formation: Another inconvenient truth.
Free radical biology & medicine, 2010. 48(8): p. 983-1001.
451. Monalisa Singh, N.H.M., Reactive Oxygen Species as β2-Adrenergic Receptor Signal
Transducers. Journal ofPharmaceutics & Pharmacology, 2014. 2(1).
452. Devasagayam T, T.J., Boloor KK, Sane Ketaki S, Ghaskadbi Saroj S, Lele RD Free Radicals
and Antioxidants in Human Health: Current Status and Future Prospects. J Assoc Physicians
India., 2004: p. 10.
453. Kohno, M., Applications of Electron Spin Resonance Spectrometry for Reactive Oxygen
Species and Reactive Nitrogen Species Research. Journal of Clinical Biochemistry and
Nutrition, 2010. 47(1): p. 1-11.
454. Mrakic-Sposta, S., et al., Assessment of a Standardized ROS Production Profile in Humans by
Electron Paramagnetic Resonance. Oxidative Medicine and Cellular Longevity, 2012. 2012:
p. 10.
455. Hertting, G., The fate of 3H-iso-proterenol in the rat. Biochemical Pharmacology, 1964.
13(8): p. 1119-1128.
456. Deo, S.H., et al., Elevated peripheral blood mononuclear cell-derived superoxide production
in healthy young black men. American Journal of Physiology - Heart and Circulatory
Physiology, 2015. 308(5): p. H548-H552.
457. Deo, S.H., et al., Norepinephrine increases NADPH oxidase-derived superoxide in human
peripheral blood mononuclear cells via α-adrenergic receptors. American Journal of
Physiology - Regulatory, Integrative and Comparative Physiology, 2013. 305(10): p. R1124-
R1132.
458. Zheng, M., et al., Emerging concepts and therapeutic implications of β-adrenergic receptor
subtype signaling. Pharmacology & Therapeutics, 2005. 108(3): p. 257-268.
459. CellROX® Oxidative Stress Reagents.
460. Kanvah, S., et al., Oxidation of DNA: Damage to Nucleobases. Accounts of Chemical
Research, 2010. 43(2): p. 280-287.
461. Marnett, L.J., Oxyradicals and DNA damage. Carcinogenesis, 2000. 21(3): p. 361-370.
462. Valko, M., et al., Role of oxygen radicals in DNA damage and cancer incidence. Molecular
and Cellular Biochemistry, 2004. 266(1): p. 37-56.
463. Azzi, M., et al., Allosteric Effects of G Protein Overexpression on the Binding of β-Adrenergic
Ligands with Distinct Inverse Efficacies. Molecular Pharmacology, 2001. 60(5): p. 999-1007.
464. Chidiac, P., et al., Inverse agonist activity of beta-adrenergic antagonists. Molecular
Pharmacology, 1994. 45(3): p. 490-499.
465. Tohmeh, J.F. and P.E. Cryer, Biphasic Adrenergic Modulation of β-Adrenergic Receptors in
Man: AGONIST-INDUCED EARLY INCREMENT AND LATE DECREMENT IN β-
ADRENERGIC RECEPTOR NUMBER. Journal of Clinical Investigation, 1980. 65(4): p. 836-
840.
466. Winter, I., STUDIES ON THE EFFECT OF ISOPROTERENOL ON DNA STRAND BREAK
REPAIR Master thesis.
467. Chou, J.P. and R.B. Effros, T CELL REPLICATIVE SENESCENCE IN HUMAN AGING.
Current pharmaceutical design, 2013. 19(9): p. 1680-1698.
468. Konstantinos, A.P. and J.F. Sheridan, Stress and influenza viral infection: modulation of
proinflammatory cytokine responses in the lung. Respiration Physiology, 2001. 128(1): p. 71-
77.
469. Kiecolt-Glaser, J.K., et al., Chronic stress alters the immune response to influenza virus
vaccine in older adults. Proceedings of the National Academy of Sciences of the United States
of America, 1996. 93(7): p. 3043-3047.
470. Effros, R.B., M. Dagarag, and H.F. Valenzuela, In vitro senescence of immune cells.
Experimental Gerontology, 2003. 38(11): p. 1243-1249.
References
196
471. Effros, R.B., Long-term immunological memory against viruses. Mechanisms of Ageing and
Development, 2001. 121(1): p. 161-171.
472. Globerson, A. and R.B. Effros, Ageing of lymphocytes and lymphocytes in the aged.
Immunology Today. 21(10): p. 515-521.
473. Vicente, R., et al., Cellular senescence impact on immune cell fate and function. Aging Cell,
2016. 15(3): p. 400-406.
474. Son, N.H., et al., Lineage-Specific Telomere Shortening and Unaltered Capacity for
Telomerase Expression in Human T and B Lymphocytes with Age. The Journal of
Immunology, 2000. 165(3): p. 1191-1196.
475. Effros, R., et al., Decline in CD28+ T cells in centenarians and in long-term T cell cultures: A
possible cause for both in vivo and in vitro immunosenecence. Vol. 29. 1994. 601-9.
476. Frasca, D., Senescent B cells in aging and age-related diseases: Their role in the regulation of
antibody responses. Experimental Gerontology, 2017.
477. Frasca, D., et al., Human peripheral late/exhausted memory B cells express a senescent-
associated secretory phenotype and preferentially utilize metabolic signaling pathways.
Experimental Gerontology, 2017. 87(Part A): p. 113-120.
478. Rajagopalan, S. and E.O. Long, Cellular senescence induced by CD158d reprograms natural
killer cells to promote vascular remodeling. Proceedings of the National Academy of
Sciences, 2012. 109(50): p. 20596-20601.
479. d'Adda di Fagagna, F., Living on a break: cellular senescence as a DNA-damage response.
Nat Rev Cancer, 2008. 8(7): p. 512-522.
480. Rossiello, F., et al., Irreparable telomeric DNA damage and persistent DDR signalling as a
shared causative mechanism of cellular senescence and ageing. Curr Opin Genet Dev, 2014.
26: p. 89-95.
481. Kunisada, M., et al., Increased Expression of Versican in the Inflammatory Response to UVB-
and Reactive Oxygen Species-Induced Skin Tumorigenesis. The American Journal of
Pathology, 2011. 179(6): p. 3056-3065.
482. Wight, T.N., I. Kang, and M.J. Merrilees, Versican and the control of inflammation. Matrix
Biology, 2014. 35(Supplement C): p. 152-161.
483. Wu, Y., et al., Versican protects cells from oxidative stress-induced apoptosis. Matrix
Biology, 2005. 24(1): p. 3-13.
484. Ricciardelli, C., et al., The biological role and regulation of versican levels in cancer. Cancer
and Metastasis Reviews, 2009. 28(1): p. 233.
485. Rahmani, M., et al., Versican: signaling to transcriptional control pathwaysThis paper is one
of a selection of papers published in this Special Issue, entitled Young Investigator's Forum.
Canadian Journal of Physiology and Pharmacology, 2006. 84(1): p. 77-92.
486. Burgess, J.K., et al., A phosphodiesterase 4 inhibitor inhibits matrix protein deposition in
airways in vitro. Journal of Allergy and Clinical Immunology, 2006. 118(3): p. 649-657.
487. Todorova, L., et al., Lung Fibroblast Proteoglycan Production Induced by Serum Is Inhibited
by Budesonide and Formoterol. American Journal of Respiratory Cell and Molecular Biology,
2006. 34(1): p. 92-100.
488. Venkitaraman, A.R., Cancer Susceptibility and the Functions of BRCA1 and BRCA2. Cell,
2002. 108(2): p. 171-182.
489. Roy, R., J. Chun, and S.N. Powell, BRCA1 and BRCA2: different roles in a common pathway
of genome protection. Nature reviews. Cancer, 2012. 12(1): p. 68-78.
490. Foulkes, W.D. and A.Y. Shuen, In Brief: BRCA1 and BRCA2. The Journal of Pathology,
2013. 230(4): p. 347-349.
491. Howe, D. and C. Lynas, The cyclin D1 alternative transcripts [a] and [b] are expressed in
normal and malignant lymphocytes and their relative levels are influenced by the
polymorphism at codon 241. Haematologica, 2001. 86(6): p. 563-569.
492. Kaplan, D., et al., D cyclins in lymphocytes. Cytometry Part A, 2005. 63A(1): p. 1-9.
493. Stewart, A.G., et al., β2-Adrenergic Receptor Agonists and cAMP Arrest Human Cultured
Airway Smooth Muscle Cells in the G<sub>1</sub> Phase of the Cell Cycle: Role of
Proteasome Degradation of Cyclin D1. Molecular Pharmacology, 1999. 56(5): p. 1079-1086.
494. L'Allemain, G., et al., Cyclin D1 expression is a major target of the cAMP-induced inhibition
of cell cycle entry in fibroblasts. Oncogene, 1997. 14: p. 1981.
References
197
495. Erickson, S., et al., Involvement of the Ink4 proteins p16 and p15 in T-lymphocyte senescence.
Oncogene, 1998. 17: p. 595.
496. Menzel, O., et al., Mechanisms Regulating the Proliferative Potential of Human
CD8<sup>+</sup> T Lymphocytes Overexpressing Telomerase. The Journal of
Immunology, 2006. 177(6): p. 3657-3668.
497. Effros, R., Z. Xm, and R. L Walford, Stress Response of Senescent T Lymphocytes Reduced
hsp70 Is Independent of the Proliferative Block. Vol. 49. 1994. B65-70.
498. Rea, I.M., S. McNerlan, and A.G. Pockley, Serum heat shock protein and anti-heat shock
protein antibody levels in aging. Experimental Gerontology, 2001. 36(2): p. 341-352.
499. Effros, R.B., Replicative senescence in the immune system: impact of the Hayflick limit on T-
cell function in the elderly. American Journal of Human Genetics, 1998. 62(5): p. 1003-1007.
500. Adibzadeh, M., et al., Lifespans of T lymphocytes. Mechanisms of Ageing and Development,
1996. 91(2): p. 145-154.
501. K., G.-L.B.L.H.T., Long-Term in vitro Growth of Human T Cell Clones: Can Postmitotic
‘Senescent’ Cell Populations Be Defined? Int Arch Allergy Immunol, 1994. 104: p. 7.
502. Fischer, M.J.E., et al., Effect of albumin on adenylate cyclase receptor-related signal
transduction of human peripheral blood mononuclear cells. Biochemical Pharmacology,
1992. 44(2): p. 351-358.
503. Nayak, A.S., et al., The Effect of Various Additives on the Stability of Isoproterenol
Hydrochloride Solutions. Drug Development and Industrial Pharmacy, 1986. 12(4): p. 589-
601.
504. Siva, S., et al., Absorption and fluorescence spectral characteristics of norepinephrine,
epinephrine, isoprenaline, methyl dopa, terbutaline and orciprenaline drugs. Vol. 50. 2012.
434-452.
505. Halliwell, B., Cell Culture, Oxidative Stress, and Antioxidants: Avoiding Pitfalls. biomed J,
2014. 37: p. 6.
506. Clement, M.-V., et al., The cytotoxicity of dopamine may be an artefact of cell culture. Journal
of Neurochemistry, 2002. 81(3): p. 414-421.
507. Lewinska, A., et al., TOTAL ANTI-OXIDANT CAPACITY OF CELL CULTURE MEDIA.
Clinical and Experimental Pharmacology and Physiology, 2007. 34(8): p. 781-786.
508. Watson, J.D. and F.H.C. Crick, Molecular Structure of Nucleic Acids: A Structure for
Deoxyribose Nucleic Acid. Nature, 1953. 171(4356): p. 737-738.
509. Ames, B.N., M.K. Shigenaga, and T.M. Hagen, Oxidants, antioxidants, and the degenerative
diseases of aging. Proceedings of the National Academy of Sciences of the United States of
America, 1993. 90(17): p. 7915-7922.
510. Helbock, H.J., et al., DNA oxidation matters: The HPLC–electrochemical detection assay of
8-oxo-deoxyguanosine and 8-oxo-guanine. Proceedings of the National Academy of Sciences
of the United States of America, 1998. 95(1): p. 288-293.
511. Lindahl, T. and B. Nyberg, Rate of depurination of native deoxyribonucleic acid.
Biochemistry, 1972. 11(19): p. 3610-3618.
512. Lindahl, T., Instability and decay of the primary structure of DNA. Nature, 1993. 362(6422):
p. 709-715.
513. Lindahl, T. and O. Karlstrom, Heat-induced depyrimidination of deoxyribonucleic acid in
neutral solution. Biochemistry, 1973. 12(25): p. 5151-5154.
514. Mullaart, E., et al., DNA damage metabolism and aging. Mutation Research/DNAging, 1990.
237(5): p. 189-210.
515. Carol Bernstein, A.R.P., Valentine Nfonsam, Harris Bernstein, DNA Damage, DNA Repair
and Cancer. New Research Directions in DNA Repair, 2013.
516. Haber, J.E., DNA recombination: the replication connection. Trends in Biochemical Sciences,
1999. 24(7): p. 271-275.
517. Ciccia, A. and S.J. Elledge, The DNA Damage Response: Making it safe to play with knives.
Molecular cell, 2010. 40(2): p. 179-204.
518. Barnes, D.E. and T. Lindahl, Repair and Genetic Consequences of Endogenous DNA Base
Damage in Mammalian Cells. Annual Review of Genetics, 2004. 38(1): p. 445-476.
References
198
519. Ward, J.F., DNA Damage Produced by Ionizing Radiation in Mammalian Cells: Identities,
Mechanisms of Formation, and Reparability, in Progress in Nucleic Acid Research and
Molecular Biology, E.C. Waldo and M. Kivie, Editors. 1988, Academic Press. p. 95-125.
520. Hoeijmakers , J.H.J., DNA Damage, Aging, and Cancer. New England Journal of Medicine,
2009. 361(15): p. 1475-1485.
521. Mangerich, A., et al., Sulfur and nitrogen mustards induce characteristic poly(ADP-
ribosyl)ation responses in HaCaT keratinocytes with distinctive cellular consequences.
Toxicology Letters, 2016. 244: p. 56-71.
522. Wogan, G.N., et al., Environmental and chemical carcinogenesis. Seminars in Cancer
Biology, 2004. 14(6): p. 473-486.
523. De Bont, R. and N. van Larebeke, Endogenous DNA damage in humans: a review of
quantitative data. Mutagenesis, 2004. 19(3): p. 169-185.
524. Jackson, A.L. and L.A. Loeb, The contribution of endogenous sources of DNA damage to the
multiple mutations in cancer. Mutation Research/Fundamental and Molecular Mechanisms of
Mutagenesis, 2001. 477(1–2): p. 7-21.
525. Nakamura, J. and J.A. Swenberg, Endogenous Apurinic/Apyrimidinic Sites in Genomic DNA
of Mammalian Tissues. Cancer Research, 1999. 59(11): p. 2522-2526.
526. Valko, M., et al., Free radicals, metals and antioxidants in oxidative stress-induced cancer.
Chemico-biological interactions, 2006. 160(1): p. 40.
527. Ma, S.K.Y.H.S.P.N., Oxidative and nitrative DNA damage in animals and patients with
inflammatory diseases in relation to inflammation-related carcinogenesis. Biological
Chemistry, 2006.
528. Lonkar, P. and P.C. Dedon, Reactive species and DNA damage in chronic inflammation:
reconciling chemical mechanisms and biological fates. International Journal of Cancer.
128(9): p. 10.
529. Shen, Z., W. Wu, and S.L. Hazen, Activated Leukocytes Oxidatively Damage DNA, RNA, and
the Nucleotide Pool through Halide-Dependent Formation of Hydroxyl Radical.
Biochemistry, 2000. 39(18): p. 5474-5482.
530. Jackson, S.P. and J. Bartek, The DNA-damage response in human biology and disease.
Nature, 2009. 461(7267): p. 1071-1078.
531. Harper, J.W. and S.J. Elledge, The DNA Damage Response: Ten Years After. Molecular Cell,
2007. 28(5): p. 739-745.
532. Zhou, B.-B.S. and S.J. Elledge, The DNA damage response: putting checkpoints in
perspective. Nature, 2000. 408(6811): p. 433-439.
533. Hirao, A., et al., DNA Damage-Induced Activation of p53 by the Checkpoint Kinase Chk2.
Science, 2000. 287(5459): p. 1824-1827.
534. Cimprich, K.A. and D. Cortez, ATR: an essential regulator of genome integrity. Nat Rev Mol
Cell Biol, 2008. 9(8): p. 616-627.
535. Meek, K., V. Dang, and S.P. Lees-Miller, Chapter 2 DNA-PK. Advances in Immunology,
2008. 99: p. 33-58.
536. Cortez, D., et al., Requirement of ATM-Dependent Phosphorylation of Brca1 in the DNA
Damage Response to Double-Strand Breaks. Science, 1999. 286(5442): p. 1162-1166.
537. Maréchal, A. and L. Zou, DNA Damage Sensing by the ATM and ATR Kinases. Cold Spring
Harbor Perspectives in Biology, 2013. 5(9).
538. Schreiber, V., et al., Poly(ADP-ribose): novel functions for an old molecule. Nat Rev Mol Cell
Biol, 2006. 7(7): p. 517-528.
539. Matsuoka, S., et al., ATM and ATR Substrate Analysis Reveals Extensive Protein Networks
Responsive to DNA Damage. Science, 2007. 316(5828): p. 1160-1166.
540. Christmann, M., et al., Mechanisms of human DNA repair: an update. Toxicology, 2003.
193(1–2): p. 3-34.
541. Helleday, T., S. Eshtad, and S. Nik-Zainal, Mechanisms underlying mutational signatures in
human cancers. Nat Rev Genet, 2014. 15(9): p. 585-598.
542. Figueroa-González, G. and C. Pérez-Plasencia, Strategies for the evaluation of DNA damage
and repair mechanisms in cancer. Oncology Letters, 2017. 13(6): p. 3982-3988.
543. Kumari S, R.R., Singh KL, Singh SP, Sinha RP, DNA damage: detection strategies. EXCLI
Journal, 2008. 7: p. 18.
References
199
544. Grimaldi, K.A., et al., PCR-based methods for detecting DNA damage and its repair at the
sub-gene and single nucleotide levels in cells. Molecular Biotechnology, 2002. 20(2): p. 181-
196.
545. Van Houten, B., S. Cheng, and Y. Chen, Measuring gene-specific nucleotide excision repair
in human cells using quantitative amplification of long targets from nanogram quantities of
DNA. Mutation Research/DNA Repair, 2000. 460(2): p. 81-94.
546. Rogakou, E.P., et al., Megabase Chromatin Domains Involved in DNA Double-Strand Breaks
in Vivo. The Journal of Cell Biology, 1999. 146(5): p. 905-916.
547. Gorczyca, W., et al., Presence of DNA Strand Breaks and Increased Sensitivity of DNA in Situ
to Denaturation in Abnormal Human Sperm Cells: Analogy to Apoptosis of Somatic Cells.
Experimental Cell Research, 1993. 207(1): p. 202-205.
548. Loo, D.T., TUNEL Assay, in In Situ Detection of DNA Damage: Methods and Protocols, V.V.
Didenko, Editor. 2002, Humana Press: Totowa, NJ. p. 21-30.
549. Levsky, J.M. and R.H. Singer, Fluorescence in situ hybridization: past, present and future.
Journal of Cell Science, 2003. 116(14): p. 2833-2838.
550. Murthy, S.K. and D.J. Demetrick, New Approaches to Fluorescence In Situ Hybridization, in
Cell Imaging Techniques: Methods and Protocols, D.J. Taatjes and B.T. Mossman, Editors.
2006, Humana Press: Totowa, NJ. p. 237-259.
551. Sestili, P. and O. Cantoni, Osmotically driven radial diffusion of single-stranded DNA
fragments on an agarose bed as a convenient measure of DNA strand scission. Free Radical
Biology and Medicine, 1999. 26(7): p. 1019-1026.
552. Sestili, P., The Fast-Halo Assay for the Assessment of DNA Damage at the Single-Cell Level,
in DNA Replication: Methods and Protocols, S. Vengrova and J.Z. Dalgaard, Editors. 2009,
Humana Press: Totowa, NJ. p. 517-533.
553. Ostling, O. and K.J. Johanson, Microelectrophoretic study of radiation-induced DNA damages
in individual mammalian cells. Biochemical and Biophysical Research Communications,
1984. 123(1): p. 291-298.
554. Singh, N.P., et al., A simple technique for quantitation of low levels of DNA damage in
individual cells. Experimental Cell Research, 1988. 175(1): p. 184-191.
555. Hartmann, A., et al., Recommendations for conducting the in vivo alkaline Comet assay.
Mutagenesis, 2003. 18(1): p. 45-51.
556. Azqueta, A., et al., Towards a more reliable comet assay: Optimising agarose concentration,
unwinding time and electrophoresis conditions. Mutation Research/Genetic Toxicology and
Environmental Mutagenesis, 2011. 724(1): p. 41-45.
557. Kent, C.R.H., et al., The Comet Moment as a Measure of DNA Damage in the Comet Assay.
International Journal of Radiation Biology, 1995. 67(6): p. 655-660.
558. Forchhammer, L., et al., Variation in the measurement of DNA damage by comet assay
measured by the ECVAG† inter-laboratory validation trial. Mutagenesis, 2010. 25(2): p. 113-
123.
559. Collins, A.R., et al., The comet assay: topical issues. Mutagenesis, 2008. 23(3): p. 143-151.
560. Møller, P., et al., On the search for an intelligible comet assay descriptor. Frontiers in
Genetics, 2014. 5: p. 217.
561. Measurement of DNA oxidation in human cells by chromatographic and enzymic methods.
Free Radical Biology and Medicine, 2003. 34(8): p. 1089-1099.
562. Gedik, C.M. and A. Collins, Establishing the background level of base oxidation in human
lymphocyte DNA: results of an interlaboratory validation study. The FASEB Journal, 2004.
19(1): p. 82-84.
563. Collins, A.R. and A. Azqueta, DNA repair as a biomarker in human biomonitoring studies;
further applications of the comet assay. Mutation Research/Fundamental and Molecular
Mechanisms of Mutagenesis, 2012. 736(1): p. 122-129.
564. Andrew R. Collins, M.D.a.A.H., Detection of alkylation damage in human lymphocyte DNA
with the comet assay. Acta Biochimica Polonica, 2001. 48(3): p. 4.
565. Ersson, C. and L. Möller, The effects on DNA migration of altering parameters in the comet
assay protocol such as agarose density, electrophoresis conditions and durations of the
enzyme or the alkaline treatments. Mutagenesis, 2011. 26(6): p. 689-695.
References
200
566. Uno, Y., H. Kojima, and M. Hayashi, The JaCVAM-organized international validation study
of the in vivo rodent alkaline comet assay. Mutation Research/Genetic Toxicology and
Environmental Mutagenesis, 2015. 786-788: p. 2.
567. Morita, T., et al., The JaCVAM international validation study on the in vivo comet assay:
Selection of test chemicals. Mutation Research/Genetic Toxicology and Environmental
Mutagenesis, 2015. 786-788: p. 14-44.
568. Uno, Y., et al., JaCVAM-organized international validation study of the in vivo rodent
alkaline comet assay for the detection of genotoxic carcinogens: I. Summary of pre-validation
study results. Mutation Research/Genetic Toxicology and Environmental Mutagenesis, 2015.
786-788: p. 3-13.
569. Uno, Y., et al., JaCVAM-organized international validation study of the in vivo rodent
alkaline comet assay for detection of genotoxic carcinogens: II. Summary of definitive
validation study results. Mutation Research/Genetic Toxicology and Environmental
Mutagenesis, 2015. 786-788: p. 45-76.
570. OECD, Test No. 489: In Vivo Mammalian Alkaline Comet Assay. 2014.
571. Moreno-Villanueva, M., et al., A modified and automated version of the 'Fluorimetric
Detection of Alkaline DNA Unwinding' method to quantify formation and repair of DNA
strand breaks. BMC Biotechnology, 2009. 9(1): p. 39.
572. Birnboim, H.C. and J.J. Jevcak, Fluorometric Method for Rapid Detection of DNA Strand
Breaks in Human White Blood Cells Produced by Low Doses of Radiation. Cancer Research,
1981. 41(5): p. 1889-1892.
573. Junk, M., et al., Mathematical modelling of the automated FADU assay for the quantification
of DNA strand breaks and their repair in human peripheral mononuclear blood cells. BMC
Biophysics, 2014. 7(1): p. 9.
574. Moreno-Villanueva, M., Automatisierte Quantifizierung von DNA-Schädigung und DNA-
Reperatur und deren Anwendung in der Genetischen Toxikologie und Alternsforschung. 2007.
575. Riss TL, M.R., Niles AL, Cell Viability Assays. Eli Lilly & Company and the National Center
for Advancing Translational Sciences, 2013, [Updated 2016 Jul 1].
576. Foster, K.A., et al., Characterization of the A549 Cell Line as a Type II Pulmonary Epithelial
Cell Model for Drug Metabolism. Experimental Cell Research, 1998. 243(2): p. 359-366.
577. Fowler, P., et al., Reduction of misleading (“false”) positive results in mammalian cell
genotoxicity assays. I. Choice of cell type. Mutation Research/Genetic Toxicology and
Environmental Mutagenesis, 2012. 742(1–2): p. 11-25.
578. Nandanuri, M.S.R. and C.S. Lange, Serum, Trypsin, and Cell Shape but Not Cell-to-Cell
Contact Influence the X-Ray Sensitivity of Chinese Hamster V79 Cells in Monolayers and in
Spheroids. Radiation Research, 1991. 127(1): p. 30-35.
579. Huang, H.-L., et al., Trypsin-induced proteome alteration during cell subculture in
mammalian cells. Journal of Biomedical Science, 2010. 17(1): p. 36-36.
580. Kirkland, D., et al., Recommended lists of genotoxic and non-genotoxic chemicals for
assessment of the performance of new or improved genotoxicity tests: A follow-up to an
ECVAM workshop. Mutation Research/Genetic Toxicology and Environmental Mutagenesis,
2008. 653(1–2): p. 99-108.
581. Garrido, J., E.M. Garrido, and F. Borges, Studies on the Food Additive Propyl Gallate:
Synthesis, Structural Characterization, and Evaluation of the Antioxidant Activity. Journal of
Chemical Education, 2012. 89(1): p. 130-133.
582. Medina, M.E., C. Iuga, and J.R. Alvarez-Idaboy, Antioxidant activity of propyl gallate in
aqueous and lipid media: a theoretical study. Physical Chemistry Chemical Physics, 2013.
15(31): p. 13137-13146.
583. Gunckel, S., et al., Antioxidant activity of gallates: an electrochemical study in aqueous
media. Chemico-Biological Interactions, 1998. 114(1): p. 45-59.
584. Stepanenko, A.A. and V.V. Dmitrenko, Pitfalls of the MTT assay: Direct and off-target effects
of inhibitors can result in over/underestimation of cell viability. Gene, 2015. 574(2): p. 193-
203.
585. Berridge, M.V., P.M. Herst, and A.S. Tan, Tetrazolium dyes as tools in cell biology: New
insights into their cellular reduction, in Biotechnology Annual Review. 2005, Elsevier. p. 127-
152.

Danksagung
201
Danksagung
Zuerst möchte ich mich bei meinem Doktorvater Alexander Bürkle bedanken für die Möglichkeit bei
ihm zu promovieren und mir dabei die außergewöhnliche Möglichkeit bot angewandte Forschung und
Grundlagenforschung zu kombinieren. Dabei stand er mir immer mir Rat und Tat zur Seite.
Zudem danke ich Prof. Dr. Markus Christmann herzlichst für die Erstellung des Zweitgutachtens.
Ganz besonders möchte ich mich bei Dr. Maria Moreno-Villanueva bedanken für die Möglichkeit an
den interessanten Projekten zu arbeiten und die vielen „out of the Box“ Ideen. Außerdem für die vielen
und langen wissenschaftlichen Diskussionen und Gespräche, die großartige Betreuung und
Motivation, inklusive Standleitung nach Houston.
Zudem gebührt mein Dank meinem Thesis Komitee, bestehend aus Prof. Dr. Alexander Bürkle, Prof.
Dr. Valentin Wittmann und Prof. Dr. Christof Hauck.
Bedanken möchte ich mich auch aufs insbesondere bei der Cetics GmbH für die Finanzierung des
Promotionsprojektes. Bei unseren Kooperationspartner bei der Cetics GmbH Dr. Marcel Pilartz, Dr.
Inka Pfitzner und Dr. Karin Engelhart. Ebenso möchte ich mich bei unseren Kooperationspartner am
EMPA bedanken Dr. Peter Wick und Dr. Cordula Hirsch.
Einen ganz besonderen Dank schulde ich Anita, Mara, Tamara und Isabell die Ihre Masterarbeit am
selben Projekt durchgeführt haben und für den ein oder anderen Blödsinn zwischen durch zu haben
waren.
Ganz besonderen Dank schulde ich Monika, Gudrun, Thilo, Walli und Claudia für das Blutabnehmen,
die Aufreinigung von Litern von Blut, technischer Unterstützung und Hilfe bei administrativen
Dingen. Und für den ein oder anderen Blödsinn im Labor oder beim Essen.
Für die vielen wissenschaftlichen und nicht wissenschaftlichen Diskussionen bedanke ich mich bei
Matze, Jan, Sebastian, Benny, Judy, Tapes, Annika, Party Arty, Julia und Aswin. Mein herzlichen
Dank geht auch an Matze, Jan, Sebastian, Party Arty, Julia, Tapes, Benny, Judy, Magda, Jenny, Lisa,
Irmela, Mariam und Andy für die vielen Aktivitäten außerhalb des Labors.
Bedanken möchte ich mich auch bei den vielen Studenten die an dem Projekt mitgearbeitet haben oder
den ein oder anderen Quatsch während ihrer Zeit im Labor mitgemacht haben Daisy, Alex, Martin,
Matze, Steffen, Schorsch, Xiau, Canesia und Victoria.
Andy und Claudia für ihr Feedback beim Schreiben der Thesis.
Der größte Dank gilt jedoch meiner Familie für die Unterstützung in jeglicher Hinsicht.