Education Lab
SELCO FOUNDATION -‐ www.selcofoundation.org
INVENTION EDUCATION: FACILITATOR’S MANUAL

1 | P a g e
Science Workbook Why science?
The science workbook is rolled out in the first phase of the Invention Education initiative, immediately as schools reopen, to introduce hands-‐on activities to children and help them develop observation, reasoning, analysis and application skills. We believe natural sciences are a concrete, complex and stimulating subject that allows young individuals to begin to understand and think critically about the world around them.
About the Science Workbook
The workbook contains 11 topics that span across the everyday science. It is made for the facilitator who is leading the activities and discussions proposed. Each module has certain specific learning objectives that are accomplished through the hands-‐on activities and discussions. The workbook also tries to correlate the concepts and learning to the curriculum prescribed by the state government of Karnataka. The general structure of a module/topic is shown below:
Module/Topic Learning objecHves
CorrelaHon to syllabus
Prior Assessment
AcHvity/Discussion • Materials required and instrucHons for the acHvity • ObjecHves of the acHvity/Discussion • ObservaHon and analysis sheet • Facilitator notes
Self assessment sheet

2 | P a g e
How to use each component in the module:
Learning Objectives: These objectives are meant for facilitators to know what they have to deliver to students and to check at the end of the module whether these learning objectives were accomplished.
Correlation to syllabus: Correlation to syllabus is provided so that it becomes easier for the schools to adopt the content.
Prior assessment sheet: The facilitators should give prior assessment sheet of a module/topic to the children a day before they start the activities of that particular module/topic. This sheet serves two purposes: One, to help the facilitators understand the current level of knowledge among the children on that particular topic and give them an idea of where to begin; two, it gets students start thinking about the topic a day before and hence sets their mind for the activities.
Activity/Discussions: Each topic accomplishes the learning objectives through hands-‐on activities and discussions. All the activities mentioned in this workbook are to be performed in a group consisting of at most 6 students. The facilitator has to group the students before they begin the activity. Each activity consists of:
i. Materials required and Instructions-‐ The facilitator should provide these sheets to the students before they start the activity. 8th and 7th grade students are supposed to read the instructions and then perform the activity, while for the 6th grade the facilitators can explain the instruction since according to our experience they slow in reading and comprehending.
Note: The facilitator can give the materials after they read the instructions because the students may not give complete attention to read the instructions if materials are given along with them.
ii. Objectives of the activity/discussion: The facilitator can check at the end of the session whether the objectives were accomplished.
iii. Observation and analysis sheet: The facilitators should give the observation and analysis sheets to the children when they perform the activity so that children can record the observations and analyze their findings.
iv. Facilitator notes: The facilitator can make use of these notes for the explanation that has to be given to the children for each activity. These notes will also help them connect the learnings from the activity to the daily life.
v. Self-‐assessment sheet: Facilitators should give these sheets to the children at end of the topic. This will help the facilitators and children assess how much they have learned from the topic/module.

3 | P a g e
Disclaimer and Feedback
This work is licensed under a Creative Commons Attribution 4.0 International License, SELCO Foundation.
The workbook has been developed with input from teachers and students, testing activities through classroom visits and focus groups, with the purpose of supporting hands-‐on learning and the development of critical thinking skills. We believe content should be dynamic and never be stagnant, and remain open to facilitator’s improvements and comments.
For feedback or collaboration please contact us at [email protected].
About the Educations Lab at SELCO Foundation
SELCO Foundation envisions a socially sustainable society, and seeks to create avenues for asset building, enhancement of quality of life and wealth creation that will uplift deprived sections of society through sustainable energy applications.
The Education Lab is a focus lab within SELCO Foundation that combines interventions with appropriate content and delivery in rural schools, colleges and vocational institutes to improve learning around sustainability and innovation. This is done through renewable energy installations at educational institutions, customized learning modules, workshops, outreach programs and student competitions. Education interventions are a platform for youth to understand and evaluate sustainable models and engage their communities to adopt sustainable practices.

4 | P a g e
Science Workbook
Contents NUTRITION ............................................................................................................................................. 5
CLIMATE CHANGE ................................................................................................................................ 19
AIR PRESSURE ...................................................................................................................................... 29
FLUIDS .................................................................................................................................................. 41
HEAT .................................................................................................................................................... 57
WATER ................................................................................................................................................. 68
MAGNETISM ........................................................................................................................................ 82
ELECTRICITY & ELECTROMAGNETISM .................................................................................................. 90
ENERGY EFFICIENCY ............................................................................................................................. 98
AGRICULTURE .................................................................................................................................... 101
LOCALLY AVAILABLE MATERIALS ....................................................................................................... 105

5 | P a g e
NUTRITION
Learning Outcomes
• Major nutrients & their purposes • Nutrients present in commonly eaten foods • Knowing what constitutes a healthy diet • Concept of calories • Calculating the percentage error of an experimental result
Correlation with syllabus
• Nutrition – Gr. 6 Science • Measurement & Units – Gr. 6 Science & Math • Fractions & Decimals – Gr. 6 Math
Correlation with the Needs Assessment Toolkit
• Health & Sanitation
Lesson Outline (Time needed: 240 minutes – 4 sessions)
A] Prior Knowledge Assessment
B] Discussion 1 (30 minutes)
C] Discussion 2 (30 minutes)
D] Activity 1 (60 minutes)
E] Activity 2 (60 minutes)
F] Activity 3 (60 minutes)
G] Project Ideas
Students should bring:
1. Commonly eaten food items

6 | P a g e
Project materials you should make available
• Activity 1 1. Different food items that the students will bring from their homes 2. Dilute iodine solution (if this isn’t available, you can get iodine tincture from the
hospital) 3. Water 4. Test tube (or a clean glass bowl) 5. Dropper 6. Copper sulphate solution 7. Caustic soda (Sodium hydroxide) • Activity 2 1. Test tube & holder 2. Thermometer & clamp 3. Matches 4. A packet of Lays 5. An shallow glass bowl that is heat resistant (evaporating dish) 6. A measuring cup
At the end of the session, please collect the students’ journals and go through their work.

7 | P a g e
A] Prior Knowledge Assessment
To be done during the previous week.
Please answer the following questions in your journal.
1) Draw an idea wheel of the nutrients that you know about.
2) Make a table of what you eat for each meal during the coming week and mark what nutrients are present in the different parts of your meal.
Meal Monday Tuesday Wednesday Thursday Friday Saturday Sunday Breakfast Lunch Dinner Snacks
B] Discussion 1
Time needed: 30 minutes
Time breakup:
1. Discussion – 20 minutes 2. Assessment – 10 minutes
Objective: To understand the purpose of each nutrient and to identify the nutrients present in commonly eaten foods
Guiding Questions (~15 minutes):
1. What do you and your parents eat in the morning before a hard day’s work? Why? 2. Why do you drink Glucose water during your school sports day or when you get
dehydrated? What nutrients are present in glucose water? 3. Should you include lentils (dal)/eggs/meat in your meals on a regular basis? Why? 4. Why should you eat fruits and vegetables every day? 5. Why should you drink milk every day? 6. Why should you eat bananas, banana stem etc. if you are constipated?
Alternative suggestion: Instead of having a class discussion, you can ask the students to form groups named after each nutrient. And you can give each group specific guiding questions.
Please look at the next page for the student assessment at the end of this discussion.
8 | P a g e
Facilitator Notes
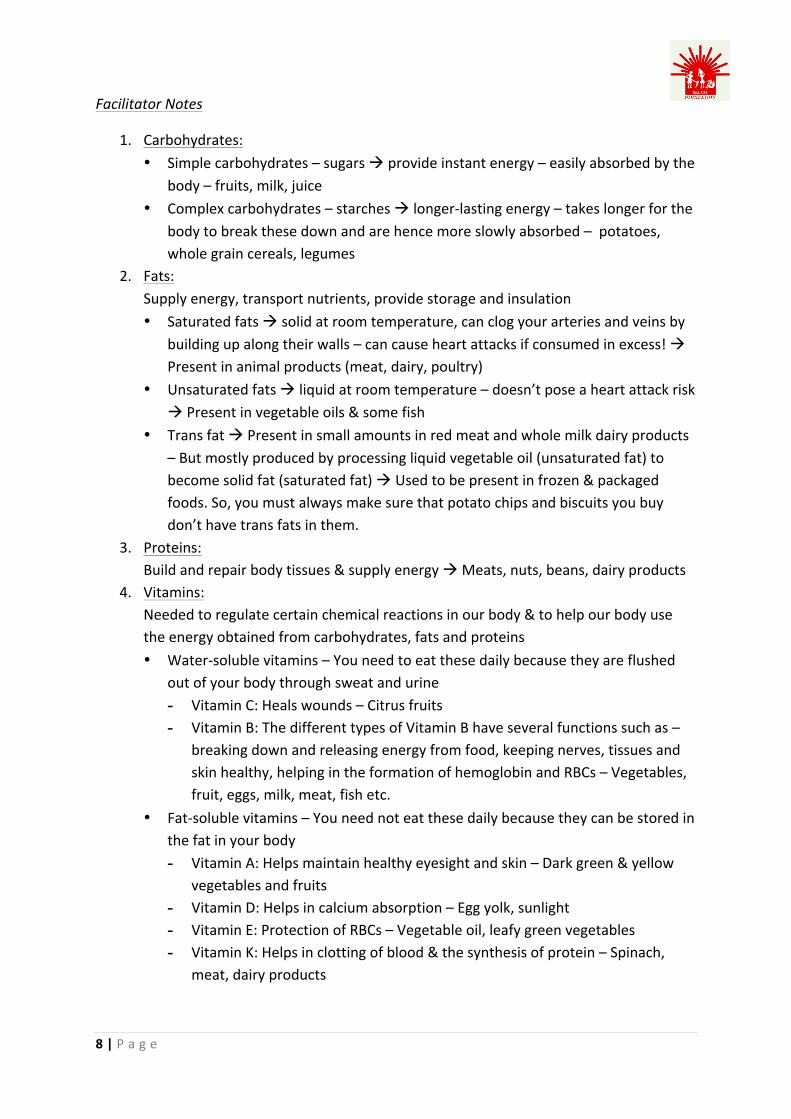
1. Carbohydrates: • Simple carbohydrates – sugars à provide instant energy – easily absorbed by the
body – fruits, milk, juice • Complex carbohydrates – starches à longer-‐lasting energy – takes longer for the
body to break these down and are hence more slowly absorbed – potatoes, whole grain cereals, legumes
2. Fats: Supply energy, transport nutrients, provide storage and insulation • Saturated fats à solid at room temperature, can clog your arteries and veins by
building up along their walls – can cause heart attacks if consumed in excess! à Present in animal products (meat, dairy, poultry)
• Unsaturated fats à liquid at room temperature – doesn’t pose a heart attack risk à Present in vegetable oils & some fish
• Trans fat à Present in small amounts in red meat and whole milk dairy products – But mostly produced by processing liquid vegetable oil (unsaturated fat) to become solid fat (saturated fat) à Used to be present in frozen & packaged foods. So, you must always make sure that potato chips and biscuits you buy don’t have trans fats in them.
3. Proteins: Build and repair body tissues & supply energy à Meats, nuts, beans, dairy products
4. Vitamins: Needed to regulate certain chemical reactions in our body & to help our body use the energy obtained from carbohydrates, fats and proteins • Water-‐soluble vitamins – You need to eat these daily because they are flushed
out of your body through sweat and urine - Vitamin C: Heals wounds – Citrus fruits - Vitamin B: The different types of Vitamin B have several functions such as –
breaking down and releasing energy from food, keeping nerves, tissues and skin healthy, helping in the formation of hemoglobin and RBCs – Vegetables, fruit, eggs, milk, meat, fish etc.
• Fat-‐soluble vitamins – You need not eat these daily because they can be stored in the fat in your body - Vitamin A: Helps maintain healthy eyesight and skin – Dark green & yellow
vegetables and fruits - Vitamin D: Helps in calcium absorption – Egg yolk, sunlight - Vitamin E: Protection of RBCs – Vegetable oil, leafy green vegetables - Vitamin K: Helps in clotting of blood & the synthesis of protein – Spinach,
meat, dairy products

9 | P a g e
5. Minerals: • Calcium – Helps build strong bones & teeth – Milk & dairy products • Iron – Helps in the production of RBCs – Meat, fish, spinach • Potassium – Facilitates normal muscle growth, healthy brain function – Bananas,
spinach, raisins • Sodium – Regulates blood pressure, helps maintain water levels in the body and
a healthy nervous system – Salt, fruits 6. Water:
Helps in digestion of food, carrying nutrients to different parts of the body, helps regulate body temperature through perspiration – water, milk, some fruits
7. Fibers: • Soluble fibers – Can be digested by your body – Helps reduce the amount of
cholesterol in your blood – Makes you less prone to constipation – Oats, barley, fruits like bananas, apples, root vegetables
• Insoluble fibers – Can’t be digested by your body – Passes through your digestive system without being broken down and helps other foods move through your digestive system more easily – bran, nuts, seeds
Please answer the following questions in your journal:
1. Pick any 3 nutrients you like and fill out the following table: Nutrient Purpose (how does it help
our body?) Food item that contains this nutrient
C] Discussion 2
Time needed: 30 minutes
Time breakup:
1. Discussion – 15 minutes 2. Analysis – 15 minutes
Note: Put up a copy of a food pyramid where everyone can see (the food pyramid is to be prepared by the facilitator).
Objective: To understand what constitutes a healthy diet

10 | P a g e
Guiding Questions:
1. Which foods should you avoid eating in excess? 2. What are calories? (Maybe show them the calorie ratings on a packet of biscuits or
Lays). How do our bodies use up the calories from food? 3. Will an adolescent boy need more calories than an adolescent girl? Why? 4. Will you need to intake more calories and proteins if you are active? 5. Why is better to snack on vegetables, fruits or nuts than on biscuits, chips etc?
Please look at the next page for the student assessment for this activity.
Facilitator Notes
Calories:
Calorie is a unit of energy, just like how meters and centimeters are units of length. Calorie intake refers to the amount of energy you consume through the foods you eat. Below is the calorie content of 1 gram of the main nutrients:
• 1 gram of Carbohydrates – 4 calories • 1 gram of Protein – 4 calories • 1 gram of Fat – 9 calories
When you have an active lifestyle (you play, dance, cycle, participate in sports, help your parents in the field and at home), you “burn” calories – that is you use up some of your calories.
If you are a boy, you will need around 1800-‐2200 calories per day, depending on how active you are (more calories if you’re more active!).
If you are a girl, you will need around 1600-‐2000 calories per day, depending on how active you are.
Please answer the following questions in your journal:
a. Draw a plate and mark the nutrients you should include in your meal in different pies. If you need more of a certain nutrient, make that pie bigger.
b. What happens if your food doesn’t have all the nutrients? c. Write down one question you have that this discussion didn’t answer.

11 | P a g e
D] Activity 1
Time needed: 60 minutes
Time breakup:
1. Performing tests & recording observations and inferences – 30 minutes 2. Discussion – 30 minutes
Objective: To test for starches, proteins & fats
Now, the students will perform the experiment & record their observations & inferences.
After the finish the experiment: Have a discussion about the inferences that the students noted down, guiding the class towards the correct inference. Also, discuss any other questions that the students might have.
At the end of the activity: Please ask each student to complete a write-‐about on a blank sheet of paper & collect it.
Facilitator Notes
1. Test for starches – If starch is present, the mixture turns blue-‐black 2. Test for proteins – If the proteins are present, the mixture turns violet 3. Test for fats – If the food contains fat, you will see a translucent oily patch on the
paper. To make sure that it isn’t water from the food, let the paper sit for a while. If the patch was due to water, it should have dried up now. If not, the patch is due to the fat content in the food.
Note: Details regarding the chemical reactions taking place aren’t given because knowledge of organic chemistry is required.
Materials Required:
1. Different food items that the students will bring from their homes 2. Dilute iodine solution (if this isn’t available, you can get iodine tincture from the
hospital) 3. Water 4. Test tube (or a clean glass bowl) 5. Dropper 6. Copper sulphate solution 7. Caustic soda (sodium hydroxide)

12 | P a g e
Instructions:
1. Fats
Take a small bit of food you want to test and wrap it in a piece of paper and crush it. Take the food off the paper and allow the paper to sit for a while (check it after you finish the next two tests). Observations (note down answers to the following in your journal):
a. How do your fingers feel after touching the food item? b. Fill the following table:
Food item being tested
What do you observe just after taking the food off the paper?
What do you observe after letting the paper sit for a while?
c. If your observations in the 2nd and 3rd columns are different, why do you think this is so?
2. Starches
Take the food item you want to test and put a few drops of dilute iodine solution. (If iodine solution/tincture is not available then it can also be prepared by adding dilute nitric acid to the solution of potassium iodide.)
Observations (please note down in your journal):
a. Color of the iodine solution b. Fill the following table
Food item being tested What happens when you add iodine
solution to the food?

13 | P a g e
3. Proteins
If the food you want to test is solid, make it into a powder or paste. Put some in a clean test tube and add 8-‐10 drops of water and shake well. Using a dropper, add 5 drops of caustic soda and 5 drops of copper sulphate solution. Shake well and wait for a few minutes. Observations (note down the following in your journal):
a. Color of copper sulphate solution b. Color of caustic soda c. Fill the following table;
Food item being tested What happens at the end of the experiment?
Inferences:
Fill the following table:
Food item tested Nutrients present
a. Do your inferences make sense to you? b. Do you have any questions regarding the experiments?
E] Activity 2
Time needed: 60 minutes
Time breakup:
1. Preliminary Information -‐ 10 minutes 2. Performing the experiment & noting down observations and inferences – 30 minutes 3. Discussion & Final Assessment– 20 minutes
Objective:
1. To find out how much energy is produced by burning a food item. In this activity, the student will calculate the amount of energy in a potato chip.

14 | P a g e
2. To demonstrate that energy dissipated while burning a food item is absorbed by different components. (This Demonstrates that the energy that we get from the food is used up for chewing, digestion, Etc. apart from our physical activities)
Preliminary Information (you should explain the following information to the students before the activity begins):
• Remember that there are many quantities that you can measure. For instance, you have learned that you can measure the length of an object using units like meters, centimetres etc. Look at the markings on your ruler. What units are they in?
• Temperature is a way of measuring how hot or cold something is. • You can increase the temperature of an object by heating it. • Two ways of heating a body are: by putting it under the sun and by heating it on a
fire. Can you think of other ways to heat a body? If yes, write it down in your journal. Facilitators can give some examples of heating food, heating water etc.
• Temperature is measured in Celsius. For example, do you know what the normal body temperature is? It is around 37 oC. What happens to our body temperature when we get a fever?
• Do you know what energy is? For example, you need more energy to run than to walk. This is why you feel more tired when you run than when you walk.
• You also need energy to heat something (eg. boil water). This is why you have to use a fuel like firewood, kerosene or LPG for things like cooking, heating water etc.
• When you do work, you expend energy. • Did you know that energy can be measured? It is measured using many different
units. The unit we will be using in this class is “calories.” • In the previous discussion, you learnt that we get energy to perform various bodily
functions from the food we eat. You also learnt that this energy is measured in terms of calories.
• The definition of 1 calorie is: The amount of energy needed to increase the temperature of 1 gm of water by 1 ˚C.
• As you read before, heat is a form of energy. • Q = mc∆T, where Q is the heat energy released/absorbed, m is the mass of the
substance, c is a property of the substance called the specific heat and ∆T is change in the temperature of the substance.
• The value of c has been experimentally obtained for different substances • For distilled water, c = 1 calories/gram˚C
At the end: Discuss the inferences and ensure that the students are on the right track. Discuss any questions that may have come up while the activities were being done. Finally, ask each student to complete a write-‐about on a blank sheet of paper at the end of the activity & collect it.

15 | P a g e
Materials Needed:
1. Test tube & clamp 2. Thermometer & clamp 3. Matches 4. A packet of Lays 5. An shallow glass bowl that is heat resistant (evaporating dish) 6. A measuring cup
Procedure:
1. Suspend the potato chip above the evaporating dish using paper clips or metal wires. 2. Place the clips or the wires parallel to each other and suspend the potato chip in
between. 3. Estimate the mass of the potato chip, the evaporating dish and the paper clip or
wire. A reference you can use for estimation is: 1 gm of water = 1 ml of water since the density of water is 1gm/ml.
4. In the measuring cylinder, pour 20 ml of distilled water and place the test tube in the clamp. What is the mass of the water in the test tube? (Note to the facilitator: The facilitator needs to find out whether the students know the formula for finding the mass, given density and volume.)
5. Adjust the height of the clamp so that the potato chip is directly under it. Insert a thermometer in the water.
6. Record the initial temperature of the water 7. Set the potato chip on fire with a matchstick and quickly move the chip so that it is
directly under the water in the test tube. You are trying to ensure that as much heat from the burning chip as possible is used to heat up the water in the test tube.
8. With a glass rod, mix the water in the test tube so that the heat is distributed uniformly. Keep measuring the temperature of the water & make sure that you record the highest temperature that the water in the test tube attains.
9. Estimate the mass of the ash left behind in the evaporating dish from burning the potato chip.
Observations to be noted down in journal:
1. Mass of 15 ml of distilled water – 2. Mass of potato chip + evaporating dish + paper clip/wire before burning – 3. Mass of potato chip ash + evaporating dish + paper clip/wire after burning -‐ 4. Mass of the food that has been burnt – 5. Initial temperature of the water – 6. Final (highest recorded) temperature of the water –

16 | P a g e
7. Change in temperature of the water – 8. Number of calories absorbed by water (Note: we will assume that the heat absorbed
by the water came entirely from burning the potato chip) – 9. Number of calories in one serving of Lays (you can find it on the packet) –
Inferences:
1. Can energy exist in different forms? Yes/No 2. What form was the energy in the potato chip converted to? 3. What are the possible components in the above experiment that absorbed the
energy? 4. How much of the total energy was lost through other components? (Hint 1: Look at
the calorie content in a serving of Lays. This should be given on the packet. Note that one serving of Lays will have a different mass from the mass of one potato chip.)
5. What percentage of total energy was Lost? (Hint 2: % lost = !!!"#!$%&'( !"#$%&! !"#$% !!!" !!! !"# !"#! ! !"#$%&'$()*+ !"#$%&' !"#$% !!!" !"# !"#
!!!"#!$%&'( !"#$%&! !"#$% * 100)
6. What do the calorie ratings on food packets like Lays mean?
F] Activity 3
Time needed: 60 minutes
Objectives:
1. To be able to prepare a healthy diet chart consisting of locally available food 2. To explore if it is possible to substitute food items that are bought in shops with
locally grown or available food.
Notes to the facilitator:
After the students complete preparing a diet chart, please have a discussion based on the following points:
1. Compare what they had filled in the prior knowledge assessment sheet of their daily diet and this table and find out whether they are having a balanced diet?
2. Discuss if the food items they bought can be substituted with locally available food
3. Have a short discussion on the concept of long-‐term and short-‐term effects (look at Facilitator Notes)

17 | P a g e
This activity completes the Nutrition module. At the end of the module:
a) Each student should complete the Self-‐Assessment slip given on the next page b) Each group must fill the Graffiti wall (blackboard) with their inputs
Facilitator Notes
This is a good opportunity to introduce the students to the concept of having a good diet with food grown in the region.
You can give the students a hypothetical situation in which it is much cheaper to eat just unhealthy food [insert oily foods that are popular in the region].
___________________________________________________________________________
Complete the following activity in your journal:
Nutrient Locally available food that contains the nutrients.
Carbohydrate
Proteins
Fats
Vitamins
Minerals
Can you figure out the healthiest possible diet using locally available food? If you need to buy something, please indicate the cost of that item.
Meal Food you will include Nutrients present Estimate cost of the meal
Breakfast Lunch Dinner Snacks
___________________________________________________________________________
18 | P a g e
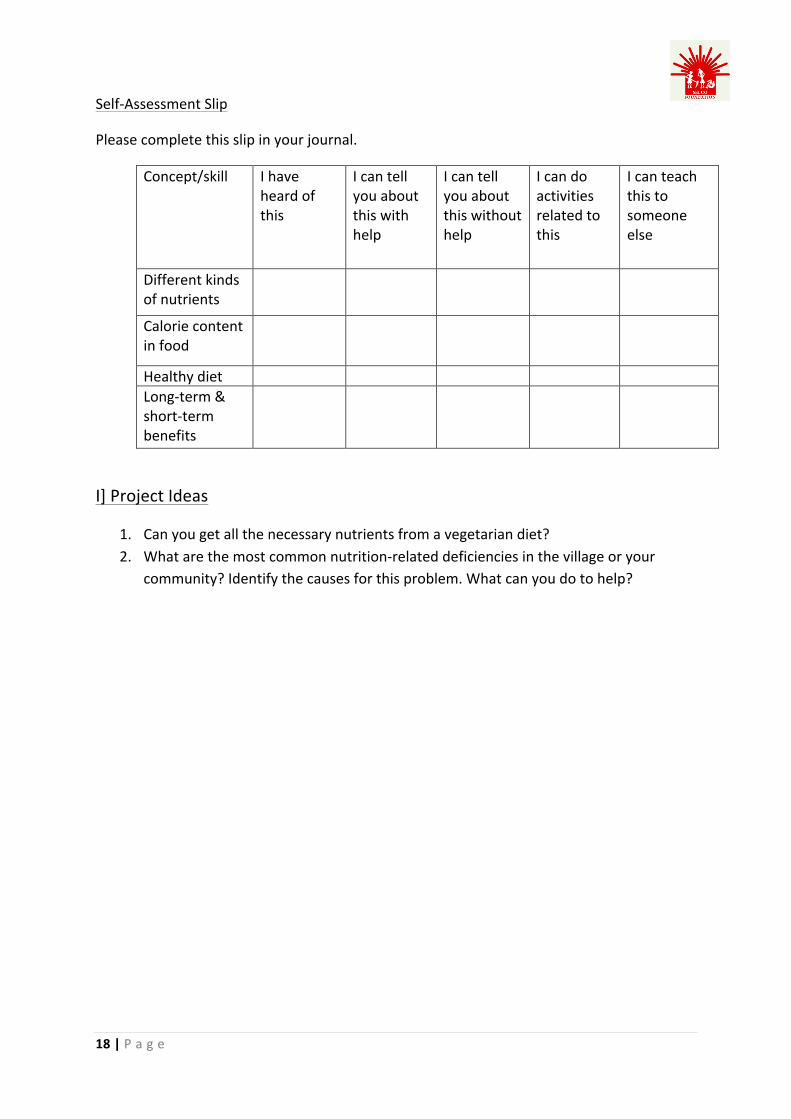
Self-‐Assessment Slip
Please complete this slip in your journal.
Concept/skill I have heard of this
I can tell you about this with help
I can tell you about this without help
I can do activities related to this
I can teach this to someone else
Different kinds of nutrients
Calorie content in food
Healthy diet Long-‐term & short-‐term benefits
I] Project Ideas
1. Can you get all the necessary nutrients from a vegetarian diet? 2. What are the most common nutrition-‐related deficiencies in the village or your
community? Identify the causes for this problem. What can you do to help?

19 | P a g e
CLIMATE CHANGE Note: This module focuses on human-‐induced climate change, the main effect being global warming.
Learning Outcomes
• Greenhouse effect and global warming • Carbon cycle • Atoms, molecules, chemical reactions & equations • Exothermic & endothermic reactions
Correlations with syllabus
• Photosynthesis -‐ Gr. 6 Science • Air & Atmosphere – Gr. 6 Science • Physical changes – Gr. 6 Science
Correlation with the Needs Assessment Toolkit
• Pollution • Energy
Lesson outline (Time needed: ~ 120 minutes)
A. Prior Knowledge Assessment (To be done before the session) B. Activity 1 (60 minutes) C. Activity 2 (20 minutes) D. Activity 3 (20 minutes) E. Activity 4 (20 minutes) F. Project ideas
Project materials you should make available
The following is a list of project materials that you should keep ready before the session begins, in the interest of time.
• Activity 2 – Understanding the carbon cycle a) Square pieces of paper (around 50) b) Colored chalk and markers c) An open space or an empty room d) A handful of sand or mud
At the end of the session, please collect the students’ journals and go through their work.

20 | P a g e
A] Prior Knowledge Assessment
To be done before the session
You should complete the following concept map to show what you already know about climate change. Fill the empty circles with thoughts that you associate with climate change. For example, you can fill the circles with causes and effects of climate change. An example – rising sea levels, which is an effect of climate change – has been given to help you get started. You can increase/decrease the number of empty bubbles given depending on how many thought you have!
Note to facilitator: Please explain how to make a concept map to the students if this is the first time they are making one.
B] Activity 1
Time needed: ~ 60 minutes
Objective: To understand the carbon cycle by playing a game
Step-‐by-‐step instructions for the game are given below. As the students play the game, you should explain various concepts (indicated in red) to them. The information for these explanations is given in the Supplementary Information section of this activity.
Materials needed:
1. Square pieces of paper (around 50) 2. Colored chalk and markers
Rising sea levels Climate
Change
21 | P a g e
3. An open space or an empty room 4. A handful of sand or mud
Step-‐by-‐step instructions for facilitators:
1. The carbon cycle is a cycle by which carbon is exchanged between different parts of the earth, such as living beings and the atmosphere. This cycle is crucial for the existence of life on Earth because most living organisms contain carbon molecules. And, the carbon cycle serves as a way to regulate the amount of carbon present on Earth. This has also become crucial for global warming because carbon dioxide is one of the main greenhouse gases.
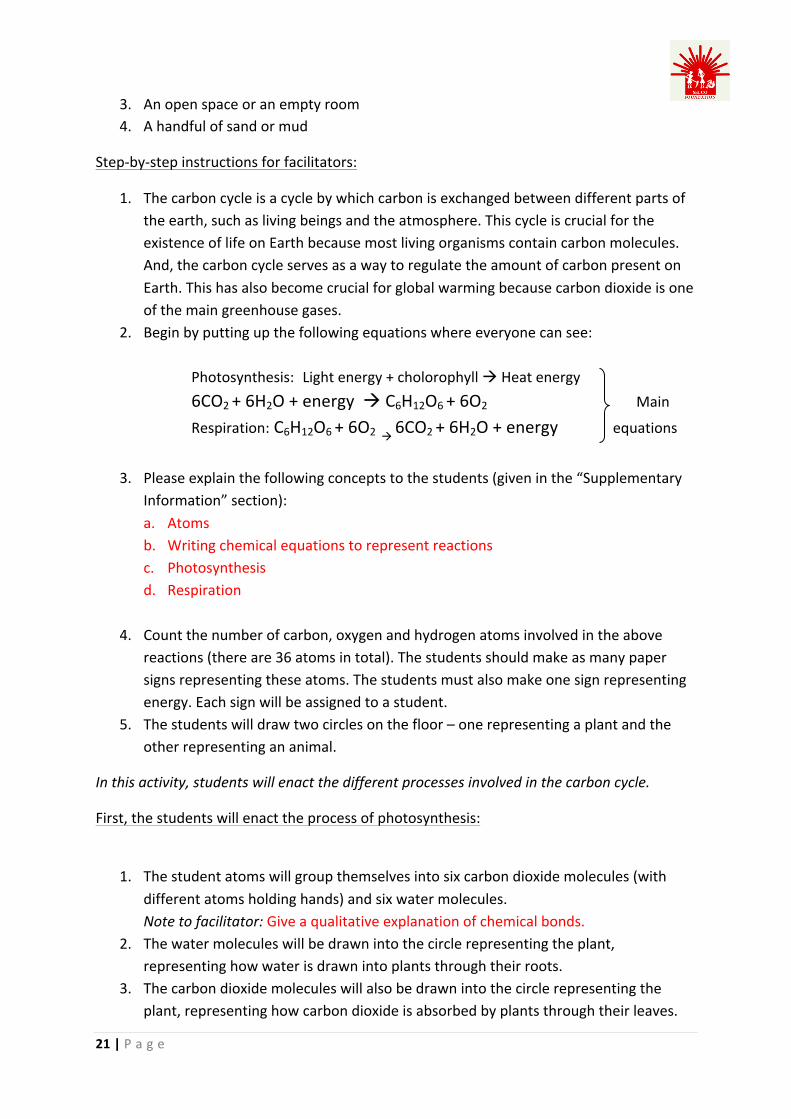
2. Begin by putting up the following equations where everyone can see:
Photosynthesis: Light energy + cholorophyll à Heat energy 6CO2 + 6H2O + energy à C6H12O6 + 6O2 Main
Respiration: C6H12O6 + 6O2 à 6CO2 + 6H2O + energy equations
3. Please explain the following concepts to the students (given in the “Supplementary Information” section): a. Atoms b. Writing chemical equations to represent reactions c. Photosynthesis d. Respiration
4. Count the number of carbon, oxygen and hydrogen atoms involved in the above reactions (there are 36 atoms in total). The students should make as many paper signs representing these atoms. The students must also make one sign representing energy. Each sign will be assigned to a student.
5. The students will draw two circles on the floor – one representing a plant and the other representing an animal.
In this activity, students will enact the different processes involved in the carbon cycle.
First, the students will enact the process of photosynthesis:
1. The student atoms will group themselves into six carbon dioxide molecules (with
different atoms holding hands) and six water molecules. Note to facilitator: Give a qualitative explanation of chemical bonds.
2. The water molecules will be drawn into the circle representing the plant, representing how water is drawn into plants through their roots.
3. The carbon dioxide molecules will also be drawn into the circle representing the plant, representing how carbon dioxide is absorbed by plants through their leaves.

22 | P a g e
4. Now, the student playing energy’s role will break the bonds of the carbon dioxide and water molecules, by pulling the hands apart. Note to facilitator: Explain how it takes energy to break bonds.
5. Now, the atoms will regroup themselves into sugar and oxygen molecules according to the photosynthesis equation you have put up.
6. The children playing the oxygen molecule can go out of the plant circle indicating the fact that plants give out oxygen used for respiration.
Now, the process of photosynthesis is complete. The next steps are those of an animal eating the plant and respiration.
The students will enact the animal eating the plant & the process of respiration:
1. The molecules in the plant circle pretend that they are being eaten by the animal by entering the animal circle. Note to facilitator: Explain to the students that this is one of the ways in which animals get glucose (relate to what they learnt in the nutrition session).
2. Now, new oxygen molecules will enter the animal, representing the fact that the animals are inhaling oxygen.
3. Now, have the students regroup themselves as carbon dioxide and water molecules, with energy being released. Note to facilitator: Explain endothermic & exothermic reactions.
4. Energy is used up by the animal for various bodily functions. So, the energy eventually leaves the animal. Water is released from the animal in the form of sweat or urine, while carbon dioxide is exhaled by the animal.
5. The children playing the carbon dioxide molecule can go out of the animal circle indicating the fact that animals give out carbon dioxide.
Next, we will extend the above activity to understand the carbon cycle better:
1. Also discuss with the students how the creation of carbon dioxide is itself an
exothermic reaction, and hence releases some heat into the atmosphere. 2. In addition, carbon dioxide is a greenhouse gas (please check if the students know
what a greenhouse gas is), which means that the carbon dioxide released acts as a blanket on the earth’s atmosphere.
3. Discuss with the students that animals don’t eat all plants. So, there is still a lot of carbon in the form of glucose that is stored in plants. You can explain how these plants act as a “carbon sink”.
Until now, the processes that the students have enacted are natural. This is the natural way in which the Earth maintains its temperature so life can survive. But, human activities are

23 | P a g e
responsible for releasing much more carbon dioxide than is necessary for the temperature to be maintained at a livable level. The result is a rise in global temperatures.
Next, the students will explore the human influences on the carbon cycle:
Note to facilitators: The students who didn’t get to take part in the previous activity can take on roles in the following activity
1. Discuss with the students how fossil fuels were formed from forests and swamps that were buried underground by geological forces. This can be enacted by putting mud/sand over the sugar molecules. Explain how pressure and heat from the inner parts of the earth turned the buried forests into fossil fuels such as coal, petroleum and gas.
2. The students will know that we mine these fossil fuels for our energy needs. Have some students work in the mines.
3. Have the students act out what happens after these fuels are mined. The coal would go to a power plant, the oil to a refinery and the gas to gas companies.
4. Explain to the students that burning the fossil fuels is the same as respiration, i.e. carbon dioxide is released in the process.
5. Now have the other students enact different activities that use energy – such as driving, watching TV, using fans and lights etc. Ask the students to come up with examples of activities that consume energy.
At the end of the game, you can discuss the following evaluation questions & anything else you can think of:
1. What is the main gas that the process of photosynthesis releases? 2. What is the main gas that the process of respiration releases? 3. Discuss ways in which the emission of greenhouse gases can be reduced.
If time permits, or at the beginning of the next activity, please ask the students to complete a write-‐about for this activity.
Facilitator Notes
- Atoms: All substances are made up of small constituents called atoms. Everything is made up of atoms, including your body! There are many atoms present (118 have currently discovered) (Check whether the students know about atoms. If they don’t, take a
24 | P a g e
sheet of paper and tear it into smaller and smaller pieces, drawing an analogy to atoms). Some common examples of atoms are: carbon, oxygen, hydrogen etc. These atoms combine with other atoms of the same of different kind to form what are called molecules. Atoms are represented by symbols, which are letters. The only symbols you will have to know for this activity are the following (Put this up on the board too before the session begins): 1. O – oxygen atom 2. H – Hydrogen atom 3. C – Carbon atom 4. O2 – Oxygen molecule (2 oxygen atoms) (This is how oxygen is present in the
atmosphere) 5. H2 – Hydrogen molecule (2 hydrogen atoms) 6. CO2 – Carbon dioxide molecule (1 carbon atom, 2 oxygen atoms) 7. H2O – Water molecule (2 hydrogen atoms, 1 oxygen atom) 8. C6H12O6 – Glucose molecule (6 carbon atoms, 12 hydrogen atoms & 6 oxygen
atoms) 9. When you see something like: 6CO2 or 6O2, it means 6 carbon dioxide molecules
or 6 oxygen molecules respectively. Atoms are really small. Its diameter is ~ 10-‐10 m. S
- Writing chemical equations to represent reactions: As you already know, atoms combine to form molecules. These molecules “react” with other atoms and molecules to form other products in a chemical reaction. One way to think about a reaction is to think about what happens when you cook something like Sambar. The different ingredients that go into making the sambar – vegetables, sambar powder, water, tamarind and salt – are like the atoms and molecules. The process of cooking the Sambar is the “chemical reaction”. The Sambar is the final product of the chemical reaction. Now, we can represent the above reaction in the form of a “chemical equation” as follows: Vegetables + Sambar powder + Water + Tamarind + Salt + Energy (Heat) à Sambar Using the same analogy, you can understand the photosynthesis & respiration chemical equations. The one thing you must remember is: when you write a chemical reaction, the number of atoms of each kind on the right and left side of the arrow has to be the

25 | P a g e
same. Think about why this should be the case. This concept will be important when you do the activity.
- Photosynthesis: Photosynthesis is the process by which plants produce glucose. Cholorophyll is a green pigment present in the leaves of plants, that helps the plants absorb light energy.
- Respiration: The chemical reaction given in this activity is actually cellular respiration and refers to the process of converting glucose into energy that the living organism can use (ATP), in the presence of oxygen.
- Chemical bonds: Atoms combine to form molecules through chemical bonds. Chemical bonds are a result of attraction between atoms. There is a certain configuration of these combined atoms that will be the most stable. Holding hands represent the chemical bonds.
- Breaking chemical bonds: It takes energy to break chemical bonds, just as it takes energy to pull your hands apart. It’s sort of like how you need energy to pull apart the “atoms or molecules” in a rubber band until the rubber band snaps.
- Animals get glucose by eating carbohydrates or starch and plants that contain stored glucose.
- Endothermic & Exothermic reactions: You already know what chemical reactions are. Some reactions release heat to the surroundings. Such reactions are called exothermic reactions. Eg. Respiration Some reactions need heat energy to take place. Such reactions are called endothermic reactions. Eg. Photosynthesis Can you think of any other examples of endothermic/exothermic reactions?
C] Activity 2
Time needed: 20 minutes
Time breakup:
1. Performing the activity -‐10 minutes 2. Discussion – 10 minutes

26 | P a g e
Objective: To understand global warming better
Put each of the following points on a play card and give the play cards to each group so that they can put them in order.
1. We need electricity 2. Power stations produce electricity by burning coal, oil or natural gas 3. Burning fossil fuels releases carbon dioxide 4. Another major source of carbon dioxide -‐ automobile emissions 5. Carbon dioxide traps heat from the sun, hence keeping the earth warm. 6. But too much carbon dioxide causes more heat to get trapped. 7. The earth’s temperature increases. 8. A higher global temperature causes heavier rains and melts icebergs (the facilitator
should check if students know about icebergs). 9. This causes sea levels to rise 10. Islands and coastal areas will get flooded.
Then, have the different groups put up their work where everyone can see and have a class discussion.
D] Activity 3
Time needed: 20 minutes
Objective: To evaluate some of the causes for carbon emissions around you
Look around your village. What are the different vehicles that you see? Can you calculate the amount of carbon dioxide emitted by any 5 people that you know from their mode of transportation? Use the following table to help you.
Type of vehicle Carbon dioxide emission per km
Two-‐wheeler 28 gm/km
Auto 78 gm/km
Diesel car 208 gm/km
Petrol car 223 gm/km
Tempo vans 300 gm/km
Large buses 515 gm/km

27 | P a g e
Record your answers in the following table:
Name of person
Relationship to you
Vehicle the person uses
Average distance they travel per day
What do they travel for?
Carbon dioxide emission
A feasible alternative that would cause less CO2 emission?
E] Activity 4
Time needed: 20 minutes
Objective: Re-‐evaluate your prior knowledge.
This activity completes the Climate Change module. At the end of the module:
c) Each student should complete the Self-‐Assessment slip given on the next page d) Each group must fill the Graffiti wall (blackboard) with their inputs
Go back to the concept map you made for the prior knowledge assessment & fill in anything new that you learnt during the session.

28 | P a g e
Self-‐Assessment Slip
Please complete this slip in your journal.
Concept/skill I have heard of this
I can tell you about this with help
I can tell you about this without help
I can teach this to someone else
Carbon dioxide emissions
Global warming
Carbon cycle Ways to reduce carbon dioxide emissions
F] Project Ideas
1. Can you come up with a carbon footprint calculator for a typical household in your village? Use this website as an example of what factors were taken into account: http://www.carbonindependent.org/
2. Explore ways to reduce the carbon footprint of your community. You will have to research several things like – mode of transport, energy-‐efficient appliances, planting trees etc.
3. Explore the carbon footprint of various renewable energy alternatives.
29 | P a g e
AIR PRESSURE
Learning outcomes
• Forces • Air can exert a force • Vectors • Area • Pressure • Atmospheric pressure • Critical analysis of experiments • Boyle’s Law • Qualitative understanding of Bernoulli’s principle • Understanding that air/liquid generally move from a high pressure to low pressure
region
Correlation with syllabus
• Air & atmosphere – Gr. 6 Science
Lesson Outline: (Time needed: ~ 180 minutes)
A. Prior Knowledge Assessment (To be done before the session) B. Activity 1 (Time needed: ~60 minutes) C. Activity 2 (Time needed: ~60 minutes) D. Activity 3 (Time needed: ~60 minutes) E. Project Ideas
Project materials that you should make available
• Activity 1 – Can air exert force? a) An empty plastic bag b) Any light object c) A drinking straw d) Tape
• Activity 2 – How does a syringe work? a) Balloon (bring enough extra ones in case the balloons burst) b) Syringe (say, the 50 cc ones) c) A pair of scissors

30 | P a g e
• Activity 3 – What is one of the reasons for a paper airplane staying afloat? a) A piece of newspaper b) Straws c) Tape and a pair of scissors
At the end of the session, please collect the students’ journals and go through their work.

31 | P a g e
A] Prior Knowledge Assessment
To be done before the session.
1. Can air exert force? That is, can air move things? Yes/No
2. What is air pressure? (You may draw a picture to show your understanding.)
3. What are some applications of air pressure? (You may draw a picture to show your understanding.)
B] Activity 1
Time needed: 60 minutes
Time breakup:
1. Performing the experiment & recording observations and inferences – 30 minutes 2. Explaining concepts – 20 minutes 3. Analysis – 10 minutes
Objective: To understand that air exerts force
Key concepts:
1. Forces 2. Vectors 3. Area 4. Pressure 5. Atmospheric pressure
Facilitator Notes
Ideally, the object should be lifted off the table on the plastic bag, because when you blow air through the straw into the plastic bag, the air is compressed or under a higher pressure (when compared to the air outside). This makes the air inside the plastic bag push outwards, and the plastic bag in turn pushes on the object, lifting it up.
More mathematically, there are two forces acting on the plastic bag – F1 due to the air outside and the weight of the book that is pushing in on the bag and F2 due to the
compressed air inside pushing outward. We know that the definition of pressure is P = !!,
where A is the area on which the force is acting. So, F = PA. Since the pressure of air inside the bag is greater (since that air is compressed), the force F2 is greater than F1 . Hence, there

32 | P a g e
is a net force, F2 – F1, pushing outwards on the bag. This is the force that causes the book to be lifted.
Key concepts that should be understood
1. Forces: Forces can act on bodies, making them move, increase/decrease their speed or change their direction of motion. You might illustrate this with an example of one student exerting a force on the other, such that the above effects are achieved.
2. Also, use common sense to explain that you need to exert a greater force on a heavier object to achieve the same effect.
3. Vectors: Forces are vectors (i.e. they have a magnitude and direction associated with them). So, they add like vectors when more than one force acts on a body. Again, you might illustrate this with two children exerting different forces on a ruler at the same time. Also, you can make them understand that displacement (motion) is a vector even colloquially because we say that we are moving in a certain direction. But something like temperature is not. If a force F1 is in the direction exactly opposite to another force F2, they subtract from each other and the net force will be in the direction of the greater force (this should appeal to common sense).
4. Area: Area describes the extent of a two-‐dimensional object. You can illustrate this concept by showing paper pieces of different sizes.
5. Pressure: Pressure is defined as the force exerted by an object per unit area. P = F/A. For example, why are injection needles sharp and not blunt? Because the sharper the needle, the smaller the area of contact between the needle and your skin. So, you need to apply a smaller force to achieve the pressure that will break open your skin.
6. Atmospheric Pressure: You already know that the Earth has an atmosphere made up of different gases. For instance, in the climate change module, you learnt that the atmosphere contains oxygen and carbon dioxide. All these gases that constitute the atmosphere are together called air. This air exerts a force on the Earth’s surface and any other object it is in contact with (including your own body). The force exerted per unit area on the Earth’s surface is called the atmospheric pressure. We are always under the influence of the atmospheric pressure & it’s useful for many practical applications.

33 | P a g e
Facilitator notes for analysis section:
• You can exert a greater force on the book because of the greater area. • You can use several plastic bags, kept at different locations for greater mechanical
leverage. (You can state the example of a car and lorry. Ask them why lorry has more number of tires).
• Cycle tires need to be filled with compressed air. This air supports the weight of the cycle and rider.
Materials needed:
1. An empty plastic bag 2. Any light object that you have (eraser, a gum tape, Etc) 3. A drinking straw 4. Tape
Instructions:
1. Insert a straw through the side of the plastic bag, letting a part of the straw stick out. 2. Put tape around the straw to prevent air from escaping. 3. Put the plastic bag on the desk & place a light object on top of the bag. 4. Blow air through the straw.
Please record the following in your journals:
• Observations 1. List all the things that you observe when you blow air through the straw.
• Inferences 1. List the reasons for each of your observations.
The students will work on the analysis section after you discuss the concepts relevant to this activity and the observations & inferences that they noted down. Analysis Answer the following questions in a line or two after discussing with your team members. Try to use pictures whenever possible.
1. What happens if you use a bigger plastic bag? 2. If you want to lift a heavier & bigger object (say, your science textbook), what can
you do? (Hint: Think of what specific quantity must be increased to lift a heavier object.)

34 | P a g e
3. Write down at least one question you have about this experiment or related concepts.
For your free time: 4. How are cycle tires similar to the plastic bag in this experiment?
C] Activity 2
Time needed: 60 minutes
Time breakup:
1) Performing the experiment & recording observations and inferences – 30 minutes 2) Discussion of concepts – 15 minutes 3) Analysis – 15 minutes
Objective: To understand the relation between volume and pressure
Key concepts:
1. Intermolecular attractive forces in gases are weak 2. Boyle’s law (pressure & volume are inversely proportional)
Note to facilitator:
After the students perform the experiment, please have a class discussion based on the supplementary information given. After the discussion, the students will work on the analysis section.
Facilitator Notes
The pressure increases as volume decreases and vice-‐versa. This is a fundamental
relationship called Boyle’s law: P α !! . To qualitatively understand why this is true,
remember that a gas consists of atoms or molecules that are held together by weak intermolecular attractive forces. This means that the gas particles are free to move around. When you decrease the volume of the gas, the particles move around in a smaller space, hence hitting the walls of the container more frequently. This increases the force exerted by the gas on the container, and hence the pressure.
So, in the experiment, when the syringe plug is pushed in, the volume of the air decreases, so the pressure increases. This is why the balloon becomes smaller. When the plug is pulled out again, the volume of the air increases and the pressure decreases.

35 | P a g e
Key concepts that should be understood
1. All substances, including gases are made up of atoms or molecules (recall the Climate Change module)
2. These molecules are held together by intermolecular attractive forces (recall the Climate Change module)
3. In gases, the intermolecular attraction is weak – so the molecules/atoms are free to move around. In liquids, the intermolecular attraction is a bit stronger, which is why you can hold a liquid (like water) in a contained (like a cup). In solid, the intermolecular attraction is very strong, which is why you can’t do things like pour a solid!
4. Boyle’s Law – Pressure of a gas increases as its volume decreases and vice-‐versa.
Facilitator notes for analysis section:
When the plug of the syringe is pulled back, the volume increases, which means that according to Boyle’s lay, the pressure decreases. The blood that the syringe is in contact with is under a greater pressure from outside. So, the blood is pushed into the syringe.
Shaking the Coke bottle causes the layer of carbon dioxide to mix with the pressurized drink. Now, when you open the bottle, the volume increases, causing the pressure of the gas to decrease. This means that the gas tries to expand into the atmosphere, but since it is mixed with the soda, it pushes out the soda too.
Note to facilitator: Please collect the journals after the session and go through the students’ answers to the analysis questions.
Materials needed:
1. Balloon (preferably inflated as described in Point 1 of the instructions) 2. Syringe (say the 50 cc ones) 3. A pair of scissors
Instructions:
1. Blow air into the balloon and inflate it to a very small size, such that it fits into the syringe.
2. Cut the loose end of the balloon. 3. Push the inflated balloon into the syringe barrelwith your fingers. 4. Observe the initial size of the balloon. 5. Close the nozzle of the syringe with a finger and push in the syringe plug. 6. Observe what happens to the size of the balloon. 7. Still keeping the nozzle closed with a finger, slowly pull back the syringe plug. 8. Observe what happens to the size of the balloon now.

36 | P a g e
Please note the following in your journal
• Observations 1. Draw the balloon as observed at the beginning, just as you insert it into the syringe. 2. What is the pressure inside the syringe? Circle the right answer:
a) Same as the atmospheric pressure b) Different from the atmospheric pressure
3. Draw the balloon as observed when the syringe plug is pushed in. 4. What is the pressure inside the syringe now? Circle the right answer:
a. Same as the atmospheric pressure b. Greater than the atmospheric pressure c. Less than the atmospheric pressure
5. Draw the balloon as observed when you pull back the syringe plug again. 6. What is the pressure inside the syringe now? Circle the right answer:
a. Same as the atmospheric pressure b. Greater than the atmospheric pressure c. Less than the atmospheric pressure
• Inferences 1. What happens to the volume (amount) of the air inside the syringe when the syringe
plug is pushed in? Circle the right answer: a. Stays the same b. Increases c. Decreases
2. What happens to the volume of the air inside the syringe when the syringe plug is pulled back? Circle the right answer: a. Stays the same b. Increases c. Decreases
3. Can you write down the relationship between pressure & volume? That is, when you decrease pressure, does the volume increase or decrease?
4. Can you draw a qualitative graph showing the relationship between pressure and volume of the air in the syringe? Let the y-‐axis represent pressure and the x-‐axis, volume.
5. Based on what you learnt in the previous activity about how forces add, can you mathematically explain the change in size of the balloon?

37 | P a g e
Analysis:
Answer the following questions in one or two lines. Just use pictures whenever you can.
1. Write down any questions you have about the experiment/related concept. 2. When you open a Coke bottle after shaking it, why does it come fizzing out? (Hint:
Pressurized gas (carbon dioxide) is mixed with water and sugar to make Coke. There is also some pressurized air at the very top of the bottle.)
3. Complete a write-‐about for this activity.
For your free time:
4. Based on your understanding of the previous experiments, explain how a syringe works when you get a blood test done.
5. Can you think of any other everyday application or example of Boyle’s law? (Answers for facilitator: Breathing, bursting balloons by squeezing them)
D] Activity 3
Time needed: 60 minutes
Time breakup:
1. Performing the experiment & recording observations and inferences: 30 minutes 2. Explanation of concepts: 15 minutes 3. Analysis section: 15 minutes
Objective: To understand Bernoulli’s principle
Guiding Question: What is one of the reasons for a paper airplane staying afloat?
Key concepts:
1. Bernoulli’s principle: Faster moving air exerts less pressure than slow-‐moving air. So, stationary air exerts the most pressure.
Note: After the students complete the experiment, please have a class discussion based on the given supplementary information, after which they will work on the analysis section.
Facilitator Notes
This is an example of Bernoulli’s principle at work, which says that moving air exerts less pressure than stationary air. Consequently, the faster the air moves, the lower the pressure in that region. So, when you blow air through the tube, the fast moving air creates a low

38 | P a g e
pressure region inside, while outside the cone, the pressure is higher. So, the cone gets flattened because the force pushing on it from outside is greater.
An airplane wing should be acted on by a net upward force for it to rise up. The wing is made such that the top part is longer than the bottom. So, when the wing is moving through air, it displaces air molecules (i.e. the air molecules that it displaces move in the opposite direction to the wing). But, since the top part is longer than the bottom, the air molecules on the top of the wing have to move faster than those at the bottom of the wing. Hence, the air pressure below the wing is greater than the air pressure on the top of the wing, resulting in a net upward force. In reality, there are a lot of other factors that need to be taken into account to ensure that airplanes fly in the air.
Note: The students will answer the analysis questions to better understand the underlying concepts of the experiment they just did.
Note: At the end of the session, please collect the journals and go through the analysis section. Note: At the end of the above 3 experiments, students must know the following (reiterate these points if needed):
• You can think of pressure as another way of expressing the force exerted by one object on another
• Air pressure is a way of expressing the force exerted by air on an object it is in contact with
• Hence, when different pressures are acting on two sides of the same object, a net force acts on that object. And this force points from the high pressure to the low pressure region. Ex. When you drink with a straw, you suck out the air in the straw, hence creating a low pressure region inside the straw. The rest of the liquid surface is at atmospheric pressure, which is higher than the pressure inside the straw. So, a force acts on the liquid, pushing it into the straw.
This activity completes the Air Pressure module. At the end of the module:
a) Each student should complete the attached Self-‐Assessment slip b) Each group must fill the Graffiti wall (blackboard) with their inputs
Materials needed:
1. A piece of newspaper 2. Straw 3. Tape and a pair of scissors

39 | P a g e
Instructions:
1. Make a cone out of the newspaper and tape the edges 2. Cut off the vertex of the cone and insert the straw in the hole and tape it, making
sure that you are leaving no holes for air to escape (except for the straw’s hole) 3. Blow hard through the straw and notice what happens to the cone
Please record the following in their journals
• Observations 1. Before doing the experiment, what do you expect should happen to the shape of the
cone when you blow air through the straw? 2. What actually happens to the shape of the cone when you blow air through the
straw? • Inferences 1. Can you come up with a logical explanation for what you observe? Hint: Try blowing
through the tube at different speeds and notice what happens to shape of the cone.
Analysis (please explain your answers through pictures):
1. Can you guess what would happen if you did the following experiment? Put a ping pong ball (small, light ball) inside a funnel and blow air from below through the funnel’s stem, keeping the funnel vertical. Will the ball stay in the funnel or rise upwards? Now, keep the funnel vertical, but blow air from the top of the funnel. Will the ball stay in the funnel or rise upwards?
2. Consider the following experiment: Two balloons are suspended from the ceiling with strings, a short distance from each other. You blow air in the region between them (without putting your face between them!). Will the balloons move towards each other or away from each other?

40 | P a g e
Self-‐Assessment Slip
Concept/activity I have heard of this
I can understand this
I can explain this with help
I can explain this without help
I can teach this to someone else
I can do activities related to this
Air pressure Atmospheric pressure
Forces Relationship between pressure and volume of a gas
Moving air exerts less pressure than stationary air
E] Project Ideas 1. Can you use some of the ideas you learnt in this session to make an automated
watering system for plants that uses fluid pressure? 2. Can you think of a way to make a barometer (an instrument that measures the
atmospheric pressure) using a balloon? Then, think of how you can calibrate it. Next, think of how you can make a commercial model that people in the village can use. You will have to explore the different ways in which a precise knowledge of the atmospheric pressure will be useful to these people.
3. Determine the relationship between tire pressure and mileage. You can look at different kinds of vehicles.

41 | P a g e
FLUIDS
Learning outcomes
1. Surface tension 2. Control variables 3. Graphing experimental data 4. Explaining graphical data 5. Gravity 6. Capillary effect 7. Balance of forces 8. Buoyancy 9. Liquid pressure
Correlation with the syllabus
1. Sorting materials into groups (covers buoyancy) – 6th grade Science 2. Measuring lengths -‐ 6th grade Science 3. Data handling – 6th grade Math
Lesson Outline (Time needed: 240 mins)
A. Prior Knowledge Assessment (to be done before the session) B. Activity 1 (Time needed: 60 mins) C. Activity 2 (Time needed: 60 mins) D. Activity 3 (Time needed: 60 mins) E. Activity 4 (Time needed: 60 mins)
Materials that you should make available
• Activity 1 – Understanding surface tension
• Two glasses • A spoon • Water • Liquid soap • Pieces of paper • Stopwatch • Different liquids Ex. oil, milk, honey (for the analysis section) • A metal vessel in which you can heat water (for the analysis section) • A stove or an arrangement to make a fire (for the analysis section)
42 | P a g e
• A thermometer (for the analysis section) • A measuring cup/dropper (for the analysis section) • Graph paper (for the analysis section)
• Activity 2 – Capillary action
1. Water 2. A deep vessel, jar or beaker 3. Straws of 3 different diameters 4. Food coloring 5. Ruler 6. Different liquids Ex. oil, milk, honey (for the analysis section)
• Activity 3 – Buoyancy 1. A drinking straw 2. A waterproof marker/pen 3. Ruler 4. Clay (modeling clay) 5. Water 6. Salt (for the analysis section) 7. A transparent container
• Activity 4 – Liquid pressure 1. An empty plastic bottle 2. Water 3. A construction compass (or anything sharp with which to make holes in the
bottle) 4. Chart paper 5. Ruler 6. Glue 7. Water-‐proof pen/marker 8. Packing tape& modeling clay
At the end of the session, please collect the students’ journals and go through their work.

43 | P a g e
A] Prior Knowledge Assessment
To be done before the session
Please answer the following questions in your journals:
1. Have you noticed water droplets condensing on the surface of a cold bottle or vessel when you take it out of the fridge? Yes/No If yes, draw what the droplets look like.
2. Do you need to apply a force to move something upwards? Yes/No Why?
3. Which of these is more likely to float in water – an empty vessel or the same vessel filled with some sort of food? Why?
B] ACTIVITY 1
Time required: 60 mins
Objective: To gain a qualitative understanding of surface tension
Guiding question: Why can some insects walk on water without breaking its surface?
Learning outcomes:
• Adhesion & cohesion • Surface tension • Control variable • Graphing • Explaining results from graphical data
Before they begin the experiment, ask the students what they think will happen to a paper ball placed on the surface of water.
The students will first perform the experiment, after which you should have a class discussion based on the given supplementary information. After the discussion, they will work on the analysis section.
Supplementary Information for facilitators
• Cohesion: Force of attraction between molecules of the same kind (e.g. between one water molecule and another water molecule) (Recall: From the Air Pressure module, you already know that there is an intermolecular attractive force present.)

44 | P a g e
• Adhesion: Force of attraction between molecules of different kinds (e.g. between one water molecule and an air molecule)
• Water molecules attract each other with a strong force (strong cohesive force). (Reason: From the Climate Change module, you already know that water is made of 2 hydrogen atoms and 1 oxygen atom. The cohesive force is due to attraction between the hydrogen atom of one water molecule and the oxygen atom of another water molecule. This is called hydrogen bonding.)
• At a water-‐air interface (like the surface of water in this experiment), the surface tension arises mainly because a stronger cohesive force between water molecules than the adhesive force between water and air. The net effect is for water to behave like a stretched elastic membrane (think about it intuitively). This property of water is called surface tension.
• So the paper ball was sitting on this “elastic membrane” held together by hydrogen bonds that water forms at the surface. You can easily break this membrane by disturbing the water at the surface. (You can demonstrate this).
• One of the most common effects of surface tension is that water drops, when small enough, are spherical. This can be intuitively understood as follows: You already know that cohesive forces between water molecules are strong. So when you have some water that isn’t forced to take on the shape of its container (which exerts some force on the water), the water molecules all tend to pull on each other. You can demonstrate this by getting a group of students to all pull each other towards themselves. The result would be that they sort of move inwards forming a spherical shape.
• You can do the following demonstration if possible: Open a tap slightly so that you can see how the water gains mass at the mouth of the tap and then gets stretched by gravity, but then the water separates into spherical droplets because of surface tension.
• When soap is added to the water, the soap molecules break the hydrogen bonds between the water molecules. This is why the paper ball starts sinking in the soap water (because the “elastic membrane” at the surface is broken).
Materials needed:
• Two glasses • A spoon • Water • Liquid soap • Pieces of paper • Stopwatch
Instructions:
45 | P a g e
1. Fill both glasses with water to the same height (keep it well below the rim of the glass)
2. Add a few drops of liquid soap to one of the glasses and mix with the spoon so that the soap is evenly distributed in the water
3. Make paper balls with the pieces of paper such that they fit into the glass 4. Gently place one paper ball each on the surfaces of the water in the two glasses
Record the following in your journals
• Observations 1. Fill the following table: Case Immediately after placing
the paper ball on the water surface
What happens after a few minutes?
Plain water Soap Water
• Inferences 1. Can you explain your observations? (Hint: Think about what effect the addition of
soap to water has. Also, think about why something would sit on water’s surface.)
Analysis:
Materials you might need for the analysis section:
• A metal vessel in which you can heat the water • A stove or an arrangement to make a fire • A thermometer • A measuring cup or a dropper • Graph paper
Instructions
You will get some experience varying experimental parameters and graphing your results in this section.
1. Identify an experimental variable to be a control. Two examples are: a) The amount of soap added (b) Temperature of water (without any soap added) A control variable is an experimental parameter, whose value you can choose. Here, you can choose how much soap to add or what temperature to heat the water to. You can use one of the two given control variables or anything else of your own choice. If you are going to use something of your own choice, be sure to check with

46 | P a g e
your facilitator. (Note: Let the 6th and 7th graders choose between the two given control variables. But the 8th graders can have the freedom to choose a different control variable, after consulting with the facilitator.) Note: If you are varying the temperature, don’t let the water boil (so that convection currents are not formed in the water, which might make the paper ball sink sooner).
2. Identify a variable to measure. In this section, we will measure the time it takes for the paper ball to get completely submerged in the water. So, you will need a stopwatch. Ask you facilitator how to use the stopwatch if you don’t know how. If a stopwatch isn’t available, you can count off the seconds. Obviously, this won’t be as accurate as using a stopwatch.
3. Place the paper ball on the water’s surface and measure the time it takes for the paper ball to get completely submerged for different values of the control variable. If for example, you are varying the amount of soap (measured using a dropper or measuring cup), you are adding, you want to tabulate your data as follows: Amount of soap added (volume) Time it takes for the paper ball to get
completely submerged under water
4. Draw a graph of both the variables (let the x-‐axis represent the control variable and the y-‐axis the time it takes for the paper ball to be completely submerged).
5. Can you explain your findings? That is, explain why the relationship you found between the time for submergence and the control variable makes sense.
C] Activity 2
Time required: 60 mins
Objective: To gain an understanding of capillary action
Guiding question: How does water rise up plants through the roots, against gravity?
Before the students perform the experiment, have the following short discussion with them:

47 | P a g e
1. What happens if you roll a ball over the edge of the table? Why doesn’t it move up? (Answer: Gravity has a tendency to pull everything to the ground. This means that gravity is exerting a force on all objects in the downward direction. )
2. What must you do to move something in the upward direction (opposite to gravity)? (Answer: You have to exert a force that is greater than the downward pull of gravity.)
Learning outcomes:
1. Gravity 2. Gravitational force due to the Earth 3. Capillary effect 4. Volume of an object 5. Density of an object 6. Balance of forces
After the students perform the experiment, please have a class discussion based on the given Facilitator Notes. After this, they can work on the analysis section.
At the end of this activity, ask the students to complete a write-‐about.
Facilitator Notes
• Gravity is a force that acts between any two objects. The force acts to pull any two objects towards each other. That is, the gravitational force is attractive.
• The force that pulls all objects downwards is the gravitational attraction of the earth. • So, to oppose this downward pull, you have to exert a force in the opposite
direction, i.e. upwards. (Recall: Forces are vectors & add like vectors from the Air Pressure module.)
• If the concept isn’t clear, you can do some demonstrations. For example, when you drop a ball or book, you can show how gravity is pulling it to the ground.
• The gravitational force due to Earth acting on a body of mass m is: mg, where g is the gravitational acceleration & can be treated as a constant for these sessions. This force can also be treated as pointing vertically downwards for these sessions.
• The water molecules are under two kinds of intermolecular attractive forces: 1. Cohesion – The attractive force between different water molecules (which in the
previous activity, you learnt is responsible for surface tension) 2. Adhesion – The attractive force between the water molecules and the straw’s
molecules • The water rises up the straw because the adhesive force exceeds the cohesive force,
causing the water that is just touching the straw to rise up. But because there is a cohesive force, the water that is being pulled up the straw pulls nearby water molecules along with it. And this chain of actions continues. This effect is called the capillary effect.

48 | P a g e
• The water stops rising up the straw when the adhesive & cohesive forces can’t counteract the downward pull on the water due to gravity anymore. (Emphasize that gravity is pulling the water down even when it’s rising. Its effect isn’t evident simply because the upward force due to adhesions and cohesion is greater than the downward force due to gravity, until enough water rises up the straw.)
• Volume of an object: Space occupied by it (please demonstrate by showing how different objects occupy different volumes). (Recall: You learnt about area in the Air Pressure module. This is the space occupied in 2 dimensions).
• The shape of the straw is a cylinder. • The volume of a cylinder is: πr2h, where r is the radius of the cylinder and h is the
height of the cylinder. You can make this clearer by stating that the area of a circle is πr2 and a cylinder is a made by stacking circles one on top of the other for a length h.
• Density = Mass of a substance/Volume occupied by the substance • So, mass of a substance = density * volume • Using this, you can find the mass of water that has risen up in the straw, because you
can calculate the volume by measuring the height to which it has risen & the radius of the straw.
• So, the water stops rising when mg = Upward force due to cohesion & adhesion.
Materials needed:
1. Water 2. A deep vessel, jar or beaker 3. Straws of three different diameters 4. Food coloring 5. Ruler 6. Other liquids like milk, oil etc. (for the analysis section)
Instructions:
1. Fill water in the container and add a few drops of food coloring to it. Make sure that the color is evenly distributed. You’re adding the food coloring so that the water is visible in the straws.
2. Cut the straws so that they are all the same length. 3. Hold all three straws lined up and put them in the water, being careful not to touch
the bottom of the container. Also, be sure that the bottoms of the straws are all at the same depth and you’re holding them parallel to each other.
4. Wait for 20-‐30 seconds. 5. Did the water go up the straws? Record your observations.

49 | P a g e
Please record the following in your journals:
Observations:
1. Draw the three straws in the container of water and indicate how high the water rose up in each straw.
Inferences:
1. Does a force need to be exerted on the water for it to move up the straw? Yes/No 2. When you suck air out of a straw (the way you would normally use a straw), what
pushes the water up? (Hint: Recall from the Air Pressure module that pressure is the force exerted per unit area. So, you just have to create a pressure difference to create an imbalance of forces, which will make things move up.)
3. What force do you think is making the water move up the straw? (Hint: Recall the concepts of adhesion & cohesion that you learnt in the previous activity.)
Analysis
In this section, instead of water, you will use other liquids. You can use just the narrow straw for this part.
1. Measure or estimate the radius of the narrow straw: r =
For each liquid you test, fill out the following table:
Liquid tested How high will the liquid rise in the straw (compared to water). Just say “higher” or “lower” and why?
Measure the height
Try explaining your findings.

50 | P a g e
D] Activity 3
Time required: 60 mins
Time breakup:
1. Performing the experiment and recording observations & inferences – 10 mins 2. Discussion – 10 mins 3. Analysis – 20 minutes
Objective: To gain an understanding of buoyancy
Guiding question: Why do you float on water?
Learning outcomes:
1. Buoyant force 2. Forces acting on a stationary object are balanced 3. Weight 4. Using convergent questions to extend a given experiment & do basic calculations
After the students finish the experiment, please have a class discussion based on the given supplementary information. After this, the students can work on the analysis section. At the end of the activity, if time permits, please ask the students to complete a describing wheel for the topic “buoyancy”.
Supplementary information for facilitators
• The upward force acting on objects submerged in a fluid is called the buoyant force. • Buoyant forces arise because when an object is submerged in a fluid, it is displacing
fluid particles from the space that it now occupies. So, the displaced fluid particles have a tendency to push on this object in the opposite direction (i.e. in the direction that will make the object move upwards).
• Why doesn’t the straw keep moving upwards? Because gravity is also acting on the straw. So the straw stops moving when the buoyant force balances the gravitational pull.
• Weight is another name for the downward gravitational force due to the Earth that an object experiences. That is, if the mass of the object is m, the weight of the object is mg.
• It intuitively makes sense that the buoyant force acting on an object must be equal to the weight of the fluid it displaces.
• As we did in the previous experiment, the mass of the fluid displaced can be found by multiplying the fluid’s density with the volume of fluid displaced.

51 | P a g e
• The volume of fluid displaced is equal to the volume of the object that is submerged under water (since it is this submerged part that causes the fluid to be displaced in the first place).
• Let the volume of the object submerged be V. If the density of the fluid is d, the mass of the fluid displaced is: m = V*d.
• So, the weight of the fluid displaced is m*g = V*d*g. And this is equal to the buoyant force acting on the submerged object.
• Now, in this experiment, the volume occupied by the clay cap can be taken to be negligible. So, the volume of the submerged part is equal to the volume of the straw.
• Recall from the previous activity that the volume of a cylinder is: πr2h. Here, r is the radius of the straw (you can ask the students to estimate this or calculate it in advance and give them the value). h is the height of the cylinder submerged. This can be found by counting the number of markings on the cylinder.
• The density of plain water is 1 gm/cm3 & the value of g is g = 980 gcm/s2. • Also, note that you can infer the mass of the straw + modeling clay, because when
the straw isn’t moving, the forces on it balanced. In other words, the downward gravitational pull on the straw is equal to the upward buoyant force acting on it.
• So, M*g = V*d*g, where M is the mass of the straw + modeling clay. So, M = V*d.
Materials required:
1. A drinking straw 2. A pen 3. Ruler 4. Clay (modeling clay) 5. Water 6. Salt (for the analysis section) 7. A transparent container
Instructions:
1. Draw marks that are 5 mm apart on the drinking straw with the pen (use your ruler to measure the 5 mm intervals)
2. Securely close one end of the straw with modeling clay 3. Fill the transparent container with water & put the straw in the water vertically such
that the end with the clay is in the water. The straw should float on the water in its vertical position. If it doesn’t stay vertical, adjust the amount of clay you stick to the straw’s bottom.
4. Count the number of markings on the straw that are submerged in the water & note it down.

52 | P a g e
Observations:
1. Number of markings submerged under plain water –
Inferences:
1. Why do things float? (Hint: Remember that we are always experiencing a downward gravitational pull. So, for something to not fall down or sink, there needs to be a force acting in the upward direction)
Analysis
1. Can you think of how this experiment can be used to measure the density of the liquid? Add a few spoons of salt to the water & submerge the straw in the salt water now. a) What is the mass of the straw + modeling clay? b) How many markings on the straw are submerged in the salt water? c) Is it easier to float in plain water or salt water? d) Can you guess if salt water or plain water has more density? e) What is the volume of the straw that is submerged in the salt water?
i) What is the radius of the straw? ii) What is the length of the straw submerged in the salt water? iii) What is the volume of the straw that is submerged in the salt water? (Remember, volume of a cylinder is πr2h)
f) If the density of the salt water is d, what is the buoyant force acting on the straw in terms of d? (Remember, the buoyant force is: V*d*g, where V is the volume of the straw submerged and g is the gravitational acceleration)
g) What is the gravitational pull acting on the straw + modeling clay? h) Recalling that the downward force = upward force for the straw to be at rest, you
know that M*g = V*d*g, so M = V*d. From this, you can see that d = M/V. Can you calculate d?
i) Is d greater than or less than 1 (the density of plain water)? 2. Can you write in your words why it’s easier to float in a denser liquid? (Hint: Think of
how buoyant force arises because of the liquid pushing against the submerged part of the body.)

53 | P a g e
E] ACTIVITY 4
Time required: 60 mins
Objective: To understand liquid pressure
Guiding question: How does water pressure help you get water in your taps from the overhead tank? (If overhead tanks aren’t present in the village, use the following question: If you stay completely submerged under water, why do your ears pop?)
Learning outcomes:
1. Liquid pressure increases with liquid depth.
The students will first work on the experiment, after which you should have a class discussion based on the given supplementary information. After this, the students will work on the analysis section.
This activity completes the Fluids module. At the end of the module, please have the students complete:
1. The Graffiti Wall (blackboard), as a group, with their thoughts on the module 2. The Self-‐Assessment slip given at the end of the module
Supplementary Information for Facilitators:
1. Recall Bernoulli’s theorem from the Air Pressure module. In that, we learnt that faster moving air exerts less pressure.
2. In fact, Bernoulli’s theorem is a bit more general than that. It is a statement of conservation of energy (introduce this concept to the students if they have already learnt it in their normal curriculum).
3. So, the general Bernoulli’s theorem states that the following quantity (which is actually the energy density (energy per unit volume) of the fluid) -‐ pressure + potential energy + kinetic energy – is a constant.
4. In the experiment that we just did, we are looking at fluids at two different points – one, just inside the hole & other just outside the hole.
5. The water just inside the hole is under pressure because of the water column above it and the atmospheric pressure. The water just outside the hole is only under atmospheric pressure.
6. The liquid pressure is given by: d*g*h, where d is the liquid density, g is the gravitational pressure & h is the height of the liquid column above the point at which we are calculating the pressure.
7. The energy of the fluid at the two points we are considering is given by: Pressure energy + kinetic energy (we are not considering potential energy because the two points are at the same height).

54 | P a g e
8. The liquid just inside the hole is at rest & hence its energy is equal to Patm + d*g*h, where Patm is the atmospheric pressure and d*g*h is the pressure of the liquid at depth h.
9. The liquid just outside the hole has energy equal to: Patm + d*v2/2, where the second term is the kinetic energy with v being the velocity of the liquid coming out.
10. Since Bernoulli’s principle says that the energy stays constant, we have the following equation: Patm + d*g*h = Patm + d*v2/2. This shows that the velocity of the liquid coming out the hole increases with increasing depth, which is what the students will have observed.
Materials required:
1. An empty plastic bottle 2. Water 3. A construction compass (or anything sharp with which to make holes in the bottle) 4. Chart paper 5. Ruler 6. Glue 7. Pen 8. Packing tape or modeling clay
Instructions:
1. Make markings that are 1 cm apart on a rectangular piece of chart paper that extend the length of the bottle’s body.
2. Stick the piece of chart paper on one side of the bottle, such that you are measuring starting from the top
3. Make three holes in the bottle with the compass – one near the bottom, one in the middle and one near the top (but not at the bottle neck).
4. Cover the three holes with packing tape or stick modeling clay in the holes so water can’t leak out
5. Fill the bottle with water till the start of the neck 6. Keep the bottle vertically at the edge of the table. 7. Place the ruler under the bottle. 8. Adjust the ruler such that it sticks out in the air from under it (so that you can
measure the water’s horizontal range using the ruler) 9. Open one hole at a time and observe how the water comes out. 10. Refill the bottle to the original level, before opening the next hole.

55 | P a g e
Observations:
1. Depth of water filled in the bottle (measured from the top) 2. Depth of the hole near the top (measured from the top) 3. Depth of the hole at the middle (measured from the top) 4. Depth of the hole near the bottom (measured from the top) 5. When you open the hole near the top, what is the horizontal range you measure
(this is the point on the ruler at which the falling water hits it) 6. Let the water drain & write in 1 or 2 lines about what happens to the flow of
water. 7. Close the top hole & refill the water to the original level 8. Open the middle hole and measure the horizontal range 9. Let the water drain & write in 1 or 2 lines what happens to the flow of water 10. Close the middle hole & refill the water to the original level 11. Open the bottom hole & measure the horizontal range 12. Let the water drain & write in 1 or 2 lines what happens to the flow of water
Inferences:
1. From which hole does the water exit: a. Most forcefully? Why? b. Least forcefully? Why?
2. From which hole does the water have the greatest horizontal range? 3. Which factor do you think affects the force with which water flows out of the holes?
(Hint: Also take into consideration your observation as you let the water drain out)
Analysis:
1. If you use a liquid with higher density (e.g. salt water), will the liquid come out with greater/lesser force than plain water? Why?
2. A dam is a construction to hold water either for storage or for producing hydroelectricity. Dams are generally built on rivers. Why is the dam wall thicker at the bottom?

56 | P a g e
Self-‐Assessment Slip
Concept/activity I have heard of this
I can understand this
I can explain this with help
I can explain this without help
I can teach this to someone else
I can do activities related to this
Fluid pressure increases with depth
Buoyancy Gravity Graphing experimental data
Surface tension Capillary action

57 | P a g e
HEAT
Learning Outcomes
- 3 modes of heat transfer - Direction of heat flow - Conductors & Insulators - Making a hypothesis & testing it
Correlation with the syllabus
- Heat – 6th grade Science
Lesson Outline (Time needed: 180 minutes)
A] Prior Knowledge Assessment
B] Discussion 1 (10 minutes)
C] Activity 1 (50 minutes)
D] Activity 2 (60 minutes)
E] Activity 3 (60 minutes)
Materials that you should make available 1. Discussion 1
• A ball • A torch • Two vessels • Water • Food color • A way to heat the water
2. Activity 1 • Metal spoon • Wooden stick/spoon • Paraffin wax • Candle or a lamp with oil • Paper clips

58 | P a g e
3. Activity 2 Balloons (at least 3 per group) Water Matchbox Candle/lamp with oil String Stick (optional) Hosepipe or funnel
4. Activity 3 • Thermometer • A way to heat water • Metal vessel + metal spoon • Water
At the end of the session, please collect the students’ journals and go through their work

59 | P a g e
A] PRIOR KNOWLEDGE ASSESSMENT
To be done before the session
Did you know that heat can flow from one place to another, just like water?
1. What is the direction of heat flow? a) From a hot body to a cold body b) From a cold body to a hot body
Draw a picture of the setup described below and then draw arrows showing how heat flows.
2. A spoon placed in a vessel containing hot water becomes hot after a while. However, the spoon’s handle doesn’t become hot immediately. So, can you think of how heat flows from the hot water to the spoon’s handle (which is farthest from the water)?
3. When you heat water on the stove, you notice that at first, the surface of the water is not hot. But as you keep heating, the surface becomes hotter & it seems like some water moves downwards and some moves upwards. How does heat flow in the water?
4. If you light up a fire and place your hand near the fire, your hand immediately feels warm. How do you think the heat flows from the fire to your hand?
B] DISCUSSION 1
Time needed: 10 minutes
Objective: To understand the concept of heat and heat flow better
Learning outcomes:
1. Relationship between heat & the microscopic motion of molecules 2. Direction of heat flow 3. Temperature
Materials needed:
1. A ball 2. A torch 3. Two vessels 4. Water 5. Food color 6. A way to heat the water

60 | P a g e
Facilitator Notes
• Heat is a form of energy [they should recall this from the Nutrition module]. • At this level, they should understand that the thermal energy present in a body is
due to the motion of the molecules in the body. • So, the faster the molecules in a body are moving, the more thermal energy the body
has. [Recall from the Air Pressure module that all objects are made up of molecules or atoms.]
• You can also introduce the concept that a system can be heated up by other forms of energy too: a) Mechanical energy can be converted to heat. For example, when a ball bounces,
some of the kinetic energy in the ball is converted to heat energy that heats up the ball, every time it hits the ground. Since the ball is continuously losing mechanical energy in this way, it becomes slower and slower and eventually stops bouncing. -‐-‐-‐ Use the ball to demonstrate
b) Electrical energy can be converted to heat energy. You can say this is why a bulb that has been turned on for a while feels hot. [They will learn about resistance, which is the cause for energy loss in the form of heat, in the Electricity module.] -‐-‐-‐-‐ Use the torch to demonstrate
c) Energy lost due to friction is in the form of heat. This is why when you rub your hands together, they feel warm, or when your bicycle tire skids on the ground, the area of contact between the tire and ground feel hot [They will learn about friction in the Simple Machines module]. For now, just tell them that frictional forces act between any two bodies that are moving against each other. Explain to them that this is why a ball rolling on the floor eventually stops rolling [here, they should recall that a force needs to be applied to change the motion of an object. So, for the ball to stop moving, the force of friction has to act opposite to the direction of motion of the ball].
You should note that in all of the examples above, the molecules in the body that was heated up started moving faster.
• You should introduce the concept that molecules in a substance are never at rest & that they are always moving around. Take a physical example, like a chair or desk. Explain that their molecules are always moving around, but we can’t see/feel the motion because the molecules are very, very small (microscopic).
• The faster the molecules in a substance move the more heat energy the substance has. You can demonstrate this with the following experiment: Pour some hot water in one vessel & cold water in the other vessel. After the water settles down in both the vessels, add a drop of food color in the center of each vessel.

61 | P a g e
Ask the students why the food color will spread through the water [they should answer that the water molecules are in motion, so the colored part of the water will bump into the non-‐colored part, causing the food color to spread]. Ask them to notice in which container the color spreads faster [it should spread faster in the hot water because the molecules in the hot water are moving faster].
• [Recall from the Fluids module that intermolecular attractive forces hold molecules together.] These forces can be modeled by springs connecting the molecules. (Please show a model of this by tying a stone to each end of a slinky. So, when molecules/atoms move, the springs connecting them vibrate. When the molecules move more vigorously, the spring vibrates more & the molecules effectively occupy more space. This is why most substances expand on heating.)
• Generally, when we think of heat, we speak of heat transfer – the flow of heat from one substance to another. This is quantified by the concept of temperature.
• At this level, the students need to only understand that temperature is the quantity that determines the direction of heat flow – that is heat always spontaneously flows from a substance at a higher temperature to one at a lower temperature. Be sure to use examples. These examples must give a clear, intuitive understanding about the fact that heat flows from a body at a higher temperature (“hot body”) to one at a lower temperature (“cold body”). A few examples that you can use are given below:
1. You can use the examples given in the Prior Knowledge Assessment, but you might have to explain these examples a bit more: - If you let a cup of hot coffee sit outside, it is only going to cool. It’s not going to
get any hotter. This is because there will be a flow of heat from the coffee to the surrounding air, but not in the reverse direction because the coffee is at a higher temperature than the surrounding air.
- Similarly a cup of cold water will not get any colder because heat flows from a body at a higher temperature to a body at a lower temperature. Here, the surrounding air is at a higher temperature than the water. So, heat flows from the surroundings to the water to raise the temperature of the water.
• Some main points to note: - There is no such thing as “coldness” flowing from or into a substance. That is, in
the 2nd example above, it would be wrong to say that the coldness is flowing out of the water into the surroundings. Rather, it is the heat that is flowing into the water from the surroundings.
- When two substances of different temperatures are in contact, heat will flow from the body at a higher temperature to the body at a lower temperature until both bodies attain the same temperature (which will be somewhere between the

62 | P a g e
temperatures of the 2 bodies). When two such bodies attain the same temperature in this way, they are said to reach a thermal equilibrium. [The students must recall how a similar thing happened in the Pressure module, where 2 regions with unequal pressures try to equalize their pressures.]
At the end of the session, ask the students to complete a write-‐about on the discussion.
C] Activity 1
Time needed: 50 minutes
Objective: To understand how heat flows through conduction
Part 1:
Facilitator Notes
1. This experiment illustrates 2 ideas: - How heat flow occurs through conduction - The fact that different materials conduct heat at different rates
2. Heat conduction occurs due to molecular motion. In this example, the molecules of the spoon near the flame first get heated up and they start vibrating, which in turn makes molecules next to them vibrate (increasing their heat energy) and so on. In this way, heat flows across the length of the spoon. This is the reason the paper clips don’t fall immediately. This is also the reason why the paper clips closer to the flame fall down first.
3. Some substances let heat pass better than others. That is the reason the paper clips stuck to the metal spoon fall down before those on the wooden spoon do.
4. Metals are better conductors of heat because of 2 reasons: a. Their atoms/molecules are very closely packed together. This means that when
atoms near one end vibrate, the vibrations can be transferred more easily to the other end.
b. Metals have “free electrons”. That is some of the metal’s electrons aren’t attached to any atoms. These electrons move around the metal. These electrons can also carry part of the heat to other parts of the metal.
5. Substances that don’t conduct heat well are called insulators. Insulators are very important in practical applications for preventing heat loss [the students will learn more about insulators in the Locally Available Materials module].

63 | P a g e
Materials needed:
1. A metal spoon 2. A wooden stick or spoon 3. Some paraffin wax 4. A candle or a lamp with oil 5. Paper clips
Instructions:
1. Take small pieces of wax and heat it slightly & stick it to the spoon along the length of the handle.
2. Now Stick the paper clip one by one to the hot wax on the spoon along the length of the metal spoon’s handle. Wait for the wax to dry – this should take only a few minutes. Make sure you stick at least 3 paper clips along the spoon’s length in this way.
3. Now place the spoon on some sort of stand & heat the other end of the spoon on the candle’s flame & observe what happens to the paper clips. Start keeping count of time as soon as you start heating the spoon.
4. Repeat the experiment with the wooden spoon
Observations:
For both the metal & wooden spoons:
a) Draw a picture of the setup. b) Next to each paper clip, note down the time when it fell down.
Inferences:
1. Can you explain why the paper clips closer to the point at which you are heating the spoon fall down first?
2. Can you explain why the paper clips on the metal spoon fall faster than those stuck to the wooden spoon?
Analysis:
1. If instead of heating the metal spoon on one end, you heated it in the middle & had paper clips stuck on either side, what do you think will happen? Depict your answer pictorially.

64 | P a g e
Part 2:
Based on their experience, ask each group to make a list of 2-‐3 insulators & 2-‐3 conductors of heat. Then, discuss with the class.
Some questions to consider if they have trouble writing the answers:
1. Why does metal feel hot when under the sun, but wood or plastic doesn’t? 2. Why do you wear a sweater in the winter? 3. Why do you wear a cloth over your head on a hot day?
• List 2 insulators. Give one reason for listing each substance as an insulator. • List 2 conductors. Give one reason for listing each substance as a conductor.
D] ACTIVITY 2
Time needed: 60 minutes
At the end of the activity, please ask the students to complete a describing wheel about heat transfer by conduction & convection.
Facilitator Notes
1. This experiment illustrates heat being transferred by two methods: - Conduction: From the balloon to the bottom layer of water - Convection: The heating up of the water in the balloon
2. The experiment also illustrates the idea of water being a better conductor of heat than air.
3. The balloon doesn’t pop when it’s filled with water because water is a better conductor of heat than air. So, the bottom layer of water conducts away the heat from the balloon’s surface.
4. At this point, only the water at the bottom is heated, while the water at the top is still cool. Hot water has lower density than cold water, so it rises up, while the cold water sinks (recall the Fluids module).
5. The cold water, which has now sunk, conducts heat away from the balloon and rises up, making more cold water sink from the top.
6. Generally gases and liquids heat up due to convection because the molecules are free to move around. Materials needed:
1. A few balloons 2. Water

65 | P a g e
3. Matchbox 4. Candle 5. Some string 6. A stick (that is about a meter long) (optional) 7. A hosepipe or funnel
Instructions:
1. Blow air into the balloon to make it a reasonable size and tie the mouth of the balloon.
2. Tie a stick to the neck of the balloon with the string. 3. Light the candle & place the balloon over the flame, holding the balloon by the stick
(don’t let it touch the flame) 4. Write down what happens 5. Now, take another balloon & fill it with a little water using the hosepipe or funnel.
Then blow air into it to make it a reasonable size. 6. Carefully tie the mouth of the balloon 7. Now tie the stick with the string & hold the balloon over the flame of the candle 8. Observe what happens to the balloon now
Observations:
1. What happens to the balloon filled with air when you hold it over the candle flame? 2. What happens to the balloon filled with water when you hold it over the candle
flame?
Inferences:
1. Why does the balloon filled with air burst? 2. The following questions will help you answer why the balloon filled with water
doesn’t burst: a. Draw the setup & draw an arrow showing how heat flows from the flame to the
balloon. b. In the same picture, draw an arrow showing how heat flows from the balloon to
the water touching the bottom of the balloon. What is the mode of heat transfer?
c. In the same picture, think of how the heat from the bottom layer of water flows to the rest of the water (think of water being heated on a stove).
d. Can you see the water in the balloon boiling?
66 | P a g e
E] ACTIVITY 3
Time needed: 60 minutes
Objective: In this activity, students will be given a problem to solve. They will first have to make a hypothesis based on what they have learnt so far, after which they will experimentally test their hypothesis.
Learning Outcomes:
• Making a hypothesis based on prior knowledge • Experimentally testing the hypothesis
This activity completes the Heat module. At the end of the module, please ask the student groups to fill the Graffiti Wall (blackboard) with their thoughts on the module.
Facilitator Notes
1. The vessel is better at cooling the water because the water has a larger surface area when poured into the vessel. So, more of the water can transfer heat to the environment.
2. Water generally cools by convection. The air just on top of the water warms up, rises and cool air comes down. This warms up and the process continues until the water cools.
3. If you just put the spoon in the water, the spoon conducts heat away from water because it’s a good conductor of heat.
4. By stirring the water, you are increasing the surface area of the water (because of the whirlpool shape formed), moving away the warm air just on top of the water (hence improving the rate of convection) and conducting heat away from the water using the spoon.
5. But by repeatedly dipping the spoon in and out of the water, you get one more benefit (in addition to the benefits of stirring) – you are adding cool air into the water (when you take the spoon from outside and dunk it in), which will absorb more heat from the water. This heated air will rise up and be whisked out when it reaches the surface. This is why dipping the spoon in and out of the water is the fastest method of cooling the water.
Problem: You have a cup of boiling hot water. What is the fastest way to cool the water to around 70 degrees Celsius if the only other equipments you have are a metal spoon & a larger vessel?

67 | P a g e
Step 1: Make a hypothesis. Here, the hypothesis is a guess you should make about the fastest way to cool the water.
How does a cup of water normally cool? -‐-‐-‐-‐-‐-‐-‐-‐-‐-‐-‐-‐-‐-‐-‐-‐
Things to consider:
1. It will be easier to cool the water in the vessel than the cup. Why? 2. Some things you can do with the spoon are:
a. Leave it in the water without stirring b. Stir the water with the spoon c. Dip the spoon in and out of the water
The fastest way to cool the water would be -‐-‐-‐-‐-‐-‐-‐-‐-‐-‐-‐-‐-‐-‐-‐-‐-‐-‐-‐-‐-‐ (choose one of the above three options). This is your hypothesis.
Step 2
Now, you must experimentally test your hypothesis. To test if your hypothesis is correct, you will have to compare 2 or 3 different methods of cooling the water. Test the following methods:
1. Water in the vessel. No stirring, but the spoon is inside the water. 2. Water in the vessel. Stirring. 3. Water in the vessel. Dipping the spoon in and out of the water.
Things you need to test your hypothesis
1. A thermometer 2. A way to heat the water
1. What should you be testing for? Since you want to see which method cools the water the fastest, you can take temperature readings for a fixed time (say 5 minutes) for each method. Then, compare the final temperature you read for each case.
2. At the end of the tests, draw a graph of the temperature of the water vs. the time. 3. Which is the fastest method to cool the water? 4. Is your hypothesis the same as the right answer? 5. Does the right answer make sense to you? Why or why not?
68 | P a g e
WATER
Learning Outcomes:
1. Basic tests for physical characteristics of water 2. Different water purification methods 3. Using given materials to perform a certain task
Correlation with the syllabus:
1. Physical changes – Gr. 6 Science 2. Sorting materials into groups – Gr. 6 Science 3. Water – Gr. 6 Science
Correlation with Needs Assessment Toolkit:
1. Water Resources
Lesson Outline (Time needed: 180 minutes):
A] Prior Knowledge Assessment
B] Activity 1 (Time needed: 60 mins)
C] Activity 2 (Time needed: 60 mins)
D] Activity 3 (Time needed: 60 mins)
E] Project Ideas
Project materials that you should make available:
1. Activity 1 • Water samples • pH paper • Lemon juice or juice from any citrus fruit • Soap water • Beaker or a vessel – washed & dried • A way to make a fire • Common balance

69 | P a g e
2. Activity 2 • Dirty water • 1 liter plastic bottle with its cap • 2 clean vessels or beakers • A 2 liter plastic bottle cut across the middle (you will need the top and bottom) • Alum • Clock or watch (or someone has to keep the count of minutes!) • Filter paper • Rubber band • Pebbles • Coarse sand • Fine sand • Clean water • Flashlight (bright torch)
3. Activity 3 • Measuring tape or ruler • Thick cotton string • A heavy pebble • Waterproof marker
At the end of the session, please collect the students’ journals and go through their work

70 | P a g e
A] PRIOR KNOWLEDGE ASSESSMENT
Please answer the following questions in your journal.
1. What are the main water sources in the village (example: well, river, lake etc.)
2. Fill the following table: Water source What do you use the
water from this source for?
Smell
3. Are there any water filtration or purification practices done in the village? Ask other villagers if you don’t know.
B] ACTIVITY 1
Time needed: 60 minutes
Objective: To perform basic tests on water samples collected from different sources in the village
Learning Outcomes:
1. Some of the required standards for drinking water 2. pH
In this activity, students will perform different tests on collected water samples & compare their results with the drinking water standards specified by the Bureau of Indian Standards (http://www.wbphed.gov.in/main/Static_pages/bureau_of_indian.php)
Facilitator Notes
In addition to the given activities, you must have general discussions with the students about the impurities present in the water. The students or school teachers will already know about some of the existing problems. You can ask the nearest water-‐testing lab for test kits for these particular contaminants then (look at Part 4).

71 | P a g e
PART 1-‐ Testing Physical Characteristics
This activity consists of fairly qualitative tests. Drinking water should be colorless, odorless and clear, according to the BIS guidelines. If the water samples brought by the students don’t satisfy these guidelines, have a discussion about why there is a deviation. For instance, a sample collected in a lake might have a distinctive color & odor. Ask the students to note down these reasons in their journals.
PART 2 – Testing the Water’s Acidity
1. For this activity, students only need to know the following: a. The pH range that indicates that the solution is acidic/basic b. How to find the pH reading based on the color change of the pH paper
2. pH is a scale to test if something is acidic or basic. The pH scale ranges from 0 to 14. 3. Based on the chemistry knowledge of the students, you can tell them that a
solution’s acidity depends on the concentration of hydrogen ions (H+). The greater the concentration of hydrogen ions, the more acidic the solution is. This is because most strong acids contain hydrogen ions. (You can give examples of HCl or H2SO4 if students have prior knowledge.)
4. The acceptable pH range of drinking water is: 6.5 – 8.5, even though pure water is
neutral (is neither acidic nor basic) and has a pH of 7. If the water is too acidic (pH below 6.5)
5. It is generally soft (soap lathers easily) and corrosive. 6. Contains a high concentration of metal ions like iron, manganese, copper, lead &
zinc. Why? Because this water corrodes metals pipes through which it flows. 7. The water might have a metallic/sour taste and cause blue-‐green stains on metal
sinks, pipes etc. 8. The water might also cause redness & irritation to skin & eyes. 9. You can neutralize acidic water by adding sodium carbonate (soda ash) to the water.
If the water is too basic (pH>8.5)
1. This means that the water is hard. Hard water is quite common & can be detected by the fact that soap doesn’t lather easily.
2. It can make the water taste bitter. 3. Forms scale deposits on dishes, buckets, clothes etc. 4. There are no adverse health effects from drinking basic water, though this is still
being researched
Guide this discussion by asking students if they have noticed any of these effects

72 | P a g e
PART 3 – Testing the solid content in the water
1. This experiment will take quite some time because you have to wait for the water to evaporate. So, it is recommended that this experiment should be done only if there is no time crunch or it is known that there is significant solid contamination in one of the collected water samples.
2. The calculations for the experiment are given below: • Weight of empty beaker – a grams • Weight of beaker + water – b grams • Weight of water – (b-‐a) grams • Weight of beaker after all the water evaporates – c grams • Weight of solid contamination – (c-‐a) grams • Volume of water – (b-‐a)/1000 liters because the density of water is 1000 g/l • So, the concentration of solid contamination in g/l is: (c-‐a)*1000/(b-‐a)
3. Note, the concentration will be noticeable only if there is significant solid contamination
4. Have a discussion of why the contamination exists if it does. 5. The desirable limit according to the BIS standards is 500 mg/l.
PART 4 –Bacteriological Contamination & Other Tests
• Please contact the nearest water-‐testing lab and see if they have demonstrations of other tests or if they give some test kits for free for educational purposes. If yes, you can demonstrate these tests, based on the available time.
Nearest lab to Yadgir district: http://indiawater.gov.in/IMISReports/Reports/WaterQuality/rpt_WQM_EntryStatusLabs_List.aspx?Rep=0&Ty=D&Rtype=BI Nearest lab to Dakshin Kannada district: http://indiawater.gov.in/IMISReports/Reports/WaterQuality/rpt_WQM_EntryStatusLabs_List.aspx?Rep=0&Ty=D&Rtype=BI

73 | P a g e
Fill the following table
PART 1 – Testing Physical Characteristics
Materials needed:
1. Collected water samples
Fill out the following table
Source from which water sample was collected
What is this water used for?
Source from which sample was collected
Color Odor Turbidity Do you think this water is fit for drinking, based on your observations of its physical characteristics? Also write down your other comments.

74 | P a g e
PART 2 -‐ Testing the Water’s Acidity
Materials needed:
1. pH paper 2. Lemon juice or juice from any citrus fruit 3. Soap powder mixed in some water (any water is fine) 4. Collected water samples
Instructions:
Look at the color chart that comes with the pH paper booklet. When you dip the pH paper in a solution, the pH paper’s color changes according to this chart. If the color change corresponds to a: a. pH range of 1-‐7 à solution is acidic b. pH range of 7-‐14 à solution is basic
Note down the following in your journal:
1. a) Do you think lemon juice is: i) acidic ii) basic
b) Color change of pH paper on dipping it in the lemon juice
c) pH reading of lemon juice corresponding to color change
d) Based on the pH reading, the lemon juice is: i) Acidic ii) Basic
2. a) Do you think the soap solution is: i) acidic ii) basic
b) Color change of pH paper on dipping it in the soap solution c) pH reading of soap solution corresponding to color change d) Based on the pH reading, the soap solution is: i) Acidic ii) Basic
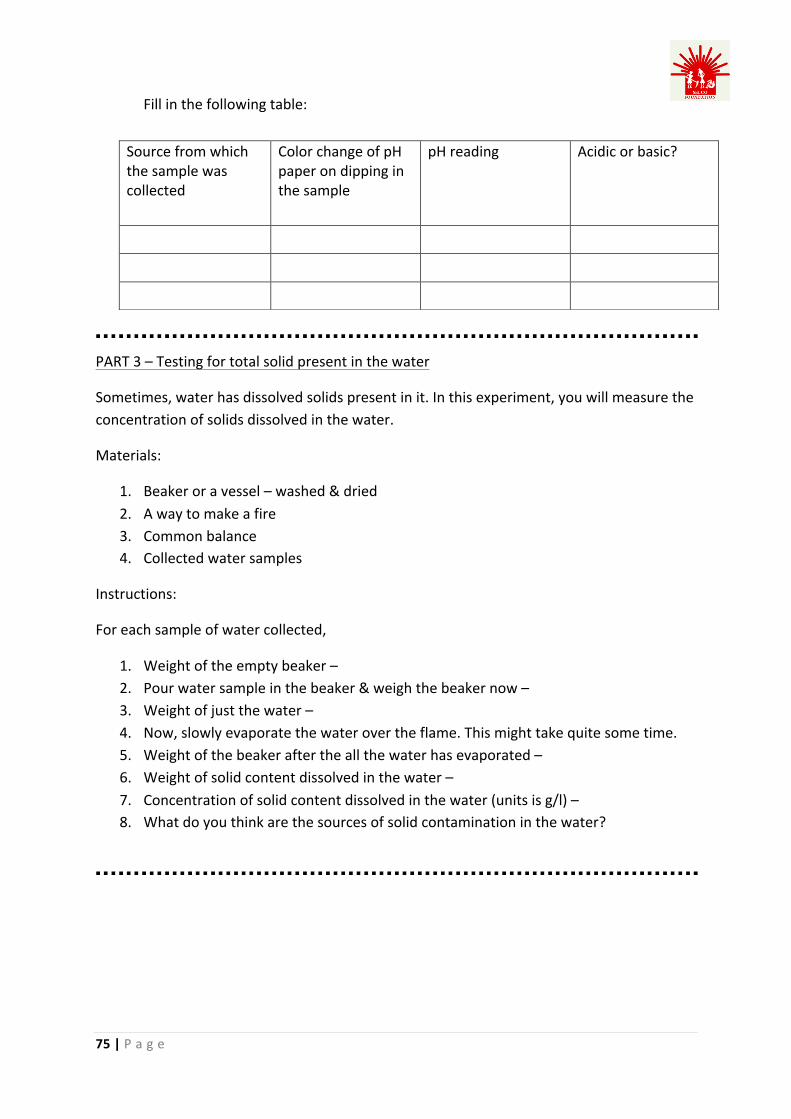
75 | P a g e
Fill in the following table:
PART 3 – Testing for total solid present in the water
Sometimes, water has dissolved solids present in it. In this experiment, you will measure the concentration of solids dissolved in the water.
Materials:
1. Beaker or a vessel – washed & dried 2. A way to make a fire 3. Common balance 4. Collected water samples
Instructions:
For each sample of water collected,
1. Weight of the empty beaker – 2. Pour water sample in the beaker & weigh the beaker now – 3. Weight of just the water – 4. Now, slowly evaporate the water over the flame. This might take quite some time. 5. Weight of the beaker after the all the water has evaporated – 6. Weight of solid content dissolved in the water – 7. Concentration of solid content dissolved in the water (units is g/l) – 8. What do you think are the sources of solid contamination in the water?
Source from which the sample was collected
Color change of pH paper on dipping in the sample
pH reading Acidic or basic?

76 | P a g e
C] ACTIVITY 2 Time needed: 60 minutes Part 1 Have a discussion about the water purification methods commonly used in the village. Ask the students what purification methods are used in their homes. It will also be helpful if you do a bit of background research to find out what the commonly present impurities in the water in the village are & what the villagers do to purify the water. For example, the water in some villages in Yadgir district is hard and has high fluoride content. Part 2 Objective: In this part, the students will design a water purification system and understand some of the main water purification processes. At the end of this activity, please ask the students to complete a write-‐about for this activity.
Facilitator Notes
Part 1
• Ask the students to set aside some of the dirty water for the second part of this activity.
Some common water purification methods are: a) Boiling – Eliminates most microbes that are responsible for gastrointestinal
problems. Can’t remove chemical toxins like metal ions. Microbes start dying at temperatures greater than 60˚C. It is recommended that water should be boiled for at least 10 minutes.
b) Disinfecting water using chemicals – You can add 2-‐3 drops of unscented household bleach to about a liter of warm water. Cover it and let it stand for at least 30 minutes. If you notice chlorine smell, the water is ready for drinking. If you don’t notice a chlorine smell, add 2 more drops of bleach and let the water stand for 15 minutes. This kills some of the microbes present in the water, but is generally not as effective as boiling. Iodine can also be used to disinfect water, but the amount of iodine mixed should be carefully regulated because too much iodine can cause thyroid problems.
c) Storage – Water can be stored in a tank or container for a few hours to let silt and other heavy particles settle down at the bottom. Then, the clear water on the top can be decanted.

77 | P a g e
d) Flocculation – This is the process of removing suspended solid particles from water by the addition of chemicals like alum. The alum causes these solid particles to clump together. Now, they become heavy enough to sink to the bottom of the impure water, so that they can be easily removed by the process sedimentation. Please refer to this video: https://www.khanacademy.org/partner-‐content/mit-‐k12/mit-‐k12-‐materials/v/flocculation Flocculation can remove organic particles as well as suspended inorganic particles such as iron. However, it can’t remove all microbes present in the water, so this process alone cannot produce safe drinking water.
e) Filtration – Water is passed through different layers of substances like charcoal, sand, gravel etc that can stop smaller particle impurities in the water from passing.
f) Aeration – This is the process of bringing water & air (specifically oxygen) in contact with each other in order to remove dissolved gases & to oxidize certain metal impurities like iron. This can also remove some organic materials. Aside from the fact that some impurities get oxidized, the other reason that aeration works is because of the turbulence caused by the water & air mixing together. This results in the dissolved gases escaping out of the water.
g) You should also mention that activated carbon is widely used in water filtration systems. The activated carbon uses the process of adsorption to remove impurities from water. This removes soluble as well as insoluble impurities from water. The impurities accumulate and attach themselves to the surface of the activated carbon. Activated carbon has high surface area so that more impurities can get attached to its surface.
You can also use the following table for reference. It gives the commonly used purification method for different impurities. You should bring this up if there is a specific impurity present in the water in the region.
Contaminant Purification Method Pesticides & Fertilizers Aeration, Flocculation Sedimentation,
Filtration Hydrogen Sulfide gas Aeration Gravel Flocculation, Sedimentation, Filtration Viruses Disinfection & Storage Parasitic worms Floculation, Sedimentation, Filtration,
Disinfection, Storage Sewage Aeration, Floculation, Sedimentation,
Filtration, Disinfection, Storage Sand Flocculation, Sedimentation, Filtration Leaves Flocculation, Sedimentation, Filtration Bacteria Disinfection, Storage Methane Aeration

78 | P a g e
PART 2 – Qualitative Test for the turbidity of water: 1. We know that light travels in straight lines. So, when the water is turbid, the light
can’t bend around the impurities present in the water. Hence, there will be a reduction in the brightness of light that you see on the other side of the glass, since the light will get diffused when the suspended impurities get in its way. This experiment will be effective only if the room is very dark & the impure water is significantly more turbid that the pure water.
Materials Needed:
1. Dirty water 2. 1 liter plastic bottle with its cap 3. 2 clean vessels or beakers 4. A 2 liter plastic bottle cut across the middle (you will need the top and bottom) 5. Alum 6. Clock or watch (or someone has to count of minutes!) 7. Filter paper 8. Rubber band 9. Pebbles 10. Coarse sand 11. Fine sand 12. Clean water 13. Flashlight (bright torch)
Instructions:
1. If the water sample you collected isn’t already visibly dirty, add some mud to it to make it look impure.
2. Smell of the dirty water – Color of the dirty water – Can you see any suspended impurities in the water?
Aeration:
1. Pour the water in the bottle, cap it and shake it vigorously for about 30 seconds. This increases the surface area of the water that is in contact with the air. This process is called aeration.
2. Next, pour this water into a vessel or beaker & pour the water back and forth between the 2 vessels about 8-‐10 times. This increases the air circulation in the water.

79 | P a g e
3. Do you see bubbles in the water as you aerate it? What are these bubbles? 4. You will know that the water has been aerated once the water stops bubbling. 5. After the aeration process,
Smell of the dirty water –
Flocculation:
Add 2 tablespoons of alum to the aerated water. Stir the mixture for a few minutes. Allow the water to stand undisturbed for 20-‐25 minutes & fill the following table every 5 minutes for the 20-‐25 minutes that you are observing this water: Time Smell Color Appearance
Filtration: 1. Now, you will make a filter with the top half of the bottle. 2. Tie the filter paper to the mouth of the top half of the bottle with a rubber band 3. Turn the bottle upside down and place it over the bottom half of the bottle 4. Put a layer of pebbles into the bottle. This will form the bottom layer of the filter. 5. Put a layer of coarse sand on top of the pebbles & a layer of fine sand on top of the
coarse sand. 6. By now, the impurities in the dirty water, which you purified by flocculation, will
have settled down by the process of sedimentation. 7. Pour this water through the filter without disturbing the impurities settled at the
bottom. 8. The filtered water will collect in the bottom half of the sliced bottle. 9. Note down the following in your journal:
Smell – Color – Appearance –
Part 2: This effectiveness of the water purification method can be further verified if you have access to a dark room, a bright LED torch and 2 clean beakers or transparent glasses. The following steps will give a qualitative measure of the turbidity of the water.
1. Pour the purified water in one glass & the dirty water in the other. 2. Put them both in a dark room and shine the torch through each glass of water. 3. Draw the setup & the path that light takes when you shine it through each glass of
water:

80 | P a g e
D] ACTIVITY 3
Time needed: 30 minutes
In this activity, the students will be given a set of materials and they will have to figure out a way to measure the depth of the water in their school’s well.
This activity completes the Water module. At the end of this activity, please ask the students to:
a) Fill the graffiti wall (blackboard) with their thoughts on the activity b) Complete the attached Self-‐Assessment slip
Facilitator Notes
Please let the students figure out how the measure the well’s depth on their own. But give them pointers when needed based on the below information.
You should tie the weight to one end of the string so that it stays taut. Lower the string into the well until you feel it touch the bottom. Mark the string with the marker at the ground level (outside the well). Pull the string out of the well & notice where it first gets wet. The depth of the well is the distance between the ground level mark and the point where it first gets wet.
If time & logistics permit, you can ask the students to repeat this in different wells in the village and compare the water level.
Materials Needed:
1. Measuring tape or ruler 2. Thick cotton string 3. A heavy pebble 4. Waterproof marker
Analysis:
1. Talk to your parents or grandparents and find out what the well depths used to be in the past. If there is a significant difference, what do you think the reason is?

81 | P a g e
Self-‐Assessment Slip
Concept/activity I have heard of this
I can understand this
I can explain this with help
I can explain this without help
I can teach this to someone else
I can do activities related to this
Water acidity Boiling Floccluation Filtration Aeration Groundwater level
E] PROJECT IDEAS
1. Can you think of how to improve sanitation in the village by using dry toilets?
2. Explore ways in which water is getting contaminated in the village & come up with solutions.

82 | P a g e
MAGNETISM
Learning Outcomes:
1. Magnetic & non-‐magnetic materials 2. Source of magnetism 3. Magnetic polarity & field lines 4. Magnetic levitation 5. Designing an experimental setup to test a prediction
Correlation with the Syllabus:
1. Magnetism – 6th grade science
Lesson Outline (Time needed: 120 minutes)
A] Prior Knowledge Assessment
B] Activity 1 (Time needed: 30 minutes)
C] Activity 2 (Time needed: 30 minutes)
D] Activity 3 (Time needed: 60 minutes)
Materials that you should make available
• Activity 1 - A bar magnet - Commonly available items (metals & non-‐metals)
• Activity 2 - Magnets of different shapes - Iron filings - Pieces of iron or some other magnetic material - A sheet of paper
• Activity 3 - Pencils (through which the ring-‐shaped magnets will fit) - A notebook - Play dough
83 | P a g e
- Several ring-‐shaped magnets (I believe these are quite cheap) (at least 6 per group)
At the end of the session, please collect the students’ journals and go through their work

84 | P a g e
A] PRIOR KNOWLEDGE ASSESSMENT
To be done before the session begins
Draw an idea wheel with what you know about magnetism in your journals.
B] ACTIVITY 1
Time needed: 30 minutes
Objective: To identify magnetic & non-‐magnetic materials from commonly available things
Learning Outcomes:
1. Magnetic & non-‐magnetic materials
Preliminary Information:
Before they start this activity, the students must know that a magnet attracts some things and doesn’t attract others. It also repels other magnets.
Facilitator Notes
1. Students must understand that magnets can attract certain substances. They should also notice that the magnet doesn’t have to touch the substance to attract it. [Compare to how earth’s gravity pulls down on a body without the body having to touch the earth.]
2. Magnetism arises because of currents inside the magnet’s atoms. The main cause for this current is the motion of electrons around the atom’s nucleus. [This will be clearer in the electromagnetism module.]
3. Some things like iron are attracted by magnets (the reason for iron being attracted to magnets is due to an electronic property called spin – too complicated at this level?).
4. Those substances that are attracted to magnets are called magnetic materials, while those that aren’t attracted to magnets are called non-‐magnetic materials.
Materials needed:
1. A bar magnet 2. Commonly available things that the students should bring (assortment of different
metals & non-‐metals)
85 | P a g e
Instructions:
You should test which materials are attracted by the bar magnet & which ones aren’t. Record your observations in the following table:
C] ACTIVITY 2
Time needed: 30 minutes
Objective: To learn about polarity and field lines.
Learning Outcomes:
1. Magnetic poles 2. Magnetic field lines
Framework: In this activity, students will design their own “experiments” based on the instructions, which explain what aspects of magnetism they are supposed to study. While the students work on the activity, you can explain different concepts given in the facilitator notes based on the questions that come up.
At the end of this activity, please ask the students to complete a write-‐about for the two activities done during this session.
Facilitator Notes:
• Like poles repel each other, while unlike poles attract each other. • Let’s call one magnet A. Suppose we place a magnetic material or another magnet
called B near A. B will feel an attractive or repulsive force due to A. But B does not have to touch A to feel this force. This kind of force, which doesn’t require bodily contact, is called “action at a distance.” “Action at a distance” is possible because of the presence of fields.
• A magnetic field surrounds every magnet & points in the direction of the force exerted by the magnet at a particular point. So, when you place a magnet under a sheet of paper & place iron filings on the paper, the filings are under a force exerted by the magnet.
Things that are attracted to the bar magnet
Things that are not attracted to the bar magnet
86 | P a g e
The direction of the force exerted on the filings at every point is given by the field line at that point. This means that the iron filings will arrange themselves in the same shape as the magnetic field around the magnet. The more iron filings at a particular point, the greater the magnetic force at that point. So, for a bar magnet, the greatest number of iron filings will be at either end of the magnet, while the center will have hardly any or very few filings, because the magnetic force is the weakest here.
• A magnetic material doesn’t produce a field of its own. But it can feel a force when placed in a magnetic field.
Materials needed:
1. Magnets of different shapes if available 2. Some iron filings 3. Pieces of iron or some other magnetic material 4. A sheet of paper
Instructions:
1. You must explore how like poles repel each other & unlike poles attract each other 2. You must explore the concept of magnetic field lines by putting the iron filings on a
sheet of paper & the magnet underneath. The iron filings, being attracted to the magnet, will arrange themselves in the shape of the magnetic field. If iron filings aren’t available, you can use sand because sand contains small iron particles. You should draw the magnetic field lines for each magnet they have, indicating the point(s) where the field is the strongest and the point(s) where the field is the weakest.
3. You must explore how magnetic materials are different from magnets.
Write down what you did with the given materials to explore each aspect given above. Then, write down your observations & inferences, like always.
Hint: For example, to explore whether like poles attract or repel each other, you must try to bring the like poles of 2-‐3 different magnets together, to see what happens.

87 | P a g e
D] ACTIVITY 3
Time needed: 60 minutes
Objective: To apply concepts learnt so far to explore magnetic levitation
Learning Outcomes:
1. Magnetic levitation 2. Designing a setup to test a prediction
Preliminary Information for students (to be explained to the students before they start the experiment):
You already know that like poles repel each other. People have taken advantage of this property and built things that can be suspended in midair. Suspending things in midair like this is called magnetic levitation. Why would this be useful? You should already know that frictional forces oppose motion between two objects (for example, when a ball is rolling on the floor, the force of friction acting between the ball and the floor tries to stop the ball. This is why balls eventually stop rolling.) A lot of energy is lost when you try to overcome this frictional force. Now, if you can suspend things in midair and make them move in midair, you end up greatly reducing the frictional force (should make intuitive sense). Because of this, some countries (e.g. Japan) have trains that move in the midair – these are called magnetic levitating trains. Since these trains experience less friction, they can travel a lot faster and with much less energy loss due to friction.
Framework:
In this activity, students will be given a bunch of materials and will be asked to design a setup that can levitate an object. Through this activity, students will be exposed to:
1. Making a prediction/hypothesis based on what they already know about magnetism (this has already been done for them – that is, the prediction is that you can magnetically levitate things because you know that like poles repel each other.)
2. Designing an experiment to test this prediction – this is to be done by the students.
Facilitator Notes
- There are several solutions depending on the number of magnets that the students are given. If they are given 6 magnets, one possible solution is to place 4 magnets on the notebook, as if on the four corners of a rectangle. Then you can insert 2 magnets through the pencil such that they are approximately on either side of the center. Now, place the pencil over the notebook and at a particular

88 | P a g e
height and horizontal distance, you will notice that the pencil just stays put in midair.
Analysis: The net force acting on the pencil is obviously zero. The reasoning behind magnetic levitation is that the sum of the magnetic repulsive forces, acting vertically upwards, is equal and opposite to the gravitational force acting vertically downwards on the pencil.
This activity completes the Magnetism module. At the end of the module, please ask the students to:
a) Fill the Graffiti Wall (blackboard) with their thoughts on the activity b) Complete the attached Self-‐Assessment slip
Materials given:
1. Pencils (through which the ring-‐shaped magnets will fit) 2. A notebook 3. Play dough 4. Several ring-‐shaped magnets (at least 6 per group)
Instructions:
1. Design a setup that will levitate the pencil in midair. 2. Some hints: - You can use the notebook as the base above which the pencil will levitate - In order to make the pencil levitate, you will obviously need to put some
magnets on the pencil. You will also need to place some magnets on the base. You need to figure out how many magnets to put on the pencil & the notebook and in what geometry.
- You can use the play dough to fix the magnets to the notebook
Analysis:
1. Can you draw the different forces due to the magnets on the base acting on the pencil?
2. If the pencil is stationary in midair, do you think the sum of the different forces acting on the pencil is: a. Zero b. Not zero
Please explain.

89 | P a g e
For your free time: Can you think of how a magnetically levitating toy train can be designed? Can you use the same ring-‐shaped magnets, or will you have to use magnets of a different shape?
Self-‐Assessment Slip
Concept/activity I have heard of this
I can understand this
I can explain this with help
I can explain this without help
I can teach this to someone else
I can do activities related to this
Like poles repel each other
Magnetic field lines
Magnetic levitation
90 | P a g e
ELECTRICITY & ELECTROMAGNETISM
Learning Outcomes:
1. Current, voltage, resistors, Ohm’s law 2. Induced EMF 3. Electromagnet 4. DC Motor 5. Generator
Correlation with Syllabus:
1. Electricity – Gr. 6 Science
Correlation with the Needs Assessment Toolkit
1. Energy
Lesson Outline (Time needed: 300 minutes)
A] Prior Knowledge Assessment
B] Activity 1 (60 minutes)
C] Activity 2 (60 minutes)
D] Activity 3 (120 minutes) (spread over 2 sessions)
E] If time permits, please set aside an hour to show videos of how electric motors and generators work
At the end of the session, please collect the students’ journals and go through their work

91 | P a g e
A] PRIOR KNOWLEDGE ASSESSMENT
Please note down answers to the following question in your journal.
1. Draw a picture of a light bulb and a switch in your house and show/explain how the bulb lights up.
B] ACTIVITY 1
Time needed: 60 minutes
In this activity, students will be introduced to the concept of charge, current and voltage by playing a game that simulates a simple circuit.
Materials needed:
1. Several paper balls 2. A battery (of two different voltages) 3. A 1.5 V bulb 4. Wire
Instructions for the facilitator:
1. Ask one student volunteer to play the role of a battery (let’s call him/her A). 2. Ask another student volunteer to play the role of a light bulb (let’s call him/her B). 3. Ask students for ideas about why the bulb lights up when connected to the battery. 4. You should guide the discussion so that students realize that the bulb lights up
because of the flow of charge in the circuit. Note: Tell the students that “charge” can be positive or negative. Positive charge is made up of positively charged metal ions, while negative charge is made up of electrons. Tell them the unlike charges attract and like charges repel (just like magnetic poles). Tell them that generally, only electrons are free to move and hence, the flow of electric charge, which is electric current, is almost always due to the flow of free electrons. Also tell them that electrons that are free to move around, called “free electrons”, are present in large amounts mostly in metals (Eg copper, aluminum). Hence, metals are generally good conductors of electricity.
5. Give A a box full of paper balls. Explain to the students that these paper balls represent electrons.
6. Ask A to throw balls at B. Now, B will “light up”. 7. Explain that B has to throw the balls back to A, introducing the concept of a circuit. 8. Ask the students how the light bulb can give off light that is brighter. Some possible
answers are: a) Throw the balls harder (this introduces the concept of voltage)
Voltage: Voltage can be thought of as the “pressure” under which the electrons flow around the circuit. It can be thought of as the amount of energy that the

92 | P a g e
battery gives each electron (think of the battery pushing the electrons out with a greater force). [Make a connection with the Fluids module – water at a greater pressure flows out with more force] If the same number of balls is thrown per minute, but each ball is given more energy, it makes sense that more energy is delivered to the bulb, making it light up brighter. Say that voltage is measured in units of volts (V).
b) Throw the balls faster, i.e. more number of balls per minute (this introduces the concept of current) Current: If you throw the balls faster, you are sending more electrons per second to the bulb. If we send twice as many electrons to the bulb per second, then the battery is delivering twice as much energy to the bulb. Say that current is measured in units of Amperes (A).
9. Introduce the concept of power. Reason that the power delivered to the bulb depends on the voltage and current. Tell the students that power P = I*V.
At the end of the activity, ask the students to complete two describing wheels, one for electricity and one for magnetism.
Now, give the students the batteries, bulb & wire.
Connect them up to form a working circuit.
1. Draw the circuit in your journal. 2. Note down the voltages of the batteries 3. Which battery makes the bulb glow brighter?
C] ACTIVITY 2
Time needed: 60 minutes
Objective: To understand energy losses due to resistance
At the end of this activity, please ask the students to complete a write-‐about for this activity.

93 | P a g e
Facilitator Notes
1. Explain to the students how to measure the voltage (multimeter probes will be
across the resistor) and current (multimeter probes will be in series with the resistor).
2. Explain to the students that resistors don’t allow all the energy to pass through and that some of the energy gets converted to heat in the resistor [Recall this from the Heat module]. Tell them that this is because the resistors aren’t made of good conductors of electricity.
3. Explain that because resistors dissipate some energy, there is a voltage drop across the resistor [make connection to previous discussion of how increasing voltage increases energy].
4. Explain to them that voltage across the resistor & current will have a linear relationship. Specifically, they are related according to: V = I*R. This is the mathematical statement of Ohm’s Law.
5. Teach them how to find the slope of a graph for the activity.
Materials needed:
1. Batteries of different voltages (at least 3-‐4) 2. A 100 ohm and 200 ohm resistor 3. Wire 4. A multimeter 5. Graph paper
Instructions:
1. Connect the battery terminals via the 100 ohm resistor & wire 2. Measure the current & voltage across the resistor & record the values in the
following table: Battery voltage (as given on the battery)
Voltage across the resistor Current
3. Make a graph of the voltage vs. current 4. Find the slope of the graph. Is it equal to the value of the resistor?
94 | P a g e
Extension:
1. Connect the bulb to the battery via the two resistors. 2. Note down the value of the resistor for which the bulb glows brighter 3. What does this result tell you about resistors?
D] ACTIVITY 3
Time needed: 120 minutes (spread over 2 sessions)
Objective: To understand the connection between electricity & magnetism
You should guide the students towards this activity by telling them that electricity and magnetism seem to have so much in common.
Note: The main objective of this activity is to provide a scientific basis for the working on electric motors & generators, which are used in so many devices that the students and their families use on a daily basis. Please keep this in mind, while conducting the activity.
PART 1:
In this part, students will explore how magnetism can cause an electric current to flow.
Facilitator Notes
1. This is an illustration of induced EMF (another term for potential difference) 2. The induced EMF is caused by the fact that the magnetic flux through the coil is
changing when you the move the magnet through the coil. 3. Magnetic flux through the coil is given by: MF = B*A, where B is the magnetic field
strength & A is the area of the coil. Basically, the students need only understand that the magnetic flux represents the “amount” of magnetic field lines passing through the coil. So, bigger the area of the coil, greater the flux.
4. The induced EMF is given by the rate of change of the magnetic flux through the coil. This is why there is no current when you don’t move the magnet. This is also why the current increases when you move the magnet faster.
Materials needed:
1. A coil of insulated copper wire (of 2 different diameters) 2. A multimeter 3. A stack of ferrite magnets

95 | P a g e
Instructions:
1. Set the multimeter to read voltage values. 2. Connect the ends of the copper coil to the multimeter probes 3. Move the magnet through the coil (bringing it in and out of the coil) 4. Note down the multimeter reading 5. Try moving the magnet faster through the coil 6. How does the multimeter reading change? 7. Keep the magnet stationary but pointing through the coil. Does the multimeter show
a non-‐zero reading?
Inferences:
1. If a current needs to flow through the coil, should there be a voltage difference across its ends? Yes/No
2. A current clearly starts flowing through the coil when you move the magnet in and out of coil. What specific action do you think causes the current to flow? Is it the presence of the magnet near the coil or the fact that the magnet is moving through the coil?
3. Now, refine your answer to the above question a little more. How does the current reading change when you move the magnets faster/slower?
4. Now, refine you answer even more. Try using the other coil & see how the current reading depends on the size (area) of the coil, assuming you are moving the magnet at the same speed through both the coils.
5. In this experiment: a) Magnetism was causing electricity b) Electricity was causing magnetism
PART 2:
In this part, the students will explore if it is possible for electricity to cause magnetism.
Facilitator Notes
1. This is an example of how electricity causes magnetism. Here, the current-‐carrying wire becomes an electromagnet.
2. The strength of the electromagnet increases if the amount of current passing through it increases.
This activity completes the Electricity and Electromagnetism module. At the end of the activity, please ask the students to:
a) Fill the Graffiti Wall (blackboard) with their thoughts b) Complete the attached Self-‐Assessment slip

96 | P a g e
Note to facilitator: In this module, we don’t go into details of how to build an electric motor or generator – partly in the interest of time and partly to avoid redundancy, since this topic is covered well by the existing syllabus. However, it is recommended that you try building the motor and generator according to the designs given during the Facilitator training. It will also be useful to talk to the students about electric motors and generators and show them some videos on the following website: http://www.arvindguptatoys.com/toys.html
The discussion about motors and generators should closely tie in with their use in appliances that students or their parents use on a daily basis – diesel generators, water pumps, fans etc.
Materials Needed:
1. A drinking glass (made of glass or clear plastic) 2. An iron nail 3. A Styrofoam ball 4. Insulated copper wire 5. A 1.5 V battery 6. A magnetic compass
Instructions:
1. Wind the copper wire around the drinking glass 2. Fill the glass with water 3. Poke the nail through the Styrofoam ball and put it in the water. The ball and the nail
must float in the water 4. Connect the ends of the copper wire to the battery terminals
Observations:
1. What happens to the suspended nail as soon as you connect the battery terminals? 2. What happens to the suspended nail when you disconnect the battery terminals?
Have one of your teammates hold the compass near the copper wire.
3. Does the compass needle deflect when you connect the battery terminals?
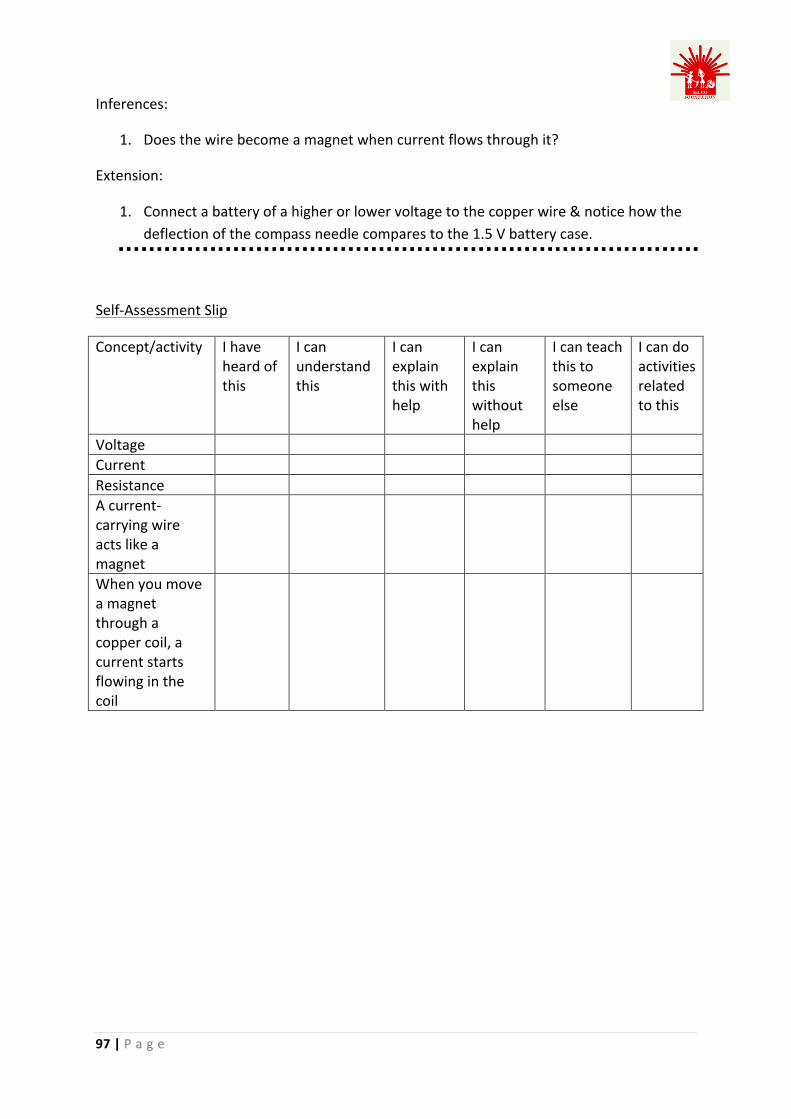
97 | P a g e
Inferences:
1. Does the wire become a magnet when current flows through it?
Extension:
1. Connect a battery of a higher or lower voltage to the copper wire & notice how the deflection of the compass needle compares to the 1.5 V battery case.
Self-‐Assessment Slip
Concept/activity I have heard of this
I can understand this
I can explain this with help
I can explain this without help
I can teach this to someone else
I can do activities related to this
Voltage Current Resistance A current-‐carrying wire acts like a magnet
When you move a magnet through a copper coil, a current starts flowing in the coil

98 | P a g e
ENERGY EFFICIENCY
Learning Outcomes:
1. Conducting energy audits 2. Evaluating the benefits of renewable energy sources 3. Exploring ways to reduce energy consumption
Correlation with the Syllabus:
1. Electricity – Gr. 6 Science
Correlation with the Needs Assessment Toolkit:
1. Energy
Lesson Outline (Time needed: 120 minutes)
1. Activity 1 (1-‐2 hours outside of class time) 2. Activity 2 (1 hour outside of class time) 3. Activity 3 (120 minutes)
At the end of the session, please collect the students’ journals and go through their work

99 | P a g e
A] ACTIVITY 1
Time needed: 1-‐2 hours outside of class
Activity 1 from the Needs Assessment toolkit.
B] ACTIVITY 2
This activity can also be done as part of the Needs Assessment Toolkit.
For this activity, you will try to find one house in the village that uses any kind of renewable energy source. For example, does anyone use solar water heaters? Does anyone have solar home lights? Does anyone use a biomass cooks stove? Does any household use biogas?
Solar water heater:
1. Find out how much the water heater costs – 2. Find out how much money is spent per year to maintain it – 3. Find out how much water (in liters) is heated per day – 4. Try heating the same amount of water using kerosene or firewood. How much
money did it cost for the kerosene/firewood? 5. What is cheaper in the long term? (You can multiply the money spent on kerosene or
firewood by the number of days in a year)
Solar home lights:
1. How much did the solar home lighting system cost? 2. How much money is spent per year on maintenance? 3. What is the wattage of the lights? 4. How many hours of backup does it provide? 5. How much money would be spent to use grid electricity for the same lights (for the
same time)? 6. Which is cheaper in the long term?
Biomass cook stove:
1. How much money was spent to set up the stove? 2. How much money is spent to collect the biomass required to cook one day’s meals? 3. How much money is spent to maintain the cook stove? 4. How much money would be spent on kerosene/firewood to cook one day’s meals? 5. Which is cheaper in the long term?

100 | P a g e
Biogas cook stove:
1. How much money was spent to set up the stove? 2. How much organic matter should be added to the anaerobic digester in a week?
How frequently should this organic matter be added? 3. How much money is spent to maintain the digester? 4. How much money would be spent on firewood or kerosene to cook one day’s meal? 5. Which option is cheaper in the long term?
The data collected by the students should be discussed in class.
C] ACTIVITY 3
Time needed: 120 minutes
Note: You can take approximately 60 minutes to discuss Activity 1 and 60 minutes for Activity 2. It will also be helpful if you simultaneously discuss the Energy topic from the Needs Assessment toolkit.
Using the data collected in Activities 1 and 2, discuss ways in which the energy consumption in each household can be reduced.
During the discussion, you should focus on the fact that when evaluating issues surrounding energy efficiency or energy shortage, it is important to look at the issue from the angles of environmental, economic and social sustainability.
You must consider various possibilities such as:
• Can the device in question be used for a shorter period of time? • Are the lights used in the house energy efficient? • Are the fans used in the house energy efficient? • Is there a way to avoid using the device in question? (For example, can a fan not be
used if the house was cross-‐ventilated?) • Are there renewable energy alternatives that would work out to be cheaper in the
long term? • How will you get them to consider long-‐term as well as short-‐term effects?
Note to facilitator: This is a very good website containing information on how to save energy -‐ http://www.bijlibachao.com/
This activity completes the Energy Efficiency module. At the end of this activity, please ask the students to complete a Describing Wheel about energy efficiency.
101 | P a g e
AGRICULTURE ACTIVITY 1:
Agriculture module of the needs assessment will be done as activity one,
ACTIVITY 2
Time needed: 60 minutes
Time breakup:
Part 1 – 20 minutes
Part 2 – 40 minutes
Learning Outcomes:
1. Connecting the crops grown in the region to the local soil & climatic conditions 2. Some theoretical information
Note: Even though this activity is divided into 2 separate parts, you should try to conduct it more organically, since both parts deal with related concepts. One suggestion is to use the surveys done by the students to help them draw broader conclusions about agricultural practices.
Part 1:
In this section, you will have a guided discussion regarding the basics of agriculture in India. It will be useful to use the information collected by the students in the previous activity as the starting point.
Broadly discuss in which season the different crops they documented about are grown, what their water requirements are etc.
Main agricultural seasons:
• Kharif – Crops sown at the beginning of the south west monsoon & harvested at the end of the south west monsoon. Sowing season: May-‐July Harvesting season: September – October Main kharif crops: Jowar, bajra, rice, maize, cotton, groundnut, sugarcane
• Rabi – Crops grown in this season need cooler climate during their growth, but warm climate during the germination of their seeds Sowing season: October – December

102 | P a g e
Harvesting season: February – April Main rabi crops – Gram, mustard, masoor dal, green peas, potato
Part 2:
Framework:
In this section, you will have a discussion based on the surveys that the students did in the previous activity. You should use the collected data as the starting point & get them to make a connection between the crops grown in the region with the local soil & climatic condition.
It will be helpful to put up the information collected by all the students in the previous activity
Suggestions:
1. It might be useful to compare the crops grown in a different region to illustrate how the choice differs based on the local soil & climate
2. You can consider bringing in a local farmer to talk about why/how they choose which crops to grow
Facilitator Notes
Crops are generally chosen based on the climate & the soil in a region.
The climatic condition is an important factor because it determines whether the water requirements of the crop can be satisfied by rains or if irrigation is required.
The soil is an important factor because plants require nutrients to grow & different soils have different kinds of nutrient content. The moisture-‐retention capacity of soil is another important factor.
Dakshina Kannada district:
• Climate: Hot & humid
• Main periods of rainfall (Annual average – 3559 mm): 1. SW monsoon – 1st week of June – 4th week of September 2. NE monsoon – 1st week of October – 1st week of December 3. Summer – March – May
• Soil type: 1. Red laterite soil (60%) 2. Sandy loam soil (40%)

103 | P a g e
• Red Laterite Soil: - Prepared by the parent rock’s weathering - Found in hot & wet areas - Rich in aluminum & iron - Red in color due to the presence of iron oxides - Deficient in potash, phosphoric acid, lime & nitrogen - Since the soil is poor in lime, it is acidic - The soil contains humus (organic matter) - The soil ranges from heavy loamy to clay
• Major field crops: Crop Season Paddy Kharif & rabi Blackgram Rabi Greengram Rabi Cow pea Rabi Horsegram Rabi
• Main fruits: - Banana - Mango - Jack fruit - Pineapple - Sapota
• Main vegetables: - Brinjal - Sweet potato - Bhindi - Cucumber - Ash gourd
• Main plantation crops: - Arecanut - Coconut - Cashew - Black pepper - Cocoa
Mostly
rainfed
Rainfed & irrigated

104 | P a g e
Yadgir district:
• Climate: Hot & dry • Main periods of rainfall (Annual average – 636 mm):
- SW monsoon: 2nd week of June – 1st week of October - NE monsoon: 2nd week of October – 2nd week of November - Winter (Jan – March) - Summer (April – May)
• Soil type: - Medium deep red clayey soil - Deep black calcareous soil
• Major field crops: Crop Season Paddy Kharif/Rabi Jowar Kharif/Rabi Green gram Kharif Red gram Kharif Groundnut Kharif/Rabi Sunflower Kharif/Rabi Bajra Kharif
Paddy & groundnut are grown under irrigated conditions.
The rest of the major field crops are rainfed (since rainfall is quite low in this region, this means that these crops don’t require much water).
• The Yadgir block has been declared drought-‐prone by the Government. • The region has a natural slope & this leads to soil & nutrient loss during the monsoon
due to run-‐offs. • Major crops in the Yadgir block: Greeen gram (kharif), jowar (rabi), red gram (kharif)
& groundnut (rabi)

105 | P a g e
LOCALLY AVAILABLE MATERIALS
Learning Outcomes:
1. Knowledge about various locally available materials (natural & synthetic) 2. Testing for various useful properties like heat content, thermal insulation,
waterproofing ability, tensile strength etc.
Correlation with the Syllabus:
1. Sorting materials into groups – Gr. 6 Science
Lesson Outline (Time needed: 300 minutes):
A] Preliminary Survey
B] Discussion 1 (60 minutes)
C] Activity 1 (60 minutes)
D] Activity 2 (60 minutes)
E] Activity 3 (60 minutes)
F] Activity 4 (60 minutes)
At the end of the session, please collect the students’ journals and go through their work

106 | P a g e
A] Preliminary Survey
The following text must be explained to the students before they do the Prior Knowledge Assessment. You should focus on the fact that locally available materials are used for two reasons – the fact that they are easily available & the fact that the properties of these materials make them ideal for a certain purpose.
In this module, you will explore locally available materials & their uses. For example, in Yadgir, the trunks of neem trees are used as roofing for houses – partly because neem trees grow widely in Yadgir and partly because of properties of the trunks (strong, resistant to insect attacks etc.) that make them ideal for roofing. Similarly, in Dakshina Kannada, the fiber obtained from coconut husk, called coir, is used to make ropes, mats and baskets – partly because coconut trees grow widely in this region and partly because of properties of coir that make it ideal for ropes and mats (it is durable, elastic and has good waterproof qualities)
In this module, you will explore different locally available materials, their uses and their properties that make them ideal for a particular use.
I] Fill your answers to this question in the given table:
• Choose 3-‐4 purposes from the following list • Talk to different people in the village and note down what materials are used for the
given purpose. • Ask them how they learnt that they had to use that material for the given purpose
(for example, some may be following what their elders did, some may have figured out the given use for this material after a series of experimentation etc.)
• Then, either by talking to villagers or thinking about it on your own, write down properties of the material that make it useful for the given purpose. You can write your answer in the table given below.
1. Cooking fuel 2. Walls of buildings 3. Roofs of buildings 4. Making furniture 5. Brooms 6. Winnowing fans 7. Lining water tanks 8. Keeping things cool if there are no refrigerators 9. Curtains 10. Ropes/baskets 11. Keeping houses cool in the summer

107 | P a g e
12. Preventing leakages during the rainy season 13. Water purification 14. Organic fertilizers/biopesticides in agriculture 15. Insect repellants in households 16. Any other purpose that you can think of
II] Fill your answers in the given table:
• Write down 2-‐3 uses of each of these materials listed below after talking to your community members.
• Also write down what property of each material makes it useful for a particular purpose. 1. Soil 2. Stone 3. Byproducts from crops grown in the region 4. Any other material that you can think of
Material Purpose it is used for Property of the material
that makes it useful for this purpose
B] DISCUSSION 1
Time needed: 60 minutes
Objective: Using the preliminary surveys as a starting point, you should discuss why a material is used for a given purpose.
Purpose Materials used for the purpose
How did people learn to use these materials for the given purpose?
Properties of the material that make it useful for the given purpose

108 | P a g e
Focus on the different properties of materials that make them useful for a given purpose.
Pay attention to patterns in the surveys. Also look for the same materials used for different purposes and different materials used for the same purpose.
Facilitator Notes
1. Useful properties of materials: - Heat content – The higher the heat content of a material, the more energy it
releases on burning. This makes it useful as a cooking fuel. [Recall how the calorie content in a potato chip was calculated in the Nutrition module]. Since most houses in the village use firewood as cooking fuel, an important question to consider is which firewood is the best. Generally, you get the most heat per wood volume by burning firewood with high density. Also, the wood needs to be seasoned. This means that the wood needs to lose moisture, because otherwise, some energy is lost in evaporating the water. Generally, the wood is just left to sit outdoors in order to make it lose moisture. Seasoned wood has cracks along the edges.
- Heat insulation – This reduces the heat transfer between objects in thermal contact (that is, objects at different temperatures are in contact). The insulating capability of a material is measured by the thermal conductivity – the lower the thermal conductivity, the higher the insulating capability. For example, traditional houses in India had thick mud or stone walls (since both mud and stone are good insulators and keep the heat out) and grass or dry leaves sandwiched between wood and terracotta tiles for roofs. In Dakshina Kannada, you might find roofs made out of terracotta tiles and interwoven coconut leaves.
- Water proof qualities – It is important for materials to have good water proof qualities. For instance, you would want mats to be relatively waterproof. In the rainy season, you would like to wear a waterproof outer layer to keep your clothes from getting wet.
- Biodegradability – Biodegradable materials are generally organic. A biodegradable material, when exposed to air, will be acted upon by bacteria or other microorganisms, which will break it down into chemical compounds. It will take some time for a material to completely biodegrade [Recall composting from the Agriculture module].

109 | P a g e
- Combustibility – This is a measure of how easily a substance will set on fire. In general, inorganic materials are not combustible, while organic materials like wood and paper are. Note that you need oxygen supply for something to burn.
- Specific gravity – This is the ratio of the density of a substance [Recall density
from the Fluids module] to the density of a reference substance (mostly always water). Therefore, materials with specific gravity less than 1 will float on water, while materials with specific gravity more than 1 will sink [Recall from the Fluids module]. Knowledge about specific gravity is important in cleaning up spills (oil spills in rivers, lakes and oceans) and in extinguishing fires. For example, you can’t use water to put off a fire caused by oil because oil is lighter than water, which means that it will float on water and the water isn’t effective in cutting off oxygen supply. But, you can use a foam-‐based fire extinguisher because foam is lighter than oil, and hence can cut off oxygen supply by floating on oil.
- Another important property to discuss with the students is the fact every
material is made up of different chemical compounds [Recall Climate Change]. Some of these chemical compounds will be important nutrients for crop growth. It can be useful to test the nutrients in different substances like powdered coconut husk (coco peat), powdered leaves of a certain plant etc. You can introduce the idea of growing media other than soil for plants.
2. Some specific information to focus on
- Dakshina Kannada 1. Use of the parts of coconut trees 2. Use of the parts of areca nut trees 3. Brick industry using the laterite soil in the region
- Yadgir 1. Use of the local stone in the region for construction 2. Use of the parts of neem trees 3. Use of peanut shells 4. Use of the clayey soil in the region to line water tanks
In the following activities, students will perform comparative tests, for different properties, on locally available materials. In this module, the focus will be on exposing the students to how to design simple tests for different properties. Brainstorming about what alternative uses the materials can be put to will happen in the 2nd and 3rd phases.

110 | P a g e
C] ACTIVITY 1
Time needed: 60 minutes
Objective: To test the waterproofing quality of different materials
Materials needed:
1. Different locally available materials 2. Water 3. Cotton wool 4. Duct tape 5. Scissors 6. Bowl 7. A measuring cup or cylinder
Instructions:
1. Wrap a ball of cotton wool in each of the different materials you are testing 2. Make sure there are no holes or gaps in the wrapping through which water can
enter. If so, cover with duct tape. 3. Dip the wrapped cotton ball in a bowl of water for a fixed amount of time (say 30
seconds) 4. Check how wet the cotton ball is – you can do this by wringing out the water from
the cotton wool as best as you can into a measuring cup. 5. Measure the amount of water absorbed by the cotton wool. 6. Do this for each material you are testing
Observations:
1. Rank the materials starting from poor waterproofing quality to good waterproofing quality
Inferences:
1. Are any of the materials that you tested currently used for waterproofing applications in the village?
Analysis: 1. Why are water-‐tanks lined with clay?

111 | P a g e
D] ACTIVITY 2
Time needed: 60 minutes
Time breakup:
Assuming that many students might have brought back the same kind of firewood, get each group to test one or two types and then compare results to save time.
Objective: To test for the heat content in different kinds of firewood
Note to the facilitator: Before beginning this activity, connect back to the Nutrition module, in which students calculated the caloric content in potato chips.
Facilitator Notes
Please refer to Activity 2 of the Nutrition module
Materials needed:
1. Test tube and clamp 2. Thermometer & clamp 3. Matches 4. Different kinds of firewood (3 different kinds) 5. A shallow glass bowl that is heat resistant (evaporating dish) 6. A measuring cup
Instructions:
1. Take a bit of firewood of one type and estimate the mass 2. Suspend the firewood piece over the evaporating dish using paper clips or metal
wire 3. Estimate the mass of the above setup 4. Pour about 20 ml of water in the test tube and place it in the test tube holder 5. What is the mass of the water in the test tube? 6. Adjust the height of the clamp so that the firewood is directly under the test tube 7. Insert a thermometer in the water and record the initial temperature of the water 8. Light the firewood with a matchstick 9. Measure the temperature of the water every 2 minutes & make sure that you record
the highest temperature that the water attains 10. Estimate the amount of ash left behind in the evaporating dish after burning the
firewood

112 | P a g e
Observations:
1. What kind of firewood are you using? 2. Mass of firewood – 3. Mass of firewood + evaporating dish + paper clip – 4. Mass of leftover ash + evaporating dish + paper clip – 5. Mass of firewood that was burnt – 6. Initial temperature of the water – 7. Highest recorded temperature of the water – 8. Change in the temperature of water – 9. Heat absorbed by the water – 10. Heat content in 1 gram of the firewood
Inferences:
1. Which firewood has the highest heat content per gram? 2. Does this firewood seem the lightest or the densest of the different samples you
tested? 3. Which of the samples you tested are being used as firewood in the village?
Analysis:
1. What firewood do you use at home? 2. Is there a better kind of firewood that you can use, based on what you learnt in class
today? 3. What are the other hurdles that stop you from using firewood with higher heat
content?
E] ACTIVITY 3
Time needed: 60 minutes
Objective: To test the thermal insulation capability of different materials
Facilitator Notes
1. Students must recall from the Heat module that some materials are good conductors of heat, while others aren’t.

113 | P a g e
2. A good conductor of heat will conduct heat away from a body that it is in thermal contact with very easily.
3. If you want something to stay hot or cold for a long time, you should make use of thermal insulators to prevent heat loss by conduction.
4. In thermos flasks, the layer of insulation used is vacuum. Recall from the Heat module that heat transfer by conduction & convection involves movement of molecules of the substances in thermal contact. So, if vacuum is used as the layer of insulation, there is no medium to allow heat transfer by these two mechanisms.
Materials needed:
1. 3-‐4 different locally available materials 2. Plastic cups of 2 different sizes (such that the smaller cup fits in the bigger one) (have
one more pair of cups than the number of materials being tested because we’ll use one insulation layer as air)
3. Thermometer 4. A way to heat water 5. Graph paper
Instructions:
1. In each of the bigger cups, cover the bottom with the insulation material. Leave one of the bigger cups empty (this is the cup for which we will use air as the insulating medium)
2. Place a smaller cup in the center of each of the larger cups 3. With the same insulating material that you used for the bottom, cover the space
between the two cups 4. Pour the same quantity of hot water in each of the smaller cups 5. Measure the temperature of the water in each of the cups for a period of 15-‐20
minutes at intervals of 2-‐3 minutes 6. Make a temperature vs. time plot for the different insulating mediums used &
determine which is the best insulator
Observations:
1. For every insulating medium used, fill out the following table: Time Temperature

114 | P a g e
2. Plot the temperatures against time for the different insulating materials used on the
same graph.
Inferences:
1. Which is a better insulator? 2. Are the materials you tested currently used as insulation?
F] ACTIVITY 4
Time needed: 60 minutes
Objective: To test the tensile strength of different locally available materials
Note to the facilitator: Before the students begin this activity, discuss what tensile strength is.
Facilitator Notes
1. The children must be familiar with ropes, which are probably used to draw water from wells, to provide support for the growth of creepers etc. An important property to consider is the maximum amount of force that can be exerted on the rope before it breaks.
2. Since different ropes are of different sizes, it will be hard to compare the force required to break it. Instead a new quantity called stress is defined. This is the force divided by the cross-‐sectional area of the rope.
3. The tensile strength is the maximum stress that the material can withstand before breaking.
4. If the stress vs. strain graph is a straight line, it means that the material is elastic.
Note: This is a good opportunity to introduce Hooke’s law, which says that for elastic materials, the force applied in stretching the material is proportional to the elongation of the material (give the example of a spring). This means that when the force is removed, the material goes back to its original elongation. So, for a purely elastic material, the graph of stress vs strain will be a straight line.
Materials needed:
1. Different locally available materials that you want to test 2. Several weights 3. Ruler

115 | P a g e
4. String 5. Graph paper
Instructions:
1. Measure the cross-‐sectional area of the material you are testing 2. Measure the initial length of the material you are testing 3. Suspend the material vertically from a solid point so that it does not move. 4. Suspend varying weights from the other end 5. Measure the extended length of the material 6. Repeat this procedure until the material breaks
Observations:
For each material that you test,
1. Cross-‐section area of the material you are testing – 2. Initial length of the material you are testing –
Weight suspended Stress (force/cross-‐sectional area)
Elongation of the material
Strain (Elongation/initial length)
3. Graph stress vs. strain
Inferences:
1. Which material has the greatest tensile strength? What purposes is this material currently used for?
2. Which material has the largest elastic region? What purposes is this material used for?