The Relation between Corporate Governance and Credit Risk, Bond Yields and Firm Valuation
Michael Bradley1, Dong Chen2, George Dallas3 and Elizabeth Snyderwine4, 5
Abstract
This study examines the empirical relations between the governance structure of public corporations in the United States and the rating and pricing of their debt securities. We study an unbalanced panel of 775 unique U.S. firms from 2001 through 2007 and identify several statistically significant relations between corporate governance factors and credit ratings, bond spreads and firm values. We find that credit ratings are negatively related to the presence of antitakeover measures for firms with speculative grade ratings and positively related to the presence of antitakeover measures for firms with investment grade ratings. Moreover, we find that spreads are positively related to the presence of antitakeover measures, and this relation is significantly stronger for firms with less than investment grade credit ratings. Our findings also suggest that more stable boards, defined as having attributes relating to board tenure, director liability indemnification and classified board structures are related to higher credit ratings and lower bond spreads. We conjecture that boards with greater stability may be better positioned to take into consideration the longer term interests of the firm as a whole, thus benefiting the firm’s creditors.
December 24, 2007
(First Draft – Comments Welcome)
Keywords: corporate governance, credit risk, credit rating, bond spreads
1 Duke University. 2 Duke University. 3 Standard & Poor’s. 4 Independent Consultant and adjunct professor (Loyola University Chicago and the University of Notre Dame). 5 The authors would like to thank the Duke Global Capital Markets Center for financial support and Standard & Poor’s and The Corporate Library both for providing data to this project, as well as for their input into the discussions surrounding our research methods. In particular we would like to recognize Cliff Griep, Laurence Hazell and Dan Konigsburg at Standard & Poor’s and Annalisa Barrett and Ric Marshall at The Corporate Library for their support and helpful insights. The opinions and conclusions expressed are those of the authors, and do not necessarily express the opinion of their employers, Duke University and Standard & Poor’s, respectively.
2
I. Introduction and Summary
This study examines the empirical relation between the governance structure of public
corporations in the United States and the rating and pricing of their debt securities. It
also examines similarities and differences between the effects of corporate governance
structures and practices on creditors and shareholders. We study an unbalanced panel of
775 unique US firms from 2001 through 2007. Our analysis proceeds in three steps.
First we examine the extent to which a firm’s various governance metrics or
characteristics (ownership structure, board structure and effectiveness, state of
incorporation, shareholder rights, transparency, disclosure and audit, executive
compensation and turnover) are related to the credit rating assigned by Standard & Poor’s
(“S&P”) to the firm’s long-term unsecured debt, controlling for the firm’s financial
condition and industrial sector.6 The purpose of this exercise is to test whether credit
ratings and credit quality are related to a firm’s corporate governance structure. We then
test whether governance metrics are related to the yields on corporate debt, given a firm’s
credit rating. Our purpose here is to examine the extent to which bond spreads may
reflect governance factors that may not be explained by the firm’s financial condition,
sector and credit rating. In the third and final part of the study we examine the relations
between governance factors and Tobin’s Q, which is a common measure of the economic
value of a firm. The purpose of this exercise is to determine whether governance factors
affect the value of the firm as a whole, or whether they affect the firm’s bondholders and
stockholders differentially.
6 This study focuses exclusively on credit ratings assigned by S&P as an indicator of credit risk. S&P’s credit ratings have been tested over time in various studies (see References), and have a demonstrated track record with regard to assessing credit risk and the potential for corporate debt default.

3
Our empirical results can be summarized as follows:
The primary determinant of a firm’s credit rating is its financial condition. This
finding replicates the results found throughout the academic literature and serves
as a building block for our subsequent analysis.
Governance attributes relating to ownership structure, shareholder rights, the audit
process, board structure and executive compensation also are shown to help
explain differences in credit ratings that are not explained by the financial
condition of the firm.
A key finding is that holding a firm’s financial condition and industrial sector
constant, the relation between its credit rating and the presence of antitakeover
mechanisms differs depending on whether the firm’s credit rating is of investment
or speculative grade. Specifically, we find a negative relation between
antitakeover mechanisms and credit ratings for firms with below investment grade
debt and a positive relation between antitakeover mechanisms and credit ratings
for firms with investment grade debt. In other words the more antitakeover
mechanisms (and implied management entrenchment), the worse the credit rating
for below investment grade bonds. Conversely, we find a positive relation
between antitakeover mechanisms and ratings for firms with investment grade
debt. One possible explanation for these results is that the ratings reflect the fact
that investment grade debt may lose value if the firm is taken over in a highly
4
leveraged transaction or by a firm that with a weaker credit profile. Clearly,
antitakeover mechanisms reduce this possibility. On the other hand, holders of
speculative grade debt could benefit from a takeover if an acquiring firm was in a
better financial condition or if the combination would generate synergistic gains
to the creditors of both firms from an operational perspective.
Thus, our results are more nuanced than those reported in two recent papers that
have focused on credit and credit ratings: Larcker, Richardson and Tuna (2004)
and Ashbaugh-Skaife, Collins and LaFond (2006) (“ACL”). These authors report
a positive relation between antitakeover provisions and credit ratings. 7 The
authors argue that strong antitakeover provisions indicate relatively weak
stockholders’ rights which translate into strong creditors’ rights.
These results are closely linked to perhaps the most important finding in our
study: a significant positive relation between credit ratings and what we regard as
attributes of board stability and discretion. We find that ratings are higher for
firms with a higher percentage of directors with 15 years of service on the board,
firms with a higher percentage of directors who hold stock, firms with classified
boards and firms whose charter, bylaws and compensation agreements provide for
director liability and indemnification. This cluster of attributes suggests that
boards with greater tenure, firm and sector knowledge, financial exposure, and
protection from liability may be better positioned to take a long term perspective
and have a greater ability to exercise discretion relative to executive management. 7 They do not analyze separately investment and speculative grade debt.

5
In a fiduciary context, this suggests that more established directors and boards
may be better equipped to act as longer term stewards for the firm as a whole –
including creditors and possibly other non-financial stakeholders, and not focus
exclusively, or disproportionately, on the potentially short-term interests of
certain shareholders, which could include hedge funds. This finding is
particularly interesting in that it challenges the conventional wisdom that long
standing, indemnified and entrenched boards lose their objectivity over time to the
influences of executive management. Indeed, our findings suggest the opposite
might be the case, at least from a creditor’s perspective.
In short, we find that credit ratings are higher for firms with stable boards and
lower for firms with entrenched management. These two findings fit nicely
together. It suggests that stable boards that may be better positioned to exercise
discretion vis a vis management will also be better positioned to address takeover
situations in ways that will balance the interests of shareholders, creditors – and
perhaps other stakeholders as well.
For the most part, the results of our analysis of bond spreads mirror those of our
analysis of credit ratings.8 Credit ratings are the primary determinants of spreads
– the higher the rating, the lower is the spread between the yield on the bond and
the yield on a U.S. Treasury bond with the closest maturity. Our results indicate
that, by and large, governance variables that are positively related to ratings are
8 All of the financial variables except for firm size and subordinated debt have the opposite signs in the ratings and spread regressions.

6
negatively related to spreads.9 Importantly, this is the case with regard to the
index of board stability that we develop which proves statistically significant both
for credit ratings and for bond spreads. We also find the relation between spreads
(the risk premium) and antitakeover mechanisms is positive and stronger for firms
with speculative grade debt. Since our analyses of bond ratings and bond yields
are based on different samples, these results lend credibility to our methodologies
and findings.
Finally, we find that a number of our governance variables that affect bond ratings
and bond yields – including our board stability index – are unrelated to Tobin’s Q,
which is a measure of the economic value of the firm. We infer from these results
that a number of governance factors that are significant for creditors are not
relevant for stockholders—thus suggesting that creditor and shareholders may
have differential preferences regarding corporate governance structures and
mechanisms. It is worth noting, however, that the presence of blockholders is
associated with a lower Tobin’s Q. This suggests the risk that both creditors and
minority shareholders may be negatively impacted by the actions of block
holders.10
9 The notable exception is the percentage of directors who hold none of the firm’s shares. This variable is negatively related to both credit ratings and credit spreads. This suggests that the market may interpret certain governance factors different from the implications reflected in credit ratings. 10 The literature refers to this phenomenon as the private benefits from control. See e.g. Barclay and Holderness (1989).
7
II. Research Contribution
We believe that the conclusions reached by this study have relevance both for
practitioners and academics in better understanding how corporate governance impacts
credit quality and the market’s perception of credit risk. While there is an extensive and
growing literature on the relation between governance attributes and security pricing, we
believe that this study adds significantly to this burgeoning literature. Specifically, our
study is distinguished from earlier research in terms of scope, methodology, and time
horizon.
Our results are based on seven years of data (2001 – 2007), as opposed to other studies
which typically provide only a one-year snapshot. A major benefit of our longer
timeframe is that we are able to show that a number of results that have been reported in
the literature are only relevant over a very short time period.
We employ additional governance variables in our analysis to test for relations with
credit ratings and bond yields. We examine the yields of seasoned bonds that are trading
in the market rather than the yields of newly issued bonds. Analyzing the prices of
seasoned bonds trading in the market avoids potential distortions due to the uncertainties
and transaction costs associated with a new issue, and this arguably presents a more
refined view of the market’s perception of risk as embodied in corporate bond yields.
The research team combines academic researchers with strong practical experience
together with practitioners with a solid grounding in the research literature relating to
8
corporate governance. This academic/practitioner combination arguably blends theory
together with practice, and contributes to the development and testing of research
questions that are informed from professional or “clinical” experience.
Our research extends and tests the insights of recent corporate governance scholarship by
examining whether there is a relation between credit quality and corporate governance
and, if so, how this relation may affect the pricing of corporate bonds.
To date, corporate governance research has focused more extensively on measuring the
link between good and bad governance and firm or equity valuation. The most notable
papers in the US literature include Gompers, Ishii, and Metrick (GIM, 2003) and
Bebchuk, Cohen and Ferrell (BCF, 2004). Both sets of authors show that valuation
multiples during the 1990s are significantly related to corporate governance
characteristics. The GIM Index (“GINDEX”) of twenty-four governance provisions,
essentially created from IRRC’s database of listed firms’ antitakeover provisions in the
1990s, is a scoring system which rates firms as having either strong or weak shareholder
rights. GIM show that firms with higher index values, i.e., weak shareholder rights,
which they interpret as an indication of poor governance, have lower valuation multiples.
BCF test GIM’s results and find that only six of the twenty-four governance provisions
are material. Brown and Caylor (2005), using data from ISS, affirm BCF’s results by
showing that only a small subset of governance factors in the public domain are related to
firm valuation.
9
Several recent papers have attempted to link corporate governance and credit or bond
ratings. There is a divergence of views relating to the trade off between good and bad
governance and what benefits shareholders and bondholders. Adopting aspects of a
corporate governance framework developed by S&P11, Ashbaugh, Collins and LaFond
(2006) (“ACL”) examine which factors are likely to affect the cost of debt financing and
find that firms with higher values of the GINDEX the higher the firm’s credit rating-- e.g.
credit ratings are higher when shareholders rights are weaker. They also find that credit
ratings are negatively associated with both the number of block holders who own at least
5% and CEO power on the board while credit ratings are positively related to: 1) weaker
shareholder rights in terms of takeover defenses; 2) the degree of financial transparency;
3) overall board independence, (4) board stock ownership and (5) board expertise. ACL
show that moving from the lower quartile to the upper quartile of the GINDEX doubles a
firm’s chances of receiving an investment grade credit rating. In so doing they also
suggest that weak governance can result in firms incurring higher debt financing costs.
Several other papers have attempted to show a link between governance factors, credit
ratings, and bond yields. Bhoraj and Sengupta (2003) link corporate governance
mechanisms to higher credit ratings and lower bond yields, showing that firms with
greater institutional ownership and stronger outside control of the board enjoy lower bond
yields and higher ratings on their new bond issues. In addition, they suggest that the
governance mechanisms which they tested can reduce information asymmetry between
firms and lenders. A recent paper by Billett King and Mauer (2004) provides empirical
11 See S&P’s corporate governance scoring criteria (in References). Note that this governance criteria has been applied separately and independently from S&P’s credit rating process.
10
evidence that takeovers can benefit bondholders because of a so-called co-insurance
effect: the reduction of overall firm risk due to operational diversification of firm
businesses after mergers. Klock, Mansi and Maxwell (2004) maintain that strong anti-
takeover provisions are associated with a lower cost of debt financing while weak anti-
takeover provisions are associated with a higher cost of debt financing. Larker,
Richardson and Tuna (2004) conclude that firms with large boards and anti-takeover
provisions tend to have better debt ratings and lower abnormal accruals while Litov
(2005) builds evidence that firms with weak shareholder rights have lower bond yields
when issuing debt and have higher credit ratings. Cremers, Nair and Wei (2006)
investigate the effects of shareholder governance mechanisms and maintain that the
impact of shareholder control on credit risk depends on takeover vulnerability.
Shareholder control is associated with higher yields if the firm is exposed to takeovers.
To our knowledge, ours is the only study that examines the effects of a comprehensive set
of governance factors on both bond ratings and bond yields. In contrast, much of the
previous research examines either the relation between governance and only ratings,
presuming that yields would be determined accordingly, or the relation between only a
small set of governance factors and ratings and spreads (Bhoraj and Sengupta (2003)).
While ratings are primary determinants of bond yields, we find that the market implicitly
“prices” other factors, including factors related to the firm’s governance attributes.
11
III. Scope, Data Selection, and Sources
This paper addresses the importance of corporate governance from the perspective of
corporate credit risk – namely the risk that a company may not be able or willing to honor
contractual debt service obligations to its creditors. In many ways, creditors share similar
interests with shareholders, since both typically have an interest in the firm’s financial
and operational performance over time. Also, in many instances, the investment
institutions may own both debt and equity securities of the same company. Moreover,
past corporate governance scandals have affected not only equity valuations of scandal-
affected companies, but also the value and credit quality of public and private debt issued
by these same firms.
However, creditor and shareholder interests are not identical in many situations including
takeovers, leveraged buyouts and when the company is operating in the vicinity of
insolvency. Hence we believe there is need for a better understanding of creditors’
perspectives on corporate governance, including the extent to which governance factors
are linked with measures of credit risk (using S&P credit ratings) as well as in the pricing
of bonds that are traded in the marketplace.
A. Corporate Governance Variables and Data
Of course, the selection of independent variables capable of capturing the many facets of
corporate governance is limited by data availability. Beyond this obvious limitation, we
seek to select variables that allow us to assess the mechanism by which corporate
governance factors affect credit quality or the perceptions of investors in the pricing of

12
corporate debt. To this end, we build on and extend a framework developed by S&P
designed to measure and analyze corporate governance attributes dating back to the late
1990s. The framework is based on four main components or categories:
• Ownership Structure and External Influences
• Shareholder Rights and Stakeholder Relations
• Transparency, Disclosure and Audit
• Board Structure and Effectiveness
This same general S&P framework is also employed (and cited) in ACL. The S&P
framework was first developed in 1999, and was based on factors arising in statute, “soft
law” or codes of conduct, listing requirements and a vast literature relating to governance
practices. These criteria were drafted with an eye toward global application and were
guided in part by the transnational corporate governance principles published by the
OECD in the late 1990s.12 The focus was on assessing those factors that affect the
relations between officers and directors on the one hand, and the firm’s financial
stakeholders (shareholders and creditors) on the other.
We complement the S&P framework by adding three additional independent variables:
(1) executive compensation; (2) executive turnover; and (3) whether the firm is
incorporated in Delaware. Note that the original S&P framework actually includes
executive compensation and turnover as a subset of broader category: board structure and
effectiveness. For our study we deconstruct this group of governance variables and
analyze each component separately. Francis, Hasan, John, and Waisman (2006) provide
12 Organization of Economic Cooperation and Development, “OECD Principles of Corporate Governance,” 1999.
13
evidence that Delaware incorporated firms have higher cost of debt through higher bond
spreads. They argue that different state laws, especially state antitakeover laws affect the
cost of capital. The fiduciary orientation of directors in Delaware incorporated firms is
also more clearly framed in terms of shareholder interests, as opposed to the interests of
the firm as a whole, which can include stakeholders such as creditors.13 We thus include
the Delaware incorporation dummy as a separate governance category.
While our study employs and extends the general framework developed by S&P, the
governance variables we employ are not proprietary to S&P. All data are publicly
available from either The Corporate Library (TCL) or Investor Responsibility Research
Center (IRRC), who in turn obtain data from regulatory filings and disclosures including
annual reports, 10Ks and proxy statements.
The basic corporate governance data are fundamentally “architectural” in nature, in that
they represent architectural or structural features of corporate governance, for example,
the levels of non-audit fees, the percentage of independent directors and the like. This
has the benefit of allowing for a large number of companies in the sample with a
transparent and objective basis of comparison. While there is merit in an architectural
approach of this nature, it must be recognized that there are also limitations to this
approach from an epistemological perspective. Perhaps most fundamentally, this
approach focuses on data that are readily measurable, which is at best only a proxy for
what we ultimately hope to measure or equate to corporate governance. Ultimately, this is
a question of principles over rules. For example, we are less interested in understanding 13 See note 37 infra.
14
the percentage of independent directors on the board than we are in understanding if this
is linked to more important, but less-directly measurable, attributes such as integrity,
fairness, accountability and effectiveness. In this process of research we must recognize
that these “softer” overarching principles are what ultimately reflect corporate
governance in its truest sense, and that the data collected is a scientifically legitimate, but
still imperfect, proxy to represent these principles in an empirical test. In this regard it is
important to recognize specific architectural features of corporate governance should not
be regarded as ends unto themselves. This is a limitation shared by other similar research
approaches in governance, including some that may leave the impression that specific
packages of corporate governance attributes are intrinsically the same thing as good or
bad corporate governance.
It should also be noted that the variables in this study do not include aspects of
stakeholder relations, corporate responsibility or social / environmental disclosure that
are increasingly being linked to the mainstream discussion of corporate governance.
However this suggests potential scope for a future research project stemming from our
study to address how these broader social variables may help to explain credit rating
levels or bond spreads.
We do not discuss each corporate governance variable used in the study. Tables 1 and 2
present definitions, type and the source of all of the data used in the study. However
below we discuss the nature and relevance of each of the seven main categories of our
analysis.

15
Ownership Structure. For this component we have three variables: shareholdings by all
insiders, institutional ownership, and block shareholdings. These relate to differing
degrees and forms of ownership. Ownership can be a critical dimension to overall
corporate governance, particularly in cases where the interests of block holders may not
be aligned with those of smaller financial stakeholders. While insider ownership may
align the interests of a management and director team with that of shareholders, whether
and to what extent this is beneficial to creditors is an empirical issue. In cases where
ownership is widely dispersed, the governance risk is that no individual shareholder will
be in a position to exert meaningful influence over the managers acting as the
shareholders’ agents. In such cases, institutional investors have the potential to play a
more meaningful role in terms of influence and engagement than individual shareholders,
which in principle is a positive feature.14 There are conflicting views and evidence as to
whether specific forms of ownership are intrinsically positively or negatively related to a
firm’s financial performance. However other credit related research (ACL) has suggested
that the presence of block holders has a negative impact on credit ratings. For purposes of
our study we believe it is important to test for ownership structure, if nothing else as a
control variable. We use the percentage of institutional shareholdings and the number of
block holders as proxies for institutional and block holdings.
Shareholder Rights and Stakeholder Relations. Our shareholder rights variables have
been featured prominently in many corporate governance research studies. This is in part
because they are readily measurable, and because they link directly with the ability of 14 This is still an aspiration in terms of the behavior of many institutional investors.
16
shareholders to influence the governance of the company they own through exercising
rights established in the company’s charter or bylaws. Both GIM and BCF provide some
empirical support for the notion that antitakeover measures lead to management
entrenchment and decreased firm value. From a creditor perspective, however, the
relevance of shareholder rights is less obvious, and possibly a source of conflict.
As much of the literature argues, antitakeover measures reduce the degree to which
managers are monitored by agents in the market for corporate control, which leads to
higher agency costs and lower equity values. Moreover, if the managers are sufficiently
entrenched, they can unilaterally veto a takeover bid and preclude their stockholders from
receiving a takeover premium. But for creditors, antitakeover provisions have quite
different implications. Takeovers or other related activity, especially those with highly
leveraged financing, increase the risk of current creditors and hence impact their wealth
negatively. But mergers by companies in different lines can also decrease the overall risk
level of the combined company through this operational diversification. This “co-
insurance” effect can benefit creditors in specific cases. There is empirical evidence
supporting both propositions.15 .
While GIM suggests that an index (the “GINDEX”) composed of twenty-four major
antitakeover provisions as an anti-takeover measure, BCF argue that most of the
components in the GINDEX do not exert meaningful antitakeover forces. They find that a
15 While ACL, Larcker, Richardson, and Tuna (2004), Klock, Mansi, and Maxwell (2005) suggest that anti-takeover measures are viewed positively by either credit rating agencies or bond traders, Billett, King, and Mauer (2004) find that bonds of target firms earn positive announcement period returns during mergers and acquisitions, especially those with ratings below investment grade, which is consistent with our findings.
17
more refined entrenchment index (EINDEX), comprised of only six variables captures all
the significance of GINDEX on firm valuation.16
Out of the twenty-four GINDEX components, we create a new index, termed BINDEX,
by adding the indicator variables (0 or 1) for the presence of director liability protection,
director indemnification, and a classified or staggered board. We argue that this index
proxies for the level of board stability and discretion. A higher value of this index
indicates that the director team may be more conservative or better positioned to exercise
greater discretion to focus on the longer term perspective of the firm. We use the tenure
of the CEO as a separate measure of management stability (entrenchment).
The entrenchment of executive managers or directors may create incentive problems that
negatively impact a firm’s shareholders. However, whether entrenchment is also harmful
to creditors is not so obvious. On the one hand, creditors are also disadvantaged by
potential incentive problems that may decrease the company’s performance. On the other
hand, however, entrenchment could also represent a more stable management/director
team and hence suggest more stable corporate policies/strategies. Bertrand and
Mullainathan (2003) provide evidence that entrenched management follow more
conservative policies.
Transparency, Disclosure and Audit. High standards of transparency, disclosure and
audit practices are governance attributes of importance to both shareholders and creditors,
though in many cases credit rating agencies may benefit from direct access to corporate 16 See Table 2 for the components of EINDEX and GINDEX.

18
managers and information, and are therefore less constrained by what is publicly
disclosed. A study by S&P of US listed companies concludes that disclosure does not
differ notably from company to company, given the conformity to U.S. GAAP and SEC
mandated disclosure standards.17 However, we have identified several relevant variables
relating to the audit process in our study. These include: the percentage of non audit fees
to total auditor fees, the number and frequency of restatements and incidents in which the
SEC has found a material weakness in the firm’s internal control as dictated by Section
404 of SOX.
Following recent developments in financial accounting, we entertain a variable that
proxies for the quality of a firm’s reported earnings. Ecker, Francis, Kim, Olsson and
Schipper (2006) (“Ecker et al.”) argue that the quality of a firm’s earnings is a priced
factor in establishing capital market equilibrium. They calculate what they refer to as
“E-loadings” which reflect the quality of a firm’s earnings. This E-loading variable can
be viewed as a governance variable that proxies for responsible financial stewardship.
The measure is based on the standard deviation of the residuals of a time-series of the
firm’s total current accruals on past, present, and future values of the firm’s cash flows
from operations, its most recent change in revenues and the level of the firm’s property,
plant and equipment for each of the preceding five years.18 The measure is further refined
17 Patel, Sandeep A. and Dallas, George S., “Transparency and Disclosure: Overview of Methodology and Study Results – United States,” (October 16, 2002). Available at SSRN:http://ssrn.com/abstract=422800 or DOI: 10.2139/ssrn.422800. 18 The intuition is that if there is a meaningful and sustaining relation between a firm’s reported earnings and its cash flows, then we can conclude that the reported earnings are of high quality. Alternatively, if there is no relation between reported earnings and cash flow, then we can conclude that the reported earnings are of low quality.
19
by calculating the degree of volatility that can be attributed to managerial intervention
and that which can be attributed to the inherent nature of the firm’s businesses.
The E-loadings are then obtained by entertaining a four-factor asset pricing model that
includes the Fama-French three factors (market return premium, firm size, market-to-
book) and the above measure of earnings quality as the fourth factor. The E-loadings are
the coefficients on this measure. Note that this measure represents the inverse of the
quality of firm’s earnings. A high E-loading value implies a high variance in the
accruals’ regression and a low quality of (reported) earnings. In order to facilitate
exposition and provide a more intuitive interpretation of the effects of this variable on
credit scores, we multiply the E-loading for each observation by -1 and denote the
resulting variable Earnings Quality (EQ). Thus, in this reformulation, the higher EQ, the
higher the quality of the firm’s reported earnings and, presumably, the higher (better) the
firm’s credit rating.
Board Structure and Effectiveness. Board effectiveness is a key aspect of corporate
governance, and both creditors and shareholders have mutual interest in a strong board to
provide oversight of management for the protection of financial stakeholders. In our
study, this category contains the greatest number of variables, in part reflecting the
presumed importance of the board in overall corporate governance. It is also the case that
a number of different aspects of board structure are directly measurable from data
provided in proxy statements and other corporate disclosures. Several variables relating
to committee structures and board independence (the percentage of independent directors,
20
and indicator variables designating if the audit committee is wholly independent, the
compensation committee is wholly independent, and the nomination committee is wholly
independent) are likely to be homogeneous among the sampled companies, given the
influence of NYSE and NASDAQ listing rules. Other less homogenous variables include
board size, the percentage of long tenured (over 15 years) directors, the percentage of
“mature” directors (over 70 years old), the percentage of directors who hold at least 4
other directorships, the percentage of directors who failed to attend at least 80% of all
board meetings, the percentage of directors who do not have any equity holding, whether
the CEO is also chairman, whether there is a lead director, and a proxy for the normal
functioning of the board such as the number of board meetings. Empirically, there is
mixed evidence about certain governance attributes which are typically linked to board
effectiveness. These include areas such as the role of board independence as well as
whether the Chairman and CEO roles should be combined or separate.
State of Incorporation. The debate regarding whether competition among states for
corporate charters create a “race to the bottom” or “race to the top” has been in the
literature for the past three decades. Daines (2001) finds that Delaware incorporated firms
have higher firm value. He argues that this is due to the higher likelihood of being taken
over for Delaware incorporated firms relative to other jurisdictions that allow for more
substantive takeover defenses. Subramanian (2004), however, challenges Daines’
conclusion by noting that the “Delaware effect” is mostly driven by small firms. While
the question of whether state incorporation has a differential effect on firm performance
is unsettled, Francis, Hasan, John, and Waisman (2006) provide evidence that Delaware
21
incorporated firms have a higher cost of debt through higher bond spreads. We further
test whether Delaware incorporation (Delaware) has differential effect on firms’ credit
ratings and bond spreads in this paper.
Executive Compensation and Turnover. Since excesses in executive compensation stand
out as a fundamental governance issue, this category warrants examination on its own.
On the surface, executive compensation is more of a concern for shareholders than
creditors, particularly in situations where options granted to executive management are
not accompanied by pre-emption rights to existing shareholders or in situations where
there is a large dilution overhang. Also, from a creditor’s perspective, for many
companies in our sample the interest coverage ratio for a CEO with compensation of $20
million will not differ materially from the interest coverage ratio for a CEO with
compensation worth $2 million. At a deeper level, however, abuses of executive
compensation signal weak board oversight generally, in a way that should be a concern
both to creditors and shareholders. Consequently we include in this category a range of
variables which may affect the quality of governance including: CEO base salary as a
percentage of CEO total compensation, CEO bonus as a percentage of total
compensation, and CEO percentage shareholdings, dilution as proxied by the options
granted to executives as a percentage of total shares outstanding and CEO tenure. For the
regression analysis on overall firm performance (Tobin’s Q), we also include the
percentage of total CEO compensation based on incentive contracts.
B. Credit Variables and Data
22
We use S&P’s credit ratings as a measure of the credit risk of individual companies. Note
that the credit rating process is fundamentally an assessment of a company’s financial
strength (specifically its vulnerability to default) and the operational or business risk
factors that may influence a company’s financial position over time. A multitude of
factors are taken into consideration in individual credit ratings at S&P. This typically
includes consideration of country risks, industry risks, competitive risks and financial risk
relating to earnings, cash flows, liquidity and balance sheets. It also can include
consideration of management and governance related factors that are viewed as material
to a company’s financial strength. These factors are assessed on a case by case basis by
individual rating committees. It is important to note that in the S&P credit rating process,
there is no formulaic algorithm employed to “score” a company’s corporate governance
in a way that has a mechanical relationship to the final rating outcome. Hence it is not
circular to test for the relations of specific governance variables to S&P credit ratings.
Antitakeover defenses warrant particular attention in this regard. At S&P, shareholder
rights are not an explicit component of the credit rating criteria and are not systematically
assessed as part of the credit rating process. As discussed previously, takeovers,
particularly highly leveraged takeovers, can have the effect of destabilizing a company in
a way that can impact creditors more than shareholders, it is also the case that in other
situations takeovers can be positive from a credit perspective. This can be the case when
a takeover results in a stronger, more business profile and/or a stronger consolidated
financial position. Ex ante, it is not possible to fully anticipate the magnitude or direction
of a takeover event on a company’s credit quality.
23
The ratings used in this project are S&P’s long term issuer credit ratings as reported in
COMPUSTAT, a product of S&P. For purposes of the econometric estimations, S&P
credit ratings are grouped into seven categories (see Table 1 for the specific methodology
for grouping).
Coding the dependent variable in this fashion is a recognition that S&P’s ratings’ are not
scaled on a linear basis. Actual default and yield experience suggests that these
relationships are in fact non-linear, particularly in the differences between the A and BBB
categories and the BBB and BB categories (the latter distinction separating “investment
grade” from “speculative grade” risk). The non-linearity in credit scores requires the use
of ordered logistic regression in the empirical tests.
C. Bond Market Variables and Data
Our bond market yields are taken from a proprietary data base of S&P that contains
prices of all rated corporate bonds at a particular point in time. We chose to sample firms
after the first quarter of each year to best match in time the firms’ disclosures relating to
its financial statements and corporate governance structure. Specifically, we sampled
bond prices as of the end of the trading day in March for the years 2002-2007. The
sample includes only senior unsecured corporate debt. Based on the S&P data we
compute each bond’s yield-to-maturity and calculate the bond’s spread by subtracting the
yield-to-maturity of a U.S. Treasury bond with the closest maturity date.
24
D. Accounting/Financial Variables and Data
All credit ratings and financial ratios are taken from COMPUSTAT and are defined by
Data Item(s) in Table 1.
IV. Empirical Evidence
A. Financial Condition, Governance and Credit Ratings
1. Full Sample
Our sample consists of an unbalanced panel of publicly traded corporations covering
2001 to 2007. After merging data from COMPUSTAT, CRSP, The Corporate Library
(TCL), the Investor Responsibility Research Center (IRRC) and Thompson Financial
(TF), we are left with roughly 500 firms in each year or 3,209 firm years representing 775
unique firms. (See Tables 1 and 2 for definitions and sources of the data used in this
study.)
Table 3 presents our main results regarding the extent to which corporate credit ratings
reflect a firm’s financial condition on the one hand and its governance structure on the
other. We begin with a model of credit ratings based on a firm’s financial data which
was developed by ACL.
Following ACL, we perform a series of Ordered–Logit Regressions in which the
dependent variable is a seven-categorical grouping of the credit ratings assigned by S&P,
25
with the highest rating corresponding to the highest ordinal value.19 Reported in Table 3
are the estimates of the coefficients of five Ordered-Logit regressions. A positive
coefficient indicates that higher values of the independent variable lead to higher (better)
ratings for the firms’ senior unsecured long-term debt.20 A negative coefficient indicates
that higher levels of the independent variable correspond to lower credit ratings. All of
the regression models reported in this study include year and Fama and French 48-
industry fixed effects. In addition all standard errors are “clustered” at the firm level.21
The independent variables in these regressions are broadly divided into six categories:
(1) Financial Data; (2) Earnings Quality 22 ; (3) Ownership Structure; (4) Executive
Compensation and Tenure; (5) Board Structure; and (6) Governance Indexes. Model 1 in
Table 3 reports the relations between a firm’s credit rating, its financial condition and its
GINDEX. Model 2 in the table reports the relations between our governance variables,
earnings quality, GINDEX and credit ratings without regard to the firm’s basic financial
data. Model 3 includes both financial and governance variables.
19 Specifically, rate=1 if Rating<=CCC+; rate=2 if CCC+<Rating<=B+; rate=3 if B+<Rating<=BB+; rate=4 if BB+<Rating<=BBB+; rate=5 if BBB+<Rating<=A+; rate=6 if A+<Rating<=AA+; rate=7 if Rating>AA+. (COMPUSTAT Data Item 280). 20 The rating assigned by S&P to a firm reflects its assessment of the risk (probability) that the firm will default on its senior, unsecured, long-term debt. 21 It is critical to cluster the standard errors by firm, since most of our independent variables are persistent through time. Failure to cluster the standard errors leads to an underestimate of the standard errors of the estimates and an overestimate of the t-statistics. See Petersen (2007). Since much of the literature ignores the effects of clustered standard errors, a number of results reported in this paper are inconsistent with much of the existing literature. We believe that these inconsistencies are due to the authors not clustering standard errors by firm. As noted elsewhere in another context, we can replicate the literature if we ignore clustering and other appropriate econometric issues. 22 Since our measure of earnings quality is based on accounting data as well as the extent of earnings management in the firm, it is not clear whether we should include it with the financial data or governance data. We therefore chose to report it separately, particularly since it is such a significant explanatory variable. However, to the extent it can be viewed as a proxy for responsible financial stewardship it appropriately can be regarded as a governance variable.
26
The results of Model 1 in Table 3 show that the coefficients on all of the financial
variables have the expected signs and all are statistically different from zero. Thus, credit
ratings are higher (1) the larger the firm’s market capitalization; (2) the lower the firm’s
leverage ratio; (3) the higher the firm’s return on assets; (4) if the firm has not realized
negative earnings over the past two years; (5) if the firm has no subordinated debt
outstanding; (6) the higher the firm’s interest coverage; and (7) the more capital intensive
the firm’s production function. These relations are highly significant, robust to almost all
specifications of the statistical model and are consistent with the findings reported by
ACL.
Interestingly, Model 1 shows no significant relation between ratings and the GINDEX.
Recall that the GINDEX is purported to measure the degree of shareholder power relative
to the power of the firm’s management.23 A high GINDEX indicates that the firm has
extensive antitakeover devices in place and is therefore under the control of its
management. GIM call these firms “dictatorships”, emphasizing the relative strength of
management versus stockholders. On the other hand, a low GINDEX indicates that the
firm has relatively few anti-takeover devices in place, which increases the power of
stockholders and decreases the power of the firm’s officers and directors.
Our finding that GINDEX is unrelated to credit scores is inconsistent with the findings
reported by ACL. We should note that we can replicate the ACL results, including their
results regarding the negative relation between GINDEX and credit ratings, for the one
year of their study (2003) if we use their coarser industry classification – a dummy 23See Table 2 for the variables included in the GIM index.

27
variable set equal to one if the firm is a utility or is in the financial services industry.
However, when we extend the data from 2001 to 2007, and use the Fama-French 48-
industry classifications, we find that this relation is insignificant.24
Model 2 replaces the financial variables in Model 1 with the firms’ governance variables,
including the measure of earnings quality as developed by Ecker et al. and discussed in
the previous section. The purpose here is twofold: first, to examine the relative
importance of governance metrics relative to financial metrics in explaining credit
ratings; and second, to identify the governance variables that are most related to credit
ratings.
The results reported in Table 3 indicate that credit ratings are in fact significantly
positively related to earnings quality, which suggests that S&P credit ratings do reflect
the quality of a firm’s reported earnings.25 Indeed, looking across the row of the table,
this variable is highly significant in all specifications of the model. Higher earnings
quality is associated with higher credit ratings.
Two ownership-structure variables are negatively related to a firm’s credit rating: the
number of stockholders who hold 5% or more of the firm’s outstanding stock and the
percentage of shares held by insiders. One interpretation of the negative relation between
ratings and the number of block holders stems from the fact that creditors may be wary of
potential takeovers, since bondholders of target firms often suffer significant capital
24 In our analysis we found a number of relations that hold in some periods (years) but not in others. Thus, researchers are to be cautioned about drawing general conclusions based on only one or two years of data. 25 These results are consistent with S&P credit rating criteria.

28
losses26 and a greater number of block holders increases the likelihood of a takeover
bid.27 Alternatively, a large number of block holders suggests that management would be
more inclined to side with shareholders regarding any conflict of interest with
bondholders. Finally, it is possible that large block holders derive certain “private
benefits from control” that come at the expense of the firm’s other financial stakeholders
– stockholders and creditors alike. 28 Of these three possibilities, the last is most
consistent with the empirical results we report subsequently. We find that the number of
block holders is negatively related to Tobin’s Q, which is a measure of the “economic”
value of a firm. Thus, we find that both creditors and (diffuse) stockholders may be
disadvantaged as the number of block holders increases.
The negative relation between credit ratings and the percentage of shares held by insiders
is a curious result. One interpretation is that the more shares held by insiders the more
sympathetic the management would be to its shareholders in any dispute involving the
firm’s creditors. It is also the case that insider ownership might increase the potential for
self dealing.
The results of Model 2 regarding executive characteristics indicate that credit ratings are
lower the longer the tenure of a firm’s CEO. This result is understandable if tenure is a
proxy for “entrenchment.” Managers who are immune from the pressures exerted by the
forces in the market for corporate control, both internal and external, do not have the
26 See, e.g,, Bradley, Desia and Kim (1988) 27 See Cremers, Martijn, and Nair (2005), who find that the number of block holders and takeover vulnerability increase the likelihood of a firm being taken over. 28See e.g. Barclay and Holderness (1989).

29
same incentives to maximize the value of the firm’s securities and, as a result, the firm’s
credit rating suffers. An alternative explanation is that long-tenured CEOs may be the
result of a family-controlled corporation, in which the operating strategy is not
necessarily to maximize the value of the firm’s outstanding securities. Interestingly, we
find a negative relation between CEO salaries and credit ratings, although the statistical
significance diminishes once the accounting variables are included in the model.
A number of variables relating to the structure of the board are significantly related to
credit ratings. Board size is positively related to credit ratings, and this is true even when
the size of the firm and its capital structure are held constant. (See Models 3-5.) This may
be due to the simple fact that larger firms require larger boards in order to carry out the
numerous fiduciary duties and responsibilities imposed by State and Federal regulations,
the SEC and the various exchanges. This evidence is consistent with Anderson, Mansi,
and Reeb (2004) and Larcker, Richardson, Tuna (2004). The data also indicate that the
greater the percentage of independent directors on the board and the greater the
percentage of directors with more than 15 years with the firm, the higher the firm’s bond
rating. These latter two results suggest that stable, outside directors are beneficial to a
firm’s credit quality.29
Unlike the results regarding managers, credit ratings are positively related to the tenure of
the board of directors, as measured by the percentage of board members who have served
the firm for 15 years or more. Thus, credit ratings are higher the longer the tenure of the
firm’s board members and the shorter the tenure of the firm’s CEO. This suggests that 29See e.g., Bhagat & Black (2002) regarding the effectiveness of outside v. inside directors.
30
from a credit perspective, managers and directors are not viewed through the same lens.
Another example of this is the fact that the greater the percentage of shares held by
CEOs, the lower the credit rating, although this relation is not statistically significant.
However, credit ratings are significantly negatively related to the percentage of directors
who hold zero of the firm’s equity. In sum, credit ratings are positively related to the
length of service and the number of shares held by directors, but are negatively related to
these variables with respect to CEOs. While on the surface this result is counterintuitive,
the explanation from a credit perspective might also be linked to the potential for short
term “equity capture” – for example, when a CEO or short term activist shareholders with
a large equity stake may favor disproportionately or unfairly the interests of short term
shareholders relative to creditors. More stable boards, on the other hand, may be more
conservative in their strategies in a way that might be supportive of longer term interests
of creditors and possibly other nonfinancial stakeholders. Finally, the results of Model 2
are consistent with those reported under Model 1 regarding the fact that there is no
significant relation between credit scores and GINDEX.
Model 3 contains both financial and governance variables. The results show that the
addition of the governance variables does not diminish the significance of the financial
variables. All of the coefficients of the financial variables have the expected signs and all
are highly significant. Moreover almost all of governance variables retain their signs and
significance levels when the financial data are added to the model. This implies that
there is information in the governance variables regarding credit ratings that is not
reflected in the firm’s financial data and vice versa.

31
Both the number of 5% block holders and the number of shares held by insiders continue
to be negatively related to credit ratings even after the accounting variables are added to
the model. Again, we conjecture that these results are due to the potential conflict
between controlling stockholders and creditors. As in Model 2, the tenure of the
management is negatively related to credit ratings, while credit ratings and the tenure of
the board of directors are positively related. Again, as in Model 2, the results from
Model 3 suggest that the number of shares held by the CEO is negatively related to credit
ratings (although the relation is not statistically significant), whereas the percentage of
the board that holds zero equity in the firm is negatively related to credit ratings. Board
size continues to be positively related to credit ratings. Finally, note that the GINDEX is
not related to credit ratings in this specification.
The results of Model 3 suggest that credit ratings reflect differences between managers
and directors. The results suggest that credit ratings are higher the greater the percentage
of the firm’s directors with 15 or more years of service and the lower the percentage of
directors who hold none of the firm’s stock. In contrast, ratings are lower the greater the
tenure of the firm’s management and the more shares held by the firm’s management.
In order to better examine the conflicting results regarding officers and directors, we
combine a subset of the factors of GIM’s GINDEX into two separate indices. The first is
the “entrenchment index” (EINDEX) defined by Bebchuk et al. and is calculated as the
sum of six indicator variables whose value is one if the indicated characteristic is present

32
and zero otherwise. The variables include: golden parachutes, limits to amend bylaws,
limits to amend charter, poison pills, staggered boards and supermajority requirements.
The second index we construct, BINDEX, is designed to capture the stability and
discretion of the board in overseeing the affairs of the company. Specifically, BINDEX
is equal to the sum of six indicator variables, each of which is equal to 1 if the stated
condition is met and zero otherwise. The indicator variables are (1) the presence of
charter amendments that limit the director’s liability; (2) whether the directors are
indemnified by the firm’s charter or bylaws; (3) whether the directors are indemnified by
contracts with the firm, and (4) whether the firm has a classified (staggered) board. The
higher the value of the index, the greater is the stability and potential discretion of the
board.
Note that the two indexes that we employ draw a distinction between directors and
executive management. The vast majority of the literature in this area ignores any
distinction between the two. From a credit perspective the distinction might reflect a
tendency of executive management on the one hand to be “captured” by short term
shareholder interests, and the resulting need for strong board directors on the other hand
to temper undue equity bias – in the spirit of exercising long term fiduciary stewardship
for the firm as a whole (including creditors and other stakeholders).
The careful reader will have noticed that the presence of a staggered board is included in
both EINDEX and BINDEX. A staggered or classified board gives the directors a certain
degree of stability of tenure, since each director comes up for election typically once ever

33
3 years. However, a number of legal scholars have argued that a staggered board is
perhaps the most effective entrenchment device available to management. 30 Since a
staggered (classified) board can have these two opposing effects, we include it in both
indexes.31
The first thing to note in Model 4 is that the addition of these two independent variables
(BINDEX and EINDEX) does not affect any of the signs of the independent variables in
Model 3 nor their statistical significance. BINDEX, our index of board
stability/discretion, is positively related to credit ratings. In contrast, EINDEX is
negatively related to credit ratings. Thus, it appears that credit ratings positively reflect
stable and unencumbered boards, but not entrenched management. The opposite signs on
these two variables suggest that the positive relation between the GINDEX and credit
scores that has been documented in the literature may not be due to antitakeover devices
but rather board stability and discretion. To examine this issue further, we generate an
interaction term equal to the product of EINDEX and a binary variable, BIG, that equals
1 if the firm’s debt is below investment grade and zero otherwise.
The results of Model 5 demonstrate that the addition of this interaction variable does not
affect either the signs or the statistical significance of most of the independent variables
of Model 3. In addition, BINDEX remains significantly positively related to credit
ratings. However, adding the interaction term “flips” the sign on EINDEX, which
suggests that there is a differential relation between management entrenchment and credit
30 Bebchuk, Coates and Subramanian (2002), and Bebchuk and Cohen (2005). 31 The simple correlation between EINDEX and BINDEX is 0.33.

34
ratings, depending on the level of the firm’s credit rating. For firms that have investment
grade credit ratings, the higher the management entrenchment the higher the rating,
whereas for firms with below investment grade debt, the higher the management
entrenchment the lower the rating.
The opposite signs on EINDEX (+) and the interaction term EINDEX * BIG (-) suggest
that for firms with below investment grade debt, anti-takeover (entrenchment) devices are
detrimental to creditors because if there were to be a merger, there is a chance that the
credit quality of the acquirer may increase the credit quality of the target’s debt – the so-
called “co-insurance” effect. Thus, bondholders who hold less than investment grade debt
may be hurt by antitakeover devices to the extent they both entrench management and
thwart potentially positive takeover related activity. In contrast, bondholders who hold
investment grade debt tend to benefit from antitakeover devices because in many cases,
the financial impact of a takeover would have more negative than positive implications
for investment grade firms.
Finally, the results for Model 5 demonstrate that credit ratings are lower for firms
incorporated in Delaware. This result is consistent with those of Francis, Hasan, John,
and Waisman (2006), who document greater when-issued spreads for bonds issued by
Delaware corporations. They attribute the higher cost of debt for firms incorporated in
Delaware to the potential of a takeover, as Delaware has few antitakeover statutes.32
However, the fact that we account for the probability of a takeover with other
32 Among the major state antitakeover statutes, Delaware only has a business combination statute that can be circumvented in a number of ways.

35
independent variables, namely EINDEX, suggests that the lower ratings for Delaware
firms might be due to the more general conflict of interests between bondholders and
stockholders33 and not specifically the probability of a takeover.
2. Sub-Period Analysis
A number of independent variables from TCL are not available prior to 2003. Table 4 is
a replication of Table 3 with the addition of nine new governance variables. Seven of the
nine variables are available for 2003 through 2007 and are included in Models 1 and 2 of
Table 4. Data regarding violations of Section 404 of the Sarbanes / Oxley Act and a
variable representing the overhang of outstanding stock options are only available for the
years 2005 through 2007. The results containing these two variables are reported in
Models 3 and 4 of Table 4.
In Table 4 Models 1 and 3 include all available independent variables over the indicated
time period, whereas Models 2 and 4 include only our governance variables. The results
based on Models 1 and 3 reveal that all of the coefficients pertaining to the financial
variables have the same signs as in Table 3 and all but two (interest coverage and capital
intensity) are highly significant. In addition, as in the full sample, credit ratings are
positively related to the quality of earnings.
Consistent with the results reported in Table 3, all of the ownership structure variables
are negatively related to credit ratings. The number of 5% block holders, the percentage
33 See note 37 infra for references regarding Delaware’s pro-stockholder (anti-creditor) position regarding the fiduciary duties of corporate directors.

36
of shares held by insiders and the percentage held by institutions are all negatively related
to ratings. This is perhaps attributable to potential conflicts of interest between creditors
and stockholders.
The results in Table 4 show that the salary, number of shares held and the tenure of the
CEO are negatively related to credit ratings. In contrast, the tenure of the board members
is positively related to credit ratings and the percentage of directors who hold none of the
firm’s equity is negatively related to credit ratings. These results are consistent with
those reported for the longer timeframe in Table 3.
Consistent with the results for the entire sample, we find that our index of board
discretion (BINDEX) is positively related to ratings and our measure of entrenchment
(EINDEX) is positively related to ratings for firms with investment grade ratings, and
negatively related to rankings for firms with below investment grade ratings.
Only two of the nine additional governance variables included in the statistical models
are significantly related to bond ratings. The percentage of non-audit fees to auditor fees
is positively related to credit ratings. This is a curious finding, and runs counter to the
principle that audit firms without non-audit fees are better positioned to conduct
independent audits. Perhaps not as surprising upon reflection, there is a negative relation
between the number of board meetings and credit ratings. Presumably, firms with lower
credit ratings require relatively more attention by their board. It is interesting to note that

37
violations of Section 404 of the Sarbanes-Oxley bill reduce a firm’s credit rating, but not
significantly so.34
B. Financial Condition, Credit Ratings, Governance and Bond Spreads
1. Full Sample
In this section we examine the extent to which bond spreads are related to governance
factors, after controlling for the issuing firm’s financial profile, sector, and credit rating.
As presented in the previous section, governance factors are related to credit ratings after
taking into consideration the effects of the firm’s financial condition. Here we are
assessing the extent to which credit ratings affect bond prices relative to governance-
related factors. As presented in the previous section, governance factors are related to
credit ratings even after taking into consideration the effects of the firm’s financial
condition.
Our sample of bond spreads is a proprietary database provided by S&P and consists of
annual “snapshots” of all traded domestic corporate bonds that are rated by the firm.
Each snapshot is taken at the end of March for each of the years 2002-2007. All of the
bonds in the sample are senior, unsecured obligations. Most of the firms in the sample
have more than one bond outstanding. There are 7,456 bond-year observations for 1,734
firm-year observations with an average of 4.3 bonds per firm.35
34 The t-statistics on the coefficients on the binary variable 404 violations is -1.43 and -1.46 for the two sub-periods, respectively. 35 We also perform our tests on a subset of the sample that includes only the largest bond issue of each firm. Our results for this sub-sample are not materially different than those for the entire sample, and are therefore not reported.
38
Our results regarding the relation between bond spreads, credit ratings and governance
variables are presented in Table 5. The dependent variable in these regressions is the
spread (difference) between the bond’s yield-to-maturity and the yield-to-maturity on a
U.S. Treasury Bond with the closest year to maturity. The first thing to note is that bond
spreads are significantly related to bond ratings. All of the rating categories are highly
significant and, except for the two highest ratings categories, 36 the coefficients are
monotonically related to bond spreads – the higher the credit rating, the lower the spread.
Moreover, the ratings are highly significant in the full specification of the statistical
model – Model 5.
In Model 2 we examine the relation between bond spreads, financial condition and
governance factors, without regard to the firm’s credit rating. We find no relation
between spreads and the years to maturity (YTM) or the issue size. Consistent with our
finding of a positive relation between earnings quality and credit ratings, here we find a
negative relation between earnings quality and spreads. Higher quality earnings reduce
the spread between the required yield on the firm’s debt and the yield to U.S. treasuries.
Note that this variable is highly significant in all specifications of the statistical model.
Particularly noteworthy is the fact that Earnings Quality is highly significant in Model 5,
which includes ratings. This suggests that bond traders assign a greater importance to the
firm’s earnings quality than is reflected in the bond’s rating.
By and large, the coefficients on most of the financial variables have the opposite sign to
those in the ratings regressions reported in Tables 3 and 4, which represents the logical 36 The estimated coefficients for these two categories are not statistically different from each other.

39
relation between credit risk and the credit risk premium. Thus bond spreads are greater
(1) if the firm had negative earnings in the prior two years; (2) the greater leverage; (3)
the lower ROA; (4) if the firm has subordinated debt; and (5) the lower the firm’s capital
intensity. Note that leverage and the return on assets become insignificant when ratings
are included in the model – Model 5. Presumably this information is already reflected in
the bonds’ ratings.
Curiously, size is positively related to spreads, but only significantly so in the full model.
Recall that we have documented a positive relation between size and ratings – larger
firms typically have higher credit ratings, which should translate into lower, not higher
spreads. However, the fact that the relation is statistically significant only in the model
containing ratings suggests that bond traders assign less importance to firm size than is
reflected in a bond’s rating. In other words, given a bond’s rating, traders may apply a
discount for size, which may be at odds with how ratings reflect the beneficial effects of
firm size to bondholders.
The results of Models 2 – 5 indicate that the number of shareholders holding blocks of
5% or more of the firm’s shares is positively related to bond spreads, which is consistent
with the result we obtained in the ratings regressions. Again, concentrated ownership
creates the possibility that the firm will be run in the interests of its shareholders, or the
block holders themselves, at the expense of the firm’s creditors -- should a conflict
between the interests of the two groups arise.
40
The annual base pay of a firm’s CEO is negatively related to the spread on its bonds in all
specifications of the model. Indeed, the significance of the relation strengthens with the
inclusion of additional independent variables. Recall that we found no relation between
CEO base pay and credit score. Thus, it appears that bond traders may be more
concerned about the base pay of the firm’s CEO than is reflected in the firm’s credit
rating.
A surprising result is that the percentage of directors holding none of a firm’s stock is
negatively related to bond spreads. This is surprising because we found that this variable
is negatively related to ratings as well – a potentially conflicting set of results. As
reported in Tables 3 and 4, the greater the percentage of zero-shareholding directors, the
lower is the firm’s credit rating, and hence the higher should be the spread on the firm’s
bonds. Moreover, this variable remains significantly positive even after we add the
firm’s credit rating to the statistical model (Model 5). Thus, even though credit ratings
are negatively related to the percentage of zero-shareholding directors, the spread
between the yields on corporate and U.S. Treasury bonds are also lower the greater the
percentage of zero-shareholding directors. This suggests that creditors may have greater
concern about possible “equity capture” of board directors that might come with greater
equity ownership by directors, whereas the credit rating appears to reflect more the
positive incentive that equity ownership offers to engage its directors to perform
diligently.

41
The results of Model 2 indicate that the GINDEX is unrelated to spreads, which contrasts
with the findings in Klock, Mansi, and Maxwell (2005), who document a negative and
significant relation between GINDEX and bond spreads for the period between 1990 and
2000.
The results of Model 3 show that BINDEX (board stability/discretion) is negatively
related to spreads, which is consistent with what we found regarding the relation of this
variable to credit ratings. EINDEX (antitakeover mechanisms) is positively related to
spreads; however unlike in the case of credit ratings EINDEX does not show significant
differentiation depending on whether or not the underlying debt is investment grade or
speculative grade. Finally, consistent with our ratings’ results, we find that EINDEX is
associated with greater spreads for below investment grade bonds.37
The last variable we entertain in the spread regressions is an indicator variable regarding
Delaware incorporations. Consistent with the negative relation between this variable and
ratings, the results show that the variable is significantly positively related to spreads in
all specifications of the statistical model. Apparently, Delaware firms pay a penalty in
both ratings and spreads when they issue corporate bonds. This is consistent with a
recent Delaware decision that states emphatically that in Delaware, the fiduciary duties of
officers and directors run exclusively to the corporation and its stockholders. Officers
and directors owe only contractual duties to creditors.38 This evidence is also consistent
37 This result suggests that there may be different relations between investment and speculative issues more generally. We leave this possibility to future research. 38 No. Am. Catholic Educational Programming v. Rob Gheewalla et al.,Supreme Court of Delaware, 521 A.2nd 92 (Del. May, 2007) (“It is well established (in Delaware) that the directors owe their fiduciary

42
with the findings in Francis, Hasan, John, and Waisman (2006) and Chava, Dierker,
Livdan, and Purnanandam (2007).
Before moving on to our sub period analysis of bond spreads, we pause to make two
observations regarding the results reported in Table 5, especially Model 5. The first point
is that while credit ratings are assigned by rating agencies, the price and hence the yield
on corporate debt is determined by the market. In other words, credit ratings are
determined by firm-specific characteristics, whereas the market prices (yields) of
corporate debt, or any financial instrument for that matter, are determined by the
interaction of supply and demand for credit. Spreads can be thought of as a description
of market equilibrium, which involves both supply and demand factors in the financial
markets, whereas credit ratings focus exclusively on the qualities of the rated issuer.
The second note of caution regarding the interpretation of the results reported in Model 5
of Table 5 is that the coefficients on the independent variables are conditioned on the
firm’s credit rating and, as we have seen previously, credit ratings are statistically related
to a number of financial and governance variables. Thus, coefficients are to be interpreted
conditionally.
2. Sub-Period Analysis
obligations to the corporation and its shareholders. While shareholders rely on directors acting as fiduciaries to protect their interests, creditors are afforded protection (only) through contractual agreements, fraud and fraudulent conveyance law, implied covenants of good faith and fair dealing, bankruptcy law, general commercial law and other sources of creditor rights.”).

43
Table 6 reports the results of the regressions of bond spreads with the expanded number
of independent variables that we have access to only after 2003. The first column in the
table is based on our sample from 2003 to 2007 and the second column reports results
based on our sample of observations in the years 2005 and 2007.
Since the time periods of the data reported in Table 6 overlap with the time periods of the
data reported in Table 5, it is not surprising that the results are similar. In fact, it is
illustrative to see how the relations (coefficients) change with just the addition or deletion
of one or two years. The results in Table 6 show that credit ratings are an important
determinant of bond spreads in any time period and under numerous specifications of the
statistical model. The coefficients on ratings are almost monotonic and are all highly
significant. Earnings quality is significantly negative in the longer period, which is
predictable. Once again size is shown to be significantly positively related to spreads.
Consistent with our findings regarding credit ratings, the data show that spreads are
positively related to the number of block holders who hold 5% or more of the firm’s
stock. Again we see that spreads are positively related to CEO base pay and negatively
related to CEO bonuses.
The results reported in table 6 regarding the board’s structure are consistent with the
results reported in Table 5. However the two statistically significant relations are
inconsistent with our results regarding board structure and ratings. As is the case in Table
5, the data in Table 6 show that the percentage of board members that hold none of the
44
firm’s shares is negatively related to spreads (the more shares held, the lower the spread
relative to U.S. treasuries). Recall that we found that this variable is negatively related to
ratings as well. As is the case for the data in Table 5, Table 6 shows that for both sub-
periods, BINDEX is negatively related to spreads, EINDEX is positively relate to spreads
and the dummy variable indicating Delaware incorporation is positive.
Interestingly, none of the additional governance variables available after 2003, except for
dilution overhang (Dilution), is significant. Dilution is positive and marginally significant
at 10% level, which is consistent with its negative relation with credit ratings as in Table
4, even though the latter result is not significant. This result suggests that bond traders
may view the dilution due to stock options awarded to high-profiled executives more
negatively than reflected in firm’s credit rating.
C. Financial Condition, Governance and Tobin’s Q
In this section, we examine the relations between our governance variables and Tobin’s
Q, which is the ratio of a firm’s market value to its book value.39 Theoretically, the
greater the ratio, the greater the value of the firm beyond its book value – the greater the
value created by the operations of the firm. The purpose of this exercise is to examine
whether the relations we found between ratings, yields and governance variables hold
with respect to the value of the firm – a more explicit concern for shareholders as
compared to creditors. For example, we find that the greater the number of block holders
with 5% of the firm’s shares, the lower the firm’s credit rating, the higher the spread on
39 Specifically, Tobin’s Q is defined as
Total Assets - Book Equity + Market Value of Equity - Deferred TaxesQ Total Assets=

45
its bonds and, as we will see, the lower Tobin’s Q. Thus, the presence of 5% block
holders is not only associated with a lower credit quality of debt, but a lower value of the
firm in general. In contrast, we find that while our board stability/discretion index is
positively related to credit ratings, it is unrelated to Q. Thus, we can reasonably assume
that the board’s relative level of stability affects the firm’s credit strength, but not the
value of the firm. By inference, our board discretion index should be negatively related
to the “value” of the firm’s equity however measured.
Table 7 reports our results regarding the effect of governance variables on Tobin’s Q.
The first block of variables lists the “traditional” determinants of Tobin’s Q. Thus we see
that Q is positively related to the return on assets, the level of R&D, and the age of the
firm. Q is negatively related to the size of the firm and the number of segments
(industries) in which the firm operates.
Earnings quality is positively related to Q, but is only statistically significant for the
whole sample period. The results indicate that Q is negatively related to the percentage
of shares held by insiders and the number of 5% block holders. Executive compensation
is positively related to Q as is the percentage of shares held by the CEO.
Curiously, we find that Q is negatively related to the number of board meetings per year.
This may be due to the fact that firms in financial difficulties require more board
attention (Vafeas (1999). Finally, the data indicate that Q is unrelated to our measure of
46
board stability/discretion (BINDEX) and negatively related to EINDEX, which is
consistent with the results reported by Bebchuk et al.
V. Conclusion
This paper has identified several statistically significant relations between corporate
governance factors, credit ratings, bond spreads and firm value in 775 U.S. firms during
the period 2001-2007. Among the numerous results of our panel study, one of the most
interesting findings is that the presence of antitakeover mechanisms is more negatively
related to credit ratings and more positively related to bond spreads, when the firm’s
credit rating is speculative (BB+ and below) than when it is investment grade (BBB- and
above). In the case of credit ratings, such presence of antitakeover mechanisms is related
to lower credit ratings for firms with speculative grade credit ratings, and higher credit
ratings for firms with investment grade ratings. This is a new finding, and one that has an
obvious interpretation. Bondholders of investment grade debt often have more to lose
than gain when an investment grade company is the target of a takeover event,
particularly if the takeover increases financial leverage. However for companies with
speculative grade ratings, antitakeover provisions can be viewed as inhibiting potentially
positive takeover events that could remove entrenched management or result in the
company becoming part of an operationally and financially stronger organization.
Perhaps the most important finding of this paper relates to the relations we identified
between certain director characteristics, credit ratings and bond spreads. We identify a
cluster of attributes relating to board tenure, director liability indemnification and

47
classified board structures, which are related to higher credit ratings and lower bond
spreads, after controlling for financial variables and industrial sector. We believe this
cluster of attributes reflects the relative stability of the board. Our findings suggest that
boards with greater stability, sector knowledge, firm knowledge, financial exposure and
protection from liability may be more conservative and better positioned to exercise
discretion relative to executive management in ways that are supportive of creditors’
interests. Boards with greater stability arguably have a greater ability to take a long term
perspective and, in a fiduciary context, to take into consideration the broader interests of
the firm as a whole, including creditors and potentially other key stakeholders.
It is noteworthy that these characteristics of board stability are not statistically significant
with regard to Tobins Q, a measure of firm value that perhaps has greater relevance to
shareholders. This suggests that creditors and shareholders may benefit differentially
depending on the degree of board stability. In particular, the positive relation between
board stability and credit quality suggests that stable and seasoned boards may better be
able to resist potential capture from short term equity interests. It is also noteworthy that
some of those board attributes that are positively related to a company’s credit quality
(the presence of classified boards, director indemnification, director tenure) are typically
seen as negative from a shareholders’ perspective. Our findings challenge conventional
wisdom in this regard, or at least suggest that creditors and shareholders have different
preferences regarding different governance structures.
48
This paper builds on the existing literature concerning the relations between governance
metrics, credit risk and financial performance. In particular we have replicated the
findings of Ashbaugh, Collins and LaFond (ACL) and Bebchuck, Cohen and Ferrill
(BCF). We find that the GINDEX (ACL’s shareholder rights index) is not statistically
significant in a broader time series beyond their one-year analysis. The more focused
entrenchment index (EINDEX) developed by BCF is more resilient, and is statistically
significant for both credit ratings and bond spreads over the period 2001-2007 and 2002-
2007, respectively. However, our study adds nuance to BCF’s results in that we identify a
positive relation between management entrenchment (antitakeover mechanisms) and
credit ratings for investment grade debt and a negative relation between management
entrenchment and credit ratings for speculative grade debt.
While we have identified a number of statistically significant relations between
governance attributes and credit risk, we are not asserting causality. However we do
believe the relations we have identified can be logically explained and have a foundation
in both theory and in professional practice. Our study has several distinctive attributes,
including the range of governance variables employed, the use of seasoned bond spreads
rather than when-issued bond spreads as in most of the literature and the seven-year time
series we were able to construct.
We believe there is further scope in examining the relation between corporate governance
and credit risk. A specific application in this regard could be to test for the relation of
corporate governance factors to ratings transitions to better understand the dynamics of

49
how governance may affect changes in credit quality at individual companies. There is
also scope for exploring further the extent to which governance preferences of creditors
may differ from those of shareholders. In particular, the concept of board stability and
discretion that we have developed can be developed further, and could link into the
debate about the fiduciary responsibility of directors towards creditors and possibly other
non-financial stakeholders.
An important extension of the methodologies developed in this paper would be to apply
them to foreign firms, recognizing the different organizational and institutional
differences in other countries. Clearly, many of our findings relate to aspects of U.S. law
and takeover practices that are not present in other parts of the world. It would therefore
be inappropriate to infer that the relations we identify between governance and credit risk
here are appropriate for firms outside the US.
There is also scope for more research to better understand the relations between credit
risk, bond spreads and other forms of “extra-financial” risk, including a firm’s
environmental and social performance. While our study does not address these issues,
we recognize that they are becoming increasingly important to investors for both
financial and non-financial reasons. It also may be the case that a firm’s performance
regarding the environment and its social responsibility provide an indication of the firm’s
sustainability and overall management quality. We believe that these issues are fruitful
areas for future research.
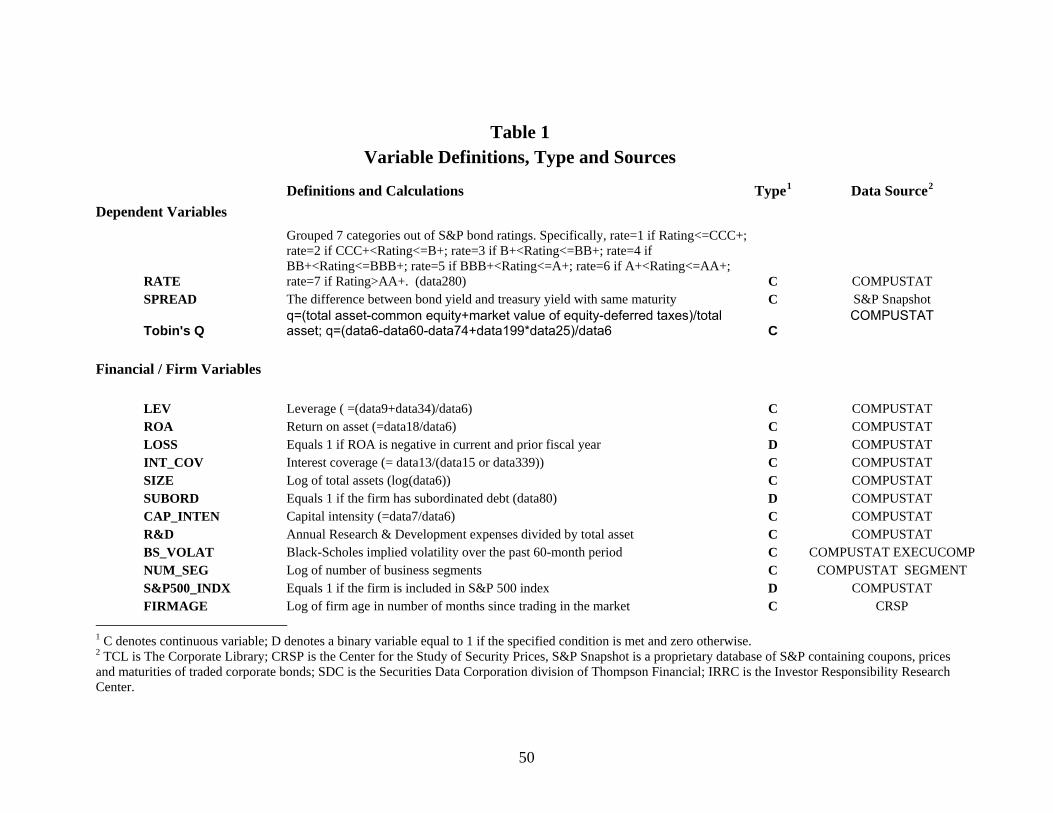
50
Table 1 Variable Definitions, Type and Sources
Definitions and Calculations Type1 Data Source2 Dependent Variables
RATE
Grouped 7 categories out of S&P bond ratings. Specifically, rate=1 if Rating<=CCC+; rate=2 if CCC+<Rating<=B+; rate=3 if B+<Rating<=BB+; rate=4 if BB+<Rating<=BBB+; rate=5 if BBB+<Rating<=A+; rate=6 if A+<Rating<=AA+; rate=7 if Rating>AA+. (data280) C COMPUSTAT
SPREAD The difference between bond yield and treasury yield with same maturity C S&P Snapshot
Tobin's Q q=(total asset-common equity+market value of equity-deferred taxes)/total asset; q=(data6-data60-data74+data199*data25)/data6 C
COMPUSTAT
Financial / Firm Variables
LEV Leverage ( =(data9+data34)/data6) C COMPUSTAT ROA Return on asset (=data18/data6) C COMPUSTAT LOSS Equals 1 if ROA is negative in current and prior fiscal year D COMPUSTAT INT_COV Interest coverage (= data13/(data15 or data339)) C COMPUSTAT SIZE Log of total assets (log(data6)) C COMPUSTAT SUBORD Equals 1 if the firm has subordinated debt (data80) D COMPUSTAT CAP_INTEN Capital intensity (=data7/data6) C COMPUSTAT R&D Annual Research & Development expenses divided by total asset C COMPUSTAT BS_VOLAT Black-Scholes implied volatility over the past 60-month period C COMPUSTAT EXECUCOMP NUM_SEG Log of number of business segments C COMPUSTAT SEGMENT S&P500_INDX Equals 1 if the firm is included in S&P 500 index D COMPUSTAT FIRMAGE Log of firm age in number of months since trading in the market C CRSP
1 C denotes continuous variable; D denotes a binary variable equal to 1 if the specified condition is met and zero otherwise. 2 TCL is The Corporate Library; CRSP is the Center for the Study of Security Prices, S&P Snapshot is a proprietary database of S&P containing coupons, prices and maturities of traded corporate bonds; SDC is the Securities Data Corporation division of Thompson Financial; IRRC is the Investor Responsibility Research Center.

51
Issue Characteristics
ISSUESIZE Face amount of bond issue scaled by 10,000,000,000 C S&P Snapshot YTM Years to maturity C S&P Snapshot
Ownership Structure
NUM_BLK5 number of at least 5% blockholders C CDA/Spectrum PER_INSIDE Percentage of shares held by top management and directors C TCL PER_INST percentage of institutional holding C CDA/Spectrum
Transparency, Disclosure and Audit
PER_NAUDIT Percentage of non-audit fees C TCL VIOLATE404 Equals 1 when the firm has 404 violation(s) in the same year D TCL
EARNINGS QUALITY
The loadings on the accrual quality (AQ) factor as augmented from the Fama-French three-factor model, where AQ is defined as the standard deviation of the residuals from the regressions of the change in working capital on past, current, and future cash flow from operations (Ecker, Francis, Kim, Olsson, and Schipper (2006)). C Frank Ecker of Duke University
DELAWARE Equals 1 if the firm is incorporated in Delaware D COMPUSTAT Board Structure and Effectiveness
ALL_IND_AUDIT Equals 1 if the audit committee is fully independent D TCL ALL_IND_COMP Equals 1 if the compensation committee is totally independent D TCL ALL_IND_NOM Equals 1 if the nomination committee is totally independent D TCL BDMTG Number of board meetings C TCL BOARD_SIZE Board size C TCL

52
CEO_CHAIR Equals 1 when CEO is also Chairman D TCL DIRIND Director Indemnification D IRRC DIRINDC Director Indemnification Contracts D IRRC DIRLIAB Charter Amendments That Limit the Director's Liability D IRRC LEAD Equals 1 if the board has a lead director D TCL PER_15_TNUR Percentage of directors over 15 years' tenure C TCL PER_4BOARDS Percentage of directors who sit on at least four other corporate boards C TCL PER_70_AGE Percentage of directors over 70 C TCL PER_EQTY_ZERO Percentage of directors with zero equity C TCL PER_MEET Percentage of directors who fail to attend at least 80% of board meetings C TCL PER_OUT Percentage of independent directors C TCL
Executive Compensation and Turnover
CEO_BASE Annual base salary of CEO as a percentage of total compensation C TCL CEO_BONUS Annual bonus of CEO as a percentage of total compensation C TCL CEO_SHARES CEO Share holding as a percentage of total shares outstanding C TCL CEO TENURE CEO tenure C TCL CEO_INCEN Proportion of incentive part of CEO compensation C COMPUSTAT EXECUCOMP DILUTION Dilution overhang within 5% of industry peers C TCL
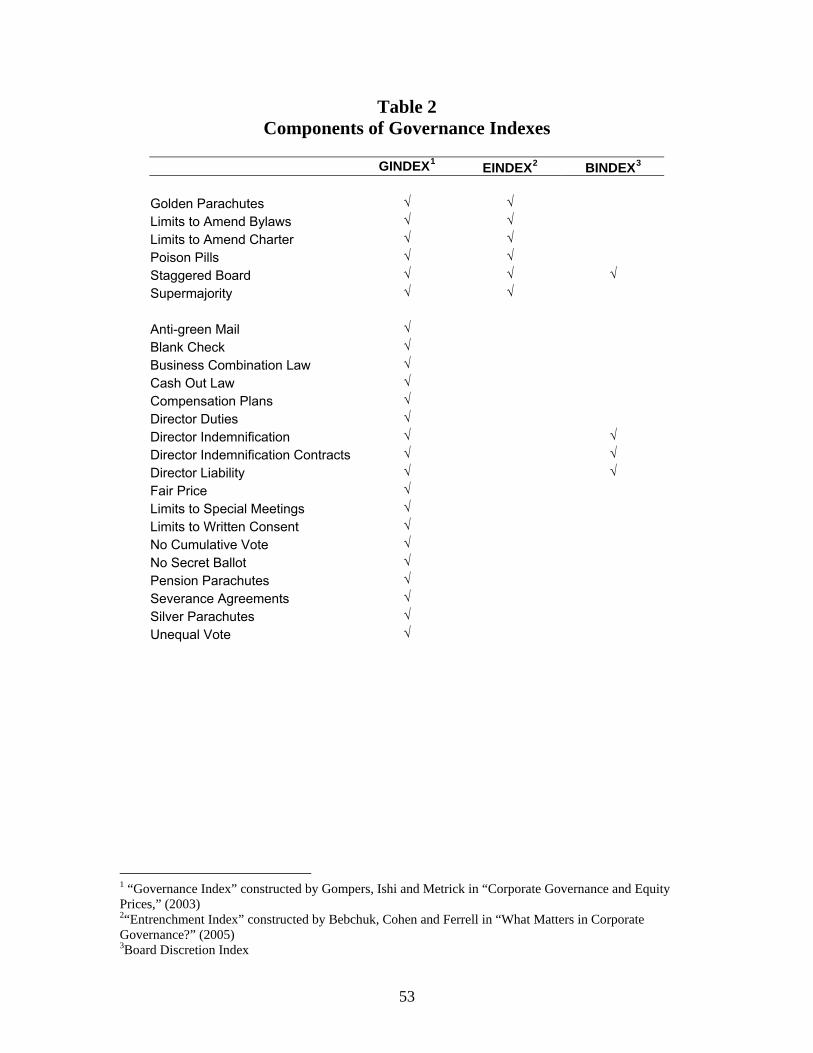
53
Table 2 Components of Governance Indexes
GINDEX1 EINDEX2 BINDEX3
Golden Parachutes √ √ Limits to Amend Bylaws √ √ Limits to Amend Charter √ √ Poison Pills √ √ Staggered Board √ √ √ Supermajority √ √ Anti-green Mail √ Blank Check √ Business Combination Law √ Cash Out Law √ Compensation Plans √ Director Duties √ Director Indemnification √ √ Director Indemnification Contracts √ √ Director Liability √ √ Fair Price √ Limits to Special Meetings √ Limits to Written Consent √ No Cumulative Vote √ No Secret Ballot √ Pension Parachutes √ Severance Agreements √ Silver Parachutes √ Unequal Vote √
1 “Governance Index” constructed by Gompers, Ishi and Metrick in “Corporate Governance and Equity Prices,” (2003) 2“Entrenchment Index” constructed by Bebchuk, Cohen and Ferrell in “What Matters in Corporate Governance?” (2005) 3Board Discretion Index
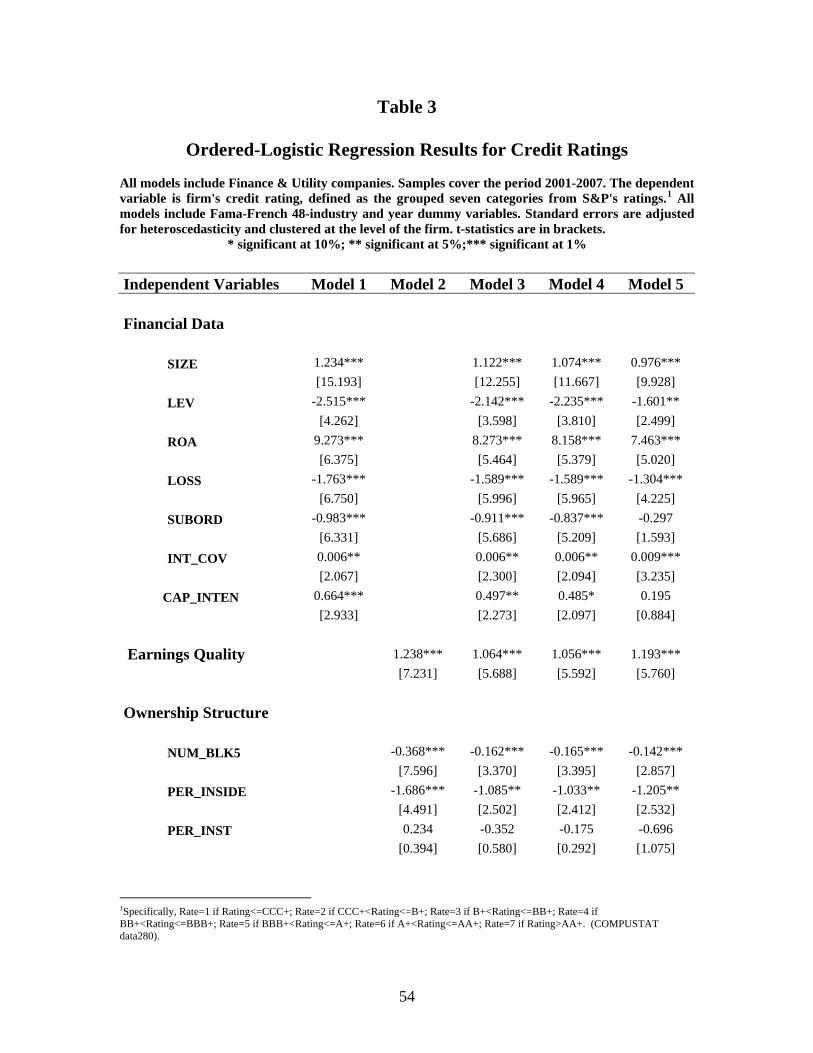
54
Table 3
Ordered-Logistic Regression Results for Credit Ratings
All models include Finance & Utility companies. Samples cover the period 2001-2007. The dependent variable is firm's credit rating, defined as the grouped seven categories from S&P's ratings.1 All models include Fama-French 48-industry and year dummy variables. Standard errors are adjusted for heteroscedasticity and clustered at the level of the firm. t-statistics are in brackets.
* significant at 10%; ** significant at 5%;*** significant at 1%
Independent Variables Model 1 Model 2 Model 3 Model 4 Model 5 Financial Data
SIZE 1.234*** 1.122*** 1.074*** 0.976*** [15.193] [12.255] [11.667] [9.928] LEV -2.515*** -2.142*** -2.235*** -1.601** [4.262] [3.598] [3.810] [2.499] ROA 9.273*** 8.273*** 8.158*** 7.463*** [6.375] [5.464] [5.379] [5.020] LOSS -1.763*** -1.589*** -1.589*** -1.304*** [6.750] [5.996] [5.965] [4.225] SUBORD -0.983*** -0.911*** -0.837*** -0.297 [6.331] [5.686] [5.209] [1.593] INT_COV 0.006** 0.006** 0.006** 0.009*** [2.067] [2.300] [2.094] [3.235]
CAP_INTEN 0.664*** 0.497** 0.485* 0.195 [2.933] [2.273] [2.097] [0.884]
Earnings Quality 1.238*** 1.064*** 1.056*** 1.193*** [7.231] [5.688] [5.592] [5.760] Ownership Structure
NUM_BLK5 -0.368*** -0.162*** -0.165*** -0.142*** [7.596] [3.370] [3.395] [2.857] PER_INSIDE -1.686*** -1.085** -1.033** -1.205** [4.491] [2.502] [2.412] [2.532] PER_INST 0.234 -0.352 -0.175 -0.696 [0.394] [0.580] [0.292] [1.075]
1Specifically, Rate=1 if Rating<=CCC+; Rate=2 if CCC+<Rating<=B+; Rate=3 if B+<Rating<=BB+; Rate=4 if BB+<Rating<=BBB+; Rate=5 if BBB+<Rating<=A+; Rate=6 if A+<Rating<=AA+; Rate=7 if Rating>AA+. (COMPUSTAT data280).
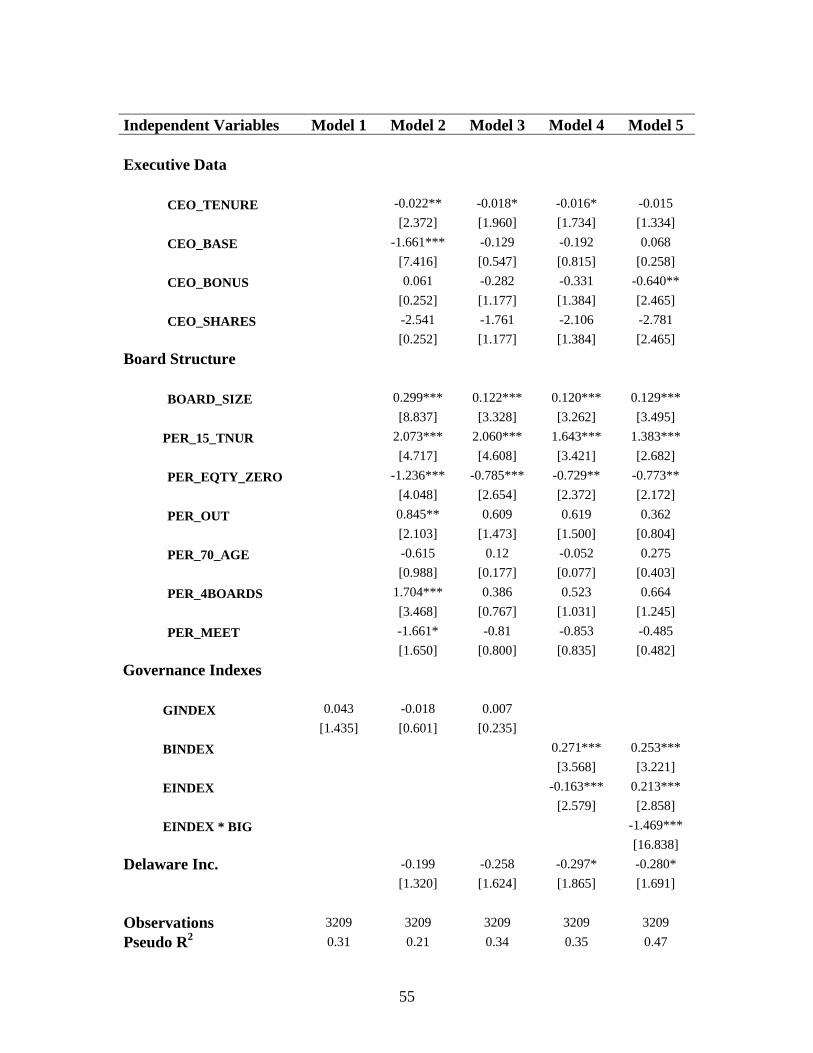
55
Independent Variables Model 1 Model 2 Model 3 Model 4 Model 5 Executive Data
CEO_TENURE -0.022** -0.018* -0.016* -0.015
[2.372] [1.960] [1.734] [1.334] CEO_BASE -1.661*** -0.129 -0.192 0.068 [7.416] [0.547] [0.815] [0.258] CEO_BONUS 0.061 -0.282 -0.331 -0.640** [0.252] [1.177] [1.384] [2.465] CEO_SHARES -2.541 -1.761 -2.106 -2.781 [0.252] [1.177] [1.384] [2.465]
Board Structure
BOARD_SIZE 0.299*** 0.122*** 0.120*** 0.129*** [8.837] [3.328] [3.262] [3.495]
PER_15_TNUR 2.073*** 2.060*** 1.643*** 1.383*** [4.717] [4.608] [3.421] [2.682] PER_EQTY_ZERO -1.236*** -0.785*** -0.729** -0.773** [4.048] [2.654] [2.372] [2.172] PER_OUT 0.845** 0.609 0.619 0.362 [2.103] [1.473] [1.500] [0.804] PER_70_AGE -0.615 0.12 -0.052 0.275 [0.988] [0.177] [0.077] [0.403] PER_4BOARDS 1.704*** 0.386 0.523 0.664 [3.468] [0.767] [1.031] [1.245] PER_MEET -1.661* -0.81 -0.853 -0.485 [1.650] [0.800] [0.835] [0.482]
Governance Indexes GINDEX 0.043 -0.018 0.007 [1.435] [0.601] [0.235] BINDEX 0.271*** 0.253*** [3.568] [3.221] EINDEX -0.163*** 0.213*** [2.579] [2.858] EINDEX * BIG -1.469*** [16.838] Delaware Inc. -0.199 -0.258 -0.297* -0.280* [1.320] [1.624] [1.865] [1.691] Observations 3209 3209 3209 3209 3209 Pseudo R2 0.31 0.21 0.34 0.35 0.47
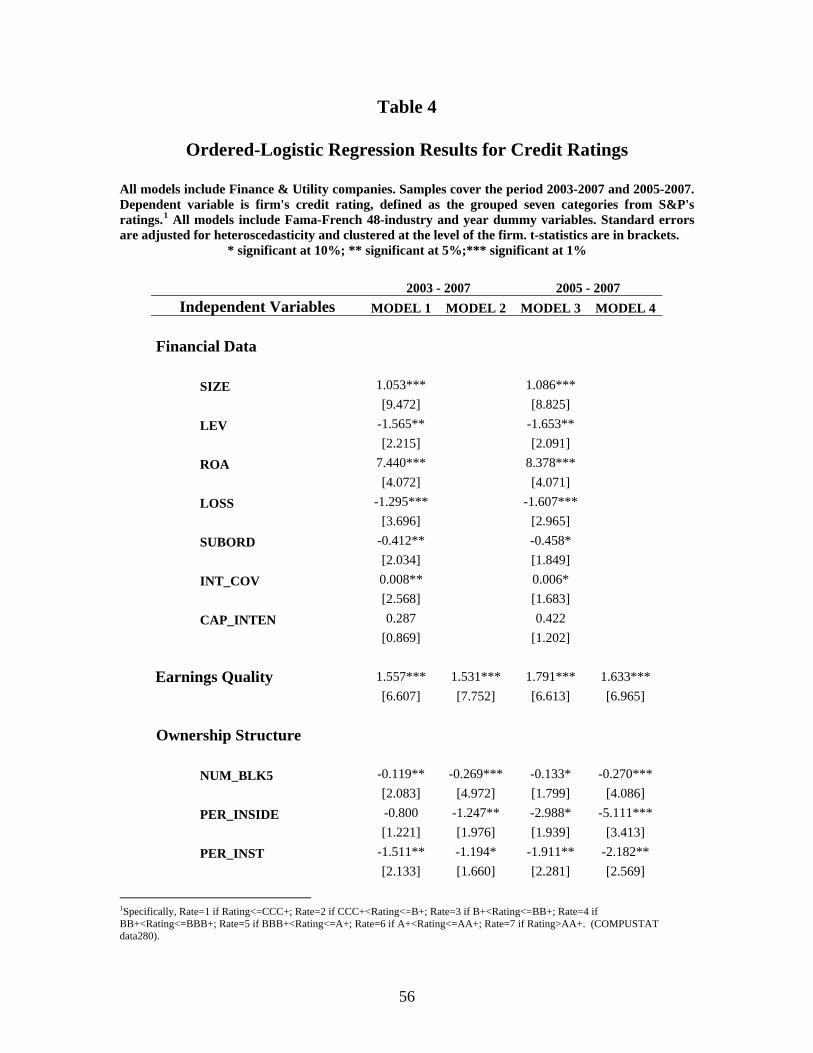
56
Table 4
Ordered-Logistic Regression Results for Credit Ratings
All models include Finance & Utility companies. Samples cover the period 2003-2007 and 2005-2007. Dependent variable is firm's credit rating, defined as the grouped seven categories from S&P's ratings.1 All models include Fama-French 48-industry and year dummy variables. Standard errors are adjusted for heteroscedasticity and clustered at the level of the firm. t-statistics are in brackets.
* significant at 10%; ** significant at 5%;*** significant at 1%
2003 - 2007 2005 - 2007 Independent Variables MODEL 1 MODEL 2 MODEL 3 MODEL 4
Financial Data
SIZE 1.053*** 1.086*** [9.472] [8.825] LEV -1.565** -1.653** [2.215] [2.091] ROA 7.440*** 8.378*** [4.072] [4.071] LOSS -1.295*** -1.607*** [3.696] [2.965] SUBORD -0.412** -0.458* [2.034] [1.849] INT_COV 0.008** 0.006* [2.568] [1.683] CAP_INTEN 0.287 0.422
[0.869] [1.202] Earnings Quality 1.557*** 1.531*** 1.791*** 1.633*** [6.607] [7.752] [6.613] [6.965] Ownership Structure
NUM_BLK5 -0.119** -0.269*** -0.133* -0.270*** [2.083] [4.972] [1.799] [4.086] PER_INSIDE -0.800 -1.247** -2.988* -5.111*** [1.221] [1.976] [1.939] [3.413] PER_INST -1.511** -1.194* -1.911** -2.182**
[2.133] [1.660] [2.281] [2.569]
1Specifically, Rate=1 if Rating<=CCC+; Rate=2 if CCC+<Rating<=B+; Rate=3 if B+<Rating<=BB+; Rate=4 if BB+<Rating<=BBB+; Rate=5 if BBB+<Rating<=A+; Rate=6 if A+<Rating<=AA+; Rate=7 if Rating>AA+. (COMPUSTAT data280).
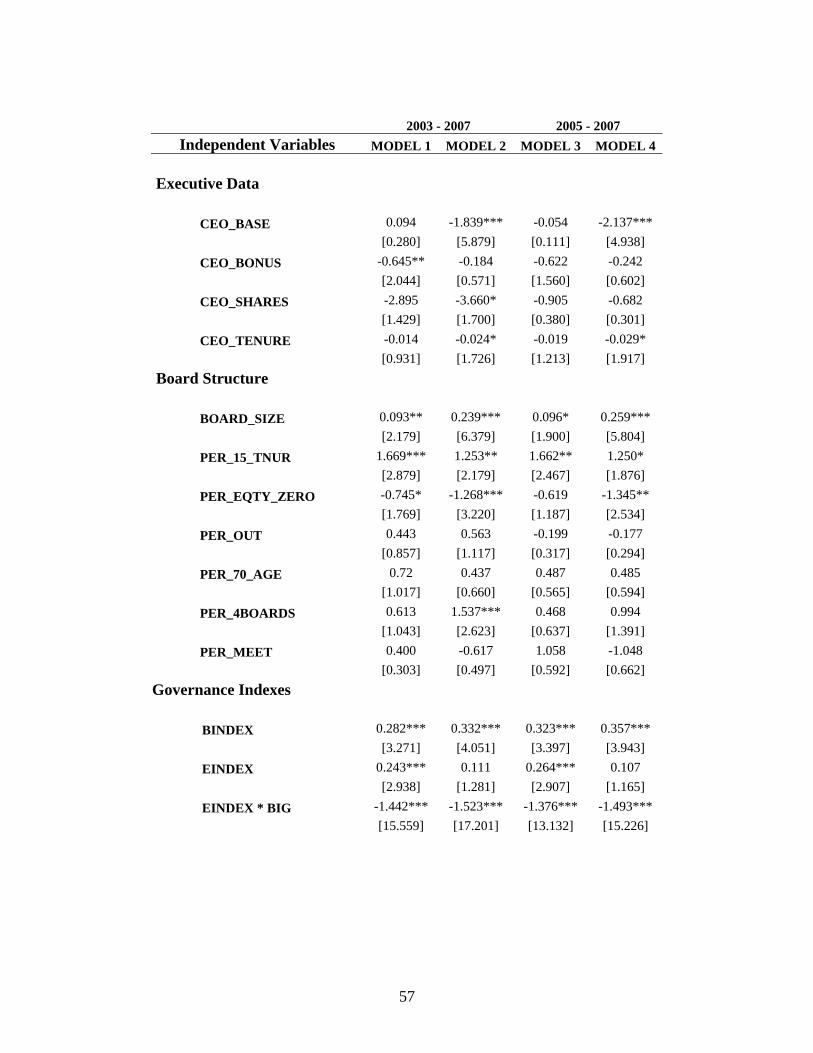
57
2003 - 2007 2005 - 2007
Independent Variables MODEL 1 MODEL 2 MODEL 3 MODEL 4
Executive Data
CEO_BASE 0.094 -1.839*** -0.054 -2.137*** [0.280] [5.879] [0.111] [4.938] CEO_BONUS -0.645** -0.184 -0.622 -0.242 [2.044] [0.571] [1.560] [0.602] CEO_SHARES -2.895 -3.660* -0.905 -0.682 [1.429] [1.700] [0.380] [0.301] CEO_TENURE -0.014 -0.024* -0.019 -0.029*
[0.931] [1.726] [1.213] [1.917] Board Structure
BOARD_SIZE 0.093** 0.239*** 0.096* 0.259*** [2.179] [6.379] [1.900] [5.804] PER_15_TNUR 1.669*** 1.253** 1.662** 1.250* [2.879] [2.179] [2.467] [1.876] PER_EQTY_ZERO -0.745* -1.268*** -0.619 -1.345** [1.769] [3.220] [1.187] [2.534] PER_OUT 0.443 0.563 -0.199 -0.177
[0.857] [1.117] [0.317] [0.294] PER_70_AGE 0.72 0.437 0.487 0.485 [1.017] [0.660] [0.565] [0.594] PER_4BOARDS 0.613 1.537*** 0.468 0.994 [1.043] [2.623] [0.637] [1.391] PER_MEET 0.400 -0.617 1.058 -1.048
[0.303] [0.497] [0.592] [0.662] Governance Indexes BINDEX 0.282*** 0.332*** 0.323*** 0.357*** [3.271] [4.051] [3.397] [3.943] EINDEX 0.243*** 0.111 0.264*** 0.107 [2.938] [1.281] [2.907] [1.165] EINDEX * BIG -1.442*** -1.523*** -1.376*** -1.493*** [15.559] [17.201] [13.132] [15.226]
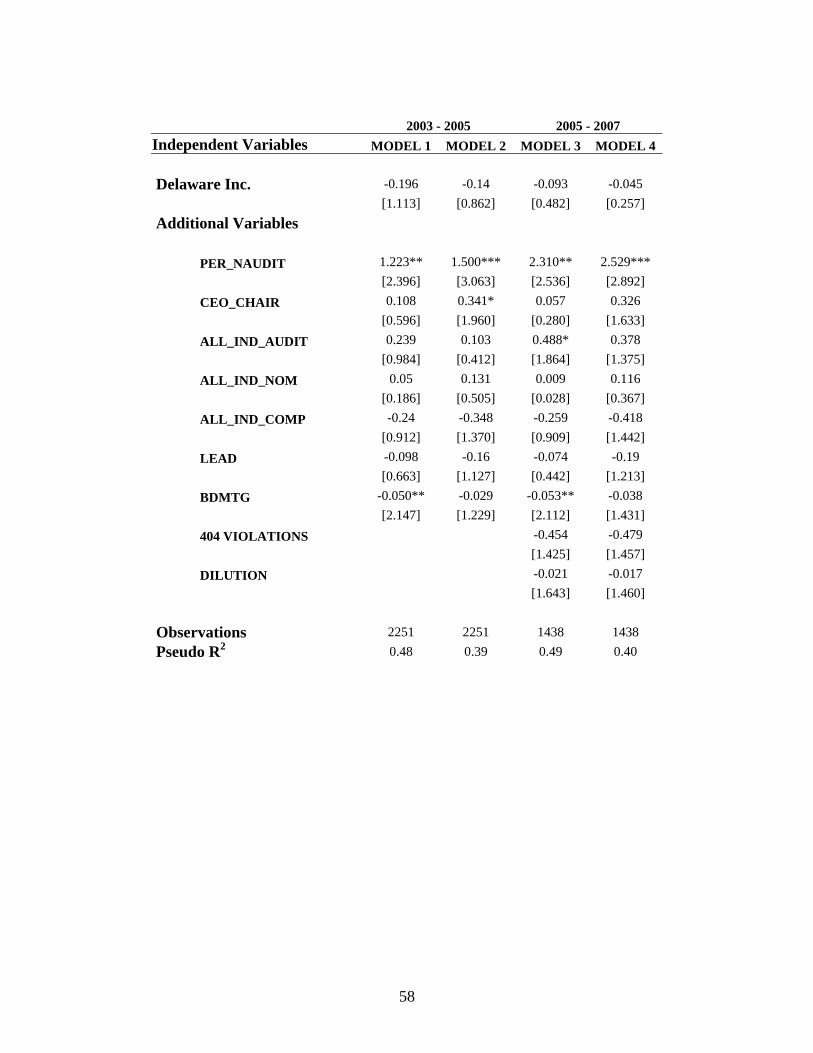
58
2003 - 2005 2005 - 2007 Independent Variables MODEL 1 MODEL 2 MODEL 3 MODEL 4 Delaware Inc. -0.196 -0.14 -0.093 -0.045 [1.113] [0.862] [0.482] [0.257] Additional Variables
PER_NAUDIT 1.223** 1.500*** 2.310** 2.529*** [2.396] [3.063] [2.536] [2.892] CEO_CHAIR 0.108 0.341* 0.057 0.326 [0.596] [1.960] [0.280] [1.633] ALL_IND_AUDIT 0.239 0.103 0.488* 0.378 [0.984] [0.412] [1.864] [1.375] ALL_IND_NOM 0.05 0.131 0.009 0.116 [0.186] [0.505] [0.028] [0.367] ALL_IND_COMP -0.24 -0.348 -0.259 -0.418 [0.912] [1.370] [0.909] [1.442] LEAD -0.098 -0.16 -0.074 -0.19 [0.663] [1.127] [0.442] [1.213] BDMTG -0.050** -0.029 -0.053** -0.038 [2.147] [1.229] [2.112] [1.431] 404 VIOLATIONS -0.454 -0.479 [1.425] [1.457] DILUTION -0.021 -0.017
[1.643] [1.460] Observations 2251 2251 1438 1438 Pseudo R2 0.48 0.39 0.49 0.40
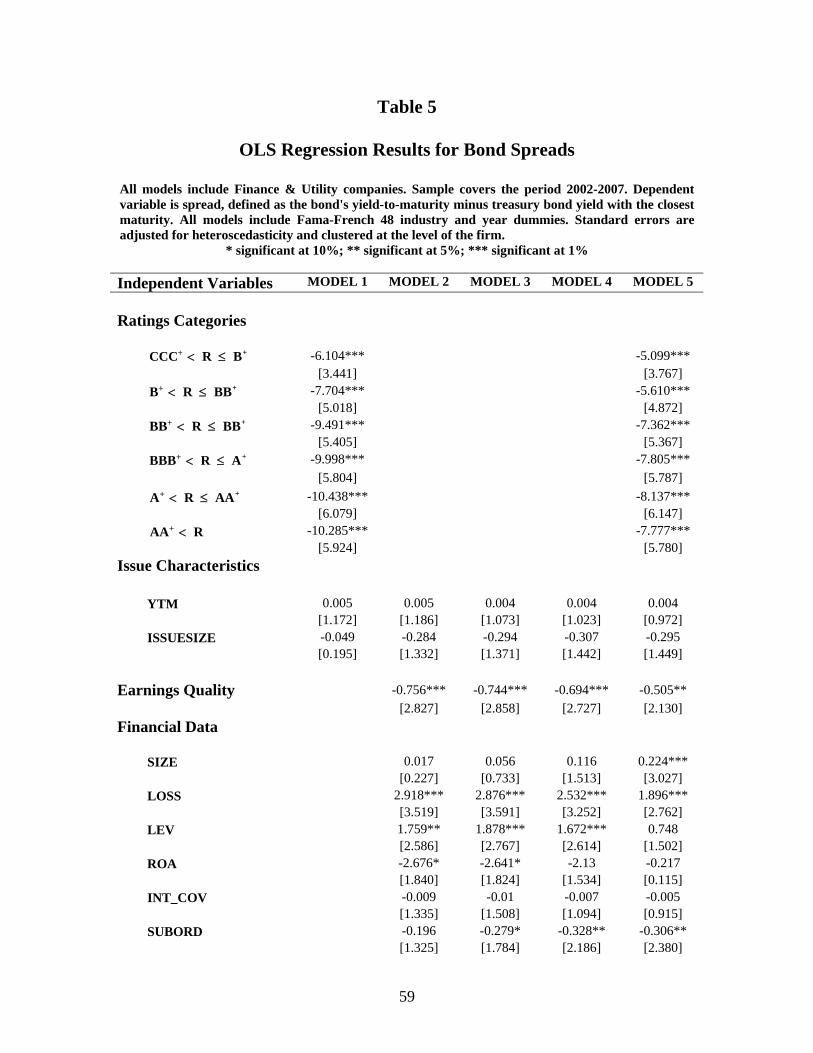
59
Table 5
OLS Regression Results for Bond Spreads
All models include Finance & Utility companies. Sample covers the period 2002-2007. Dependent variable is spread, defined as the bond's yield-to-maturity minus treasury bond yield with the closest maturity. All models include Fama-French 48 industry and year dummies. Standard errors are adjusted for heteroscedasticity and clustered at the level of the firm.
* significant at 10%; ** significant at 5%; *** significant at 1%
Independent Variables MODEL 1 MODEL 2 MODEL 3 MODEL 4 MODEL 5 Ratings Categories +CCC R B+ < ≤ -6.104*** -5.099*** [3.441] [3.767] +B R BB+ < ≤ -7.704*** -5.610*** [5.018] [4.872] +BB R BB+ < ≤ -9.491*** -7.362*** [5.405] [5.367] +BBB R A+ < ≤ -9.998*** -7.805*** [5.804] [5.787] +A R AA+ < ≤ -10.438*** -8.137*** [6.079] [6.147] AA R + < -10.285*** -7.777*** [5.924] [5.780] Issue Characteristics YTM 0.005 0.005 0.004 0.004 0.004 [1.172] [1.186] [1.073] [1.023] [0.972] ISSUESIZE -0.049 -0.284 -0.294 -0.307 -0.295 [0.195] [1.332] [1.371] [1.442] [1.449] Earnings Quality -0.756*** -0.744*** -0.694*** -0.505** [2.827] [2.858] [2.727] [2.130] Financial Data SIZE 0.017 0.056 0.116 0.224*** [0.227] [0.733] [1.513] [3.027] LOSS 2.918*** 2.876*** 2.532*** 1.896*** [3.519] [3.591] [3.252] [2.762] LEV 1.759** 1.878*** 1.672*** 0.748 [2.586] [2.767] [2.614] [1.502] ROA -2.676* -2.641* -2.13 -0.217 [1.840] [1.824] [1.534] [0.115] INT_COV -0.009 -0.01 -0.007 -0.005 [1.335] [1.508] [1.094] [0.915] SUBORD -0.196 -0.279* -0.328** -0.306** [1.325] [1.784] [2.186] [2.380]
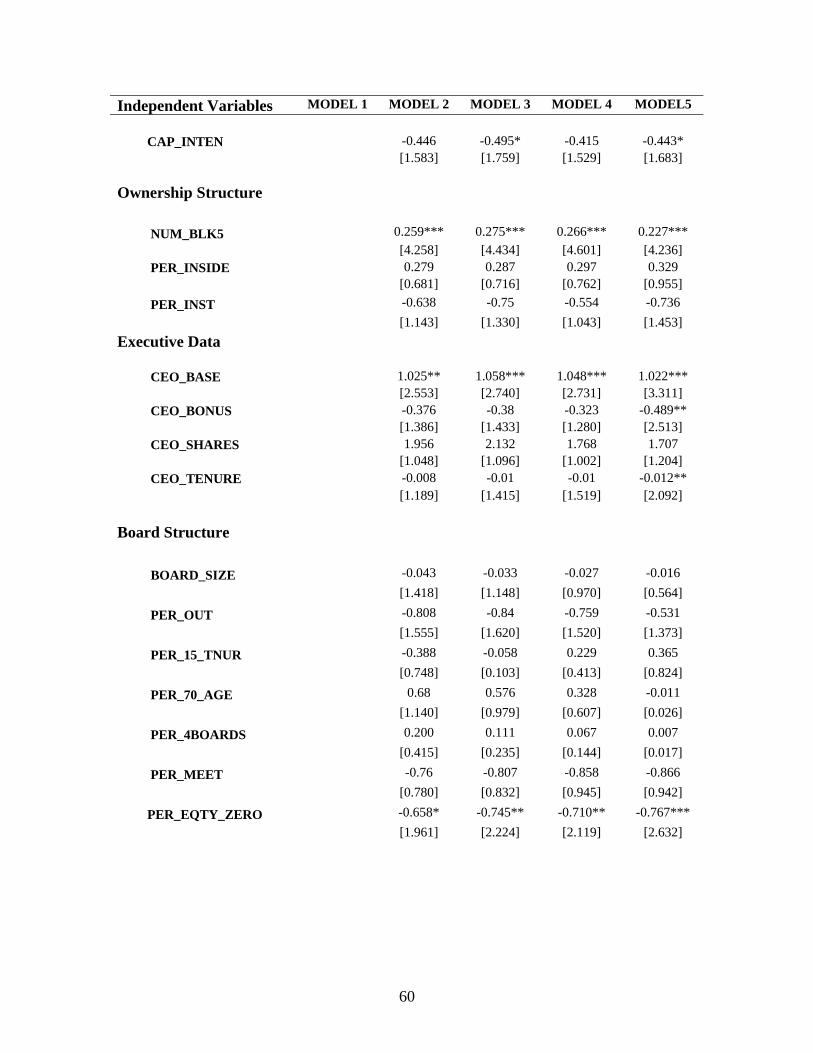
60
Independent Variables MODEL 1 MODEL 2 MODEL 3 MODEL 4 MODEL5 CAP_INTEN -0.446 -0.495* -0.415 -0.443* [1.583] [1.759] [1.529] [1.683] Ownership Structure
NUM_BLK5 0.259*** 0.275*** 0.266*** 0.227*** [4.258] [4.434] [4.601] [4.236] PER_INSIDE 0.279 0.287 0.297 0.329 [0.681] [0.716] [0.762] [0.955] PER_INST -0.638 -0.75 -0.554 -0.736
[1.143] [1.330] [1.043] [1.453] Executive Data CEO_BASE 1.025** 1.058*** 1.048*** 1.022*** [2.553] [2.740] [2.731] [3.311] CEO_BONUS -0.376 -0.38 -0.323 -0.489** [1.386] [1.433] [1.280] [2.513] CEO_SHARES 1.956 2.132 1.768 1.707 [1.048] [1.096] [1.002] [1.204] CEO_TENURE -0.008 -0.01 -0.01 -0.012** [1.189] [1.415] [1.519] [2.092] Board Structure
BOARD_SIZE -0.043 -0.033 -0.027 -0.016
[1.418] [1.148] [0.970] [0.564]
PER_OUT -0.808 -0.84 -0.759 -0.531
[1.555] [1.620] [1.520] [1.373]
PER_15_TNUR -0.388 -0.058 0.229 0.365
[0.748] [0.103] [0.413] [0.824]
PER_70_AGE 0.68 0.576 0.328 -0.011
[1.140] [0.979] [0.607] [0.026]
PER_4BOARDS 0.200 0.111 0.067 0.007
[0.415] [0.235] [0.144] [0.017]
PER_MEET -0.76 -0.807 -0.858 -0.866
[0.780] [0.832] [0.945] [0.942]
PER_EQTY_ZERO -0.658* -0.745** -0.710** -0.767*** [1.961] [2.224] [2.119] [2.632]
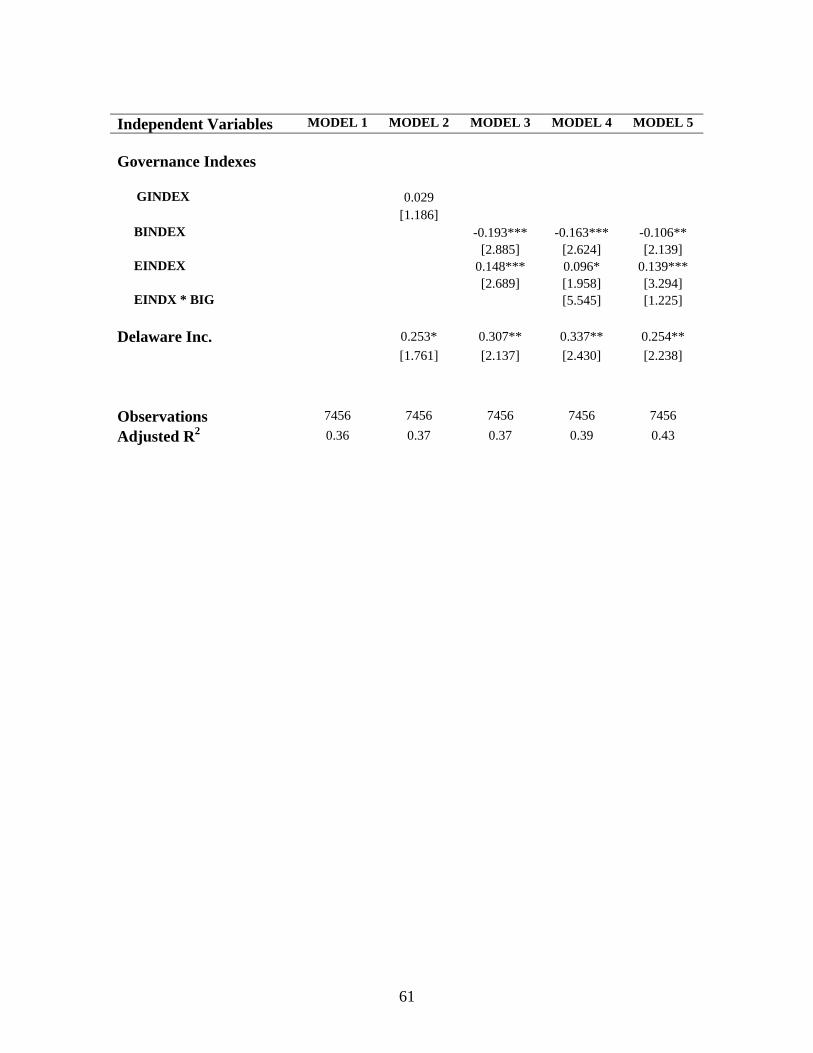
61
Independent Variables MODEL 1 MODEL 2 MODEL 3 MODEL 4 MODEL 5 Governance Indexes GINDEX 0.029 [1.186] BINDEX -0.193*** -0.163*** -0.106** [2.885] [2.624] [2.139] EINDEX 0.148*** 0.096* 0.139*** [2.689] [1.958] [3.294] EINDX * BIG [5.545] [1.225] Delaware Inc. 0.253* 0.307** 0.337** 0.254** [1.761] [2.137] [2.430] [2.238]
Observations 7456 7456 7456 7456 7456
Adjusted R2 0.36 0.37 0.37 0.39 0.43
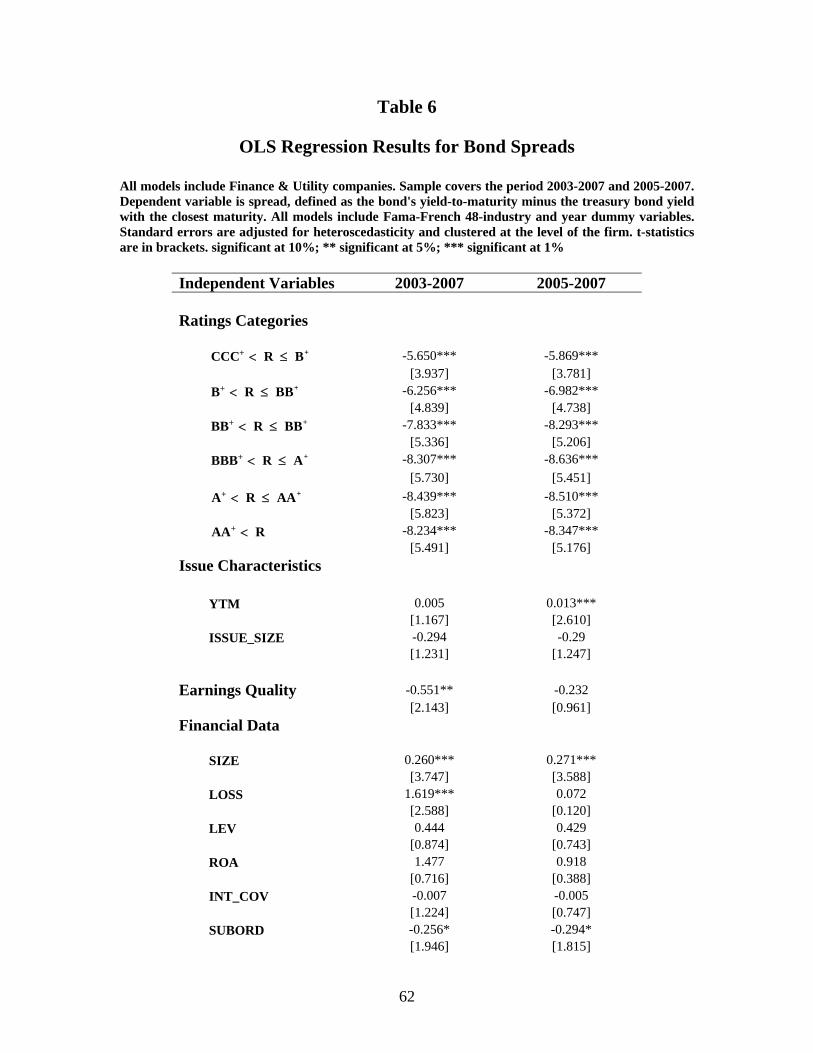
62
Table 6
OLS Regression Results for Bond Spreads
All models include Finance & Utility companies. Sample covers the period 2003-2007 and 2005-2007. Dependent variable is spread, defined as the bond's yield-to-maturity minus the treasury bond yield with the closest maturity. All models include Fama-French 48-industry and year dummy variables. Standard errors are adjusted for heteroscedasticity and clustered at the level of the firm. t-statistics are in brackets. significant at 10%; ** significant at 5%; *** significant at 1%
Independent Variables 2003-2007 2005-2007 Ratings Categories +CCC R B+ < ≤ -5.650*** -5.869*** [3.937] [3.781] +B R BB+ < ≤ -6.256*** -6.982*** [4.839] [4.738] +BB R BB+ < ≤ -7.833*** -8.293*** [5.336] [5.206] +BBB R A+ < ≤ -8.307*** -8.636*** [5.730] [5.451] +A R AA+ < ≤ -8.439*** -8.510*** [5.823] [5.372] AA R + < -8.234*** -8.347*** [5.491] [5.176] Issue Characteristics YTM 0.005 0.013*** [1.167] [2.610] ISSUE_SIZE -0.294 -0.29 [1.231] [1.247] Earnings Quality -0.551** -0.232 [2.143] [0.961] Financial Data SIZE 0.260*** 0.271*** [3.747] [3.588] LOSS 1.619*** 0.072 [2.588] [0.120] LEV 0.444 0.429 [0.874] [0.743] ROA 1.477 0.918 [0.716] [0.388] INT_COV -0.007 -0.005 [1.224] [0.747] SUBORD -0.256* -0.294* [1.946] [1.815]
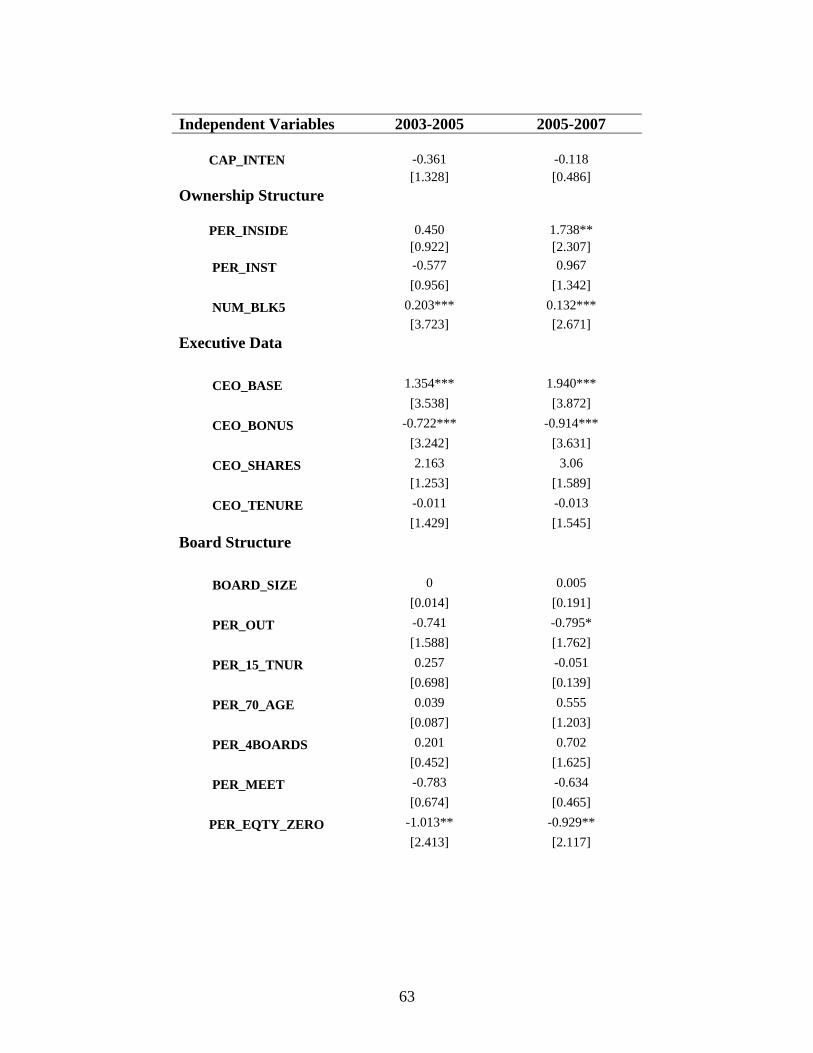
63
Independent Variables 2003-2005 2005-2007 CAP_INTEN -0.361 -0.118 [1.328] [0.486] Ownership Structure PER_INSIDE 0.450 1.738** [0.922] [2.307] PER_INST -0.577 0.967
[0.956] [1.342]
NUM_BLK5 0.203*** 0.132*** [3.723] [2.671] Executive Data
CEO_BASE 1.354*** 1.940***
[3.538] [3.872]
CEO_BONUS -0.722*** -0.914***
[3.242] [3.631]
CEO_SHARES 2.163 3.06
[1.253] [1.589]
CEO_TENURE -0.011 -0.013 [1.429] [1.545] Board Structure BOARD_SIZE 0 0.005
[0.014] [0.191]
PER_OUT -0.741 -0.795*
[1.588] [1.762]
PER_15_TNUR 0.257 -0.051
[0.698] [0.139]
PER_70_AGE 0.039 0.555
[0.087] [1.203]
PER_4BOARDS 0.201 0.702
[0.452] [1.625]
PER_MEET -0.783 -0.634
[0.674] [0.465]
PER_EQTY_ZERO -1.013** -0.929**
[2.413] [2.117]
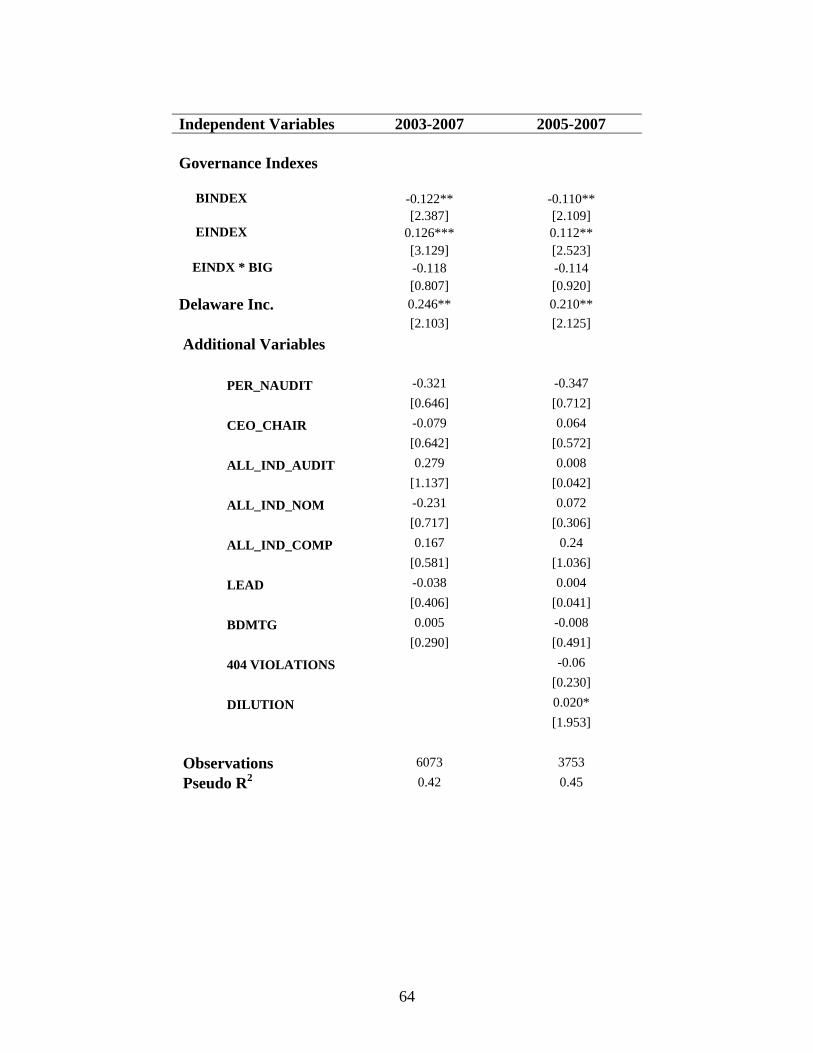
64
Independent Variables 2003-2007 2005-2007 Governance Indexes BINDEX -0.122** -0.110** [2.387] [2.109] EINDEX 0.126*** 0.112** [3.129] [2.523] EINDX * BIG -0.118 -0.114 [0.807] [0.920] Delaware Inc. 0.246** 0.210** [2.103] [2.125]
Additional Variables
PER_NAUDIT -0.321 -0.347
[0.646] [0.712]
CEO_CHAIR -0.079 0.064
[0.642] [0.572]
ALL_IND_AUDIT 0.279 0.008
[1.137] [0.042]
ALL_IND_NOM -0.231 0.072
[0.717] [0.306]
ALL_IND_COMP 0.167 0.24
[0.581] [1.036]
LEAD -0.038 0.004
[0.406] [0.041]
BDMTG 0.005 -0.008
[0.290] [0.491]
404 VIOLATIONS -0.06
[0.230]
DILUTION 0.020*
[1.953]
Observations 6073 3753
Pseudo R2 0.42 0.45
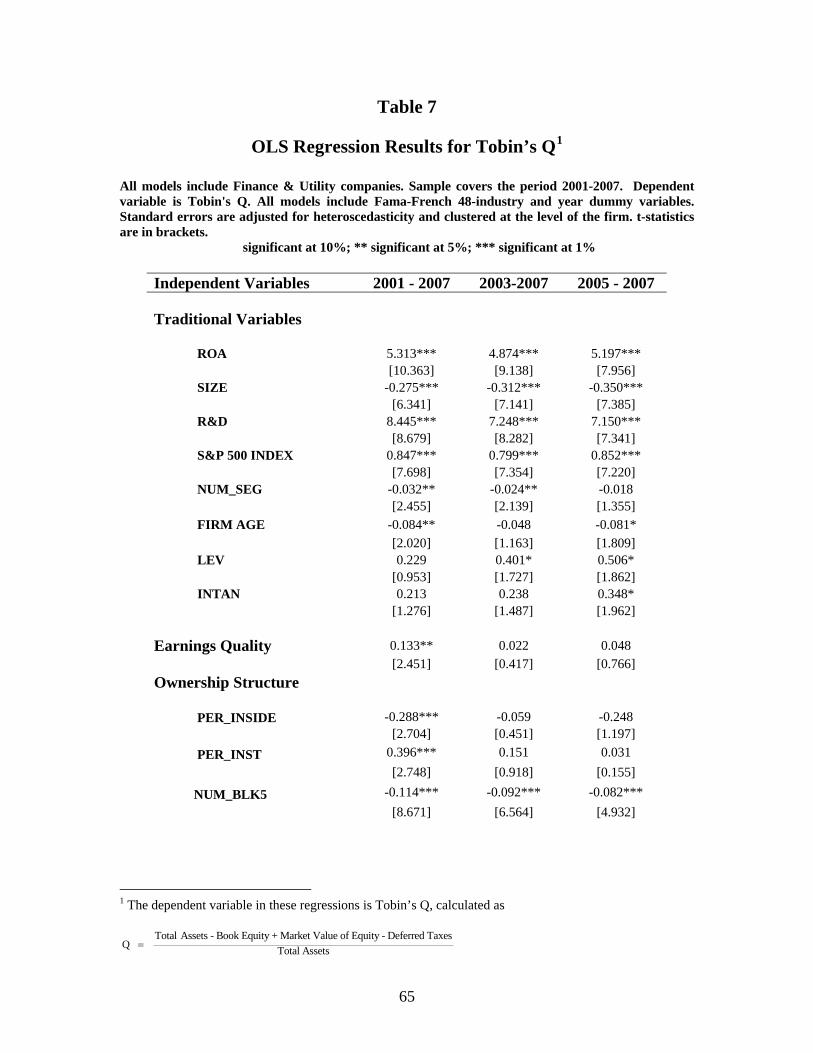
65
Table 7
OLS Regression Results for Tobin’s Q1
All models include Finance & Utility companies. Sample covers the period 2001-2007. Dependent variable is Tobin's Q. All models include Fama-French 48-industry and year dummy variables. Standard errors are adjusted for heteroscedasticity and clustered at the level of the firm. t-statistics are in brackets.
significant at 10%; ** significant at 5%; *** significant at 1%
Independent Variables 2001 - 2007 2003-2007 2005 - 2007 Traditional Variables ROA 5.313*** 4.874*** 5.197*** [10.363] [9.138] [7.956] SIZE -0.275*** -0.312*** -0.350*** [6.341] [7.141] [7.385] R&D 8.445*** 7.248*** 7.150*** [8.679] [8.282] [7.341] S&P 500 INDEX 0.847*** 0.799*** 0.852*** [7.698] [7.354] [7.220] NUM_SEG -0.032** -0.024** -0.018 [2.455] [2.139] [1.355] FIRM AGE -0.084** -0.048 -0.081* [2.020] [1.163] [1.809] LEV 0.229 0.401* 0.506* [0.953] [1.727] [1.862] INTAN 0.213 0.238 0.348* [1.276] [1.487] [1.962] Earnings Quality 0.133** 0.022 0.048 [2.451] [0.417] [0.766] Ownership Structure PER_INSIDE -0.288*** -0.059 -0.248 [2.704] [0.451] [1.197] PER_INST 0.396*** 0.151 0.031
[2.748] [0.918] [0.155]
NUM_BLK5 -0.114*** -0.092*** -0.082*** [8.671] [6.564] [4.932]
1 The dependent variable in these regressions is Tobin’s Q, calculated as
Total Assets - Book Equity + Market Value of Equity - Deferred TaxesQ Total Assets=
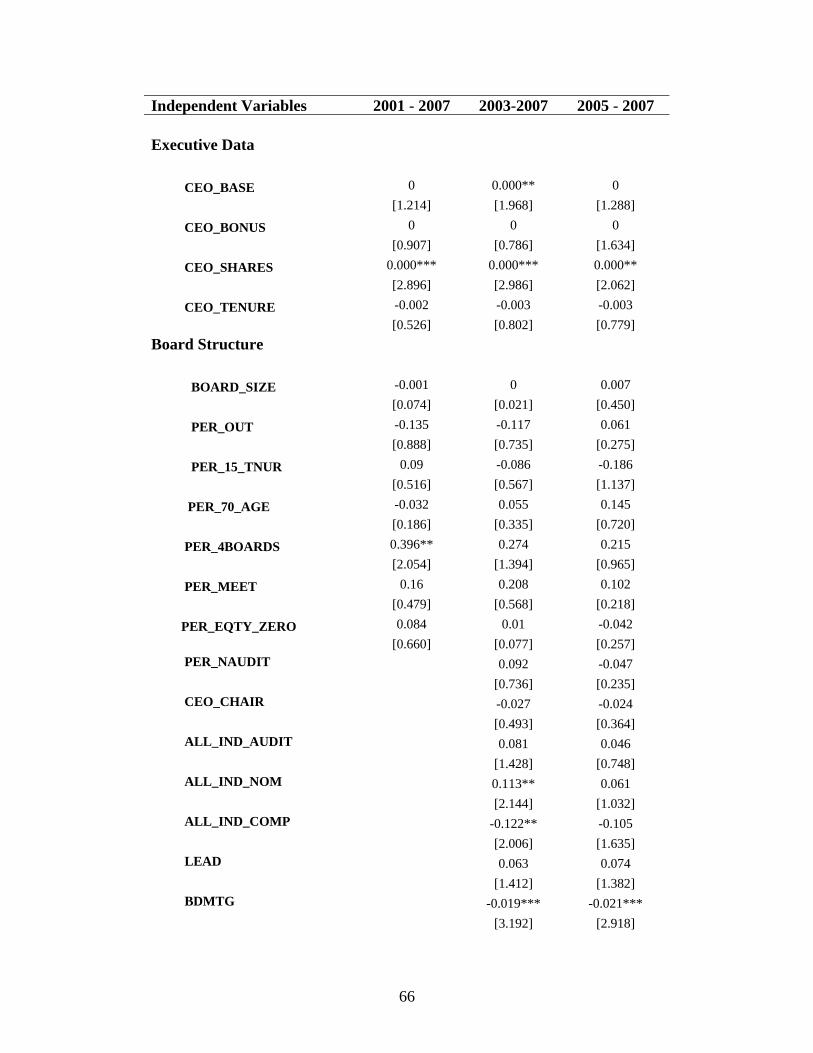
66
Independent Variables 2001 - 2007 2003-2007 2005 - 2007
Executive Data
CEO_BASE 0 0.000** 0
[1.214] [1.968] [1.288]
CEO_BONUS 0 0 0
[0.907] [0.786] [1.634]
CEO_SHARES 0.000*** 0.000*** 0.000**
[2.896] [2.986] [2.062]
CEO_TENURE -0.002 -0.003 -0.003
[0.526] [0.802] [0.779] Board Structure BOARD_SIZE -0.001 0 0.007
[0.074] [0.021] [0.450]
PER_OUT -0.135 -0.117 0.061
[0.888] [0.735] [0.275]
PER_15_TNUR 0.09 -0.086 -0.186
[0.516] [0.567] [1.137]
PER_70_AGE -0.032 0.055 0.145
[0.186] [0.335] [0.720]
PER_4BOARDS 0.396** 0.274 0.215
[2.054] [1.394] [0.965]
PER_MEET 0.16 0.208 0.102
[0.479] [0.568] [0.218]
PER_EQTY_ZERO 0.084 0.01 -0.042 [0.660] [0.077] [0.257] PER_NAUDIT 0.092 -0.047
[0.736] [0.235] CEO_CHAIR -0.027 -0.024
[0.493] [0.364] ALL_IND_AUDIT 0.081 0.046
[1.428] [0.748] ALL_IND_NOM 0.113** 0.061
[2.144] [1.032] ALL_IND_COMP -0.122** -0.105
[2.006] [1.635] LEAD 0.063 0.074
[1.412] [1.382] BDMTG -0.019*** -0.021***
[3.192] [2.918]
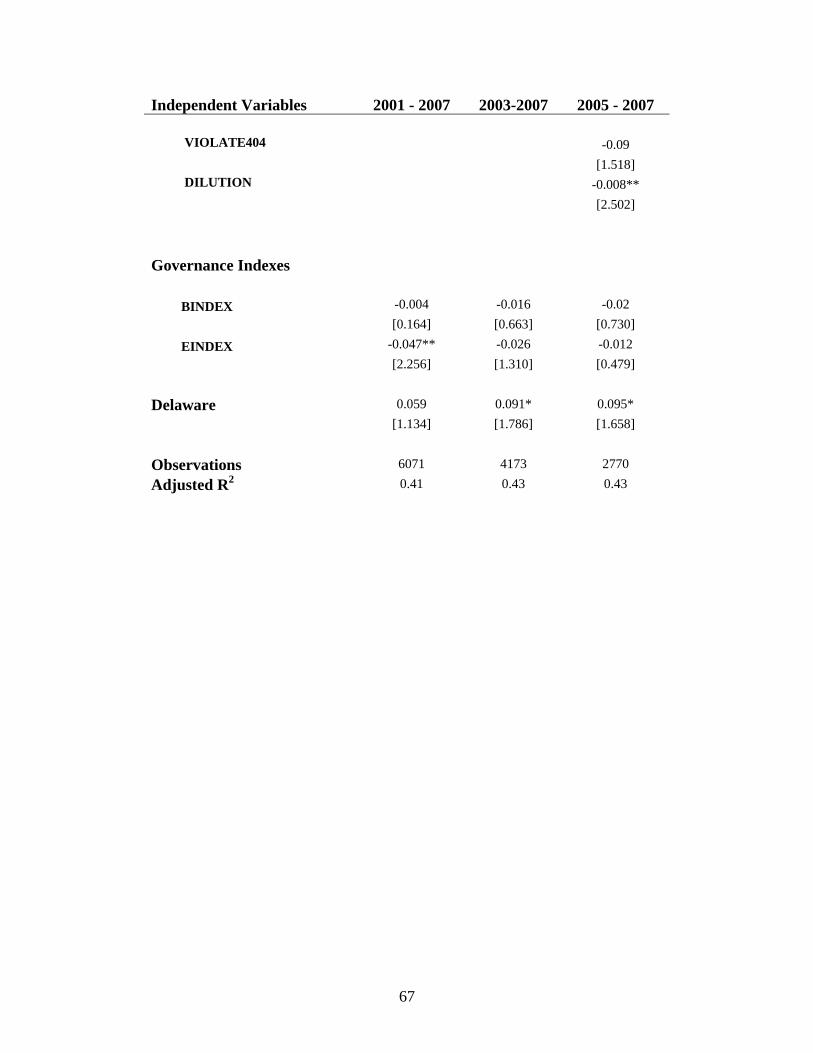
67
Independent Variables 2001 - 2007 2003-2007 2005 - 2007 VIOLATE404 -0.09 [1.518] DILUTION -0.008** [2.502]
Governance Indexes BINDEX -0.004 -0.016 -0.02
[0.164] [0.663] [0.730]
EINDEX -0.047** -0.026 -0.012
[2.256] [1.310] [0.479]
Delaware 0.059 0.091* 0.095*
[1.134] [1.786] [1.658]
Observations 6071 4173 2770
Adjusted R2 0.41 0.43 0.43
68
References Anderson, Ronald, Sattar A. Mansi, and Dvaid M. Reeb, 2004. Board Characteristics, Accounting Report Integrity, and the Cost of Debt. Journal of Accounting and Economics, 37, 315-342. Ashbaugh-Skaife, H., D. Collins, and R. LaFond, 2006. The Effects of Corporate Governance on Firms’ Credit Ratings. Journal of Accounting and Economics, forthcoming. Barclay, Michael and C. Holderness, 1989. Private Benefits from Control of Public Corporations, Journal of Financial Economics 25, 371-395 (1989). Bauer, R., N. Gunster, and R. Otten, 2003. Empirical Evidence on Corporate Governance in Europe. Journal of Asset Management, forthcoming. Bebchuk, Lucian, J.C. Coates IV, and G. Subramanian, 2002. The Powerful Anti-Takeover Force of Staggered Boards: Theory, Evidence and Policy. Stanford Law Review 54, 887-951 Bebchuk, L., A. Cohen, and A. Ferrell, 2004. What Matters in Corporate Governance. Working Paper, Harvard Law School. Bebchuk, Lucian, and Alma Cohen, 2005. The Costs of Entrenched Boards, Journal of Financial Economics, 78, 409-433 Bertrand, Marianne, and Sendhil Mullainathan, 2003. Enjoying the Quiet Life? Corporate Governance and Managerial Preferences, Journal of Political Economy, 111(5), 1043-1075. Bhagat, Sanjai and B. Black, 2002. The Non-Correlation Between Board Independence and Long-Term Firm Performance, Journal of Corporation Law 27, 231-274. Bhagat, S., and B. Bolton, 2007. Corporate Governance and Firm Performance. Working Paper, University of Colorado. Bhojraj, S., and P. Sengupta, 2003. Effects of Corporate Governance on Bond Ratings and Yields: The Role of Institutional Investors and Outside Directors. Journal of Business 76, 455-476. Billett, Matthew, Tao-Hsien King, and David Mauer, 2004. Bondholder wealth effects in mergers and acquisitions: new evidence from the 1980s and 1990s. Journal of Finance, Vol LIX, No. 1, 107-135. Boardman, C. and R, McEnally, 1981. Factors Affecting Seasoned Corporate Bond Prices. Journal of Financial and Quantitative Analysis 31 (September): 337-355.
69
Bradley, M., A. Desai and E. Han Kim, 1988. Synergistic Gains from Corporate Acquisitions and Their Division Between Target and Acquiring Firms, Journal of Financial Economics 21 (May): 3-40. Brown, L., and M. Caylor, 2004. Corporate Governance and Firm Performance. Working Paper, Georgia State University. Chava, Sudheer, Martin Dierker, Dmitry Livdan, and Amiyatosh Purnanandam, 2007. Do Shareholder Rights Affect the Cost of Bank Loans? Working paper, Texas A&M University. Cremers, M., K..J. Martijn and V.B. Nair, 2005. Governance Mechanisms and Equity Prices. Journal of Finance Vol. LX, 2859-2894 Cremers, Martijn, Vinay B. Nair, and Chengyang Wei, 2006, Governance Mechanisms and Bond Prices, forthcoming, Review of Financial Studies. Daines, Robert, 2001, Does Delaware Law Improve Firm Value? Journal of Financial Economics 62, 525-558. Dallas G, 2004. Methodological Overview: Perspectives of an External Analyst. In Governance and Risk (G. Dallas, ed.), ch. 2, New York: McGraw-Hill, 2004. Ecker, Frank, Jennifer Francis, Irene Kim, Per M. Olsson, and Katherine Schipper, 2006, A Returns-Based Representation of Earnings Quality. The Accounting Review 81, 749-780 Faleye, Olubunmi, 2007, Classified Boards, Firm Value, and Managerial Entrenchment. Journal of Financial Economics, 83, 501-529. Fisher, L., 1959. Determinants of Risk Premiums on Corporate Bonds, The Journal of Political Economy 67 (June): 217-237. Francis, Bill, Iftekhar Hasan, Kose John, and Maya Waisman, 2006, Does Delaware Incorporation Affect the Firm’s Cost of Debt Capital? Working paper, Rensselaer Polytechnic Institute. Fung, W., and A. Rudd, 1986. Pricing New Corporate Bond Issues: An Analysis of Issue Cost and Seasoning Effects. Journal of Finance 41 (July): 633-645. Gompers, P.A., J.L. Ishii, and A. Metrick, 2003. Corporate Governance and Equity Prices. Quarterly Journal of Economics 118, 107-115. Hermalin, Benjamin, and Michael Weisbach ,1998. Endogenously Chosen Boards of Directors and their Monitoring of the CEO, The American Economic Review, Vol. 88 96–118.
70
Jensen, Michael , 1993 , The Modern Industrial Revolution, Exit, and the Failure of Internal Control Systems. Journal of Finance, 48, 831-880. Johnson, Shane, Ted Moormant, and Sorin Sorescu (2007). A Reexamination of Corporate Governance and Equity Prices. AFA 2007 Chicago Meetings Paper. Klock, Mark, Sattar A. Mansi, and William F. Maxwell, 2005. Does Corporate Governance Matter to Bondholders? Journal of Financial and Quantitative Analysis, vol. 40, no. 4, 693-719 Lamy, R., and R. Thompson, 1988. Risk Premia and the Pricing of Primary Issue Bonds. Journal of Banking and Finance 12 (December): 585-601. Larcker, David, S. Richardson, and I. Tuna, 2004. Does Corporate Governance Really Matter? Working paper, Wharton School, University of Pennsylvania. Larker, D., S. Richardson, and I. Tuna, 2005. How Important is Corporate Governance? Working Paper, The Wharton School, University of Pennsylvania. Lehn, K., S. Patro, and M. Zhao, 2005. Governance Indices and Valuation Multiples: Which Causes Which? Working Paper, University of Pittsburgh. Lei, L., and M. Y. Teen, 2005. The Determinants of Corporate Governance and the Link between Corporate Governance and Performance: Evidence from the UK Using a Corporate Governance Scorecard. European Journal of Accounting, forthcoming. (L. Lei: PhD. Dissertation, National University of Singapore) Litov, Lubomir, 2005. Corporate Governance and Financing Policy: New Evidence. Working paper, Washington University. No. Am. Catholic Educational Programming v. Rob Gheewalla et al.,Supreme Court of Delaware, 521 A.2nd 92 (Del. May, 2007) Petersen, Mitchell, 2007. Estimating Standard Errors in Finance Panel Data Sets: Comparing Approaches. forthcoming, Review of Financial Studies Sengupta, P., 1998. Corporate Disclosure Quality and the Cost of Debt. The Accounting Review 73 (October): 459-474. Standard & Poor’s, 2002. Transparency and Disclosure: Overview of Methodology and Study Results—United States. S. Patel and G. Dallas, October 2002 Standard & Poor’s, 2007. Corporate Governance Scores and Evaluation Criteria, Methodology, and Definitions. Dallas, G. and Kochetygova, J., Standard & Poor’s RatingsDirect, 7 February 2007.
71
Standard & Poor’s 2007. Annual 2006 Global Corporate Default Study and Rating Transitions. Vazza, D., Aurora, D., Erturk, E. Standard & Poor’s RatingsDirect, 5 February 2007. Subramanian, G. 2004, The Disappearing Delaware Effect. Journal of Law, Economics, & Organization 20, 32-59. Warther, Vincent A., 1998. Board Effectiveness and Board Dissent: a Model of the Board's Relationship to Management and Shareholders. Journal of Corporate Finance, 4, 53-70. Wilcox, John, 2002. Two Cheers for Staggered Boards. Corporate Governance Advisor, Vol. 10, No. 6, 1-5 Ziebart, D. and S. Reiter, 1992. Bond Ratings, Bond Yields, and Financial Information, Contemporary Accounting Research 9 (Fall): 252-282.


![Corporate Governance Manualpaisalo.in/pdf/corporate-governance-en.pdf · [ 1 ] DEFINITIONS Corporate Governance Corporate Governance is the system of internal controls and procedures](https://static.cupdf.com/doc/110x72/60457b037dc32d128b177c66/corporate-governance-1-definitions-corporate-governance-corporate-governance.jpg)