Intertek Evaluation for: Cricket Wireless. __________ ______ ~R~ev.!..:i~s•~· o:!!n....!1..:.:.0~-___,1"-'/ l'-'4""'/2,.,0<..!1~3
692 Mltz 698MHz
90d8m ERP (1 MW)
LTE SUe
Ch57
704 Mltz 728 Mltz 734Mttz
Figure 9- Guardband for L TE Deployment Plan
&OdBmERP (1 kW)
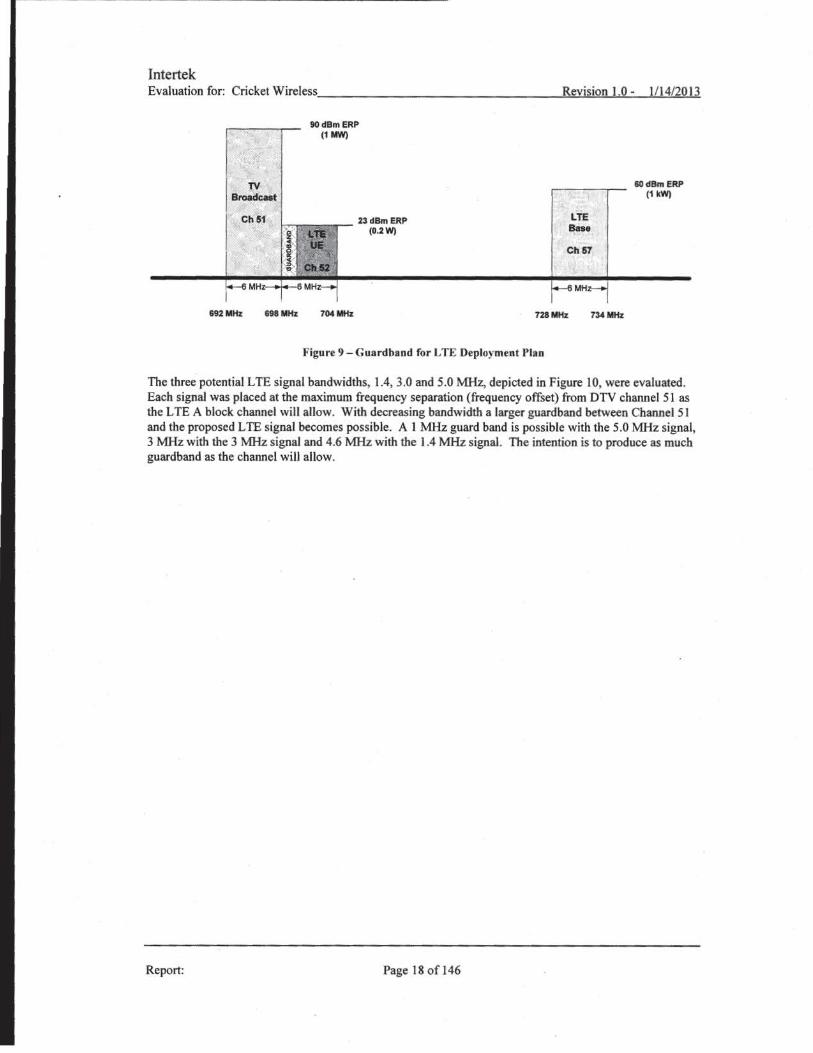
The three potential LTE signal bandwidths, 1.4, 3.0 and 5.0 MHz, depicted in Figure I 0, were evaluated. Each signal was placed at the maximum frequency separation (frequency offset) from DTV channel 51 as the LTE A block channel will allow. With decreasing bandwidth a larger guardband between Channel 51 and the proposed L TE signal becomes possible. A 1 MHz guard band is possible with the 5.0 MHz signal, 3 MHz with the 3 MHz signal and 4.6 MHz with the 1.4 MHz signal. The intention is to produce as much guardband as the channel will allow.
Report: Page 18 of 146
lntertek Evaluation for: Cricket Wireless. ________________ ..!.:R~ee!..vJ!!!·s~io!:!.!n~l!..::.O~-----.!1~11~4~/2=.l0""1~3
692 MHz
2.3 Test Assumptions
698 MHz
90dBm ERP (1 MW)
Figure 10 - UE signal bandwidths evaluated
704MHz
23 dBm ERP
(0.2W)
Test assumptions will be kept to the fewest feasible number. However, some assumptions must be made. Many are in the area of how representative the test sample is of the population it is drawn from. Care was taken in the sample selection plan to ensure that the test sample is representative of its larger population. Variables such as manufacturing variance and changes in performance with age and handling are assumed to have relatively small impact.
2.4 Applicable Documents
Table 1 is a list of applicable standards and other documents for this project.
Document Number
3GPP TS 36.101
A TSC A/53 Part 1
Report:
Table 1 Applicable Documents
Title
3rd Generation Partnership Project; Technical Specification Group Radio Access Network; Evolved Universal Terrestrial Radio Access (E-UTRA); User Equipment (UE) radio transmission and reception (Release II)
Digital Television System
Page 19 of 146
Revision &Date
2012
2009
lntertek Evaluation for: Cricket Wireless·----------------~R~ev.!.!i~si~o:!.!n....:l..:..:.O~-;;__....:.lwl li..;.]4~/2~0:.:1~3
A TSC A/53 Part 2
A TSC A/153 Part 1
ATSC A/153 Part 2
IEEE 1900.2-2008
Report:
RFffransmission System Characteristics
A TSC Mobile DTV System
RFffransmission System Characteristics
IEEE Recommended Practice for the Analysis of In-Band and Adjacent Band Interference and Coexistence Between Radio Systems
Page 20 of 146
2011
2011
2011
2008
Intertek Evaluation for: Cricket Wireless. ________________ "'-'R"'!e-'-'vi,st~·o"-'n-...!1'-".0~---!l.w/1~4,_,/2~0!...!1~3
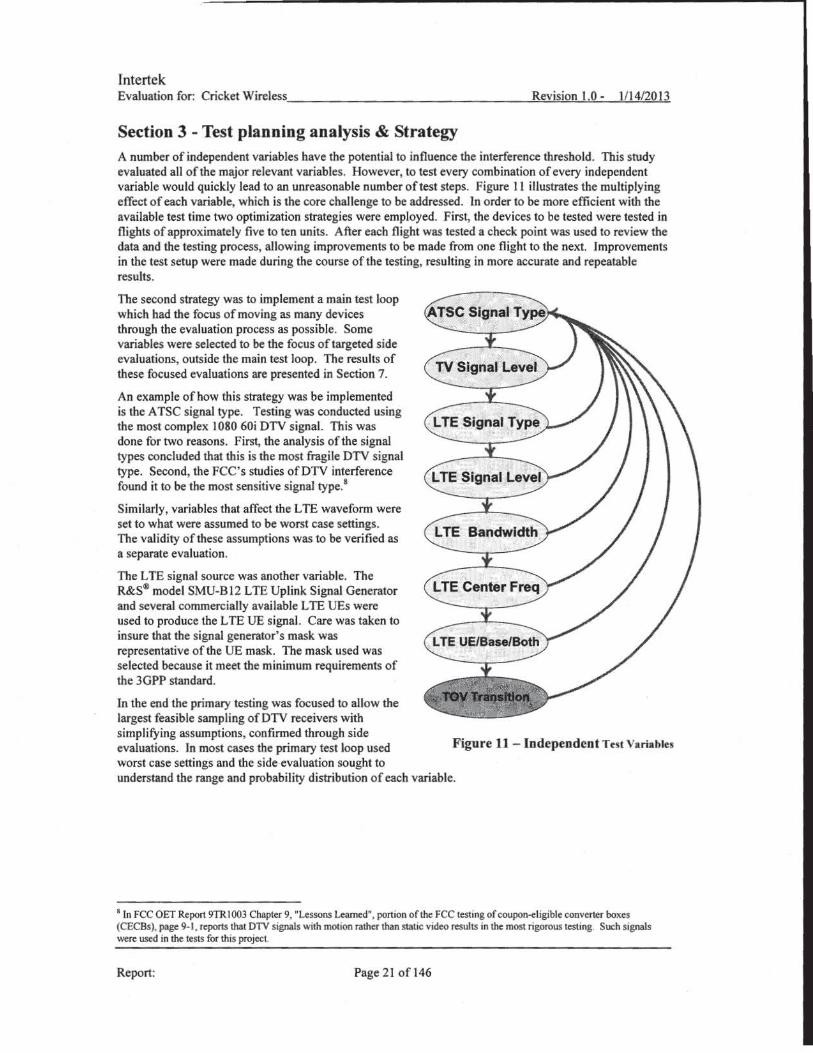
Section 3 - Test planning analysis & Strategy A number of independent variables have the potential to influence the interference threshold. This study evaluated all of the major relevant variables. However, to test every combination of every independent variable would quickly lead to an unreasonable number of test steps. Figure 11 illustrates the multiplying effect of each variable, which is the core challenge to be addressed. In order to be more efficient with the available test time two optimization strategies were employed. First, the devices to be tested were tested in flights of approximately five to ten units. After each flight was tested a check point was used to review the data and the testing process, allowing improvements to be made from one flight to the next. Improvements in the test setup were made during the course of the testing, resulting in more accurate and repeatable results.
The second strategy was to implement a main test loop which had the focus of moving as many devices through the evaluation process as possible. Some variables were selected to be the focus of targeted side evaluations, outside the main test loop. The results of these focused evaluations are presented in Section 7.
An example of how this strategy was be implemented is the A TSC signal type. Testing was conducted using the most complex 1080 60i DTV signal. This was done for two reasons. First, the analysis of the signal types concluded that this is the most fragile DTV signal type. Second, the FCC's studies ofDTV interference found it to be the most sensitive signal type.8
Similarly, variables that affect the LTE waveform were set to what were assumed to be worst case settings. The validity of these assumptions was to be verified as a separate evaluation.
The L TE signal source was another variable. The R&S® model SMU-BJ2 LTE Uplink Signal Generator and several commercially available LTE UEs were used to produce the LTE UE signal. Care was taken to insure that the signal generator's mask was representative of the UE mask. The mask used was selected because it meet the minimum requirements of the 3GPP standard.
In the end the primary testing was focused to allow the largest feasible sampling of DTV receivers with simplifying assumptions, confirmed through side evaluations. In most cases the primary test loop used Figure 11 -Independent Test Variables
worst case settings and the side evaluation sought to understand the range and probability distribution of each variable.
8 In FCC OET Report 9TRI 003 Chapter 9, "Lessons Learned", portion of the FCC testing of coupon-eligible converter boxes (CECBs), page 9-1 , reports that DTV signals with motion rather than static video results in the most rigorous testing. Such signals were used in the tests for this project.
Report: Page 21 of 146
Intertek Evaluation for: Cricket Wireless ________________ R=ev;:..J.i~si,o'"'"n-"I.!.::.0<----'-11:....::1'-'4.:..:/2""'0'"""1..,3
3.1 LTE (Source) device characteristics
3.1.1 Transmission Power
The maximum transmit power is 23 dBm with a ±2 dB tolerance for UE in this band.9
The signal bandwidth and with it the number of resource blocks used is a variable explored in the testing.
3.1.2 Out-of-Band Emissions
Out-of-band-emissions (OOBE) are a significant consideration for this issue. OOBE that fall within DTV channel 51, 692-698 MHz, will be of particular concern because it constitutes a co-channel interfering signal to the DTV Channel 51 signal. In its 2007 test report the FCC found:
Co-Channel Interference Rejection
Tests conducted by the FCC Laboratory in 2005 on 28 consumer DTV receivers demonstrated that the receivers differ very little in their immunity to broadband cochannel interference. In those tests, receivers were found to produce pictures that were free of visual errors when the TV signal power exceeded broadband interference power within the same TV channel by a threshold ranging from 14.9 to 15.8 dB, with the median threshold being 15.3 dB. 101 These results closely match the 15.2 dB threshold of the Grand Alliance receiver. I U
The small variation of co-channel interference rejection perfomJance among the receivers and the close match to the older Grand Alliance results are in line with the expectation that co-channel interference rejection threshold is detem1ined primarily by the structure of the ATSC DTV signal format adopted by the FCC. 12
The co-channel interference rejection sets a floor to expectations for DIU ratio. The desired-to-undesired (DIU) signal ratio cannot exceed the OOBE levels within the DTV Channel 51 band by more than -15 dB. A measure of the OOBE falling into DTV Channel 51 versus the L TE fundamental plus 15 dB will be an effective limit on the DIU ratio defining A-block-into-DTV-Channel-51 interferenc.e. But that best case will only be possible if interference from OOBE is the dominant interference mechanism. If other interference mechanisms dominate then DIU ratios below that level may be observed as defining A-block-into-DTV -Channel 51 interference.
The FCC OOBE limits in the service rules for the 698-746 MHz band set a worst case level for OOBE since these requirements prevent LTE UE from having higher levels ofOOBE.
(g) For operations in the 698-746 MHz band, the power of any emission outside a licensee's frequency band(s) of operation shall be attenuated below the transmitter power (P) within the licensed band(s) of operation, measured in watts, by at least 43 + 10 log (P) dB. Compliance with this provision is based on the use of measurement instrumentation employing a resolution bandwidth of 100 kilohertz or greater. However,
9 See 3GPPTS 36.101 V9.9.0 (2011-09) Sections 6.6.2.1.1 and Table 6.2.2.1.1-1 or 3GPP TS 36.101 Vll.O.O (2012-03) Section 6.2.2 and Table 6.2.2- 1, which specifies the maximum emission limits for L TE UE. UE in this band operate as power class 3 devices under the 3GPP standard. The 3GPP standards define several power classes and set maximum transmit power limits for each class.
10 Martin, <SHVERA Study>, 2005, chapter 3.
II Federal Communications Commission Advisory Committee on Advanced Television Service, "Final Technical Report", Oct 31, 1995,p. l9.
12 March 30, 2007, OET Report FCC/OET 07-TR-1003, "Interference Rejection Thresholds of Consumer Digital Television Receivers Available in 2005 and 2006", pg. 1·2.
Report: Page 22 ofl 46
Intertek Evaluation for: Cricket Wireless. ________________ ~R~e..:..vi!!?.s~io~n~l'-'".0~-..._.!1~/1~4~/2~0!..!1~3
in the 100 kilohertz bands immediately outside and adjacent to a licensee's frequency block, a resolution bandwidth of at least 30 kHz may be employed. 13
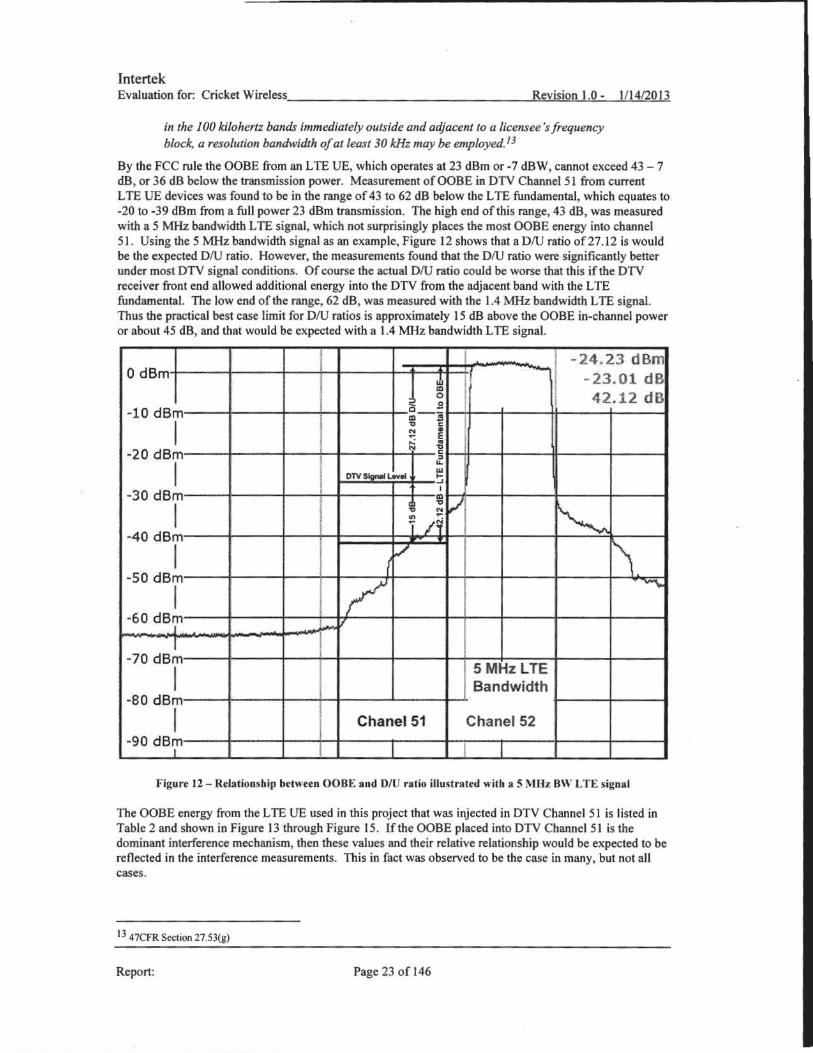
By the FCC rule the OOBE from an LTE UE, which operates at 23 dBm or -7 dBW, cannot exceed 43 - 7 dB, or 36 dB below the transmission power. Measurement ofOOBE in DTV Channel 51 from current LTE UE devices was found to be in the range of 43 to 62 dB below the L TE fundamental, which equates to -20 to -39 dBm from a full power 23 dBm transmission. The high end of this range, 43 dB, was measured with a 5 MHz bandwidth L TE signal, which not surprisingly places the most OOBE energy into channel 51 . Using the 5 MHz bandwidth signal as an example, Figure 12 shows that a DIU ratio of27.12 is would be the expected DIU ratio. However, the measurements found that the DIU ratio were significantly better under most DTV signal conditions. Of course the actual DIU ratio could be worse that this if the DTV receiver front end allowed additional energy into the DTV from the adjacent band with the L TE fundamental. The low end of the range, 62 dB, was measured with the 1.4 MHz bandwidth LTE signal. Thus the practical best case limit for DIU ratios is approximately 15 dB above the OOBE in-channel power or about 45 dB, and that would be expected with a 1.4 MHz bandwidth L TE signal.
--I -24.23 dBm 0 dBm
~ -23.01 dB 0 ' 42.12 dB
21_~ I l -10 dBm
I CD s I I -.:> c: ~ • E ,..: ..
-20 dBm N -.:>
c:
I " I
IL
I OTV SigN~ IAvel Ul .... ..J
-30 dBm ' CD
/ I l -.:>
-.:> N
~ .... "'":
I /1 -40 dBm
I (/ ~ -so dBm
~ ~
I -60 dsr :,.....V
r -70 dBm
5 MHz LTE I I Bandwidth -80 dBm
I I Chanel51 Chane! 52 -90 dBm
I I I
Figure 12 - Relationship between OOBE and 0 /U ratio illustrated with a 5 MHz BW L TE signal
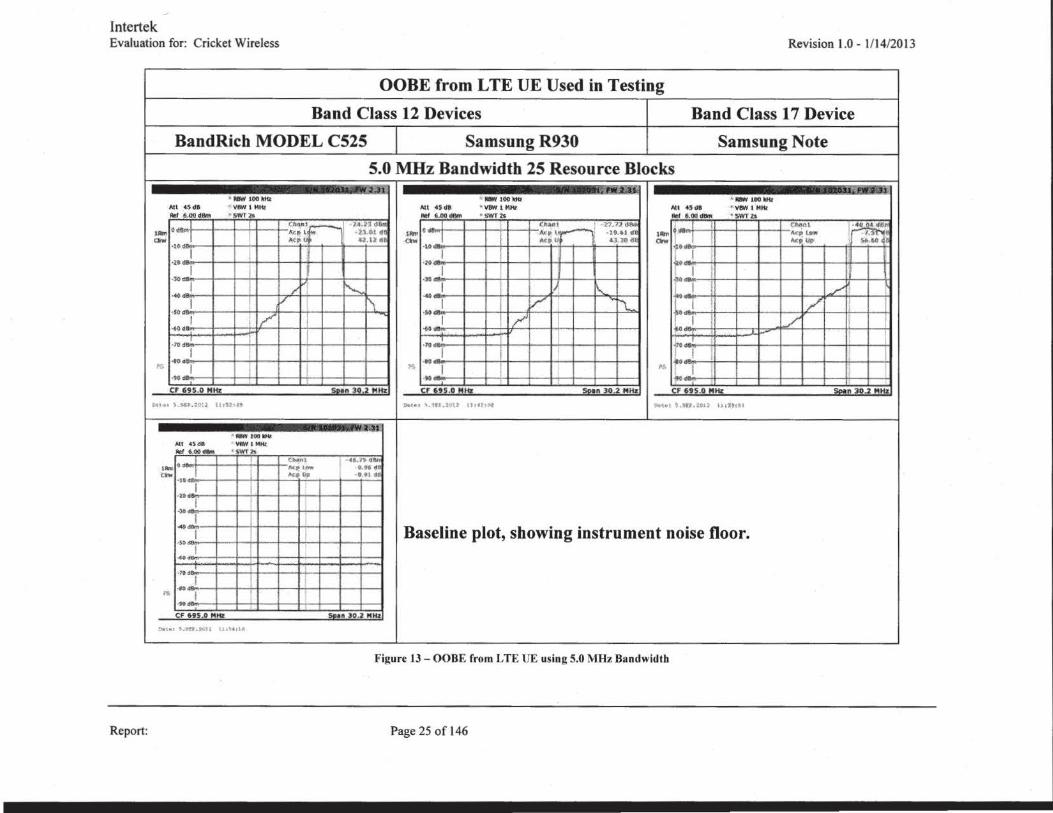
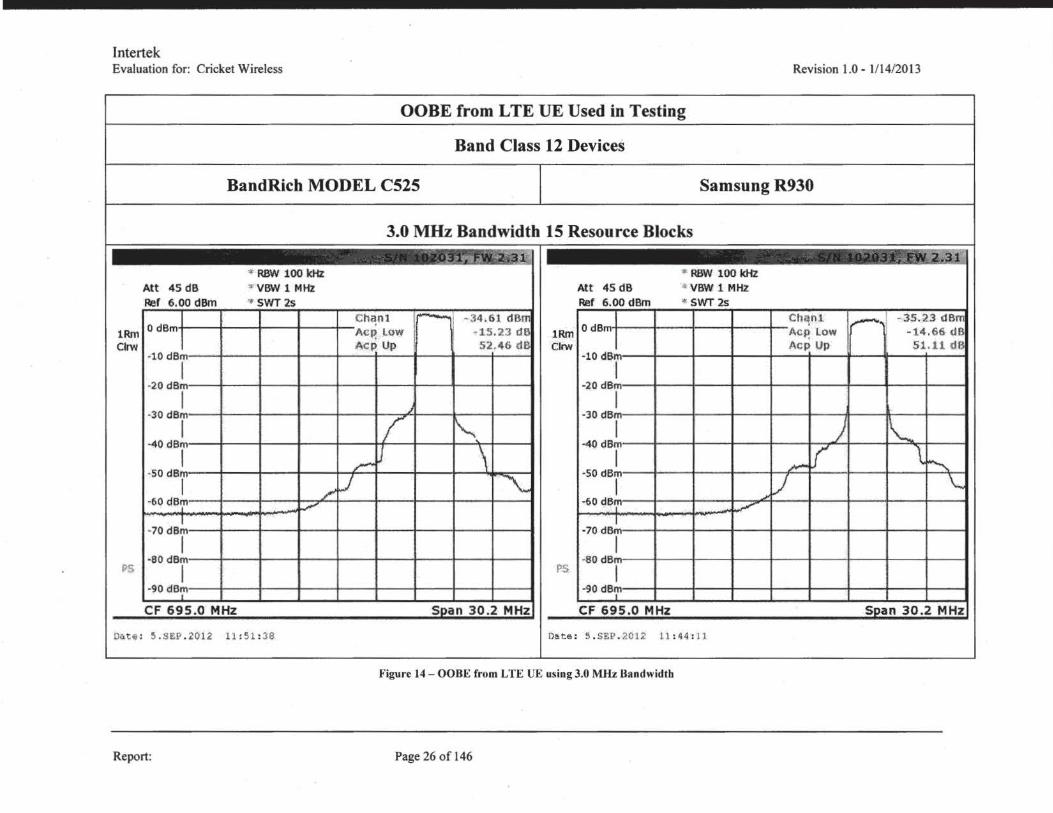
The OOBE energy from the L TE UE used in this project that was injected in DTV Channel 51 is listed in Table 2 and shown in Figure 13 through Figure 15. Ifthe OOBE placed into DTV Channel 51 is the dominant interference mechanism, then these values and their relative relationship would be expected to be reflected in the interference measurements. This in fact was observed to be the case in many, but not all cases.
13 47CFR Section 27.53(g)
Report: Page 23 of 146
lntertek Evaluation for: Cricket Wireless. _ ______________ -'R~e~v~i s~io~n~l.~0..:.----'1!..!../.!..:14!!../2~0~1~3
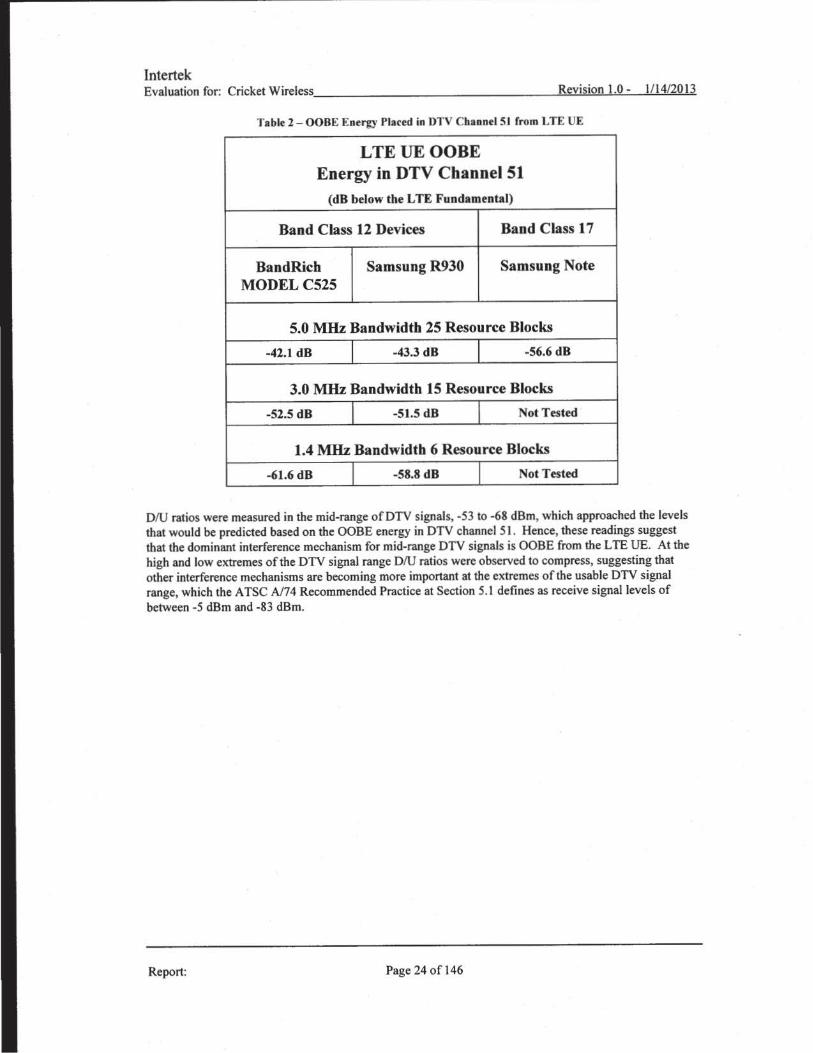
Table 2- OOBE Energy Placed in DTV Channel S I from LTE UE
LTEUEOOBE Energy in DTV Channel 51
(dB below the LTE Fundamental)
Band Class 12 Devices
BandRich MODELC525
Samsung R930
Band Class 17
Samsung Note
5.0 MHz Bandwidth 25 Resource Blocks
-42.1 dB -43.3 dB -56.6 dB
3.0 MHz Bandwidth 15 Resource Blocks
-52.5 dB -51.5 dB Not Tested
1.4 MHz Bandwidth 6 Resource Blocks
-61.6 dB -58.8 dB Not Tested
DIU ratios were measured in the mid-range ofDTV signals, -53 to -68 dBm, which approached the levels that would be predicted based on the OOBE energy in DTV channel 51. Hence, these readings suggest that the dominant interference mechanism for mid-range DTV signals is OOBE from the L TE UE. At the high and low extremes of the DTV signal range DIU ratios were observed to compress, suggesting that other interference mechanisms are becoming more important at the extremes of the usable DTV signal range, which the ATSC A/74 Recommended Practice at Section 5.1 defines as receive signal levels of between -5 dBm and -83 dBm.
Report: Page 24 of 146
Intertek Evaluation for: Cricket Wireless Revision l.O - l/ 14/20 13
OOBE from L TE UE Used in Testing
Band Class 12 Devices Band Class 17 Device
HandRich MODEL C525 Samsung R930 Samsung Note
5.0 MHz Bandwidth 25 Resource Blocks _,
~-m ~-'~" _7><.' ~~ . · -lOOlrKz · -lOOliHl
'"Vf!JN l Mttt · swr~
~- 0 J .... .
~At Ac::p LUIJ
·~• o• .s I ,
Qw •l O
(lrW ~p\lo .s. ... . I
~to- ~· I I *
..,. '* • I
• I 0
·10 d • I •• l I ... ... ,.. X I'!· I I
-~ -tO ... Cf' 695.0" n 3 0 2 Mit% cr 6ts.o 111 on 30.2 Hit% n JO.l Mit%
C.."-·t ,,11-&ff.':(!tl UtU~f• l71ttMt -..·at .::tttt,. u tfhfq t' ·'"4·1 ,.tu .. :ou Hc2t:'2
.,.,too.-AU 4Sda YtiN l MHI 1101 6.00 .... · ~WTl'\
CbthJ. • 41.1t Gfllf ..... 1'4.P, "'* •t.H • a.. ~lljl ...
·11
I ...... I .,. 1 ........ Baseline plot, showing instrument noise floor. I .,. I ...
_,. I
I ... ,. I ... CF 695.0 Mttr •tt 30~2 MHI
t'fl••~ , .. .,tr .~n. u,•.c,1•
Figure 13 - OOBE from LTE UE using 5.0 MHz Bandwidth
Report: Page 25 of 146
Intertek Evaluation for: Cricket Wireless Revision l.O- l/ 14/2013
OOBE from LTE UE Used in Testing
Band Class 12 Devices
HandRich MODEL C525 Samsung R930
3.0 MHz Bandwidth 15 Resource Blocks L'f"'l..l ..-_·; ~ - ·-z.;
~ ~ , .. L,
* RBW 100 kHz • R8W 100kHZ
Att 45 dB "' Vrw-1 1 MHz Att 45 dB .t VBW 1 MHz
Ref 6.00 dBm ~ SWT2s Ref 6.00 dBm "' SWT 2S
Chant c tutnl 1Rm
OdBm Ac~ Low 1Rm 0 dB Acp Low Clrw A c p Up Clrw Acp Up
·10 dBm -10 dBm
I I ·20 dBm ·20 dBm
I I -30 dBm -30 dBm
I I ·40 dBm -40 dBm
I I ·SO dBm ·SO dBm
I I ·60 dBm ·60 dBm
-70 dBm -70 dBm
I I ·80 dBm ·80 dBm
PS I PS I ·90 dBm ·90 dBm
CF 695.0 MHz S an 30 .2 MHZ CF 695 .0 MHZ S an 30.2 MHZ
~te : ~ . s£~ . 2012 11 : ~1 : 38 Oat& : 5 . SEP . 20l2 11 :44 : 11
Figure 14 - OOB~ from LTE U~ using 3.0 MHz Bandwidth
Report: Page 26 of 146

Intertek Evaluation for: Cricket Wireless Revision 1.0 - 1/ 14/201 3
OOBE from LTE UE Used in Testing
Band Class 12 Devices
HandRich MODEL CS25 Samsung R930
1.4 MHz Bandwidth 6 Resource Blocks
·~IT"'~ I t"" ~·d·~ ,.·;<.:, ,
• RBW 100kHz • RBW 100kHz Att 45 dB VBW 1 MHz Att 45 dB • vaw 1 MHz
Ref 6.00 dBm • swr2s Ref 6.00 dBm • swr 2s Chant I -43 .6s d Chant - 43.08 dB
1Rm 0 dBm AcP, low - 9.57 dB 1Rm 0 dBm ACP, low -10.1.2 dB Clrw Acp Up 61.59 dB Clrw Acp Up S$. 79 d8
-10 dBm -10 dBm
I I ·20 dBm ·20 dB
I I -30 dBm -30 dBm
I I ·40 dBm ·40 dBm
I I ·50 dBm ·50 dBm
I I -60 dBm ·60 dBm
·70 dBm ·70 dBm
I I ·80 dBm ·80 dBm
PS I PS I -90 dBm ·90 dBm
CF 695.0 MHz S an 30 .2 MHZ CF 695.0 MHZ S an 30 .2 MHZ
06te : 5 . SEP . 2012 Jl : 49 : 16 Date: 5 . S£P . 2012 11 : 47 : 13
------------- ----------------- ---------------- ---------------- ------- -----····-·--
Figure IS - OOBE fro m LTE UE using 1.4 Mflz Bandwidth
Report: Page 27 of 146
Intertek Evaluation for: Cricket Wireless Revision 1.0 - 1114/2013
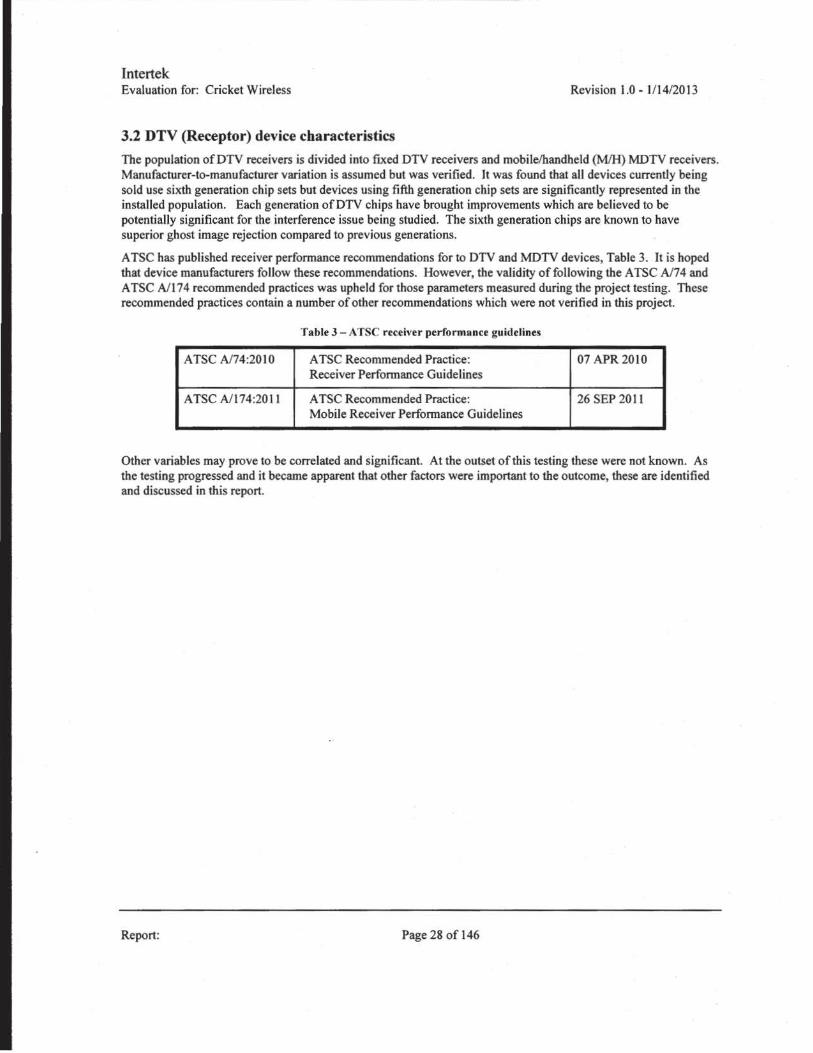
3.2 DTV (Receptor) device characteristics
The population ofDTV receivers is divided into ftXed DTV receivers and mobile/handheld (M!H) MDTV receivers. Manufacturer-to-manufacturer variation is assumed but was verified. Jt was found that all devices currently being sold use sixth generation chip sets but devices using fifth generation chip sets are significantly represented in the installed population. Each generation ofDTV chips have brought improvements which are believed to be potentially significant for the interference issue being studied. The sixth generation chips are known to have superior ghost image rejection compared to previous generations.
A TSC has published receiver performance recommendations for to DTV and MDTV devices, Table 3. It is hoped that device manufacturers follow these recommendations. However, the validity of following the A TSC A/74 and A TSC A/174 recommended practices was upheld for those parameters measured during the project testing. These recommended practices contain a number of other recommendations which were not verified in this project.
Table 3- ATSC receiver performance guidelines
ATSC A/74:2010 ATSC Recommended Practice: 07 APR 2010 Receiver Performance Guidelines
ATSC A/174:201 1 A TSC Recommended Practice: 26 SEP 201 1 Mobile Receiver Performance Guidelines
Other variables may prove to be correlated and significant. At the outset of this testing these were not known. As the testing progressed and it became apparent that other factors were important to the outcome, these are identified and discussed in this report.
Report: Page 28 of 146
lntertek Evaluation for: Cricket Wireless Revision 1.0- 1114/2013
Section 4 - Test Preparation Activities
4.1 Tbesbold of Sensitivity
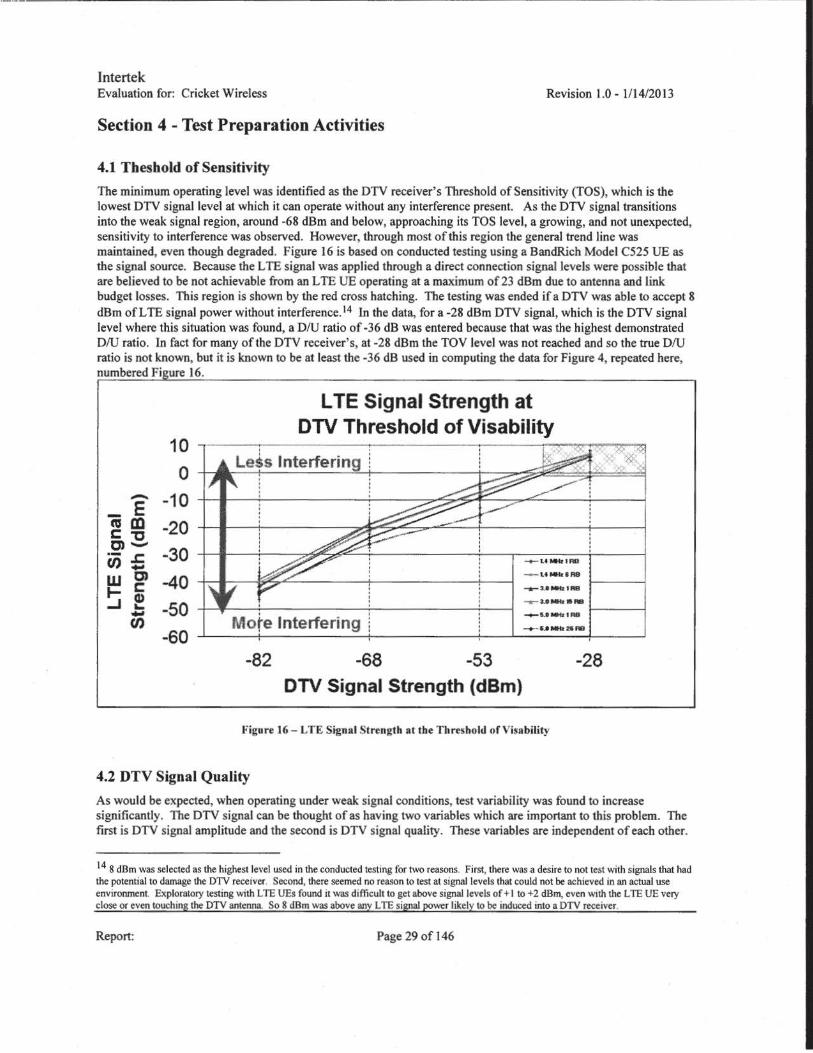
The minimum operating level was identified as the DTV receiver's Threshold of Sensitivity (TOS), which is the lowest DTV signal level at which it can operate without any interference present. As the DTV signal transitions into the weak signal region, around -68 dBm and below, approaching its TOS level, a growing, and not unexpected, sensitivity to interference was observed. However, through most of this region the general trend line was maintained, even though degraded. Figure 16 is based on conducted testing using a BandRich Model C525 UE as the signal source. Because the L TE signal was applied through a direct connection signal levels were possible that are believed to be not achievable from an L TE UE operating at a maximum of23 d.Bm due to antenna and link budget losses. This region is shown by the red cross hatching. The testing was ended if a DTV was able to accept 8 d.Bm ofL TE signal power without interference. 14 In the data, for a -28 dBm DTV signal, which is the DTV signal level where this situation was found, a DIU ratio of -36 dB was entered because that was the highest demonstrated DIU ratio. In fact for many of the DTV receiver's, at -28 dBm the TOY level was not reached and so the true DIU ratio is not known, but it is known to be at least the -36 dB used in computing the data for Figure 4, repeated here, numbered Fi ure 16.
-E cum c:-c m-·- .s::. en_ w C) 1- c: ...J ~ -en
10
0 -10
-20
-30 -40 -50 -60
L TE Signal Strength at DTV Threshold of Visability
Le~s Interfering
-t-- t.f ..... tAD
-~. .... ,,. -a-3..811M1 t ..
-r-u~~etr•M
Mote Interfering - · .. - · .. 1-----1 -+-I .I ...... BAB
-82 -68 -53 -28 DTV Signal Strength (dBm)
Figure 16 - LTE Signal Strength at the Threshold of Visability
4.2 DTV Signal Quality
As would be expected, when operating under weak signal conditions, test variability was found to increase significantly. The DTV signal can be thought of as having two variables which are important to this problem. The first is DTV signal amplitude and the second is DTV signal quality. These variables are independent of each other.
14 8 dBm was selected as the highest level used in the conducted testing for two reasons. First, there was a desire to not test with signals that had the potential to damage the DTV receiver. Second, there seemed no reason to test at signal levels that could not be achieved in an actual use environment. Exploratory testing with L TE UEs found it was difficult to get above signal levels of+ I to +2 dBm, even WJth the L TE UE very close or even touching the DTV antenna. So 8 dBm was above any L TE signal power likely to be induced into a DTV receiver.
Report: Page 29 of 146
Intertek Evaluation for: Cricket Wireless Revision 1.0- 1/14/201 3
Signal quality can degrade due to signal reflections and other influences, which are independent of the signal amplitude. Signal quality is commonly measured as Error Vector Magnitude (EVM). It was observed that, particularly under weak signal conditions, variation in EVM could dramatically influence the sensitivity to interference. Accordingly the interference threat distance can vary significantly due to EVM even with the same DTV signal amplitude.
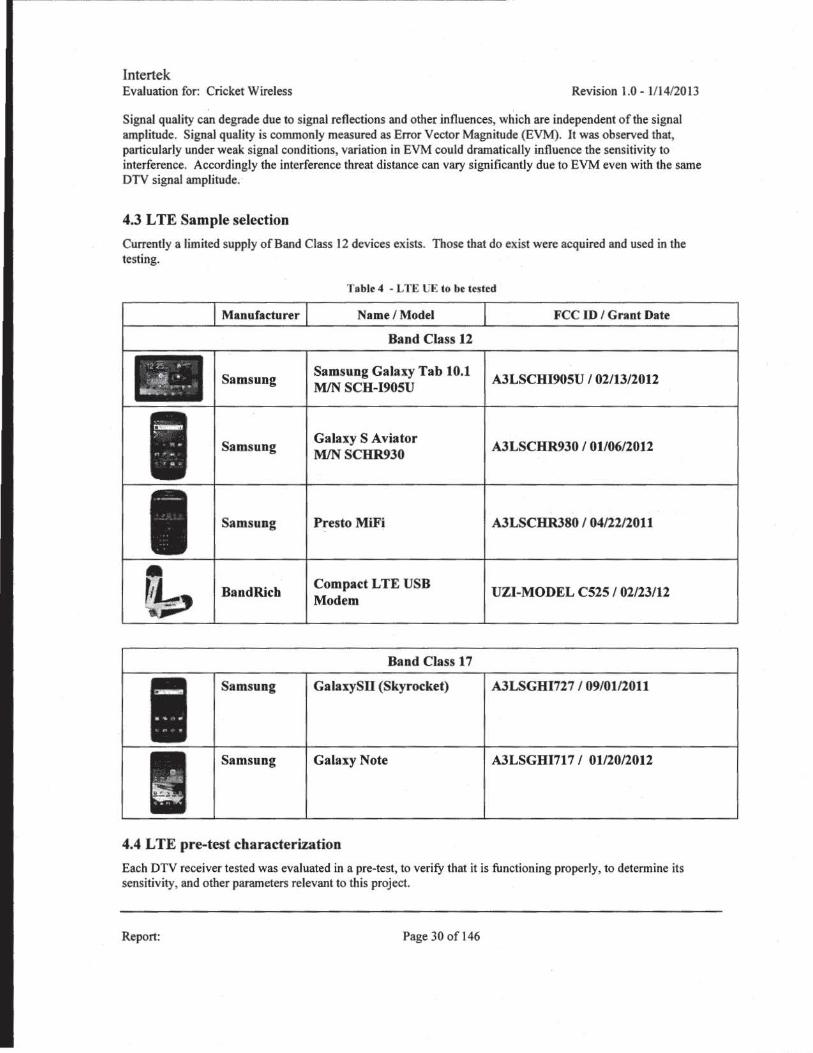
4.3 LTE Sample selection
Currently a limited supply of Band Class 12 devices exists. Those that do exist were acquired and used in the testing.
Table 4 - L TE t:E to bt tested
Manufacturer
Samsung
Samsung
Samsung
BandRicb
Samsung
Samsung
Name / Model
Band Class 12
Samsung Galaxy Tab 10.1 MIN SCH-190SU
Galaxy S Aviator M/N SCHR930
Presto MiFi
Compact LTE USB Modem
Band Class 17
GalaxySD (Skyrocket)
Galaxy Note
4.4 L TE pre-test characterization
FCC ID I Grant Date
A3LSCBI90SU I 02/13/2012
A3LSCHR930 I 0110612012
A3LSCHR380 I 04122/2011
UZI-MODEL CS2S I 02123112
A3LSGHI727 I 09101/2011
A3LSGBI717 I 0112012012
Each DTV receiver tested was evaluated in a pre-test, to verify that it is functioning properly, to detennine its sensitivity, and other parameters relevant to this project.
Report: Page 30 of 146
lntertek Evaluation for: Cricket Wireless Revision 1.0- l/ 14/2013
4.4.1 Maximum transmit power
The maximum transmit power was measured for each L TE UE and compared to the FCC equipment authorization test report on file with the FCC. The purpose of the comparison was to verify that the device being used was representative of the design, as reported to the FCC.
4.4.1. t Galaxy S Aviator (Band Class 12)
The Galaxy S Aviator, model SCHR930, was measured for maximum radiated power and the results compared to those reported to the FCC in the test report available on the FCC equipment grants database. It was confirmed that the specific devices being used were representative of the design, as evidenced by the FCC test report. Hence, it is believed that the L TE devices used were operating normally and reasonably represent their model.
4.4.1.2 BandRich L TE USB Modem (Band Class 12)
The BandRich Compact L TE USB Modem, Model Model CS25, was measured for maximum radiated power and the results compared to those reported to the FCC as part of the equipment grant for tbis device.
4.4.1.3 Galaxy Note (Band Class 17)
The Galaxy Note, Model SGH 1717, was measured for maximum radiated power and the results compared to those reported to the FCC as part of the equipment grant for this device.
4.4.2 L TE In-Band
The following signal characteristics were measured for each L TE UE used in the testing: • Maximum transmit power. • Adjacent channel power at maximum transmit power. • Occupied bandwidth.
4.4.3 L TE Out-of-Band
The out-of-band-emission from each UE used in this testing was measured before the device was used in the testing.
4.5 DTV Sample selection
DTV receivers can be categorized in a number of ways. Samsung guides consumers on its site by arranging their TV products by type, screen size, features and price. Sony uses a similar arrangement but adds a product family category and currently has four product families, the XBR-HX Series, HX-Series, EX-Series and BX-Series. A series of models may indicate a similar or identical underlying receiver design and so there is the liklihood that models within a series will behave similarly. Price may also be significant if correlated to higher quality design in the receiver circuitry.
Report: Page 31 of 146

lntertek Evaluation for: Cricket Wireless Revision 1.0 - 1114/20 13
Type Screen Size Features Price
(LEOs use backlighting to (Screen size is measured (Features range from (Price ranges are directly deliver enhanced images. diagonally, from inside fashionable style to related to the number of
LCD displays work weU in edges, and does not include interactive features like features. The higber the dark and bright light. the outer frame. ) Samsung Apps.) cost, tbe more features.) Plasma TVs have high
contrast ratios and deep blacks.)
LED TV 60"- 65" 3D Under $800
Plasma TV 52" - 58" Samsung Apps $800-$1500
LCD TV 46" - 51" 600Hz Subfield Motion $1500- $2500
40" - 43" Skype $2500 and up
32" - 37" Built-in WiFi
19" - 26"
Figure 17- Samsung's consumer oriented TV catcgories15
The DTV receivers for the first two flights were selected by choosing from recent lists of the manufacturers with the greatest market share and the best selling or most highly rated models.
The January 10, 2012, issue of This Week In Consumer Electronics (TWICE) magazine reported the top-ten consumer grade TV receivers manufacturers as:
1. Sam sung 2. LG 3. Sony 4. Panasonic 5. Sharp 6. Toshiba 7. Vizio 8. RCA 9. Westinghouse 10. Mitsubishi
This list of manufacturers was then used with lists from Amazon (as of April S, 2012) of the top 100 TV models ranked by sales and Best Buy's list of the top 57 models based on consumer reviews. A unit from each manufacturer, generally the first on the list for that manufacturer (its best selling model) was selected. Also included were DTV receivers from manufacturers not listed in the top ten to ensure that " low end" receivers were included. This added receivers from five manufacturers:
IS
11. 12. 13. 14. 15.
Report:
Haier Co by Insignia Dynex NC
Source: http://www.samsung.cornlus/video/tvsfall-products
Page 32 of 146
Intertek Evaluation for: Cricket Wireless Revision 1.0- 1/14/2013
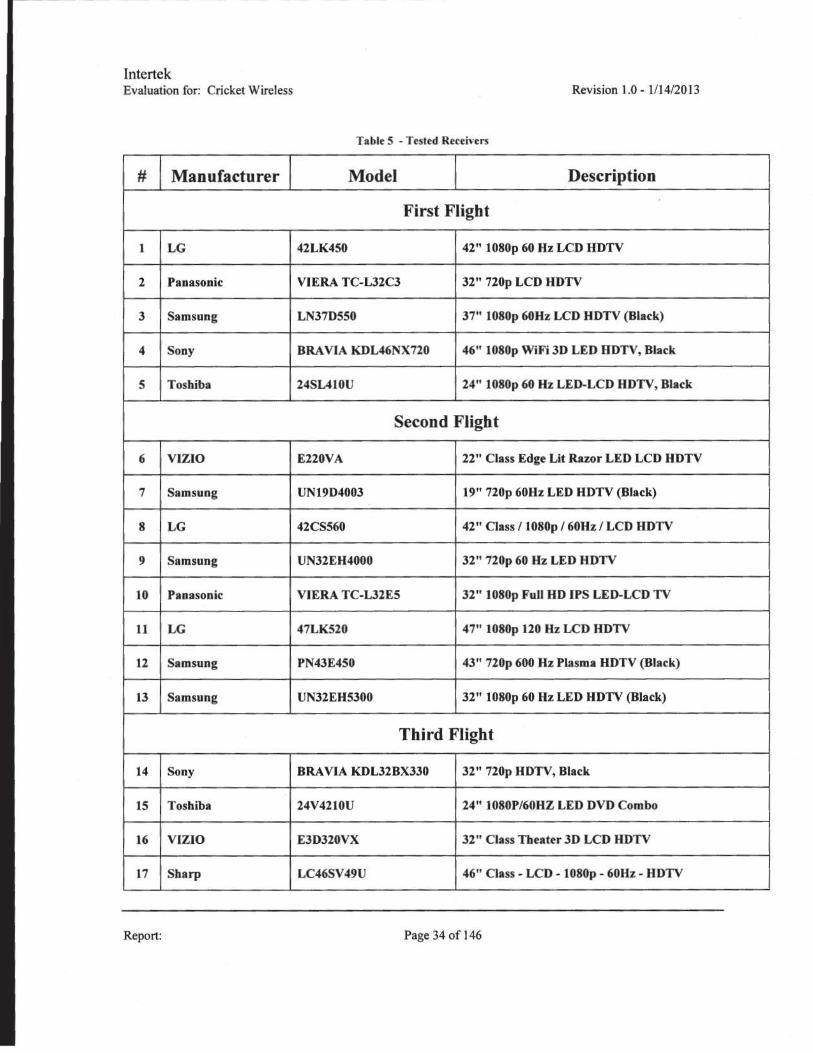
The resulting list represents a selection of the best selling or highest consumer rated models from manufacturers represented in either of these lists. Table 5 below identifies tested DTV receivers.
Report: Page 33 of I 46
Intertek Evaluation for: Cricket Wireless Revision 1.0 - 1/ 14/201 3
Table 5 -Tested Receivers
# Manufacturer Model Description
First Flight
1 LG 42LK450 42" 1080p 60Hz LCD HDTV
2 Panasonic VIERA TC-L32C3 32" 720p LCD HDTV
3 Sam sung LN37DS50 37" 1080p 60Hz LCD HDTV (Black)
4 Sony BRA VIA KDL46NX720 46" 1080p WiFi 3D LED HDTV, Black
5 Toshiba 24SL410U 24" 1080p 60Hz LED-LCD HDTV, Black
Second Flight
6 VlZIO E220VA 22" Class Edge Lit RAzor LED LCD HDTV
7 Sam sung UN19D4003 19" 720p 60Hz LED HDTV (Black)
8 LG 42CS560 42" Class / 1080p / 60Hz I LCD HDTV
9 Sam sung UN32EH4000 32" 720p 60Hz LED HDTV
10 Panasonic VIERA TC-L32ES 32" 1080p Full HD IPS LED-LCD TV
11 LG 47LKS20 47" 1080p 120 Hz LCD HDTV
12 Samsung PN43E450 43" 720p 600Hz Plasma HDTV (Black)
13 Samsung UN32EH5300 32" 1080p 60Hz LED HDTV (Black)
Third Flight
14 Sony BRA VIA KDL32BX330 32" 720p HDTV, Black
15 Toshiba 24V4210U 24" 1080P/60HZ LED DVD Combo
16 VIZIO E3D320VX 32" Class Theater 3D LCD HDTV
17 Sharp LC46SV49U 46" Class - LCD- 1080p- 60Hz - HDTV
Report: Page 34 of 146
Intertek Evaluation for: Cricket Wireless Revision 1.0 - 1/14/20 13
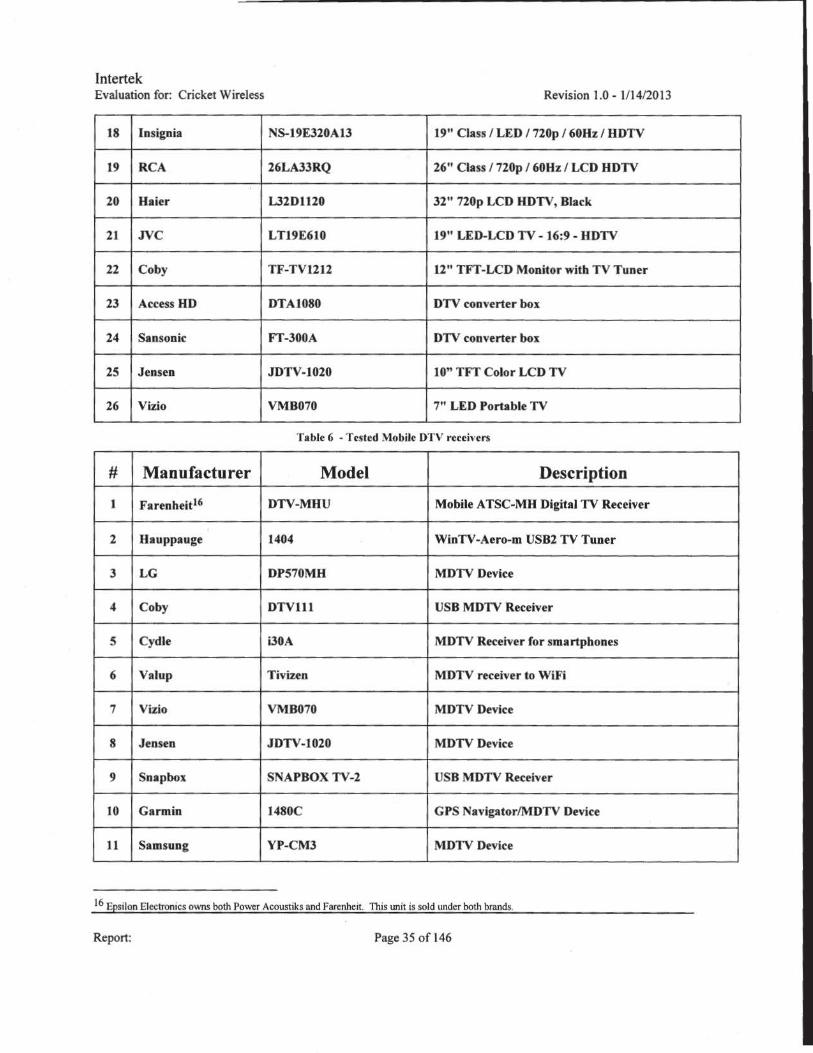
18 Insignia NS-19E320Al3 19" Class I LED / 720p / 60Hz I HDTV
19 RCA 26LA33RQ 26" Oass / 720p / 60Hz I LCD HDTV
20 Baier L32D1120 32" 720p LCD HDTV, Black
21 JVC LT19E610 19" LED-LCD TV -16:9- HDTV
22 Co by TF-TV1212 12" TFf-LCD Monitor with TV Tuner
23 Access HD DTA1080 DTV converter box
24 Sansonic FT-300A DTV converter box
25 Jensen JDTV-1020 10" TFT Color LCD TV
26 Vizio VMB070 7" LED Portable TV
Table 6 - Tested Mobile DTV receivers
# Manufacturer Model Description
I Farenheit16 DTV-MHU Mobile A TSC-MH Digital TV Receiver
2 Hauppauge 1404 WinTV-Aero-m USB2 TV Tuner
3 LG DP570MH MDTV Device
4 Co by DTVlll USB MDTV Receiver
s Cydle i30A MDTV Receiver for smartphones
6 Valup Tivizen MDTV receiver to WiFi
7 Vizio VMB070 MDTV Device
8 Jensen JDTV-1020 MDTVDevice
9 Snap box SNAPBOX TV -2 USB MDTV Receiver
10 Garmin 1480C GPS Navigator/MDTV Device
11 Samsung YP-CM3 MDTV Device
16 Epsilon Electronics owns both Power Acoustiks and Farenheit. This unit is sold under both brands.
Report: Page 35 of 146

Intertek Evaluation for: Cricket Wireless Revision 1.0- 1/14/2013
12 Navigon DVB-T MDTVDevice
13 Mio V730 MDTVDevice
14 MioMoov V500N700 GPS Navigator/MDTV Device
15 RCA DMT3BR Mobile ATSC MIH Car Tuner Receiver
16 BOYO VT-MH TV tuner - external
17 BOYO VT-MHC ATSC and ASTC MJH Tuner Combo
18 Exonic EXDTV ATSC M Hand Digital TV Tuner Combo
19 Soundstream TV-ATSC-MH A TSC M H and Digital TV Tuner Combo
20 Hauppauge TV -PCfV -80e-23058 HD USB TV Tuner, ATSC-M/H Video System
21 Nesa DMH-2 ATSC M/H Digital TV Tuner
22 Performance ICBM-ATSC ATSC MIH Digital TV Tuner Teknique
23 SK Enterprises TVTATSC-M A TSC MIH Digital TV Tuner
24 Leading Advance LX-A8005 A TSC M/H Receiver for Car
25 Kingtronic 7" LCD Handheld Portable DTV
4.6 DTV pre-test characterization
4.6.1 Sensitivity measurement procedure
Detennine the TOS-A (Threshold of Sensitivity with an ascending signal) and TOS-D (Threshold of Sensitivity with a descending signal), using the following procedure:
Report: Page 36 of 146
Intertek Evaluation for: Cricket Wireless Revision 1.0- 1/14/2013
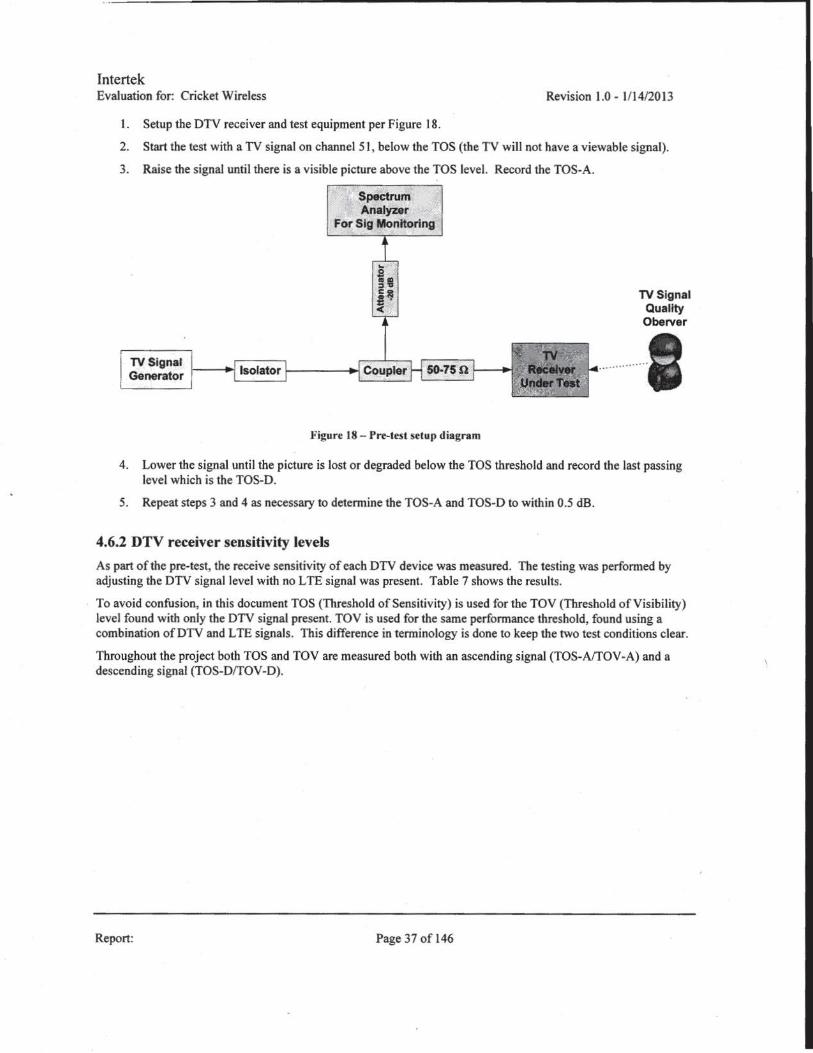
1. Setup the DTV receiver and test equipment per Figure 18.
2. Start the test with a TV signal on channel 5 1, below the TOS (the TV will not have a viewable signal).
3. Raise the signal until there is a visible picture above the TOS level. Record the TOS-A.
"' Sp8ctrum Analyzer
For Sig Monitoring
TV Signal Generator 1--+1 Isolator 1------1~ Coupler
Figure 18 - Pre-test setup diagram
TV Signal Quality
Oberver
4. Lower the signal until the picture is lost or degraded below the TOS threshold and record the last passing level which is the TOS-D.
5. Repeat steps 3 and 4 as necessary to determine the TOS-A and TOS-D to within 0.5 dB.
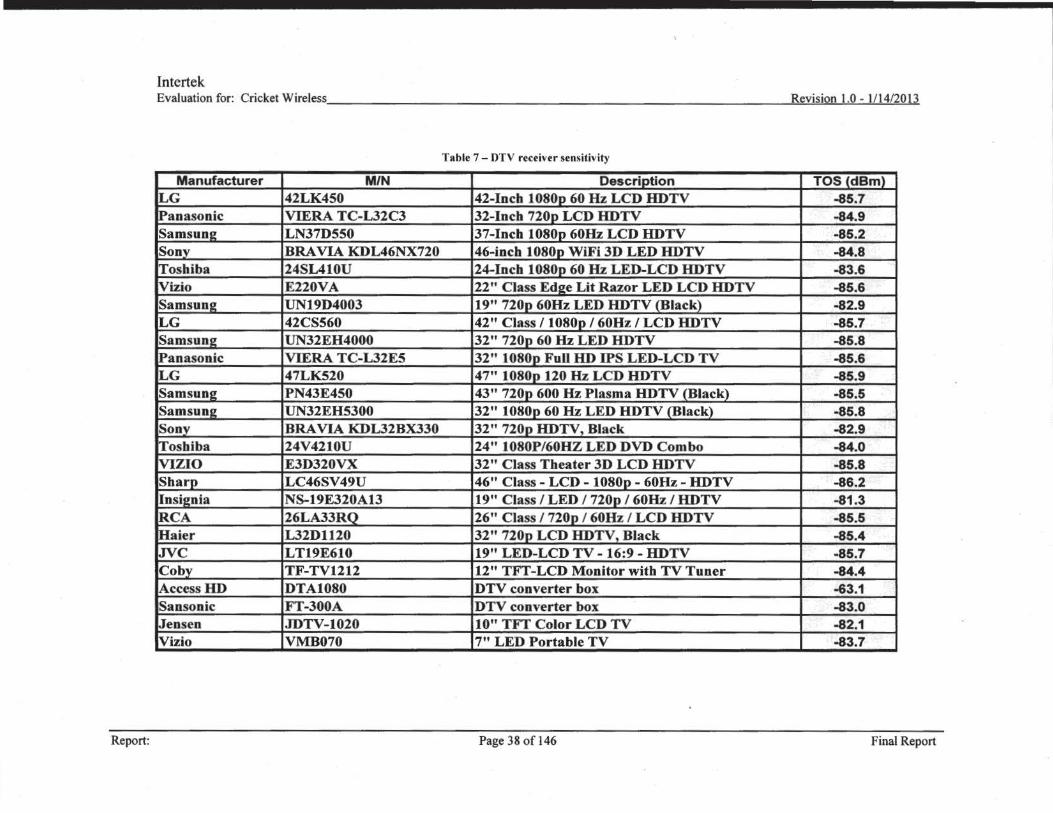
4.6.2 DTV receiver sensitivity levels
As part of the pre-test, the receive sensitivity of each DTV device was measured. The testing was performed by adjusting the DTV signal level with no LTE signal was present. Table 7 shows the results.
To avoid confusion, in this document TOS (Threshold of Sensitivity) is used for the TOY (Threshold of Visibility) level found with only the DTV signal present. TOY is used for the same performance threshold, found using a combination ofDTV and LTE signals. This difference in terminology is done to keep the two test conditions clear.
Throughout the project both TOS and TOV are measured both with an ascending signal (TOS-A/TOV-A) and a descending signal (TOS-D/TOV-D).
Report: Page 37 of 146
Intertek Evaluation for: Cricket Wireless Revision 1.0 - 1/14/2013
Table 7- DTV receiver sensitivity
Manufacturer M/N Description TOS (dBm) LG 42LK450 42-Inch 1080p 60Hz LCD HDTV -85.7 IPanasonic VIERA TC-L32C3 32-Inch 720p LCD HDTV -84.9 Samsune: LN37D550 37-Inch 1080p 60Hz LCD HDTV -85.2 Sony BRA VIA KDL46NX720 46-inch 1 080p WiFi 3D LED HDTV -84.8 Toshiba 24SL410U 24-Inch 1080p 60Hz LED-LCD HDTV -83.6 Vizio E220VA 22" Class Ede;e Lit Razor LED LCD HDTV -85.6 Samsune; UN19D4003 19" 720p 60Hz LED HDTV (Black) -82.9 LG 42CS560 42" Class /1080p /60Hz I LCD HDTV -85.7 Samsung UN32EH4000 32" 720p 60 Hz LED HDTV -85.8 iPanasonic VIERA TC-L32E5 32" 1080p Full HD IPS LED-LCD TV -85.6 LG 47LK520 47" 1080p 120Hz LCD HDTV -85.9 Samsune: PN43E450 43" 720p 600 Hz Plasma HDTV_(Biack) -85.5 Samsune; UN32EH5300 32" 1080p 60Hz LED HDTV (Black_}_ -85.8 Sony BRA VIA KDL32BX330 32" 720p HDTV, Black -82.9 rroshiba 24V4210U 24" 1080PI60HZ LED DVD Combo -84.0 iVIZIO E3D320VX 32" Class Theater 3D LCD HDTV -85.8 Sharp LC46SV49U 46" Class- LCD- 1080p- 60Hz- HDTV -86.2 Insignia NS-19E320A13 19" Class I LED I 720p I 60Hz I HDTV -81.3 [RCA 26LA33RQ 26" Class I 720p I 60Hz I LCD HDTV -85.5 l!!_aier L32D1120 32" 720p LCD HDTV, Black -85.4 ~c LT19E610 19" LED-LCD TV- 16:9- HDTV -85.7 Co by TF-TV1212 12" TFT-LCD Monitor with TV Tuner -84.4 AccessHD DTA1080 DTV converter box -63.1 Sansonic Fr-300A DTV converter box -83.0 ~ens en JDTV-1020 10" TFr Color LCD TV -82.1 Vizio VMB070 7" LED Portable TV -83.7
Report: Page 38 of 146 Final Report
Intertek Evaluation for: Cricket Wireless Revision l.O- 1114/2013
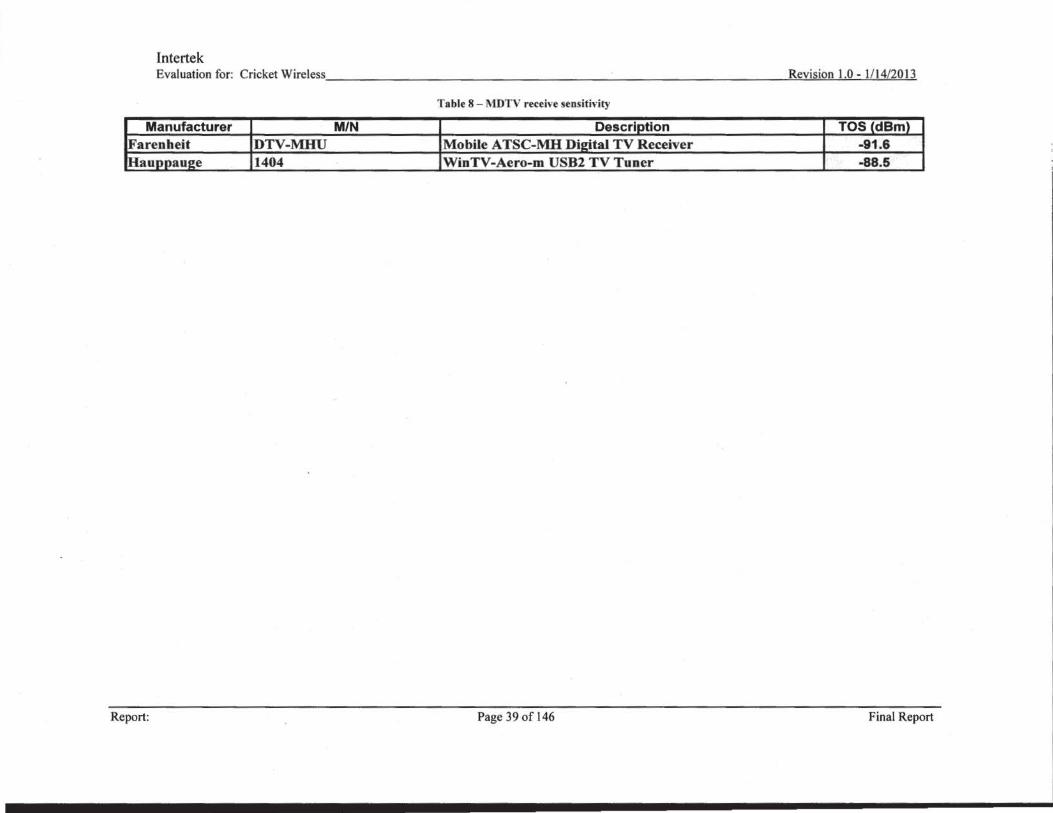
Table 8 - MDTV receive sensitivity
M/N DTV-MHU -91.6 1404 WinTV-Aero-m USB2 TV Tuner -88.5
Report: Page 39 of 146 Final Report
Intertek Evaluation for: Cricket Wireless __________________ ~R.,e::...:v.....,is'""i o><!n.!....:..:l.'-"'O_-~l.!..;/l,_4""'/2=.:0"-'1=3
Section 5 -Conducted testing This section describes the conducted testing and corresponding data analysis for the DTV receivers tested.
5.1 Objective
The objective of this project was to evaluate the DTV receiver performance to a controlled combination ofDTV and L TE signals.
5.2 Test setup
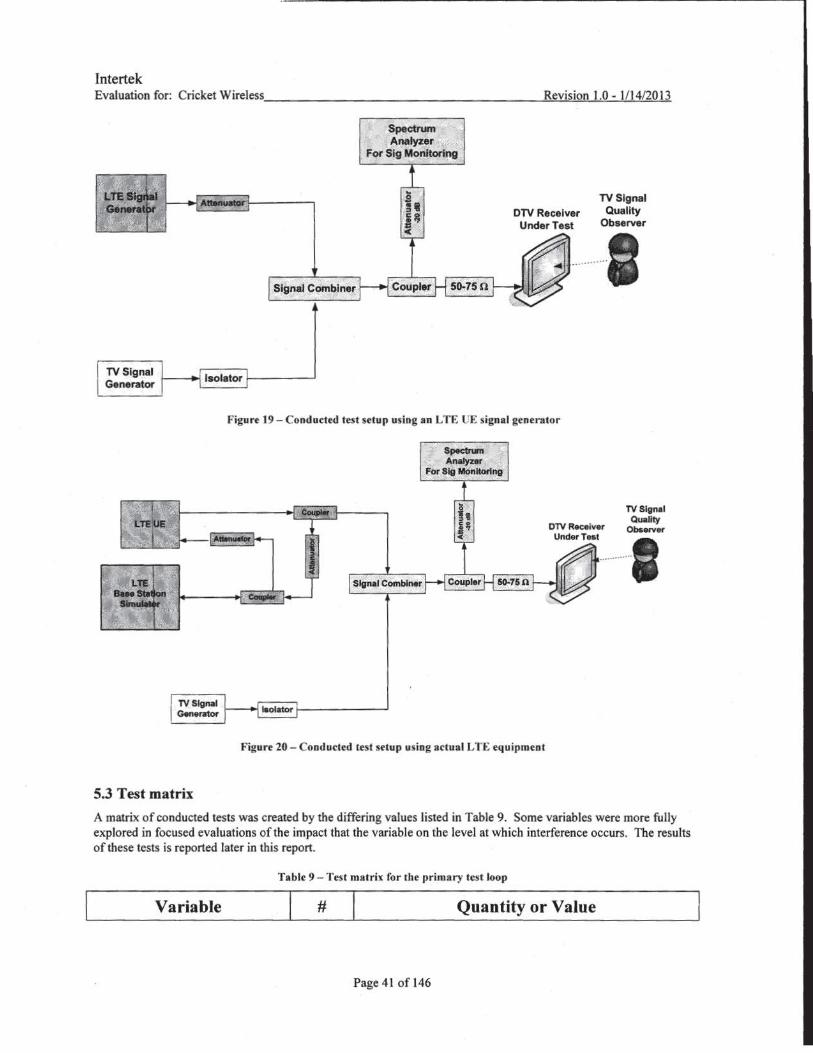
Two types of conducted testing were performed. The first used L TE waveforms, created by an L TE signal generator, see Figure 19. The second used actual L TE equipment, with the UE controlled by a base station simulator, see Figure 20. Each approach has its strengths and were used in the final evaluation of A-block interference to DTV channel 51 reception.
The primary advantage of testing with actual LTE equipment is that it recreates the actual use environment and may introduce variables that the waveform creation process may not include. However, this approach is clearly hindered because it can only use equipment that is currently available. Further, using actual equipment cannot explore the variability that the entire population ofLTE equipment may exhibit.
Testing with generated waveforms has the advantage that it is repeatable. The test waveforms can be generated by other laboratories and test results confirmed by them. Further, testing with generated waveforms does not require a base station simulator and simplifies the test setup, making it possible for more Jabs to replicate these test results, if they wish. Waveforms can also be designed to either accentuate worst case LTE signals, which may occur rarely in actual use, or be varied through a range of parameters, as might be found in a population of L TE devices.
Page 40 of 146
Intertek Evaluation for: Cricket Wireless. __________________ __,Rc.:.:e:..:v~is"""io,.,n"-"""1.""0_-_,l.._/!..-14"'"/2:::0""'1=3
5.3 Test matrix
S!gnal Combiner
Spectrum Ana~er . ,,
For Slg Monito'rtng
TV Signal DTV Receiver Quality
Under Test Observer
Figure 19 - Conducted test setup using an L TE tiE signal generator
. Spec:Crum
·' Analyzer _For 81g MOnitorinG
Signal COmbiner
laolator 1---- - --'
Figure 20 - Conducted test setup using actual L TE equipment
TV Signal QuaUty
DTV Receiver Observer
"""'T"' I
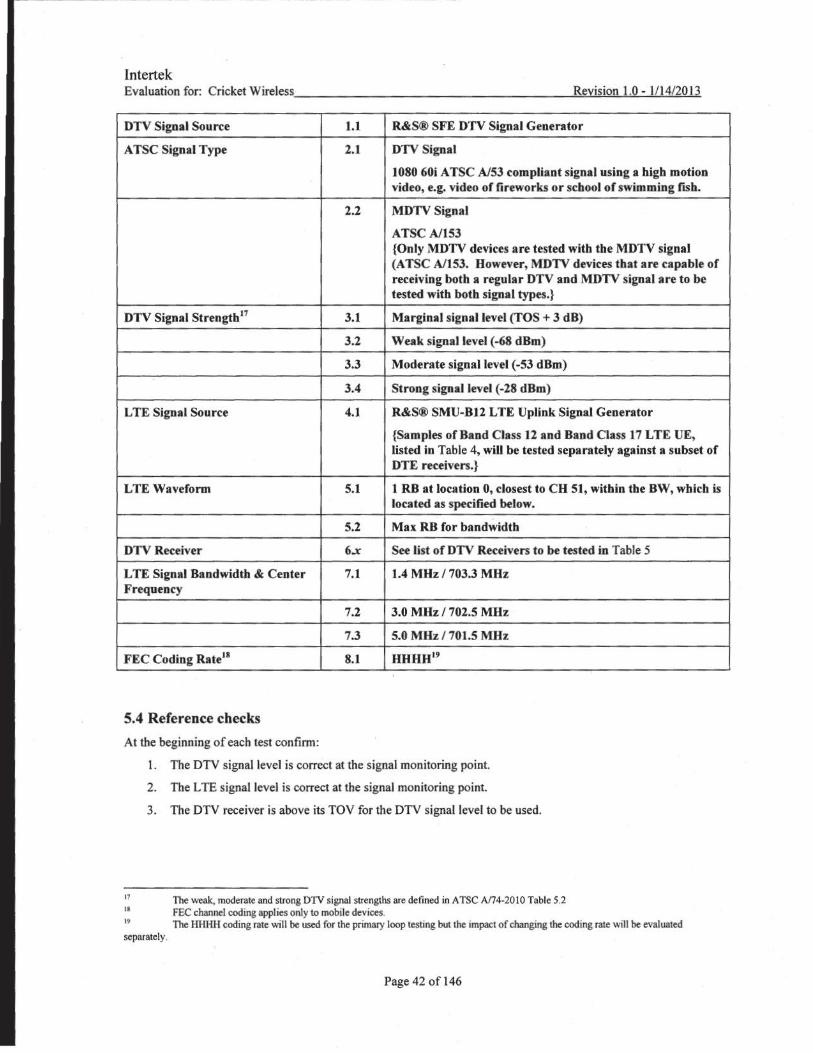
A matrix of conducted tests was created by the differing values listed in Table 9. Some variables were more fully explored in focused evaluations of the impact that the variable on the level at which interference occurs. The results of these tests is reported later in this report.
Table 9 - Test matrix for the primary test loop
Variable # Quantity or Value
Page 41 of 146
Intertek Evaluation for: Cricket Wireless _____ ___ _ ___ _ ___ _ _ ....:R~e'-'v_,is'-"io~n.:.....:..:l."'"0_-....:1"'"'11,_4""'12:.:0<..:1=3
DTV Signal Source 1.1 R&S® SFE DTV Signal Generator
ATSC Signal Type 2.1 DTV Signal
1080 60i ATSC A/53 compliant signal using a high motion video, e.g. video of fireworks or school of swimming fish.
2.2 MDTVSignal
ATSC A/153 {Only MDTV devices are tested with the MDTV signal (ATSC A/153. However, MDTV devices that are capable of receiving both a regular DTV and MDTV signal are to be tested with both signal types.}
DTV Signal Strength" 3.1 Marginal signal level (TOS + 3 dB)
3.2 Weak signal level (-68 dBm)
3.3 Moderate signal level (-53 dBm)
3.4 Strong signal level (-28 dBm)
LTE Signal Source 4.1 R&S® SMU-B12 L TE Uplink Signal Generator
{Samples of Band Class 12 and Band Class 17 LTE UE, listed in Table 4, will be tested separately against a subset of DTE receivers.}
L TE Waveform 5.1 1 RB at location 0, closest to CH 51, within the BW, which is located as specified below.
5.2 Max RB for bandwidth
DTV Receiver 6x See list of DTV Receivers to be tested in Table 5
L TE Signal Bandwidth & Center 7.1 1.4 MHz I 703.3 MHz Frequency
7.2 3.0 MHz I 702.5 MHz
7.3 5.0 MHz I 701.5 MHz
FEC Coding Rate18 8.1 HHHW9
5.4 Reference checks
At the beginning of each test confirm:
I. The DTV signal level is correct at the signal monitoring point.
2. The L TE signal level is correct at the signal monitoring point.
3. The DTV receiver is above its TOV for the DTV signal level to be used.
" The weak, moderate and strong DTV signal strengths are defined in A TSC An4-201 0 Table 5.2 11 FEC channel coding applies only to mobile devices. 19 The HHHH coding rate will be used for the primary loop testing but the impact of changing the coding rate will be evaluated separately.
Page 42 of 146
Intertek Evaluation for: Cricket Wireless ___________________ .:.:R~e~vJ~·s~io~n~l.~O~-...!l'-!../ 1!..:4!:!./.o::.20~13
5.5 Test procedure - Main Test Loop
The following procedure was followed for this test:
1. From matrix created in Section 5.3 and Table 9 select and setup the configuration to be tested and record:
a. DTV Signal Source
b. A TSC Signal Type
c. DTV Signal Strength
d. L TE Signal Source
e. LTE Waveform (settings on the LTE signal generator)
f. DTV receiver to be tested
g. LTE signal bandwidth
h. LTE signal center frequency
2. Perform the reference checks
3. Starting at an LTE signal level below the TO V-A threshold, raise the L TE signal level until the TO V-A is determined. Repeat as necessary to resolve the TOY-A threshold to within 0.5 dB. Record the TOY-A level.
If the LTE signal level reaches 8 dBm without reaching the TOY level end the test and record that result as TOY not reached.20
This testing is performed with the L TE signal generator but a sampling of results will be confirmed with actual L TE UE devices.
4. Reduce the L TE signal level, starting above the TOY -D level until reception is disrupted. Repeat as necessary to resolve the TOV-D threshold to within 0.5 dB. Record the TOV-D level.
5. Calculate and record the DIU ratio for TOY-A and TOY-D.
Note that the values for desired and undesired signal shall be measured in a bandwidth sufficiently wide to capture the full energy of the signal.
5.6 Performance Metrics
The primary metrics recorded are:
I. The DTV signal level and L TE signal level at the TOY -A and TOY -D and the DIU ratio at these thresholds.
2. The TOY-A and TOV-0.
5. 7 DTV Signal Quality
Independent of signal amplitude, signal quality was found to have a significant influence on the results. Error Vector Magnitude (EVM) was used as a measure of signal quality.
"The error vector magnitude or EVM (sometimes also called receive constellation error or RCE) is a measure used to quantify the performance of a digital radio transmitter or receiver. A signal
20 8 dBm is selected be greater than the highest power an LTE UE can possibly couple into a DTV antenna. During the radiated testing it was found that it was difficult to get above 2 dBm ofLTE power into the DTV, even with the LTE UEextremely close to the DTV 'rabbit-ears' or loop antenna.
Page 43 of 146