Internet-Scale Service Infrastructure Efficiency
International Symposium on System Architecture
James Hamilton, 2009/6/23
VP & Distinguished Engineer, Amazon Web Services
w: mvdirona.com/jrh/work
b: perspectives.mvdirona.com

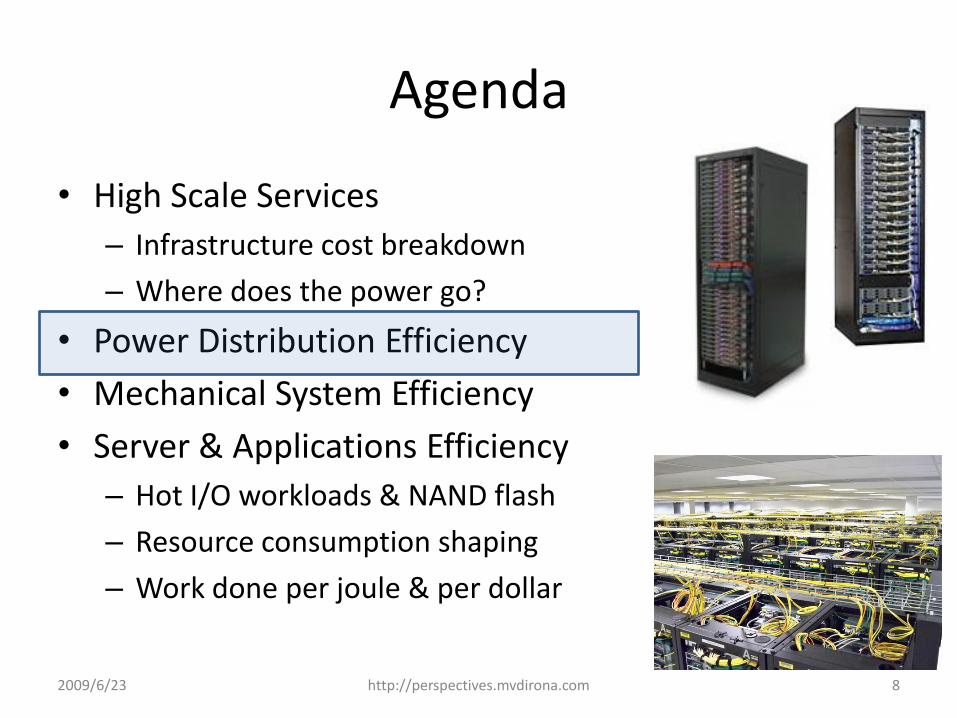
Agenda
• High Scale Services
– Infrastructure cost breakdown
– Where does the power go?
• Power Distribution Efficiency
• Mechanical System Efficiency
• Server & Applications Efficiency
– Hot I/O workloads & NAND flash
– Resource consumption shaping
– Work done per joule & per dollar
22009/6/23 http://perspectives.mvdirona.com
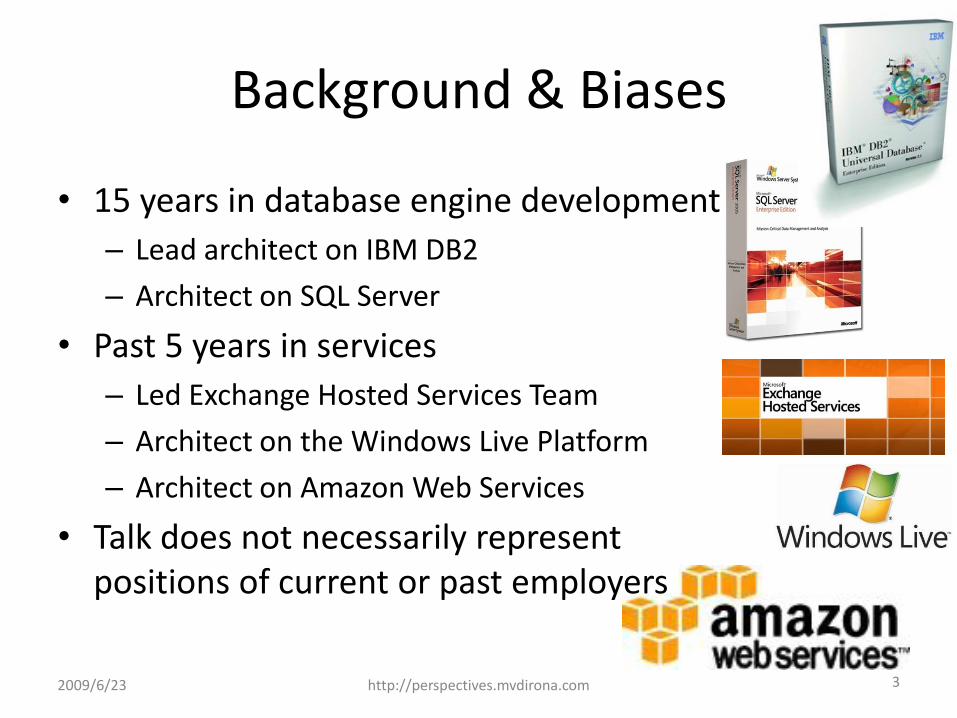
Background & Biases
2009/6/23 3
• 15 years in database engine development
– Lead architect on IBM DB2
– Architect on SQL Server
• Past 5 years in services
– Led Exchange Hosted Services Team
– Architect on the Windows Live Platform
– Architect on Amazon Web Services
• Talk does not necessarily represent positions of current or past employers
http://perspectives.mvdirona.com
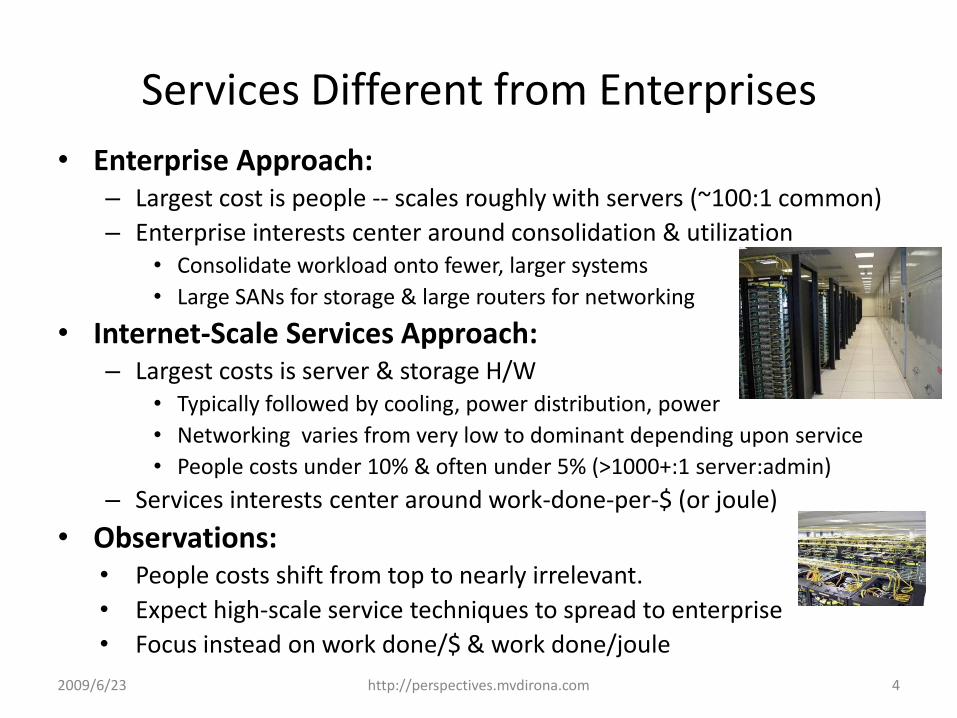
Services Different from Enterprises
• Enterprise Approach:– Largest cost is people -- scales roughly with servers (~100:1 common)
– Enterprise interests center around consolidation & utilization• Consolidate workload onto fewer, larger systems
• Large SANs for storage & large routers for networking
• Internet-Scale Services Approach:– Largest costs is server & storage H/W
• Typically followed by cooling, power distribution, power
• Networking varies from very low to dominant depending upon service
• People costs under 10% & often under 5% (>1000+:1 server:admin)
– Services interests center around work-done-per-$ (or joule)
• Observations:• People costs shift from top to nearly irrelevant.
• Expect high-scale service techniques to spread to enterprise
• Focus instead on work done/$ & work done/joule
42009/6/23 http://perspectives.mvdirona.com
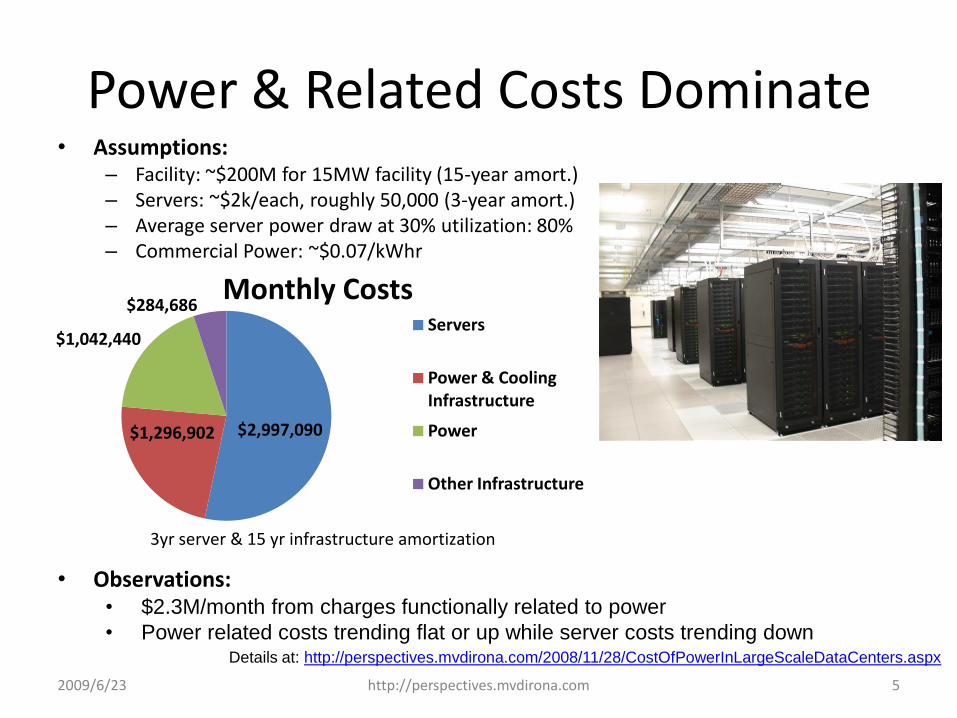
Power & Related Costs Dominate• Assumptions:
– Facility: ~$200M for 15MW facility (15-year amort.)– Servers: ~$2k/each, roughly 50,000 (3-year amort.)– Average server power draw at 30% utilization: 80%– Commercial Power: ~$0.07/kWhr
5http://perspectives.mvdirona.com
• Observations:• $2.3M/month from charges functionally related to power
• Power related costs trending flat or up while server costs trending down
$2,997,090$1,296,902
$1,042,440
$284,686Servers
Power & Cooling Infrastructure
Power
Other Infrastructure
3yr server & 15 yr infrastructure amortization
Details at: http://perspectives.mvdirona.com/2008/11/28/CostOfPowerInLargeScaleDataCenters.aspx
Monthly Costs
2009/6/23

PUE & DCiE• Measure of data center infrastructure efficiency• Power Usage Effectiveness
– PUE = (Total Facility Power)/(IT Equipment Power)
• Data Center Infrastructure Efficiency– DCiE = (IT Equipment Power)/(Total Facility Power) * 100%
• Help evangelize tPUE (power to server components)– http://perspectives.mvdirona.com/2009/06/15/PUEAndTotalPowerUsageEfficiencyTPUE.aspx
2009/6/23 http://perspectives.mvdirona.com 6
http://www.thegreengrid.org/en/Global/Content/white-papers/The-Green-Grid-Data-Center-Power-Efficiency-Metrics-PUE-and-DCiE
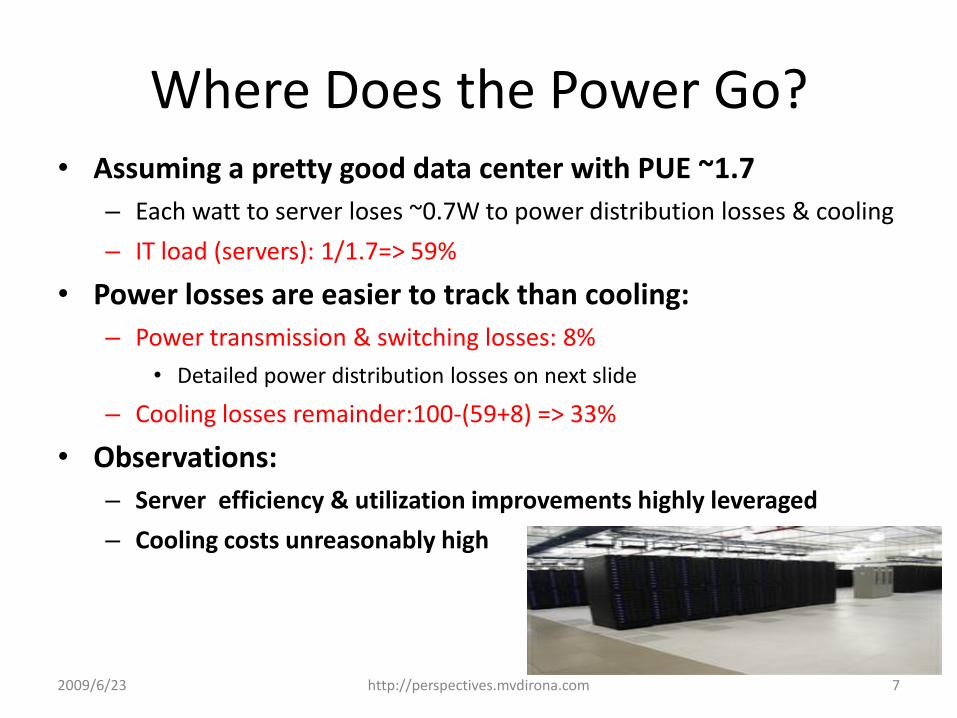
Where Does the Power Go?• Assuming a pretty good data center with PUE ~1.7
– Each watt to server loses ~0.7W to power distribution losses & cooling
– IT load (servers): 1/1.7=> 59%
• Power losses are easier to track than cooling:
– Power transmission & switching losses: 8%
• Detailed power distribution losses on next slide
– Cooling losses remainder:100-(59+8) => 33%
• Observations:
– Server efficiency & utilization improvements highly leveraged
– Cooling costs unreasonably high
72009/6/23 http://perspectives.mvdirona.com
Agenda
• High Scale Services
– Infrastructure cost breakdown
– Where does the power go?
• Power Distribution Efficiency
• Mechanical System Efficiency
• Server & Applications Efficiency
– Hot I/O workloads & NAND flash
– Resource consumption shaping
– Work done per joule & per dollar
82009/6/23 http://perspectives.mvdirona.com
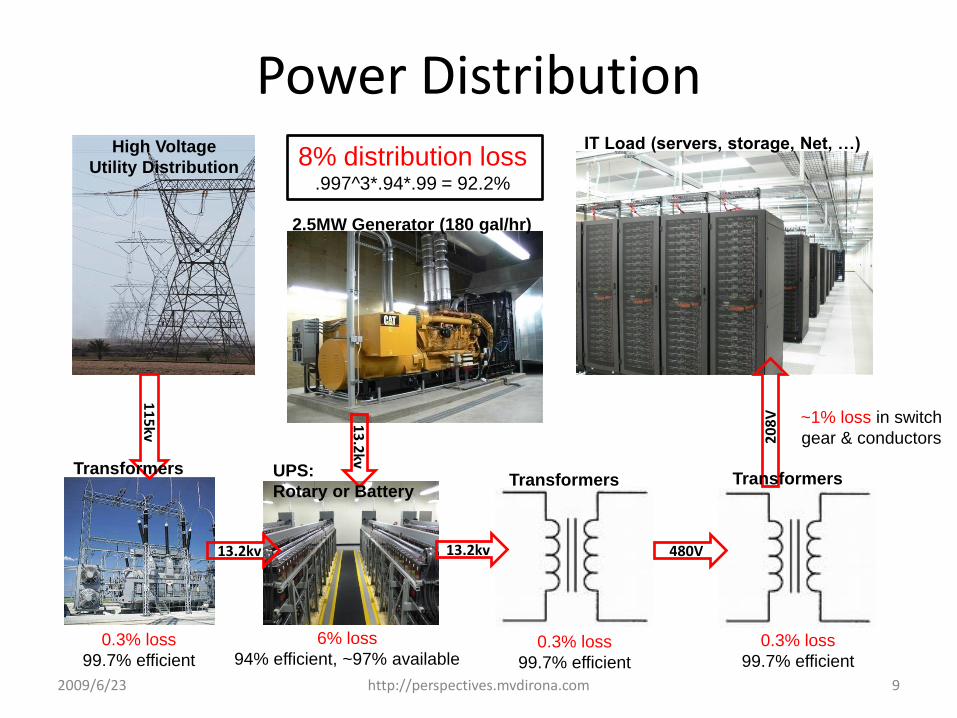
Power Distribution
2009/6/23 http://perspectives.mvdirona.com 9
13.2kv
11
5kv
13
.2kv
13.2kv 480V
20
8V
0.3% loss
99.7% efficient0.3% loss
99.7% efficient
0.3% loss
99.7% efficient
6% loss
94% efficient, ~97% available
~1% loss in switch
gear & conductors
UPS:
Rotary or Battery
TransformersTransformers Transformers
High Voltage
Utility Distribution
IT Load (servers, storage, Net, …)
2.5MW Generator (180 gal/hr)
8% distribution loss.997^3*.94*.99 = 92.2%

Power Distribution Efficiency Summary
• Two additional conversions in server:
1. Power Supply: often <80% at typical load
2. On board step-down (VRM/VRD): <80% common
• ~95% efficient both available & affordable
• Rules to minimize power distribution losses:
1. Oversell power (more theoretic load that power)
2. Avoid conversions (fewer transformer steps & efficient UPS)
3. Increase efficiency of conversions
4. High voltage as close to load as possible
5. Size VRMs & VRDs to load & use efficient parts
6. DC distribution potentially a small win (regulatory issues)
2009/6/23 http://perspectives.mvdirona.com 10
Agenda
• High Scale Services
– Infrastructure cost breakdown
– Where does the power go?
• Power Distribution Efficiency
• Mechanical System Efficiency
• Server & Applications Efficiency
– Hot I/O workloads & NAND flash
– Resource consumption shaping
– Work done per joule & per dollar
112009/6/23 http://perspectives.mvdirona.com
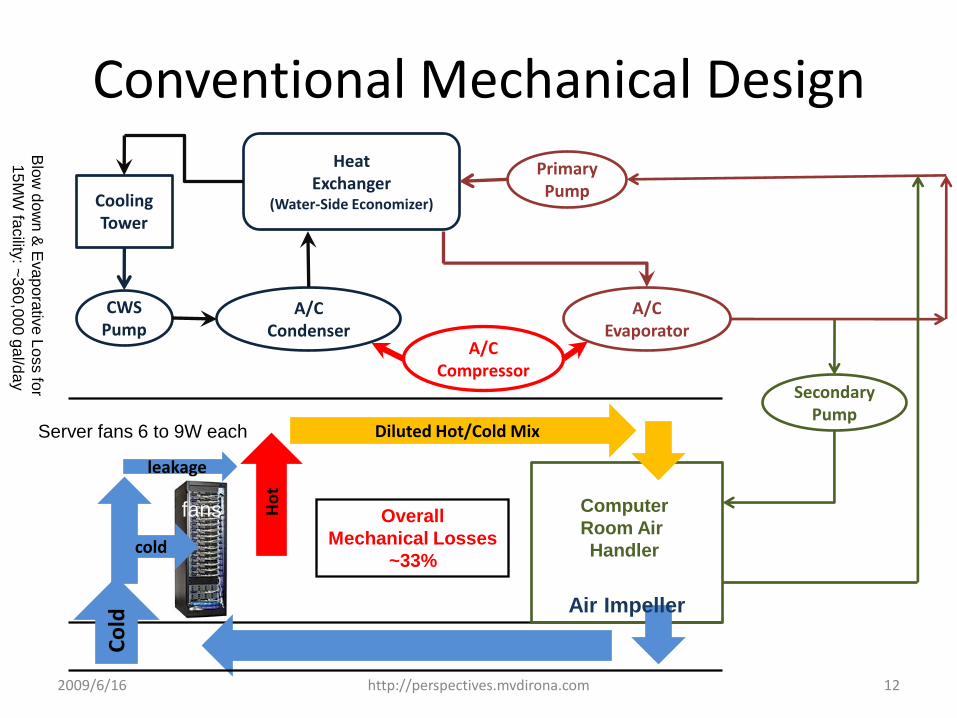
Conventional Mechanical Design
2009/6/16 http://perspectives.mvdirona.com 12
Computer
Room Air
Handler
Cooling Tower
CWSPump
HeatExchanger
(Water-Side Economizer)
A/C Condenser
PrimaryPump
A/C Evaporator
SecondaryPump
leakage
cold
Ho
t
Diluted Hot/Cold Mix
Co
ld
fans
Air Impeller
Server fans 6 to 9W each
Overall
Mechanical Losses
~33%
A/C Compressor
Blo
w d
ow
n &
Eva
po
rativ
e L
oss fo
r
15
MW
facility
: ~3
60
,00
0 g
al/d
ay

ASHRAE 2008 Recommended
2009/6/23 http://perspectives.mvdirona.com 13
ASHRAE 2008 Recommended Class 1
81F
Most data center run in this range

ASHRAE Allowable
2009/6/23 http://perspectives.mvdirona.com 14
ASHRAE 2008 Recommended Class 1
ASHRAE Allowable Class 1 90F
Most data center run in this range
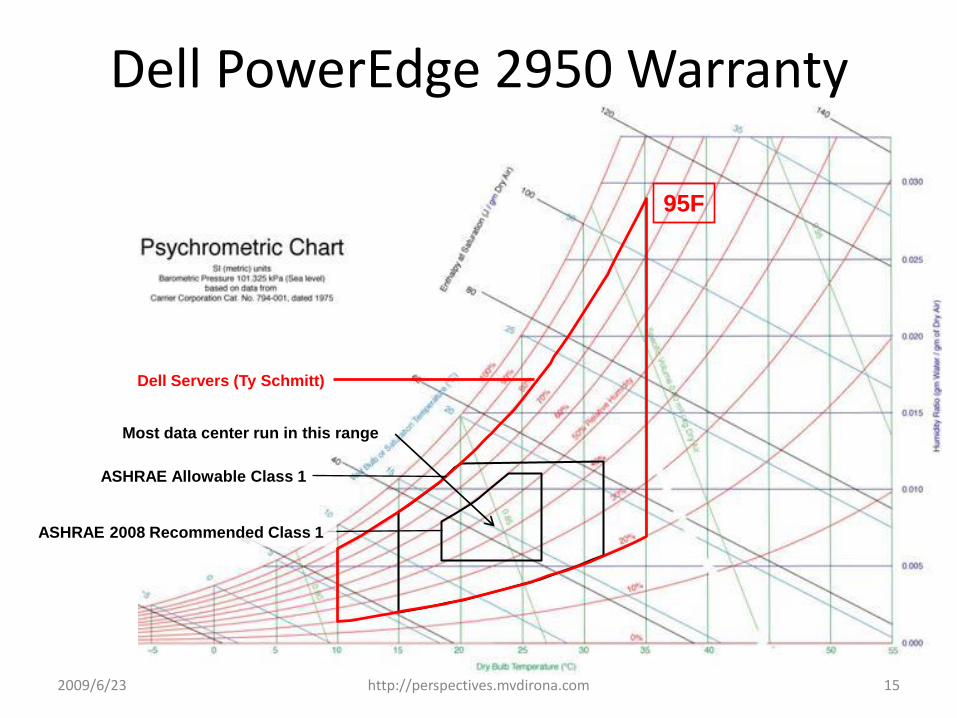
Dell PowerEdge 2950 Warranty
2009/6/23 http://perspectives.mvdirona.com 15
ASHRAE Allowable Class 1
Dell Servers (Ty Schmitt)
95F
ASHRAE 2008 Recommended Class 1
Most data center run in this range
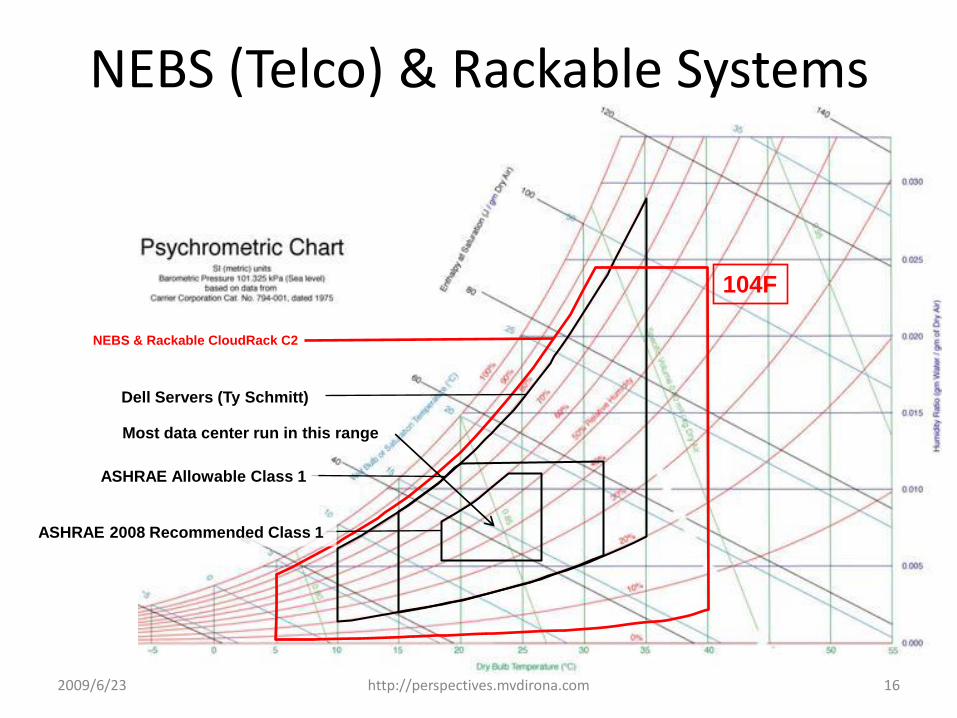
NEBS (Telco) & Rackable Systems
2009/6/23 http://perspectives.mvdirona.com 16
Dell Servers (Ty Schmitt)
NEBS & Rackable CloudRack C2
Most data center run in this range
104F
ASHRAE 2008 Recommended Class 1
ASHRAE Allowable Class 1
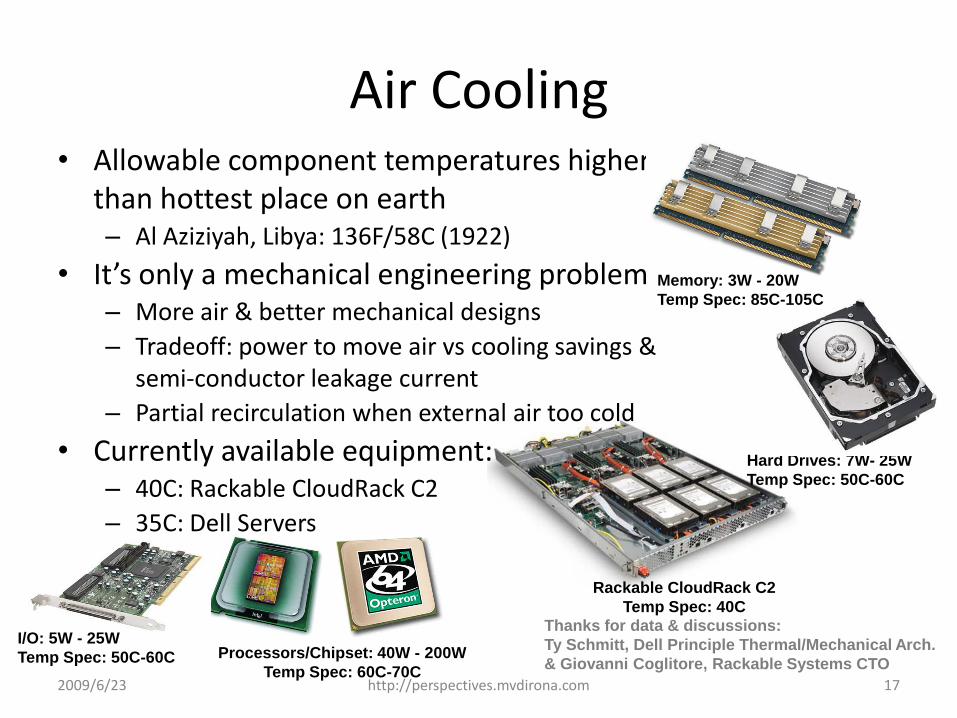
Hard Drives: 7W- 25W
Temp Spec: 50C-60C
Processors/Chipset: 40W - 200W
Temp Spec: 60C-70C
I/O: 5W - 25W
Temp Spec: 50C-60C
Rackable CloudRack C2
Temp Spec: 40C
Air Cooling• Allowable component temperatures higher
than hottest place on earth– Al Aziziyah, Libya: 136F/58C (1922)
• It’s only a mechanical engineering problem– More air & better mechanical designs
– Tradeoff: power to move air vs cooling savings & semi-conductor leakage current
– Partial recirculation when external air too cold
• Currently available equipment:– 40C: Rackable CloudRack C2
– 35C: Dell Servers
2009/6/23 http://perspectives.mvdirona.com 17
Memory: 3W - 20W
Temp Spec: 85C-105C
Thanks for data & discussions:
Ty Schmitt, Dell Principle Thermal/Mechanical Arch.
& Giovanni Coglitore, Rackable Systems CTO
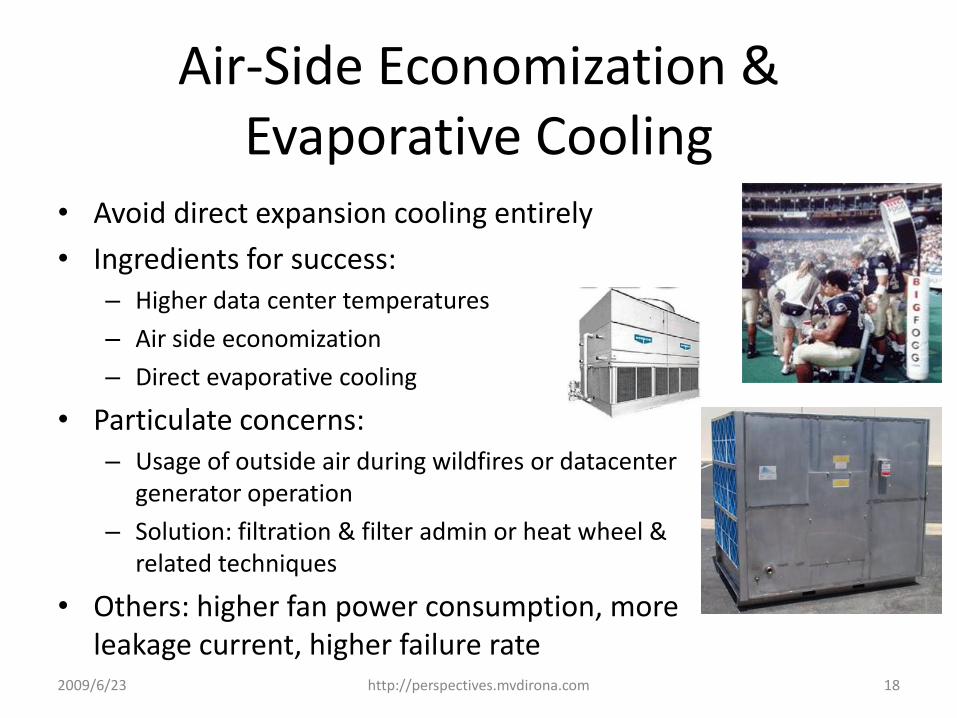
Air-Side Economization & Evaporative Cooling
• Avoid direct expansion cooling entirely
• Ingredients for success:– Higher data center temperatures
– Air side economization
– Direct evaporative cooling
• Particulate concerns:– Usage of outside air during wildfires or datacenter
generator operation
– Solution: filtration & filter admin or heat wheel & related techniques
• Others: higher fan power consumption, more leakage current, higher failure rate
2009/6/23 http://perspectives.mvdirona.com 18

Mechanical Efficiency Summary
• Mechanical System Optimizations:
1. Tight airflow control, short paths & large impellers
2. Raise data center temperatures
3. Cooling towers rather than A/C
4. Air side economization & evaporative cooling
• outside air rather than A/C & towers
2009/6/23 http://perspectives.mvdirona.com 19
Agenda
• High Scale Services
– Infrastructure cost breakdown
– Where does the power go?
• Power Distribution Efficiency
• Mechanical System Efficiency
• Server & Applications Efficiency
– Hot I/O workloads & NAND flash
– Resource consumption shaping
– Work done per joule & per dollar
202009/6/23 http://perspectives.mvdirona.com

0
20
40
60
80
100
120
1983 1990 1994 1998 2003 2007
Sequential BW (MB/s)
Random BW (MB/s)
Disk Random BW vs Sequential BW
• Disk sequential BW lagging DRAM and CPU• Disk random access BW growth ~10% of sequential• Conclusion: Storage Chasm widening requiring larger
memories & more disks
Source: Dave Patterson with
James Hamilton updates
212009/6/23 http://perspectives.mvdirona.com

Memory to Disk Chasm• Disk I/O rates grow slowly while CPU data consumption
grows near Moore pace– Random read 1TB disk: 15 to 150 days*
• Sequentialize workloads– Essentially the storage version of cache conscious algorithms
• e.g. map/reduce
– Disks arrays can produce acceptable aggregate sequential bandwidth
• Redundant data: materialized views & indexes– Asynchronous maintenance
– Delta or stacked indexes (from IR world)
• Distributed memory cache (remote memory “closer” than disk)
• I/O Cooling: Blend hot & cold data (using HDD)
• I/O concentration: partition hot & cold (SSD & HDD mix)
2009/6/23 22
* Tape is Dead, Disk is Tape, Flash is Disk, Ram Locality is King (Jim Gray)
http://perspectives.mvdirona.com

Case Study: TPC-C with SSD
• 98 HDD total– 90 data disks (primarily random access)– 8 log & O/S disks (primarily sequential access)
• Compute HDD/SSD cross-over using fictitious SSD– 128GB SSD @ 7k IOPS
• 90 HDD to store 2,464GB (short stroked)– 106GB static & 2,357GB dynamic (60 day rule)– 90 disk HDD budget: $26,910 (disks $299 each)– Requires 20 SSDs to support @ up to $1,346 each
• Static content only (drop 60 day rule)– Conservatively estimate 45k IOPS
• Used 90 short stroked disks at 500 IOPS each
– Requires 7 SSDs at up to $3,844 (easy)
• Very hot I/O workloads a win on SSD
23
O/S & Log
Data
http://www.tpc.org/results/FDR/TPCC/Dell_2900_061608_fdr.pdf
2009/6/23 http://perspectives.mvdirona.com

Summary
• CPU optimizations are always welcome but the biggest design & optimization problems today are at the datacenter level
• In work at all levels, focus on:
– Work done per dollar
– Work done per joule
• Single dimensional performance measurements are not interesting at scale unless balanced against cost
2009/6/23 http://perspectives.mvdirona.com 24

• This Slide Deck:– I will post these slides to http://mvdirona.com/jrh/work later this week
• Power and Total Power Usage Effectiveness (tPUE)• http://perspectives.mvdirona.com/2009/06/15/PUEAndTotalPowerUsageEfficiencyTPUE.aspx
• Berkeley Above the Clouds• http://perspectives.mvdirona.com/2009/02/13/BerkeleyAboveTheClouds.aspx
• Degraded Operations Mode– http://perspectives.mvdirona.com/2008/08/31/DegradedOperationsMode.aspx
• Cost of Power– http://perspectives.mvdirona.com/2008/11/28/CostOfPowerInLargeScaleDataCenters.aspx– http://perspectives.mvdirona.com/2008/12/06/AnnualFullyBurdenedCostOfPower.aspx
• Power Optimization:– http://labs.google.com/papers/power_provisioning.pdf
• Cooperative, Expendable, Microslice Servers– http://perspectives.mvdirona.com/2009/01/15/TheCaseForLowCostLowPowerServers.aspx
• Power Proportionality– http://www.barroso.org/publications/ieee_computer07.pdf
• Resource Consumption Shaping:– http://perspectives.mvdirona.com/2008/12/17/ResourceConsumptionShaping.aspx
• Email– [email protected]
More Information
2009/6/23 2525http://perspectives.mvdirona.com