Information | Analytics | Expertise
© 2014 IHS / ALL RIGHTS RESERVED
INTERNATIONAL LPG MARKETS AND LPG PRICING OUTLOOKGLP Forum MexicoHacienda GalindoQueretaro, Mexico
OCTOBER 2, 2014
Walter M. Hart, Ph.D, P.E., Senior Director+1 832 209 [email protected]

GLOBAL LPG MARKETS & PRICING - OCTOBER 2 2014
© 2014 IHS 2
Agenda
World Supply
World Demand
World Trade
Prices

© 2014 IHS
GLOBAL LPG MARKETS & PRICING - OCTOBER 2 2014
3
Global LPG production is growing most rapidly in the US, the Middle East and in Asia
2000
2003
2006
2009
2012
2015
2018
0
50000
100000
150000
200000
250000
300000
350000
0.0
1,624,383.0
3,248,766.0
4,873,149.0
6,497,532.0
8,121,915.0
9,746,298.0
11,370,681.0
Global LPG Production by Region
Europe/CISLatin AmericaAfricaAsia/PacificMiddle EastNorth AmericaM
illi
on
Bar
rels
Per
Day

© 2014 IHS 4
LPG production from the Middle East has some uncertainty
2000
2002
2004
2006
2008
2010
2012
2014
2016
2018
2020
0
10000
20000
30000
40000
50000
60000
70000
0.0
324,876.0
649,752.0
974,628.0
1,299,504.0
1,624,380.0
1,949,256.0
2,274,132.0
Middle East LPG Production by Country
OtherIraqIranUAEQatarSaudi ArabiaM
illi
on
Bar
rels
Per
Day
GLOBAL LPG MARKETS & PRICING - OCTOBER 2 2014

© 2014 IHS 5
Asia LPG production will be driven by refinery additions in China
2000
2003
2006
2009
2012
2015
2018
0
10000
20000
30000
40000
50000
60000
70000
0.0
324,876.0
649,752.0
974,628.0
1,299,504.0
1,624,380.0
1,949,256.0
2,274,132.0
Asia LPG Production
Indian SubcontinentSoutheast AsiaNortheast Asia
Mil
lio
n B
arre
ls P
er D
ay
GLOBAL LPG MARKETS & PRICING - OCTOBER 2 2014

© 2014 IHS 6
The US / Canada LPG production increase is driven by shale-sourced gas processing
2000
2002
2004
2006
2008
2010
2012
2014
2016
2018
2020
0
10000
20000
30000
40000
50000
60000
70000
80000
90000
100000
-0.2
0.3
0.8
1.3
1.8
2.3
2.8
3.3
US/Canada LPG Production
SecAxisGas ProcessingRefining/ Upgrading
Mil
lio
n B
arre
ls p
er D
ay
GLOBAL LPG MARKETS & PRICING - OCTOBER 2 2014

© 2014 IHS 7
Latin America has some promising developments to increase LPG production
2000
2002
2004
2006
2008
2010
2012
2014
2016
2018
2020
0
5000
10000
15000
20000
25000
30000
0.0
324,876.0
649,752.0
974,628.0
Latin America LPG Production by Country
OtherVenezuelaPeruMexicoBrazilArgentina
Mil
lio
n B
arre
ls P
er D
ay
GLOBAL LPG MARKETS & PRICING - OCTOBER 2 2014

© 2014 IHS 8
Agenda
World Supply
World Demand
World Trade
Prices
GLOBAL LPG MARKETS & PRICING - OCTOBER 2 2014

© 2014 IHS 9
Global LPG demand growth will continue to be driven by Asia and the Middle East
0
50000
100000
150000
200000
250000
300000
350000
0.0
1,624,383.0
3,248,766.0
4,873,149.0
6,497,532.0
8,121,915.0
9,746,298.0
11,370,681.0
Global LPG Demand by Region
Europe/CIS
North America
Latin America
Africa
Middle East
Asia/Pacific
Mill
ion
Bar
rels
Pe
r D
ay
Asia/Pacific
Middle East
Africa
Latin America
North America
Europe/CIS
World
0.0% 5.0% 10.0%
LPG Demand Growth (CAGR)
2010-20202000-2010
GLOBAL LPG MARKETS & PRICING - OCTOBER 2 2014
© 2014 IHS 10
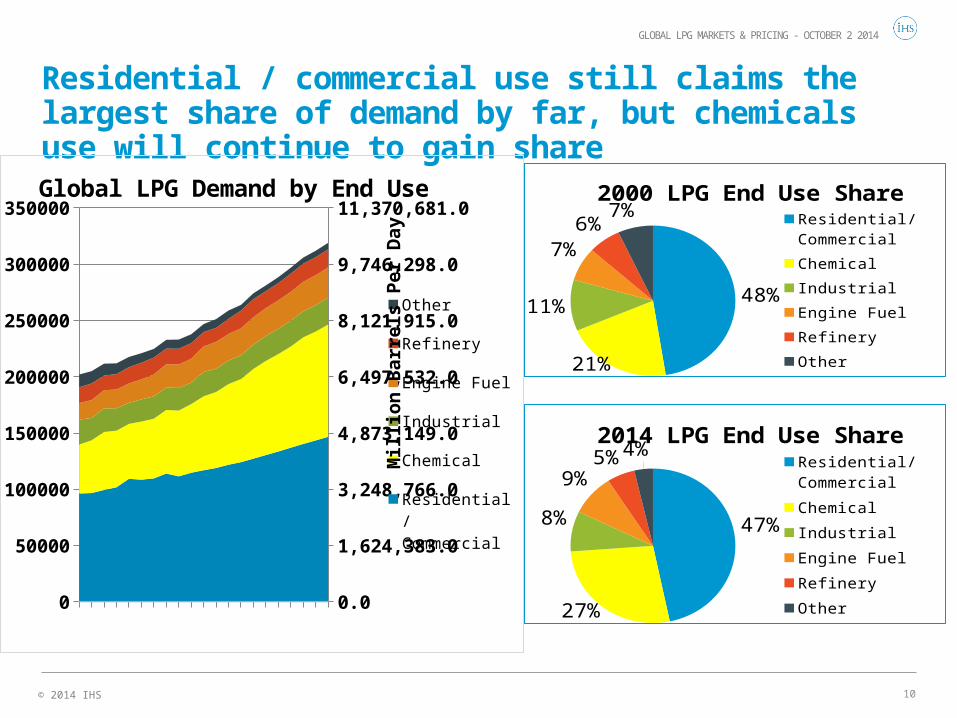
Residential / commercial use still claims the largest share of demand by far, but chemicals use will continue to gain share
0
50000
100000
150000
200000
250000
300000
350000
0.0
1,624,383.0
3,248,766.0
4,873,149.0
6,497,532.0
8,121,915.0
9,746,298.0
11,370,681.0Global LPG Demand by End Use
Other
Refinery
Engine Fuel
Industrial
Chemical
Residential/ Commercial
Mill
ion
Ba
rre
ls P
er
Da
y
47%
27%
8%
9%5% 4%2014 LPG End Use Share
Residential/ Commercial
Chemical
Industrial
Engine Fuel
Refinery
Other
48%
21%
11%
7%6%
7%2000 LPG End Use Share
Residential/ Commercial
Chemical
Industrial
Engine Fuel
Refinery
Other
GLOBAL LPG MARKETS & PRICING - OCTOBER 2 2014
© 2014 IHS 11
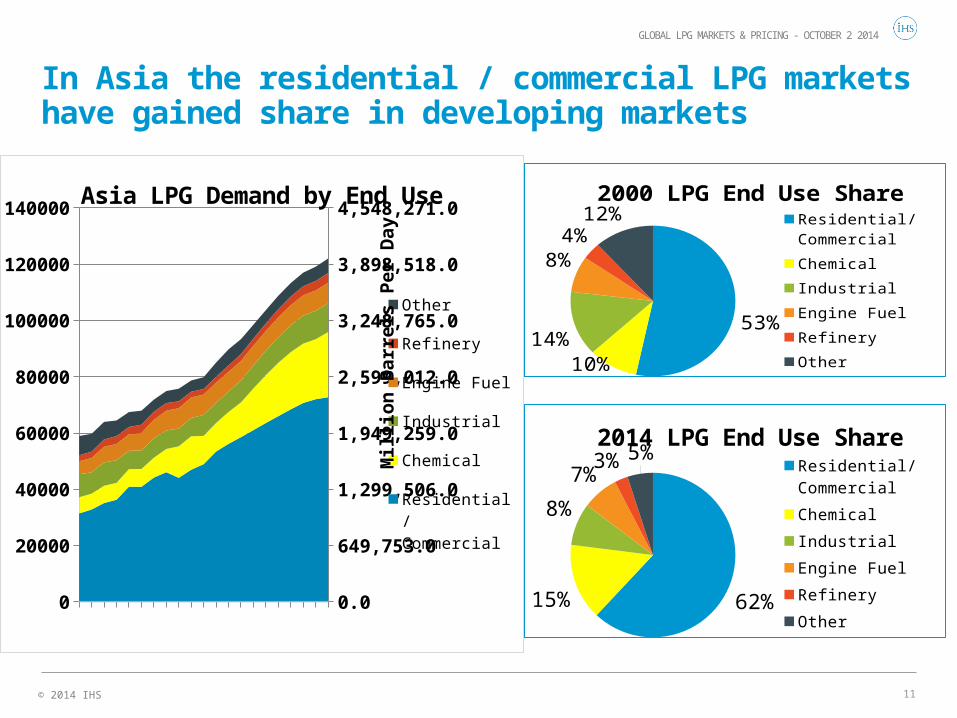
In Asia the residential / commercial LPG markets have gained share in developing markets
0
20000
40000
60000
80000
100000
120000
140000
0.0
649,753.0
1,299,506.0
1,949,259.0
2,599,012.0
3,248,765.0
3,898,518.0
4,548,271.0Asia LPG Demand by End Use
Other
Refinery
Engine Fuel
Industrial
Chemical
Residential/ Commercial
Mill
ion
Ba
rre
ls P
er
Da
y
62%15%
8%
7%3% 5%2014 LPG End Use Share
Residential/ Commercial
Chemical
Industrial
Engine Fuel
Refinery
Other
53%
10%
14%
8%4%
12%2000 LPG End Use Share
Residential/ Commercial
Chemical
Industrial
Engine Fuel
Refinery
Other
GLOBAL LPG MARKETS & PRICING - OCTOBER 2 2014

© 2014 IHS 12
In the Middle East the impressive growth in residential / commercial LPG markets is eclipsed by dramatic petrochemical feedstocks market growth
0
10000
20000
30000
40000
0.0
324,876.0
649,752.0
974,628.0
1,299,504.0
Middle East LPG Demand by End Use
Refinery/ Indus-trial
Engine Fuel
Chemical
Residential/ Commercial
Mill
ion
Ba
rre
ls P
er
Da
y57%
38%
3% 3%2000 LPG End Use Share
Residential/ Commercial
Chemical
Engine Fuel
Refinery/ Industrial
35%
63%
1% 1%2014 LPG End Use Share
Residential/ Commercial
Chemical
Engine Fuel
Refinery/ Industrial
GLOBAL LPG MARKETS & PRICING - OCTOBER 2 2014

© 2014 IHS 13
Residential / Commercial LPG demand is declining in the US/ Canada - LPG demand growth will be driven by USGC PDH units
0
10000
20000
30000
40000
50000
60000
70000
80000
0.0
500,000.0
1,000,000.0
1,500,000.0
2,000,000.0
2,500,000.0
North America LPG Demand by End Use
Other
Refinery
Chemical
Residential/ Commercial
Mill
ion
Ba
rre
ls P
er
Da
y 26%
40%
14%
20%
2000 LPG End Use Share
Residential/ Commercial
Chemical
Refinery
Other
21%
44%
18%
17%
2014 LPG End Use Share
Residential/ Commercial
Chemical
Refinery
Other
GLOBAL LPG MARKETS & PRICING - OCTOBER 2 2014

© 2014 IHS 14
US domestic propane demand is not increasing except for the PDH units, so surplus propane must be exported
2000 2001 2002 2003 2004 2005 2006 2007 2008 2009 2010 2011 2012 2013 2014 2015 2016 2017 2018 2019 20200
200
400
600
800
1,000
1,200
1,400
1,600
1,800
2,000
2,200
US Propane demand
Res/Com Base Chemical-Ethylene Price Sensitive Chemical
Chemical-Ref. Propylene Chemical-PDH Industrial
Farm Other Exports
Th
ou
san
d
bar
rels
per
day
GLOBAL LPG MARKETS & PRICING - OCTOBER 2 2014

© 2014 IHS 15
Increased gas-sourced isobutane production will reduce the demand for isomerization; increased exports will be needed
2000
2001
2002
2003
2004
2005
2006
2007
2008
2009
2010
2011
2012
2013
2014
2015
2016
2017
2018
2019
2020
0
100
200
300
400
500
600US isobutane demand
Refining Chemicals Other Exports
Th
ou
sa
nd
ba
rre
ls p
er
da
y2000
2001
2002
2003
2004
2005
2006
2007
2008
2009
2010
2011
2012
2013
2014
2015
2016
2017
2018
2019
2020
0
100
200
300
400
500
600US normal butane demand
Refining IsomerizationChemical-Base Demand Price Sensitive ChemicalIndustrial OtherExports
Th
ou
sa
nd
ba
rre
ls p
er
da
yGLOBAL LPG MARKETS & PRICING - OCTOBER 2 2014

© 2014 IHS 16
The Latin America LPG demand growth rate is limited because the dominant end use is residential / commercial
2000
2002
2004
2006
2008
2010
2012
2014
2016
2018
2020
0
5000
10000
15000
20000
25000
30000
35000
40000
0.0
200,000.0
400,000.0
600,000.0
800,000.0
1,000,000.0
1,200,000.0
Latin America LPG Demand by Country
OtherVenezuelaPeruMexicoBrazilArgentinaM
illi
on
Bar
rels
Per
Day
GLOBAL LPG MARKETS & PRICING - OCTOBER 2 2014
© 2014 IHS 17
Agenda
World Supply
World Demand
World Trade
Prices
GLOBAL LPG MARKETS & PRICING - OCTOBER 2 2014

© 2014 IHS 18
The United States now rivals the world’s largest LPG exporters
2005 2009 2011 2013 2014 Ann.
0
20,000,000
40,000,000
60,000,000
80,000,000
0.0
500,000.0
1,000,000.0
1,500,000.0
2,000,000.0
2,500,000.0
Selected Waterborne LPG Exports
Second AxisAustraliaNigeriaKuwaitAlgeriaNorth SeaUnited StatesQatarUAESaudi Arabia
Source: IHS Energy - Waterborne
GLOBAL LPG MARKETS & PRICING - OCTOBER 2 2014

© 2014 IHS 19
The US will be the world’s largest LPG exporter
0
10000
20000
30000
40000
50000
60000
70000
80000
0.0
200,000.0
400,000.0
600,000.0
800,000.0
1,000,000.0
1,200,000.0
1,400,000.0
1,600,000.0
1,800,000.0
Total LPG Exports by Selected Major Exporters
NigeriaAlgeriaNorth SeaUnited StatesQatarUAESaudi Arabia
Mil
lio
n B
arre
ls P
er D
ay
GLOBAL LPG MARKETS & PRICING - OCTOBER 2 2014

© 2014 IHS 20
Most US LPG exports are going to Latin America, but the market is limited…
0.0
5000000.0
10000000.0
15000000.0
0
0.1
0.2
0.3
0.4
0.5
Destination of US LPG Exports
scndaxisOtherAsiaEuropeLatin AmericaM
illi
on
Bar
rels
per
Day
GLOBAL LPG MARKETS & PRICING - OCTOBER 2 2014
Source: IHS Energy - Waterborne

© 2014 IHS 21
Asia will have import growth in all sub-regions
2000
2002
2004
2006
2008
2010
2012
2014
2016
2018
2020
-10000
0
10000
20000
30000
40000
50000
60000
-324,876.0
0.0
324,876.0
649,752.0
974,628.0
1,299,504.0
1,624,380.0
1,949,256.0Asia Net LPG Imports by Subregion
Indian SubcontinentNortheast AsiaSoutheast Asia
Mil
lio
n B
arre
ls P
er D
ay
GLOBAL LPG MARKETS & PRICING - OCTOBER 2 2014

© 2014 IHS 22
Agenda
World Supply
World Demand
World Trade
Prices
GLOBAL LPG MARKETS & PRICING - OCTOBER 2 2014

© 2014 IHS
A glut of US ethane has ethane prices following natural gas, but the other US NGLs are still tracking refined products
0
5
10
15
20
25
30Henry Hub Natural Gas
Ethane
Propane
Normal Butane
Natural Gasoline
N o m i n a l d o l l a r s p e r M M B t u
USGC (Mont Belvieu) NGL natural gas prices
© 2014 IHSSource: IHS
23
GLOBAL LPG MARKETS & PRICING - OCTOBER 2 2014

© 2014 IHS 24
Since about 2012, the last significant increment of US LPG exports has been moving to Asia
0.0
5000000.0
10000000.0
15000000.0
0
0.1
0.2
0.3
0.4
0.5
Destination of US LPG Exports
scndaxisOtherAsiaEuropeLatin AmericaM
illi
on
Bar
rels
per
Day
GLOBAL LPG MARKETS & PRICING - OCTOBER 2 2014
Source: IHS Energy - Waterborne

© 2014 IHS
WORLD LPG MARKET OVERVIEW/ MARCH 2014
25
LPG competes with refined products in the Asian markets
1995 2000 2005 2010 2015 2020 20250
2
4
6
8
10
12
14
0.0
0.2
0.4
0.6
0.8
1.0
1.2
1.4
Propane to Dubai Crude OilPropane to Naphtha Ratio in Japan
$/t
on
pro
pa
ne
pe
r $
/Bb
l c
rud
e o
il
$/t
on
pro
pa
ne
pe
r $
/to
n o
f n
ap
hth
a
Weakening trend pre-recession
Volatile but flatter post-recession
Forecast

© 2014 IHS
The arbitrage between Asia and the United States must remain large enough to clear the US LPG markets
Jan-
05
Jan-
06
Jan-
07
Jan-
08
Jan-
09
Jan-
10
Jan-
11
Jan-
12
Jan-
13
Jan-
14
Jan-
15
0
100
200
300
400
500
600
700
800
900
1,000
1,100
1,200
-600
-400
-200
0
200
400
600
800
1,000
1,200
1,400
1,600
1,800Belv - Japan DifferentialForecast DifferentialPropane, Mont BelvieuPropane, MB FcstSpot Propane, Japan
Price ($/metric ton)
Differential($/metric ton)
Propane
© 2014 IHSSource: IHS
Jan-
05
Jan-
06
Jan-
07
Jan-
08
Jan-
09
Jan-
10
Jan-
11
Jan-
12
Jan-
13
Jan-
14
Jan-
15
0
100
200
300
400
500
600
700
800
900
1,000
1,100
-600
-400
-200
0
200
400
600
800
1,000
1,200
1,400
1,600
Belv - NWE Differen-tialDifferential FcstN-Butane, Mont BelvieuN-Butane, MB Fcst
Price ($/metric ton)
Differential($/metric ton)
Butane
© 2014 IHSSource: IHS
26
GLOBAL LPG MARKETS & PRICING - OCTOBER 2 2014

© 2014 IHS 27
Thank You!
Walter M. Hart, Ph.D., P.E.
Senior Director, NGL Research & Consulting
1 (832) 209-4424
GLOBAL LPG MARKETS & PRICING - OCTOBER 2 2014

© 2014 IHS. No portion of this report may be reproduced, reused, or otherwise distributed in any form without prior written consent, with the exception of any internal client distribution as may be permitted in the license agreement between client and IHS. Content reproduced or redistributed with IHS permission must display IHS legal notices and attributions of authorship. The information contained herein is from sources considered reliable but its accuracy and completeness are not warranted, nor are the opinions and analyses which are based upon it, and to the extent permitted by law, IHS shall not be liable for any errors or omissions or any loss, damage or expense incurred by reliance on information or any statement contained herein. For more information, please contact IHS at [email protected], +1 800 IHS CARE (from North American locations), or +44 (0) 1344 328 300 (from outside North America). All products, company names or other marks appearing in this publication are the trademarks and property of IHS or their respective owners.
Americas: +1.800.IHS.CARE (+1.800.447.273); [email protected]
Europe, Middle East, and Africa: +44.(0).1344.328.300; [email protected]
Asia and the Pacific Rim: +604.291.3600; [email protected]
Contact us


![#CiveItUp LPG (LPG a) IOCL Cl / BPCL D / HPCL C] LPG àà àa … · · 2018-02-28iocl cl / bpcl d / hpcl c] lpg àà àa-r/àkft lpg àž lpg t:- lpg dgcc (poi) lpg 17 lpg id"](https://static.cupdf.com/doc/110x72/5ae5ebd07f8b9acc268cac07/civeitup-lpg-lpg-a-iocl-cl-bpcl-d-hpcl-c-lpg-a-cl-bpcl-d-hpcl-c.jpg)