Genomic Instability Induced By Long-Term Exposure to Polychlorinated Biphenyls (PCBs)
1
Abstract
In highly industrialized cities, the byproducts of mechanized operations released into the
environment are often potential carcinogens, such as polychlorinated biphenyls (PCBs). Previous studies
have shown the oncogenic effects of PCB exposure. However, the mechanisms underlying PCB-induced
carcinogenesis are largely undefined. In our research, we analyzed the effects of PCBs on cancer
progression through a long-term study of the in vitro effects on cell lines treated with the chemical. For
the experiments, we utilized a 293T human embryonic kidney cell line, and a LS174T primary colon
carcinoma cell line. At the highest concentration of PCB treatment of 50 , we primarily observed
massive amounts of cell death. Gradually, resistant colonies emerged, that were able to grow without the
PCBs affecting their viability. These colonies were passaged for fifty generations with continuous
exposure to the chemical. The original colonies were passaged into two different cell lines: one with
continuous PCB exposure and the other pulse-treated or withdrawn from PCB exposure. Our study
analyzed the growth rates of the cell lines used. In comparison to the control-cells, the PCB-treated cells
displayed an accelerated net growth rate. Exposure to PCBs resulted in 293T cells displaying significantly
higher levels of aneuploidy than the parental lines. These findings showed that the continual treatment
with PCBs enhances the degree of chromosomal instability, and confers a faster growth rate. Our findings
suggest that PCBs could promote genetic instability as a potential mechanism promoting tumorigenesis.
2
Introduction
Environmental pollution significantly affects public health. This influence has often taken a toll
on the lives of many, resulting in significant morbidity and mortality. In other words, industrial operations
have detrimentally affected ecosystems by releasing unprecedented amounts of toxic waste products into
the air and water.
Polychlorinated biphenyls (PCBs), a group of aromatic hydrocarbons, are industrial byproducts
that play a role as chlorinated pollutants in both air and water [31]
. They have a molecular structure
composed of two benzene rings surrounded by carbon atoms that determine the specific PCB type
resulting in a high number of isoforms. This organic chemical has been associated with several health
effects such as thymus gland problems, immune deficiencies and an increased risk of developing cancer
[31]. They have been designated by the International Agency for Research on Cancer (IARC) as “probably
carcinogenic to humans” and consequently by the National Toxicology Program as “reasonably
anticipated to be human carcinogens” [30]
. Their low degree of biodegradability and their lipophilic nature
allows for increased storage in adipose tissue in both animals and humans [1, 25]
. PCBs have been shown to
have a lingering presence in the environment. In the 1970’s, these chemicals began being banned and
tightly regulated in their use. They are still found in ecosystems and remain a potential health hazard to
humans and animals alike.
A few population studies indicate that PCBs are associated with specific types of cancer in
humans and animals, such as liver cancer and breast cancer [2, 15]
. An underlying variable in the toxicity of
PCB exposure is its presence in natural environments. It is not simply found as an isolated chemical;
rather it is found as a conflation of other chemicals such as dichlorodiphenyltrichloroethane (DDT) [9]
.
Over the past century, many cases connected to the accidental release of PCBs from factories
have occurred. One well known incident is the General Electric case dealing with a massive leakage from
their facilities into the Hudson River taking place from 1947 through 1977. During these thirty years, 1.3
million pounds of PCBs were released into the Hudson River. Such incidences have led to massive
dredging projects to contain these carcinogenic chemicals [29]
. Although the spill occurred decades ago,
the effect of the chemical on the environment has not eroded with the years. Recently, researchers found
the presence of PCBs in soil surrounding industrial districts [18]
. Integration of PCBs into food chains has
led to its amplified presence in ecosystems [7]
. Although PCB exposure results in a multitude of health
problems, the interplay between exposure and cancer formation is of great concern.
The link developed between PCB exposure and cancer formation has been shown in numerous
studies. Previous research has exhibited how PCB exposure affected mitotic arrest, p53 activation, and
mitotic spindle arrest in NIH fibroblasts [2, 5]
. Using mammalian cell lines such as MDA breast cancer
3
cells, these chemicals were shown to promote and initiate carcinogenesis through events such as DNA
damage, and caspase-dependent apoptosis [23]
.
Although existing research on PCBs directly discusses their carcinogenic potential [23]
, such
studies address a limited time frame for exposure to the chemical. In addition, most of our understanding
of PCBs is derived from either in vivo models of carcinogenity [7]
or global epidemiological studies of
cancer incidence [8]
. It is necessary to address PCB induced effects in the long-term or from prolonged
exposure. This is because long-term exposure mimics the level of environmental stress that organisms
face when exposed to such chemicals.
To answer this question, we made use of an in vitro, human cell line model. In this model we
looked for resistant colonies emerging from initial PCB exposure. We analyzed how PCBs function on
the cellular level. To confirm the build-up of resistance we conducted a dose response assay for the first
three days of treatment for both cell lines. The cell lines were treated with different concentrations of
PCBs which allowed us to assess the effects with varying concentrations. By conducting such an
expansive test, we located which PCB type provided resistant colonies that were to be analyzed further.
Our research essentially explores the mechanisms through which long-term exposure to the
chemical induces the cells to express genes that drive cellular abnormalities. The cell lines used have been
treated for eight months with continuous exposure to the chemical. This project established four cell lines
called: Treated continuously with PCBs, Pulse-treated (or withdrawn from PCB exposure), Parental (the
original cell line never exposed to PCBs), and the DMSO- treated cell line. To determine the longitudinal
effects of exposure to the pollutant, resistant colonies found after primary treatment were passaged for
fifty generations. It was necessary for us to evaluate how long-term exposure could prompt cells to
express abnormalities. Further analysis on the nature of the pulse-treated cell line served as a model to
understand how withdrawal of treatment from the PCBs could cause the cells to revert back to a normal
phenotype. It also established a stark contrast between the Treated and the Pulse-Treated cells, showing
that long-exposure to the chemical, not short-term exposure causes further phenotypic instability.
We also explored changes in cell growth levels after continual exposure to the chemical. The
reason for looking for an abnormal growth rate, and anchorage independent growth was to develop a
phenotype of carcinogenity. One of the hallmarks of cancer is the evasion of growth suppressors. The
cancer cell is able to bypass the role that tumors suppressor genes have imposed which limits cell growth
and proliferation [3]
. Our research seeks to develop the phenotype before even addressing the mechanism.
When analyzing these established cell lines, we looked for their anchorage independent growth
levels and their growth rates at higher passage levels. These experiments allowed us to assess the high-
grade tumor formation potential, an important component for the identification of carcinogenity.
Normally, cancer cells are able to grow in the absence of their neighboring cells and anchorage to the
4
extracellular matrix (ECM) [16]
. Cells that are not transformed normally experience apoptosis when not
adhered to a substratum [16]
. A cell that does not form colonies is a non-transformed cell [17]
. Furthermore,
acquiring anchorage independence represents a portion of a cell’s malignant transformation. This is
categorized as a chromosome mutation event which as the anchorage independent growth suggests,
permits cells to become malignant and proliferate at a faster rate.
The research sought to address the formation of chromosomal abnormalities induced by PCBs.
The cells were evaluated for their copy number frequencies in two chromosomes: chromosome
16 and 18. These two chromosomes have in previous karyotyping shown to have a normal copy number
in the cell lines used [12, 13]
. The 293T human embryonic kidney cell line showed a significantly higher
level of aneuploidy than the control lines analyzed. Previous research has shown that genetic and
phenotypic instabilities are two out of many components of cancer cell formation and that an abnormal
number of chromosomes results in destabilized mitotic genes [24]
. We found a significantly higher degree
of aneuploidy for the 293T human embryonic kidney cells, treated persistently with PCBs. On the
contrary, the LS174T cell line, displayed a level of aneuploidy that was barely distinguishable from the
controls evaluated. Previous data demonstrated that the higher the level of aneuploidy, the greater the
degree of genetic instability [24]
. This research has built a model for carcinogenesis in a particular cell line,
the 293T human embryonic kidney cell line, which has shown accelerated growth rate and a significantly
higher degree of genetic instability as a result of persistent PCB exposure. Although the LS174T cells did
not show a significantly higher rate of genetic instability, its accelerated growth rate and high tumor
formation potential can be attributed to other factors playing into carcinogenesis.
We sought to define the long term effects of PCB exposure on two cell lines by using data that
demonstrated the interplay between PCB exposure and cellular changes. Surprisingly, our data
demonstrates that in 293T human embryonic kidney cells, prolonged PCB exposure induces a high degree
of genetic instability, and an accelerated growth rate. While many previous studies have characterized the
effects of this pollutant in short term exposure and demonstrated the cellular changes that occur, none
have fully explored the extent to which long-term PCB exposure changes the cell’s stability. Our findings
suggest that the chemical treatment combined with the persistent environmental stress, permitted
remodeling of the cell’s genetic stability and development of carcinogenic potential.
Material/Methods
Cell Lines-
Two established cell lines were used for this investigation: the LS174T colon carcinoma cell line
and the 293T human embryonic kidney cell line. HEK-293T cells were maintained in Dulbecco’s
Modified Eagle Medium (DMEM) containing 10% FBS. The LS174T cell line was maintained in DMEM
consisting of L-glutamine, Na-pyruvate and 10% FBS. Cells were passaged by trypsinization in order to
5
detach the cells from the plate. They were washed with 1x Sterile Phosphate buffered saline (PBS) before
passaging. These cells were incubated in a humidified environment with 5% CO2 and kept at 37 degrees
Centigrade.
Polychlorinated Biphenyls-
The PCBs were ordered from Sigma-Aldrich in a bulk order which included several members of
the family of chemicals. The six isoforms were: Aroclor 1260, 1262, 1254, 1232, 1242, and 1248. PCBs
can be found in Aroclor form- a state at which it is dissolved in iso-octane solution. These Aroclors were
chosen especially, because they were found in toxicological and genetic studies [1, 2]
. Their isoform
number depended on their different molecular structures, specifically the number of chlorine atoms found
on the benzene rings and the otherwise subtle differences in the molecular structure. The PCBs came in a
high concentration kit which had 1000 g/ ml PCB dissolved in isooctane. Such a high concentration
made it ideal for use as an analytical standard.
Isolating the PCBs from the Aroclor solution-
The PCBs were received through Sigma-Aldrich in closed glass containers [Catalog # 44803].
When evaporating the iso-octane solution in the chemical hood, we took the necessary precautions to
keep the chemical from contacting skin. This was by wearing nitrile gloves, through which the chemical
would not be able to penetrate. The PCBs, dissolved in the iso-octane solution, were isolated using a
nitrogen flow tank. This apparatus was provided by the Sawyers Lab at MSKCC.
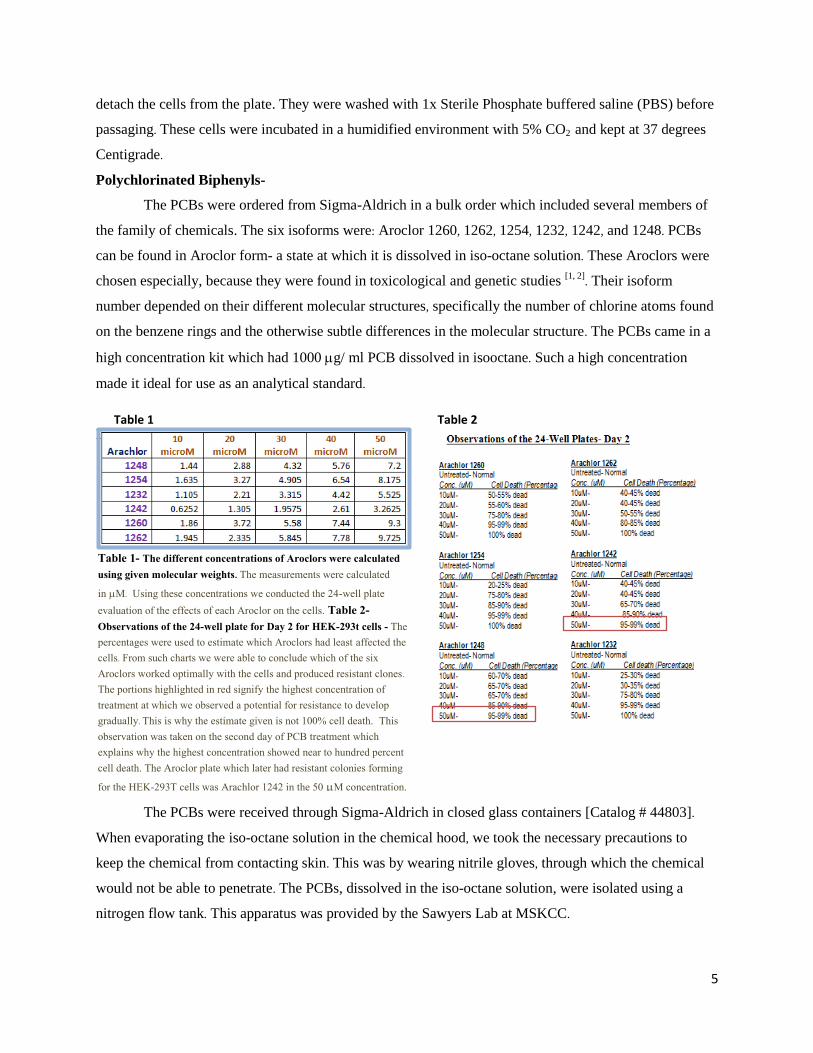
Table 1- The different concentrations of Aroclors were calculated using given molecular weights. The measurements were calculated
inM. Using these concentrations we conducted the 24-well plate
evaluation of the effects of each Aroclor on the cells. Table 2- Observations of the 24-well plate for Day 2 for HEK-293t cells - The percentages were used to estimate which Aroclors had least affected the cells. From such charts we were able to conclude which of the six Aroclors worked optimally with the cells and produced resistant clones. The portions highlighted in red signify the highest concentration of treatment at which we observed a potential for resistance to develop gradually. This is why the estimate given is not 100% cell death. This observation was taken on the second day of PCB treatment which explains why the highest concentration showed near to hundred percent cell death. The Aroclor plate which later had resistant colonies forming
for the HEK-293T cells was Arachlor 1242 in the 50M concentration.
Table 1
Table 2
6
This method deviates from previous methods of isolating PCBs. The iso-octane solution was hard
to evaporate because it is a stable compound that is capable of forming heavy air around the tube opening
to prevent further evaporation. For this reason, we devised a method using a nitrogen gas flow directed
towards the falcon tube interior containing the Aroclor solution. The PCBs were isolated as 1 mm.
residues found in the 15 ml falcon tube after evaporating the iso-octan e. The PCBs were then dissolved in
1 ml of dimethyl sulfoxide (DMSO). This allowed for adequate storage for long-term use in the lab and
storage at room temperature in the chemical hood.
In Vitro Exposure to PCBs-
In order to provide adequate exposure, the different Aroclors were inserted in the media
according to varying concentrations. This step required the calculation of their different M amounts: 10
M, 20M, 30M, 40M, and 50M. We used different concentrations in order to determine the
dosage response and identify which dosage level proved optimal for the selection process. This meant that
we were looking for the highest concentration at which the cells gained resistance and formed resistant
colonies. The cell lines were plated with specific concentrations of PCBs, in 24-well plates for selection.
Each column had a different dosage of the chemical treatment. This scheme gave us information from the
many replicates for each dosage concentration.
There was a column for the control cell line which had treatment with Media only. There was a
total of six different 24-well plates used for this investigation because each one contained one out of the
six-member Aroclor family. Each day a specific amount of the chemical was added to fresh media as seen
in Table 2. After a 24-hour incubation period, the apoptotic, floating cells were washed off with PBS.
Fresh media was provided to the cells along with the PCB concentration.
We treated the cells each day, for two weeks until resistant colonies emerged in select plates.
During the two–week selection process, the cells were observed for the percentage of viable cells for each
dosage. An estimate of the number alive was recorded for each day (Table 2). This helped distinguish
which plates had the highest amount of cell death and which ones were affected the slightest. By
recording an estimate for each day we found in particular plates, cells were emerging at high
concentrations, which were resistant to the chemical exposure.
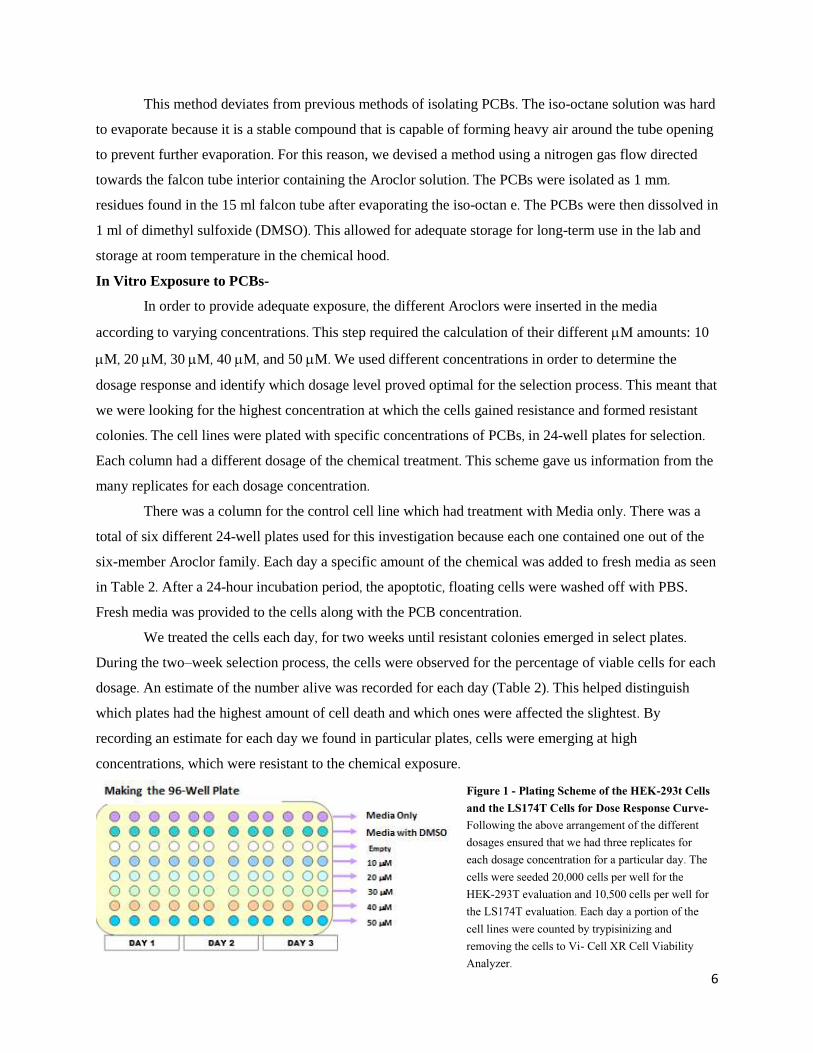
Figure 1 - Plating Scheme of the HEK-293t Cells and the LS174T Cells for Dose Response Curve- Following the above arrangement of the different dosages ensured that we had three replicates for each dosage concentration for a particular day. The cells were seeded 20,000 cells per well for the HEK-293T evaluation and 10,500 cells per well for the LS174T evaluation. Each day a portion of the cell lines were counted by trypisinizing and removing the cells to Vi- Cell XR Cell Viability Analyzer.

7
Dose-Response Curve-
To map out what occurred to the normal cells during the first three days of PCB treatment, we
conducted a dose response curve. The cells were grown overnight in serum-free media to ensure that they
grew at the same rate. We used 96-well plates. The scheme of the plate is shown in Figure 1. Each day the
cells were counted using a Vi-Cell Counter. Using the Vi-Cell XR Cell Viability Analyzer machine and
software we counted the number of viable cells. This machine allowed for automatic execution of the
trypan-blue exclusion protocol. This protocol involved 500 L of a sample volume mixed with trypan
blue. Then the machine took 50 images to denote the cell viability and concentration. The parameters for
analysis of the cell lines used were already in the program because of the common use of the cell lines in
the lab. There were three replicates for each cell line for each day.
The two controls provided were the Media-Only control and the Media treated with DMSO
controls. The DMSO in the media was at the same concentration as the PCBs in the media. This vehicle
control was provided in order to allow for insight on whether the cell’s viability and growth trend was in
any way affected by DMSO exposure.
Passaging of Resistant Clones-
The resistant colonies which were isolated were passaged for eight months until Passage 50
(Figure 5). The original colonies diverged into two different cell lines: one was continually treated with
the PCBs. These were LS174T Treated, and 293T Treated. For the other line, we had withdrawn PCB
exposure. These were LS174T Pulse Treated, and 293T Pulse Treated. These were passaged for a couple
of months using the Aroclor solution administered at each passage. The cells were normally split at a 1:4
ratio every three to four days. The Treated cell line was provided with 32 L concentration at the time of
initial seeding, to ensure that the cells were exposed to the chemical in the media. The total amount of
media was 10 mL and we used 10 cm. plates for passaging. The concentration used was proportional to
the total amount of media used.
Soft Agarose Assay-
Soft agarose assays provided a means to evaluate the cells’ capability to grow without contact
from other cells and to form colonies. This assay was conducted using the standardized protocol provided
by the Chan Lab. The cells were seeded at varying concentrations per well into each six well plate. The
agarose contained a double layer: the top layer is 0.4% agarose and the bottom layer is 0.8% agarose.
They were grown for two weeks with the media changed on top to prevent the plates from drying up. The
program used for the soft agarose colony counting was called Gel Count. This was used to rapidly count
the number of colonies formed in the semi-solid agarose matrix. It also provided the average colony size
information.
8
The six-well plates have been used with varying concentrations in order to see the optimal
seeding density at which the cell suspensions grow. Provided with the information about the seeding
concentration at which the cells have grown the best, it was followed up with analysis on the four cell
lines and which ones formed the largest number of colonies.
Fluorescence in situ Hybridization (FISH)-
The procedure used was provided by the Molecular Cytogenetics Core Facility. We used
interphase nuclei with a specific subset of probes. These centromere probes were specific to short,
repeated areas of each centromere. Often times, mistakes such as cross-hybridizations with other
centromeres occurred resulting in faulty signals. The chromosomes selected were Chromosome 18 and 16,
for they proved to be part of studies including abnormality in cell lines. However, they were not particular
to any former PCB studies [12, 13]
.
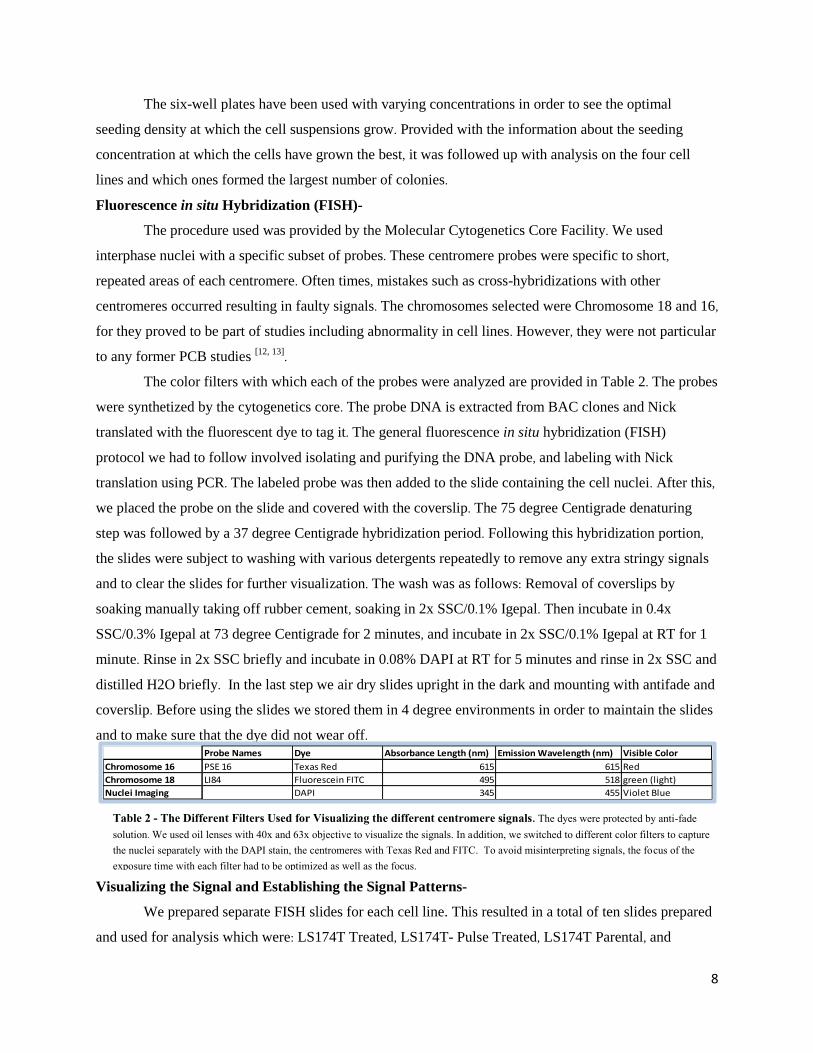
The color filters with which each of the probes were analyzed are provided in Table 2. The probes
were synthetized by the cytogenetics core. The probe DNA is extracted from BAC clones and Nick
translated with the fluorescent dye to tag it. The general fluorescence in situ hybridization (FISH)
protocol we had to follow involved isolating and purifying the DNA probe, and labeling with Nick
translation using PCR. The labeled probe was then added to the slide containing the cell nuclei. After this,
we placed the probe on the slide and covered with the coverslip. The 75 degree Centigrade denaturing
step was followed by a 37 degree Centigrade hybridization period. Following this hybridization portion,
the slides were subject to washing with various detergents repeatedly to remove any extra stringy signals
and to clear the slides for further visualization. The wash was as follows: Removal of coverslips by
soaking manually taking off rubber cement, soaking in 2x SSC/0.1% Igepal. Then incubate in 0.4x
SSC/0.3% Igepal at 73 degree Centigrade for 2 minutes, and incubate in 2x SSC/0.1% Igepal at RT for 1
minute. Rinse in 2x SSC briefly and incubate in 0.08% DAPI at RT for 5 minutes and rinse in 2x SSC and
distilled H2O briefly. In the last step we air dry slides upright in the dark and mounting with antifade and
coverslip. Before using the slides we stored them in 4 degree environments in order to maintain the slides
and to make sure that the dye did not wear off.
Visualizing the Signal and Establishing the Signal Patterns-
We prepared separate FISH slides for each cell line. This resulted in a total of ten slides prepared
and used for analysis which were: LS174T Treated, LS174T- Pulse Treated, LS174T Parental, and
Probe Names Dye Absorbance Length (nm) Emission Wavelength (nm) Visible Color
Chromosome 16 PSE 16 Texas Red 615 615 Red
Chromosome 18 LI84 Fluorescein FITC 495 518 green (light)
Nuclei Imaging DAPI 345 455 Violet Blue
Table 2 - The Different Filters Used for Visualizing the different centromere signals. The dyes were protected by anti-fade solution. We used oil lenses with 40x and 63x objective to visualize the signals. In addition, we switched to different color filters to capture the nuclei separately with the DAPI stain, the centromeres with Texas Red and FITC. To avoid misinterpreting signals, the focus of the exposure time with each filter had to be optimized as well as the focus.
9
LS174T- DMSO, LS174T-P0, and 293T- Treated, 293T- Pulse Treated, 293T- Parental, 293T- DMSO-
Treated, and 293T-P0. These were, at first, manually evaluated using a hundred nuclei sample size. The
nuclei number and the signal patterns were recorded and conflated into graphs. The software used to
retain the images on the computer was called Isis. We also used Metasystems, a program used to analyze
chromosome signals. This program was used to compile information on the chromosome count for each
nucleus. This automated system proved to be efficient with the amount of times that it took for scanning
each nucleus. The program also allowed for unbiased information on the slides that were used due to the
creation of histograms that charted the number of signals in each nucleus scanned. The filters also change
and the images are finalized with the clear signals.
The approach to analyzing the slides primarily involved looking manually into the microscope
images using the system, Isis, a program which solely captures fields. First, we captured enough slides on
the Isis program and adjusted the program’s capability in capturing the red and green signals for the
centromeres for Chromosome 16 and 18. Then nuclei score sheets were used to evaluate the signals which
were captured by the microscope. This process involved looking at a small sample size which created an
estimate of the number of different, possible signal patterns. The 100-nuclei cell counts were done in the
beginning in order to familiarize ourselves with the different signal patterns, for example the split signals
which were often found on the chromosome. A larger sample size was necessary for statistical analysis.
This study expanded to become a thousand nuclei analysis of each slide. Chromosome 16 and 18 were
chosen for the two-color FISH interphase nuclei analysis due to previous karyotyping done on the cell
lines used and the chromosomes having normal signal counts [12,13]
. The experiments used established cell
lines that had been extensively karyotyped in previous papers. For the LS174T cells, previous
karyotyping determined that most of chromosome counts were normal except for two trisomies at
Chromosome 7 and 15 and a loss of an X or Y. The Representative SKY karyotype for the HEK-293T
cells had shown that there were no known abnormalities associated with Chromosome 16 and 18.
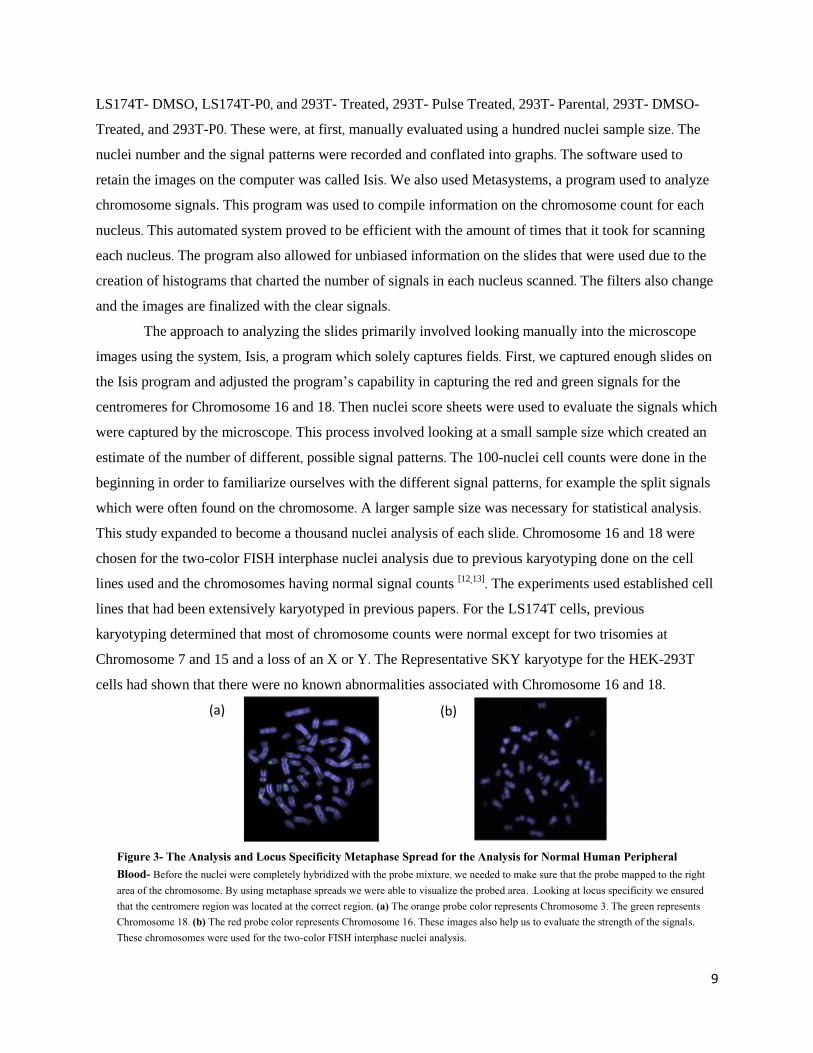
Figure 3- The Analysis and Locus Specificity Metaphase Spread for the Analysis for Normal Human Peripheral Blood- Before the nuclei were completely hybridized with the probe mixture, we needed to make sure that the probe mapped to the right area of the chromosome. By using metaphase spreads we were able to visualize the probed area. .Looking at locus specificity we ensured that the centromere region was located at the correct region. (a) The orange probe color represents Chromosome 3. The green represents Chromosome 18. (b) The red probe color represents Chromosome 16. These images also help us to evaluate the strength of the signals. These chromosomes were used for the two-color FISH interphase nuclei analysis.
(a) (b)

10
Results
Dose-Response Curve
In order to observe the effect of the PCBs on the growth rates of normal cell lines in the
beginning, they were assessed for their growth rates in the first three days following PCB exposure. This
assay was used to primarily evaluate the concentration at which the cells were killed. The cultures were
started at the same time and the cells were starved in serum-free media the day before starting the growth
curve. The results of this analysis are shown in Figure 4. Notably, the graph for the dose-response curves
shows that the PCBs have a deleterious effect on the cell’s growth capacity for the first three days. This
ensured that the cells were grown starting with the same phase of growth. In the two graphs for Figure 4
we see a clear difference between the primary responses to the chemical. For the HEK-293T cells in Fig.
4a, Day 1 shows a downward growth rate. For the LS174T cell line on Day 1 we see the upward growth
rate. The LS174T cell line showed that it was not affected by the PCB on the first day as much as the
other cell line was affected. The reason for this could be attributed to the fact that LS174T cell line is
carcinogenic and has a capability to evade growth regulation that a normal cell would face. This would
explain the upward growth we see on Day 1 instead of the downward course the curve takes for the HEK-
293T cell line. This comparison also suggests that the LS174T was more resistant to the PCB exposure
initially than the HEK-293T cell line. There was a point at which the cell lines display stability and grow
further. As seen in Figure 4a, it was by Day 2 that the net growth stabilized. Overall, for the LS174T cell
lines we observed more resistance to the PCBs from the first day of treatment.
Figure 4- The Effect of the PCBs in Varying Dosages During Primary Exposure – (a) This dose-response graph is for the HEK-293T cells. These dose
response curves were generated with cell counts taken from each group and we averaged the counts for each day and plotted them onto the graph. The
10 treatment shows an overall 40% decline in the growth rate between Day 1 and 3. The 30 treatment displays a 75% decrease in growth over the
course of three days. The 50 treatment shows an overall 90% decline in growth. These results indicate that the different doses show a trend in the cell growth. The highest dosage treatment has the lowest net growth rate whereas the lowest dosage has the greatest net growth. Furthermore, the 50 experiences stabilization in growth as Day 3 approaches. The rate of decline in growth is 81.5% between Day 0 and Day 1, and lowers to 30% between
Day 1 and Day 2. Finally it shows a 58.3% decline in growth between Day 2 and Day 3. (b) This dose-response curve is for the LS174T cell line. The 10
M concentration had an overall increase in growth by 103%. The 50showed only a slight 28.5% increase in growth. These results indicate that for the LS174T cells, the PCBs affected cell growth in a trend similar to the 293T cell line. The highest dosage showed the lowest net growth while the lowest dosage response had a higher growth rate. The control treatment showed a high proliferation rate over the three days which was expected. This data from the control lines shows us how the PCB is acting on the cells, and not the DMSO.

11
Primary Treatment of Cell Lines with PCBs Induces Low Net Growth
To assess the direct effects of the PCBs on the cell line used, the cells were carefully monitored
for two weeks, taking into account the different concentrations at which they were exposed which varied
from low to high M quantities. The Aroclor isomers were evaluated separately for their effects in each
cell line. Thus, the cells were seeded at the same density in each of six 24-well plates. Each cell line
responded to a distinct Aroclor with massive cell death in the beginning, but slow gain of resistance. For
the HEK-293T cells the plate treated with Aroclor 1242 quantity produced resistant colonies by Day 3 of
treatment. By observing using one-day intervals we monitored which of the other Aroclor plates did not
have any surviving cells for the highest concentration of PCB. For the LS174T cell line, resistant clones
emerged after treatment with Aroclor 1232 for four days.
Isolating the Clonally Selected Cells for Further Passaging
The main objective of the previous dose response graphs was to display the capacity of the PCBs
to induce cell death after primary exposure. By counting the number of cells for each day, over the course
of three days, we were able to notice how the first day of exposure with PCBs caused cells to die in
different degrees for each concentration tested. For instance, the 10 M concentration had a sparse
number of cells that were brownish in color and slightly detached from the plate. However, for the 40 M
and 50 M concentrations we saw the cells detached from the plate, with necrotic morphology. We
categorized this type of cell death as necrosis, not as apoptosis. This is because apoptosis is programmed
cell death, whereas necrotic cell death occurs passively without any underlying mechanisms [19]
.
Gradually, the cells gained resistance to the treatment. This buildup of resistance was critical to the
investigation. This experiment was continued by further passaging the resistant clones that were isolated
in the 24-well plates.
Assessing the Proliferation Rate for Higher Passages
Figure 5 - How the Cells Were Handled Following Isolation of Resistant Clones Following initial PCB exposure the cells experienced massive cell death. After the first few days, resistant colonies formed in certain plates. To make sure that these colonies were indeed resistant, they were treated for a longer time with the PCB in the media. These resistant cells were passaged further into two different cell lines. The Treated cell line was passaged for an equal amount of time as the Pulse-treated cell line. Both were given the same amount of time before passaging and grown using the same media concentration. The
continually treated cell line was exposed to 32 l of PCB. Following the long term passaging with and without the treatment, we looked for the difference between the two cell lines used.
Resistant Colony
12
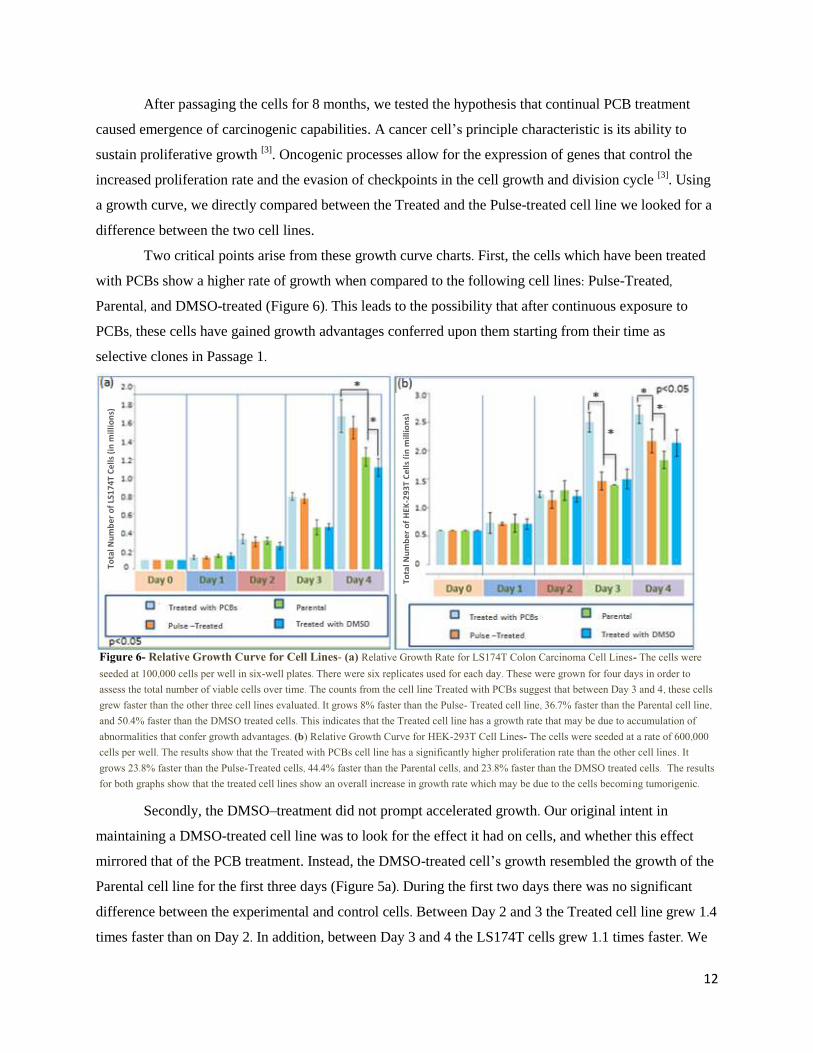
After passaging the cells for 8 months, we tested the hypothesis that continual PCB treatment
caused emergence of carcinogenic capabilities. A cancer cell’s principle characteristic is its ability to
sustain proliferative growth [3]
. Oncogenic processes allow for the expression of genes that control the
increased proliferation rate and the evasion of checkpoints in the cell growth and division cycle [3]
. Using
a growth curve, we directly compared between the Treated and the Pulse-treated cell line we looked for a
difference between the two cell lines.
Two critical points arise from these growth curve charts. First, the cells which have been treated
with PCBs show a higher rate of growth when compared to the following cell lines: Pulse-Treated,
Parental, and DMSO-treated (Figure 6). This leads to the possibility that after continuous exposure to
PCBs, these cells have gained growth advantages conferred upon them starting from their time as
selective clones in Passage 1.
Secondly, the DMSO–treatment did not prompt accelerated growth. Our original intent in
maintaining a DMSO-treated cell line was to look for the effect it had on cells, and whether this effect
mirrored that of the PCB treatment. Instead, the DMSO-treated cell’s growth resembled the growth of the
Parental cell line for the first three days (Figure 5a). During the first two days there was no significant
difference between the experimental and control cells. Between Day 2 and 3 the Treated cell line grew 1.4
times faster than on Day 2. In addition, between Day 3 and 4 the LS174T cells grew 1.1 times faster. We
Figure 6- Relative Growth Curve for Cell Lines- (a) Relative Growth Rate for LS174T Colon Carcinoma Cell Lines- The cells were
seeded at 100,000 cells per well in six-well plates. There were six replicates used for each day. These were grown for four days in order to assess the total number of viable cells over time. The counts from the cell line Treated with PCBs suggest that between Day 3 and 4, these cells grew faster than the other three cell lines evaluated. It grows 8% faster than the Pulse- Treated cell line, 36.7% faster than the Parental cell line, and 50.4% faster than the DMSO treated cells. This indicates that the Treated cell line has a growth rate that may be due to accumulation of abnormalities that confer growth advantages. (b) Relative Growth Curve for HEK-293T Cell Lines- The cells were seeded at a rate of 600,000 cells per well. The results show that the Treated with PCBs cell line has a significantly higher proliferation rate than the other cell lines . It grows 23.8% faster than the Pulse-Treated cells, 44.4% faster than the Parental cells, and 23.8% faster than the DMSO treated cells. The results for both graphs show that the treated cell lines show an overall increase in growth rate which may be due to the cells becoming tumorigenic.
Tota
l Nu
mb
er o
f LS
17
4T C
ells
(in
mill
ion
s)
Tota
l Nu
mb
er o
f H
EK-2
93T
Cel
ls (
in m
illio
ns)

13
can draw additional conclusions from Figure 5a. The Pulse-treated cell line on both Day 2 and 3 showed a
viable cell count similar to the count for the Treated cell line.
By contrast on Day 4, the Treated cell line grew 8.2% faster than the Pulse-treated cell line.
Meanwhile, the Treated LS174T cell line grew 36% faster than the Parental cell line for Day 4. This
allows us to conclude that for the LS174T colon carcinoma cell line, an already mutagenic cell line, the
continual PCB treatment has given it further capability to evade normal growth patterns and cellular
programs which normally regulate the proliferation rate.
This increased growth advantage was also seen in the 293T cell line. In Figure 5b, it can be
observed that between Day 2 and 3, the Treated cell line and the Parental cell line were growing at the
same rate. On Day 3, the Treated cell line had a two-fold increase in growth. Between Day 2 and Day 3,
the Pulse-treated cell line and the Parental cell line show a 29% and 7.6% increase in growth, respectively.
On the fourth day the Treated cell line experienced a slowdown in growth rate. The graph shows the
Treated cell line had only a 5% increase in growth from the day before, in contrast to the 47.7% increase
for the Pulse-Treated cell line, 30.9% increase seen for the Parental cell line, and the 42% increase for the
DMSO-treated cell line. This data comparison suggests that the Treated cell line in contrast to the other
three cell lines evaluated, displayed a slowing down of growth between Day 3 and Day 4 and yet, the
Treated 293T cell line had the highest amount of cell viability.
We analyzed the total cell viability over the course of four days to determine whether the PCB-
treated cell line differed in its growth rate from that of the pulse-treated cell line. For the HEK-293T cell
line we observed a significant difference between the growth rate of the Treated cell line when compared
to that of the Pulse-Treated cell line. Meanwhile, for the LS174T colon carcinoma cell line, there was no
statistical difference between the Treated and the Pulse-treated cell line on Day 4, but there is a notable
difference between the Treated and Parental.
Centromere Specific Interphase Nuclei Analysis of the Established Cell Lines
Aneuploidy is commonly viewed as a hallmark of cancer [14, 6]
. This phenomenon manifests itself
as an abnormal chromosome count. This can be found in cases of an extra chromosome which is trisomy,
the absence of a chromosome which is monosomy, and an extra set of chromosomes which is polyploidy.
These two chromosomes were chosen particularly because chromosome 16 and 18 showed no
variation in copy number from the baseline level in previous karyotypes conducted. The copy number of
these two chromosomes was set at the baseline level for the karyotype studies previously. Using the two
chromosomes being as a baseline level for the chromosome count, we then could establish whether any
variation had occurred over time. One abnormality connected to Chromosome 16 was Mosaicism or
Trisomy 16 [21]
. Chromosome 18 is also another chromosome which is connected to trisomy cases. In
humans, trisomy 18 leads to serious health problems towards a disease called Edward’s syndrome. In
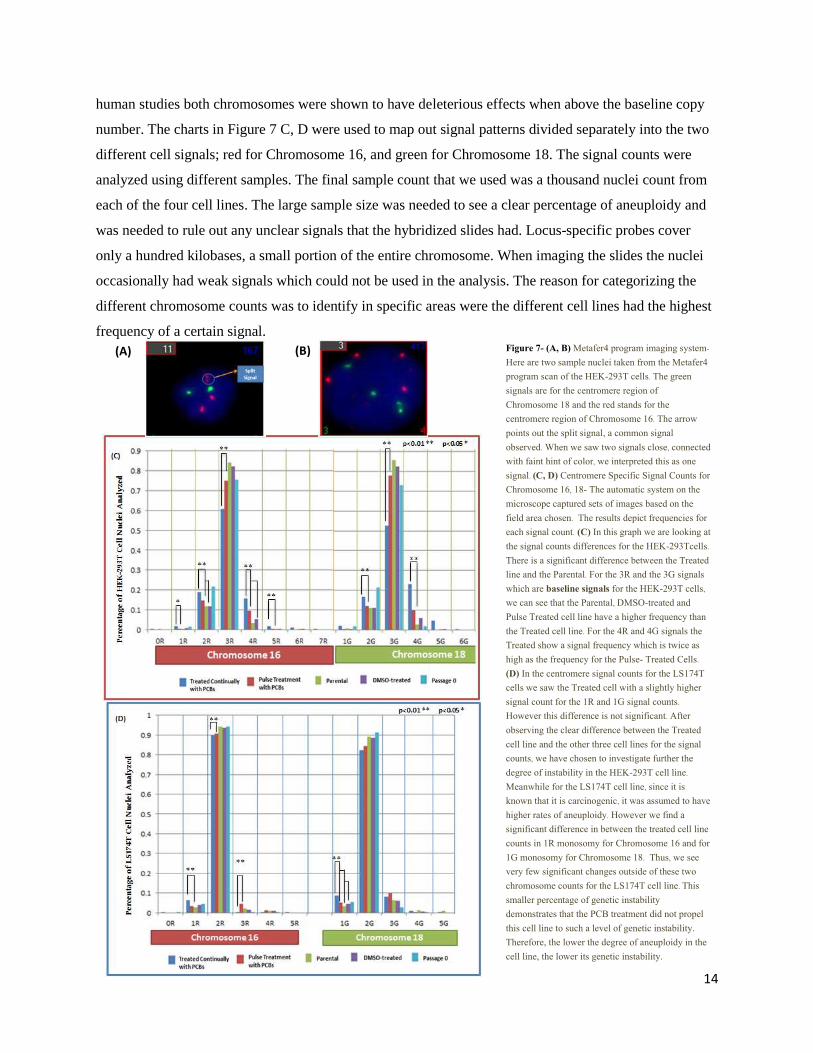
14
human studies both chromosomes were shown to have deleterious effects when above the baseline copy
number. The charts in Figure 7 C, D were used to map out signal patterns divided separately into the two
different cell signals; red for Chromosome 16, and green for Chromosome 18. The signal counts were
analyzed using different samples. The final sample count that we used was a thousand nuclei count from
each of the four cell lines. The large sample size was needed to see a clear percentage of aneuploidy and
was needed to rule out any unclear signals that the hybridized slides had. Locus-specific probes cover
only a hundred kilobases, a small portion of the entire chromosome. When imaging the slides the nuclei
occasionally had weak signals which could not be used in the analysis. The reason for categorizing the
different chromosome counts was to identify in specific areas were the different cell lines had the highest
frequency of a certain signal.
Figure 7- (A, B) Metafer4 program imaging system- Here are two sample nuclei taken from the Metafer4 program scan of the HEK-293T cells. The green signals are for the centromere region of Chromosome 18 and the red stands for the centromere region of Chromosome 16. The arrow points out the split signal, a common signal observed. When we saw two signals close, connected with faint hint of color, we interpreted this as one signal. (C, D) Centromere Specific Signal Counts for Chromosome 16, 18- The automatic system on the microscope captured sets of images based on the field area chosen. The results depict frequencies for each signal count. (C) In this graph we are looking at the signal counts differences for the HEK-293Tcells. There is a significant difference between the Treated line and the Parental. For the 3R and the 3G signals which are baseline signals for the HEK-293T cells, we can see that the Parental, DMSO-treated and Pulse Treated cell line have a higher frequency than the Treated cell line. For the 4R and 4G signals the Treated show a signal frequency which is twice as high as the frequency for the Pulse- Treated Cells. (D) In the centromere signal counts for the LS174T cells we saw the Treated cell with a slightly higher signal count for the 1R and 1G signal counts. However this difference is not significant. After observing the clear difference between the Treated cell line and the other three cell lines for the signal counts, we have chosen to investigate further the degree of instability in the HEK-293T cell line. Meanwhile for the LS174T cell line, since it is known that it is carcinogenic, it was assumed to have higher rates of aneuploidy. However we find a significant difference in between the treated cell line counts in 1R monosomy for Chromosome 16 and for 1G monosomy for Chromosome 18. Thus, we see very few significant changes outside of these two chromosome counts for the LS174T cell line. This smaller percentage of genetic instability demonstrates that the PCB treatment did not propel this cell line to such a level of genetic instability. Therefore, the lower the degree of aneuploidy in the cell line, the lower its genetic instability.
(A) (B)
15
We saw a significant difference in the HEK-293T Treated cell line and the control cell lines as
seen in Figure 7C. This pronounced difference is found in the Chromosome 18 counts. For, the HEK-
293T cell line, the baseline chromosome copy number was 3n. This meant that a majority of chromosome
had three copies. This cell line was previously characterized as a hypotriploid cell line [12]
. In Figure 7C,
the Treated cell line shows double the number of signals for 4G than the Pulse-treated cell line. This is
significant because at this aneuploidy level, a demonstrated higher percentage difference shows a distinct
characteristic form for the Treated cell line. The Parental cell line and the DMSO- treated cell line have
very few nuclei with the 4 green signals. The P0 cell line shows a higher number of nuclei with the
diploid signal counts for both Chromosome 16 and 18. This tells us that the original resistant colonies had
a high percentage of nuclei that had the diploid count. In Figure 7C, we can see that the HEK-293T cells
treatment with the chemical show a higher degree of genetic instability.
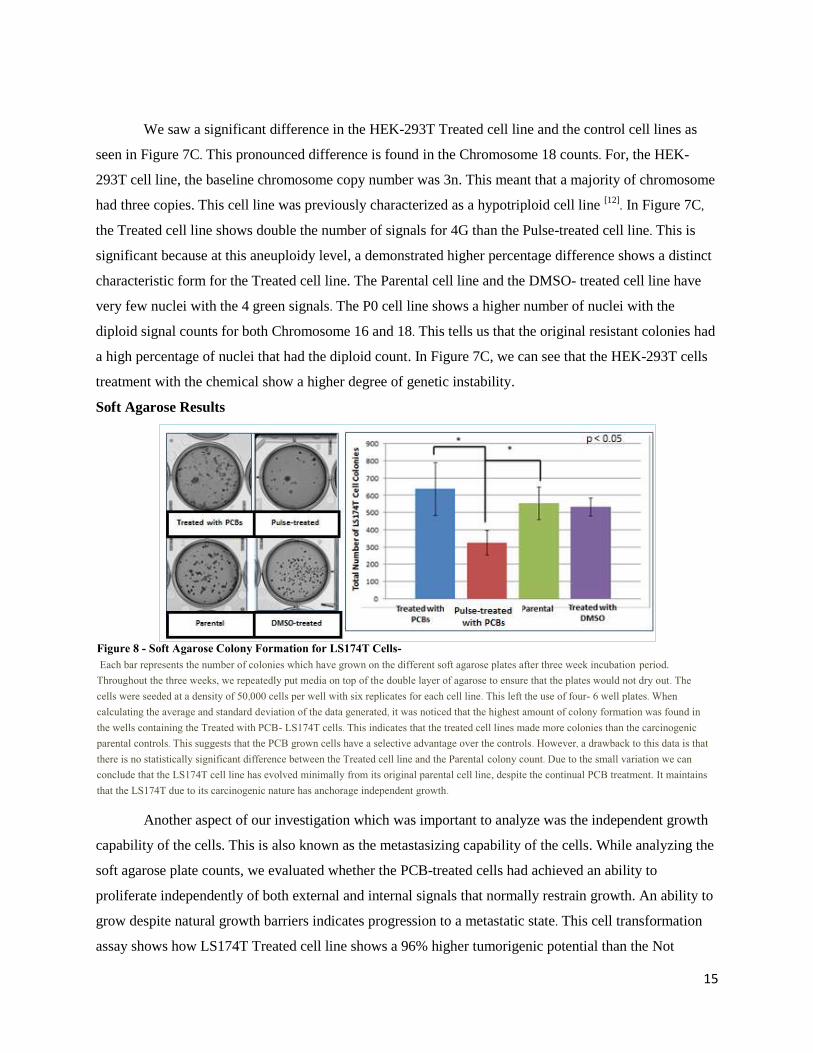
Soft Agarose Results
Another aspect of our investigation which was important to analyze was the independent growth
capability of the cells. This is also known as the metastasizing capability of the cells. While analyzing the
soft agarose plate counts, we evaluated whether the PCB-treated cells had achieved an ability to
proliferate independently of both external and internal signals that normally restrain growth. An ability to
grow despite natural growth barriers indicates progression to a metastatic state. This cell transformation
assay shows how LS174T Treated cell line shows a 96% higher tumorigenic potential than the Not
Figure 8 - Soft Agarose Colony Formation for LS174T Cells- Each bar represents the number of colonies which have grown on the different soft agarose plates after three week incubation period. Throughout the three weeks, we repeatedly put media on top of the double layer of agarose to ensure that the plates would not dry out. The cells were seeded at a density of 50,000 cells per well with six replicates for each cell line. This left the use of four- 6 well plates. When calculating the average and standard deviation of the data generated, it was noticed that the highest amount of colony formation was found in the wells containing the Treated with PCB- LS174T cells. This indicates that the treated cell lines made more colonies than the carcinogenic parental controls. This suggests that the PCB grown cells have a selective advantage over the controls . However, a drawback to this data is that there is no statistically significant difference between the Treated cell line and the Parental colony count. Due to the small variation we can conclude that the LS174T cell line has evolved minimally from its original parental cell line, despite the continual PCB treatment. It maintains that the LS174T due to its carcinogenic nature has anchorage independent growth.
16
Treated cell line (Figure 8). The Treated cell line shows a significantly higher colony count than the
Pulse-Treated cell line. However, the difference between the Treated and the Parental cell lines is not
significant. The PCBs did not affect the LS174T colon carcinoma cell line in its metastatic potential. The
DMSO-treated cell line similarly showed no significant difference when compared to the cell line. This
suggests that the slight difference seen in Figure 8 can be attributed to the technical issues. It also
suggests that the treatment with PCBs caused very little change in the colon carcinoma cell line in
general.
Conclusion
In view of the analyses done on the cell lines tested with PCBs, we propose that initial PCB
exposure prompts a selection process. This process is initiated by low net growth after primary exposure
to the pollutant. Although the cells responded differently with distinct Day 1 growth rates (Figure 4), in
two days, the net growth was stabilized. After two weeks of continuously treating the cells with PCBs at a
high dosage concentration, we isolated resistant colonies that emerged in the 24-well plates. For the
LS174T cells we observed resistant colonies forming in the 50 M plate for Aroclor 1232, whereas for
the HEK-293T cells, a 50 M exposure to Aroclor 1242 produced resistant colonies.
Additonally, we observed that varying dosage exposure to PCBs caused cell death in different
degrees. For the HEK-293T cell line, the percentage of cell growth observed allowed us to locate where
resistant colonies were emerging. As we passaged the cells with PCBs continually for eight months, we
observed the cells undergo selective pressure prompted by PCB exposure. In the LS174T cell line, we
observed a significantly higher growth rate than the growth rate for the Pulse-Treated cell line. Similarly,
the Treated HEK-293T cell line, displayed a higher growth rate than the Parental cell line. In the soft
agarose assay, the HEK-293T cell line had no colony formation. The LS174T cell line, a carcinoma cell
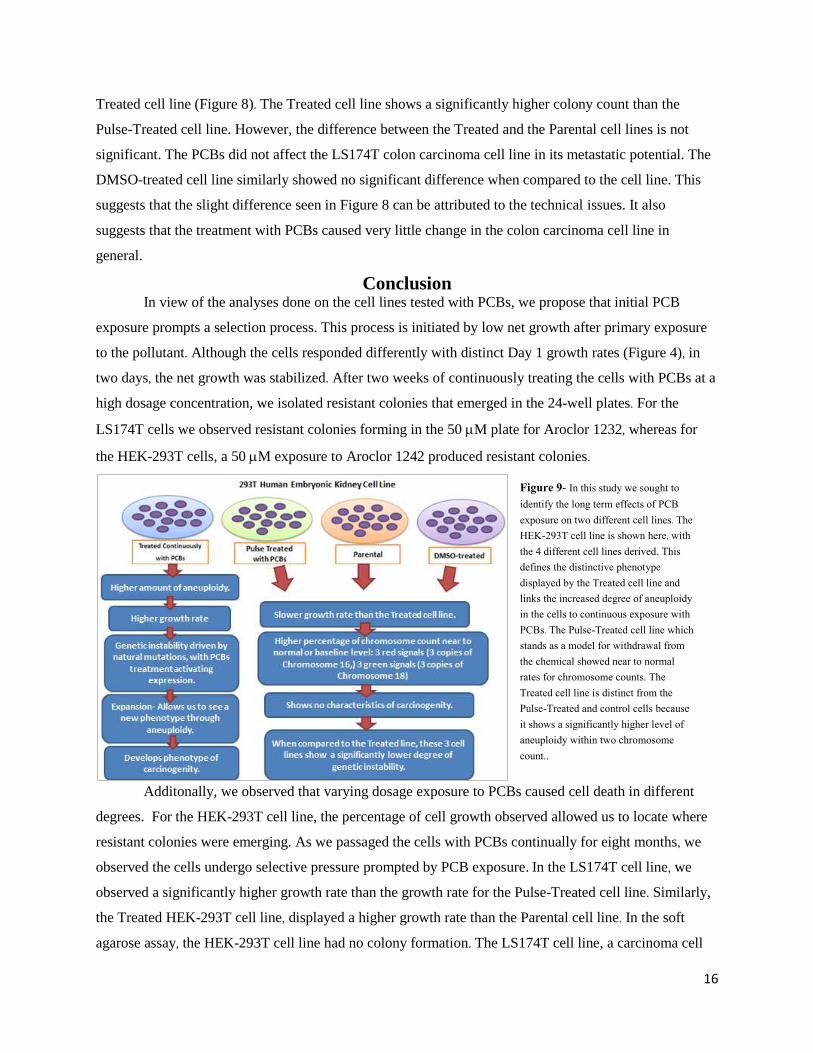
Figure 9- In this study we sought to
identify the long term effects of PCB exposure on two different cell lines. The HEK-293T cell line is shown here, with the 4 different cell lines derived. This defines the distinctive phenotype displayed by the Treated cell line and links the increased degree of aneuploidy in the cells to continuous exposure with PCBs. The Pulse-Treated cell line which stands as a model for withdrawal from the chemical showed near to normal rates for chromosome counts. The Treated cell line is distinct from the Pulse-Treated and control cells because it shows a significantly higher level of aneuploidy within two chromosome count..

17
line, which was expected to form colonies, showed colony formation for the Treated cell line. This colony
formation was significantly higher than the colony formation calculated for the Pulse-Treated cell line.
However, we did not observe a significant difference between the Treated and the Parental cell line for
colony formation. We conducted thousand nuclei set analysis of centromere counts for two chromosomes
i.e. Chromosome16 and 18. Both have been linked with abnormalities in human studies [20, 21]
. The HEK-
293T cell line displayed a significantly higher aneuploidy count for both chromosomes. The LS174T cell
line, showed only a slightly higher aneuploidy count than the controls used. This allows us to conclude
that the HEK-293T cell line has mostly been affected by the continuous PCB exposure through the
development of carcinogenic capacity as is.
Primary Resistance to Exposure
The goal of this study was to determine the effects of a portion of the large Aroclor family: Aroclor
1242, 1232, 1260, 1262, 1254, and 1248, on two established cell lines. From the graphs we concluded that
the LS174T and the HEK-293T cells were affected by PCBs in the first three days of exposure. While the
HEK-293T showed massive cell death on Day 1 of treatment, the LS174T showed little change in growth
on Day 1. There was less of cell death by Day 3, as resistant cells emerged.
We originally conducted growth curves to evaluate the concentration at which the cells were able
to gain resistance. An underlying mechanism favored their growth in such stressful conditions. For this
portion of the project, we sought the highest concentration of the PCBs at which the cells were capable of
growing. In the two cell lines we found that they gained resistance to particular isoforms of the Aroclor at
the highest concentration of 50 M. It was determined that the cells were affected at varying degrees in
the other treatment concentrations. Our objective was to look for the highest concentration of treatment at
which we would isolate cells resistant to the PCB treatment. It is probable that the colonies emerged from
single cell survivors that had a genetic makeup that allowed for their survival. This process of selection
was observed in both standardized cell lines used. Based on the rise of the resistant colonies in the plates
at the end of two weeks, we established two cell lines derived from the original resistant colonies.
Dosage Response Trends in Cell Growth
The dosage response curves show trends in the different concentrations of the polychlorinated
biphenyls when exposed to the cells. The highest concentration of PCB treatment (50 M) was shown to
have prompt a lower net growth rate than cells grown in lower concentrations such as 10 M. Both the
dose response curve and the primary PCB exposure in the 24-well plates manifest the development of
distinct cell lines used for their selective growth advantage and drug resistance.
Passaging with Prolonged Exposure the Original Resistant Colonies
Once resistance was established as seen from the dose-response curves, the cell lines were
passaged into two separate cell lines: one with continual treatment with PCBs, and the other with pulse-
18
treatment. The experiments conducted following this passaging displayed an accumulation of further
abnormalities in such cell lines which will make them oncogenic and distinct from the parental and
DMSO-treated cell lines.
Comparison of the Growth Rates of the Cell Lines
After several passages, we compared the growth rates of the treated lines. For both HEK-293T
cell lines and the LS174T cell lines, the treated cell lines showed a capacity to proliferate at a faster rate
than the pulse treated cell line and the two controls (Figure 6). The cell line continuously treated with
PCBs displayed a growth rate that is significant above all the other cell lines that are not in the presence
of PCBs. This comparative study suggested that PCBs may be inducing a higher growth rate. The
mechanism that could possibly lead to this growth advantage is the cells up-regulating preexisting genes
that regulate the mitogenic signals of cells. In The Hallmarks of Cancer, Weinberg discusses the
importance of a cancer cells ability to bypass growth regulators through the formation of growth factor
ligands and the activation of signaling pathways downstream of these ligand accepting receptors [3]
. By
following up on this, a future study could focus on the genes connected to mitotic signaling.
Anchorage-Independent Growth
While characterizing cancer cells, it is important to refer to their capability in evading the effects
of growth suppressors. To develop on the issue of the progression to carcinogenity we looked at
anchorage independent growth in the cells. When a cell is detached from neighboring cells it is incapable
of growing. In metastatic cells, the cells are capable of growing without any contact with other cells. For
anchorage-independent growth, the 293T cells did not show any colony formation. This may be due to the
fact that the 293T is not a carcinogenic cell line. For the LS174T cell line, however, the data suggests that
a high number of colonies were capable of forming for the Treated cell lines and the Parental. The pulse-
treated cell line had the fewest colonies forming. The PCB-Treated cell line and the Parental cell lines
displayed the highest number of colonies formed. However when compared statistically, we found that the
slightly higher colony formation data for the Treated cell line was not significant. The two cell lines were
comparable in the treatment they were given, however without a significant difference between the treated
and the parental, we can assume that the PCBs had not affected these cells by giving them the capability
to metastasize as higher colony formation in soft agarose would otherwise suggest. The pulse treated cell
line presents a slower rate of colony formation that remained quite distinct from the Treated line. This
suggested that a withdrawal from the original resistant clones had not conferred a high level of metastatic
potential.
Continuous PCB Exposure and the Degree of Genetic Instability Induced
Initially, we observed the process of clonal selection, where certain cells acquired resistance to
the highest concentrations of PCBs. Directly correlated to this selective growth advantage is genetic
19
instability which directly drives this growth even after so many passages. In some cancers, aneuploidy is
evident. However, it is not clear as to whether aneuploidy is a consequence of or is a causative factor of
cancer. Research has shown that numeric aberrations in chromosome count, aneuploidy, is usually found
in cancers. The induction of aneuploidy has been correlated with the mutation of several mitotic genes [24]
.
By witnessing an elevated degree of aneuploidy in the cells, we can conclude that the cell has gone
through a transformation, driven by a chromosomal mutation event [14]
.
To prove that the experimental groups became unstable due to PCB exposure, we assessed copy
number of two chromosome centromeres to measure their frequencies in varying signal patterns.
Interphase nuclei were analyzed using fluorescence in situ hybridization (FISH), to specifically look for
the centromere signal counts for chromosome 16 and 18. In previous karyotyping studies, these two
chromosomes had a normal copy number [12, 13]
. We found significantly higher aneuploidy counts for the
293T cells treated persistently with PCBs. In the LS74T cell line, the level of aneuploidy was barely
discernible from the aneuploidy rates for the other three cell lines. We conclude that the lack of
concordance between the aneuploidy rate for the LS174T cell line and the level of carcinogenesis is a
result of this cell already being carcinogenic.
Previous research has proven that the higher the aneuploidy count observed in a cell line, the
more genetically unstable is its karyotype [24]
. Thus, it can be assumed through the aneuploidy rates seen
in the PCB-treated 293T cells, that persistent exposure is not only conferring “genetic instability” onto the
cells, but also “mutability,” a characteristic that renders capable of changing more often.
What lies distinct in this study is that it addresses PCB exposure to resistant clones over the
course of several passages and analyzes for changes on the cellular level. The study investigated the types
of abnormalities that aggregated in the cells. In addition, we are analyzing the effects of PCBs during
primary exposure. By characterizing the fates of the cells in such a long-term study, the PCBs were given
a different role through which they conferred a selective growth advantage. With the combined data, two
distinct cell lines have been formed: one with consistent PCB exposure, and the other withdrawn from
PCB exposure. Despite the different treatment of these cell lines, they were derived from the original
resistant colonies. We hypothesized that withdrawal of PCB exposure would cause the cells to revert back
to their normal phenotype. Our analyses of later passages demonstrated that continuous exposure led to
the development of genetic instability and accelerated growth for the HEK-293T cells. The Pulse-Treated
cell line has shown a smaller degree of accelerated growth and aneuploidy rates than the Treated cell line.
This suggests that withdrawal of PCB exposure from original resistant colonies leads to a return to near
normal characteristics for these cells. Thus, the Parental and Pulse-Treatment data are very similar. This
connection adds to the importance of continual in vitro treatment of resistant cells. The cells developed a
phenotype of instability that permitted the 293T cell’s transformation from normal to cancerous.
20
The classical theory of carcinogenesis involves three steps which are: initiation, promotion, and
progression [28]
. The constant exposure of the chemical to the different cell lines served as the promotion
step, where the resistant cells were expanded and treated simultaneously. This presents us with the
possibility that the changes within the cell line were not entirely a genotoxic contribution, where the
chemical affects the genetic material directly. In previous studies, other pollutants such as arsenic have
been shown to induce carcinogenesis without a genotoxic contribution but rather with activation of the
stress gene expression factors [20]
. This opens up the possibility that PCB exposure has not only introduced
an abnormal chromosome copy number, but also DNA damage and epigenetic changes. It is possible that
chemical induced stress that has driven the cells to acquire alternations in gene expression permit
successful growth. In addition, we cannot limit genetic instability to aneuploidy, as there may be
deleterious mutations, deletions, chromosomal breakages, and amplification of particular genes that result
in the Treated cells ability to grow faster than normal cells.
For future studies we will look at the changes in gene expression levels in the cell lines by using
gene expression arrays. Our goal would be to identify differentially expressed genes among the cell lines.
We also propose looking for pathways which drive tumorigenesis in the PCB-treated cells. The ‘Parallel
Pathways to Tumorigenesis’ figure, displays a high variability among the pathways taken to complete
tumorigenesis. [3]
A comparison among the cell lines will give us a better understanding of specific genes
connected to PCB-induced effects. Since we already established genetic instability using a two
chromosome analyses, we will use karyotyping to map out the full extent of genetic instability. The
karyotype analysis will be done using the HEK-293T cells, because this cell line showed distinct copy
number counts for the Treated cells. In order to uncover the cause for such chromosomal instability, we
will be looking for what drives such cellular abnormalities.
Previous research has extensively covered the linkage between PCB exposure and tumor
formation in animal models. This broad range of research pertains to characterizing PCBs as a tumor
promoter. However this research project differs from previous studies tracking cancer progression. In
summary, our analyses provides a framework for PCB-induced carcinogenesis after long term exposure
not only as result of epigenetic changes but also as direct DNA reactivity [32]
. The time frame for this
study opens up the possibility for the PCBs to induce further cellular changes.
We have established that PCBs are a family of environmental carcinogens which in long-term
exposure induce resistant cells to express abnormalities that permit accelerated growth. For a cell line to
evolve with aneuploidy as a marker for its transformation there may be mutations involved. Our objective
in using RNA expression differences between the cell lines will define what mutations correlate to this
abnormality. From the first experiment displaying a process of clonogenic selection through the
chromosome count analysis, our research has shown that the experimental cells have acquired or induced

21
the expression of intrinsic mutations which allowed for the Treated cell lines to develop a phenotype of
carcinogenity. To further elucidate the reason for such abnormalities, research is needed to identify the
mutations that are related to this genetic instability and the formation of carcinogenic potential.
Acknowledgements
Many thanks to the Chan Lab for providing me with a lab bench to work in and the time and materials
needed to formulate my project and make it a reality. They assisted with all the questions I had regarding
the research process and helped with establishing the way to approach my project and plan the next
logical step based on the data. The Cytogenetics Core Facility has also assisted with the FISH procedure
analysis. They taught me how to interpret signals, compile the signaling data into charts and make the data
coherent. I am grateful for the guidance provided to me by my Research class teacher, in formulating
logical conclusions regarding my data. I would like to thank my research mentor for patiently answering
every question I came up with.. Today, I am set on continuing research in the future and using my
knowledge and experiences from the past two years to make myself a better researcher.
22
References
1. Reymann S, Borlak J. Transcriptome et al.- Profiling of human hepatocytes treated with Aroclor
1254 reveals transcription factor regulatory networks and clusters of regulated genes.
2. Shin KJ, Kim SH, Kim D, Kim YH, Lee HW, Chang YS, Gu MB, Ryu SH, Suh PG. et al.-
2,2',4,6,6'-Pentachlorobiphenyl induces mitotic arrest and p53 activation.
3. Hanahan D, Weinberg RA. et al.- Hallmarks of cancer: the next generation.
4. Al-Anati L, Högberg J, Stenius U. et al.- Non-dioxin-like PCBs interact with benzo[a]pyrene-
induced p53-responses and inhibit apoptosis.
5. Glauert HP, Tharappel JC, Lu Z, Stemm D, Banerjee S, Chan LS, Lee EY, Lehmler HJ, Robertson
LW, Spear BT. et al.- Role of oxidative stress in the promoting activities of pcbs.
6. Rajagopalan H, Jallepalli PV, Rago C, Velculescu VE, Kinzler KW, Vogelstein B, Lengauer C. et
al.- Inactivation of hCDC4 can cause chromosomal instability.
7. Xia C, Lam JC, Wu X, Xie Z, Lam PK. et al.- Polychlorinated biphenyls (PCBs) in marine fishes
from China: Levels, distribution and risk assessment.
8. Fredslund SO, Bonefeld-Jørgensen EC. et al.- Breast cancer in the Arctic - changes over the past
decades.
9. Antonio TA, Edith RP, Rogelio FR, Fernando DB, Catalina OA, Nelinho PM. et al.-
Assessment of persistent organic pollutants levels in blood samples from Quintana Roo, Mexico.
10. Engler RE. et al.- The Complex Interaction between Marine Debris and Toxic Chemicals in the
Ocean.
11. Chang F, Pagano JJ, Crimmins BS, Milligan MS, Xia X, Hopke PK, Holsen TM. et al.
Temporal trends of polychlorinated biphenyls and organochlorine pesticides in Great Lakes fish,
1999-2009.
12. L. Bylund, S. Kytola, W.O.Lui, C. Larsson and G. Weber et al.- Analysis of the cytogenetic
stability of the human embryonal kidney cell line 293 by cytogenetic and STR profiling
approaches
13. Lynne P. Rutzky, Celia I. Kaye, Michael Siciliano et al.- Longitudinal Karyotype and Genetic
Signature Analysis of Cultured Human Colon Adenocarcinoma Cell Lines LS180 and LS174t
14. Sen, S et al.- Aneuploidy and cancer
15. Liu S., Li S., Du Y. et al.- Polychlorinated Biphenyls (PCBs) Enhance Metastatic Properties of
Breast Cancer Cells by Activating Rho-Associated Kinase (ROCK)
16. Wang LH et al.- Molecular signaling regulating anchorage-independent growth of cancer cells.
17. Guadamillas M, Cerezo A, Pozo M. et al.- Overcoming anoikis – pathways to anchorage-
independent growth in cancer)

23
18. Hou H, Zhao L, Zhang J, Xu YF, Yan ZG, Bai LP, Li FS. et al.- Organochlorine pesticides and
polychlorinated biphenyls in soils surrounding the Tanggu Chemical Industrial District of Tianjin,
China.
19. Kitanaka C, Kuchino Y et al.- Caspase-independent programmed cell death with necrotic
morphology.
20. Ding M et al.- Predisposing factors in occupational lung cancer: inorganic minerals and
chromium.
21. Benn P. et al.- Trisomy 16 and trisomy 16 Mosaicism: a review.
22. Cereda A, Carey JC. et al.- The trisomy 18 syndrome.
23. Lin CH, Huang CL, Chuang MC, Wang YJ, Chen DR, Chen ST, Lin PH. et al.- Protective role of
estrogen receptor-alpha on lower chlorinated PCB congener-induced DNA damage and repair in
human tumoral breast cells.
24. Duesberg P, Rausch C, Rasnick D, Helhmann R et al.- Genetic instability of cancer cells is
proportional to their degree of aneuploidy.
25. Robertson L W, Ludewig G et al.- Polychlorinated Biphenyl (PCB) carcinogenity with special
emphasis on airborne PCBs.
26. Fuberg AS, Sandanger T, Thune I, Burkow IC, Lun E et al.- Fish consumption and plasma levels
of organochlorines in female population in Northern Norway.
27. Bishop R et al.- Application of fluorescence in situ hybridization (FISH) in detecting genetic
aberrations of medical significance.
28. Caligur V et al.- Carcinogenesis and Epigenetics
29. "Hudson River PCBs Superfund Site | US Environmental Protection Agency." US Environmental
Protection Agency. http://www.epa.gov/hudson/
30. "Drinking Water Contaminants | Drinking Water Contaminants | US EPA." Home | Water | US
EPA. <http://water.epa.gov/drink/contaminants/index.cfm>.
31. "National Primary Drinking Water Regulation." U.S. Environmental Protection Agency.
<www.epa.gov/ogwdw/consumer/pdf/mcl.pdf>.
32. Whysner J, Montandon F, McClain RM, Downing J, Verna LK, Steward RE 3rd, Williams GM et
al.- Absence of DNA adduct formation by phenobarbital, polychlorinated biphenyls, and
chlordane in mouse liver using the 32P-postlabeling assay.