Integration Guide: Varonis and Splunk
2
Contents
Chapter 1: About the Varonis DatAlert app and technology add-on for Splunk ............................................. 3
Prerequisites......................................................................................................................................... 3
Technical support ................................................................................................................................. 3
Chapter 2: Configuring DatAlert to send alerts to Splunk ............................................................................ 4
Configuring syslog message forwarding .................................................................................................. 4
Using the predefined Splunk template .................................................................................................... 4
Selecting an alert method for a single rule .............................................................................................. 5
Selecting an alert method for multiple rules ........................................................................................... 5
Chapter 3: Installing the Varonis technology add-on and app for Splunk ..................................................... 6
Downloading the Varonis technology add-on and DatAlert app for Splunk ................................................ 6
Installing the Varonis technology add-on for Splunk ................................................................................ 6
Installing the Varonis DatAlert app for Splunk ......................................................................................... 7
Configuring a new Splunk UDP listener ................................................................................................... 7
Configuring an existing Splunk UDP listener ............................................................................................ 8
Optimizing for a dedicated index ............................................................................................................ 9
Verifying installation .............................................................................................................................. 9
Chapter 4: Using the Varonis DatAlert app for Splunk ............................................................................... 10
Accessing the Varonis app for Splunk ................................................................................................... 10
Understanding the alert dashboard window .......................................................................................... 10
Understanding the time filters .............................................................................................................. 11
Viewing alerts over time ....................................................................................................................... 12
Viewing the Drill-Down Dashboards ..................................................................................................... 13
Viewing detailed information about alerts ............................................................................................. 13
Chapter 5: Event Mapping ....................................................................................................................... 14
Chapter 6: CIM Data Model Mapping ....................................................................................................... 19
Chapter 7: Troubleshooting..................................................................................................................... 25
Connectivity problems ........................................................................................................................ 25
Drill-down problems ............................................................................................................................ 27
Escalation requirements ...................................................................................................................... 28

3
Chapter 1: About the Varonis DatAlert app and technology add-on for Splunk The Varonis Technology add-on (TA) for Splunk and the Varonis DatAlert app for Splunk enables integrating
the Varonis DatAlert functionality into Splunk enterprise.
Both the Varonis DatAlert app and TA provide field extractions and dashboards that enable you to locate
notable Varonis alerts directly from the Splunk user interface, and then drill down into Varonis DatAlert to
get additional insights into the alert and the context in which it was generated. Additionally, they include
field extractions that assist users in querying and visualizing Varonis alerts using Splunk enterprise.
The Varonis DatAlert app and TA are Splunk CIM compliant, which enables correlating the Varonis alerts with
other events collected by Splunk enterprise. This also enables incorporating Varonis alerts in Splunk
enterprise Security (ES).
The Varonis Technology add-on for Splunk has incorporated parts of CEFUtils - Common Event Format
Extraction Utilities (https://splunkbase.splunk.com/app/487/).
Prerequisites
Various prerequisites are required to install and configure the Varonis Technology add-on and app for Splunk
and configure DatAlert to send alerts to Splunk.
Ensure you meet the following prerequisites:
• The following must be installed and running on your company's server:
• Splunk enterprise 7.1
• Data Security Platform versions 6.2 and higher (DatAlert must be installed)
• To configure DatAlert to send alerts to Splunk, the user must have the DL Configuration role.
• To configure the Varonis DatAlert app for Splunk, the user must be the Splunk admin user.
Technical support
For further information or technical assistance, contact Varonis Support.
4
Chapter 2: Configuring DatAlert to send alerts to Splunk You can configure DatAlert to send alerts to the Varonis DatAlert app for Splunk.
Configuring syslog message forwarding
You can configure the Syslog server address in DatAlert so that alerts are sent to Splunk. To configure the
Syslog server address in DatAlert:
1. In DatAdvantage, select Tools > DatAlert. DatAlert is displayed.
2. From the left menu, select Configuration.
3. In Syslog Message Forwarding, do as follows:
• Syslog server IP address - The IP address of the Splunk server on which you plan to set up a UDP
listener.
• Port - The port on which the Splunk server will be listening.
4. Click OK.
Using the predefined Splunk template
For DatAlert versions higher than 6.3.170, DatAlert provides a predefined alert template for Splunk.
To define a template for DatAlert versions higher than 6.3.170:
1. Ensure that you have configured Syslog message forwarding.
2. In DatAlert, from the left menu, click Alert Templates. The Alert Templates window is displayed.
3. In the table, select Varonis App for Splunk.
4. In the toolbar, click Edit Alert Template. The Edit Alert Template dialog box is displayed.
5. In Apply to Alert Templates, select Syslog message.
6. Click OK, and then OK again.
Note: To configure DatAlert to send alerts to Splunk, the user must have the DL
Configuration role.
Note: Integration was tested only over UDP.
5
Selecting an alert method for a single rule
You can select the alert method, which is the means by which the alert is transferred. For the Varonis app for
Splunk, the alert is transferred by creating a Syslog message. To select an alert method for a single rule, do
as follows:
1. Ensure that you have defined a new template.
2. In DatAlert, in the Rules table, select the rule and then from the toolbar, click Edit Rule. The Rule
Editing menu is displayed.
3. From the left menu, select Alerts Method. The Alert Method window is displayed.
4. Select Syslog message.
5. Click OK.
Selecting an alert method for multiple rules
You can select the alert method for multiple rules simultaneously. To select the alert method for multiple
rules:
1. Ensure that you have defined a new template.
2. In DatAlert, in the Rules table, select the rules, and then from the toolbar, click Edit Rule . The Rule
Editing menu is displayed.
3. From the left menu, select Alerts Method. Note that the window's contents are disabled for
selection.
4. To enable Syslog message for selection, click the edit icon and select the checkbox.
5. Click OK.

6
Chapter 3: Installing the Varonis technology add-on and app for Splunk Installing the Varonis technology add-on and app for Splunk enables integrating the Varonis DatAlert
functionality into Splunk enterprise.
Downloading the Varonis technology add-on and DatAlert app for Splunk
Prior to installation, you must first download the Varonis Technology add-on and DatAlert app for Splunk.
To download the Varonis Technology add-on and DatAlert app for Splunk:
1. Ensure that you have configured DatAlert to send alerts to Splunk.
2. Browse to https://www.varonis.com/products/splunk-app, and download the Varonis app for Splunk
and the Varonis Technology add-on for Splunk.
3. Place the downloaded zip files in a temporary folder.
Installing the Varonis technology add-on for Splunk
Installing the Varonis Technology add-on for Splunk enables integrating the Varonis DatAlert functionality
into Splunk enterprise.
To install the Varonis Technology add-on for Splunk:
1. Ensure that you have downloaded the Varonis Technology add-on and DatAlert app for Splunk.
2. In your local Splunk installation, access the main page.
3. Next to Apps, click the gear icon. The Apps window is displayed.
4. Click Install App from File. The Upload an App window is displayed.
5. Click Browse and browse for the Varonis Technology add-on for Splunk zip file you downloaded.
6. Select the file and click Upload.

7
7. If you are prompted to restart Splunk enterprise, then do so.
8. In the Apps window, you should have Technology add-on for Varonis DatAlert listed in the list of
apps. The app is installed.
Installing the Varonis DatAlert app for Splunk
Installing the Varonis DatAlert app for Splunk enables integrating the Varonis DatAlert functionality into
Splunk enterprise.
To install the Varonis DatAlert app for Splunk:
1. Ensure that you have downloaded the Varonis App for Splunk.
2. In your local Splunk installation, access the main page.
3. Next to Apps, click the gear icon. The Apps window is displayed.
4. Click Install App from File.
5. The Upload an App window is displayed.
6. Click Browse and browse for the Varonis app for Splunk zip file you downloaded.
7. Select the file and click Upload.
8. If you are prompted to restart Splunk enterprise, then do so.
9. In the Apps window, you should have Varonis DatAlert app for Splunk listed in the list of apps.
The app is installed.
Configuring a new Splunk UDP listener
You can configure a new UDP listener, enabling the installed app to correctly receive the Syslog messages
from DatAlert.
Alternatively, you can use an existing listener by configuring the existing Splunk UDP listener.
1. Ensure that you have installed the Varonis DatAlert app for Splunk.
2. In your local Splunk installation, access the main page.
3. From the top menu, select Settings > Data Inputs. The Data Inputs window is displayed.
4. In the UDP row, in the Action column, click Add New.
The Add Data window is displayed. The TCP and UDP selections are displayed on the right.
8
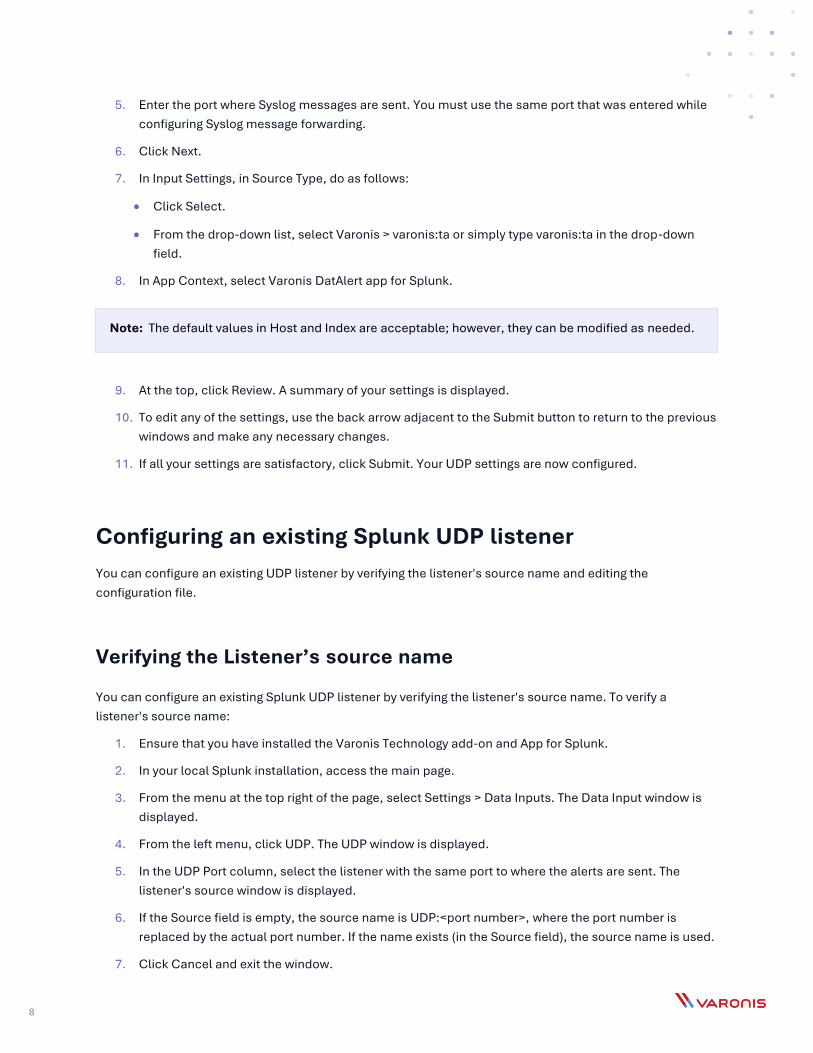
5. Enter the port where Syslog messages are sent. You must use the same port that was entered while
configuring Syslog message forwarding.
6. Click Next.
7. In Input Settings, in Source Type, do as follows:
• Click Select.
• From the drop-down list, select Varonis > varonis:ta or simply type varonis:ta in the drop-down
field.
8. In App Context, select Varonis DatAlert app for Splunk.
9. At the top, click Review. A summary of your settings is displayed.
10. To edit any of the settings, use the back arrow adjacent to the Submit button to return to the previous
windows and make any necessary changes.
11. If all your settings are satisfactory, click Submit. Your UDP settings are now configured.
Configuring an existing Splunk UDP listener
You can configure an existing UDP listener by verifying the listener's source name and editing the
configuration file.
Verifying the Listener’s source name
You can configure an existing Splunk UDP listener by verifying the listener's source name. To verify a
listener's source name:
1. Ensure that you have installed the Varonis Technology add-on and App for Splunk.
2. In your local Splunk installation, access the main page.
3. From the menu at the top right of the page, select Settings > Data Inputs. The Data Input window is
displayed.
4. From the left menu, click UDP. The UDP window is displayed.
5. In the UDP Port column, select the listener with the same port to where the alerts are sent. The
listener's source window is displayed.
6. If the Source field is empty, the source name is UDP:<port number>, where the port number is
replaced by the actual port number. If the name exists (in the Source field), the source name is used.
7. Click Cancel and exit the window.
Note: The default values in Host and Index are acceptable; however, they can be modified as needed.
9
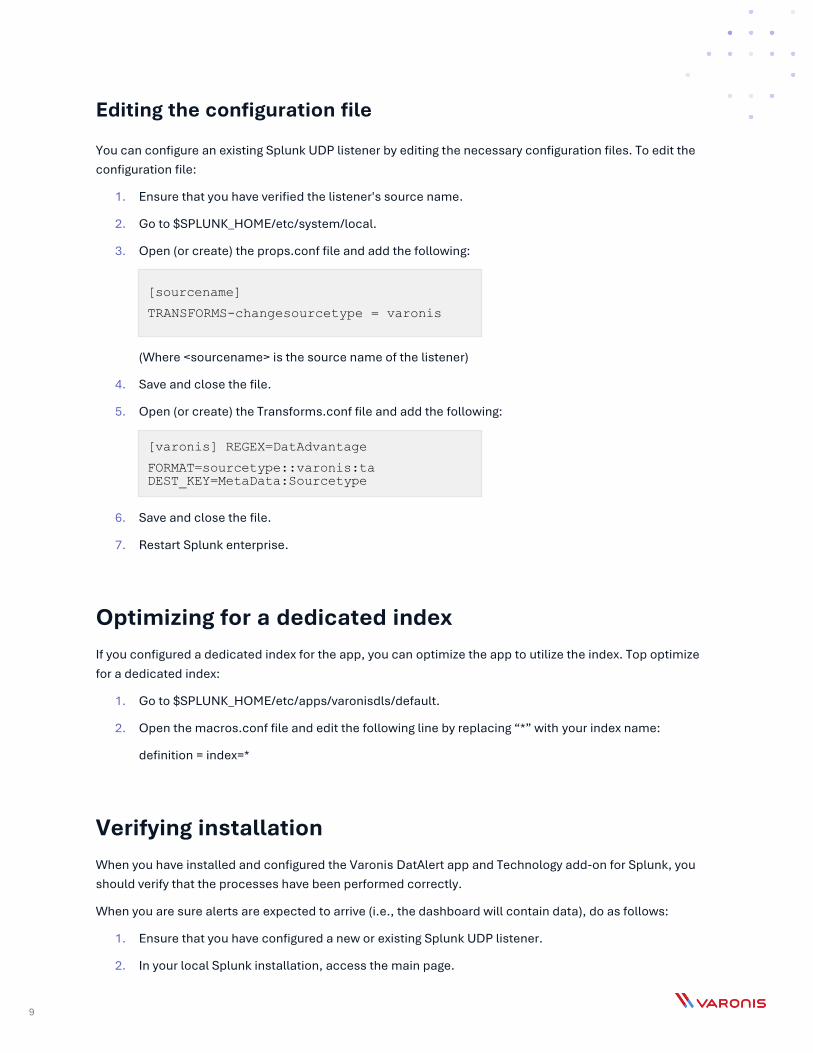
Editing the configuration file
You can configure an existing Splunk UDP listener by editing the necessary configuration files. To edit the
configuration file:
1. Ensure that you have verified the listener's source name.
2. Go to $SPLUNK_HOME/etc/system/local.
3. Open (or create) the props.conf file and add the following:
(Where <sourcename> is the source name of the listener)
4. Save and close the file.
5. Open (or create) the Transforms.conf file and add the following:
6. Save and close the file.
7. Restart Splunk enterprise.
Optimizing for a dedicated index
If you configured a dedicated index for the app, you can optimize the app to utilize the index. Top optimize
for a dedicated index:
1. Go to $SPLUNK_HOME/etc/apps/varonisdls/default.
2. Open the macros.conf file and edit the following line by replacing “*” with your index name:
definition = index=*
Verifying installation
When you have installed and configured the Varonis DatAlert app and Technology add-on for Splunk, you
should verify that the processes have been performed correctly.
When you are sure alerts are expected to arrive (i.e., the dashboard will contain data), do as follows:
1. Ensure that you have configured a new or existing Splunk UDP listener.
2. In your local Splunk installation, access the main page.
[sourcename]
TRANSFORMS-changesourcetype = varonis
[varonis] REGEX=DatAdvantage
FORMAT=sourcetype::varonis:ta DEST_KEY=MetaData:Sourcetype

10
3. Verify that Varonis DatAlert app for Splunk and Technology add-on for Varonis DatAlert are displayed
on the left.
4. If the Varonis DatAlert app for Splunk is displayed, click it. The Alert dashboard is displayed.
5. If Varonis DatAlert app for Splunk is not displayed, or the dashboard is empty, review your
installation procedures.
Chapter 4: Using the Varonis DatAlert app for Splunk The Varonis DatAlert app for Splunk provides field extractions and dashboards that enable you to locate
notable Varonis alerts directly from the Splunk user interface, and then drill down into Varonis DatAlert to
get additional insights into the alert and the context in which it was generated.
Accessing the Varonis app for Splunk
You can access the Varonis app for Splunk to view its dashboards, locate notable Varonis alerts, and drill
down into Varonis DatAlert.
To access the Varonis app for Splunk:
1. Ensure that you have installed the Varonis Technology add-on and App for Splunk.
2. In your local Splunk installation, access the main page.
3. From the left, click Varonis DatAlert app for Splunk.
The Alert Dashboard is displayed.
Understanding the alert dashboard window
The Alert Dashboard enables you to view "at a glance" the top alerted users, assets, devices, and threat
models that match the specified search criteria/timeframe.
It enables you to quickly view and detect suspicious activity for further analysis. The Top Alerted Users, Top
Alerted Assets, Top Alerted Devices and Top Alerted Threat Models areas of the dashboard each display
entities, sorted by the number of alerts generated for that entity. The entity with the most alerts appear at the
top of each list. The color represents the alert with the highest severity on this entity.
Note: Before you start using the Varonis DatAlert app for Splunk, ensure that it is installed and
configured. You must be the admin user to configure the Varonis DatAlert app for Splunk.

11
Access the Alert Dashboard window.
The Alert Dashboard comprises the following elements:
• Alerts Over Time - A stacked bar chart illustrating the dispersion of alerts matching the defined
timeframe.
• Top Alerted Users - A list of the top alerted users sorted by the number of alerts.
• Top Alerted Assets - A list of the top alerted assets sorted by the number of alerts.
• Top Alerted Threat Models - A list of the top alerted threat models sorted by the number of alerts.
• Top Alerted Devices - A list of the top alerted devices sorted by the number of alerts.
For additional options that you can perform on the elements, refer to the following (more information
regarding these and other options can be found in the Splunk documentation): - A list of up the top alerted
devices sorted by the number of alerts.
• - Export a list of all alerts in the table to a CSV file.
• - Refresh the contents of the list.
Understanding the time filters
Time filters enable setting time boundaries on your searches.
You can restrict a search with preset time ranges, create custom time ranges, specify time ranges based on
date or date and time, or work with advanced features in the time filters.
To access the time filters, from the top of the dashboard, click All Time. The time filter is displayed.
• Presets - Built-in time ranges options. You can select from a list of real-time windows, relative time
ranges, or All Time (no time filtering).
Note: The remaining options are all custom time filters.
Note: The elements are independent of one another. For instance, the top alerted user may not be
associated with the top alerted asset or threat model.
Note: Only a summary of the time filtering functionality is presented here. For a complete picture, refer
to the Splunk documentation.

12
• Relative - Specify a custom time range for your search that is relative to the current time. You can
select from the list of time range units, for example, seconds ago, minutes ago, etc.
• Real Time - Specify the start time for your real-time time range window.
• Date Range - Specify calendar dates in your search. You can choose among options to return events:
Between a beginning and end date, Before a date, and Since a date.
• Date and Time Range - Specify calendar dates and times for the beginning and ending of your search.
• Advanced - Enables you to perform a more advanced search.
Viewing alerts over time
The Alerts dashboard enables you to view a stacked bar chart illustrating the dispersion of alerts over a
specified period of time.
Each bar in the chart displays up to three severities, divided into stacks. Each stack represents a different
severity - high, medium or low. The color code represents the severity of the alert:
• Red - High severity. Alerts with a severity of Emergency, Alert or Critical.
• Orange - Medium severity. Alerts with a severity of Error or Warning.
• Green - Low severity. Alerts with a severity of Notice, Informational and Debug.
To view alerts over time, do as follows:
1. Ensure that you have installed the Varonis Technology add-on for Splunk and configured DatAlert to
send alerts to Splunk.
2. Access the Varonis App for Splunk.
The Alerts Dashboard window is displayed. The Alerts Over Time area is at the top.
3. To focus on alerts from a specific severity, click the relevant severity from the legend on top of the
chart. This will open a new search with the selected severity.
4. To view the number of alerts retrieved per severity, hover the mouse over the relevant bar. The
number of alerts per severity is displayed.
5. To change the timeframe, click the All time drop-down list on the top of the page, and select one of
the options.
Note: This may be useful if you want to focus on high severities only.
13
Viewing the Drill-Down Dashboards
The drill-down dashboards enable you to take a closer look at selected entities in the Alerts dashboard.
By selecting a top alerted entity, either asset, user, threat model, or device, you can access a complete list
of all alerts on that entity within the selected timeframe.
To view the drill-down dashboards, do as follows:
1. Access the Varonis App for Splunk.
2. The Alerts Dashboard window is displayed.
3. Click the row of an entity for which you want a closer look.
4. The drill-down dashboard for that entity is displayed. For example: The window comprises two areas:
• Timeline - An "alerts over time" graph for the selected entity and timeframe.
• Alerts List - A list of all alerts for that entity, listed with the user, severity, and rule.
5. If needed, change the timeframe of the alerts.
6. To view detailed information regarding the alert, click the relevant alert in the list.
Viewing detailed information about alerts
The Varonis Web Interface enables you view relevant information regarding alerts. To view the detailed
information about alerts:
• From the relevant drill-down dashboard, click the relevant alert.
• The Varonis Web Interface displays the Alert Info page. This window enables you to drill down and
analyze the details of each alert that matches your search criteria. It enables you to streamline your
investigation and make a quick and informed decision regarding whether the activity is malicious or
legitimate.
Note: Alerts might be available in Splunk before they are available in the Varonis Web Interface.
If this is so, attempting to view the drill-down dashboards in the Varonis Web Interface will
display an error message.
Note: This step is only for customers running the Varonis Web Interface.
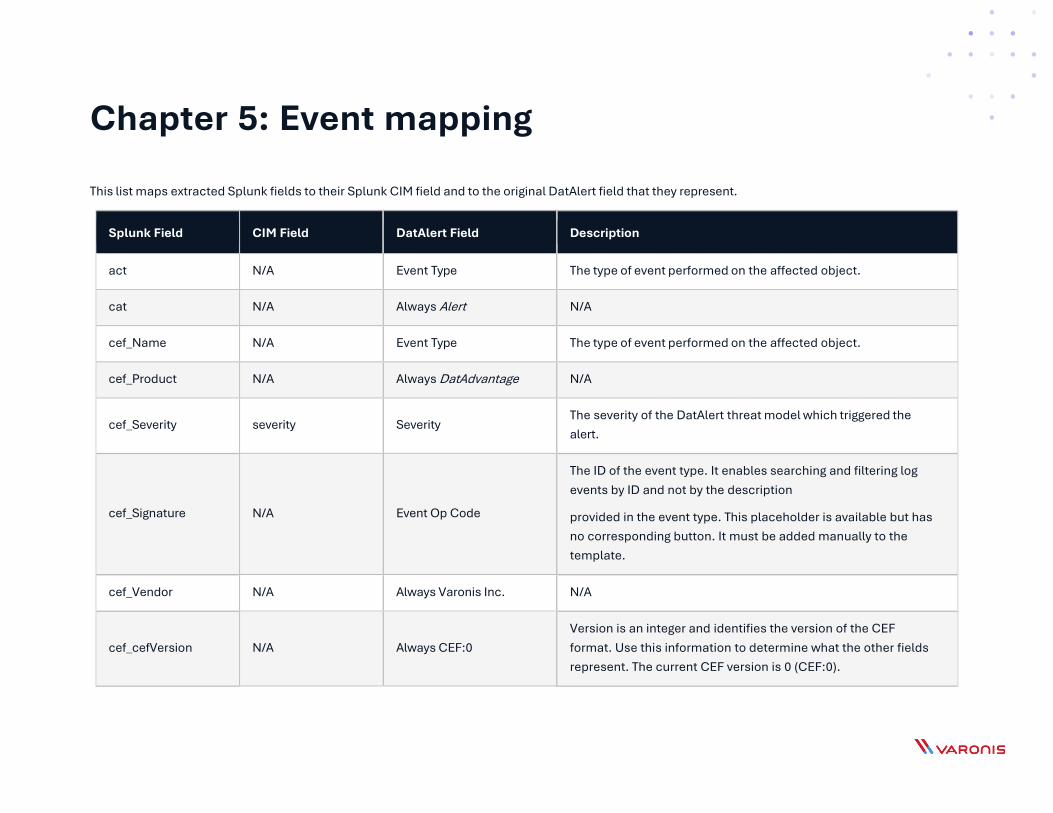
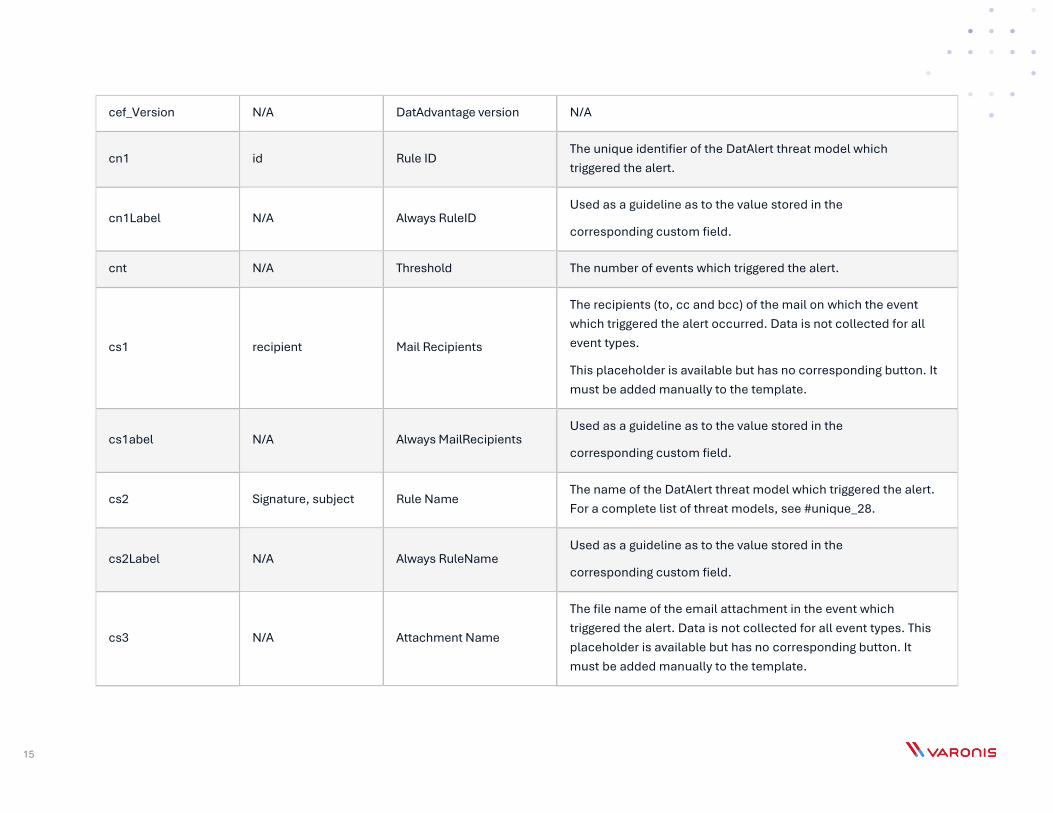
Chapter 5: Event mapping
This list maps extracted Splunk fields to their Splunk CIM field and to the original DatAlert field that they represent.
Splunk Field CIM Field DatAlert Field Description
act N/A Event Type The type of event performed on the affected object.
cat N/A Always Alert N/A
cef_Name N/A Event Type The type of event performed on the affected object.
cef_Product N/A Always DatAdvantage N/A
cef_Severity severity Severity The severity of the DatAlert threat model which triggered the
alert.
cef_Signature N/A Event Op Code
The ID of the event type. It enables searching and filtering log
events by ID and not by the description
provided in the event type. This placeholder is available but has
no corresponding button. It must be added manually to the
template.
cef_Vendor N/A Always Varonis Inc. N/A
cef_cefVersion N/A Always CEF:0
Version is an integer and identifies the version of the CEF
format. Use this information to determine what the other fields
represent. The current CEF version is 0 (CEF:0).
15
cef_Version N/A DatAdvantage version N/A
cn1 id Rule ID The unique identifier of the DatAlert threat model which
triggered the alert.
cn1Label N/A Always RuleID Used as a guideline as to the value stored in the
corresponding custom field.
cnt N/A Threshold The number of events which triggered the alert.
cs1 recipient Mail Recipients
The recipients (to, cc and bcc) of the mail on which the event
which triggered the alert occurred. Data is not collected for all
event types.
This placeholder is available but has no corresponding button. It
must be added manually to the template.
cs1abel N/A Always MailRecipients Used as a guideline as to the value stored in the
corresponding custom field.
cs2 Signature, subject Rule Name The name of the DatAlert threat model which triggered the alert.
For a complete list of threat models, see #unique_28.
cs2Label N/A Always RuleName Used as a guideline as to the value stored in the
corresponding custom field.
cs3 N/A Attachment Name
The file name of the email attachment in the event which
triggered the alert. Data is not collected for all event types. This
placeholder is available but has no corresponding button. It
must be added manually to the template.
16
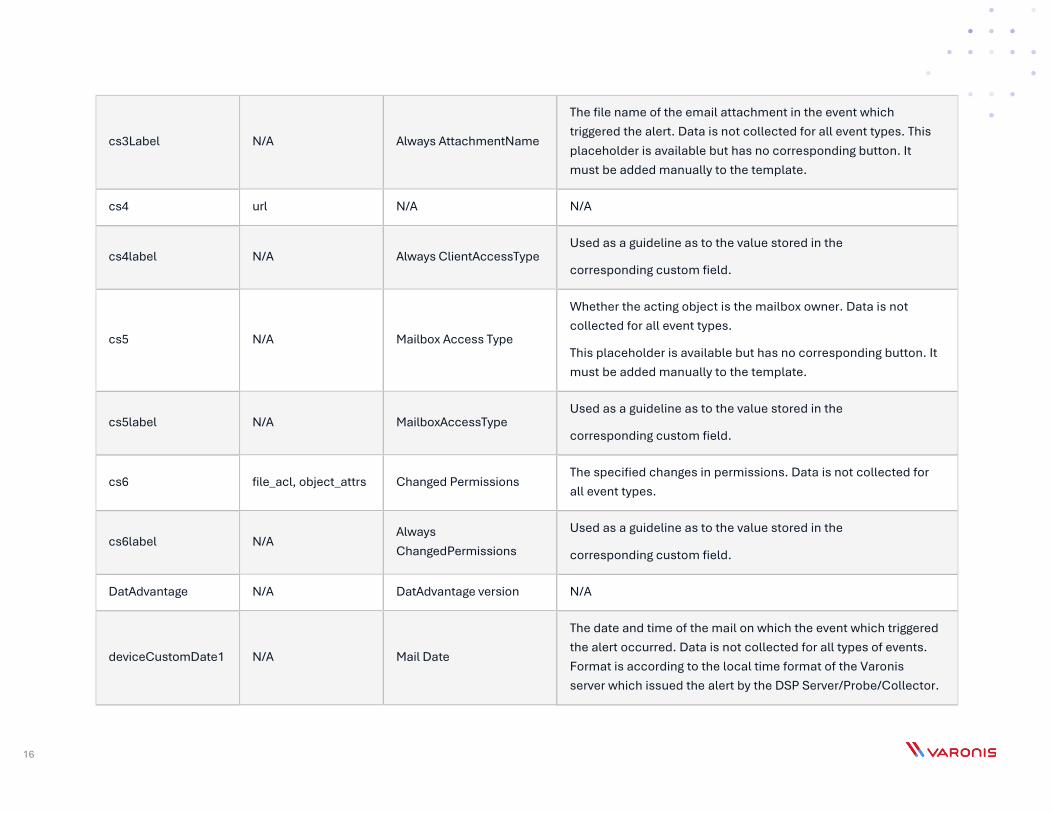
cs3Label N/A Always AttachmentName
The file name of the email attachment in the event which
triggered the alert. Data is not collected for all event types. This
placeholder is available but has no corresponding button. It
must be added manually to the template.
cs4 url N/A N/A
cs4label N/A Always ClientAccessType Used as a guideline as to the value stored in the
corresponding custom field.
cs5 N/A Mailbox Access Type
Whether the acting object is the mailbox owner. Data is not
collected for all event types.
This placeholder is available but has no corresponding button. It
must be added manually to the template.
cs5label N/A MailboxAccessType Used as a guideline as to the value stored in the
corresponding custom field.
cs6 file_acl, object_attrs Changed Permissions The specified changes in permissions. Data is not collected for
all event types.
cs6label N/A Always
ChangedPermissions
Used as a guideline as to the value stored in the
corresponding custom field.
DatAdvantage N/A DatAdvantage version N/A
deviceCustomDate1 N/A Mail Date
The date and time of the mail on which the event which triggered
the alert occurred. Data is not collected for all types of events.
Format is according to the local time format of the Varonis
server which issued the alert by the DSP Server/Probe/Collector.
17
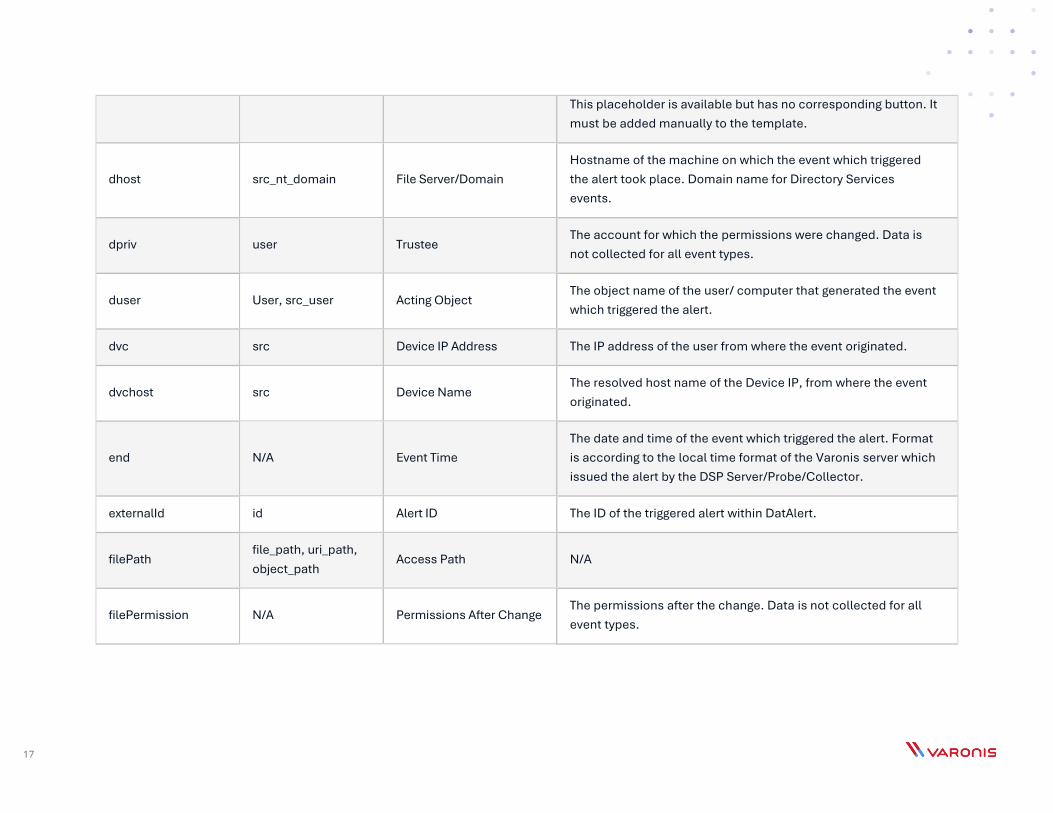
This placeholder is available but has no corresponding button. It
must be added manually to the template.
dhost src_nt_domain File Server/Domain
Hostname of the machine on which the event which triggered
the alert took place. Domain name for Directory Services
events.
dpriv user Trustee The account for which the permissions were changed. Data is
not collected for all event types.
duser User, src_user Acting Object The object name of the user/ computer that generated the event
which triggered the alert.
dvc src Device IP Address The IP address of the user from where the event originated.
dvchost src Device Name The resolved host name of the Device IP, from where the event
originated.
end N/A Event Time
The date and time of the event which triggered the alert. Format
is according to the local time format of the Varonis server which
issued the alert by the DSP Server/Probe/Collector.
externalId id Alert ID The ID of the triggered alert within DatAlert.
filePath file_path, uri_path,
object_path Access Path N/A
filePermission N/A Permissions After Change The permissions after the change. Data is not collected for all
event types.
18
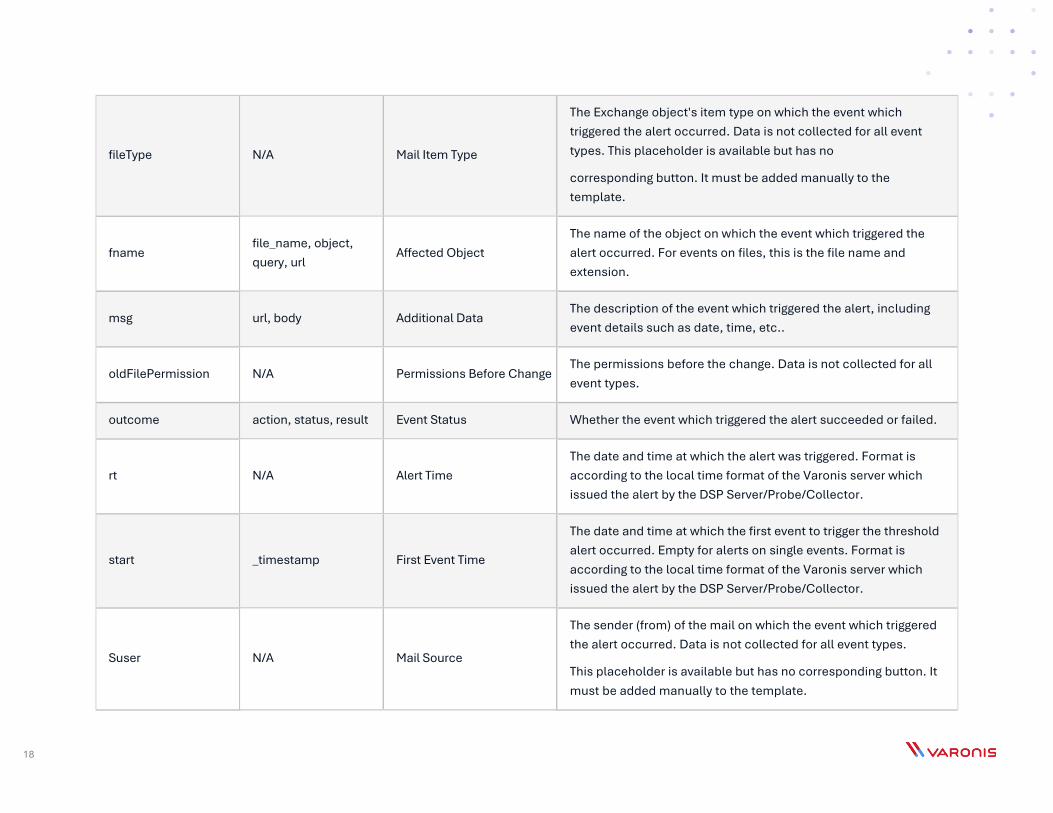
fileType N/A Mail Item Type
The Exchange object's item type on which the event which
triggered the alert occurred. Data is not collected for all event
types. This placeholder is available but has no
corresponding button. It must be added manually to the
template.
fname file_name, object,
query, url Affected Object
The name of the object on which the event which triggered the
alert occurred. For events on files, this is the file name and
extension.
msg url, body Additional Data The description of the event which triggered the alert, including
event details such as date, time, etc..
oldFilePermission N/A Permissions Before Change The permissions before the change. Data is not collected for all
event types.
outcome action, status, result Event Status Whether the event which triggered the alert succeeded or failed.
rt N/A Alert Time
The date and time at which the alert was triggered. Format is
according to the local time format of the Varonis server which
issued the alert by the DSP Server/Probe/Collector.
start _timestamp First Event Time
The date and time at which the first event to trigger the threshold
alert occurred. Empty for alerts on single events. Format is
according to the local time format of the Varonis server which
issued the alert by the DSP Server/Probe/Collector.
Suser N/A Mail Source
The sender (from) of the mail on which the event which triggered
the alert occurred. Data is not collected for all event types.
This placeholder is available but has no corresponding button. It
must be added manually to the template.
Chapter 6: CIM data model mapping Each DatAlert threat model is mapped to one or more Splunk CIM data models, matching the type of threat it
detects. The DatAlert fields are therefore mapped to the target Splunk data models.
The following list displays the DatAlert threat models that are mapped to each Splunk CIM data model:
• Intrusion Detection
• Abnormal access behavior: possible credential stuffing attack from a single source
• Abnormal access behavior: possible distributed credential stuffing attack
• Abnormal admin behavior: accumulative increase in amount of devices accessed
• Abnormal admin behavior: accumulative increase in lockouts across admin accounts
• Abnormal admin behavior: accumulative increase in lockouts for individual admin accounts
• Abnormal admin behavior: atypical access to platform from geolocation
• Abnormal admin behavior: unusual amount of devices accessed
• Abnormal admin behavior: unusual amount of lockouts across admin accounts
• Abnormal behavior: accumulative increase in amount of devices accessed
• Abnormal behavior: accumulative increase in amount of public devices accessed
• Abnormal behavior: accumulative increase in lockouts across end-user accounts
• Abnormal behavior: accumulative increase in lockouts for individual end-user accounts
• Abnormal behavior: accumulative increase in the amount of logons to devices
• Abnormal behavior: accumulative increase in the number of logons to personal devices
• Abnormal behavior: activity from blacklisted geolocation
• Abnormal behavior: activity from new geolocation to the organization
• Abnormal behavior: unreasonable geo-hopping
• Abnormal behavior: unusual amount of configuration and backup files accessed
• Abnormal behavior: unusual amount of devices accessed
• Abnormal behavior: unusual amount of lockout across end-user accounts
• Abnormal behavior: unusual amount of logons to devices
• Abnormal behavior: unusual amount of logons to personal devices
• Abnormal behavior: unusual amount of public devices accessed
• Abnormal behavior: unusual amount of script files accessed
• Abnormal behavior: unusual amount of system files accessed
• Abnormal behavior: unusual number of failed DNS Queries
20
• Abnormal behavior: unusual number of users attempted to connect from a single external IP
• Abnormal computer behavior: accumulative increase in amount of devices accessed
• Abnormal computer behavior: computer account attempted to access a personal device for the
first time
• Abnormal computer behavior: unusual amount of devices accessed
• Abnormal DNS reverse lookup requests to different IPs
• Abnormal executive behavior: accumulative increase in amount of script, configuration and
backup files accessed across executive accounts
• Abnormal executive behavior: unusual amount of script, configuration and backup files accessed
• Abnormal service behavior: a dormant service account was reactivated
• Abnormal service behavior: accumulative increase in amount of devices accessed
• Abnormal service behavior: accumulative increase in lockouts across service accounts
• Abnormal service behavior: accumulative increase in lockouts for individual service accounts
• Abnormal service behavior: atypical access to platform from geolocation
• Abnormal service behavior: service account attempted to access a personal device for the first
time
• Abnormal service behavior: service account logged on to a personal device for the first time
• Abnormal service behavior: unusual amount of devices accessed
• Abnormal service behavior: unusual amount of logons to personal devices
• Abnormal service behavior: unusual amounts of lockouts across service accounts
• Abnormal user behavior: password reset by an administrator followed by access to a computer
other than the user’s personal computer
• Abnormal user behavior: password reset by an administrator followed by access to a computer to
which the user does not normally access
• Credentials stuffing attack from an external source
• DNS cache poisoning (birthday attack)
• DNS cache snooping attack
• Encryption downgrade attack
• Failed privilege escalation was detected via vulnerability in Kerberos
• Lockout: Multiple accounts locked out
• Operation on a security tool failed
• Operation on a system administration tool failed
• Potential brute-force attack targeting a specific account
21
• Potential identity theft based on downgraded encryption
• Rapid brute-force attack targeting a specific account
• Reconnaissance using DNS Zone Transfer
• Security certificate activity by non-administrators
• Security tools accessed
• Security tools created or modified
• Successful brute-force attack targeting a specific account
• Successful login to an application by a user with a disabled Active Directory account
• Successful privilege escalation was detected via vulnerability in Kerberos
• Suspicious access activity: non-admin access to files containing credentials
• Suspicious access activity: non-admin access to startup files and scripts
• Suspicious access activity: service account access to file containing credentials
• Suspicious mailbox activity: multiple messages marked as unread by user other than the mailbox
owner
• System administration tools accessed
• System administration tools created or modified
• Data Loss Prevention
• Abnormal admin behavior: access to atypical mailboxes
• Abnormal behavior: access to an unusual amount of idle data
• Abnormal behavior: access to an unusual amount of idle sensitive data
• Abnormal behavior: accumulative increase in amount of idle and sensitive data accessed
• Abnormal behavior: accumulative increase in amount of idle data accessed
• Abnormal behavior: unusual amount of emails sent to a single recipient
• Abnormal behavior: unusual amount of files with denied access
• Abnormal behavior: unusual number of files deleted
• Abnormal behavior: unusual number of messages marked as unread by a user other than the
mailbox owner
• Abnormal behavior: unusual number of sensitive files deleted
• Abnormal executive behavior: accumulative increase in amount of files with denied access across
executive accounts
• Abnormal executive behavior: unusual amount of files with denied access across executive
accounts
• Abnormal service behavior: access to atypical files
• Abnormal service behavior: access to atypical folders
22
• Abnormal service behavior: access to atypical folders containing GDPR data
• Abnormal service behavior: access to atypical mailboxes
• Abnormal service behavior: atypical actions performed on mailbox owned by other users
• Abnormal service behavior: atypical failure to access data
• Access to an unusual number of idle GDPR files
• Unusual number of GDPR files deleted or modified
• Unusual number of GDPR files with denied access
• Abnormal admin behavior: access to atypical mailboxes
• Abnormal behavior: unusual amount of emails sent to a single recipient
• Abnormal behavior: unusual number of messages marked as unread by a user other than the
mailbox owner
• Abnormal service behavior: access to atypical mailboxes
• Abnormal service behavior: atypical actions performed on mailbox owned by other users
• Creation: automatic forwarding of incoming messages on mailbox
• Suspicious mailbox activity: multiple messages marked as unread by user other than the mailbox
owner
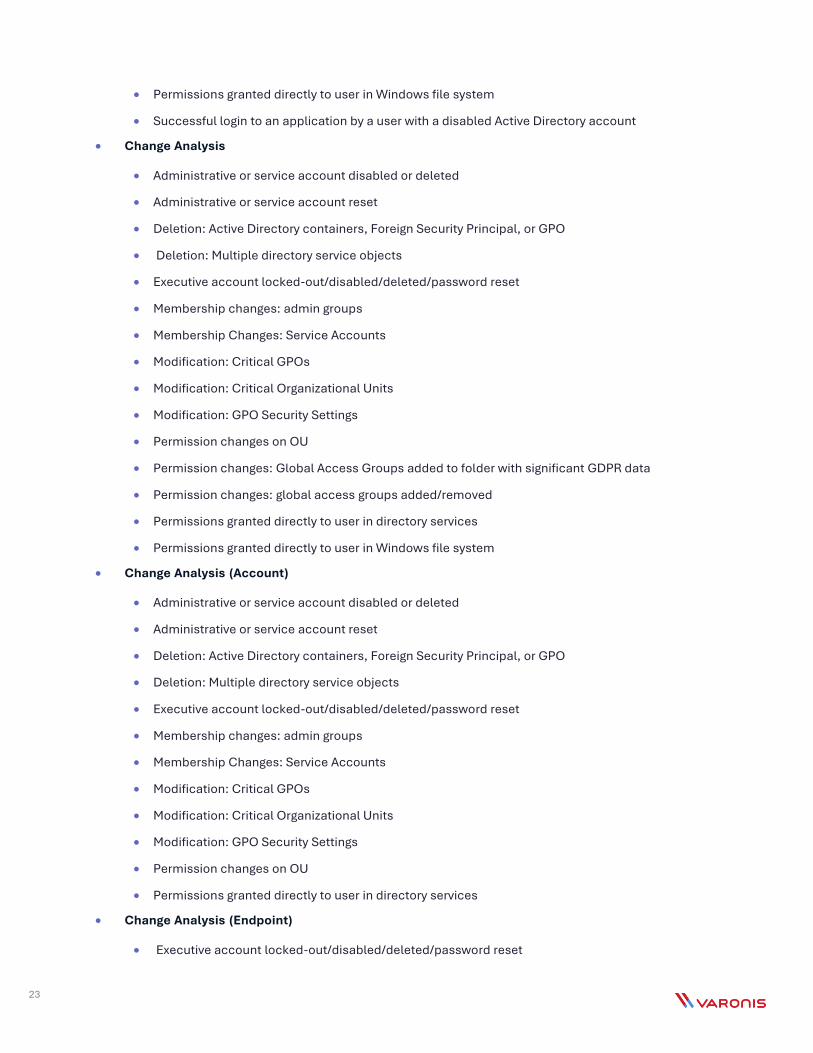
• Alerts
• Administrative or service account disabled or deleted
• Administrative or service account reset
• Creation: automatic forwarding of incoming messages on mailbox
• Deletion: Active Directory containers, Foreign Security Principal, or GPO
• Deletion: Multiple directory service objects
• Executive account locked-out/disabled/deleted/password reset
• Low and slow increase in number of idle GDPR files accessed
• Membership changes: admin groups
• Membership Changes: Service Accounts
• Modification: Critical GPOs
• Modification: Critical Organizational Units
• Modification: GPO Security Settings
• Permission changes on OU
• Permission changes: Global Access Groups added to folder with significant GDPR data
• Permission changes: global access groups added/removed
• Permissions granted directly to user in directory services
23
• Permissions granted directly to user in Windows file system
• Successful login to an application by a user with a disabled Active Directory account
• Change Analysis
• Administrative or service account disabled or deleted
• Administrative or service account reset
• Deletion: Active Directory containers, Foreign Security Principal, or GPO
• Deletion: Multiple directory service objects
• Executive account locked-out/disabled/deleted/password reset
• Membership changes: admin groups
• Membership Changes: Service Accounts
• Modification: Critical GPOs
• Modification: Critical Organizational Units
• Modification: GPO Security Settings
• Permission changes on OU
• Permission changes: Global Access Groups added to folder with significant GDPR data
• Permission changes: global access groups added/removed
• Permissions granted directly to user in directory services
• Permissions granted directly to user in Windows file system
• Change Analysis (Account)
• Administrative or service account disabled or deleted
• Administrative or service account reset
• Deletion: Active Directory containers, Foreign Security Principal, or GPO
• Deletion: Multiple directory service objects
• Executive account locked-out/disabled/deleted/password reset
• Membership changes: admin groups
• Membership Changes: Service Accounts
• Modification: Critical GPOs
• Modification: Critical Organizational Units
• Modification: GPO Security Settings
• Permission changes on OU
• Permissions granted directly to user in directory services
• Change Analysis (Endpoint)
• Executive account locked-out/disabled/deleted/password reset

24
• Permission changes: Global Access Groups added to folder with significant GDPR data
• Permission changes: global access groups added/removed
• Permissions granted directly to user in Windows file system
• Malware
• Crypto activity detected
• Data exfiltration via DNS tunneling
• Encryption of multiple files
• Exploitation software accessed
• Exploitation software created or modified
• File encrypted by ransomware
• Immediate pattern detected: user actions resemble ransomware
• Modification: Hosts file
• Operation on a penetration testing or hacking tool failed
• Operation on an exploitation tool failed
• Past ransomware activity indicated by a residual ransomware note
• Penetration testing and hacking tools accessed
• Penetration testing and hacking tools created or modified
• Suspected ransomware intrusion activity
• Suspicious access activity: non-admin access to system binaries in non-system locations
25
Chapter 7: Troubleshooting
Connectivity problems
Learn about common connectivity problems that may occur, along with possible causes and solutions.
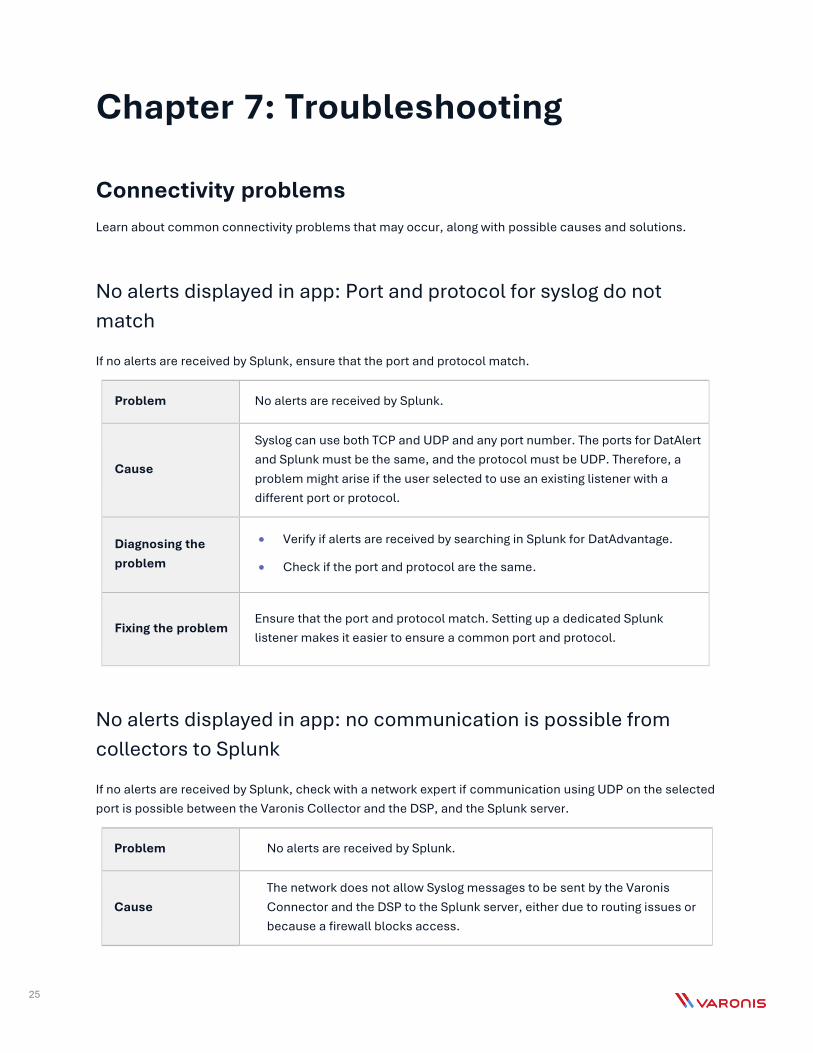
No alerts displayed in app: Port and protocol for syslog do not
match
If no alerts are received by Splunk, ensure that the port and protocol match.
Problem No alerts are received by Splunk.
Cause
Syslog can use both TCP and UDP and any port number. The ports for DatAlert
and Splunk must be the same, and the protocol must be UDP. Therefore, a
problem might arise if the user selected to use an existing listener with a
different port or protocol.
Diagnosing the
problem
• Verify if alerts are received by searching in Splunk for DatAdvantage.
• Check if the port and protocol are the same.
Fixing the problem Ensure that the port and protocol match. Setting up a dedicated Splunk
listener makes it easier to ensure a common port and protocol.
No alerts displayed in app: no communication is possible from
collectors to Splunk
If no alerts are received by Splunk, check with a network expert if communication using UDP on the selected
port is possible between the Varonis Collector and the DSP, and the Splunk server.
Problem No alerts are received by Splunk.
Cause
The network does not allow Syslog messages to be sent by the Varonis
Connector and the DSP to the Splunk server, either due to routing issues or
because a firewall blocks access.
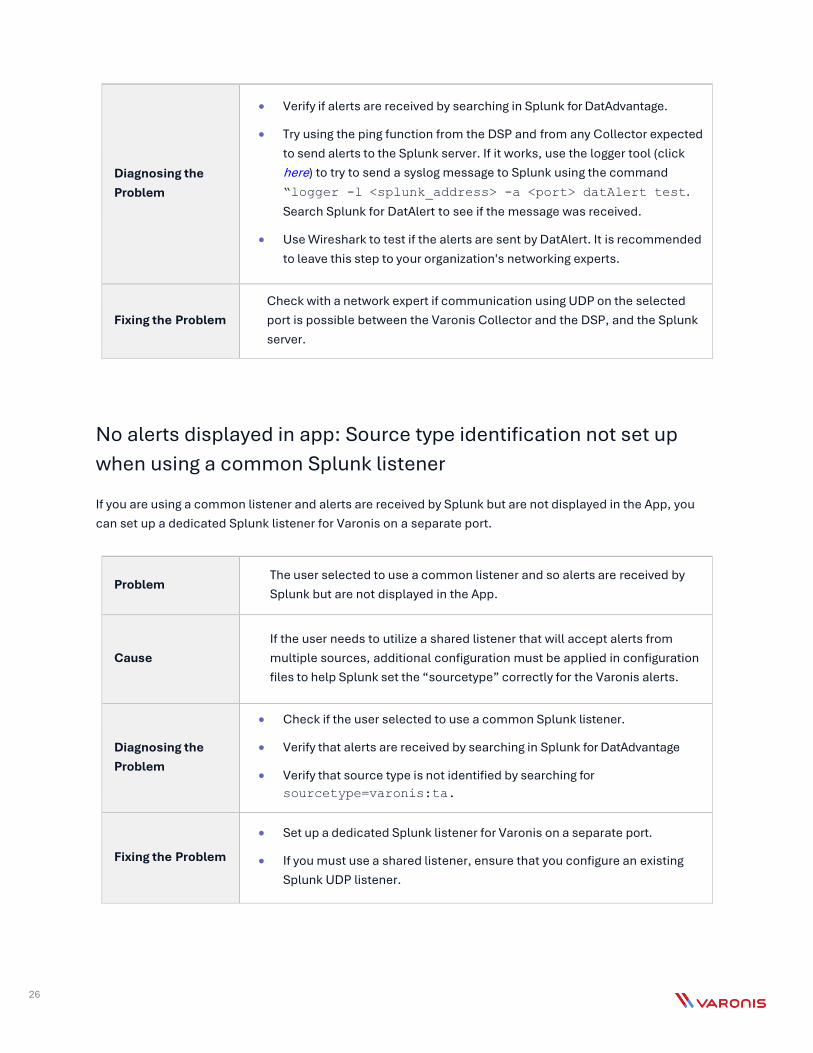
26
Diagnosing the
Problem
• Verify if alerts are received by searching in Splunk for DatAdvantage.
• Try using the ping function from the DSP and from any Collector expected
to send alerts to the Splunk server. If it works, use the logger tool (click
here) to try to send a syslog message to Splunk using the command
“logger -l <splunk_address> -a <port> datAlert test.
Search Splunk for DatAlert to see if the message was received.
• Use Wireshark to test if the alerts are sent by DatAlert. It is recommended
to leave this step to your organization's networking experts.
Fixing the Problem
Check with a network expert if communication using UDP on the selected
port is possible between the Varonis Collector and the DSP, and the Splunk
server.
No alerts displayed in app: Source type identification not set up
when using a common Splunk listener
If you are using a common listener and alerts are received by Splunk but are not displayed in the App, you
can set up a dedicated Splunk listener for Varonis on a separate port.
Problem The user selected to use a common listener and so alerts are received by
Splunk but are not displayed in the App.
Cause
If the user needs to utilize a shared listener that will accept alerts from
multiple sources, additional configuration must be applied in configuration
files to help Splunk set the “sourcetype” correctly for the Varonis alerts.
Diagnosing the
Problem
• Check if the user selected to use a common Splunk listener.
• Verify that alerts are received by searching in Splunk for DatAdvantage
• Verify that source type is not identified by searching for
sourcetype=varonis:ta.
Fixing the Problem
• Set up a dedicated Splunk listener for Varonis on a separate port.
• If you must use a shared listener, ensure that you configure an existing
Splunk UDP listener.

27
No alerts displayed in app: no source type selected for a dedicated
Splunk listener
If a dedicated listener is used and alerts are received by Splunk but are not presented in the App, you can
reconfigure the dedicated Splunk listener.
Problem The user selected to use a dedicated listener, and alerts are received by
Splunk but are not presented in the App.
Cause The user did not set the sourcetype correctly when configuring the listener.
Diagnosing the
Problem
• Check if the user selected to use a dedicated Splunk listener.
• Verify that alerts are received by searching in Splunk for DatAdvantage.
• Verify that source type is not identified by searching for
sourcetype=varonis:ta.
Fixing the Problem Set up a dedicated Splunk listener.
Drill-down problems
Learn about common drill-down problems that may occur while using the Varonis app for Splunk.
"This site can't be reached" or "page not found" errors when drilling-
down to Varonis web UI: Wrong syslog template
If you cannot drill down to view details about the alert in the Varonis Web Interface, you may need to redefine
the Syslog template.
Problem
The user is not able to drill down from an alert in Splunk to the Alert page in
Varonis Web Interface. The browser displays an error such as This site can’t
be reached or page not found.
Cause The user did not manually edit the Syslog template configured in DatAlert with
the details regarding the Varonis Web Interface.
28
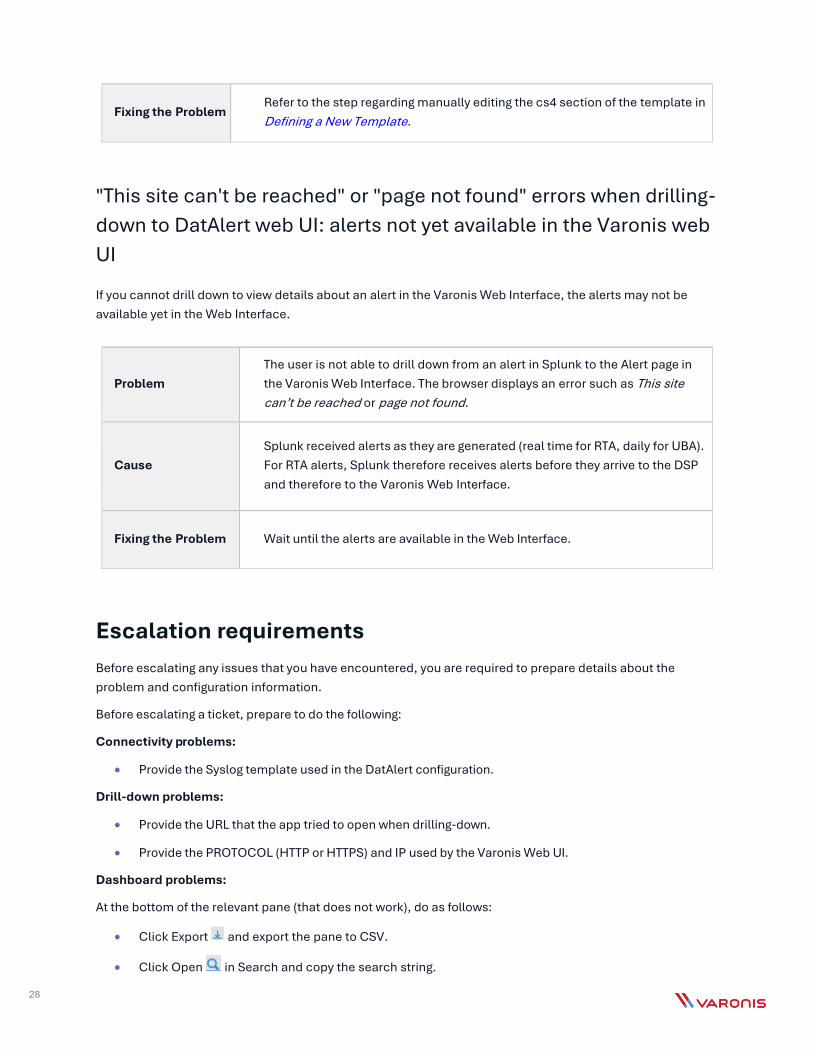
Fixing the Problem Refer to the step regarding manually editing the cs4 section of the template in
Defining a New Template.
"This site can't be reached" or "page not found" errors when drilling-
down to DatAlert web UI: alerts not yet available in the Varonis web
UI
If you cannot drill down to view details about an alert in the Varonis Web Interface, the alerts may not be
available yet in the Web Interface.
Problem
The user is not able to drill down from an alert in Splunk to the Alert page in
the Varonis Web Interface. The browser displays an error such as This site
can’t be reached or page not found.
Cause
Splunk received alerts as they are generated (real time for RTA, daily for UBA).
For RTA alerts, Splunk therefore receives alerts before they arrive to the DSP
and therefore to the Varonis Web Interface.
Fixing the Problem Wait until the alerts are available in the Web Interface.
Escalation requirements
Before escalating any issues that you have encountered, you are required to prepare details about the
problem and configuration information.
Before escalating a ticket, prepare to do the following:
Connectivity problems:
• Provide the Syslog template used in the DatAlert configuration.
Drill-down problems:
• Provide the URL that the app tried to open when drilling-down.
• Provide the PROTOCOL (HTTP or HTTPS) and IP used by the Varonis Web UI.
Dashboard problems:
At the bottom of the relevant pane (that does not work), do as follows:
• Click Export and export the pane to CSV.
• Click Open in Search and copy the search string.