Integrating social, environmental and economic dimensions into a
monitoring framework
Maria [email protected]
Summary
• Context• What do data tell us about the integration of the
three dimensions of sustainable development?• Indicators/measures to monitor sustainable
development• Inequality measures• Conclusion

Context
Rio+20, HLPGS, post-2015 discussions
• Increasing interest in having sustainable development at the core of development
• Need to integrate the social, economic and environmental dimensions of development
What do data tell us about the integration of the social, economic and environmental dimensions of development?

Illustrative example: HDI versus Ecological footprint
0.0
0.1
0.2
0.3
0.4
0.5
0.6
0.7
0.8
0.9
1.0
0.0 2.0 4.0 6.0 8.0 10.0 12.0
Ecological Footprint (global hectares per capita)
Hu
ma
n D
ev
elo
pm
en
t In
de
x
Earth's biocapacity (2.1 hectares per person)
High human development
(HDI>0.8)
CLOSER TO SUSTAINABLE DEVELOPMENT
Countries with low ecological
foortprint tend to have low HDI
Countries with high HDI tend to have high environmental impact
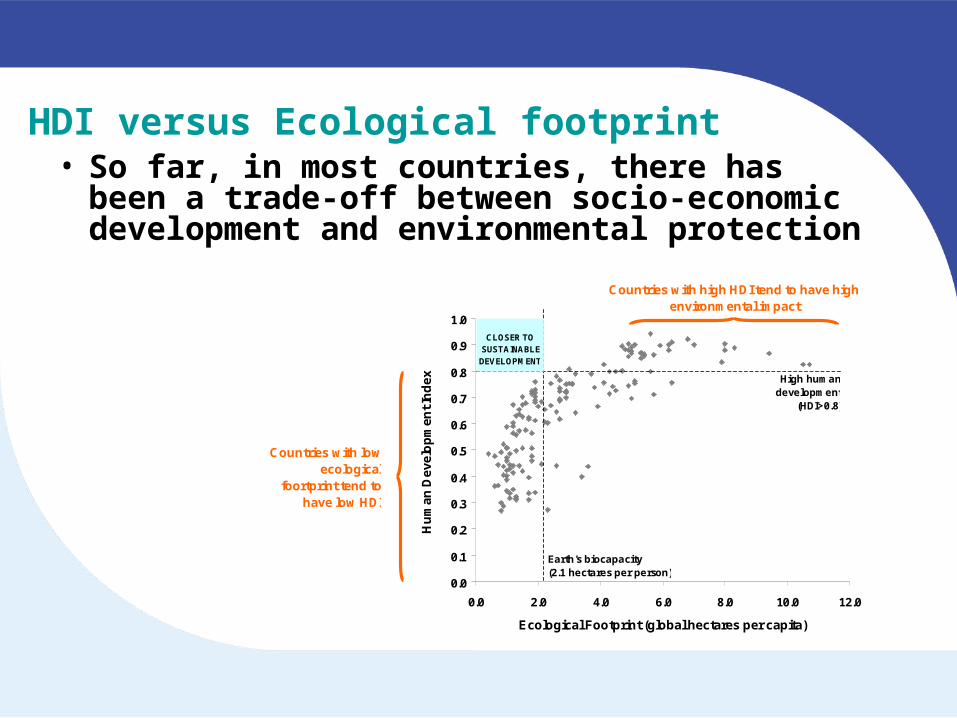
HDI versus Ecological footprint• So far, in most countries, there has been a trade-
off between socio-economic development and environmental protection
0.0
0.1
0.2
0.3
0.4
0.5
0.6
0.7
0.8
0.9
1.0
0.0 2.0 4.0 6.0 8.0 10.0 12.0
Ecological Footprint (global hectares per capita)
Hu
ma
n D
ev
elo
pm
en
t In
de
x
Earth's biocapacity (2.1 hectares per person)
High human development
(HDI>0.8)
CLOSER TO SUSTAINABLE DEVELOPMENT
Countries with low ecological
foortprint tend to have low HDI
Countries with high HDI tend to have high environmental impact
Is it possible for countries to reach higher levels of social development while keeping a sustainable environmental impact?

HDI versus Ecological footprint• Some countries have succeeded in moving higher
up in the HDI while keeping within a sustainable ecological footprint
Peru
0
0.2
0.4
0.6
0.8
1
0 0.5 1 1.5 2 2.5
Ecological footprint
HD
I
20052000
19951990
19851980 1975

HDI versus Ecological footprint• And others have succeeded to move to a lower
ecological footprint while keeping high levels of HDI
Germany
0
0.2
0.4
0.6
0.8
1
0 1 2 3 4 5 6 7
Ecological footprint
HD
I2005 2000 19951990
19851980

What measures can make the inter-linkages between the socio-economic and environmental dimensions visible?

• Indicators/measures to monitor sustainable development should:
– Permit to visualize the environmental implications of socio-economic activities and the welfare implications of imbalances and changes of ecosystems
• to promote synergies and avoid trade-offs favouring one dimension over the others
– Reflect the complexity of sustainable development in its multiple dimensions
• but be simple and user-friendly for policy makers
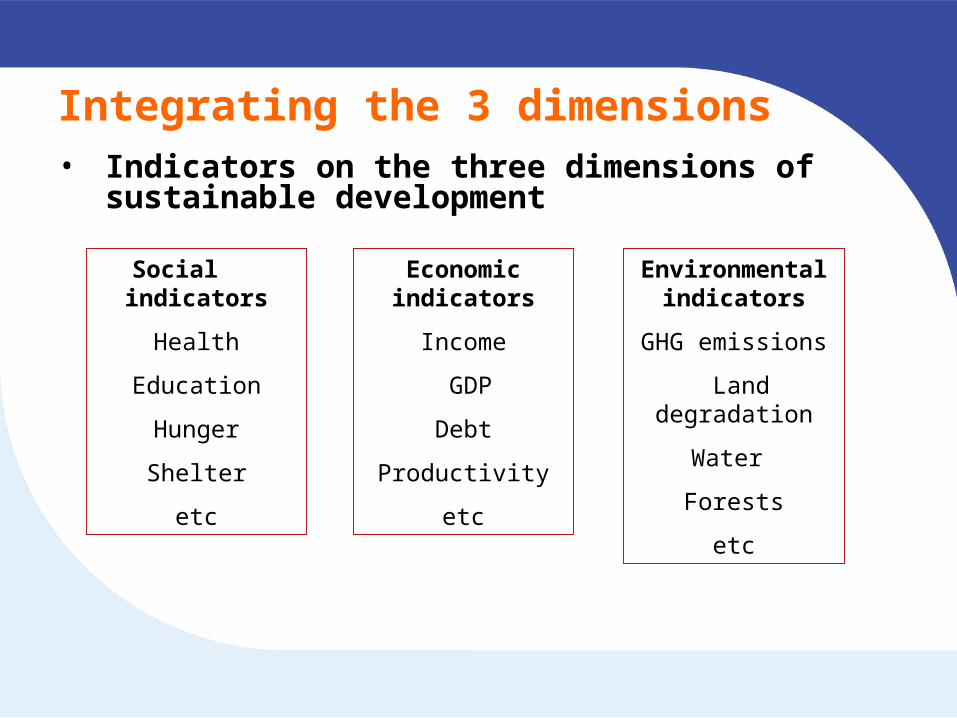
Integrating the 3 dimensions• Indicators on the three dimensions of sustainable
development
Environmental indicators
GHG emissions
Land degradation
Water
Forests
etc
Social indicators
Health
Education
Hunger
Shelter
etc
Economic indicators
Income
GDP
Debt
Productivity
etc
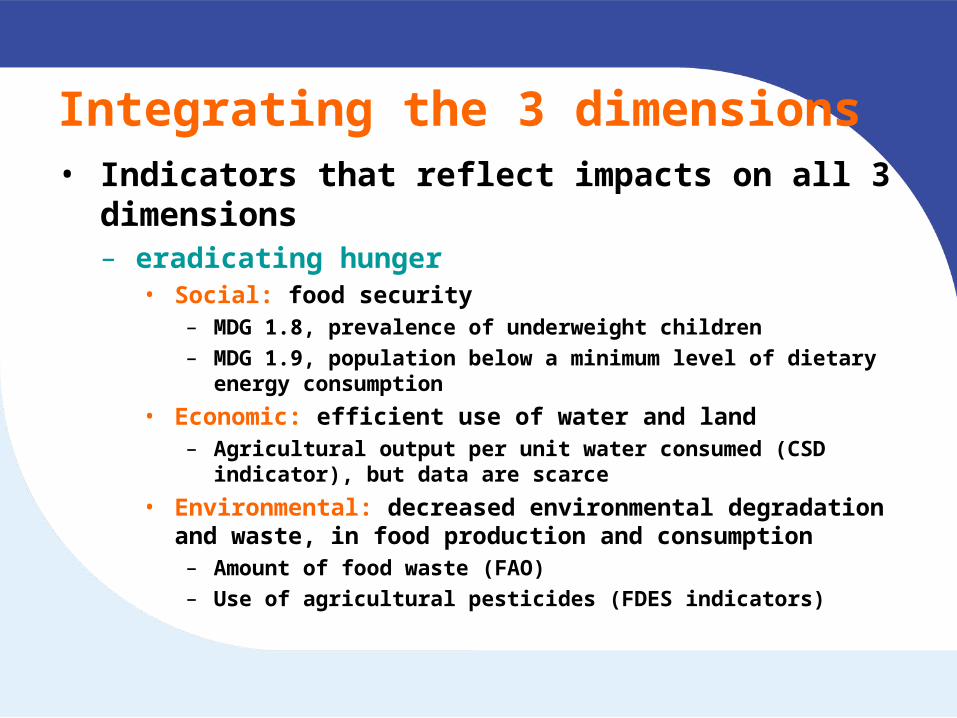
Integrating the 3 dimensions• Indicators that reflect impacts on all 3 dimensions
– eradicating hunger• Social: food security
– MDG 1.8, prevalence of underweight children– MDG 1.9, population below a minimum level of dietary energy
consumption
• Economic: efficient use of water and land– Agricultural output per unit water consumed (CSD indicator), but
data are scarce
• Environmental: decreased environmental degradation and waste, in food production and consumption– Amount of food waste (FAO)– Use of agricultural pesticides (FDES indicators)

Integrating the 3 dimensions• Another example:
– sustainable energy for all• Social: energy access
– Energy use per capita (IEA)– Share of households without electricity or other modern energy
services (CSD indicator; collected in household surveys), but data are scarce
• Economic: energy efficiency– Energy use per $1000 GDP (IEA)
• Environmental: use of renewable and clean sources– Renewable as % of total (IEA)– % of population using solid fuels (WHO)
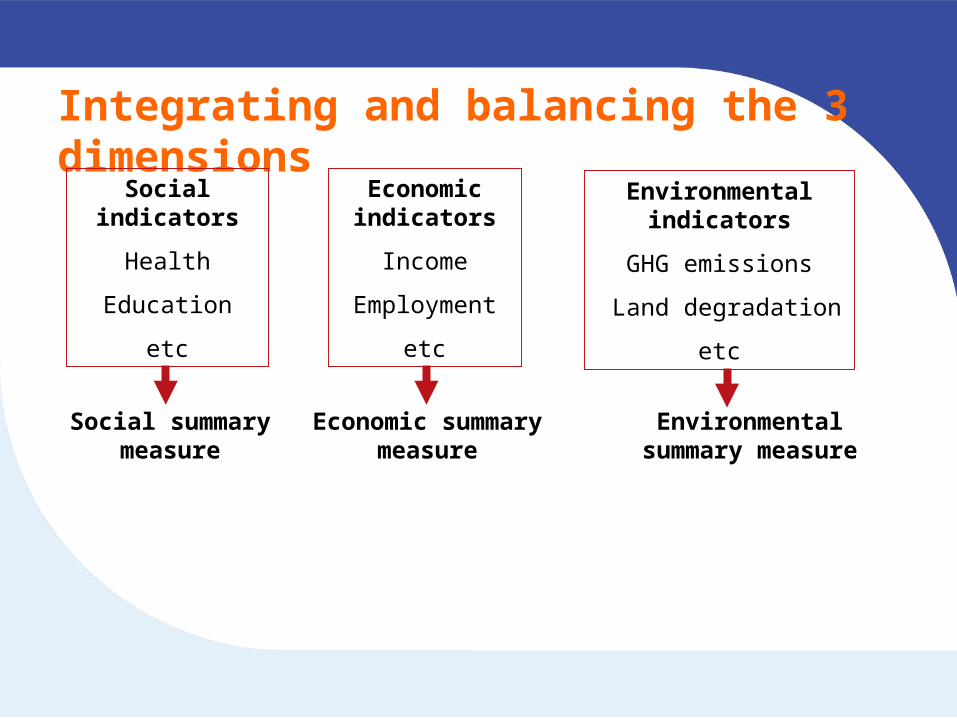
Integrating and balancing the 3 dimensions
Social indicators
Health
Education
etc
Economic indicators
Income
Employment
etc
Environmental indicators
GHG emissions
Land degradation
etc
Social summary measure
Economic summary measure
Environmental summary measure
Integrating the 3 dimensions• Summary measures to provide an overall picture of what
happens in social, economic and/or environmental dimensions– GDP
– Human development index
– Ecological footprint, environmental performance index, living planet index
– etc

Integrating and balancing the 3 dimensions
Social indicators
Health
Education
etc
Economic indicators
Income
Employment
etc
Environmental indicators
GHG emissions
Land degradation
etc
Social summary measure
Economic summary measure
Environmental summary measure
How to integrate them?

Integrating the 3 dimensions
Country Env Soc Eco
X 0.1 0.5 0.9
Y 0.4 0.5 0.6
• Measures that favour synergies and penalize trade-offs
– Many summary measures do not penalize trade offs
• methodology for aggregation: simple average of different indicators
• Simple average– Both countries, X and Y,
have the same average (Env + Soc + Eco)/3 = 0.5
S = social measureEco = economic measureEnv = Environmental measure

Integrating the 3 dimensions
Country Env Soc Eco
X 0.1 0.5 0.9
Y 0.4 0.5 0.6
• Measures that favour synergies and penalize trade-offs
– Many summary measures do not penalize trade offs
• methodology for aggregation: simple average of different indicators
S = social measureEco = economic measureEnv = Environmental measureValues closer to one indicate better performance
But country X performs much better in the economic dimension at the price of a low environmental performance

Integrating the three dimensions• Simple average
– Both countries, X and Y, have the same mean (Env + Soc + Eco)/3 = 0.5
• Geometric mean
– Country X: 0.36– Country Y: 0.49
Country Env Soc EcoX 0.1 0.5 0.9Y 0.4 0.5 0.6
3Soc × Eco × EnvSD =
Penalized for the economic-environmental trade-off
Integrating the 3 dimensions
• Measures that favour synergies and penalize trade-offs
– Geometric mean
• Has been used in the calculation of the human development index since 2011
• Better than simple average at penalizing trade-offs

Integrating and balancing the 3 dimensions
Social indicators
Health
Education
etc
Economic indicators
Income
Employment
etc
Environmental indicators
GHG emissions
Land degradation
etc
Social summary measure
Economic summary measure
Environmental summary measure
Overall SD measure

Inequality measures• Measure disparities across a population of the
resources received by that population
• Resources: income, land, education, health services, energy, water, etc.
• Measures across all population versus disaggregating for specific groups
– Across all population: Gini coefficient, Hoover coefficient, % population with access to a service, etc.
– For specific groups: disaggregating indicators for women/men, by wealth quintiles, for minorities, for persons with disabilities, etc.

Income inequality measures• Increased interest in the SDG discussions
• Associated to social negative outcomes, like increased violence, increased adolescent pregnancy rates
• Popular/discussed measures
– Gini coefficient
– Palma index
– Poorest quintile's share in national income/consumption
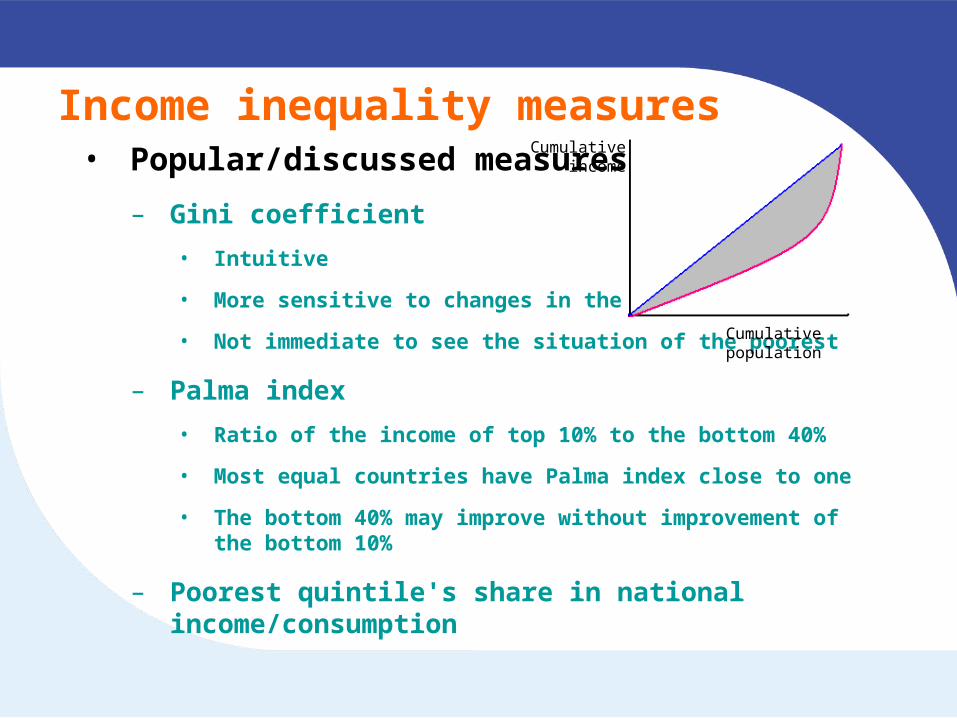
Income inequality measures• Popular/discussed measures
– Gini coefficient
• Intuitive
• More sensitive to changes in the middle class
• Not immediate to see the situation of the poorest
– Palma index
• Ratio of the income of top 10% to the bottom 40%
• Most equal countries have Palma index close to one
• The bottom 40% may improve without improvement of the bottom 10%
– Poorest quintile's share in national income/consumption
Cumulative income
Cumulative population
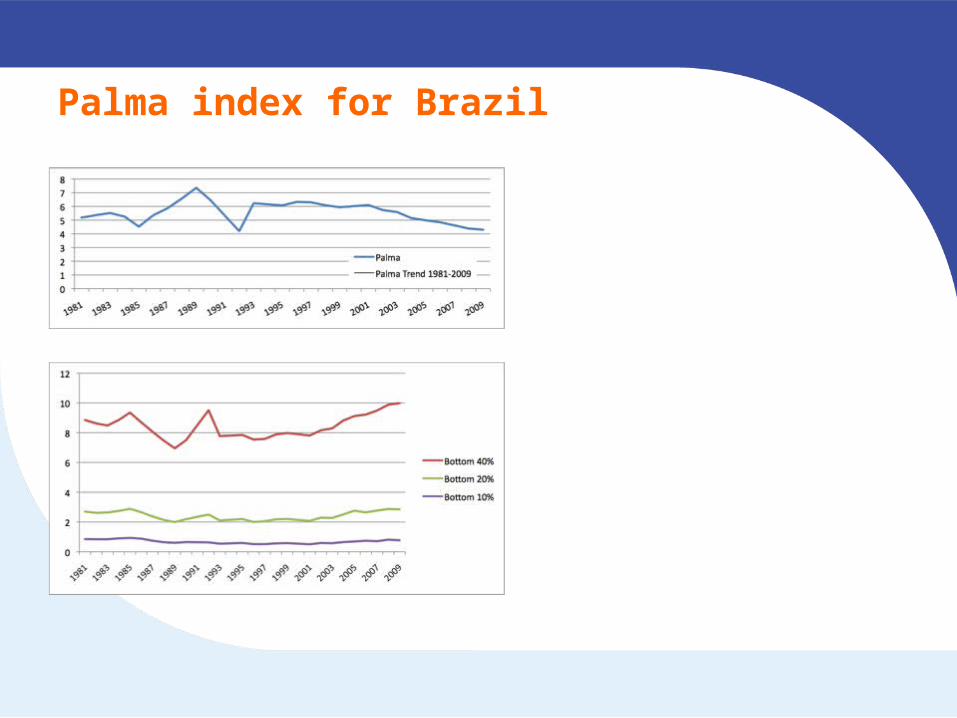
Palma index for Brazil

Income inequality measures• Popular/discussed measures
– Gini coefficient
• Intuitive
• More sensitive to changes in the middle class
• Not immediate to see the situation of the poorest
– Palma index
• Ratio of the income of top 10% to the bottom 40%
• Most equal countries have Palma index close to one
• The bottom 40% may improve without improvement of the bottom 10%
– Poorest quintile's share in national income/consumption
• Can supplement other inequality measures
Cumulative income
Cumulative population
Concluding points• Sets of indicators should address the three dimensions
of sustainable development • Combining measures can help promote synergies in the
three dimensions– geometric means
• Many inequality measures around, selection depends on purpose