Integrated Nutrition, Food Security and
Retrospective Mortality Survey
West Pokot County
Kenya
Funded by
MAY 2012
ACF‐USA / West Pokot SMART Survey‐Kenya/ May 2012
TABLE OF CONTENTSLIST OF TABLES ................................................................................................................................................... 3
LIST OF FIGURES ................................................................................................................................................. 3
ACKNOWLEDGEMENT ........................................................................................................................................ 4
LIST OF ABBREVIATIONS AND ACRONYMS .......................................................................................................... 5
1 EXECUTIVE SUMMARY ............................................................................................................................... 6
2 INTRODUCTION ......................................................................................................................................... 7
3 METHODOLOGY ......................................................................................................................................... 7
3.1 TYPE OF SURVEY ............................................................................................................................................... 7
3.2 SURVEY OBJECTIVES ........................................................................................................................................... 7
3.3 SOURCES OF SURVEY DATA ................................................................................................................................. 8
3.4 SAMPLING METHODOLOGY ................................................................................................................................. 8
3.4.1 First Stage ................................................................................................................................................ 8
3.4.2 Second Stage ............................................................................................................................................ 8
3.4.3 Survey Schedule and Training .................................................................................................................. 9
3.4.4 Field Work ................................................................................................................................................ 9
3.4.5 Data entry, cleaning, and analysis ........................................................................................................... 9
3.5 INDICATORS USED ........................................................................................................................................ 9
3.5.1 Anthropometric survey ............................................................................................................................ 9
3.5.2 Mortality survey: .................................................................................................................................... 10
3.5.3 Health, WASH and Food Security& Livelihoods: .................................................................................... 10
3.6 DATA QUALITY CONTROL AND ASSURANCE ............................................................................................... 10
4 SURVEY LIMITATIONS/CONSTRAINTS ........................................................................................................ 10
5 SURVEY RESULTS ...................................................................................................................................... 11
5.1 ANTHROPOMETRIC SURVEY ....................................................................................................................... 11
5.1.1 Distribution by age and sex .................................................................................................................... 11
5.1.2 Distribution of Acute Malnutrition in Z‐score, WHO 2006 standards .................................................... 11
5.1.3 Distribution of Middle Upper Arm Circumference.................................................................................. 14
5.2 RETROSPECTIVE MORTALITY SURVEY ......................................................................................................... 14
5.3 SOCIO‐DEMOGRAPHIC CHARACTERISTICS OF THE RESPONDENTS ............................................................ 15
5.4 HEALTH AND NUTRITION ............................................................................................................................ 15
5.5 WATER SANITATION AND HYGIENE ............................................................................................................ 19
5.6 FOOD SECURITY AND LIVELIHOODS ............................................................................................................ 22
6 DISCUSSION AND CONCLUSIONS ............................................................................................................... 28
7 RECOMMENDATIONS................................................................................................................................ 29
APPENDIX 1: SUMMARY OF KEY FINDINGS .............................................................................................................. 31
APPENDIX 2: SURVEY PLAUSIBILITY REPORT SUMMARY,MAY 2012 .................................................................................... 33
APPENDIX 3: MAP OF WEST POKOT COUNTY ................................................................................................................. 34
APPENDIX 4: SAMPLED VILLAGES .................................................................................................................................. 35
APPENDIX 5: HOUSEHOLD MORTALITY DATA FORM (ONE SHEET PER HOUSEHOLD) ................................................................ 36
APPENDIX 6: CLUSTER MORTALITY QUESTIONNAIRE (ONE SHEET/CLUSTER) ................................................................ 37
APPENDIX 7: ANTHROPOMETRIC QUESTIONNAIRE ................................................................................................. 38
APPENDIX 8: IYCN QUESTIONNAIRE ........................................................................................................................ 39
APPENDIX 9: MARKET ASSESSMENT DATA ...................................................................................................................... 40

ACF‐USA / West Pokot SMART Survey‐Kenya/ May 2012
LIST OF TABLES
TABLE 1: SURVEY PLANNING DETAILS ..................................................................................................................................... 8
TABLE 2: DISTRIBUTION OF AGE AND SEX OF SAMPLE ............................................................................................................... 11
TABLE 3: PREVALENCE OF ACUTE MALNUTRITION BY AGE BASED ON WHZ‐SCORES AND/OR OEDEMA, WHO 2006 REFERENCES ........... 12
TABLE 4: DISTRIBUTION OF ACUTE MALNUTRITION AND OEDEMA BASED ON WEIGHT‐FOR‐HEIGHT Z‐SCORES ...................................... 12
TABLE 5: SEASONAL COMPARISON IN MALNUTRITION RATES ..................................................................................................... 14
TABLE 6: MUAC DISTRIBUTION .......................................................................................................................................... 14
TABLE 7: SUMMARY OF MORTALITY DATA ............................................................................................................................. 14
TABLE 8: MORTALITY RATES ............................................................................................................................................... 14
TABLE 9: VITAMIN A SUPPLEMENTATION .............................................................................................................................. 17
TABLE 10: OPV VACCINATION ............................................................................................................................................ 17
TABLE 11: IYCN INDICATORS .............................................................................................................................................. 18
TABLE 12: WATER STORAGE CONTAINERS ............................................................................................................................. 21
TABLE 14: APPROPRIATE HAND WASHING PRACTICES .............................................................................................................. 22
TABLE 14: HOUSEHOLD HARVEST ........................................................................................................................................ 22
TABLE 15: HOUSEHOLD LIVESTOCK OWNERSHIP ..................................................................................................................... 24
TABLE 16: HOUSEHOLD DIETARY DIVERSITY SCORE ................................................................................................................. 25
TABLE 17: STRESSORS EXPERIENCED .................................................................................................................................... 27
TABLE 18:DIARRHOEA INCIDENCES VS. WASH ...................................................................................................................... 28
TABLE19: SUMMARY OF KEY FINDINGS, POSSIBLE CAUSES AND RECOMMENDATIONS ............................................. 29
LIST OF FIGURES
FIGURE 1: DISTRIBUTION OF SEX BY AGE GROUP ..................................................................................................................... 11
FIGURE 2: WEIGHT FOR HEIGHT DISTRIBUTION IN Z‐SCORE COMPARED TO THE WHO STANDARD .................................................... 13
FIGURE 3:WEIGHT FOR HEIGHT Z‐SCORES BASED ON GENDER (WHO STANDARDS) ...................................................................... 13
FIGURE 4:HEIGHT FOR AGE COMPARED TO WHO STANDARDS .................................................................................................. 13
FIGURE 5: MAIN SOURCE OF LIVELIHOOD .............................................................................................................................. 15
FIGURE 6: MORBIDITY RATES .............................................................................................................................................. 15
FIGURE7: DIARRHOEA MANAGEMENT .................................................................................................................................. 16
FIGURE 8: HEALTH SEEKING BEHAVIOR .................................................................................................................................. 16
FIGURE 9: TRENDS IN MOSQUITO NET OWNERSHIP AND USAGE ................................................................................................. 17
FIGURE 10: MEASLES VACCINATION COVERAGE ..................................................................................................................... 18
FIGURE 11: WATER ACCESSIBILITY ....................................................................................................................................... 19
FIGURE 12:QUEUING TIME AT WATER SOURCE ....................................................................................................................... 20
FIGURE 13: RELIEVING POINTS IN WEST POKOT COUNTY ......................................................................................................... 20
FIGURE 14: WATER TREATMENT PRACTICES .......................................................................................................................... 21
FIGURE 15: CRITICAL HAND WASHING TIMES ......................................................................................................................... 21
FIGURE 16: PROPORTION OF HOUSEHOLDS WHO PLANTED CROPS ............................................................................................. 22
FIGURE 17: REASONS FOR INCREASE OR DECREASE IN MOST RECENT HARVEST .............................................................................. 23
FIGURE 18: DURATION OF THE RECENT HARVEST FOR HOUSEHOLD CONSUMPTION ........................................................................ 23
FIGURE 19: HOW THE MOST RECENT HARVEST WAS USED ......................................................................................................... 24
FIGURE 20: CONSUMED FOOD GROUPS ................................................................................................................................ 25
FIGURE 21: HOUSEHOLD FOOD SOURCES .............................................................................................................................. 26
FIGURE 22: SOURCES OF HOUSEHOLD INCOME ....................................................................................................................... 26
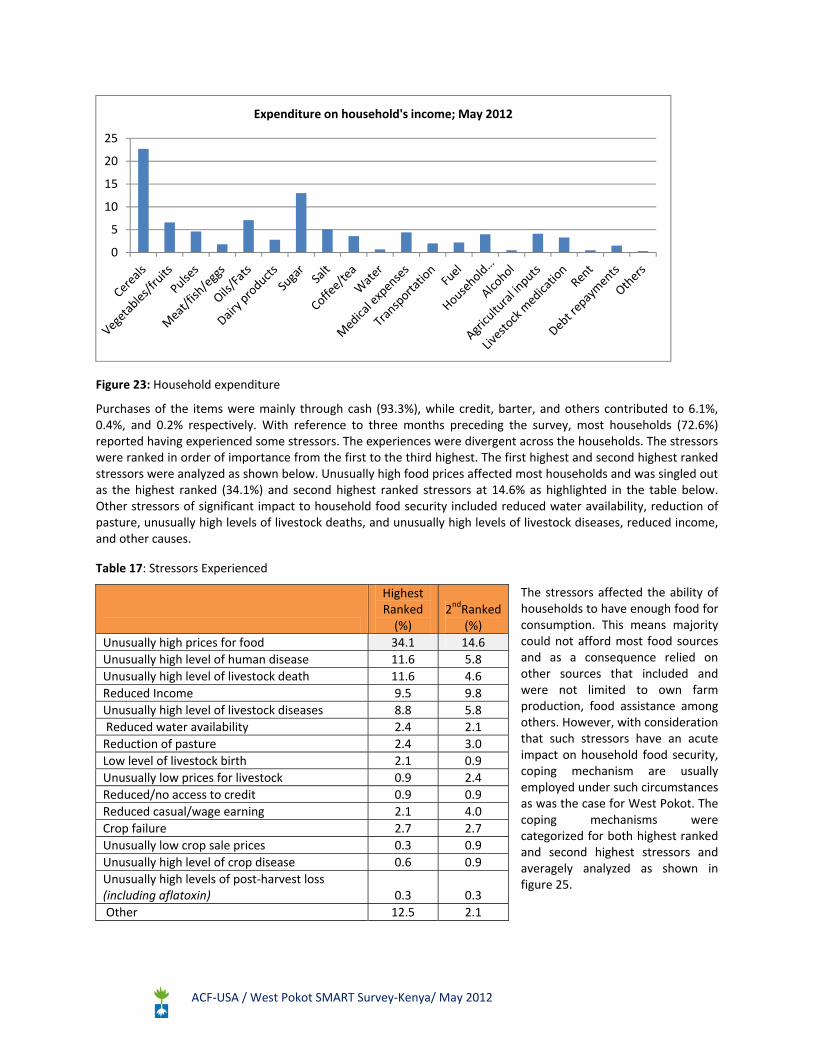
FIGURE 23: HOUSEHOLD EXPENDITURE ................................................................................................................................. 27

ACF‐USA / West Pokot SMART Survey‐Kenya/ May 2012
ACKNOWLEDGEMENT
Action Against Hunger is indebted to all the parties for their contribution and profound support during the survey
exercise. The survey wouldn’t have been possible without the active participation of the actors who included and
were not limited to:
UNICEF for financial support
ACF Kenya Nairobi and West Pokot teams for their technical and logistical support throughout the survey process
The relevant government ministries (Ministry of Health/Public Health, Arid Lands and Resource Management Project, Local authorities, Ministry of Agriculture) for provision of relevant background information and playing an active role during data collection as team leaders
All the data collection teams for their diligent effort in gathering reliable and quality data
The community and caretakers of sampled households for taking their time out of their busy schedule to provide the much needed valuable information

ACF‐USA / West Pokot SMART Survey‐Kenya/ May 2012
LIST OF ABBREVIATIONS AND ACRONYMS
ACF‐USA Action Contre la Faim‐ USA (Action Against Hunger‐USA) ALRMP Arid Lands Resource Management Project ASAL Arid and Semi‐Arid Land CLTS Community Led Total Sanitation CMR Crude Mortality Rate DHIS District Health Information System DHMT District Health Management Team EBF Exclusive Breastfeeding ENA Emergency Nutrition Assessment EPI Expanded Program on Immunization GAM Global Acute Malnutrition GFD General Food Distribution GOK Government of Kenya HINI High Impact Nutrition Interventions HDDS Household Dietary Diversity Score IMAM Integrated Management of Acute Malnutrition NGO Non‐Governmental Organization IYCN Infant and Young Child Nutrition KEMSA Kenya Medical Supply Agency KDHS Kenya Demographic Health Survey MAM Moderate Acute Malnutrition MOMS Ministry of Medical Services MOPHS Ministry of Public Health and Sanitation MUAC Mid Upper Arm Circumference NCHS National Centre for Health Statistics OPV Oral Polio Vaccine OTP Outpatient Therapeutic Program PPS Population Proportion to Size RC Reserve Cluster SAM Severe Acute Malnutrition SFP Supplementary Feeding Program SMART Standardized Monitoring and Assessment of Relief and Transitions U5MR Under Five Mortality Rate UNICEF United Nations Children’s Fund W/H Weight for Height WFP World Food Program WHO World Health Organization
ACF‐USA / West Pokot SMART Survey‐Kenya/ May 2012
1 EXECUTIVE SUMMARY
An integrated nutrition, food security and retrospective mortality survey was undertaken by the Ministry of Health and ACF during the rainy season (May 2012) in West Pokot County. The overall survey objective was to determine the rates of acute malnutrition amongst children aged 6‐59 months and the population’s mortality rates1 in West Pokot County.
SMART2 methodology was utilized in the implementation of the survey. Adequate and prior planning were crucial in actualization of the survey objectives despite heavy rains in the area that constrained access to part of the sampled clusters; a challenge that was tackled by accessing replacement clusters.
Findings from this study revealed critical global acute malnutrition (GAM) rates of 12.3% (9.4 – 16.0) and severe acute malnutrition (SAM) rates of 1.5% (0.7 – 3.2). These findings show no significant difference with the 2011 malnutrition rates recorded during a similar period. Crude and under five mortality rates of 0.22% (0.09 – 0.57) and 0.87%(0.28 – 2.70) respectively were obtained. These lie below the WHO alert and emergency mortality thresholds. Additional information was gathered to provide more insight into factors underlying the acute malnutrition mortality rates (See appendix 1: Summary of Key findings). In summary, high disease incidence, poor infant and young child nutrition, increased distance to facilities that inhibit prompt health care seeking behavior, limited access to safe water, low latrine coverage/ usage and compromised food security are some of the contributing factors to the prevailing malnutrition rates.
The above findings indicate the need for an integrated and concerted effort in tackling the probable determinants of malnutrition in West Pokot.
1Crude and Under five Mortality rates 2 Standardized Monitoring and Assessment in Relief and Transitions

ACF‐USA / West Pokot SMART Survey‐Kenya/ May 2012
2 INTRODUCTION
West Pokot County is an ASAL3 area located in Rift Valley Province. It borders Uganda to the West, Trans‐Nzoia and Marakwet to the South and Turkana to the East. The County covers a surface area of 9100 square km with an estimated population of 512,6904 and an annual population growth rate of 3.1%.
The county is composed of 3 main districts namely West, Central, and North Pokot. These districts consequently form the 3 major livelihood zones of pastoralism, agro‐pastoral, and mixed farming for North, Central and West Pokot districts respectively.
The food security situation in the county was reported to be critical especially in the North and moderate in some areas in May 20115. Analysis of secondary data indicates that stressed levels have been consistent in the agro pastoral zone, while the mixed farming livelihood zone has improved from stressed to no food insecurity in relation to previous assessments6. Despite the food security situation being expected to improve; a number of challenges such as endemic livestock diseases7, high food prices, recurrent droughts, insecurity, and cattle rustling especially in the North and Central Pokot are inevitable.
3 METHODOLOGY
3.1 Type of Survey An integrated nutrition and food security survey was conducted in West Pokot County in May 2012. This was exactly a year since the last one conducted by Samaritan’s Purse in 2011.The survey applied Standardized Monitoring and Assessment of Relief and Transition (SMART) methodology with all the tools tailored as per the MOPHS8 and MOMS9 recommendations for anthropometric and retrospective mortality survey.
Additional household data was collected using structured questionnaires, adjusted to meet the survey objectives in regard to dynamics of the county. The key information collected included WASH10, food security and health/ health care practices.
3.2 Survey Objectives The overall survey objective was to determine the rates of acute malnutrition amongst children aged 6‐59 months and the population’s mortality rates11 in West Pokot County. Specific survey objectives were to; 1. Determine the prevalence of acute malnutrition in the children aged 6‐59months. 2. Determine the Crude and under five mortality rates of the entire population 3. Determine the morbidity rates in children aged 0‐59 months. 4. Estimate the coverage of immunization (measles, OPV1&3), and micronutrient supplementation amongst
children aged 0‐59 months. 5. Estimate the coverage of women supplemented with iron folic acid for 90 days in their last pregnancy 6. Assess household food security, Maternal and Child Health care practices, and water sanitation and hygiene
practices.
3 Arid and Semi‐Arid lands 4KNBS4 2009 Census Report, 5Integrated SMART survey conducted in West Pokot County by Samaritans Purse 6West Pokot 2012 Short Rains Assessment Report 7Peste des Petits Ruminants (PPR) and Contagious Caprine Pleural Pneumonia (CCPP) in goats and East Coast Fever (ECF) in cattle 8Ministry of Public Health and Sanitation 9Ministry of Medical Services 10Water, Sanitation and Hygiene 11Crude and Under five Mortality rates
ACF‐USA / West Pokot SMART Survey‐Kenya/ May 2012
7. Develop capacity amongst focal government ministries and community members in undertaking integrated nutritional surveys
3.3 Sources of Survey Data The survey data was derived from both primary and secondary sources for both quantitative and qualitative forms. Some of the primary data gathered included anthropometry, mortality, IYCN, WASH, FSL and market prices. These were gathered through administration of structured questionnaires at household levels. Secondary data was also obtained from various sources such as MOPHS/MOMS, NDMA12, past survey reports and Yanga’t13 so as to triangulate findings from primary data sets.
3.4 Sampling Methodology
3.4.1 First Stage
A two stage sampling methodology was applied for the survey using ENA for SMART November 2011software. The county population was obtained from the 2009 Census report [The smallest sampling unit (village)].Sample size was then determined by entering the design effect, prevalence rates, desired precision, average household size, and non‐response rate into the ENA for SMART planning phase as shown in the table below.
Table 1: Survey Planning Details
Based on probability to population size (PPS), 39 clusters were randomly selected comprising of 12 households per cluster for data collection. It is however important to note that 10% of the clusters could not be accessed due to heavy rains that flooded and cut off roads. The team thus assessed all the replacement clusters as per SMART methodology guidelines.
3.4.2 Second Stage
The second stage involved obtaining 12 households per cluster during data collection process.
12National Drought Management Authority 13 Community Based Organization that deals with Water Sanitation and Hygiene and Girl Child Education in West Pokot County.
Data entered on ENA software Anthropometric Survey
Rationale
Estimated prevalence of GAM 18.2 Highest GAM C.I in May 2011 survey
Desired precision 4.7 The higher the malnutrition prevalence, the lower the precision as well as objectives
Design effect 2.0 Slight difference in livelihood zones
Average household size 6.8 May 2011 Survey
Percent of under five children 20 Population estimate from DHIS and Census report 2009
Percent of non‐respondent 5 Based on vastness of the area as well as cater for any unforeseen circumstances
Households to be included 465
Data entered on ENA Software Mortality Survey
Estimated death rate per 10000/day
1.98 Highest Crude mortality rate C.I in May 2011 survey
Desired precision 0.8
Design Effect 2.0 Slight difference in livelihood zones
Recall period 90days
Average Household size 6.8 As per May 2011 Survey
Non‐Response 5
Households to be included 445

ACF‐USA / West Pokot SMART Survey‐Kenya/ May 2012
A list of all existing households was obtained per cluster with the help of respective village elders and 12 households selected through simple random sampling. Relevant data was then gathered from each of the twelve sampled households. The anthropometric survey targeted all children aged 6‐59 months in the sampled households whereas the mortality survey targeted all sampled households irrespective of whether they had a child under five years of age or not. Sampled households whose occupants (child and/or caregiver) were not available at the time of the data collection were revisited later during the day.
3.4.3 Survey Schedule and Training
The training of the survey teams (6 team leaders, 2 data entry clerks, 24 enumerators, and 3 ACF staff) was scheduled and conducted from 14th to 18th May 2012 in Kapenguria. The training covered all the important components of the SMART survey. These included the survey objectives, administration of questionnaires in the local language, anthropometric measurements, use of survey tools, interview techniques and how to record the responses during data collection exercise in the household. The primary data collection exercise was planned for 19th to 25th May 2012 for the entire West Pokot County; however, this had to be extended by two days to the 27th May 2012. The extension was mainly due to inaccessibility of 10% of the sampled clusters compelling the exercise to cover the 4 RCs (Reserve Clusters).
3.4.4 Field Work
The field work was mainly data collection, a rigorous exercise aimed at gathering primary data from the sampled villages to make inferences with regard to the survey objectives. It was conducted by 6 teams, each constituted of 4 enumerators (2 data measures and 2 data collectors) and 1 team leader from the Ministry of Health. Coordination and supervision of the entire process was done by ACF Staff.
3.4.5 Data entry, cleaning, and analysis
ENA for SMART software November 2011 version, SPSS version 18, and Microsoft Excel were used for data analysis. Anthropometric data was entered into ENA software on daily basis to determine the quality of gathered data for close monitoring, supervision, and provision of feedback to the teams before going to the field. Household database was made through SPSS exportation into Excel upon entering household questionnaire information into the SPSS for windows version 18. The collected data was subsequently imported into SPSS for correlation and analysis.
3.5 INDICATORS USED
3.5.1 Anthropometric survey
All children aged 6‐59 months were targeted in the entire sampled household for anthropometric survey. The anthropometric data was collected using the anthropometric questionnaire. The information gathered using this tool includes:
Age: Birth certificates, baptism cards as well as birth notifications were used to determine the children’s ages. However, a local events calendar was used in absence of the above documents.
Sex: The child’s sex was documented as Male (M) or Female (F)
Weight: Children’s weight was taken in their undressed state using a 25 kg hanging spring Salter scale to the nearest 100g (recorded to 1 decimal place)
Height/Length: Recumbent length was taken for children less than 85 cm or less than 2 years of age while those greater or equal to 85 cm or more than 2 years of age were measured standing up.
MUAC: Mid Upper Circumference (MUAC) was measured on the left arm with no clothes on the arm, at the middle point between the elbow and the shoulder, while the arm was relaxed and hanging by the body’s side. MUAC was

ACF‐USA / West Pokot SMART Survey‐Kenya/ May 2012
measured to the nearest mm. In the event of a disability the right arm was used or for those who are left‐handed, MUAC was taken on the right arm.
Bilateral Oedema: This was assessed by the application of moderate thumb pressure for at least 3 seconds on both feet. Only children with bilateral Oedema were recorded as having nutritional Oedema.
Measles vaccination: Vaccination cards were used to establish measles vaccination status for children aged 9‐59 months. Lack of immunization card at the time of the survey prompted the enumerators to probe the caretaker further if the child had been immunized against measles or not. For children with confirmed immunization (by date) on the vaccination card, the status was recorded as “1” (Card) otherwise as “0” (No). Oral confirmation from the caretaker without confirmation by card was recorded as “2” (caretaker’s verification). All children less than 9 months old were excluded from measles analysis.
Oral Polio Vaccination: The vaccine cards were used to establish if the child had received OPV. However, where there was no card the caretakers were asked to give a recall confirmation if the child had received the oral polio vaccine.
De‐worming: The caretakers were probed to determine if children between 2 and 5 years had been de‐wormed twice annually.
Vitamin A coverage: This was established by the number of times vitamin A was administered to the eligible child in the past one year. The answer was further probed and subsequently recorded in the anthropometric questionnaire and analyzed based on the recommended two age group categories
3.5.2 Mortality survey:
Pertinent mortality data was recorded in all the 12 sampled households per cluster by use of a standard mortality questionnaire. In case of absence of members of a sampled household or empty households, the teams constantly inquired about their location from the neighbors and came back later before leaving the village. Sampled households were not replaced during the exercise.
3.5.3 Health, WASH and Food Security& Livelihoods:
A structured household questionnaire was used to obtain the above data from all the sampled households.
3.6 DATA QUALITY CONTROL AND ASSURANCE
The entire survey team was trained for five days (to include standardization and pilot tests) prior to the data collection exercise. The training content was tailored to focus on study objectives and methodology. Emphasis was placed on accuracy and precision in taking anthropometric measurements, data collection tools and appropriate administration of the questionnaires to the respondents in the local language. Each of the six survey teams had a team leader from the MOH to oversee the data collection exercise.
Data entry was undertaken on daily basis to ensure quality of work by running plausibility reports for each team. This formed a check basis upon which feedback would be given to all the teams in the morning before proceeding to the field.
4 SURVEY LIMITATIONS/CONSTRAINTS
The following constraints were encountered during the survey: a. This was a cross‐sectional study. The results should therefore be cautiously interpreted because it gives
the nutritional status of the specific study area at the specified time. All the causal factors are probable causes.

ACF‐USA / West Pokot SMART Survey‐Kenya/ May 2012
b. The survey was undertaken during the rainy season and this caused logistical challenges that hampered access to 10%14 of the39 sampled clusters, thereby, leaving the survey teams with no option other than visiting all the reserve clusters (RCs) as per SMART methodology guidelines.
c. Deaths issues are surreptitiously held by the community. Divulgence of such information especially by the mothers was a major challenge.
d. Difficulties in determining the livestock count per household as the community considers counting of their livestock culturally unethical.
5 SURVEY RESULTS
5.1 ANTHROPOMETRIC SURVEY
5.1.1 Distribution by age and sex
A total of 289 boys and 248 girls aged between 6 and 59 months were assessed in the anthropometric survey. The overall sex ratio attained p‐value of 0.077 thus boys and girls were equally represented.
Table 2: Distribution of age and sex of sample
The sex ratios across the various age groups were within acceptable range except for age group 6‐17(1.3) and 30‐41 (1.3). This could be as a result of age recall as 32.4% of the ages were estimations made by use of an events calendar.
Figure 1: Distribution of sex by age group
5.1.2 Distribution of Acute Malnutrition in Z‐score, WHO 2006 standards
Table 4 below shows the distribution of acute malnutrition by age group in z‐score and/or Oedema as per WHO standards. As illustrated below, majority of the children in all age groups are normal with severely and moderately malnourished children by Z score accounting for 1.3% and 10.8% respectively. It is important to note that one
14Four clusters
-80 -60 -40 -20 0 20 40 60 80
6-17
18-29
30-41
42-53
54-59
PERCENTAGE
Ag
e in
mo
nth
s
GIRLS BOYS
AGE (months) Boys Girls Total Ratio
no. % no. % no. % Boy: girl
6‐17 76 57.1 57 42.9 133 24.8 1.3
18‐29 65 50.8 63 49.2 128 23.8 1.0
30‐41 67 55.8 53 44.2 120 22.3 1.3
42‐53 56 51.4 53 48.6 109 20.3 1.1
54‐59 25 53.2 22 46.8 47 8.8 1.1
Total 289 53.8 248 46.2 537 100.0 1.2
ACF‐USA / West Pokot SMART Survey‐Kenya/ May 2012
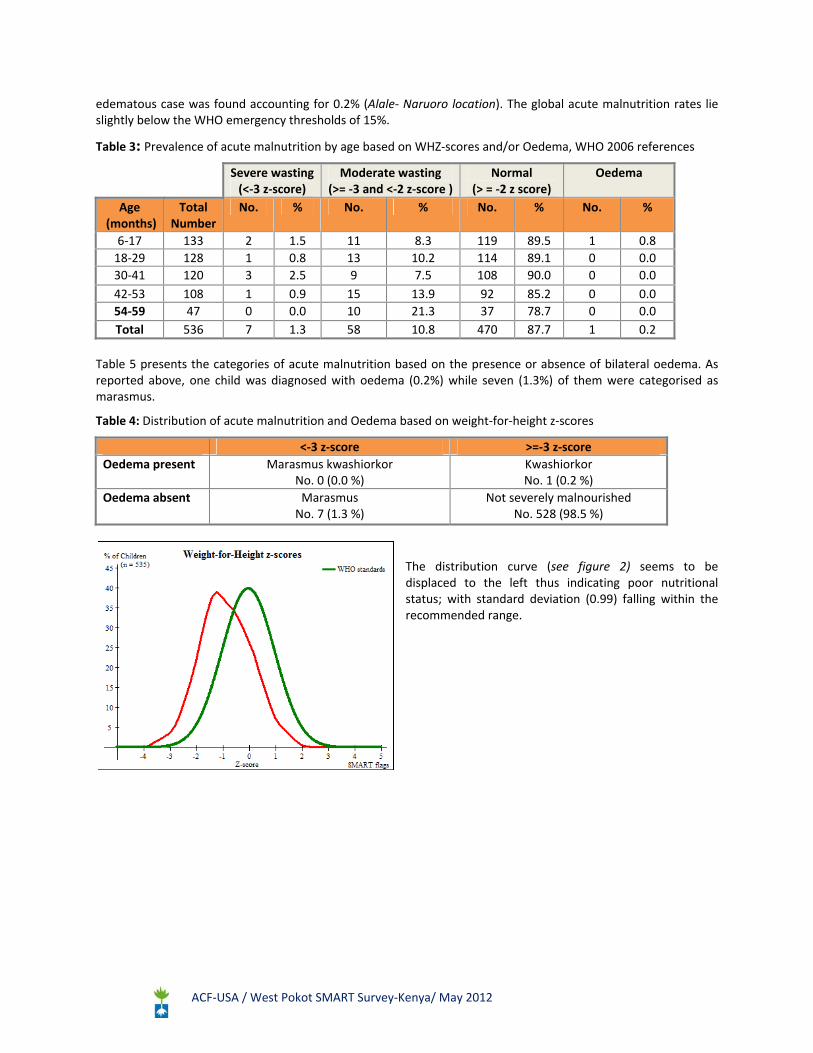
edematous case was found accounting for 0.2% (Alale‐ Naruoro location). The global acute malnutrition rates lie slightly below the WHO emergency thresholds of 15%.
Table 3: Prevalence of acute malnutrition by age based on WHZ‐scores and/or Oedema, WHO 2006 references
Severe wasting (<‐3 z‐score)
Moderate wasting (>= ‐3 and <‐2 z‐score )
Normal(> = ‐2 z score)
Oedema
Age (months)
Total Number
No. % No. % No. % No. %
6‐17 133 2 1.5 11 8.3 119 89.5 1 0.8
18‐29 128 1 0.8 13 10.2 114 89.1 0 0.0
30‐41 120 3 2.5 9 7.5 108 90.0 0 0.0
42‐53 108 1 0.9 15 13.9 92 85.2 0 0.0
54‐59 47 0 0.0 10 21.3 37 78.7 0 0.0
Total 536 7 1.3 58 10.8 470 87.7 1 0.2
Table 5 presents the categories of acute malnutrition based on the presence or absence of bilateral oedema. As reported above, one child was diagnosed with oedema (0.2%) while seven (1.3%) of them were categorised as marasmus.
Table 4: Distribution of acute malnutrition and Oedema based on weight‐for‐height z‐scores
<‐3 z‐score >=‐3 z‐score
Oedema present Marasmus kwashiorkorNo. 0 (0.0 %)
Kwashiorkor No. 1 (0.2 %)
Oedema absent MarasmusNo. 7 (1.3 %)
Not severely malnourished No. 528 (98.5 %)
The distribution curve (see figure 2) seems to be displaced to the left thus indicating poor nutritional status; with standard deviation (0.99) falling within the recommended range.
ACF‐USA / West Pokot SMART Survey‐Kenya/ May 2012
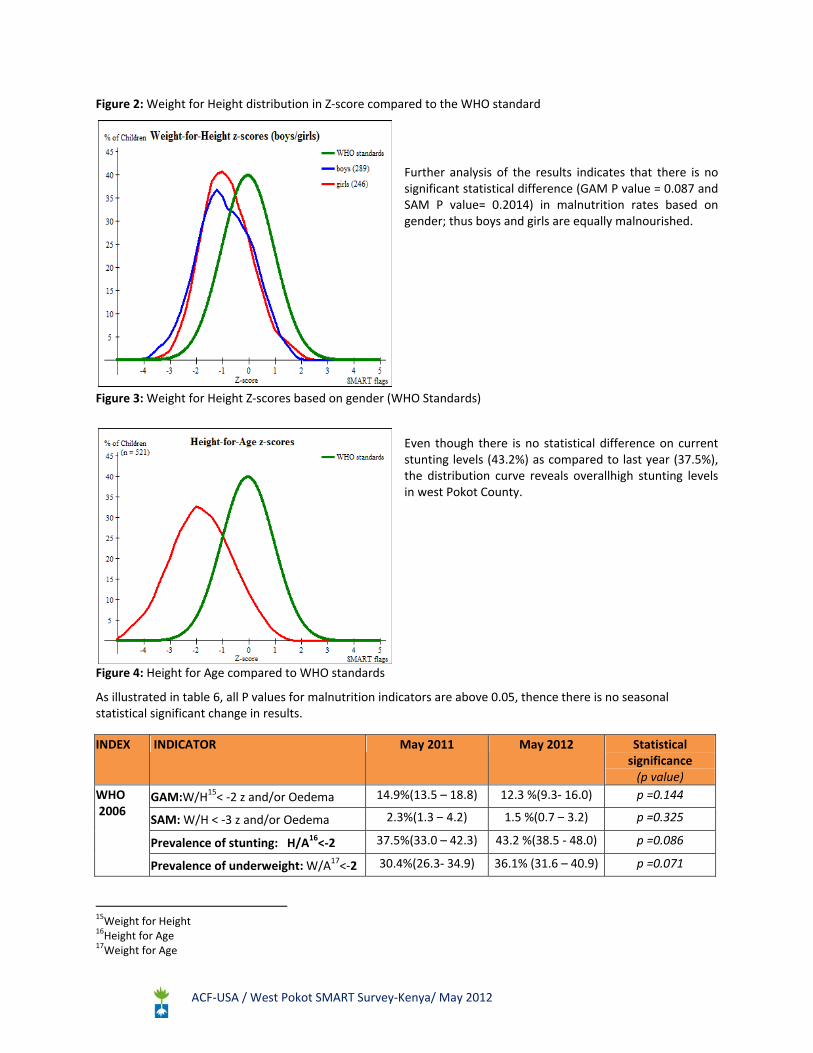
Figure 2: Weight for Height distribution in Z‐score compared to the WHO standard
Further analysis of the results indicates that there is no significant statistical difference (GAM P value = 0.087 and SAM P value= 0.2014) in malnutrition rates based on gender; thus boys and girls are equally malnourished.
Figure 3: Weight for Height Z‐scores based on gender (WHO Standards)
Even though there is no statistical difference on current stunting levels (43.2%) as compared to last year (37.5%), the distribution curve reveals overallhigh stunting levels in west Pokot County.
Figure 4: Height for Age compared to WHO standards
As illustrated in table 6, all P values for malnutrition indicators are above 0.05, thence there is no seasonal statistical significant change in results.
INDEX INDICATOR May 2011 May 2012 Statistical significance (p value)
WHO 2006
GAM:W/H15< ‐2 z and/or Oedema 14.9%(13.5 – 18.8) 12.3 %(9.3‐ 16.0) p =0.144
SAM: W/H < ‐3 z and/or Oedema 2.3%(1.3 – 4.2) 1.5 %(0.7 – 3.2) p =0.325
Prevalence of stunting: H/A16<‐2 37.5%(33.0 – 42.3) 43.2 %(38.5 ‐ 48.0) p =0.086
Prevalence of underweight: W/A17<‐2 30.4%(26.3‐ 34.9) 36.1% (31.6 – 40.9) p =0.071
15Weight for Height 16Height for Age 17Weight for Age
ACF‐USA / West Pokot SMART Survey‐Kenya/ May 2012
Table 5: Seasonal comparison in Malnutrition rates
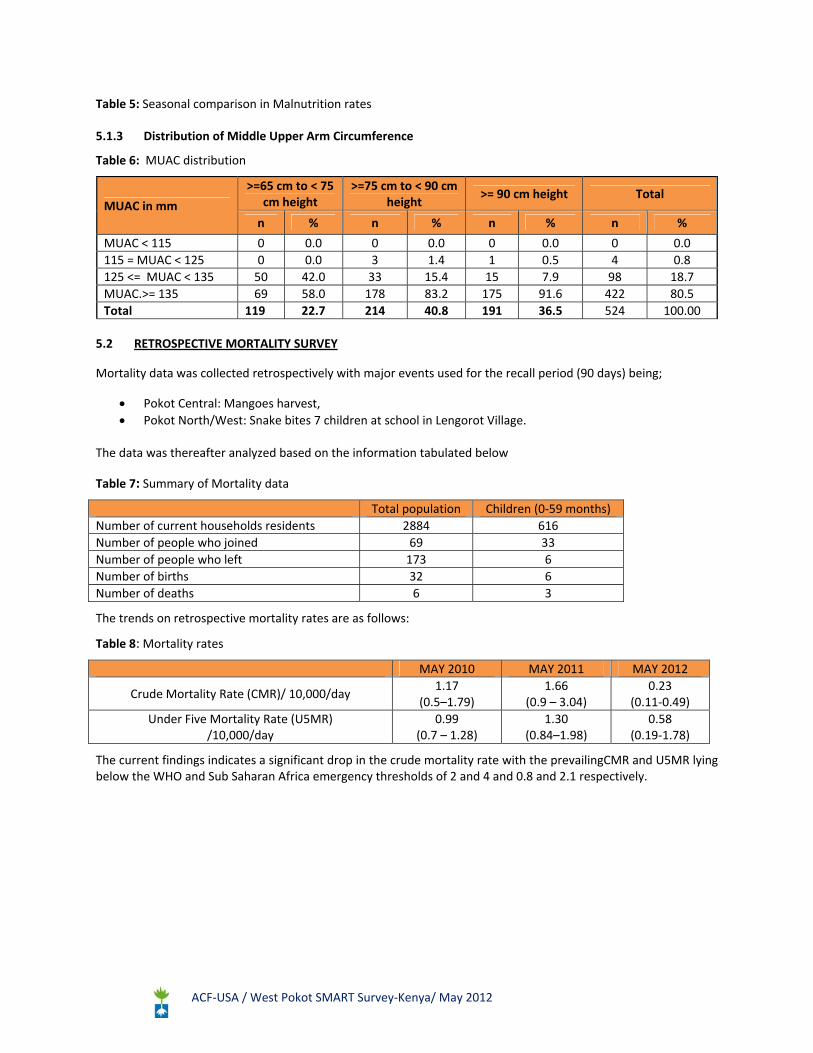
5.1.3 Distribution of Middle Upper Arm Circumference
Table 6: MUAC distribution
MUAC in mm
>=65 cm to < 75 cm height
>=75 cm to < 90 cm height
>= 90 cm height Total
n % n % n % n %
MUAC < 115 0 0.0 0 0.0 0 0.0 0 0.0
115 = MUAC < 125 0 0.0 3 1.4 1 0.5 4 0.8
125 <= MUAC < 135 50 42.0 33 15.4 15 7.9 98 18.7
MUAC.>= 135 69 58.0 178 83.2 175 91.6 422 80.5
Total 119 22.7 214 40.8 191 36.5 524 100.00
5.2 RETROSPECTIVE MORTALITY SURVEY
Mortality data was collected retrospectively with major events used for the recall period (90 days) being;
Pokot Central: Mangoes harvest,
Pokot North/West: Snake bites 7 children at school in Lengorot Village.
The data was thereafter analyzed based on the information tabulated below
Table 7: Summary of Mortality data
Total population Children (0‐59 months)
Number of current households residents 2884 616
Number of people who joined 69 33
Number of people who left 173 6
Number of births 32 6
Number of deaths 6 3
The trends on retrospective mortality rates are as follows:
Table 8: Mortality rates
MAY 2010 MAY 2011 MAY 2012
Crude Mortality Rate (CMR)/ 10,000/day 1.17
(0.5–1.79) 1.66
(0.9 – 3.04) 0.23
(0.11‐0.49)
Under Five Mortality Rate (U5MR)/10,000/day
0.99(0.7 – 1.28)
1.30(0.84–1.98)
0.58(0.19‐1.78)
The current findings indicates a significant drop in the crude mortality rate with the prevailingCMR and U5MR lying below the WHO and Sub Saharan Africa emergency thresholds of 2 and 4 and 0.8 and 2.1 respectively.

ACF‐USA / West Pokot SMART Survey‐Kenya/ May 2012
5.3 SOCIO‐DEMOGRAPHIC CHARACTERISTICS OF THE RESPONDENTS
Most (85.3%) households in West Pokot County are male headed; female headed household accounted for 14.7%.Theaverage household size was of 6members.
Figure 5 illustrates the main source of livelihood for household head in the county, indicating crop production as the predominant (43.4%) livelihood source.
Figure 5: Main source of livelihood
5.4 HEALTH AND NUTRITION
Micro‐nutrient supplementation, de‐worming, measles/OPV immunization, morbidity and bed net coverage are the High Impact Nutrition Interventions (HINI) and health related indicators assessed during the SMART survey. HINI program has been implemented in the survey area since November 2011.
Morbidity for children aged 0 to 59 months old based on a two week recall period prior to the survey date was assessed. However, the results are incomparable with previous survey results (6‐59 months).
About a third (35.5%) of the households with children under five years of age reported to have either of their children sick two weeks before the survey. As illustrated, diarrhea incidences accounted for the highest percentages (49.6%).
Figure 6: Morbidity rates
Figure 7 below indicates the different measures taken by caregivers in management of the diarrheal cases reported during the survey. Zinc supplementation during these episodes account for the least (1.6%) percentage. This is way below the national target of 80.0%. Nevertheless, the proportion has shown a slight improvement in comparison with KDHS Report 2008‐9 (0.0%).
0 20 40 60
ARI
Malaria
Diarrhoea
Cough
Others
Morbidity rates amongst children aged 0‐59 months
0 10 20 30 40 50
Livestock keeping
crop production
salaried
Daily wage labor
Petty trade
Fuel wood products
Others
MAIN SOURCE OF LIVELIHOOD FOR HOUSEHOLD HEAD

ACF‐USA / West Pokot SMART Survey‐Kenya/ May 2012
The minimal usage of the zinc tablets is highly attributed to its shortage at the health facilities with confirmation that it was missing in the KEMSA18 kit in the last 2 supplies (January and March 2012).
Figure 7: Diarrhoea management19
80.3% of the caretakers sought some assistance when the children were sick. However, quality of the services sought was pretty poor with less than half (39.2%) visiting public clinics for medical assistance. This could be highly attributed to the fact that some villages are located far away from the health facilities with inaccessible terrains. Important to note is that MSF20is one of the NGOs responding to health issues (treatment of endemic diseases) in West Pokot County.
Figure 8: Health seeking behavior
Malaria incidences were reported at 31.2%. Mosquito bed net usage and ownership was therefore assessed in order to determine appropriate malaria prevention and control practices in West Pokot County. The results are presented in the figure below.
18Kenya Medical Supplies Agency 19Homemade liquids refers to use of either porridge, soup, tea or milk in management of diarrhea 20Médecins Sans Frontières
0
10
20
30
40
50
Public clinic Shop Private clinic Traditionalherbs/healer
Communityhealthworker
Relatives NGO mobile clinic
Health seeking behaviour in times of illness; May 2012
0 10 20 30
ORS
Home‐made Sugar /Salt Soln
Home‐made liquids
Zinc
Others
Management of diarheoa episodes amongst children 0‐59 months in West Pokot County; May 2012
ACF‐USA / West Pokot SMART Survey‐Kenya/ May 2012
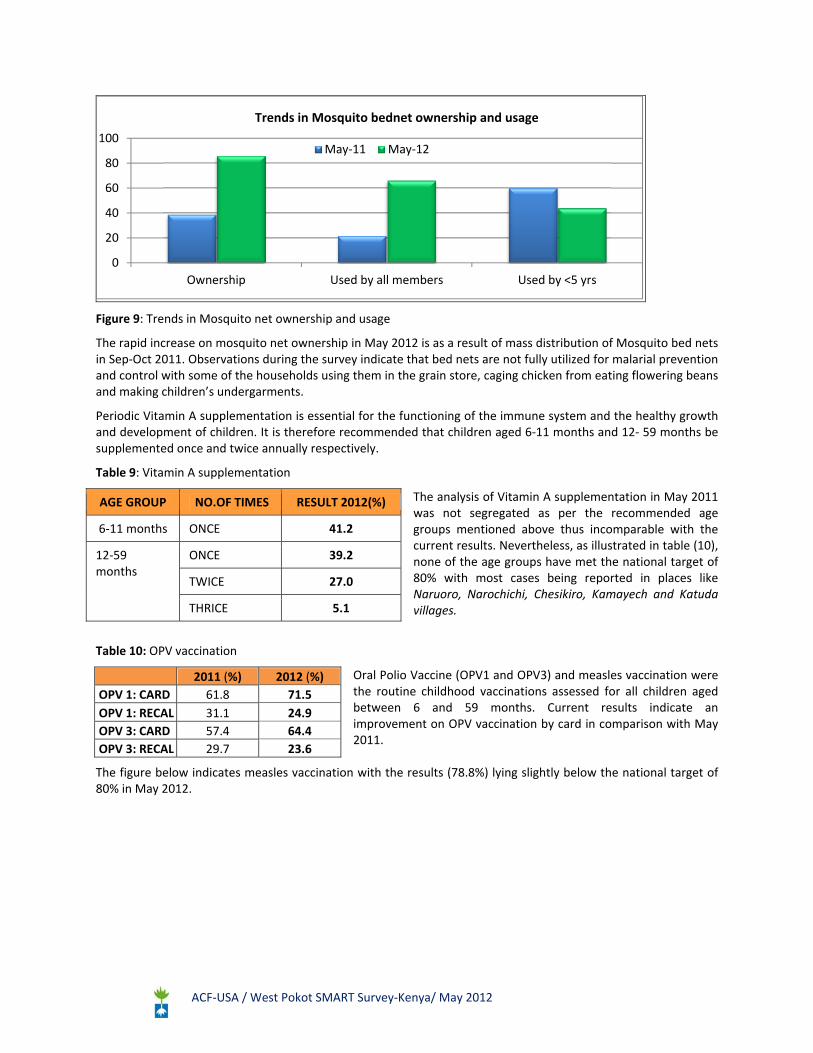
Figure 9: Trends in Mosquito net ownership and usage
The rapid increase on mosquito net ownership in May 2012 is as a result of mass distribution of Mosquito bed nets in Sep‐Oct 2011. Observations during the survey indicate that bed nets are not fully utilized for malarial prevention and control with some of the households using them in the grain store, caging chicken from eating flowering beans and making children’s undergarments.
Periodic Vitamin A supplementation is essential for the functioning of the immune system and the healthy growth and development of children. It is therefore recommended that children aged 6‐11 months and 12‐ 59 months be supplemented once and twice annually respectively.
Table 9: Vitamin A supplementation
The analysis of Vitamin A supplementation in May 2011 was not segregated as per the recommended age groups mentioned above thus incomparable with the current results. Nevertheless, as illustrated in table (10), none of the age groups have met the national target of 80% with most cases being reported in places like Naruoro, Narochichi, Chesikiro, Kamayech and Katuda villages.
Table 10: OPV vaccination
Oral Polio Vaccine (OPV1 and OPV3) and measles vaccination were the routine childhood vaccinations assessed for all children aged between 6 and 59 months. Current results indicate an improvement on OPV vaccination by card in comparison with May 2011.
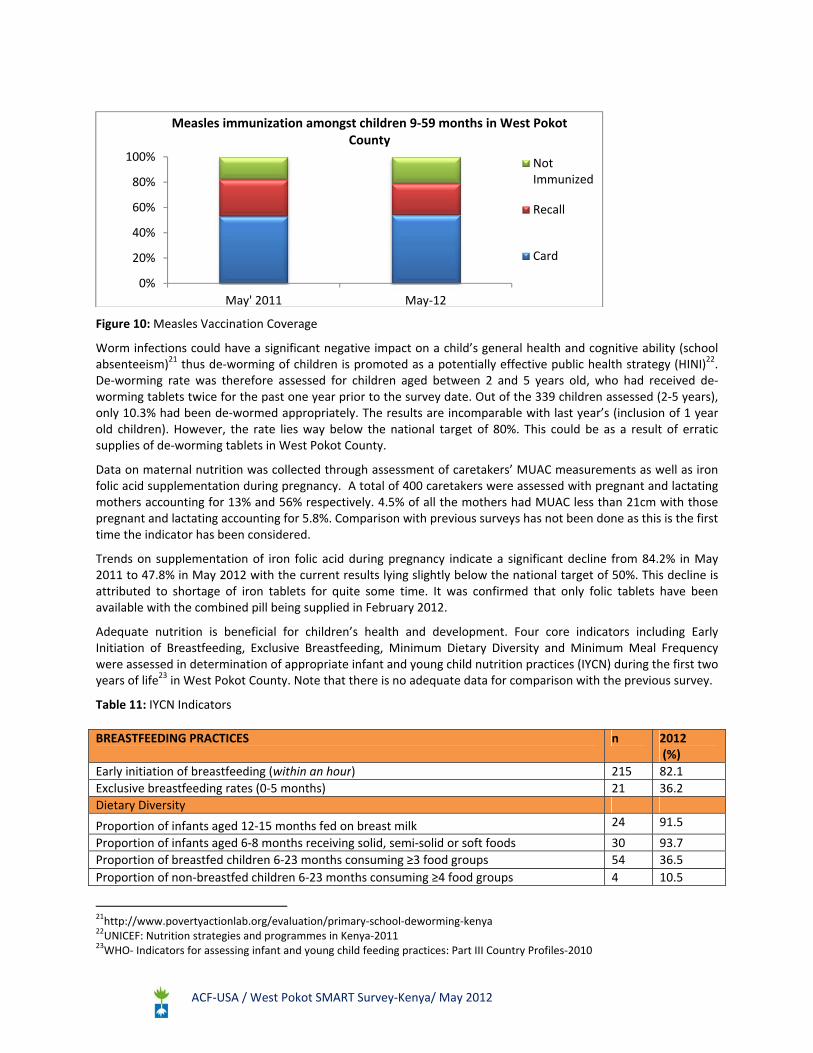
The figure below indicates measles vaccination with the results (78.8%) lying slightly below the national target of 80% in May 2012.
0
20
40
60
80
100
Ownership Used by all members Used by <5 yrs
Trends in Mosquito bednet ownership and usage
May‐11 May‐12
AGE GROUP NO.OF TIMES RESULT 2012(%)
6‐11 months ONCE 41.2
12‐59 months
ONCE 39.2
TWICE 27.0
THRICE 5.1
2011 (%) 2012 (%)
OPV 1: CARD 61.8 71.5
OPV 1: RECAL 31.1 24.9
OPV 3: CARD 57.4 64.4
OPV 3: RECAL 29.7 23.6
ACF‐USA / West Pokot SMART Survey‐Kenya/ May 2012
Figure 10: Measles Vaccination Coverage
Worm infections could have a significant negative impact on a child’s general health and cognitive ability (school absenteeism)21 thus de‐worming of children is promoted as a potentially effective public health strategy (HINI)22. De‐worming rate was therefore assessed for children aged between 2 and 5 years old, who had received de‐worming tablets twice for the past one year prior to the survey date. Out of the 339 children assessed (2‐5 years), only 10.3% had been de‐wormed appropriately. The results are incomparable with last year’s (inclusion of 1 year old children). However, the rate lies way below the national target of 80%. This could be as a result of erratic supplies of de‐worming tablets in West Pokot County.
Data on maternal nutrition was collected through assessment of caretakers’ MUAC measurements as well as iron folic acid supplementation during pregnancy. A total of 400 caretakers were assessed with pregnant and lactating mothers accounting for 13% and 56% respectively. 4.5% of all the mothers had MUAC less than 21cm with those pregnant and lactating accounting for 5.8%. Comparison with previous surveys has not been done as this is the first time the indicator has been considered.
Trends on supplementation of iron folic acid during pregnancy indicate a significant decline from 84.2% in May 2011 to 47.8% in May 2012 with the current results lying slightly below the national target of 50%. This decline is attributed to shortage of iron tablets for quite some time. It was confirmed that only folic tablets have been available with the combined pill being supplied in February 2012.
Adequate nutrition is beneficial for children’s health and development. Four core indicators including Early Initiation of Breastfeeding, Exclusive Breastfeeding, Minimum Dietary Diversity and Minimum Meal Frequency were assessed in determination of appropriate infant and young child nutrition practices (IYCN) during the first two years of life23 in West Pokot County. Note that there is no adequate data for comparison with the previous survey.
Table 11: IYCN Indicators
21http://www.povertyactionlab.org/evaluation/primary‐school‐deworming‐kenya 22UNICEF: Nutrition strategies and programmes in Kenya‐2011 23WHO‐ Indicators for assessing infant and young child feeding practices: Part III Country Profiles‐2010
0%
20%
40%
60%
80%
100%
May' 2011 May‐12
Measles immunization amongst children 9‐59 months in West Pokot County
NotImmunized
Recall
Card
BREASTFEEDING PRACTICES n 2012 (%)
Early initiation of breastfeeding (within an hour) 215 82.1
Exclusive breastfeeding rates (0‐5 months) 21 36.2
Dietary Diversity
Proportion of infants aged 12‐15 months fed on breast milk 24 91.5
Proportion of infants aged 6‐8 months receiving solid, semi‐solid or soft foods 30 93.7
Proportion of breastfed children 6‐23 months consuming ≥3 food groups 54 36.5
Proportion of non‐breastfed children 6‐23 months consuming ≥4 food groups 4 10.5

ACF‐USA / West Pokot SMART Survey‐Kenya/ May 2012
It is recommended24 that breastfeeding should be initiated within the first hour of life and the baby be exclusively breastfed (EBF) for the first 6 months. Current findings indicate that early initiation of breastfeeding (82.1%) is above the national target of 70% with EBF accounting for 36.2% which is way below the national target of 50%.
Complementary feeding is the transition from EBF to family foods from 6 to 24 months, thus the complementary food should be timely, adequate and diversified in order to cover the nutritional needs of the growing child while maintaining breastfeeding25. The proportion of children receiving timely and adequate amount of complementary food accounted for 93.7% and 73.8% respectively. However, diversification of the food was minimal with the proportion receiving adequate dietary diversity accounting for 31.2%.
5.5 WATER SANITATION AND HYGIENE
West Pokot County experiences two rainy seasons; the long rains, from March to June, and the short rains, from mid‐October to mid‐November. The timing of the SMART survey fell during the long rains season which posed a big challenge due to the heavy pour experienced during the data collection exercise. Moreover, floods occurred in some parts of the County which caused displacement of about 150 households and death of five children (struck by lightning) as per initial assessment conducted by Kenya Red Cross Society26.
Inadequate access to safe water and sanitation services, coupled with poor hygiene practices, kills and sickens thousands of children every day, and leads to impoverishment and diminished opportunities for thousands more27. This section presents analyses for the core indicators of WASH28.
WATER ACCESS
The figure below presents the main water sources reported during the survey.
Figure 11: Water accessibility
24WHO‐ Indicators for assessing infant and young child feeding practices: Part III Country Profiles‐2010 25WHO‐ Indicators for assessing infant and young child feeding practices: Part III Country Profiles‐2010 26 Emergency Appeal; Kenya: Complex Emergency (Floods, Drought and Civil Unrest) 11th June 2012 27 WHO/UNICEF Joint Monitoring Programme for Water Supply and Sanitation (JMP)‐2012 28Water, Sanitation and Hygiene
0 10 20 30 40 50 60
Tap water
Protected borehole
Protected spring
River
Unprotected borehole
Dam
Laga
Unprotected springDrinking Water sources in West Pokot County; May 2012
SAFE WATER SOURCES
Proportion of both breastfed and non‐breastfed children 6‐23 months consuming ≥ 3 or ≥ 4 food groups respectively
58 31.2
Minimum Meal times
Proportion of breastfed children 6‐8 months and 6‐ 23 months having at least 2 meals and ≥ 3 meals a day respectively
145 80.5
Proportion of non‐breastfed children 6‐23 months having ≥4 meals a day 16 42.1
Proportion of breastfed children 6‐8 months, 6‐23 months and non‐breastfed 6‐23 months having ≥2, ≥3 and≥4 meals a day respectively
161 73.8
UNSAFE WATER SOURCE
ACF‐USA / West Pokot SMART Survey‐Kenya/ May 2012
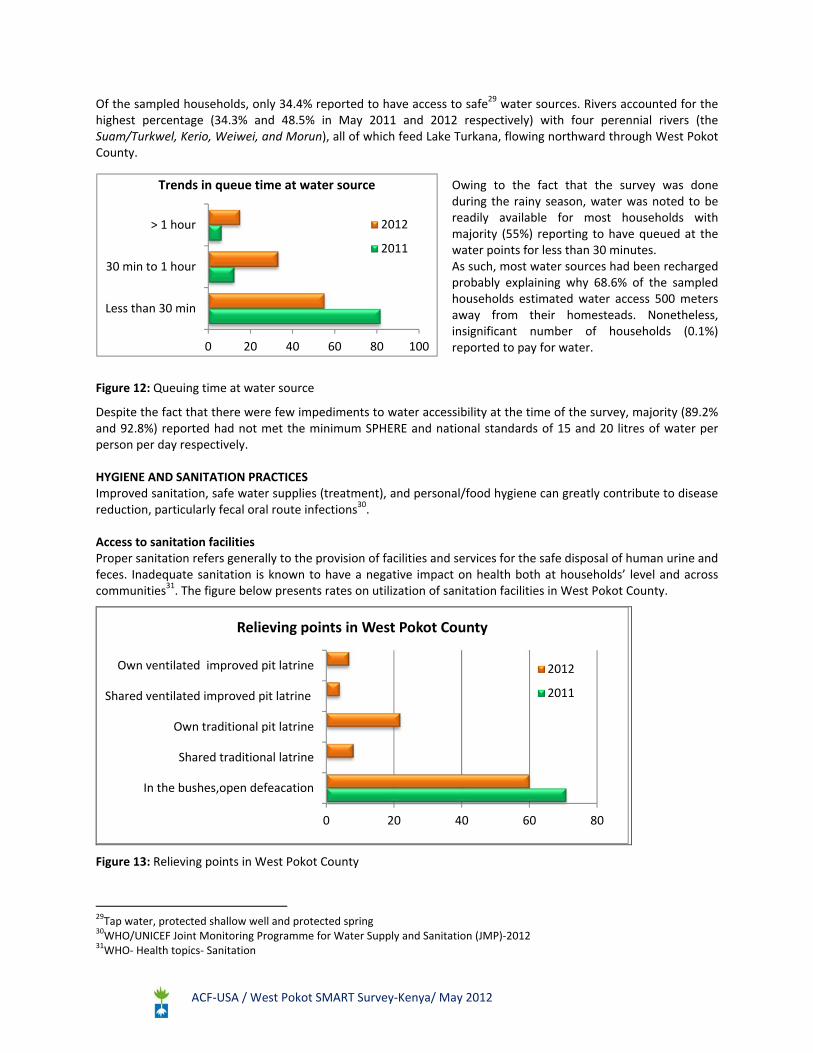
Of the sampled households, only 34.4% reported to have access to safe29 water sources. Rivers accounted for the highest percentage (34.3% and 48.5% in May 2011 and 2012 respectively) with four perennial rivers (the Suam/Turkwel, Kerio, Weiwei, and Morun), all of which feed Lake Turkana, flowing northward through West Pokot County.
Owing to the fact that the survey was done during the rainy season, water was noted to be readily available for most households with majority (55%) reporting to have queued at the water points for less than 30 minutes. As such, most water sources had been recharged probably explaining why 68.6% of the sampled households estimated water access 500 meters away from their homesteads. Nonetheless, insignificant number of households (0.1%) reported to pay for water.
Figure 12: Queuing time at water source
Despite the fact that there were few impediments to water accessibility at the time of the survey, majority (89.2% and 92.8%) reported had not met the minimum SPHERE and national standards of 15 and 20 litres of water per person per day respectively. HYGIENE AND SANITATION PRACTICES Improved sanitation, safe water supplies (treatment), and personal/food hygiene can greatly contribute to disease reduction, particularly fecal oral route infections30. Access to sanitation facilities Proper sanitation refers generally to the provision of facilities and services for the safe disposal of human urine and feces. Inadequate sanitation is known to have a negative impact on health both at households’ level and across communities31. The figure below presents rates on utilization of sanitation facilities in West Pokot County.
Figure 13: Relieving points in West Pokot County
29Tap water, protected shallow well and protected spring 30WHO/UNICEF Joint Monitoring Programme for Water Supply and Sanitation (JMP)‐2012 31WHO‐ Health topics‐ Sanitation
0 20 40 60 80
In the bushes,open defeacation
Shared traditional latrine
Own traditional pit latrine
Shared ventilated improved pit latrine
Own ventilated improved pit latrine
Relieving points in West Pokot County
2012
2011
0 20 40 60 80 100
Less than 30 min
30 min to 1 hour
> 1 hour
Trends in queue time at water source
2012
2011
ACF‐USA / West Pokot SMART Survey‐Kenya/ May 2012
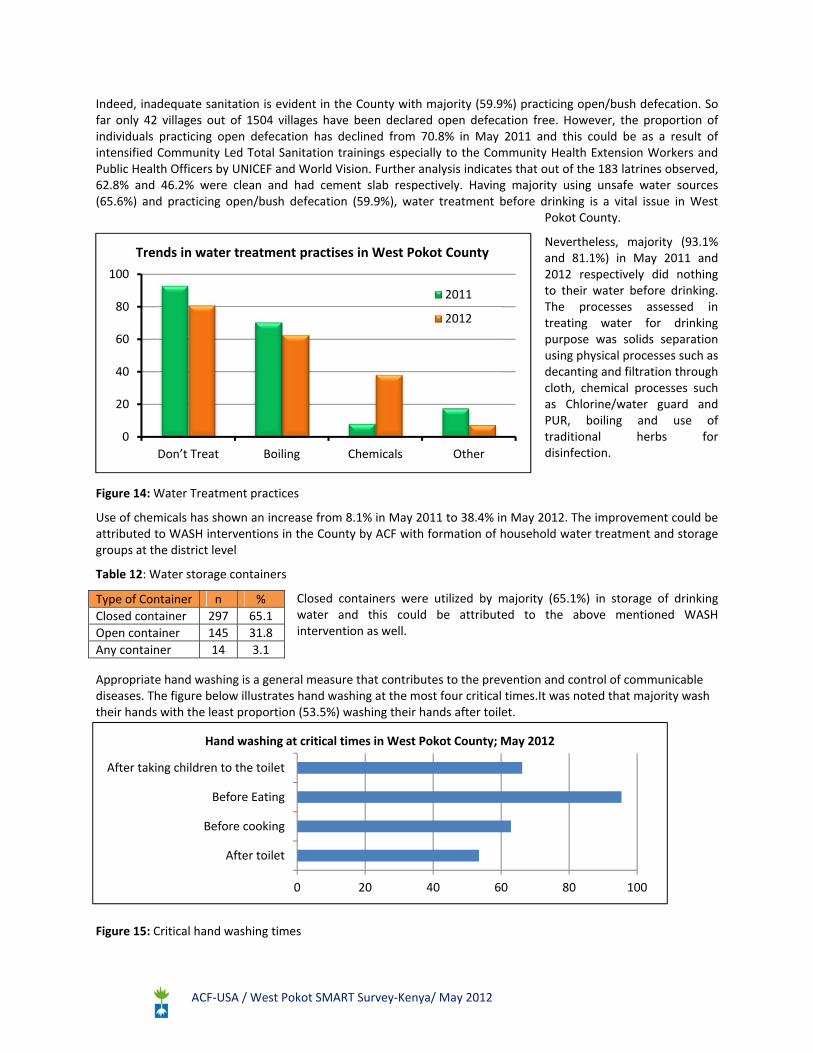
Indeed, inadequate sanitation is evident in the County with majority (59.9%) practicing open/bush defecation. So far only 42 villages out of 1504 villages have been declared open defecation free. However, the proportion of individuals practicing open defecation has declined from 70.8% in May 2011 and this could be as a result of intensified Community Led Total Sanitation trainings especially to the Community Health Extension Workers and Public Health Officers by UNICEF and World Vision. Further analysis indicates that out of the 183 latrines observed, 62.8% and 46.2% were clean and had cement slab respectively. Having majority using unsafe water sources (65.6%) and practicing open/bush defecation (59.9%), water treatment before drinking is a vital issue in West
Pokot County.
Nevertheless, majority (93.1% and 81.1%) in May 2011 and 2012 respectively did nothing to their water before drinking. The processes assessed in treating water for drinking purpose was solids separation using physical processes such as decanting and filtration through cloth, chemical processes such as Chlorine/water guard and PUR, boiling and use of traditional herbs for disinfection.
Figure 14: Water Treatment practices
Use of chemicals has shown an increase from 8.1% in May 2011 to 38.4% in May 2012. The improvement could be attributed to WASH interventions in the County by ACF with formation of household water treatment and storage groups at the district level
Table 12: Water storage containers
Closed containers were utilized by majority (65.1%) in storage of drinking water and this could be attributed to the above mentioned WASH intervention as well.
Appropriate hand washing is a general measure that contributes to the prevention and control of communicable diseases. The figure below illustrates hand washing at the most four critical times.It was noted that majority wash their hands with the least proportion (53.5%) washing their hands after toilet.
Figure 15: Critical hand washing times
Type of Container n %
Closed container 297 65.1
Open container 145 31.8
Any container 14 3.1
0
20
40
60
80
100
Don’t Treat Boiling Chemicals Other
2011
2012
Trends in water treatment practises in West Pokot County
0 20 40 60 80 100
After toilet
Before cooking
Before Eating
After taking children to the toilet
Hand washing at critical times in West Pokot County; May 2012
ACF‐USA / West Pokot SMART Survey‐Kenya/ May 2012
Table 13: Appropriate hand washing practices
Further analysis indicates that quite a big number of the caregivers (39.0% and 16.9%) use only water and soap only when they can afford it respectively. Therefore, appropriate hand washing practices of caregivers (43.5%) is below the national target of 80%.
5.6 FOOD SECURITY AND LIVELIHOODS
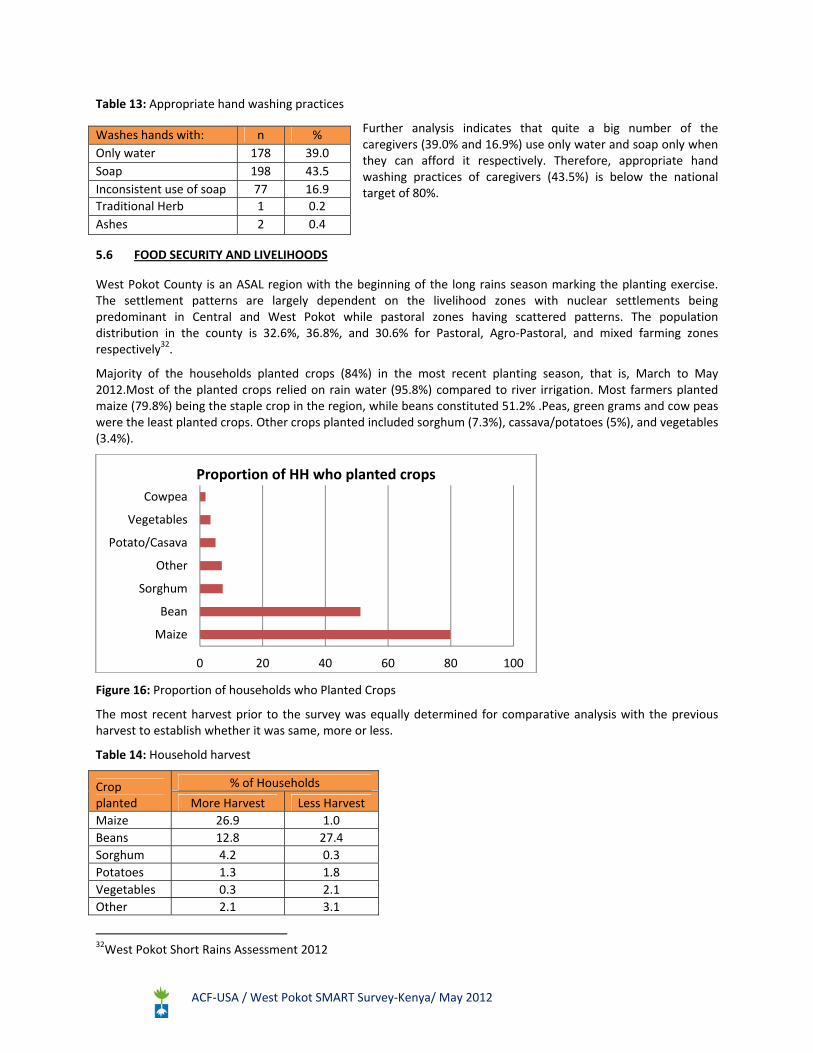
West Pokot County is an ASAL region with the beginning of the long rains season marking the planting exercise. The settlement patterns are largely dependent on the livelihood zones with nuclear settlements being predominant in Central and West Pokot while pastoral zones having scattered patterns. The population distribution in the county is 32.6%, 36.8%, and 30.6% for Pastoral, Agro‐Pastoral, and mixed farming zones respectively32.
Majority of the households planted crops (84%) in the most recent planting season, that is, March to May 2012.Most of the planted crops relied on rain water (95.8%) compared to river irrigation. Most farmers planted maize (79.8%) being the staple crop in the region, while beans constituted 51.2% .Peas, green grams and cow peas were the least planted crops. Other crops planted included sorghum (7.3%), cassava/potatoes (5%), and vegetables (3.4%).
Figure 16: Proportion of households who Planted Crops
The most recent harvest prior to the survey was equally determined for comparative analysis with the previous harvest to establish whether it was same, more or less.
Table 14: Household harvest
Crop planted
% of Households
More Harvest Less Harvest
Maize 26.9 1.0
Beans 12.8 27.4
Sorghum 4.2 0.3
Potatoes 1.3 1.8
Vegetables 0.3 2.1
Other 2.1 3.1
32West Pokot Short Rains Assessment 2012
0 20 40 60 80 100
Maize
Bean
Sorghum
Other
Potato/Casava
Vegetables
Cowpea
Proportion of HH who planted crops
Washes hands with: n %
Only water 178 39.0
Soap 198 43.5
Inconsistent use of soap 77 16.9
Traditional Herb 1 0.2
Ashes 2 0.4
ACF‐USA / West Pokot SMART Survey‐Kenya/ May 2012
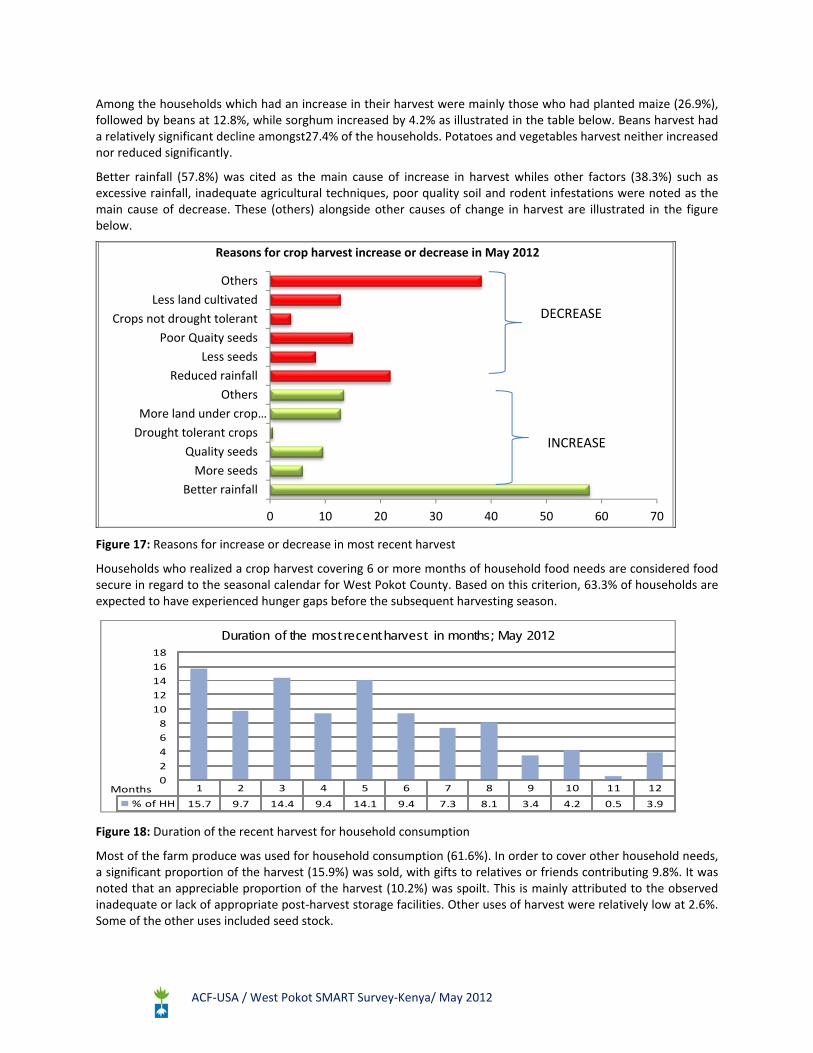
Among the households which had an increase in their harvest were mainly those who had planted maize (26.9%), followed by beans at 12.8%, while sorghum increased by 4.2% as illustrated in the table below. Beans harvest had a relatively significant decline amongst27.4% of the households. Potatoes and vegetables harvest neither increased nor reduced significantly.
Better rainfall (57.8%) was cited as the main cause of increase in harvest whiles other factors (38.3%) such as excessive rainfall, inadequate agricultural techniques, poor quality soil and rodent infestations were noted as the main cause of decrease. These (others) alongside other causes of change in harvest are illustrated in the figure below.
Figure 17: Reasons for increase or decrease in most recent harvest
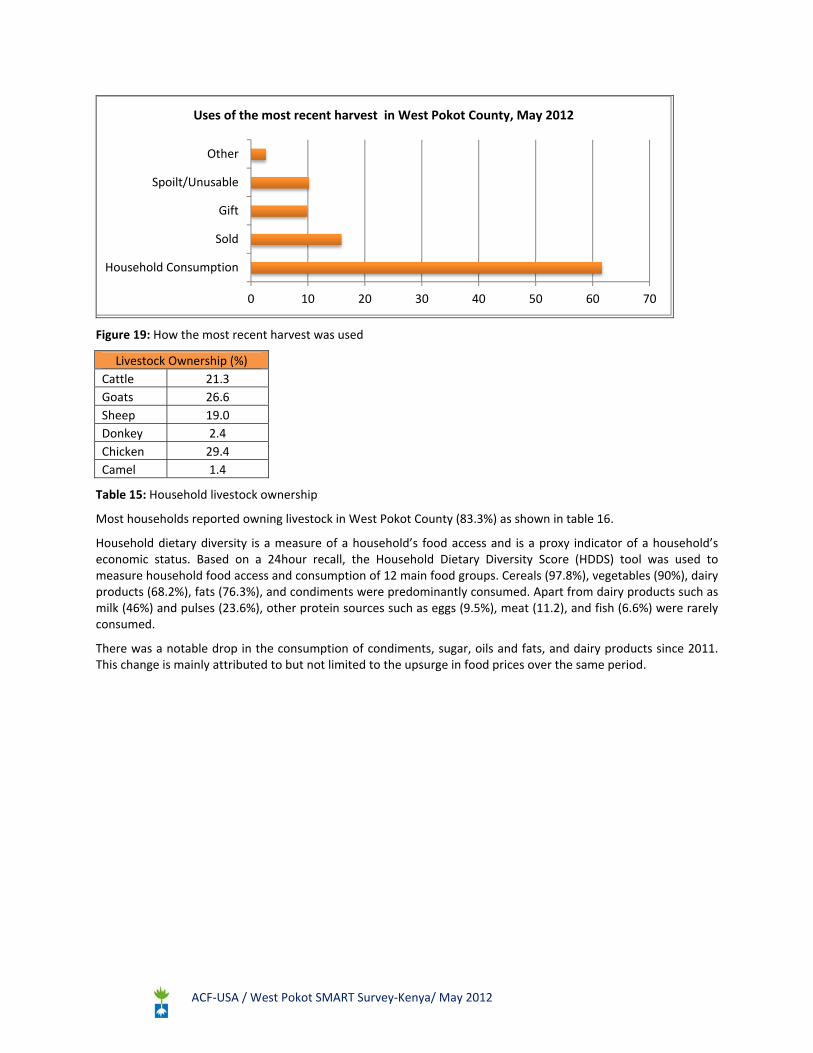
Households who realized a crop harvest covering 6 or more months of household food needs are considered food secure in regard to the seasonal calendar for West Pokot County. Based on this criterion, 63.3% of households are expected to have experienced hunger gaps before the subsequent harvesting season.
1 2 3 4 5 6 7 8 9 10 11 12
% of HH 15.7 9.7 14.4 9.4 14.1 9.4 7.3 8.1 3.4 4.2 0.5 3.9
0
2
4
6
8
10
12
14
16
18
Duration of the most recent harvest in months; May 2012
Months
Figure 18: Duration of the recent harvest for household consumption
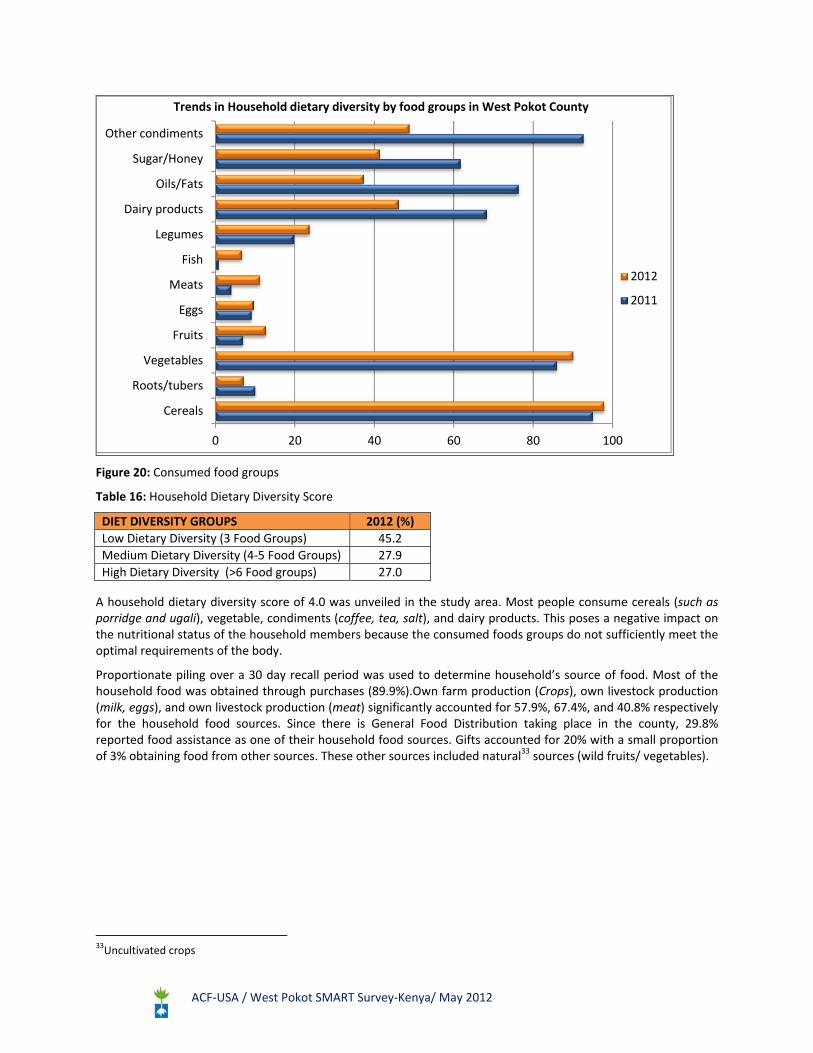
Most of the farm produce was used for household consumption (61.6%). In order to cover other household needs, a significant proportion of the harvest (15.9%) was sold, with gifts to relatives or friends contributing 9.8%. It was noted that an appreciable proportion of the harvest (10.2%) was spoilt. This is mainly attributed to the observed inadequate or lack of appropriate post‐harvest storage facilities. Other uses of harvest were relatively low at 2.6%. Some of the other uses included seed stock.
0 10 20 30 40 50 60 70
Better rainfall
More seeds
Quality seeds
Drought tolerant crops
More land under crop…
Others
Reduced rainfall
Less seeds
Poor Quaity seeds
Crops not drought tolerant
Less land cultivated
Others
Reasons for crop harvest increase or decrease in May 2012
INCREASE
DECREASE
ACF‐USA / West Pokot SMART Survey‐Kenya/ May 2012
Figure 19: How the most recent harvest was used
Livestock Ownership (%)
Cattle 21.3
Goats 26.6
Sheep 19.0
Donkey 2.4
Chicken 29.4
Camel 1.4
Table 15: Household livestock ownership
Most households reported owning livestock in West Pokot County (83.3%) as shown in table 16.
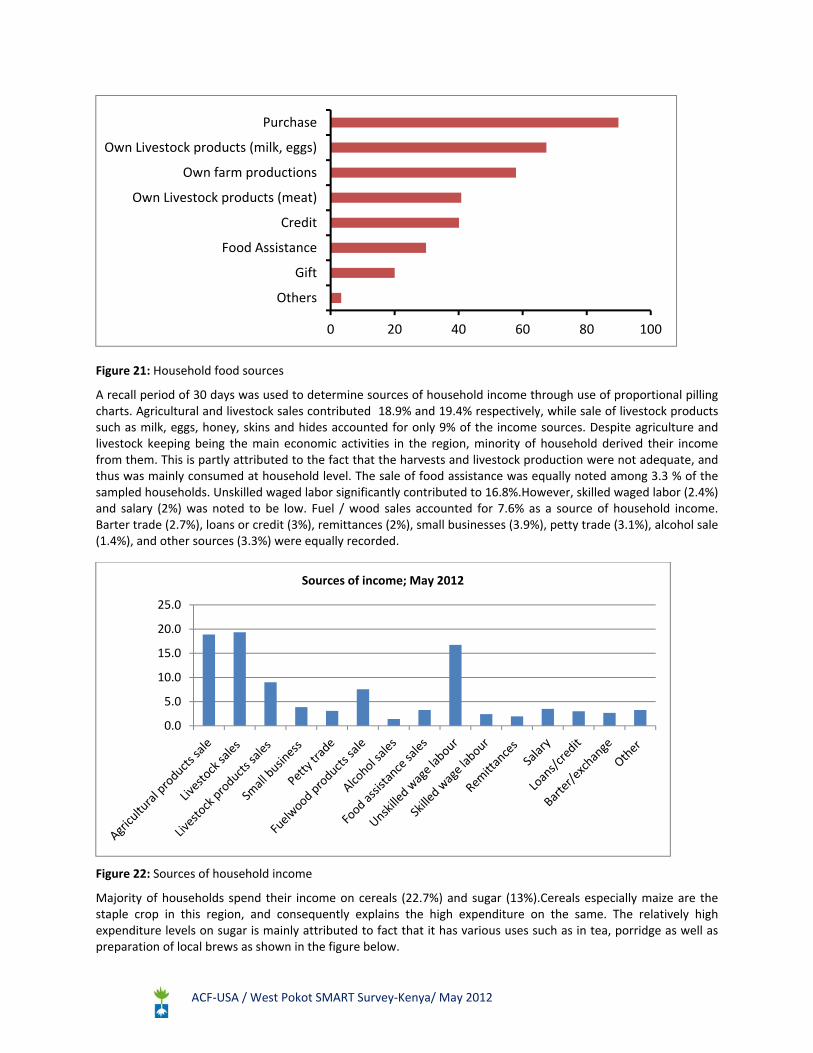
Household dietary diversity is a measure of a household’s food access and is a proxy indicator of a household’s economic status. Based on a 24hour recall, the Household Dietary Diversity Score (HDDS) tool was used to measure household food access and consumption of 12 main food groups. Cereals (97.8%), vegetables (90%), dairy products (68.2%), fats (76.3%), and condiments were predominantly consumed. Apart from dairy products such as milk (46%) and pulses (23.6%), other protein sources such as eggs (9.5%), meat (11.2), and fish (6.6%) were rarely consumed.
There was a notable drop in the consumption of condiments, sugar, oils and fats, and dairy products since 2011. This change is mainly attributed to but not limited to the upsurge in food prices over the same period.
0 10 20 30 40 50 60 70
Household Consumption
Sold
Gift
Spoilt/Unusable
Other
Uses of the most recent harvest in West Pokot County, May 2012
ACF‐USA / West Pokot SMART Survey‐Kenya/ May 2012
Figure 20: Consumed food groups
Table 16: Household Dietary Diversity Score
A household dietary diversity score of 4.0 was unveiled in the study area. Most people consume cereals (such as porridge and ugali), vegetable, condiments (coffee, tea, salt), and dairy products. This poses a negative impact on the nutritional status of the household members because the consumed foods groups do not sufficiently meet the optimal requirements of the body.
Proportionate piling over a 30 day recall period was used to determine household’s source of food. Most of the household food was obtained through purchases (89.9%).Own farm production (Crops), own livestock production (milk, eggs), and own livestock production (meat) significantly accounted for 57.9%, 67.4%, and 40.8% respectively for the household food sources. Since there is General Food Distribution taking place in the county, 29.8% reported food assistance as one of their household food sources. Gifts accounted for 20% with a small proportion of 3% obtaining food from other sources. These other sources included natural33 sources (wild fruits/ vegetables).
33Uncultivated crops
0 20 40 60 80 100
Cereals
Roots/tubers
Vegetables
Fruits
Eggs
Meats
Fish
Legumes
Dairy products
Oils/Fats
Sugar/Honey
Other condiments
Trends in Household dietary diversity by food groups in West Pokot County
2012
2011
DIET DIVERSITY GROUPS 2012 (%)
Low Dietary Diversity (3 Food Groups) 45.2
Medium Dietary Diversity (4‐5 Food Groups) 27.9
High Dietary Diversity (>6 Food groups) 27.0
ACF‐USA / West Pokot SMART Survey‐Kenya/ May 2012
Figure 21: Household food sources
A recall period of 30 days was used to determine sources of household income through use of proportional pilling charts. Agricultural and livestock sales contributed 18.9% and 19.4% respectively, while sale of livestock products such as milk, eggs, honey, skins and hides accounted for only 9% of the income sources. Despite agriculture and livestock keeping being the main economic activities in the region, minority of household derived their income from them. This is partly attributed to the fact that the harvests and livestock production were not adequate, and thus was mainly consumed at household level. The sale of food assistance was equally noted among 3.3 % of the sampled households. Unskilled waged labor significantly contributed to 16.8%.However, skilled waged labor (2.4%) and salary (2%) was noted to be low. Fuel / wood sales accounted for 7.6% as a source of household income. Barter trade (2.7%), loans or credit (3%), remittances (2%), small businesses (3.9%), petty trade (3.1%), alcohol sale (1.4%), and other sources (3.3%) were equally recorded.
Figure 22: Sources of household income
Majority of households spend their income on cereals (22.7%) and sugar (13%).Cereals especially maize are the staple crop in this region, and consequently explains the high expenditure on the same. The relatively high expenditure levels on sugar is mainly attributed to fact that it has various uses such as in tea, porridge as well as preparation of local brews as shown in the figure below.
0 20 40 60 80 100
Others
Gift
Food Assistance
Credit
Own Livestock products (meat)
Own farm productions
Own Livestock products (milk, eggs)
Purchase
0.0
5.0
10.0
15.0
20.0
25.0
Sources of income; May 2012
ACF‐USA / West Pokot SMART Survey‐Kenya/ May 2012
Figure 23: Household expenditure
Purchases of the items were mainly through cash (93.3%), while credit, barter, and others contributed to 6.1%, 0.4%, and 0.2% respectively. With reference to three months preceding the survey, most households (72.6%) reported having experienced some stressors. The experiences were divergent across the households. The stressors were ranked in order of importance from the first to the third highest. The first highest and second highest ranked stressors were analyzed as shown below. Unusually high food prices affected most households and was singled out as the highest ranked (34.1%) and second highest ranked stressors at 14.6% as highlighted in the table below. Other stressors of significant impact to household food security included reduced water availability, reduction of pasture, unusually high levels of livestock deaths, and unusually high levels of livestock diseases, reduced income, and other causes.
Table 17: Stressors Experienced
The stressors affected the ability of households to have enough food for consumption. This means majority could not afford most food sources and as a consequence relied on other sources that included and were not limited to own farm production, food assistance among others. However, with consideration that such stressors have an acute impact on household food security, coping mechanism are usually employed under such circumstances as was the case for West Pokot. The coping mechanisms were categorized for both highest ranked and second highest stressors and averagely analyzed as shown in figure 25.
0
5
10
15
20
25
Expenditure on household's income; May 2012
Highest Ranked (%)
2ndRanked (%)
Unusually high prices for food 34.1 14.6
Unusually high level of human disease 11.6 5.8
Unusually high level of livestock death 11.6 4.6
Reduced Income 9.5 9.8
Unusually high level of livestock diseases 8.8 5.8
Reduced water availability 2.4 2.1
Reduction of pasture 2.4 3.0
Low level of livestock birth 2.1 0.9
Unusually low prices for livestock 0.9 2.4
Reduced/no access to credit 0.9 0.9
Reduced casual/wage earning 2.1 4.0
Crop failure 2.7 2.7
Unusually low crop sale prices 0.3 0.9
Unusually high level of crop disease 0.6 0.9
Unusually high levels of post‐harvest loss (including aflatoxin) 0.3 0.3
Other 12.5 2.1

ACF‐USA / West Pokot SMART Survey‐Kenya/ May 2012
6 DISCUSSION AND CONCLUSIONS
The prevailing malnutrition rates; GAM 12.3% (9.4‐16.0) and SAM 1.5% (0.7‐ 3.2) lie at WHO alert level with very high stunting levels of 43.2% (38.5‐48.0) when compared to the national target of 16%34.Seasonal comparisons show no significant change in the prevalence of acute malnutrition.
The above malnutrition rates can be attributed to a number of factors as shown by the UNICEF conceptual framework of malnutrition such as disease prevalence. During the survey period, 35.5% of households reported child illnesses. However, not all households sought appropriate health care seeking behavior as only 55.9% sought medical attentions from clinicians. A number of factors compromised on the health care seeking behavior as observed. For example, distance to health facilities was quite long and this was further hampered by the heavy rains that cut of road access in most parts. Other competing activities such as land cultivation during this season hindered appropriate health care seeking behavior. Secondly, lack of some essential drugs at the facility further compromised health management as indicated by the very low coverage of most micro nutrient supplements that fell below the national target. Therapeutic zinc, Iron/Folic acid, Vitamin A and de‐worming were below the national targets accounting for 1.6%, 47.8%, 28.7% and 10.3% respectively. The confirmed inadequate availability of essential drugs such as Zinc and Iron Folic acid tablets at health facilities could have a negative impact on management of diarrhea in children and cause anemia during pregnancy which is deleterious to mothers and foetuses (Maternal and foetal complications). The infant and young child nutrition practises were also poor. Even though timely initiation of breastfeeding (82.1%) was adequate, exclusive breastfeeding rates of 36.2% was way below the national target of 50%.
Without water, sanitation and hygiene, sustainable development is impossible35. Unsafe water sources were used by the majority (65.6%) in West Pokot County with most households neither meeting the minimum SPHERE (89.2%) nor the National standards (92.8%) of 15 L/P/D and 20 L/P/D respectively. Owing the fact that majority were using unsafe water sources (65.6%) and practicing open/bush defecation (59.9%), water treatment was below expectations with 81.1% of the households doing nothing to the water before drinking. Consistent use of soap during hand washing at critical times was minimal (43.5%).
A summary of diarrhea incidences in comparison with water, hygiene and sanitation is illustrated below:
Table 18: Diarrhoea Incidences vs. WASH
It is likely that there is some correlation between diarrheal episodes and the unveiled WASH challenges which further deteriorates
the nutritional status of the young children.
Household food security in the county is still precarious as manifested by the low household dietary diversity score of 4.0; with cereals, vegetable, condiments, dairy products, sugar, fats, and legumes being the main consumed food groups in that order. Crops mainly rely on rainfall and the harvest hardly lasts for six months because part of the produce contributes mainly as an income source at the household level alongside unskilled wage labor. Harvest spoilage is also a contributing factor due to lack of or inadequate storage facilities. Relative comparison of the harvests shows that there is a decline, especially for beans. The poor household dietary diversity is also compounded by stressors such as unusually high food prices, unusually high level of livestock deaths, and unusually high level of human diseases.The above factors therefore suggest that diet inadequacy and poor hygiene & sanitation leading to repeated illnesses of young children contributed to the prevailing malnutrition rates in West Pokot County.
34UNICEF: Nutrition strategies and programmes in Kenya‐2011 35WHO/UNICEF Joint Monitoring Programme for Water Supply and Sanitation (JMP)‐2012
Diarrhoea incidences
Un safe water source
No water treatment
Open defecation
Inconsistent use of soap in hand washing
% n % n % n % n %
62 49.6 40 64.5 51 82.2 34 54.8 35 56.4
ACF‐USA / West Pokot SMART Survey‐Kenya/ May 2012
7 RECOMMENDATIONS
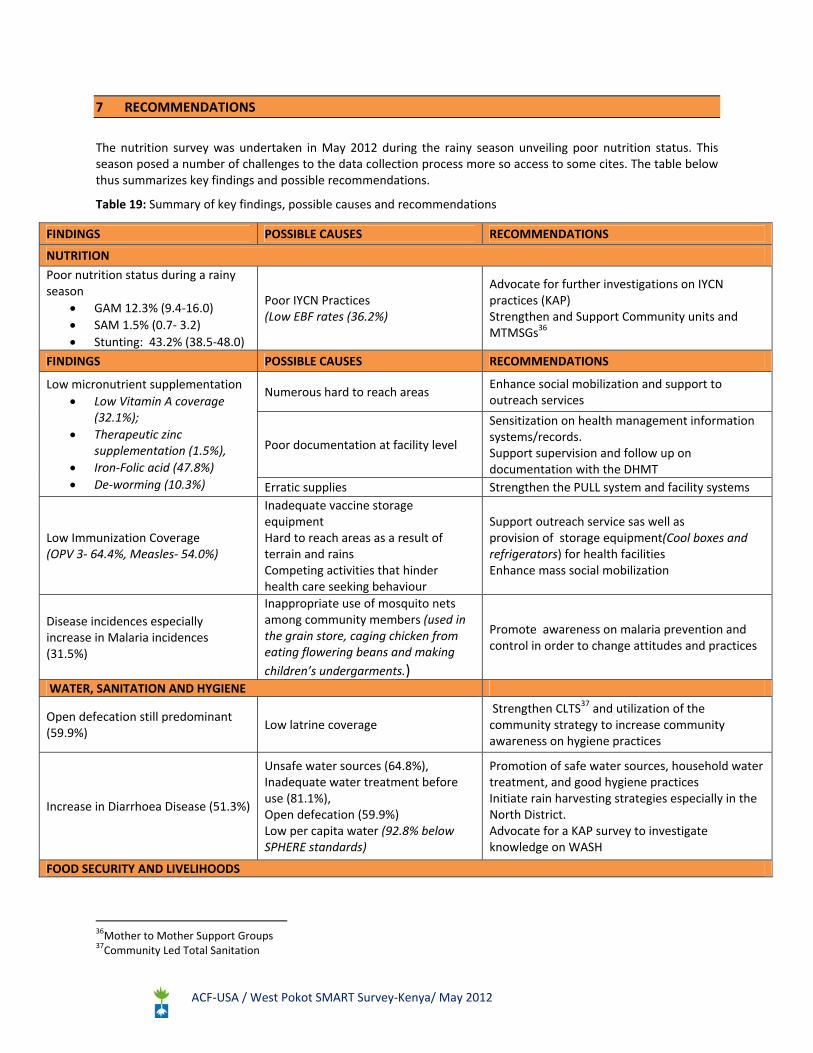
The nutrition survey was undertaken in May 2012 during the rainy season unveiling poor nutrition status. This season posed a number of challenges to the data collection process more so access to some cites. The table below thus summarizes key findings and possible recommendations.
Table 19: Summary of key findings, possible causes and recommendations
FINDINGS POSSIBLE CAUSES RECOMMENDATIONS
NUTRITION
Poor nutrition status during a rainy season
GAM 12.3% (9.4‐16.0)
SAM 1.5% (0.7‐ 3.2)
Stunting: 43.2% (38.5‐48.0)
Poor IYCN Practices (Low EBF rates (36.2%)
Advocate for further investigations on IYCN practices (KAP) Strengthen and Support Community units and MTMSGs36
FINDINGS POSSIBLE CAUSES RECOMMENDATIONS
Low micronutrient supplementation
Low Vitamin A coverage (32.1%);
Therapeutic zinc supplementation (1.5%),
Iron‐Folic acid (47.8%)
De‐worming (10.3%)
Numerous hard to reach areas Enhance social mobilization and support to outreach services
Poor documentation at facility level
Sensitization on health management information systems/records. Support supervision and follow up on documentation with the DHMT
Erratic supplies Strengthen the PULL system and facility systems
Low Immunization Coverage (OPV 3‐ 64.4%, Measles‐ 54.0%)
Inadequate vaccine storage equipment Hard to reach areas as a result of terrain and rains Competing activities that hinder health care seeking behaviour
Support outreach service sas well as provision of storage equipment(Cool boxes and refrigerators) for health facilities Enhance mass social mobilization
Disease incidences especially increase in Malaria incidences (31.5%)
Inappropriate use of mosquito nets among community members (used in the grain store, caging chicken from eating flowering beans and making
children’s undergarments.)
Promote awareness on malaria prevention and control in order to change attitudes and practices
WATER, SANITATION AND HYGIENE
Open defecation still predominant (59.9%)
Low latrine coverage Strengthen CLTS37 and utilization of the community strategy to increase community awareness on hygiene practices
Increase in Diarrhoea Disease (51.3%)
Unsafe water sources (64.8%), Inadequate water treatment before use (81.1%), Open defecation (59.9%) Low per capita water (92.8% below SPHERE standards)
Promotion of safe water sources, household water treatment, and good hygiene practices Initiate rain harvesting strategies especially in the North District. Advocate for a KAP survey to investigate knowledge on WASH
FOOD SECURITY AND LIVELIHOODS
36Mother to Mother Support Groups 37Community Led Total Sanitation
ACF‐USA / West Pokot SMART Survey‐Kenya/ May 2012
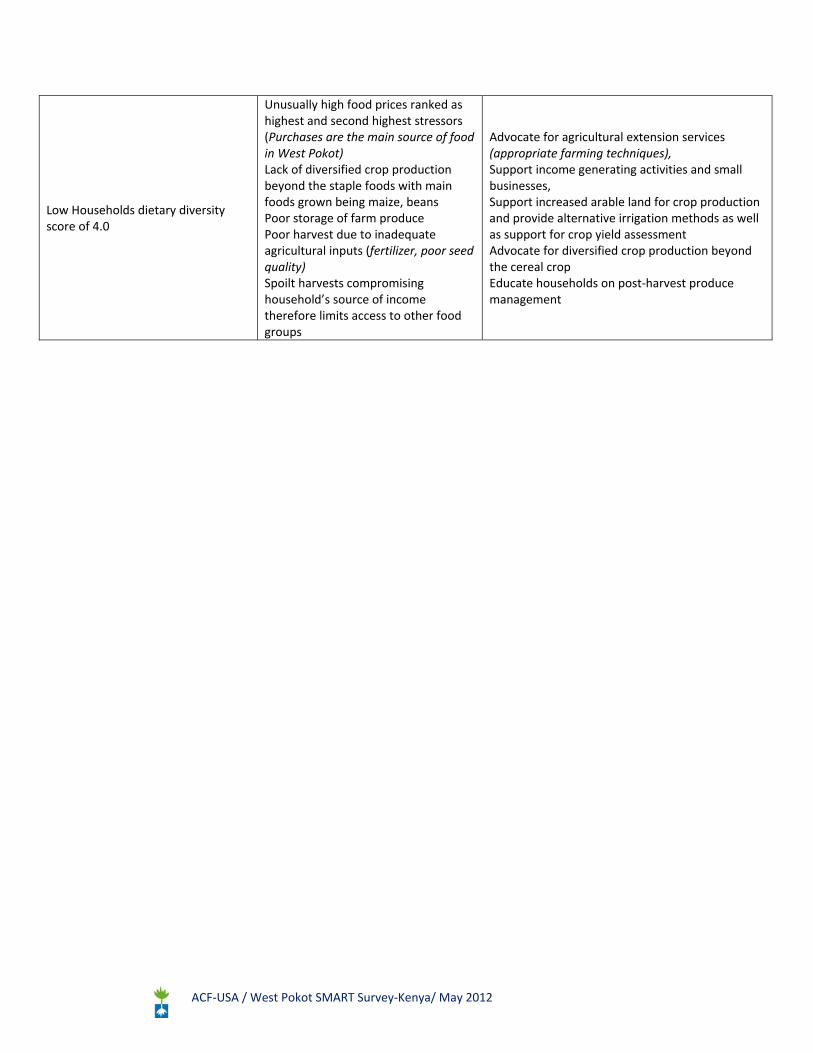
Low Households dietary diversity score of 4.0
Unusually high food prices ranked as highest and second highest stressors (Purchases are the main source of food in West Pokot) Lack of diversified crop production beyond the staple foods with main foods grown being maize, beans Poor storage of farm produce Poor harvest due to inadequate agricultural inputs (fertilizer, poor seed quality) Spoilt harvests compromising household’s source of income therefore limits access to other food groups
Advocate for agricultural extension services (appropriate farming techniques), Support income generating activities and small businesses, Support increased arable land for crop production and provide alternative irrigation methods as well as support for crop yield assessment Advocate for diversified crop production beyond the cereal crop Educate households on post‐harvest produce management

ACF‐USA / West Pokot SMART Survey‐Kenya/ May 2012
APPENDIX 1: SUMMARY OF KEY FINDINGS
INDEX INDICATOR RESULTS 201138 RESULTS 2012
WHO (n=535)
Global Acute Malnutrition (GAM)39
W/H < ‐2 z and/or Oedema 14.9%
(12.1‐ 18.2 ) 12.3%
(9.4 – 16.0)
Severe Acute Malnutrition (SAM)W/H < ‐3 z and/or Oedema
2.3% (1.3 – 4.2)
1.5%(0.7 – 3.2)
WHO (n=521)
Prevalence of stunting: (H/A) <‐2 score 37.5%
(33.0 – 42.3) 43.2%
(33.5 – 48.0)
WHO (n=532)
Prevalence of underweight:(W/A ) <‐2 score( 30.4%
(26.3 – 34.9) 36.1%
(31.6 – 40.9)
Prevalence Severe Acute Malnutrition (SAM): MUAC < 11.5 CM and/or Oedema 0.6% (0.1‐2.5)
Prevalence Moderate Acute Malnutrition (MAM): MUAC ≥11.5 CM and <12.5CM 3.4% (1.8‐6.2)
Prevalence of Global Acute Malnutrition (GAM): MUAC < 12.5 cm or edema 3.7% (2.2‐ 6.8)
At risk MUAC ≥12.5 and <13.5 cm 14.3% 16.4%
Proportion of children aged 6‐59 months with bilateral Oedema 0.0% 0.2 %
Crude retrospective mortality (94 days)/10,000/ day [Design effect = 1] 1.3%
[0.84 ‐1.98]
0.22%[0.09‐0.57]
Under five retrospective mortality/10,000/day [Design effect = 1] 1.66%
[0.90 ‐ 3.04] 0.87%
[0.28 – 2.70]
IMMUNIZATION COVERAGE RESULTS 2011 RESULTS 2012
Measles vaccination by card (Children ≥ 9 months =504) 53.0% 54.0%
OPV1/Pentavalent 1 by card 61.8% 71.5%
OPV3/Pentavalent 3 by card 57.4% 64.4%
VITAMIN A SUPPLEMENTATION COVERAGE RESULTS 2011 RESULTS 2012
Children aged 6‐11 months who received vitamin A supplementation in past one year 50.3% 41.2%
Children aged 12‐59 months who received vitamin A supplementation ONCE in past one year 39.2%
Children aged 12‐59 months who received vitamin A supplementation TWICE in past one year 27.0%
Children aged 12‐59 months who received vitamin A supplementation THRICE in past one year 5.1%
MORBIDITY (Two weeks recall period) RESULTS 2012
Proportion of children aged 0‐59 months with illness (n=125) 34.9%
Proportion of children aged 0‐59 months with fever alone / in combination with other symptoms 31.2%
Proportion of children aged 0‐59 months with acute respiratory infections 10.4%
Proportion of children aged 0 – 59 months with Diarrhea at 49.6% as follows
Watery diarrhea 20.0%
Bloody diarrhea 27.2%
Both watery and bloody diarrhea 2.4%
Proportion of children aged 0‐59 months with coughs 29.6%
Proportion of children 0‐59 months of age with other forms of illness 30.4%
MANAGEMENT OF DIARRHOEA RESULTS 2011 RESULTS 2012
Proportion of children who took ORS in diarrhea conditions 36.7% 21.0%
Proportion of children who took home made sugar solutions during diarrhea conditions 1.6%
Proportion of children with diarrhea incidence who received zinc supplementation 1.6%
OTHER HINI INDICATORS RESULTS 2011 RESULTS 2012
Proportion of children 2‐5 years de‐ wormed twice a year 40.3% 10.3%
38 Bracket results expressed at 95% confidence interval 39 Design effect for Anthropometric survey: 1.21

ACF‐USA / West Pokot SMART Survey‐Kenya/ May 2012
Proportion of women supplemented with iron for 90 days in their last pregnancy 84.2% 47.8%
INFANT AND YOUNG CHILD NUTRITION RESULTS 2012
Early initiation of breastfeeding (within an hour; ) 82.1%
Exclusive breastfeeding rates ; 0‐5 months; 36.2%
Proportion of infants aged 12‐15 months fed on breast milk 91.5%
Proportion of infants aged 6‐8 months receiving solid, semi‐solid or soft foods 93.7%
Proportion of breastfed children 6‐23 months consuming ≥3 food groups 36.5%
Proportion of non‐breastfed children 6‐23 months consuming ≥4 food groups 10.5%
Proportion of both breastfed and non‐breastfed children 6‐23 months consuming ≥ 3 or ≥ 4 food groups respectively
31.2%
Proportion of breastfed children 6‐8 months and 6‐ 23 months having at least 2 meals and ≥ 3 meals a day respectively
80.5%
Proportion of non‐breastfed children 6‐23 months having ≥4 meals a day 42.1%
Proportion of breastfed children 6‐8 months, 6‐23 months and non‐breastfed 6‐23 months having ≥2, ≥3 and≥4 meals a day respectively
73.8%
NUTRITION STATUS OF CAREGIVERS OF <5 YR OLD CHILDREN RESULTS 2012
Proportion of women pregnant and lactating 69.0%
Proportion of women pregnant and lactating with MUAC < 21 CM 5.8%
MOSQUITO BEDNET OWNERSHIP AND USAGE RESULTS 2011 RESULTS 2012
Proportion of household who own mosquito nets 38.9% 86.0%
Proportion of households with mosquito nets, who reported that all family member slept under a mosquito net the night before the survey
21.9% 66.1%
Proportion of households with mosquito nets, who reported that under the age of five years slept under a mosquito net the night before the survey
60.2% 43.9%
Proportion of households with mosquito nets, who reported that female adults slept under a mosquito net the night before the survey
40.4%
WATER AND SANITATION RESULTS 2011 RESULTS 2012
Proportion of households who access safe40 water source 34.4%
Time taken to the main water source for drinking
Less than 30 minutes 68.6%
30 minutes to 1 hour 40.2% 22.4%
More than one hour 9.0%
Proportion of households who DID NOT practice any form of water treatment 70.6% 81.6%
Proportion of caregivers who wash their hands with water and soap 38.0% 43.4%
FOOD SECURITY RESULTS 2012Proportion of households owning livestock 83.3%
Proportion of households that had cultivated crops in the previous planting season 84.2%
Household dietary diversity score
Low Dietary Diversity (= 3 Food Groups) 45.2%
Medium Dietary Diversity (4 – 5 Food Groups) 27.9%
High Dietary Diversity (6+ Food Groups) 27.0%
40 SAFE WATER SOURCES: Tap, protected borehole, protected spring and water trucking as water is treated at point of delivery
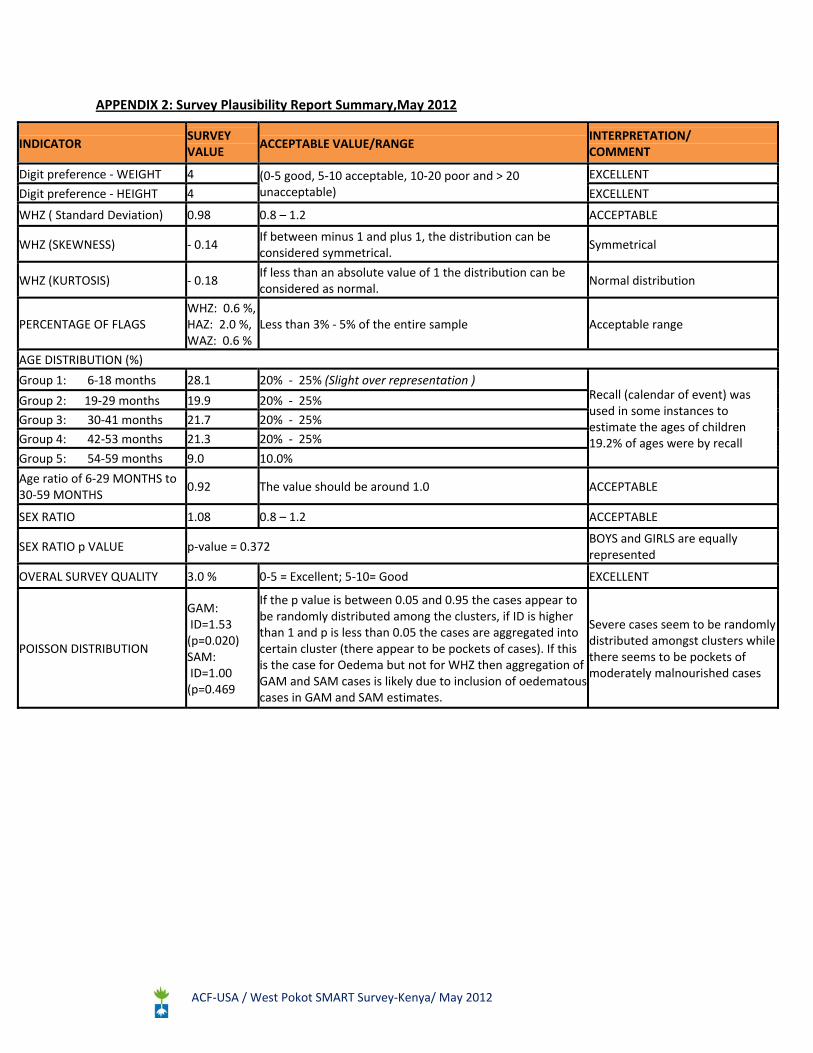
ACF‐USA / West Pokot SMART Survey‐Kenya/ May 2012
APPENDIX 2: Survey Plausibility Report Summary,May 2012
INDICATOR SURVEY VALUE
ACCEPTABLE VALUE/RANGE INTERPRETATION/ COMMENT
Digit preference ‐ WEIGHT 4 (0‐5 good, 5‐10 acceptable, 10‐20 poor and > 20 unacceptable)
EXCELLENT
Digit preference ‐ HEIGHT 4 EXCELLENT
WHZ ( Standard Deviation) 0.98 0.8 – 1.2 ACCEPTABLE
WHZ (SKEWNESS) ‐ 0.14 If between minus 1 and plus 1, the distribution can be considered symmetrical.
Symmetrical
WHZ (KURTOSIS) ‐ 0.18 If less than an absolute value of 1 the distribution can be considered as normal.
Normal distribution
PERCENTAGE OF FLAGS WHZ: 0.6 %, HAZ: 2.0 %, WAZ: 0.6 %
Less than 3% ‐ 5% of the entire sample Acceptable range
AGE DISTRIBUTION (%)
Group 1: 6‐18 months 28.1 20% ‐ 25% (Slight over representation ) Recall (calendar of event) was used in some instances to estimate the ages of children 19.2% of ages were by recall
Group 2: 19‐29 months 19.9 20% ‐ 25%
Group 3: 30‐41 months 21.7 20% ‐ 25%
Group 4: 42‐53 months 21.3 20% ‐ 25%
Group 5: 54‐59 months 9.0 10.0%
Age ratio of 6‐29 MONTHS to 30‐59 MONTHS
0.92 The value should be around 1.0 ACCEPTABLE
SEX RATIO 1.08 0.8 – 1.2 ACCEPTABLE
SEX RATIO p VALUE p‐value = 0.372 BOYS and GIRLS are equally represented
OVERAL SURVEY QUALITY 3.0 % 0‐5 = Excellent; 5‐10= Good EXCELLENT
POISSON DISTRIBUTION
GAM: ID=1.53 (p=0.020) SAM: ID=1.00 (p=0.469
If the p value is between 0.05 and 0.95 the cases appear to be randomly distributed among the clusters, if ID is higher than 1 and p is less than 0.05 the cases are aggregated into certain cluster (there appear to be pockets of cases). If this is the case for Oedema but not for WHZ then aggregation of GAM and SAM cases is likely due to inclusion of oedematous cases in GAM and SAM estimates.
Severe cases seem to be randomly distributed amongst clusters while there seems to be pockets of moderately malnourished cases
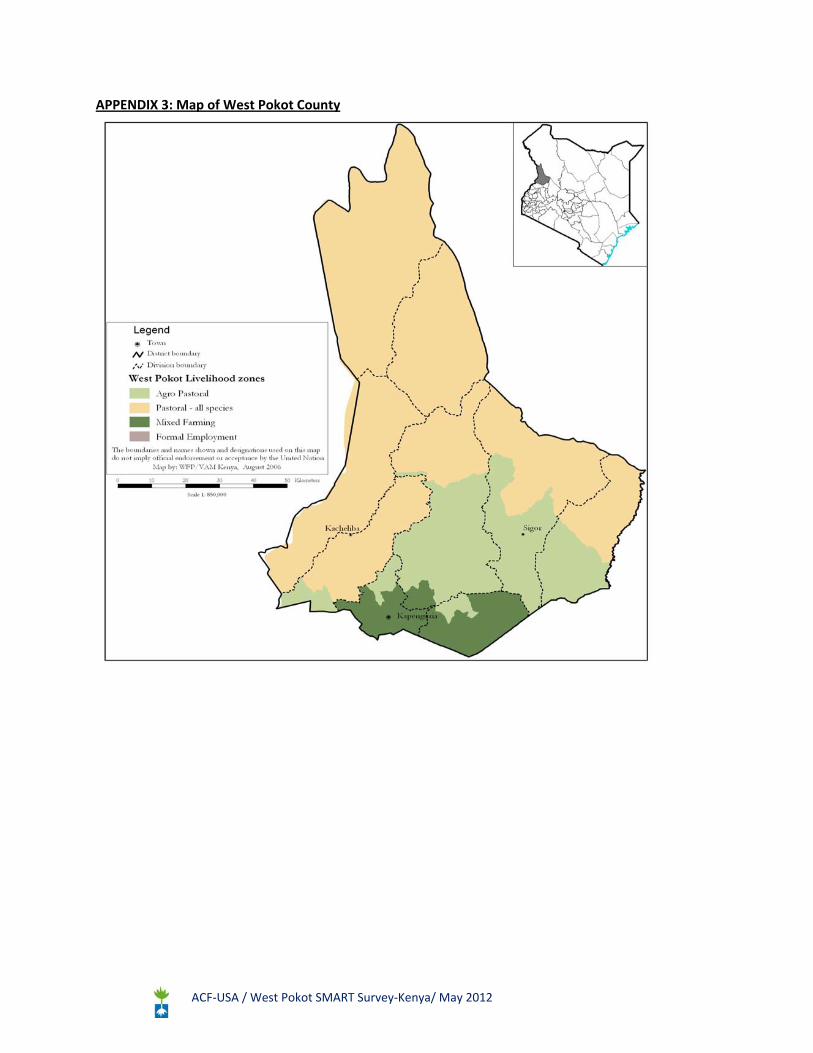
ACF‐USA / West Pokot SMART Survey‐Kenya/ May 2012
APPENDIX 3: Map of West Pokot County
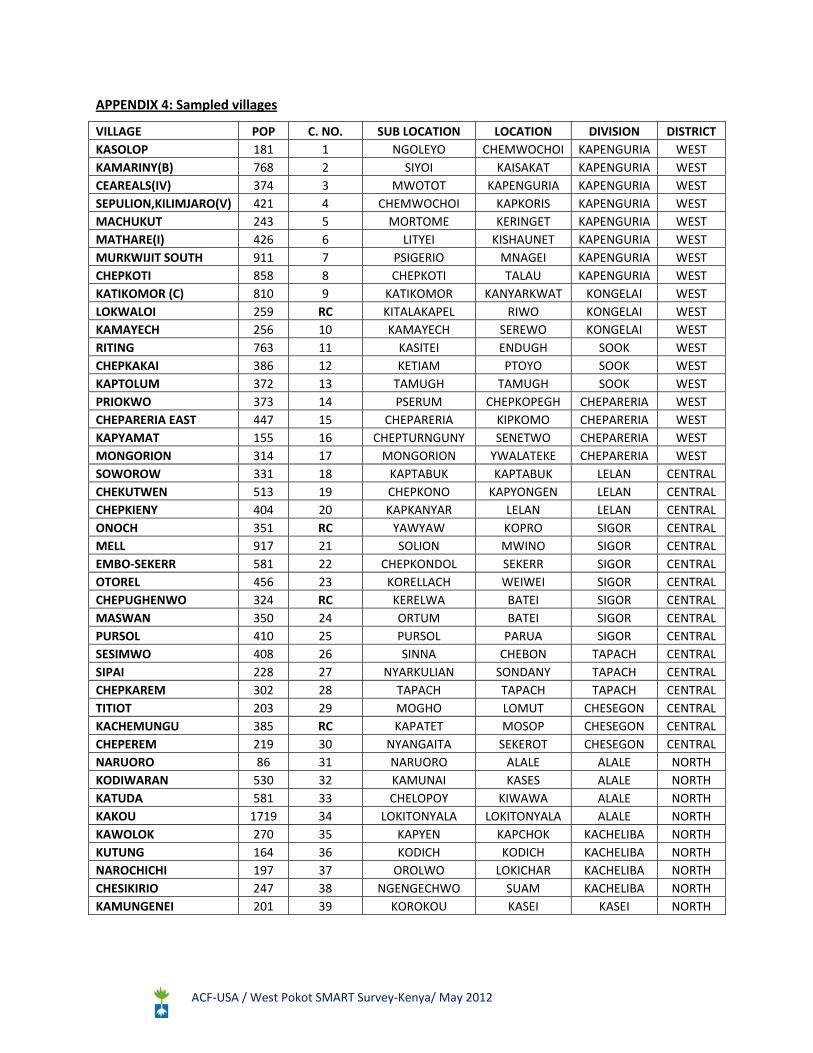
ACF‐USA / West Pokot SMART Survey‐Kenya/ May 2012
APPENDIX 4: Sampled villages
VILLAGE POP C. NO. SUB LOCATION LOCATION DIVISION DISTRICT
KASOLOP 181 1 NGOLEYO CHEMWOCHOI KAPENGURIA WEST
KAMARINY(B) 768 2 SIYOI KAISAKAT KAPENGURIA WEST
CEAREALS(IV) 374 3 MWOTOT KAPENGURIA KAPENGURIA WEST
SEPULION,KILIMJARO(V) 421 4 CHEMWOCHOI KAPKORIS KAPENGURIA WEST
MACHUKUT 243 5 MORTOME KERINGET KAPENGURIA WEST
MATHARE(I) 426 6 LITYEI KISHAUNET KAPENGURIA WEST
MURKWIJIT SOUTH 911 7 PSIGERIO MNAGEI KAPENGURIA WEST
CHEPKOTI 858 8 CHEPKOTI TALAU KAPENGURIA WEST
KATIKOMOR (C) 810 9 KATIKOMOR KANYARKWAT KONGELAI WEST
LOKWALOI 259 RC KITALAKAPEL RIWO KONGELAI WEST
KAMAYECH 256 10 KAMAYECH SEREWO KONGELAI WEST
RITING 763 11 KASITEI ENDUGH SOOK WEST
CHEPKAKAI 386 12 KETIAM PTOYO SOOK WEST
KAPTOLUM 372 13 TAMUGH TAMUGH SOOK WEST
PRIOKWO 373 14 PSERUM CHEPKOPEGH CHEPARERIA WEST
CHEPARERIA EAST 447 15 CHEPARERIA KIPKOMO CHEPARERIA WEST
KAPYAMAT 155 16 CHEPTURNGUNY SENETWO CHEPARERIA WEST
MONGORION 314 17 MONGORION YWALATEKE CHEPARERIA WEST
SOWOROW 331 18 KAPTABUK KAPTABUK LELAN CENTRAL
CHEKUTWEN 513 19 CHEPKONO KAPYONGEN LELAN CENTRAL
CHEPKIENY 404 20 KAPKANYAR LELAN LELAN CENTRAL
ONOCH 351 RC YAWYAW KOPRO SIGOR CENTRAL
MELL 917 21 SOLION MWINO SIGOR CENTRAL
EMBO‐SEKERR 581 22 CHEPKONDOL SEKERR SIGOR CENTRAL
OTOREL 456 23 KORELLACH WEIWEI SIGOR CENTRAL
CHEPUGHENWO 324 RC KERELWA BATEI SIGOR CENTRAL
MASWAN 350 24 ORTUM BATEI SIGOR CENTRAL
PURSOL 410 25 PURSOL PARUA SIGOR CENTRAL
SESIMWO 408 26 SINNA CHEBON TAPACH CENTRAL
SIPAI 228 27 NYARKULIAN SONDANY TAPACH CENTRAL
CHEPKAREM 302 28 TAPACH TAPACH TAPACH CENTRAL
TITIOT 203 29 MOGHO LOMUT CHESEGON CENTRAL
KACHEMUNGU 385 RC KAPATET MOSOP CHESEGON CENTRAL
CHEPEREM 219 30 NYANGAITA SEKEROT CHESEGON CENTRAL
NARUORO 86 31 NARUORO ALALE ALALE NORTH
KODIWARAN 530 32 KAMUNAI KASES ALALE NORTH
KATUDA 581 33 CHELOPOY KIWAWA ALALE NORTH
KAKOU 1719 34 LOKITONYALA LOKITONYALA ALALE NORTH
KAWOLOK 270 35 KAPYEN KAPCHOK KACHELIBA NORTH
KUTUNG 164 36 KODICH KODICH KACHELIBA NORTH
NAROCHICHI 197 37 OROLWO LOKICHAR KACHELIBA NORTH
CHESIKIRIO 247 38 NGENGECHWO SUAM KACHELIBA NORTH
KAMUNGENEI 201 39 KOROKOU KASEI KASEI NORTH

ACF‐USA / West Pokot SMART Survey‐Kenya/ May 2012
APPENDIX 5: Household Mortality data form (One sheet per Household)
District : _______________Division: Location: ____________Village: ____________ Cluster number: HH number: Date: Team number:_______
1 2 3 4 5 6 7 8
ID HH
member Present NOW
Present at beginning of recall (include those not present now and indicate which members were not present at the start of the recall
period )
Sex (M/F)
Date of birth/or age in years
Born during recall period?
Died during the recall period
Cause of death
(use codes below)
1
2
3
4
5
6
7
8
9
10
11
12
13
14
15
16
17
18
19
20
Tally (these data are entered into Nutrisurvey for each household):
Current HH members – total
Current HH members ‐ < 5
Current HH members who arrived during recall (exclude births)
Current HH members who arrived during recall ‐ <5
Past HH members who left during recall (exclude deaths)
Past HH members who left during recall ‐ < 5
Births during recall
Total deaths
Deaths < 5
Cause of death codes: 1: Watery diarrhoea 2: Bloody diarrhoea 3: Measles 4: Fever with chills like malaria 5: Fever, cough, difficulty in breathing 6: Malnutrition 7: Others specify:_______________

APPENDIX 6: CLUSTER MORTALITY QUESTIONNAIRE (one sheet/cluster) District: __________Division: Location: _______________Village: ____________
Cluster number: Date: Team number: _______
HH
Current HH
Member
Current HH Member Who
Arrived During Recall
(Exclude Births)
Past HH Members Who Left
During Recall
(Exclude Deaths)
Births During
Recall
Deaths During Recall
TOTAL <5 TOTAL <5 TOTAL <5 TOTAL <5
1
2
3
4
5
6
7
8
9
10
11
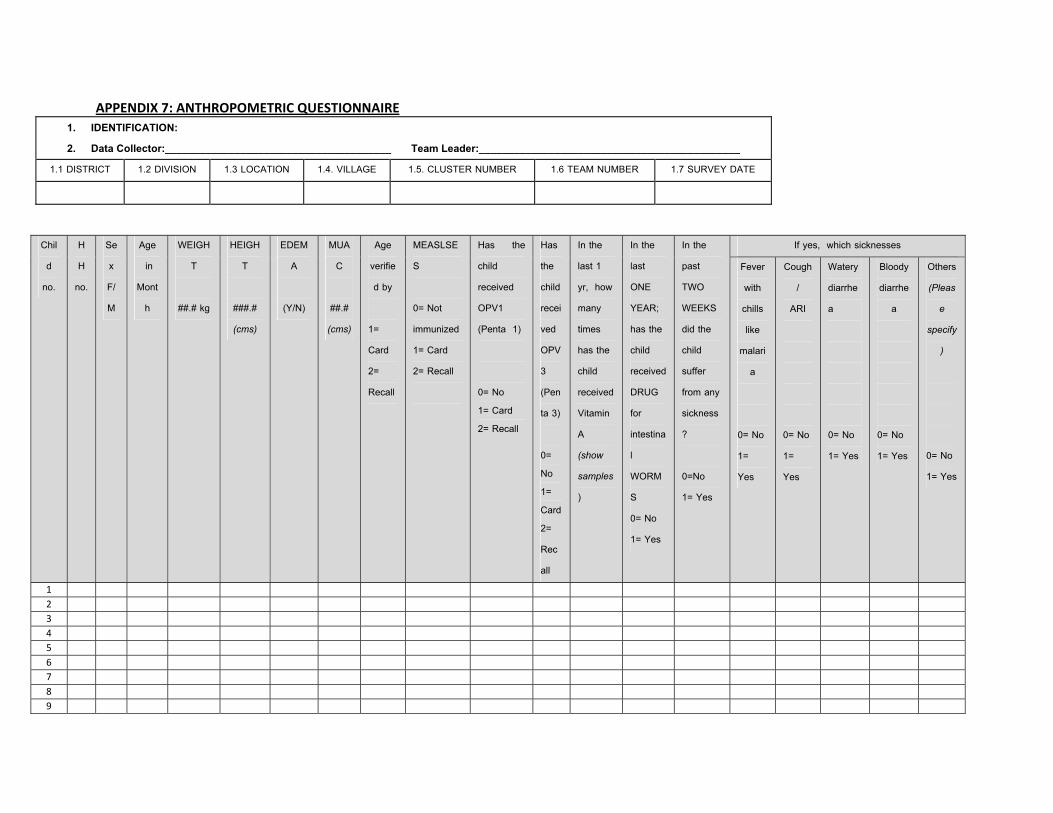
APPENDIX 7: ANTHROPOMETRIC QUESTIONNAIRE
1. IDENTIFICATION:
2. Data Collector:_______________________________________ Team Leader:_____________________________________________
1.1 DISTRICT 1.2 DIVISION 1.3 LOCATION 1.4. VILLAGE 1.5. CLUSTER NUMBER 1.6 TEAM NUMBER 1.7 SURVEY DATE
Chil
d
no.
H
H
no.
Se
x
F/
M
Age
in
Mont
h
WEIGH
T
##.# kg
HEIGH
T
###.#
(cms)
EDEM
A
(Y/N)
MUA
C
##.#
(cms)
Age
verifie
d by
1=
Card
2=
Recall
MEASLSE
S
0= Not
immunized
1= Card
2= Recall
Has the
child
received
OPV1
(Penta 1)
0= No
1= Card
2= Recall
Has
the
child
recei
ved
OPV
3
(Pen
ta 3)
0=
No
1=
Card
2=
Rec
all
In the
last 1
yr, how
many
times
has the
child
received
Vitamin
A
(show
samples
)
In the
last
ONE
YEAR;
has the
child
received
DRUG
for
intestina
l
WORM
S
0= No
1= Yes
In the
past
TWO
WEEKS
did the
child
suffer
from any
sickness
?
0=No
1= Yes
If yes, which sicknesses
Fever
with
chills
like
malari
a
0= No
1=
Yes
Cough
/
ARI
0= No
1=
Yes
Watery
diarrhe
a
0= No
1= Yes
Bloody
diarrhe
a
0= No
1= Yes
Others
(Pleas
e
specify
)
0= No
1= Yes
1
2
3
4
5
6
7
8
9
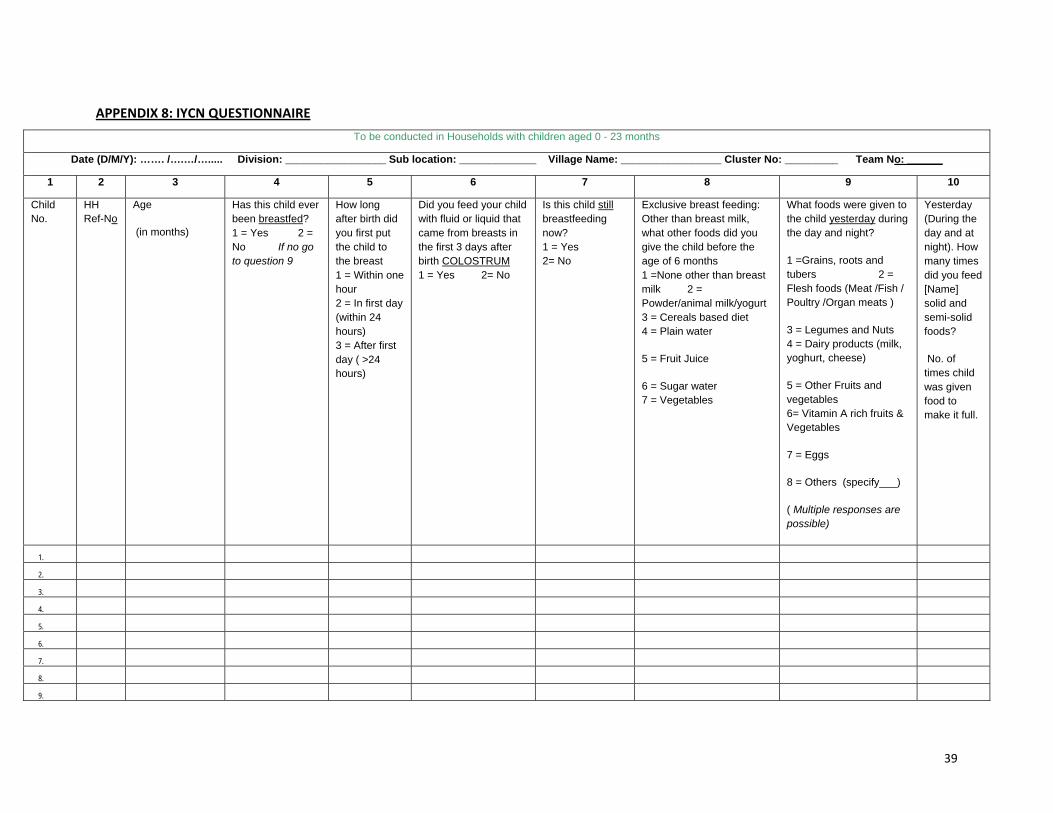
39
APPENDIX 8: IYCN QUESTIONNAIRE
To be conducted in Households with children aged 0 - 23 months
Date (D/M/Y): ……. /….…/…..... Division: _________________ Sub location: _____________ Village Name: _________________ Cluster No: _________ Team No: ______
1 2 3 4 5 6 7 8 9 10
Child No.
HH Ref-No
Age
(in months)
Has this child ever been breastfed? 1 = Yes 2 = No If no go to question 9
How long after birth did you first put the child to the breast 1 = Within one hour 2 = In first day (within 24 hours) 3 = After first day ( >24 hours)
Did you feed your child with fluid or liquid that came from breasts in the first 3 days after birth COLOSTRUM 1 = Yes 2= No
Is this child still breastfeeding now? 1 = Yes 2= No
Exclusive breast feeding: Other than breast milk, what other foods did you give the child before the age of 6 months 1 =None other than breast milk 2 = Powder/animal milk/yogurt 3 = Cereals based diet 4 = Plain water
5 = Fruit Juice
6 = Sugar water 7 = Vegetables
What foods were given to the child yesterday during the day and night?
1 =Grains, roots and tubers 2 = Flesh foods (Meat /Fish / Poultry /Organ meats )
3 = Legumes and Nuts 4 = Dairy products (milk, yoghurt, cheese)
5 = Other Fruits and vegetables 6= Vitamin A rich fruits & Vegetables
7 = Eggs
8 = Others (specify___)
( Multiple responses are possible)
Yesterday (During the day and at night). How many times did you feed [Name] solid and semi-solid foods?
No. of times child was given food to make it full.
1.
2.
3.
4.
5.
6.
7.
8.
9.
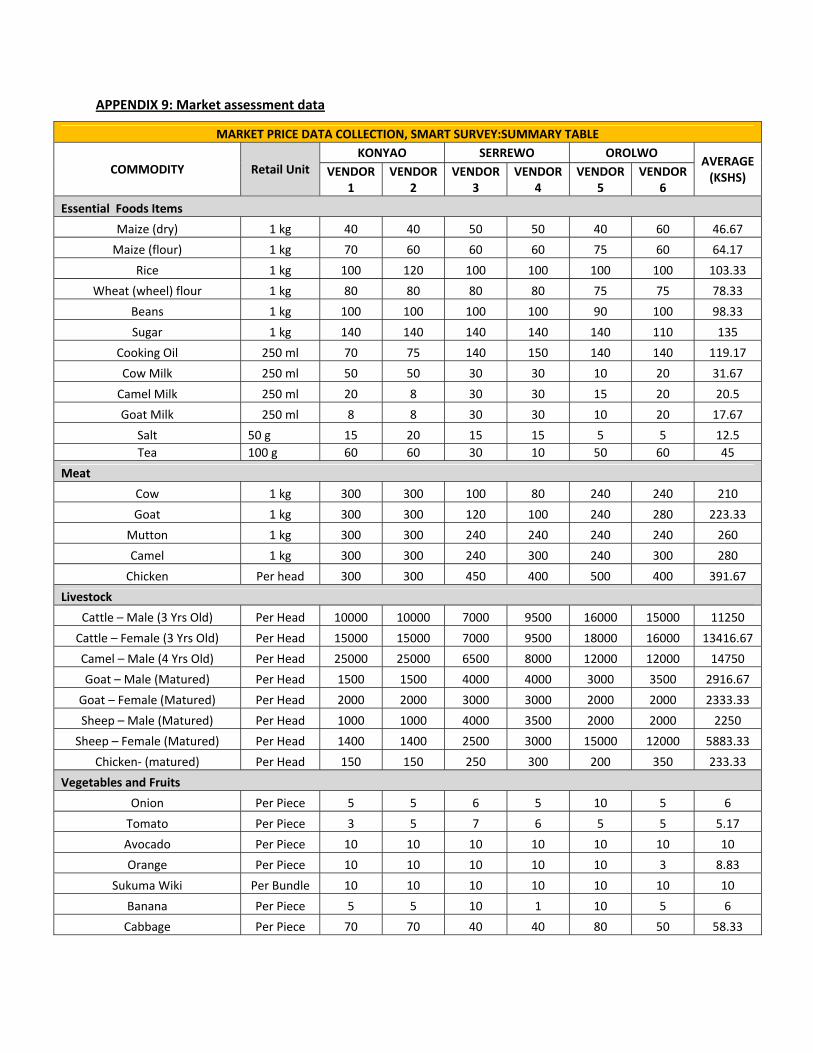
APPENDIX 9: Market assessment data
MARKET PRICE DATA COLLECTION, SMART SURVEY:SUMMARY TABLE
COMMODITY Retail Unit KONYAO SERREWO OROLWO
AVERAGE (KSHS) VENDOR
1 VENDOR
2 VENDOR
3 VENDOR
4 VENDOR
5 VENDOR
6
Essential Foods Items
Maize (dry) 1 kg 40 40 50 50 40 60 46.67
Maize (flour) 1 kg 70 60 60 60 75 60 64.17
Rice 1 kg 100 120 100 100 100 100 103.33
Wheat (wheel) flour 1 kg 80 80 80 80 75 75 78.33
Beans 1 kg 100 100 100 100 90 100 98.33
Sugar 1 kg 140 140 140 140 140 110 135
Cooking Oil 250 ml 70 75 140 150 140 140 119.17
Cow Milk 250 ml 50 50 30 30 10 20 31.67
Camel Milk 250 ml 20 8 30 30 15 20 20.5
Goat Milk 250 ml 8 8 30 30 10 20 17.67
Salt 50 g 15 20 15 15 5 5 12.5
Tea 100 g 60 60 30 10 50 60 45
Meat
Cow 1 kg 300 300 100 80 240 240 210
Goat 1 kg 300 300 120 100 240 280 223.33
Mutton 1 kg 300 300 240 240 240 240 260
Camel 1 kg 300 300 240 300 240 300 280
Chicken Per head 300 300 450 400 500 400 391.67
Livestock
Cattle – Male (3 Yrs Old) Per Head 10000 10000 7000 9500 16000 15000 11250
Cattle – Female (3 Yrs Old) Per Head 15000 15000 7000 9500 18000 16000 13416.67
Camel – Male (4 Yrs Old) Per Head 25000 25000 6500 8000 12000 12000 14750
Goat – Male (Matured) Per Head 1500 1500 4000 4000 3000 3500 2916.67
Goat – Female (Matured) Per Head 2000 2000 3000 3000 2000 2000 2333.33
Sheep – Male (Matured) Per Head 1000 1000 4000 3500 2000 2000 2250
Sheep – Female (Matured) Per Head 1400 1400 2500 3000 15000 12000 5883.33
Chicken‐ (matured) Per Head 150 150 250 300 200 350 233.33
Vegetables and Fruits
Onion Per Piece 5 5 6 5 10 5 6
Tomato Per Piece 3 5 7 6 5 5 5.17
Avocado Per Piece 10 10 10 10 10 10 10
Orange Per Piece 10 10 10 10 10 3 8.83
Sukuma Wiki Per Bundle 10 10 10 10 10 10 10
Banana Per Piece 5 5 10 1 10 5 6
Cabbage Per Piece 70 70 40 40 80 50 58.33