Indian Power Sector- Indian Power Sector- Clean Coal TechnologiesClean Coal Technologies
V.S. VERMAV.S. VERMA
MEMBER , CERCMEMBER , CERC
11

22
• Installed Capacity – from 1362 MW in 1947 at the time of Independence to 1,82,689 MW on 31/10/11
• Gross Electricity Generation – from 4073 MU in 1947 to 789,013 MU ON 31/3/11
• Per capita consumption- from 16.3 Units in ’47 to 813.5 Units in 2010-11
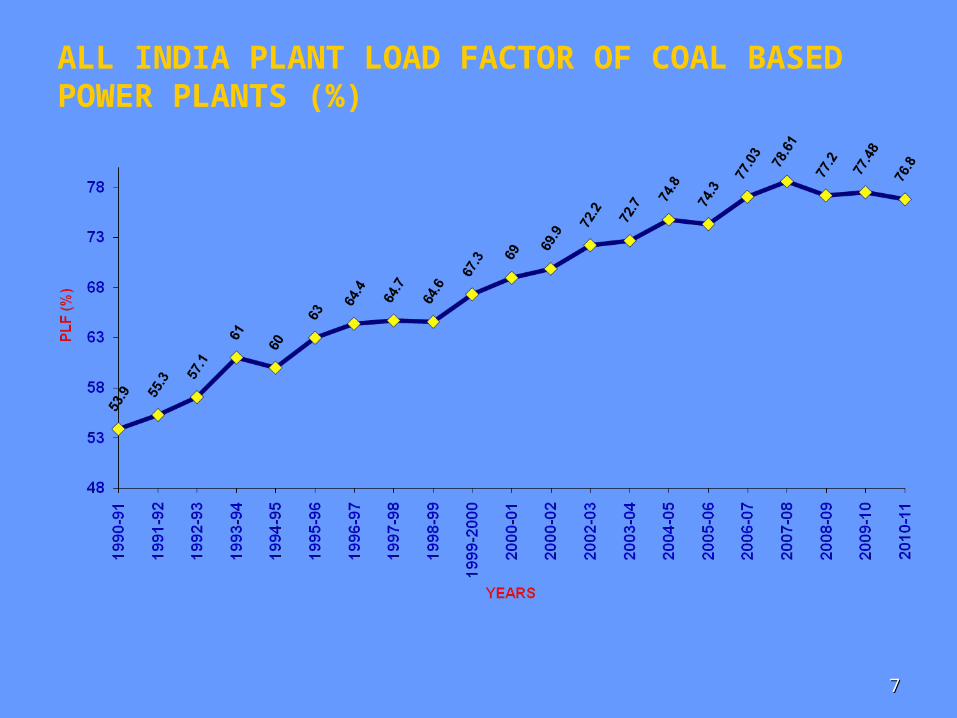
• All India PLF of thermal stations – from 52.4 % in 1985-86 to 76.8% in 2010-11
Highlights of Power Sector

33
Installed Capacity = 1,82,689 MW
INSTALLED CAPACITY AS ON 31.10.2011

44
GROWTH OF INSTALLED CAPACITY

55
GROWTH OF ELECTRICITY GENERATION IN INDIA

66
GROWTH OF PER CAPITA CONSUMPTION
77
ALL INDIA PLANT LOAD FACTOR OF COAL BASED POWER PLANTS (%)

88
PeriodPeak
Demand(MW)
PeakMet
(MW)
PeakDeficit/Surplus(MW)
PeakDeficit/Surplus
( % )
EnergyRequi-rment(MU)
EnergyAvail-ability(MU)
EnergyDeficit/Surplus
(MU)
EnergyDeficit/Surplus
( % )
2007-08 108866 90793 -18073 -16.6 739343 666007 -73336 -9.9
2008-09 109809 96785 -13024 -11.9 777039 691038 -86001 -11.1
2009-10119,16
6104,00
9-15,157 -12.7
830,594
746,644-
83,950-10.1
2010-11122,28
7110,25
6-12,031 -9.8
861,591
788,355-
73,236-8.5
Actual Power Supply Position

99
Peak Deman
d
Peak Met
Surplus/DeficitEnergy
Requirement
Energy Availabilit
ySurplus/Deficit
(MW) (MW) (MW) % (MU) (MU) (MU) %
Northern 40248 37117 -3131 -7.8 164922 155486 -9436 -5.7
Western 42042 36007 -6035 -14.4 156328 142314 -14014 -9.0
Madhya Pradesh 9150 7842 -1308 -14.3 22885 20394 -2491 -10.9
Southern 33937 31489 -2448 -7.2 147438 138887 -8551 -5.8
Eastern 14505 13971 -534 -3.7 57944 55509 -2435 -4.2
N-Eastern 1920 1782 -138 -7.2 6700 6069 -631 -9.4
All India 128907 114233 -14674 -11.4 533332 498265 -35067 -6.6
Power Supply Position ( April2011-Oct 2011)

1010
(in MW)
Capacity addition target during 11th Plan 78,700
Capacity addition likely as per Mid Term Assessment
62,374
Capacity addition likely as per latest assessment
52,895
Capacity Commissioned during 11th Plan (as on 15.11.2011) (Hydro- 5260 MW, Thermal-38,408 MW, Nuclear – 880 MW)(Private Sector -17,428 MW, State Sector- 14,510 MW, Central Sector- 12,610 MW)
44,548
CAPACITY ADDITION DURING 11TH PLAN (2007-2012)

1111
Projects under construction in Madhya Pradesh -Thermal
THERMAL
1Vindhyachal TPP-IV U 11,12
MP NTPC C 1000
2 Satpura TPP Ext U-10,11 MP MPPGCL S 500
3Shree Singati (Malwa) TPP U 1,2
MP MPGENCO S 1200
4 Bina TPP U-1,2 MPBina Power Supply Company Ltd., Jaypee Group
P 500
5 Anoppur TPP -I U 1,2 MP MB Power ( M P) Ltd. P 1200
6 Sasan UMPP MP Reliance Power Ltd. P 3960
7 Nigri TPP U 1,2 MP JP Power Ventures Ltd. P 1320
8 Mahan TPP U 1,2 MP Essar Power MP Ltd. P 1200
9 DB POWER U1,2 MP DB POWER 1320
TOTAL (THERMAL) 12200

1212
CAPACITY ADDITION -12TH PLAN (2012-2017)
•Report of Working Group on Power for 12th Plan expected shortly. Likely requirement of capacity addition during 12th Plan - about 80,000 MW. ( RES – 18,500 MW; 55% Capacity - Private Sector; 40% - coal based supercritical technology
•Target of energy saving through DSM and Energy Efficiency measures about 60 BU at busbar, avoided peaking capacity about 12,000 MW.

1313
Size Steam Parameter Efficiency Year
MW ata/C/C (%)
30-50 60/ 482 ~31 1950
60-100 90/ 535 32-33 1960
110 to150 130/ 535/535 35-36 1970
200/210 130,150/535/535 36.3,37.8 1977
250 150/535/535 38.3 1995
500 170/ 538/538 38.5 1984
500 170/535/565 38.7 2010
660 247/535/565 ~39.5 2010
660/800 247/565/593 40.5
Efficiency on HHV basis
Major Unit Sizes and Steam parameters
1414
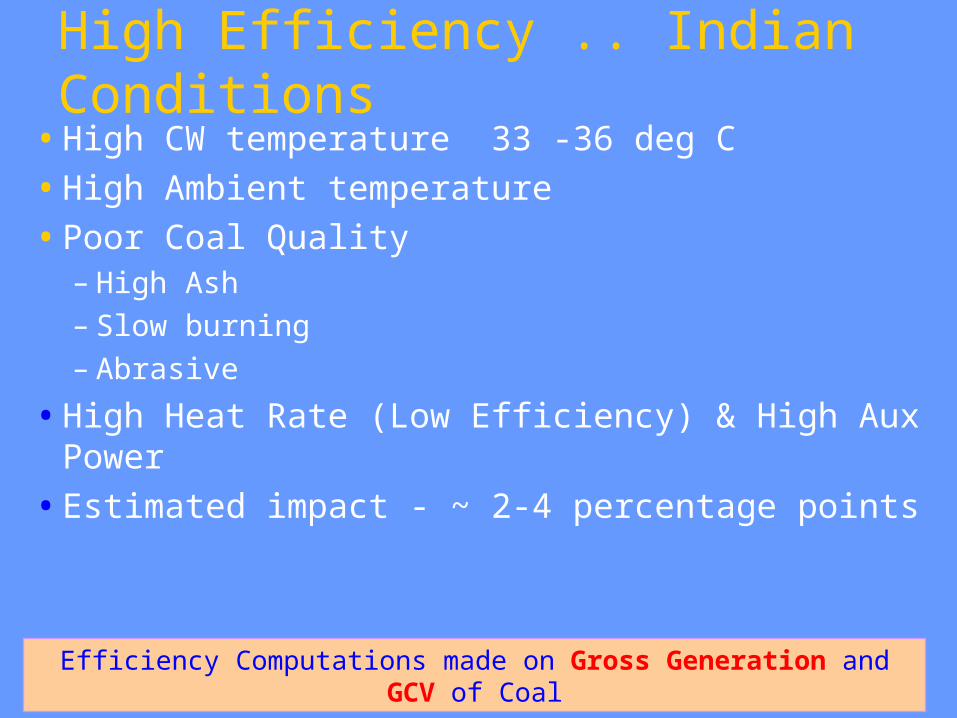
High Efficiency .. Indian Conditions
•High CW temperature 33 -36 deg C
•High Ambient temperature
•Poor Coal Quality– High Ash– Slow burning– Abrasive
•High Heat Rate (Low Efficiency) & High Aux Power
•Estimated impact - ~ 2-4 percentage points
Efficiency Computations made on Gross Generation and GCV of Coal

1515
Supercritical Unit Sizes Unit Size (MW)
Parameters Design Efficiency* Gross on
HHV
660 247kg/cm2 538/565 O C
39.5 %
247kg/cm2 565/593 O C
40.5 %
800 247kg/cm2 565/593 O C
40.5 %

1616
Supercritical Technology•First Supercritical unit of 660 MW
Commissioned in Dec-2010
•4 Units with total capacity 2640 MW operating
•~ 4000 MW supercritical capacity to be operational in 11th Plan (March -2012)
•Supercritical to constitute ~40% coal fired capacity addition in 12th Plan (2012-17)
•100% coal fired capacity addition in 13th Plan and beyond to be supercritical
1717
Ultra supercritical (USC) technology
− International Experience ~ 280 bars 600 deg C.
− Experience limited mainly in Japan, Europe and few countries
− International Developments under watch− Higher Steam Parameters Contemplated
Based On Feed Back Of Operating Supercritical Units

1818
LIST OF SUPERCRITICAL PROJECTS COMMISSIONED DURING 11TH PLAN
Sl.No.
PLANT NAME STATEDEVELOPE
R
BENEFITS
11TH PLAN (2007-
12)
1 MUNDRA TPP PH-II U 1,2 GUJARATADANI
POWER1320
2 MUNDRA TPP PH-III U 1 GUJARATADANI
POWER660
3 SIPAT-I U1CHATTISG
ARHNTPC 660
TOTAL (COMMISSIONED) TILL 15.11.2011
2640

1919
LIST OF SUPERCRITICAL PROJECTS UNDER EXECUTION FOR LIKELY BENEFITS DURING 11TH PLAN
Sl.No.
PLANT NAME STATE DEVELOPER
LIKELY BENEFITS 11TH PLAN (2007-12)
1ULTRA MEGA MUNDRA
U1GUJARAT TATA POWER 800
2 TIRODA TPP PH-I, U1 MAHARASHTRA ADANI POWER 660
3 SIPAT-I U2 CHATTISGARH NTPC 660
4 Jhajjar TPP U1 HARYANA CLP POWER 660
TOTAL (UNDER EXECUTION) 2780

2020
LIST OF SUPERCRITICAL PROJECTS UNDER EXECUTION FOR LIKELY BENEFITS DURING 12TH PLAN IN MADHYA PRADESH
1 Sasan UMPP U 1-4Reliance Power Ltd.
2640MW
2 Nigri TPP U 1JP Power
Ventures Ltd.
660MW

2121
Advance Ultra Supercritical Technology– Efforts underway for indigenous
development of 700 deg C technology – Part of National Mission on Clean Coal
Technology– MoU between IGCAR, NTPC & BHEL – Indigenous design and manufacturing of
materials proposed

2222
Integrated Gasification Combined Cycle (IGCC)
•Limited International experience & with low ash coals ( Only 6 plants are in operation in the world)
•Fluidised bed gasifier considered suitable for Indian coals not proven Internationally
•High Capital and operating Cost
• IGCC technology for Indian coal requires indigenous development through R&D – Feasibility studies done by Nexant, USA & BHEL
•Indicate Low efficiency and low availability

2323
Future Ahead for IGCC
– BHEL MOU with APGENCO for IGCC demo project
– NTPC desirous of setting up IGCC demo plant through International cooperation

2424
Oxyfuel Technology
• Is currently being developed around the world
•Few small projects are in operation or proposed
– Vattenfall 30 MW , Germany
•Barriers – Need of high purity Oxygen – high
penalty on Efficiency– Technology yet to be proven
2525
CO2 Emissions

2626
Per Capita CO2 Emissions (t CO2/capita)
•World – 4.29
• India - 1.37
•China – 5.13
•USA - 16.90
(Source: IEA key world Energy Statistics 2011)

2727
Absolute CO2 Emissions from Indian Power Sector*
469.7 494.7 520.5 548.3 579.8
0.0100.0200.0300.0400.0500.0600.0700.0
2005-06 2006-07 2007-08 2008-09 2009-10
Year
Mill
ion
tC
O2
Estimated to be ~600 Million tonnes in 2010-11
Emissions are from Grid Connected power stations

2828
Average CO2 Emissions per unit Grid Average kg CO2/kWh
NEWNE 0.82 Southern 0.75 India 0.81
NEWNE – Northern,Eastern,Western and North Eastern Grid

2929
CO2 emissions from various unit sizes in kg CO2/MWh
•800 MW – ~0.88
•660MW - ~0.90
•500 MW – ~0.92
•210 MW – ~0.94

3030