For Private Circulation Only. FOR IMPORTANT INFORMATION ABOUT KOTAK SECURITIES’ RATING SYSTEM AND OTHER DISCLOSURES. REFER TO THE END OF THIS MATERIAL.
Contents
Daily Alerts
Company alerts
Bajaj Corp.: Management meet notes - on a strong footing
Sector alerts
Technology: Accenture - another strong broad-based growth quarter
Telecom: Auction outcome details - largely in line, with some customary surprises
Infrastructure: Indian AC industry - bring on the heat
INDIA DAILY March 27, 2015 India 26-Mar 1-day 1-mo 3-mo
Sensex 27,458 (2.3) (6.0) 0.8
Nifty 8,342 (2.2) (5.7) 1.7
Global/Regional indices
Dow Jones 17,678 (0.2) (2.5) (2.1)
Nasdaq Composite 4,863 (0.3) (2.0) 1.2
FTSE 6,895 (1.4) (0.7) 4.3
Nikkei 19,491 0.1 3.7 9.4
Hang Seng 24,541 0.2 (1.1) 5.1
KOSPI 2,023 0.0 1.9 3.9
Value traded – India
Cash (NSE+BSE) 267 226 209
Derivatives (NSE) 5,785 5,816 1,093
Deri. open interest 2,812 2,777 1,585
Forex/money market
Change, basis points
26-Mar 1-day 1-mo 3-mo
Rs/US$ 62.8 (10) 123 (84)
10yr govt bond, % 7.9 1 9 (22)
Net investment (US$ mn)
25-Mar MTD CYTD
FIIs 99 3,678 16,162
MFs (63) (632) 4,802
Top movers
Change, %
Best performers 26-Mar 1-day 1-mo 3-mo
SIEM IN Equity 1355.2 (0.7) 2.1 58.5
HDIL IN Equity 101.3 1.0 (15.2) 49.6
LPC IN Equity 1973.0 (1.8) 13.6 40.2
AL IN Equity 68.5 1.6 2.3 37.6
RBXY IN Equity 819.3 (1.4) 19.1 33.3
Worst performers
BOI IN Equity 197.4 (2.7) (16.2) (34.5)
PNB IN Equity 148.2 (4.7) (10.8) (33.3)
UNBK IN Equity 162.0 (2.4) (7.6) (32.8)
RCOM IN Equity 60.1 (1.9) (13.9) (25.3)
BOB IN Equity 161.0 (2.9) (11.0) (24.6)

For Private Circulation Only. FOR IMPORTANT INFORMATION ABOUT KOTAK SECURITIES’ RATING SYSTEM AND OTHER DISCLOSURES, REFER TO THE END OF THIS MATERIAL.
LHO growth accelerates a tad; however, overall consumer demand weak
Management highlighted that while LHO market growth, as per Nielsen, has picked up from -
1% in December 2014 to 1% in January 2015 and 2.5% in February, overall consumer demand
still remains weak. Cooling oils growth has come under pressure in 4QFY15 due to weaker off-
take, especially in North due to unseasonal rains and relatively cooler temperatures.
ADHO continues to grow ahead of market; several other growth drivers in place
While we model 14% volume growth in ADHO in FY2016E driven by low base (in 1HFY16E)
and market share gains, our interaction with the management suggests several other growth
drivers – (1) NOMARKS continues to post good growth driven by better traction in both creams
and facewash and distribution expansion; we model NOMARKS to post `800 mn revenues in
FY2016E (+40% yoy), (2) BJCOR has recently launched a new low-cost Amla brand in five states
– Bajaj Amla with Almond and Rosemary oil positioned against Shanti Amla at `20 for 80 ml;
we note Marico has cut prices of Shanti Amla 80 ml SKU from `23 to `20 (in response,
perhaps), and (3) BJCOR is planning to increase its focus on international markets such as
Nepal, Bangladesh, the UAE and Africa; we note BJCOR has four dedicated country managers
across key geographies and is planning to set up a manufacturing (third-party) facility in the
UAE.
We remain positive; retain BUY and raise TP to `510 (from `495)
We model 27.7% yoy growth in PAT in FY2016E aided by – (1) 18% yoy growth in ADHO
revenues (14% volume growth and ~4% weighted average price hike) and (2) 260 bps jump in
GMs to 64.3% aided by 20% dip in LLP prices; we note BJCOR has locked in LLP for six months
at `60.5/kg (current LLP prices stand at `62.5/kg and FY2015E average for BJCOR stood at
`77.6/kg). While we expect A&SP to jump 80 bps yoy to 18.8%, we expect bulk of the increase
to be driven by higher promotional expenses (especially at consumer levels in the form of
freebies).
We remain bullish on BJCOR driven by – (1) volume growth pick-up, (2) strong earnings growth
visibility and (3) modest valuations (P/E of 20X FY2017E EPS; at ~40% discount to sector
multiples ex-ITC). BJCOR remains our preferred pick among small-cap consumer names; retain
BUY rating with a revised target price of `510 (from `495) as we roll over to March 2017E
estimates (based on P/E multiple of 23X; ~30% discount to sector multiples ex-ITC).
Bajaj Corp. (BJCOR) Consumer Products
Management meet notes – on a strong footing. Our recent interaction reinforces
our confidence in BJCOR – (1) LHO growth has accelerated a tad and ADHO continues
to grow significantly ahead of market, (2) LLP prices remain benign and (3) NOMARKS,
international business and new low-cost Amla brand to emerge as additional growth
drivers. Modest valuations at P/E of 20X FY2017E lend additional comfort. Retain BUY
rating with a revised TP of `510 (from `495) based on P/E of 23X March 2017E.
BUY
MARCH 27, 2015
UPDATE
Coverage view: Attractive
Price (`): 443
Target price (`): 510
BSE-30: 27,458
Bajaj Corp.
Stock data Forecasts/Valuations 2015 2016E 2017E
52-week range (Rs) (high,low) EPS (Rs) 15.0 19.1 22.3
Market Cap. (Rs bn) EPS growth (%) 24.3 27.7 16.6
Shareholding pattern (%) P/E (X) 29.6 23.2 19.9
Promoters 66.9 Sales (Rs bn) 8.3 9.9 12.0
FIIs 23.5 Net profits (Rs bn) 2.2 2.8 3.3
MFs 2.0 EBITDA (Rs bn) 2.4 3.1 3.8
Price performance (%) 1M 3M 12M EV/EBITDA (X) 26.1 19.9 16.0
Absolute 3.6 30.5 102.8 ROE (%) 43.5 52.9 53.1
Rel. to BSE-30 8.5 29.5 63.2 Div. Yield (%) 2.6 2.0 2.7
Company data and valuation summary
500-203
65.4

Bajaj Corp. Consumer Products
KOTAK INSTITUTIONAL EQUITIES RESEARCH 3
Exhibit 1: We have broadly retained our estimates Key changes to earnings model, Bajaj Corp, March fiscal year-ends, 2015-17E
Source: Company, Kotak Institutional Equities estimates
Exhibit 2: BJCOR has recently launched ‘Bajaj Amla with Almond and Rosemary oil’ – a low-cost Amla
brand positioned versus Shanti Amla (this is the 160 ml variant)
Source: Company, Kotak Institutional Equities
Exhibit 3: LLP prices have corrected sharply from peak of Rs85/kg a year ago to Rs62.5/kg BJCOR’s quarterly average purchase price for LLP (Rs/kg)
Source: Company, Kotak Institutional Equities
2015E 2016E 2017E 2015E 2016E 2017E 2015E 2016E 2017E
Revenues (Rs mn) 8,266 9,896 11,964 8,262 9,947 12,098 0.0 (0.5) (1.1)
EBITDA (Rs mn) 2,390 3,084 3,768 2,376 3,068 3,778 0.6 0.5 (0.3)
EBITDA (%) 28.9 31.2 31.5 28.8 30.8 31.2
PAT (Rs mn) 2,206 2,817 3,283 2,194 2,795 3,291 0.5 0.8 (0.2)
EPS (Rs/share) 15.0 19.1 22.3 14.9 19.0 22.3 0.5 0.8 (0.2)
Revised Earlier Change (%)
50
55
60
65
70
75
80
85
90
1Q
FY1
1
2Q
FY1
1
3Q
FY1
1
4Q
FY1
1
1Q
FY1
1
2Q
FY1
2
3Q
FY1
2
4Q
FY1
2
1Q
FY1
3
2Q
FY1
3
3Q
FY1
3
4Q
FY1
3
1Q
FY1
4
2Q
FY1
4
3Q
FY1
4
4Q
FY1
4
1Q
FY1
5
2Q
FY1
5
3Q
FY1
5
4Q
FY1
5E
Consumer Products Bajaj Corp.
4 KOTAK INSTITUTIONAL EQUITIES RESEARCH
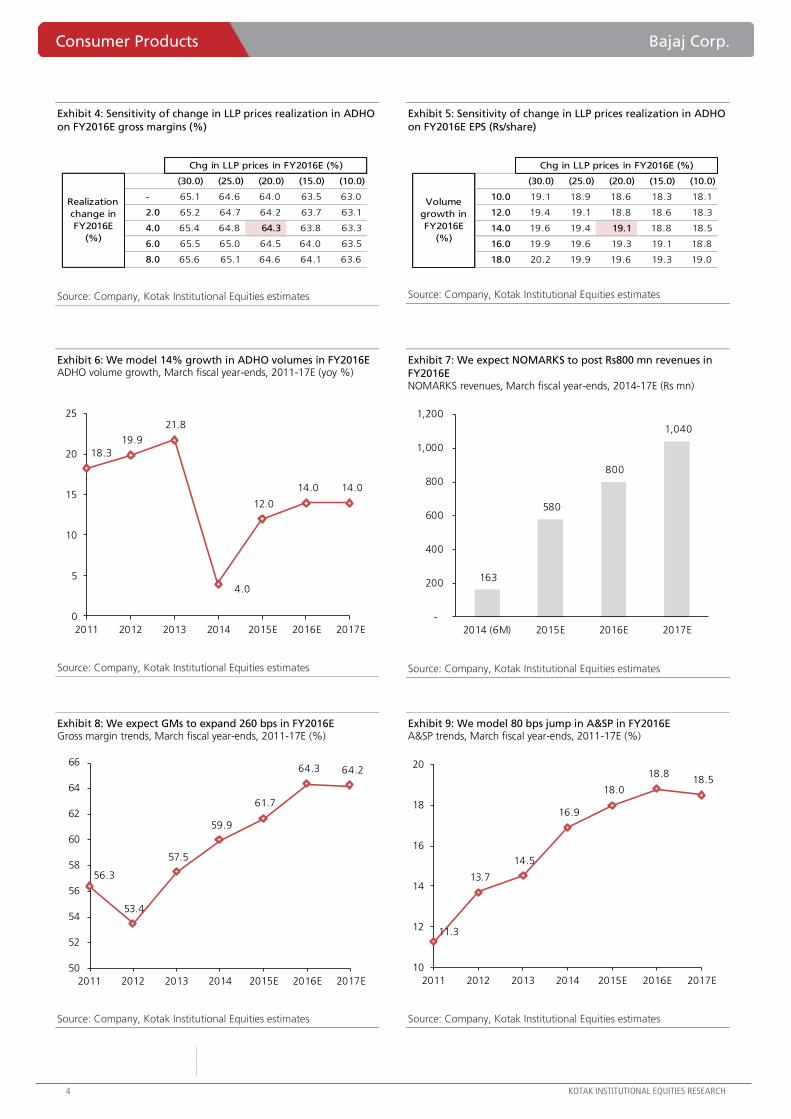
Exhibit 4: Sensitivity of change in LLP prices realization in ADHO
on FY2016E gross margins (%)
Source: Company, Kotak Institutional Equities estimates
Exhibit 5: Sensitivity of change in LLP prices realization in ADHO
on FY2016E EPS (Rs/share)
Source: Company, Kotak Institutional Equities estimates
Exhibit 6: We model 14% growth in ADHO volumes in FY2016E ADHO volume growth, March fiscal year-ends, 2011-17E (yoy %)
Source: Company, Kotak Institutional Equities estimates
Exhibit 7: We expect NOMARKS to post Rs800 mn revenues in
FY2016E NOMARKS revenues, March fiscal year-ends, 2014-17E (Rs mn)
Source: Company, Kotak Institutional Equities estimates
Exhibit 8: We expect GMs to expand 260 bps in FY2016E Gross margin trends, March fiscal year-ends, 2011-17E (%)
Source: Company, Kotak Institutional Equities estimates
Exhibit 9: We model 80 bps jump in A&SP in FY2016E A&SP trends, March fiscal year-ends, 2011-17E (%)
Source: Company, Kotak Institutional Equities estimates
64.3 (30.0) (25.0) (20.0) (15.0) (10.0)
- 65.1 64.6 64.0 63.5 63.0
2.0 65.2 64.7 64.2 63.7 63.1
4.0 65.4 64.8 64.3 63.8 63.3
6.0 65.5 65.0 64.5 64.0 63.5
8.0 65.6 65.1 64.6 64.1 63.6
Chg in LLP prices in FY2016E (%)
Realization
change in
FY2016E
(%)
19.1 (30.0) (25.0) (20.0) (15.0) (10.0)
10.0 19.1 18.9 18.6 18.3 18.1
12.0 19.4 19.1 18.8 18.6 18.3
14.0 19.6 19.4 19.1 18.8 18.5
16.0 19.9 19.6 19.3 19.1 18.8
18.0 20.2 19.9 19.6 19.3 19.0
Chg in LLP prices in FY2016E (%)
Volume
growth in
FY2016E
(%)
18.3
19.9
21.8
4.0
12.0
14.0 14.0
0
5
10
15
20
25
2011 2012 2013 2014 2015E 2016E 2017E
163
580
800
1,040
-
200
400
600
800
1,000
1,200
2014 (6M) 2015E 2016E 2017E
56.3
53.4
57.5
59.9
61.7
64.3 64.2
50
52
54
56
58
60
62
64
66
2011 2012 2013 2014 2015E 2016E 2017E
11.3
13.7
14.5
16.9
18.0
18.8 18.5
10
12
14
16
18
20
2011 2012 2013 2014 2015E 2016E 2017E
Bajaj Corp. Consumer Products
KOTAK INSTITUTIONAL EQUITIES RESEARCH 5
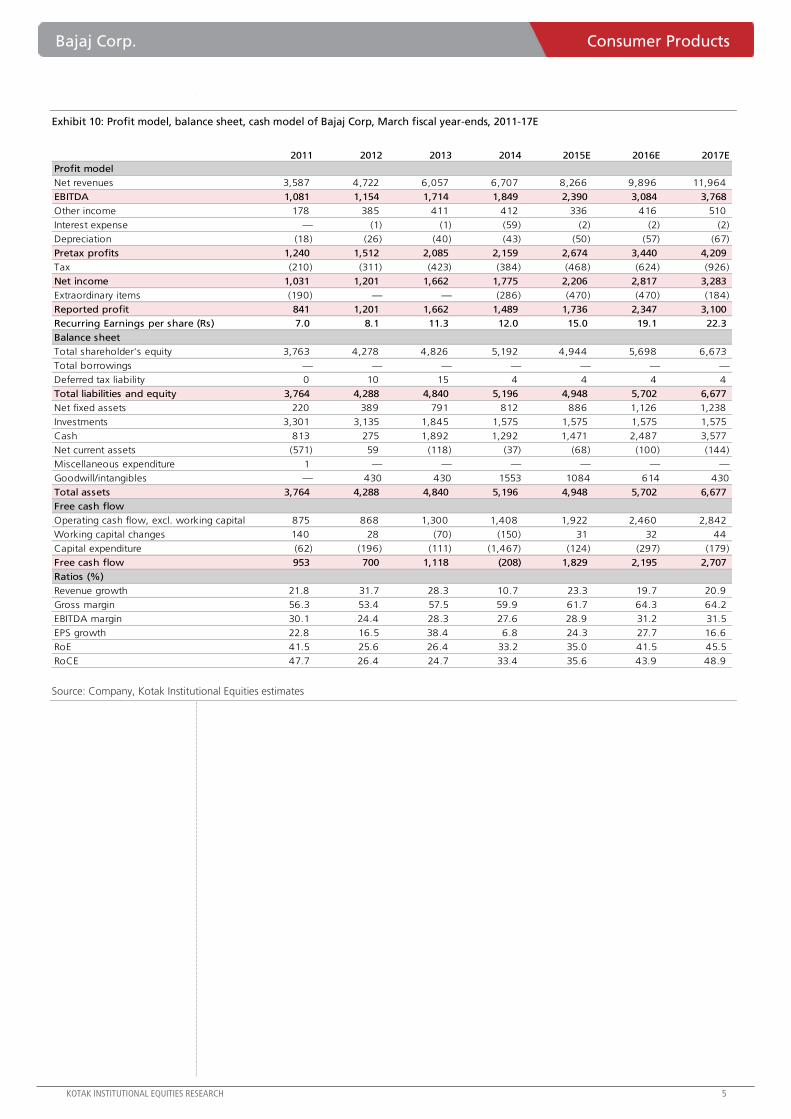
Exhibit 10: Profit model, balance sheet, cash model of Bajaj Corp, March fiscal year-ends, 2011-17E
Source: Company, Kotak Institutional Equities estimates
2011 2012 2013 2014 2015E 2016E 2017E
Profit model
Net revenues 3,587 4,722 6,057 6,707 8,266 9,896 11,964
EBITDA 1,081 1,154 1,714 1,849 2,390 3,084 3,768
Other income 178 385 411 412 336 416 510
Interest expense — (1) (1) (59) (2) (2) (2)
Depreciation (18) (26) (40) (43) (50) (57) (67)
Pretax profits 1,240 1,512 2,085 2,159 2,674 3,440 4,209
Tax (210) (311) (423) (384) (468) (624) (926)
Net income 1,031 1,201 1,662 1,775 2,206 2,817 3,283
Extraordinary items (190) — — (286) (470) (470) (184)
Reported profit 841 1,201 1,662 1,489 1,736 2,347 3,100
Recurring Earnings per share (Rs) 7.0 8.1 11.3 12.0 15.0 19.1 22.3
Balance sheet
Total shareholder's equity 3,763 4,278 4,826 5,192 4,944 5,698 6,673
Total borrowings — — — — — — —
Deferred tax liability 0 10 15 4 4 4 4
Total liabilities and equity 3,764 4,288 4,840 5,196 4,948 5,702 6,677
Net fixed assets 220 389 791 812 886 1,126 1,238
Investments 3,301 3,135 1,845 1,575 1,575 1,575 1,575
Cash 813 275 1,892 1,292 1,471 2,487 3,577
Net current assets (571) 59 (118) (37) (68) (100) (144)
Miscellaneous expenditure 1 — — — — — —
Goodwill/intangibles — 430 430 1553 1084 614 430
Total assets 3,764 4,288 4,840 5,196 4,948 5,702 6,677
Free cash flow
Operating cash flow, excl. working capital 875 868 1,300 1,408 1,922 2,460 2,842
Working capital changes 140 28 (70) (150) 31 32 44
Capital expenditure (62) (196) (111) (1,467) (124) (297) (179)
Free cash flow 953 700 1,118 (208) 1,829 2,195 2,707
Ratios (%)
Revenue growth 21.8 31.7 28.3 10.7 23.3 19.7 20.9
Gross margin 56.3 53.4 57.5 59.9 61.7 64.3 64.2
EBITDA margin 30.1 24.4 28.3 27.6 28.9 31.2 31.5
EPS growth 22.8 16.5 38.4 6.8 24.3 27.7 16.6
RoE 41.5 25.6 26.4 33.2 35.0 41.5 45.5
RoCE 47.7 26.4 24.7 33.4 35.6 43.9 48.9
For Private Circulation Only. FOR IMPORTANT INFORMATION ABOUT KOTAK SECURITIES’ RATING SYSTEM AND OTHER DISCLOSURES, REFER TO THE END OF THIS MATERIAL.
Accenture delivers yet again; 10% growth in 2QFY15, FY2015 revenue growth outlook raised
Accenture reported local currency (l/c) revenue growth of 12% in the February 2015 (2QFY15)
quarter. Growth was strong in both consulting (+11% yoy in l/c) and outsourcing (+13% yoy in
l/c) segments. Digital, contributing 20% to overall revenues, grew 20% and forms the bedrock
of ACN’s growth; part of the growth is aided by a number of acquisitions in the past 12
months. From a vertical standpoint, communications, media and tech grew 15% and products
segment grew by 13%. Accenture reported second-highest bookings of US$9.4 bn in the
quarter.
ACN raised FY2015 (Aug year-end) revenue growth guidance to 8-10% from 5-8% in l/c. The
management indicated continuation of strong growth in 2HFY15, while attributing the growth
to significant market share gains across all streams of businesses. Accenture targets gross
addition of 90,000 employees in FY2015.
Currency impacts reported USD growth and EPS
Fx impacted ACN‘s reported USD revenue growth by 6.5%. We note that ACN derives 36% of
revenues from Europe, which has suffered from currency depreciation against USD. ACN, as a
result, cut FY2015 (Aug year-end) EPS guidance by 1%. An interesting aspect of the
performance was 140 bps yoy decline in gross margin in the Feb 2015 quarter, presumably due
to currency movements. However, 170 bps decline in SG&A expenses resulted in overall 30 bps
yoy increase in EBIT margin.
Read-through—the difficult part but positive overall
Accenture’s result read-through is always open to contradicting interpretations. Strong
outsourcing-based growth for Accenture can be a reflection of a strong demand environment
(positive for Indian IT) or alternately led by market share gains (negative for Indian IT). The
management’s statement of growth led by market share gains across all key segments stirs up
the plot even more. Yet we believe that the overall read-through is a positive. We based this on
Growth in consulting business indicates a solid discretionary spending environment.
ACN indicated that growth in consulting business was across all segments, digital,
management, strategy and operations. Strong growth in consulting is a useful indicator of
discretionary spending even after making concessions of market share gains.
Another quarter of double-digit yoy growth in outsourcing segment. Solid growth in
outsourcing indicates that Accenture is participating in and winning deals as much as any
other offshore IT pure-plays. What makes this growth creditable is that ACN does not have
high exposure to IMS, the primary growth driver of other IT companies. The performance of
ACN demonstrates that growth is still possible in apps portfolio provided vendors are capable
to structure and deliver multi-service lines deals in an outcome-based format. ACN’s
outsourcing business comprises application services, business process management and
relatively low exposure to infra.
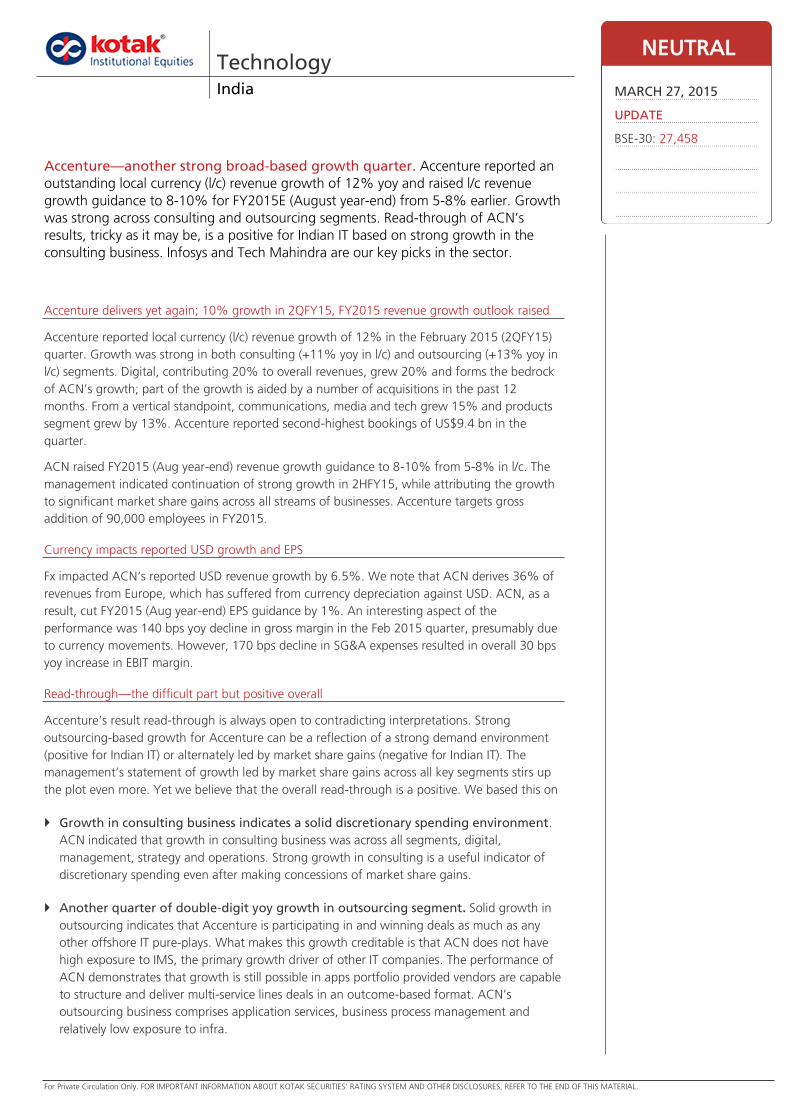
Technology India
Accenture—another strong broad-based growth quarter. Accenture reported an
outstanding local currency (l/c) revenue growth of 12% yoy and raised l/c revenue
growth guidance to 8-10% for FY2015E (August year-end) from 5-8% earlier. Growth
was strong across consulting and outsourcing segments. Read-through of ACN’s
results, tricky as it may be, is a positive for Indian IT based on strong growth in the
consulting business. Infosys and Tech Mahindra are our key picks in the sector.
NEUTRAL
MARCH 27, 2015
UPDATE
BSE-30: 27,458

Technology India
KOTAK INSTITUTIONAL EQUITIES RESEARCH 7
Maintain constructive view, recent correction is an opportunity to buy
We believe that demand in FY2016 will be similar to FY2015. Several US indicators such as
the Consumer Confidence Index, PMI and unemployment rate have been robust for the past
few quarters and point towards a healthy US economy. IT spends are likely to pick up in
banking and financial services. Indian IT companies are seeing significant market share gains
as large deals come up for re-bid. Demand is Europe is robust led by higher outsourcing. We
see recent correction in the stock prices as an opportunity to buy.
Exhibit 1: Accenture interim results, August fiscal year-ends (US$ mn)
Source: Company, Kotak Institutional Equities
Exhibit 2: Kotak Institutional Equities: valuation summary of key Indian technology companies
Source: Companies, Kotak Institutional Equities estimates
2QFY14 1QFY15 2QFY15 % qoq % yoy
Revenues 7,131 7,896 7,493 (5.1) 5.1
Cost of revenues 4,901 5,356 5,253 (1.9) 7.2
SG&A expenses 1,279 1,352 1,220 (9.8) (4.6)
EBIT 951 1,188 1,021 (14.0) 7.3
Other income (1) 4 (16)
PBT 950 1,192 1,005 (15.7) 5.8
Provision for taxes 228 300 262
PAT 722 892 743 (16.7) 2.9
Minority interest 51 61 52 (13.6) 2.8
PAT after minority interest 671 832 691 (16.9) 2.9
Margins (%)
EBIT 13.3 15.0 13.6
Net income 10.1 11.3 9.9
26-Mar-15 EPS (Rs) P/E (X) EV/EBITDA (X) RoE (%)
Company Price (Rs) Rating (Rs m) (US$ m) 2015E 2016E 2017E 2015E 2016E 2017E 2015E 2016E 2017E 2015E 2016E 2017E
HCL Technologies 987 REDUCE 1,387,984 22,141 53.8 56.2 62.2 18.4 17.6 15.9 13.6 12.2 10.5 32.7 27.4 24.9
Hexaware Technologies 289 SELL 87,160 1,390 10.8 14.1 16.0 26.7 20.5 18.1 17.2 14.4 12.5 26.2 31.5 32.6
Infosys 2,146 ADD 2,465,024 39,322 108.4 123.1 146.0 19.8 17.4 14.7 14.2 12.0 9.8 25.7 25.0 25.3
Mindtree 1,361 REDUCE 113,903 1,817 64.8 75.1 88.3 21.0 18.1 15.4 14.8 12.2 10.0 29.8 28.2 27.3
Mphasis 376 SELL 78,908 1,259 31.5 33.9 37.3 11.9 11.1 10.1 6.5 5.8 5.0 12.6 12.9 13.4
TCS 2,513 ADD 4,922,479 78,524 107.8 122.9 145.5 23.3 20.5 17.3 17.2 14.4 12.0 35.8 35.0 34.6
Tech Mahindra 651 ADD 625,525 9,978 32.6 38.9 45.8 20.0 16.7 14.2 14.5 11.8 9.9 26.9 25.4 24.0
Wipro 632 ADD 1,560,175 24,888 34.4 38.4 44.8 18.3 16.5 14.1 12.4 10.7 8.8 22.7 21.5 21.4
Technology Attractive 11,241,158 179,321 20.8 18.5 15.8 15.0 12.7 10.6 26.8 25.4 25.0
KIE universe 74,544,416 1,189,143 19.1 16.0 13.5 11.5 9.6 8.1 13.8 14.8 15.7
Target O/S shares EPS CAGR (%) Net Profit (Rs mn) EBITDA (Rs mn) Sales (Rs mn)
Company Price (Rs) (mn) 2014-17E 2015E 2016E 2017E 2015E 2016E 2017E 2015E 2016E 2017E 2015E 2016E 2017E
HCL Technologies 850 1,414 (11.7) 19.2 4.6 10.5 76,026 79,530 88,033 92,179 99,008 109,574 373,409 424,690 483,651
Hexaware Technologies 210 302 8.1 (14.4) 30.3 13.1 3,265 4,255 4,814 4,776 5,688 6,507 25,817 31,079 35,607
Infosys 2,350 1,143 (8.4) 14.0 13.6 18.5 123,923 140,730 166,802 151,530 175,693 208,274 537,630 611,997 716,247
Mindtree 1,400 84 18.0 20.6 16.0 17.5 5,452 6,324 7,431 7,140 8,462 10,060 35,601 41,818 49,573
Mphasis 355 210 36.3 114.3 7.4 10.1 6,625 7,112 7,828 8,874 9,625 10,516 58,502 62,083 66,382
TCS 2,700 1,959 14.2 10.4 14.0 18.4 211,120 240,700 285,082 273,451 321,887 377,750 950,462 1,109,160 1,303,154
Tech Mahindra 725 864 (29.0) 1.7 19.5 17.7 28,123 33,621 39,586 42,384 51,041 59,445 223,161 277,731 321,838
Wipro 670 2,467 12.2 8.8 11.5 16.6 84,989 94,750 110,440 109,738 121,764 140,490 472,513 521,492 598,704
Technology 12.5 12.5 17.0 539,522 607,023 710,016 690,073 793,169 922,616 2,677,096 3,080,050 3,575,156
KIE universe 4.2 19.4 18.7
Notes:
(a) HCL Technologies is June fiscal year-ending.
(b) Hexaware Technologies is December year-ending.
Mkt cap.
EPS growth (%)
For Private Circulation Only. FOR IMPORTANT INFORMATION ABOUT KOTAK SECURITIES’ RATING SYSTEM AND OTHER DISCLOSURES, REFER TO THE END OF THIS MATERIAL.
Auction details out; some surprises as always even as broad results are on expected lines
Some quick top-down highlights first, before we jump into the details –
Total aggregate payout of `1.1 tn, of which upfront payment would be `290 bn.
Aggregate payouts for various players—Idea – `303 bn, Vodafone `260 bn, Bharti – `291
bn, RJio – `101 bn, RCOM – `43 bn, TTSL – `79 bn, and Aircel – `23 bn. Telenor did not win
any spectrum.
Bharti, Vodafone, and Idea renewed a minimum of 5 MHz of 900 MHz spectrum in all of
their renewal circles. In fact, Bharti enhanced its 900 MHz holdings in five out of its six
renewal circles.
RCOM could not renew 900 MHz spectrum in five out of its seven circles, but did buy
alternate 1800 spectrum in two circles. The company faces the reality of having to shut
down its 2G GSM operations in three circles (Assam, Bihar, and West Bengal; GSM
operations in these circles contribute roughly 13% of its overall wireless revenues).
Bharti and Vodafone made good strides in terms of buying fresh spectrum for enhancing
data spectrum footprint. Idea could not do much on this front given that the company’s
primary focus was ensuring that it renews 900 MHz spectrum in its nine renewal circles.
R-Jio largely focused on completing its FD-LTE spectrum footprint and managed to expand
this to 20 circles from 14 before the auctions. The only two circles where RJio does not have
FD-LTE spectrum (either 1800 or 800; it bought substantial 800 MHz spectrum in these
auctions and we are assuming it is for FD-LTE) are Punjab and UP (West).
What do these results mean for the sector/ listed incumbents? A lot…
We believe that the incumbents met their two key objectives—(1) renew a minimum 5 MHz of
900-band spectrum in their respective 900 circles, and (2) enhance data spectrum footprint
wherever possible. On the second aspect, Bharti did better than Vodafone and Idea; however,
we believe that all three are well-positioned from a hi-speed data spectrum standpoint in their
respective leadership circles (more on this later). From a renewal pressure standpoint,
incumbents can now look forward to a long phase where they do not need to worry about
‘business continuity risks’ emerging from the unique spectrum renewal approach that the
government adopted. To sum up, we believe the positives just about balance out the negatives
in the form of financial pressure arising from massive payouts. We stay positive on both Bharti
and Idea.
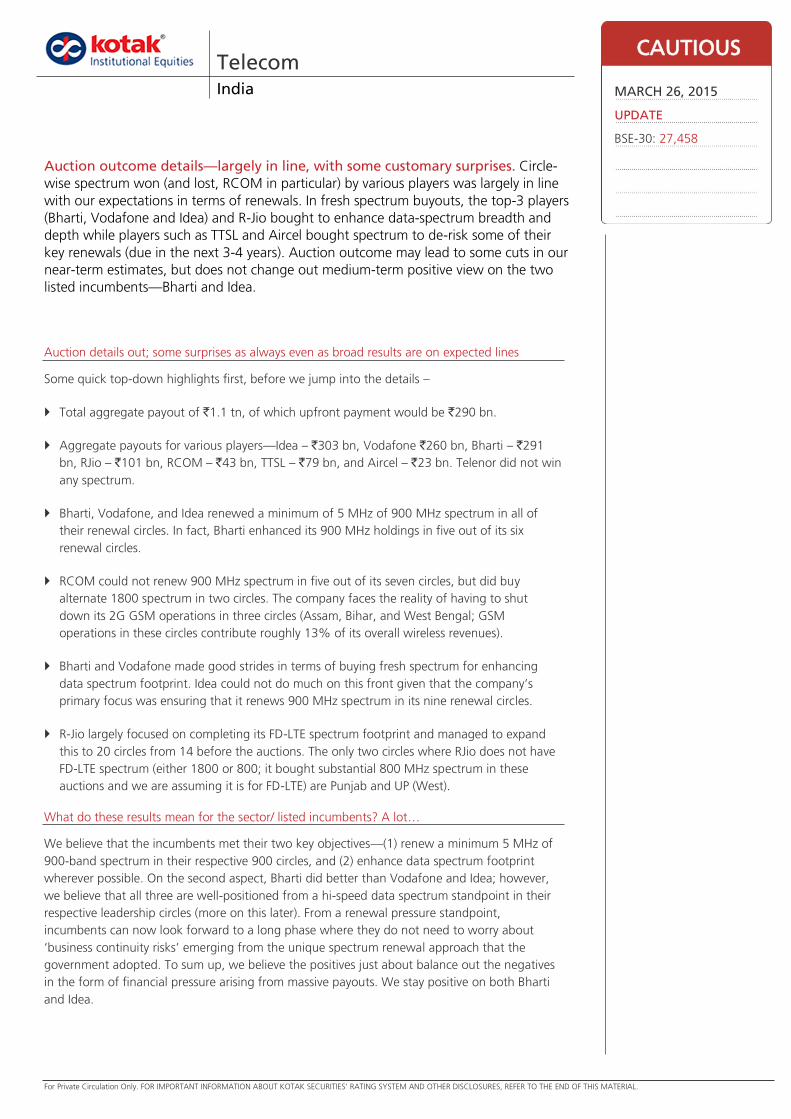
Telecom India
Auction outcome details—largely in line, with some customary surprises. Circle-
wise spectrum won (and lost, RCOM in particular) by various players was largely in line
with our expectations in terms of renewals. In fresh spectrum buyouts, the top-3 players
(Bharti, Vodafone and Idea) and R-Jio bought to enhance data-spectrum breadth and
depth while players such as TTSL and Aircel bought spectrum to de-risk some of their
key renewals (due in the next 3-4 years). Auction outcome may lead to some cuts in our
near-term estimates, but does not change out medium-term positive view on the two
listed incumbents—Bharti and Idea.
CAUTIOUS
MARCH 26, 2015
UPDATE
BSE-30: 27,458

Telecom India
KOTAK INSTITUTIONAL EQUITIES RESEARCH 9
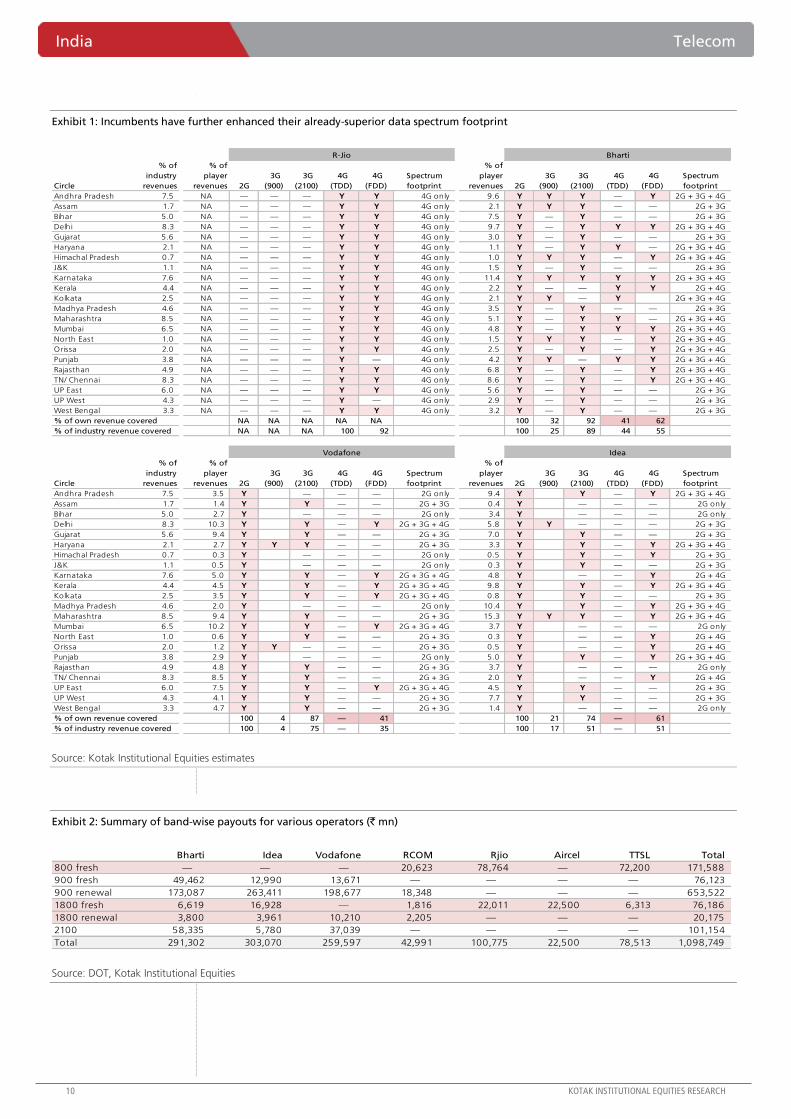
Incumbents now even better placed, spectrum-wise, to capture upside from
data (3G and 4G) growth
Exhibits 1 and 2 depict the spectrum footprint of R-Jio, Bharti, Vodafone, and Idea after
these auctions. While R-Jio has now broadly completed its pan-India FD-LTE footprint to add
to its 2300 MHz TD-LTE footprint, we believe that the incumbents’ combination of 2G + 3G
+ 4G spectrums (different combinations in different circles for different incumbents) is
superior to R-Jio’s, and that incumbents are not likely to lose to R-Jio on this count. More
specifically:
Bharti’s 3G footprint (commercially launched + circles with the requisite spectrum) now
covers 98% of its revenues and its 4G (LTE) footprint covers 71%. The company does not
have any ‘2G only’ circles anymore and can offer mobile broadband in all its circles.
Idea: 3G footprint 80%, 4G footprint 61%; 5 2G-only circles contributing 13% to its
revenues.
Vodafone: 3G footprint 88%, 4G footprint 41%; six ‘2G-only circles’ contributing 12%
to its revenues.
Even as there are gaps in Vodafone’s and Idea’s footprint, what matters is data spectrum in
their leadership circles and on that count, we see almost no gaps. Bharti is placed extremely
well on this aspect.
We shall publish more thoughts and earnings revisions, if any, after hearing the
managements’ views on implications of these auctions
Our auction payout estimates were amongst the highest on the Street and the actual
outcome has turned out to be broadly in line with our expectations. Bharti’s auction payout
(aggregate) is about 30% higher than our estimate, but the company has achieved (almost)
pan-India 3G footprint and enhanced its 4G footprint; we were building in payouts towards
this in later years and to that extent, the additional payout only has a time-value impact.
Idea is hosting a call to discuss auction results and implications on Monday, March 30, 2015;
we expect to get Bharti’s views too and shall have a relook at our estimates after these
discussions.
We remain constructive on both Bharti and Idea and negative on RCOM. From a Bharti
Infratel standpoint, data footprint expansion will lead to higher loading revenues in the
future; however, (1) these are in our numbers, and (2) loading does not create material
value.
We have refrained from detailing auction results in words; a lot of charts follow that largely
convey the story.
India Telecom
10 KOTAK INSTITUTIONAL EQUITIES RESEARCH
Exhibit 1: Incumbents have further enhanced their already-superior data spectrum footprint
Source: Kotak Institutional Equities estimates
Exhibit 2: Summary of band-wise payouts for various operators (` mn)
Source: DOT, Kotak Institutional Equities
Circle
% of
industry
revenues
% of
player
revenues 2G
3G
(900)
3G
(2100)
4G
(TDD)
4G
(FDD)
Spectrum
footprint
% of
player
revenues 2G
3G
(900)
3G
(2100)
4G
(TDD)
4G
(FDD)
Spectrum
footprint
Andhra Pradesh 7.5 NA — — — Y Y 4G only 9.6 Y Y Y — Y 2G + 3G + 4G
Assam 1.7 NA — — — Y Y 4G only 2.1 Y Y Y — — 2G + 3G
Bihar 5.0 NA — — — Y Y 4G only 7.5 Y — Y — — 2G + 3G
Delhi 8.3 NA — — — Y Y 4G only 9.7 Y — Y Y Y 2G + 3G + 4G
Gujarat 5.6 NA — — — Y Y 4G only 3.0 Y — Y — — 2G + 3G
Haryana 2.1 NA — — — Y Y 4G only 1.1 Y — Y Y — 2G + 3G + 4G
Himachal Pradesh 0.7 NA — — — Y Y 4G only 1.0 Y Y Y — Y 2G + 3G + 4G
J&K 1.1 NA — — — Y Y 4G only 1.5 Y — Y — — 2G + 3G
Karnataka 7.6 NA — — — Y Y 4G only 11.4 Y Y Y Y Y 2G + 3G + 4G
Kerala 4.4 NA — — — Y Y 4G only 2.2 Y — — Y Y 2G + 4G
Kolkata 2.5 NA — — — Y Y 4G only 2.1 Y Y — Y 2G + 3G + 4G
Madhya Pradesh 4.6 NA — — — Y Y 4G only 3.5 Y — Y — — 2G + 3G
Maharashtra 8.5 NA — — — Y Y 4G only 5.1 Y — Y Y — 2G + 3G + 4G
Mumbai 6.5 NA — — — Y Y 4G only 4.8 Y — Y Y Y 2G + 3G + 4G
North East 1.0 NA — — — Y Y 4G only 1.5 Y Y Y — Y 2G + 3G + 4G
Orissa 2.0 NA — — — Y Y 4G only 2.5 Y — Y — Y 2G + 3G + 4G
Punjab 3.8 NA — — — Y — 4G only 4.2 Y Y — Y Y 2G + 3G + 4G
Rajasthan 4.9 NA — — — Y Y 4G only 6.8 Y — Y — Y 2G + 3G + 4G
TN/ Chennai 8.3 NA — — — Y Y 4G only 8.6 Y — Y — Y 2G + 3G + 4G
UP East 6.0 NA — — — Y Y 4G only 5.6 Y — Y — — 2G + 3G
UP West 4.3 NA — — — Y — 4G only 2.9 Y — Y — — 2G + 3G
West Bengal 3.3 NA — — — Y Y 4G only 3.2 Y — Y — — 2G + 3G
% of own revenue covered NA NA NA NA NA 100 32 92 41 62
% of industry revenue covered NA NA NA 100 92 100 25 89 44 55
Circle
% of
industry
revenues
% of
player
revenues 2G
3G
(900)
3G
(2100)
4G
(TDD)
4G
(FDD)
Spectrum
footprint
% of
player
revenues 2G
3G
(900)
3G
(2100)
4G
(TDD)
4G
(FDD)
Spectrum
footprint
Andhra Pradesh 7.5 3.5 Y — — — 2G only 9.4 Y Y — Y 2G + 3G + 4G
Assam 1.7 1.4 Y Y — — 2G + 3G 0.4 Y — — — 2G only
Bihar 5.0 2.7 Y — — — 2G only 3.4 Y — — — 2G only
Delhi 8.3 10.3 Y Y — Y 2G + 3G + 4G 5.8 Y Y — — — 2G + 3G
Gujarat 5.6 9.4 Y Y — — 2G + 3G 7.0 Y Y — — 2G + 3G
Haryana 2.1 2.7 Y Y Y — — 2G + 3G 3.3 Y Y — Y 2G + 3G + 4G
Himachal Pradesh 0.7 0.3 Y — — — 2G only 0.5 Y Y — Y 2G + 3G
J&K 1.1 0.5 Y — — — 2G only 0.3 Y Y — — 2G + 3G
Karnataka 7.6 5.0 Y Y — Y 2G + 3G + 4G 4.8 Y — — Y 2G + 4G
Kerala 4.4 4.5 Y Y — Y 2G + 3G + 4G 9.8 Y Y — Y 2G + 3G + 4G
Kolkata 2.5 3.5 Y Y — Y 2G + 3G + 4G 0.8 Y Y — — 2G + 3G
Madhya Pradesh 4.6 2.0 Y — — — 2G only 10.4 Y Y — Y 2G + 3G + 4G
Maharashtra 8.5 9.4 Y Y — — 2G + 3G 15.3 Y Y Y — Y 2G + 3G + 4G
Mumbai 6.5 10.2 Y Y — Y 2G + 3G + 4G 3.7 Y — — — 2G only
North East 1.0 0.6 Y Y — — 2G + 3G 0.3 Y — — Y 2G + 4G
Orissa 2.0 1.2 Y Y — — — 2G + 3G 0.5 Y — — Y 2G + 4G
Punjab 3.8 2.9 Y — — — 2G only 5.0 Y Y — Y 2G + 3G + 4G
Rajasthan 4.9 4.8 Y Y — — 2G + 3G 3.7 Y — — — 2G only
TN/ Chennai 8.3 8.5 Y Y — — 2G + 3G 2.0 Y — — Y 2G + 4G
UP East 6.0 7.5 Y Y — Y 2G + 3G + 4G 4.5 Y Y — — 2G + 3G
UP West 4.3 4.1 Y Y — — 2G + 3G 7.7 Y Y — — 2G + 3G
West Bengal 3.3 4.7 Y Y — — 2G + 3G 1.4 Y — — — 2G only
% of own revenue covered 100 4 87 — 41 100 21 74 — 61
% of industry revenue covered 100 4 75 — 35 100 17 51 — 51
R-Jio Bharti
Vodafone Idea
Bharti Idea Vodafone RCOM Rjio Aircel TTSL Total
800 fresh — — — 20,623 78,764 — 72,200 171,588
900 fresh 49,462 12,990 13,671 — — — — 76,123
900 renewal 173,087 263,411 198,677 18,348 — — — 653,522
1800 fresh 6,619 16,928 — 1,816 22,011 22,500 6,313 76,186
1800 renewal 3,800 3,961 10,210 2,205 — — — 20,175
2100 58,335 5,780 37,039 — — — — 101,154
Total 291,302 303,070 259,597 42,991 100,775 22,500 78,513 1,098,749

Telecom India
KOTAK INSTITUTIONAL EQUITIES RESEARCH 11
Exhibit 3: 900 MHz spectrum renewal summary
Source: DOT, Kotak Institutional Equities
Exhibit 4: Results of the 800 MHz spectrum auction (MHz)
Source: DOT, Kotak Institutional Equities
Up for renewal (MHz) Post auction holding (MHz)
Bharti
Andhra Pradesh 7.8 9.0
Himachal Pradesh 6.2 7.4
Karnataka 7.8 8.8
North East 4.4 8.8
Punjab 7.8 10.0
Rajasthan 6.2 6.0
Idea
Andhra Pradesh 6.2 5.0
Gujarat 6.2 5.0
Haryana 6.2 6.0
Karnataka 6.2 5.0
Kerala 6.2 6.0
Madhya Pradesh 6.2 7.4
Maharashtra 7.8 9.0
Punjab 7.8 5.6
UP (West) 6.2 5.0
Vodafone
Gujarat 7.8 6.0
Haryana 6.2 6.2
Kerala 6.2 6.4
Maharashtra 6.2 5.0
Rajasthan 6.2 6.4
UP (East) 6.2 5.6
RCOM
Assam 6.2 —
Bihar 6.2 —
Himachal Pradesh 6.2 5.0
Madhya Pradesh 6.2 5.0
North East 4.4 —
Orissa 6.2 —
West Bengal 4.4 —
Rs mn Bharti Vodafone Idea
Reliance
Jio RCOM TTSL Aircel Telenor
Total
spectrum
Total
payout
Clearing
price (Rs
mn/MHz)
Reserve
price (Rs
mn/MHz)
Clearing/
Reserve
(X)
Metros
Delhi 1.25 1.25 10,596 8,477 6,170 1.37
Mumbai 5.00 2.50 7.50 54,562 7,275 4,390 1.66
Kolkata 1.25 1.25 1,838 1,470 1,470 1.00
A circles
Andhra Pradesh 3.75 3.75 22,724 6,060 2,340 2.59
Gujarat 2.50 2.50 6,944 2,777 2,750 1.01
Karnataka - - 3,030 3,030 1.00
Maharashtra 2.50 2.50 19,985 7,994 3,390 2.36
Tamilnadu - - 3,600 3,600 1.00
B circles
Haryana 5.00 1.25 1.25 7.50 4,243 566 380 1.49
Kerala
Madhya Pradesh 5.00 5.00 20,420 4,084 910 4.49
Punjab 2.50 2.50 2,146 858 850 1.01
Rajasthan
UP east 3.75 3.75 5,025 1,340 1,340 1.00
UP west 1.25 1.25 1,188 950 950 1.00
West Bengal 1.25 1.25 713 570 570 1.00
C circles
Assam 5.00 5.00 10.00 8,222 822 280 2.94
Bihar 5.00 5.00 4,292 858 850 1.01
Himachal Pradesh 5.00 2.50 7.50 1,468 196 190 1.03
North East 5.00 5.00 10.00 2,538 254 110 2.31
Orissa 5.00 1.25 6.25 2,565 410 380 1.08
J&K 5.00 2.50 7.50 2,121 283 280 1.01
Total quantum operatorwise - - - 48.75 26.25 11.25 - - 86 171,588 51,875 34,230 1.52
# of circles won - - - 10 11 5 - - 18
No Auction
No Auction
India Telecom
12 KOTAK INSTITUTIONAL EQUITIES RESEARCH
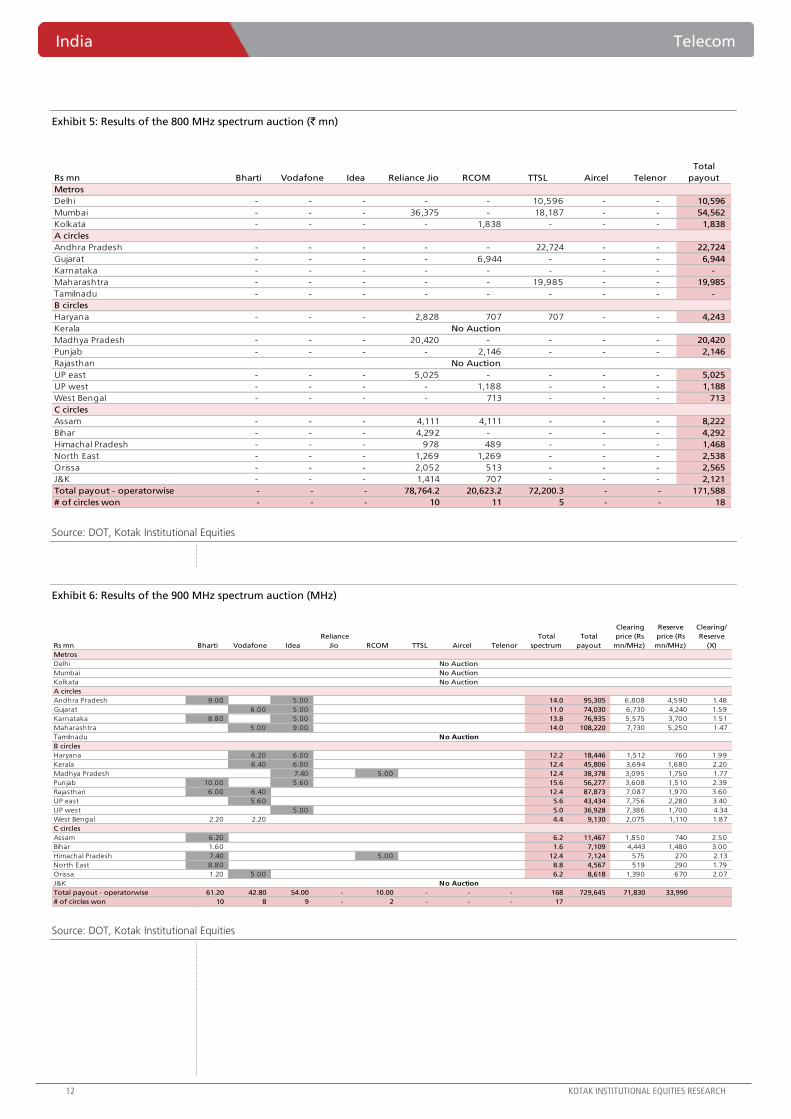
Exhibit 5: Results of the 800 MHz spectrum auction (` mn)
Source: DOT, Kotak Institutional Equities
Exhibit 6: Results of the 900 MHz spectrum auction (MHz)
Source: DOT, Kotak Institutional Equities
Rs mn Bharti Vodafone Idea Reliance Jio RCOM TTSL Aircel Telenor
Total
payout
Metros
Delhi - - - - - 10,596 - - 10,596
Mumbai - - - 36,375 - 18,187 - - 54,562
Kolkata - - - - 1,838 - - - 1,838
A circles
Andhra Pradesh - - - - - 22,724 - - 22,724
Gujarat - - - - 6,944 - - - 6,944
Karnataka - - - - - - - - -
Maharashtra - - - - - 19,985 - - 19,985
Tamilnadu - - - - - - - - -
B circles
Haryana - - - 2,828 707 707 - - 4,243
Kerala
Madhya Pradesh - - - 20,420 - - - - 20,420
Punjab - - - - 2,146 - - - 2,146
Rajasthan
UP east - - - 5,025 - - - - 5,025
UP west - - - - 1,188 - - - 1,188
West Bengal - - - - 713 - - - 713
C circles
Assam - - - 4,111 4,111 - - - 8,222
Bihar - - - 4,292 - - - - 4,292
Himachal Pradesh - - - 978 489 - - - 1,468
North East - - - 1,269 1,269 - - - 2,538
Orissa - - - 2,052 513 - - - 2,565
J&K - - - 1,414 707 - - - 2,121
Total payout - operatorwise - - - 78,764.2 20,623.2 72,200.3 - - 171,588
# of circles won - - - 10 11 5 - - 18
No Auction
No Auction
Rs mn Bharti Vodafone Idea
Reliance
Jio RCOM TTSL Aircel Telenor
Total
spectrum
Total
payout
Clearing
price (Rs
mn/MHz)
Reserve
price (Rs
mn/MHz)
Clearing/
Reserve
(X)
Metros
Delhi
Mumbai
Kolkata
A circles
Andhra Pradesh 9.00 5.00 14.0 95,305 6,808 4,590 1.48
Gujarat 6.00 5.00 11.0 74,030 6,730 4,240 1.59
Karnataka 8.80 5.00 13.8 76,935 5,575 3,700 1.51
Maharashtra 5.00 9.00 14.0 108,220 7,730 5,250 1.47
Tamilnadu
B circles
Haryana 6.20 6.00 12.2 18,446 1,512 760 1.99
Kerala 6.40 6.00 12.4 45,806 3,694 1,680 2.20
Madhya Pradesh 7.40 5.00 12.4 38,378 3,095 1,750 1.77
Punjab 10.00 5.60 15.6 56,277 3,608 1,510 2.39
Rajasthan 6.00 6.40 12.4 87,873 7,087 1,970 3.60
UP east 5.60 5.6 43,434 7,756 2,280 3.40
UP west 5.00 5.0 36,928 7,386 1,700 4.34
West Bengal 2.20 2.20 4.4 9,130 2,075 1,110 1.87
C circles
Assam 6.20 6.2 11,467 1,850 740 2.50
Bihar 1.60 1.6 7,109 4,443 1,480 3.00
Himachal Pradesh 7.40 5.00 12.4 7,124 575 270 2.13
North East 8.80 8.8 4,567 519 290 1.79
Orissa 1.20 5.00 6.2 8,618 1,390 670 2.07
J&K
Total payout - operatorwise 61.20 42.80 54.00 - 10.00 - - - 168 729,645 71,830 33,990
# of circles won 10 8 9 - 2 - - - 17
No Auction
No Auction
No Auction
No Auction
No Auction

Telecom India
KOTAK INSTITUTIONAL EQUITIES RESEARCH 13
Exhibit 7: Results of the 900 MHz spectrum auction (` mn)
Source: DOT, Kotak Institutional Equities
Exhibit 8: Results of the 1800 MHz spectrum auction (MHz)
Source: DOT, Kotak Institutional Equities
Rs mn Bharti Vodafone Idea
Reliance
Jio RCOM TTSL Aircel Telenor
Total
payout
Metros
Delhi
Mumbai
Kolkata
A circles
Andhra Pradesh 61,268 - 34,038 - - - - - 95,305
Gujarat - 40,380 33,650 - - - - - 74,030
Karnataka 49,060 - 27,875 - - - - - 76,935
Maharashtra - 38,650 69,570 - - - - - 108,220
Tamilnadu
B circles
Haryana - 9,374 9,072 - - - - - 18,446
Kerala - 23,642 22,164 - - - - - 45,806
Madhya Pradesh - - 22,903 - 15,475 - - - 38,378
Punjab 36,075 - 20,202 - - - - - 56,277
Rajasthan 42,519 45,354 - - - - - - 87,873
UP east - 43,434 - - - - - - 43,434
UP west - - 36,928 - - - - - 36,928
West Bengal 4,565 4,565 - - - - - - 9,130
C circles
Assam 11,467 - - - - - - - 11,467
Bihar 7,109 - - - - - - - 7,109
Himachal Pradesh 4,251 - - - 2,873 - - - 7,124
North East 4,567 - - - - - - - 4,567
Orissa 1,668 6,950 - - - - - - 8,618
J&K
Total payout - operatorwise 222,549 212,348 276,401 - 18,348 - - - 729,645
# of circles won 10 8 9 - 2 - - - 17
No Auction
No Auction
No Auction
No Auction
No Auction
Rs mn Bharti Vodafone Idea
Reliance
Jio RCOM TTSL Aircel Telenor
Total
spectrum
Total
payout
Clearing
price (Rs
mn/MHz)
Reserve
price (Rs
mn/MHz)
Clearing/
Reserve
(X)
Metros
Delhi
Mumbai
Kolkata 2.00 5.00 7.0 10,437 1,491 730 2.04
A circles
Andhra Pradesh 1.20 2.60 3.8 9,226 2,428 1,690 1.44
Gujarat 3.40 3.4 8,092 2,380 2,380 1.00
Karnataka 1.00 0.60 1.6 2,960 1,850 1,850 1.00
Maharashtra
Tamilnadu 6.40 0.60 10 17.0 38,250 2,250 2,250 1.00
B circles
Haryana 3.40 4.00 0.60 8.0 3,728 466 320 1.46
Kerala 1.00 1.0 835 835 750 1.11
Madhya Pradesh
Punjab 1.00 0.60 1.6 1,136 710 710 1.00
Rajasthan 10.00 10.0 7,275 728 600 1.21
UP east 1.20 3.00 4.2 4,492 1,070 970 1.10
UP west 2.20 2.2 2,111 960 950 1.01
West Bengal
C circles
Assam
Bihar - - 620 620 1.00
Himachal Pradesh 4.80 5.40 10.2 1,622 159 90 1.77
North East 1.60 1.00 5.00 7.6 836 110 110 1.00
Orissa 6.20 5.00 5.00 16.2 5,362 331 230 1.44
J&K
Total payout - operatorwise 15.40 5.60 20.40 28.00 11.80 2.60 10 - 93.8 96,362 16,386 14,250
# of circles won 6 3 6 6 5 1 1 - 14.0
No Auction
No Auction
No Auction
No Auction
No Auction
No Auction
No Auction

India Telecom
14 KOTAK INSTITUTIONAL EQUITIES RESEARCH
Exhibit 9: Results of the 1800 MHz spectrum auction (` mn)
Source: DOT, Kotak Institutional Equities
Exhibit 10: Results of the 2100 MHz spectrum auction (MHz)
Source: DOT, Kotak Institutional Equities
Rs mn Bharti Vodafone Idea
Reliance
Jio RCOM TTSL Aircel Telenor
Total # of
blocks
Metros
Delhi
Mumbai
Kolkata 2,982 - - 7,455 - - - - 10,437
A circles
Andhra Pradesh 2,914 - - - - 6,313 - - 9,226
Gujarat - 8,092 - - - - - - 8,092
Karnataka - - 1,850 - 1,110 - - - 2,960
Maharashtra
Tamilnadu - - 14,400 1,350 - - 22,500 - 38,250
B circles
Haryana 1,584 - - 1,864 280 - - - 3,728
Kerala - 835 - - - - - - 835
Madhya Pradesh
Punjab 710 - - - 426 - - - 1,136
Rajasthan - - - 7,275 - - - - 7,275
UP east - 1,283 - 3,209 - - - - 4,492
UP west - - 2,111 - - - - - 2,111
West Bengal
C circles
Assam
Bihar - - - - - - - - -
Himachal Pradesh - - 763 859 - - - - 1,622
North East 176 - 110 - 550 - - - 836
Orissa 2,052 - 1,655 - 1,655 - - - 5,362
J&K
Total payout - operatorwise 10,418.20 10,209.90 20,889.10 22,011.10 4,020.60 6,312.80 22,500 - 96,362
# of circles won 6 3 6 6 5 1 1 - 14
No Auction
No Auction
No Auction
No Auction
No Auction
No Auction
No Auction
Rs mn Bharti Vodafone Idea
Reliance
Jio RCOM TTSL Aircel Telenor
Total
spectrum
Total
payout
Clearing
price (Rs
mn/MHz)
Reserve
price (Rs
mn/MHz)
Clearing/
Reserve
(X)
Metros
Delhi - - 6,630 6,630 1.00
Mumbai - - 6,490 6,490 1.00
Kolkata 5.0 5.0 5,780 1,156 1,090 1.06
A circles
Andhra Pradesh - - 2,750 2,750 1.00
Gujarat 5.0 5.0 12,900 2,580 2,580 1.00
Karnataka 5.0 5.0 16,424 3,285 3,220 1.02
Maharashtra 5.0 5.0 15,050 3,010 3,010 1.00
Tamilnadu 5.0 5.0 17,200 3,440 3,440 1.00
B circles
Haryana 5.0 5.0 2,300 460 460 1.00
Kerala 5.0 5.0 5,886 1,177 1,110 1.06
Madhya Pradesh 5.0 5.0 4,568 914 870 1.05
Punjab
Rajasthan 5.0 5.0 6,991 1,398 870 1.61
UP east 5.0 5.0 4,515 903 860 1.05
UP west 5.0 5.0 5,254 1,051 1,030 1.02
West Bengal
C circles
Assam 5.0 5.0 1,932 386 290 1.33
Bihar
Himachal Pradesh
North East 5.0 5.0 554 111 80 1.38
Orissa 5.0 5.0 1,803 361 330 1.09
J&K
Total payout - operatorwise 35.00 30.00 5.00 - - - - - 70.0 101,154 36,101 35,110
# of circles won 7 6 1 - - - - - 14
No Auction
No Auction
No Auction
No Auction
No Auction

Telecom India
KOTAK INSTITUTIONAL EQUITIES RESEARCH 15
Exhibit 11: Results of the 2100 MHz spectrum auction (` mn)
Source: DOT, Kotak Institutional Equities
Exhibit 12: Bharti - spectrum holdings before and after the auctions
Source: DOT, Kotak Institutional Equities
Rs mn Bharti Vodafone Idea
Reliance
Jio RCOM TTSL Aircel Telenor
Total
payout
Metros
Delhi - - - - - - - - -
Mumbai - - - - - - - - -
Kolkata - - 5,780 - - - - - 5,780
A circles
Andhra Pradesh - - - - - - - - -
Gujarat 12,900 - - - - - - - 12,900
Karnataka - 16,424 - - - - - - 16,424
Maharashtra 15,050 - - - - - - - 15,050
Tamilnadu 17,200 - - - - - - - 17,200
B circles
Haryana 2,300 - - - - - - - 2,300
Kerala - 5,886 - - - - - - 5,886
Madhya Pradesh 4,568 - - - - - - - 4,568
Punjab
Rajasthan - 6,991 - - - - - - 6,991
UP east 4,515 - - - - - - - 4,515
UP west - 5,254 - - - - - - 5,254
West Bengal
C circles
Assam - 1,932 - - - - - - 1,932
Bihar
Himachal Pradesh
North East - 554 - - - - - - 554
Orissa 1,803 - - - - - - - 1,803
J&K
Total payout - operatorwise 58,335 37,039 5,780 - - - - - 101,154
# of circles won 7 6 1 - - - - - 14
No Auction
No Auction
No Auction
No Auction
No Auction
900 MHz
1800
administered
1800
auctioned 2100 MHz 2300 MHz
900 MHz
administered
900 MHz
auctioned
1800
administered 1800 auctioned 2100 MHz 2300 MHz
Renewed circles
Delhi 6.0 — 7.0 5.0 20.0 — 6.0 — 7.0 5.0 20.0
Kolkata 7.0 — 5.0 — 20.0 — 7.0 — 7.0 — 20.0
Renewal circles
Andhra Pradesh 7.8 2.2 8.8 5.0 — — 9.0 — 10.0 5.0 —
Himachal Pradesh 6.2 — 10.2 5.0 — — 7.4 — 10.2 5.0 —
Karnataka 7.8 2.2 8.8 5.0 20.0 — 8.8 — 8.8 5.0 20.0
North East 4.4 1.8 7.0 5.0 — — 8.8 — 8.6 5.0 —
Punjab 7.8 — 8.2 — 20.0 — 10.0 — 9.2 — 20.0
Rajasthan 6.2 2.0 8.2 5.0 — — 6.0 — 8.2 5.0 —
Non-renewal circles
Assam 1.8 4.4 1.3 5.0 — 1.8 6.2 4.4 1.3 5.0 —
Bihar 6.2 3.0 — 5.0 — 6.2 1.6 3.0 — 5.0 —
Chennai/ TN — 9.2 5.0 5.0 — — — 9.2 5.0 10.0 —
Gujarat — 6.2 — — — — — 6.2 — 5.0 —
Haryana — 6.2 — — 20.0 — — 6.2 3.4 5.0 20.0
J&K 6.2 — 2.6 5.0 — 6.2 — — 2.6 5.0 —
Kerala — 6.2 5.0 — 20.0 — — 6.2 5.0 — 20.0
Madhya Pradesh — 8.0 5.8 — — — — 8.0 5.8 5.0 —
Maharashtra — 8.2 — — 20.0 — — 8.2 — 5.0 20.0
Mumbai 5.0 9.2 6.0 5.0 20.0 5.0 — 9.2 6.0 5.0 20.0
Orissa 6.2 1.8 5.0 — — 6.2 1.2 1.8 11.2 5.0 —
UP (East) 6.2 1.0 — — — 6.2 — 1.0 — 5.0 —
UP (West) — 6.2 — 5.0 — — — 6.2 — 5.0 —
West Bengal 4.4 1.8 4.4 5.0 — 4.4 2.2 1.8 4.4 5.0 —
Pre-auction Post-auction
India Telecom
16 KOTAK INSTITUTIONAL EQUITIES RESEARCH
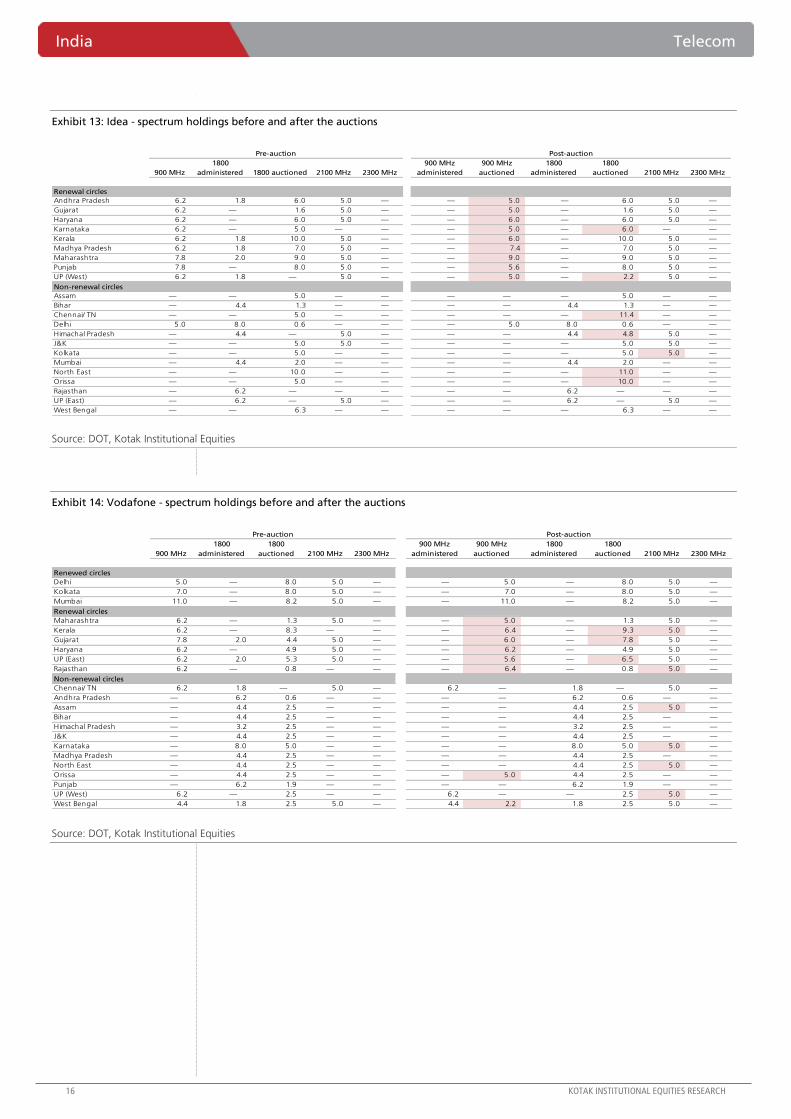
Exhibit 13: Idea - spectrum holdings before and after the auctions
Source: DOT, Kotak Institutional Equities
Exhibit 14: Vodafone - spectrum holdings before and after the auctions
Source: DOT, Kotak Institutional Equities
900 MHz
1800
administered 1800 auctioned 2100 MHz 2300 MHz
900 MHz
administered
900 MHz
auctioned
1800
administered
1800
auctioned 2100 MHz 2300 MHz
Renewal circles
Andhra Pradesh 6.2 1.8 6.0 5.0 — — 5.0 — 6.0 5.0 —
Gujarat 6.2 — 1.6 5.0 — — 5.0 — 1.6 5.0 —
Haryana 6.2 — 6.0 5.0 — — 6.0 — 6.0 5.0 —
Karnataka 6.2 — 5.0 — — — 5.0 — 6.0 — —
Kerala 6.2 1.8 10.0 5.0 — — 6.0 — 10.0 5.0 —
Madhya Pradesh 6.2 1.8 7.0 5.0 — — 7.4 — 7.0 5.0 —
Maharashtra 7.8 2.0 9.0 5.0 — — 9.0 — 9.0 5.0 —
Punjab 7.8 — 8.0 5.0 — — 5.6 — 8.0 5.0 —
UP (West) 6.2 1.8 — 5.0 — — 5.0 — 2.2 5.0 —
Non-renewal circles
Assam — — 5.0 — — — — — 5.0 — —
Bihar — 4.4 1.3 — — — — 4.4 1.3 — —
Chennai/ TN — — 5.0 — — — — — 11.4 — —
Delhi 5.0 8.0 0.6 — — — 5.0 8.0 0.6 — —
Himachal Pradesh — 4.4 — 5.0 — — — 4.4 4.8 5.0 —
J&K — — 5.0 5.0 — — — — 5.0 5.0 —
Kolkata — — 5.0 — — — — — 5.0 5.0 —
Mumbai — 4.4 2.0 — — — — 4.4 2.0 — —
North East — — 10.0 — — — — — 11.0 — —
Orissa — — 5.0 — — — — — 10.0 — —
Rajasthan — 6.2 — — — — — 6.2 — — —
UP (East) — 6.2 — 5.0 — — — 6.2 — 5.0 —
West Bengal — — 6.3 — — — — — 6.3 — —
Pre-auction Post-auction
900 MHz
1800
administered
1800
auctioned 2100 MHz 2300 MHz
900 MHz
administered
900 MHz
auctioned
1800
administered
1800
auctioned 2100 MHz 2300 MHz
Renewed circles
Delhi 5.0 — 8.0 5.0 — — 5.0 — 8.0 5.0 —
Kolkata 7.0 — 8.0 5.0 — — 7.0 — 8.0 5.0 —
Mumbai 11.0 — 8.2 5.0 — — 11.0 — 8.2 5.0 —
Renewal circles
Maharashtra 6.2 — 1.3 5.0 — — 5.0 — 1.3 5.0 —
Kerala 6.2 — 8.3 — — — 6.4 — 9.3 5.0 —
Gujarat 7.8 2.0 4.4 5.0 — — 6.0 — 7.8 5.0 —
Haryana 6.2 — 4.9 5.0 — — 6.2 — 4.9 5.0 —
UP (East) 6.2 2.0 5.3 5.0 — — 5.6 — 6.5 5.0 —
Rajasthan 6.2 — 0.8 — — — 6.4 — 0.8 5.0 —
Non-renewal circles
Chennai/ TN 6.2 1.8 — 5.0 — 6.2 — 1.8 — 5.0 —
Andhra Pradesh — 6.2 0.6 — — — — 6.2 0.6 — —
Assam — 4.4 2.5 — — — — 4.4 2.5 5.0 —
Bihar — 4.4 2.5 — — — — 4.4 2.5 — —
Himachal Pradesh — 3.2 2.5 — — — — 3.2 2.5 — —
J&K — 4.4 2.5 — — — — 4.4 2.5 — —
Karnataka — 8.0 5.0 — — — — 8.0 5.0 5.0 —
Madhya Pradesh — 4.4 2.5 — — — — 4.4 2.5 — —
North East — 4.4 2.5 — — — — 4.4 2.5 5.0 —
Orissa — 4.4 2.5 — — — 5.0 4.4 2.5 — —
Punjab — 6.2 1.9 — — — — 6.2 1.9 — —
UP (West) 6.2 — 2.5 — — 6.2 — — 2.5 5.0 —
West Bengal 4.4 1.8 2.5 5.0 — 4.4 2.2 1.8 2.5 5.0 —
Pre-auction Post-auction
Telecom India
KOTAK INSTITUTIONAL EQUITIES RESEARCH 17
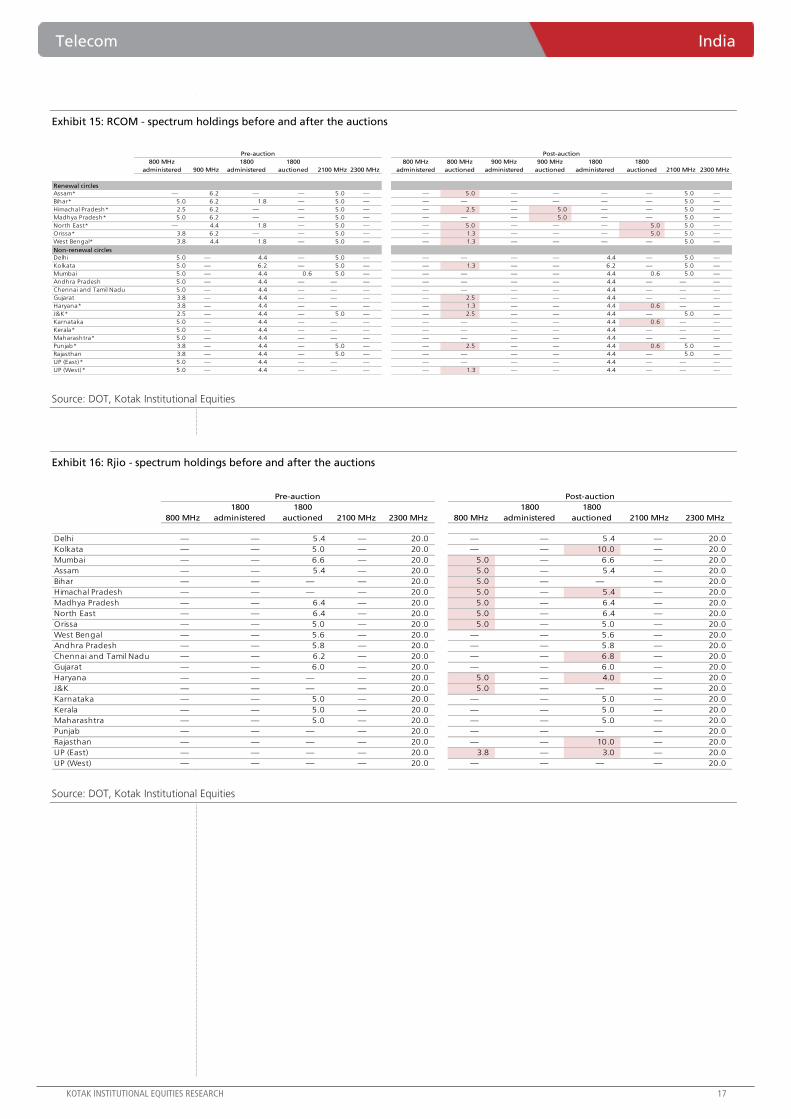
Exhibit 15: RCOM - spectrum holdings before and after the auctions
Source: DOT, Kotak Institutional Equities
Exhibit 16: Rjio - spectrum holdings before and after the auctions
Source: DOT, Kotak Institutional Equities
800 MHz
administered 900 MHz
1800
administered
1800
auctioned 2100 MHz 2300 MHz
800 MHz
administered
800 MHz
auctioned
900 MHz
administered
900 MHz
auctioned
1800
administered
1800
auctioned 2100 MHz 2300 MHz
Renewal circles
Assam* — 6.2 — — 5.0 — — 5.0 — — — — 5.0 —
Bihar* 5.0 6.2 1.8 — 5.0 — — — — — — — 5.0 —
Himachal Pradesh* 2.5 6.2 — — 5.0 — — 2.5 — 5.0 — — 5.0 —
Madhya Pradesh* 5.0 6.2 — — 5.0 — — — — 5.0 — — 5.0 —
North East* — 4.4 1.8 — 5.0 — — 5.0 — — — 5.0 5.0 —
Orissa* 3.8 6.2 — — 5.0 — — 1.3 — — — 5.0 5.0 —
West Bengal* 3.8 4.4 1.8 — 5.0 — — 1.3 — — — — 5.0 —
Non-renewal circles
Delhi 5.0 — 4.4 — 5.0 — — — — — 4.4 — 5.0 —
Kolkata 5.0 — 6.2 — 5.0 — — 1.3 — — 6.2 — 5.0 —
Mumbai 5.0 — 4.4 0.6 5.0 — — — — — 4.4 0.6 5.0 —
Andhra Pradesh 5.0 — 4.4 — — — — — — — 4.4 — — —
Chennai and Tamil Nadu 5.0 — 4.4 — — — — — — — 4.4 — — —
Gujarat 3.8 — 4.4 — — — — 2.5 — — 4.4 — — —
Haryana* 3.8 — 4.4 — — — — 1.3 — — 4.4 0.6 — —
J&K* 2.5 — 4.4 — 5.0 — — 2.5 — — 4.4 — 5.0 —
Karnataka 5.0 — 4.4 — — — — — — — 4.4 0.6 — —
Kerala* 5.0 — 4.4 — — — — — — — 4.4 — — —
Maharashtra* 5.0 — 4.4 — — — — — — — 4.4 — — —
Punjab* 3.8 — 4.4 — 5.0 — — 2.5 — — 4.4 0.6 5.0 —
Rajasthan 3.8 — 4.4 — 5.0 — — — — — 4.4 — 5.0 —
UP (East)* 5.0 — 4.4 — — — — — — — 4.4 — — —
UP (West)* 5.0 — 4.4 — — — — 1.3 — — 4.4 — — —
Post-auctionPre-auction
800 MHz
1800
administered
1800
auctioned 2100 MHz 2300 MHz 800 MHz
1800
administered
1800
auctioned 2100 MHz 2300 MHz
Delhi — — 5.4 — 20.0 — — 5.4 — 20.0
Kolkata — — 5.0 — 20.0 — — 10.0 — 20.0
Mumbai — — 6.6 — 20.0 5.0 — 6.6 — 20.0
Assam — — 5.4 — 20.0 5.0 — 5.4 — 20.0
Bihar — — — — 20.0 5.0 — — — 20.0
Himachal Pradesh — — — — 20.0 5.0 — 5.4 — 20.0
Madhya Pradesh — — 6.4 — 20.0 5.0 — 6.4 — 20.0
North East — — 6.4 — 20.0 5.0 — 6.4 — 20.0
Orissa — — 5.0 — 20.0 5.0 — 5.0 — 20.0
West Bengal — — 5.6 — 20.0 — — 5.6 — 20.0
Andhra Pradesh — — 5.8 — 20.0 — — 5.8 — 20.0
Chennai and Tamil Nadu — — 6.2 — 20.0 — — 6.8 — 20.0
Gujarat — — 6.0 — 20.0 — — 6.0 — 20.0
Haryana — — — — 20.0 5.0 — 4.0 — 20.0
J&K — — — — 20.0 5.0 — — — 20.0
Karnataka — — 5.0 — 20.0 — — 5.0 — 20.0
Kerala — — 5.0 — 20.0 — — 5.0 — 20.0
Maharashtra — — 5.0 — 20.0 — — 5.0 — 20.0
Punjab — — — — 20.0 — — — — 20.0
Rajasthan — — — — 20.0 — — 10.0 — 20.0
UP (East) — — — — 20.0 3.8 — 3.0 — 20.0
UP (West) — — — — 20.0 — — — — 20.0
Pre-auction Post-auction
India Telecom
18 KOTAK INSTITUTIONAL EQUITIES RESEARCH
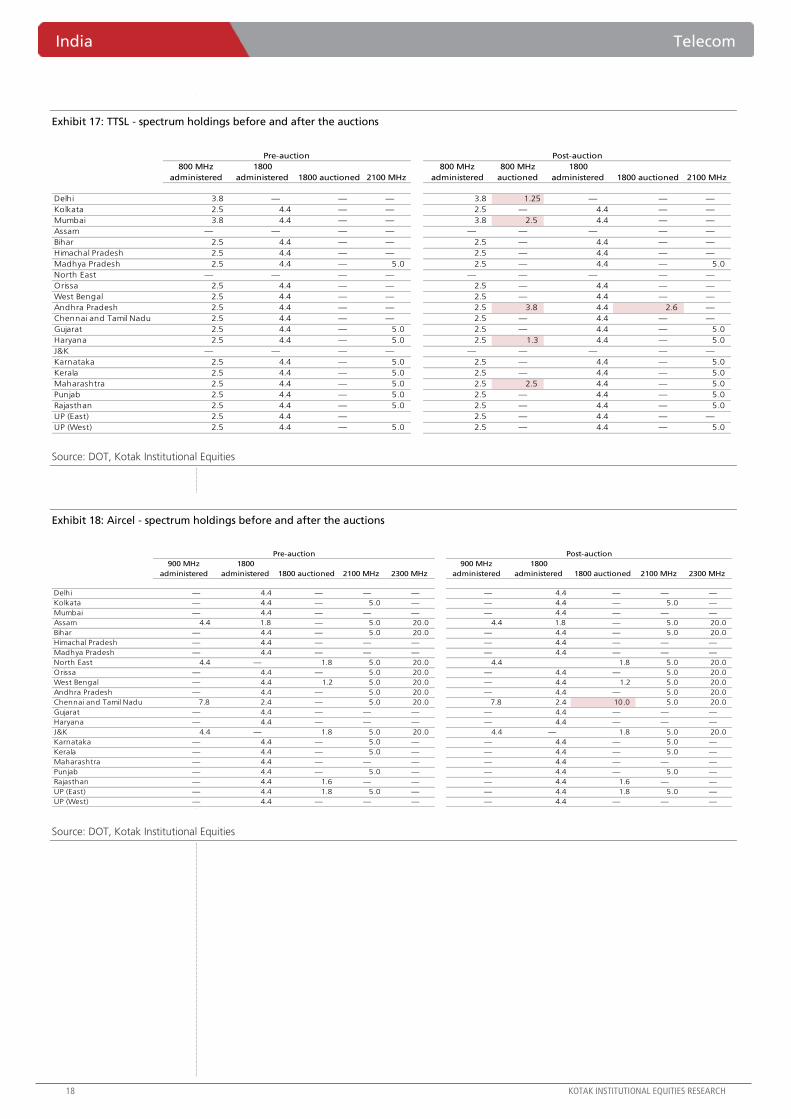
Exhibit 17: TTSL - spectrum holdings before and after the auctions
Source: DOT, Kotak Institutional Equities
Exhibit 18: Aircel - spectrum holdings before and after the auctions
Source: DOT, Kotak Institutional Equities
800 MHz
administered
1800
administered 1800 auctioned 2100 MHz
800 MHz
administered
800 MHz
auctioned
1800
administered 1800 auctioned 2100 MHz
Delhi 3.8 — — — 3.8 1.25 — — —
Kolkata 2.5 4.4 — — 2.5 — 4.4 — —
Mumbai 3.8 4.4 — — 3.8 2.5 4.4 — —
Assam — — — — — — — — —
Bihar 2.5 4.4 — — 2.5 — 4.4 — —
Himachal Pradesh 2.5 4.4 — — 2.5 — 4.4 — —
Madhya Pradesh 2.5 4.4 — 5.0 2.5 — 4.4 — 5.0
North East — — — — — — — — —
Orissa 2.5 4.4 — — 2.5 — 4.4 — —
West Bengal 2.5 4.4 — — 2.5 — 4.4 — —
Andhra Pradesh 2.5 4.4 — — 2.5 3.8 4.4 2.6 —
Chennai and Tamil Nadu 2.5 4.4 — — 2.5 — 4.4 — —
Gujarat 2.5 4.4 — 5.0 2.5 — 4.4 — 5.0
Haryana 2.5 4.4 — 5.0 2.5 1.3 4.4 — 5.0
J&K — — — — — — — — —
Karnataka 2.5 4.4 — 5.0 2.5 — 4.4 — 5.0
Kerala 2.5 4.4 — 5.0 2.5 — 4.4 — 5.0
Maharashtra 2.5 4.4 — 5.0 2.5 2.5 4.4 — 5.0
Punjab 2.5 4.4 — 5.0 2.5 — 4.4 — 5.0
Rajasthan 2.5 4.4 — 5.0 2.5 — 4.4 — 5.0
UP (East) 2.5 4.4 — 2.5 — 4.4 — —
UP (West) 2.5 4.4 — 5.0 2.5 — 4.4 — 5.0
Pre-auction Post-auction
900 MHz
administered
1800
administered 1800 auctioned 2100 MHz 2300 MHz
900 MHz
administered
1800
administered 1800 auctioned 2100 MHz 2300 MHz
Delhi — 4.4 — — — — 4.4 — — —
Kolkata — 4.4 — 5.0 — — 4.4 — 5.0 —
Mumbai — 4.4 — — — — 4.4 — — —
Assam 4.4 1.8 — 5.0 20.0 4.4 1.8 — 5.0 20.0
Bihar — 4.4 — 5.0 20.0 — 4.4 — 5.0 20.0
Himachal Pradesh — 4.4 — — — — 4.4 — — —
Madhya Pradesh — 4.4 — — — — 4.4 — — —
North East 4.4 — 1.8 5.0 20.0 4.4 1.8 5.0 20.0
Orissa — 4.4 — 5.0 20.0 — 4.4 — 5.0 20.0
West Bengal — 4.4 1.2 5.0 20.0 — 4.4 1.2 5.0 20.0
Andhra Pradesh — 4.4 — 5.0 20.0 — 4.4 — 5.0 20.0
Chennai and Tamil Nadu 7.8 2.4 — 5.0 20.0 7.8 2.4 10.0 5.0 20.0
Gujarat — 4.4 — — — — 4.4 — — —
Haryana — 4.4 — — — — 4.4 — — —
J&K 4.4 — 1.8 5.0 20.0 4.4 — 1.8 5.0 20.0
Karnataka — 4.4 — 5.0 — — 4.4 — 5.0 —
Kerala — 4.4 — 5.0 — — 4.4 — 5.0 —
Maharashtra — 4.4 — — — — 4.4 — — —
Punjab — 4.4 — 5.0 — — 4.4 — 5.0 —
Rajasthan — 4.4 1.6 — — — 4.4 1.6 — —
UP (East) — 4.4 1.8 5.0 — — 4.4 1.8 5.0 —
UP (West) — 4.4 — — — — 4.4 — — —
Pre-auction Post-auction

For Private Circulation Only. FOR IMPORTANT INFORMATION ABOUT KOTAK SECURITIES’ RATING SYSTEM AND OTHER DISCLOSURES, REFER TO THE END OF THIS MATERIAL.
Indian room air-conditioning industry is poised for steady growth
The Indian room air-conditioning (AC) industry is poised to grow steadily given (1) increasing push
towards higher urbanization, (2) a growing middle class and increase in discretionary spending,
(3) easy availability of financing schemes, (4) climate across several Indian states is conducive to AC
demand, and (5) lower penetration of ACs than other home appliances and versus Asian peer
countries. We estimate a 13-15% volume CAGR over FY2015-20, which will lead to a per-year
sales volume of 5.5-6.3 mn in FY2020 versus 3.1 mn in FY2015; value growth will be US$2.7-3.0
bn in FY2020 versus US$1.4 bn in FY2015.
Competition – top eight players control >85% of the market share
There are around 32 players in the Indian room-AC market (Appendix 2), which may sound
worrisome from a competition standpoint; however, the top-eight players control >85% of the
market (Exhibit 5). Several new players continue to enter the market and smaller existing players
try to gain market share with little or no success. For established players, higher market share
supported by large distribution networks (>50% of the sales for Voltas and Blue Star come from
Tier 2-4 cities), strong brand names and quality products form a virtuous circle and become an
enduring advantage. In Exhibit 5, we spell out recent efforts by top-eight players to increase
market share.
Air-conditioning purchase—first-hand experience
We recently visited several local multi-brand outlets and found that (1) the multi-brand stores
typically offer around 10-15 brands (top-eight companies’ brands mostly find a place in these
stores while remaining companies’ brands are unevenly scattered across stores), (2) there can be
a sharp variance between the MRP prices, store prices and final negotiated prices (explained on
page 10 through some examples), (3) online prices are not always cheaper than physical store
ones, as we found out while purchasing an LG inverter AC, and (4) to reduce barriers for first-
time buyers, there were several easy-financing schemes offered through credit cards and NBFCs.
How Voltas gained market share in the past few years…
Voltas’ cooling products business gained market share (20-21% currently from lower double
digits in 2006) led by (1) its consumer-centric smart brand positioning and the trust factor that
comes from being a Tata brand, (2) its expanding distribution with about 9,700 touch-points
(highest reach in the category), and (3) its evolving model mix in terms of new technology,
features and price points.
We increase Voltas’ target price to `275 (from `260 earlier) on rollover to March 2017
estimates. We have a REDUCE rating given little margin of safety at the CMP; implied
expectations factors (1) full recovery of its EMP business margin in FY2016-17 (we expect the
issue to persist longer than anticipated, as has been the case so far), and (2) cooling products
business trading at full valuations (Exhibit 27). If Voltas was a pure cooling-products business,
then we could have been more confident about the estimates and would have been
comfortable with slightly higher valuation than is reasonably warranted for higher longer-term
compounding.
Infrastructure India
Indian AC industry—bring on the heat. The Indian room AC industry is poised to
grow steadily—we estimate a 13-15% volume CAGR over FY2015-20. While 32 players
vying for the market share may sound worrisome from a competition standpoint, top
eight players controlling >85% of the market gives comfort. Voltas (REDUCE) and Blue
Star (Not Rated) are well known proxy plays for the sector’s growth, but fully valued at
their CMPs (Exhibits 27-28).
CAUTIOUS
MARCH 26, 2015
UPDATE
BSE-30: 28,112

India Infrastructure
2 KOTAK INSTITUTIONAL EQUITIES RESEARCH
INDIAN ROOM AIR CONDITIONING INDUSTRY: WELL-POISED FOR GROWTH
The Indian room AC industry is well-poised to grow steadily given (1) increasing push
towards higher urbanization (Exhibits 7-8), (2) a growing middle class and increase in
discretionary spending (Exhibit 9), (3) easy availability of financing schemes (Exhibits 10-11),
(4) climate across several Indian states conducive to AC demand, (5) lower penetration of
ACs relative to other home appliances (Exhibit 12), and (6) low penetration than in Asian
peer countries (Exhibit 13).
We estimate a 12.5-15.0% volume CAGR over FY2015-20, which will lead to per-year sales
volume of 5.5-6.3 mn in FY2020 versus 3.1 mn in FY2015 (Exhibit 1). Value growth will be
US$2.7-3 bn in FY2020 versus US$1.4 bn in FY2015 (Exhibit 2).
Exhibit 1: Air-conditioning volumes are likely to grow to >5 mn in FY2020 versus 3.1 mn in FY2015 Trend in volumes sales of air conditioners, March fiscal year-ends, 2000-2020E (mn units)
0.5
3.1
5.5
-10
0
10
20
30
40
0
1
2
3
4
5
6
20
00
20
01
20
02
20
03
20
04
20
05
20
06
20
07
20
08
20
09
20
10
20
11
20
12
20
13
20
14
20
15
E
20
16
E
20
17
E
20
18
E
20
19
E
20
20
E
Sales by volume (mn units) YoY growth (%)
12.5%
CAGR
12.5%
CAGR
15%
CAGR
6.3
10%
CAGR
Source: Industry, Kotak Institutional Equities estimates
Exhibit 2: Air-conditioning sales likely to grow to US$2.7-3 bn in FY2020 versus US$1.4 bn in FY2015 Trend in sales (by value of air conditioners, March fiscal year-ends, 2000-2020E (US$ mn)
-
500
1,000
1,500
2,000
2,500
3,000
20
01
20
02
20
03
20
04
20
05
20
06
20
07
20
08
20
09
20
10
20
11
20
12
20
13
20
14
20
15
E
20
16
E
20
17
E
20
18
E
20
19
E
20
20
E
Source: Industry, Kotak Institutional Equities estimates
Infrastructure India
KOTAK INSTITUTIONAL EQUITIES RESEARCH 3
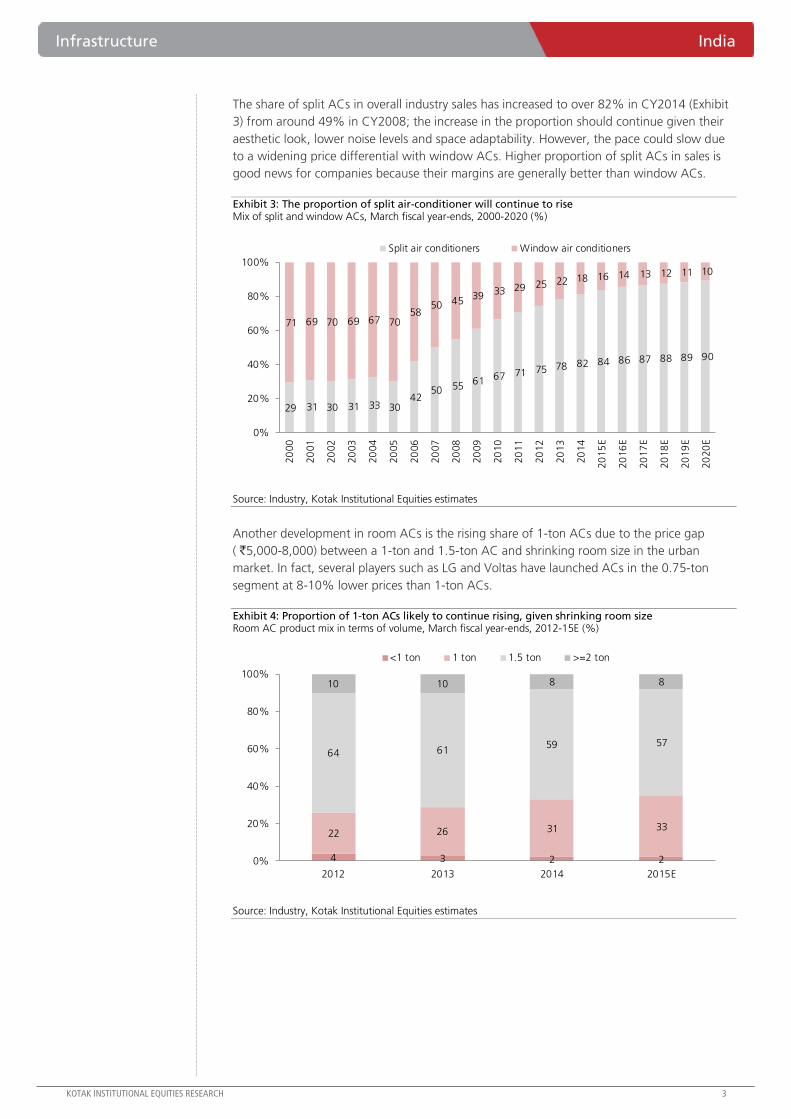
The share of split ACs in overall industry sales has increased to over 82% in CY2014 (Exhibit
3) from around 49% in CY2008; the increase in the proportion should continue given their
aesthetic look, lower noise levels and space adaptability. However, the pace could slow due
to a widening price differential with window ACs. Higher proportion of split ACs in sales is
good news for companies because their margins are generally better than window ACs.
Exhibit 3: The proportion of split air-conditioner will continue to rise Mix of split and window ACs, March fiscal year-ends, 2000-2020 (%)
29 31 30 31 33 30 42
50 55 61 67 71 75 78 82 84 86 87 88 89 90
71 69 70 69 67 70 58
50 45 39 33 29 25 22 18 16 14 13 12 11 10
0%
20%
40%
60%
80%
100%
20
00
20
01
20
02
20
03
20
04
20
05
20
06
20
07
20
08
20
09
20
10
20
11
20
12
20
13
20
14
20
15
E
20
16
E
20
17
E
20
18
E
20
19
E
20
20
E
Split air conditioners Window air conditioners
Source: Industry, Kotak Institutional Equities estimates
Another development in room ACs is the rising share of 1-ton ACs due to the price gap
( `5,000-8,000) between a 1-ton and 1.5-ton AC and shrinking room size in the urban
market. In fact, several players such as LG and Voltas have launched ACs in the 0.75-ton
segment at 8-10% lower prices than 1-ton ACs.
Exhibit 4: Proportion of 1-ton ACs likely to continue rising, given shrinking room size Room AC product mix in terms of volume, March fiscal year-ends, 2012-15E (%)
4 3 2 2
22 26 31 33
64 6159 57
10 10 8 8
0%
20%
40%
60%
80%
100%
2012 2013 2014 2015E
<1 ton 1 ton 1.5 ton >=2 ton
Source: Industry, Kotak Institutional Equities estimates

India Infrastructure
4 KOTAK INSTITUTIONAL EQUITIES RESEARCH
Competition – top eight players control >85% of the market share
There are around 32 players in the Indian room AC market (Appendix 2), which may sound
worrisome from a competitive standpoint. However, the good part is that the top eight
players control >85% of the market share (Exhibit 5).
Several new players continue to enter the market and smaller existing players try to gain
market share with little or no success so far. This is because for established players large
distribution-led scale advantages support higher market share (>50% of the sales for Voltas
and Blue Star comes from Tier 2-4 cities); besides their strong brand names and quality
products form a virtuous circle and become a competitive advantage. As we explain below
(air-conditioning purchase – first-hand experience), this probably corroborates the thesis
that ‘nothing succeeds like success’ and implies that the smaller players have to work twice
as hard to gain share from larger players.
In Exhibit 5 details the top-eight players’ recent efforts to maintain or increase market share.
Exhibit 5: Top-eight players in the market have captured >85% market share AC players’ strategies to capture higher market share
Company Remarks Market share Dealers
Voltas # Recently introduced a ‘smart’ range of all-weather ACs, which allows users to keep track
of the amount of electricity guzzled by downloading an app called Voltas Remote
# Looking to diversify into new releated consumer product categories
# Export target of at least 100,000 units p.a over the next two years (10% of the annual
sales) vs. 25,000 to 30,000 units now
20-21% >6,500
LG India # Recently launched an innovative product; an inverter AC that can keep mosquitoes away!
It also has Himalaya cool and monsoon comfort technologies, geared for Indian
conditions
# Market share target of 25% in CY2015 with a turnover of Rs25bn, a growth of 25% yoy
(vs. 10-15% in last few years)
18-19% na
Samsung # Recently launched an innovative product; an inverter air conditioner that can also keep
mosquitoes away! It has also launched Himalaya cool and monsoon comfort
technologies, designed especially for Indian conditions
12-13% na
Hitachi # US-based Johnson Controls and Japanese Hitachi have entered into a global joint
venture (JV), which is going to have a bearing on the India business
# Hitachi Groups has increased its focus in India and plans to hire additonal 30%
employees to touch 13,000
9-10% 2,100
Daikin # Looking at setting up a second manufacturing plant to double its capacity as exisinting
plant at Neemrana running at >90% utilisation (further investment of Rs3.3 bn)
# Plan to sell 0.5mn ACs in FY16 vs. 0.425mn in FY15
# Moving from “prominence to dominance” in India by launching new technology;
looking for exports to Sri Lanka, Bangladesh
8-9% 2,650
Panasonic # Katrina Kaif is the brand ambassador. New campaign launched ( ‘need for more’),
positioning the product as a LifeConditioner
8-9% na
Videocon # Recently launched ‘Wi-Fi enabled’ AC range which can be controlled using a smartphone
app. Further investment planned at Rs1 bn.
# Wants to increase market share to 15% in an years' time from present ~8% and has
assigned Rs450 mn towards advertisment and Rs600mn towards R&D spends
7-8% 6,000
Blue Star # Looking at setting up an air-conditioner manufacturing facility in South India, having a
capacity of 500,000 units p.a (further investment of Rs1.5 bn)
# Targeting a market share of 10% in FY16 as compared to the current 8.5% in terms of
value; plans to spend Rs350mn of advertisment in the forthcoming summer season
7-8% 3,500
Source: Industry, media sources, Kotak Institutional Equities estimates
We note that of the 32 players offering ACs, only 17 offer window ACs while they all offer
split ACs (Appendix 2). LG is the leader in split ACs while Voltas is the market leader (by a
wide margin) in the window AC market. Hitachi has worked its way up in window ACs
while Samsung vacated the window AC market in FY2012.

Infrastructure India
KOTAK INSTITUTIONAL EQUITIES RESEARCH 5
In Exhibit 6, we highlight key financial parameters of companies’ home appliances segment.
The operating margin and pre-tax RoCE data indicate that a price war is not likely to capture
higher market share, especially from MNC players.
Exhibit 6: MNCs’ financials indicate price-war is unlikely to capture market share Financials for home appliances segments of various AC companies, March fiscal year-ends, 2011-14
2011 2012 2013 2014
Revenue (Rs mn)
Samsung India (a) 35,246 34,753 36,806 51,958
Hitachi Home & Life Solutions (b) 7,640 7,981 9,300 10,997
Daikin Airconditioning India 6,974 11,962 16,037 18,204
Blue Star (c) 7,889 9,326 9,652 10,755
Voltas (d) 15,608 15,388 18,356 20,524
Whirlpool India (e) 27,028 26,579 27,727 28,346
Operating profit (Rs mn)
Samsung India (a) (1,103) (142) (635) (184)
Hitachi Home & Life Solutions (b) 634 300 480 533
Daikin Airconditioning India (274) 429 (126) (36)
Blue Star (c) 902 875 804 948
Voltas (d) 1,599 1,298 1,655 2,567
Whirlpool India (e) 2,191 1,734 1,617 1,477
Operating profit margin (%)
Samsung India (a) (3.1) (0.4) (1.7) (0.4)
Hitachi Home & Life Solutions (b) 8.3 3.8 5.2 4.8
Daikin Airconditioning India (3.9) 3.6 (0.8) (0.2)
Blue Star (c) 11.4 9.4 8.3 8.8
Voltas (d) 10.2 8.4 9.0 12.5
Whirlpool India (e) 8.1 6.5 5.8 5.2
Capital Employed (Rs mn)
Samsung India 10,333 8,731 7,301 7,344
Hitachi Home & Life Solutions 2,353 2,390 3,040 3,154
Daikin Airconditioning India 2,781 3,399 6,446 7,955
Blue Star 1,390 2,068 2,195 2,513
Voltas 1,908 1,903 2,371 2,747
Whirlpool India 5,026 5,299 5,911 5,799
Pre-tax ROCE (%)
Samsung India (a) (11) (2) (9) (3)
Hitachi Home & Life Solutions (b) 27 13 16 17
Daikin Airconditioning India (10) 13 (2) (0)
Blue Star (c) 65 42 37 38
Voltas (d) 84 68 70 93
Whirlpool India (e) 44 33 27 25
Notes:
(a) Numbers pertain to home appliances segment (washing machines, air-conditioners, refrigerators and
microwave ovens).
(b) Includes air-conditioners and refrigerators.
(c) Numbers pertain to cooling products segment (room air-conditioners, commercial refrigeration products &
systems).
(d) Numbers pertain to unitary cooling products segment (room air-conditioners, commercial refrigeration
products & systems).
(e) Numbers pertain to home appliances segment (washing machines, air-conditioners, refrigerators and
microwave ovens).
Source: Companies, Kotak Institutional Equities
Many macro factors support the longevity and durability of the ACs business in
India
We explain through Exhibits 7-16 how a plethora of factors supports the longevity and
durability of the ACs business in India.

India Infrastructure
6 KOTAK INSTITUTIONAL EQUITIES RESEARCH
A rising share of manufacturing GDP (to 25% over the next 10-15 years from current 16%)
will entail higher urbanization (Exhibits 7-8), as seen in China. The corollary is a growing
middle class and increase in discretionary spending (Exhibit 9), adequately supported by easy
availability of financing schemes (Exhibits 10-11). The room AC industry will clearly benefit
from these factors, which will also be supported by (1) low penetration levels in India than
other home appliances (Exhibit 12) and versus Asian peer countries (Exhibit 13) and
(2) climate across several Indian states being conductive to AC demand (Exhibit 14).
Exhibit 7: Urban population at 31% in India versus 51% in China Share of urban population in India and China, calendar year-ends 1987-2011 (%)
25
31
24
51
15
20
25
30
35
40
45
50
55
19
87
19
89
19
91
19
93
19
95
19
97
19
99
20
01
20
03
20
05
20
07
20
09
20
11
India China
Source: World Bank, Kotak Institutional Equities
Exhibit 8: Indian cities likely to house 40% population by 2030 Share of urban population in India, March fiscal- year-ends 1971-2030 (%)
10
15
20
25
30
35
40
45
300
500
700
900
1,100
1,300
1,500
1,700
1971 1981 1991 2001 2011 2030
Total population (mn) Urbanisation rate (%)
Source: Ministry of Urban Development, Kotak Institutional Equities
Exhibit 9: India will see a massive uptick in affluent households Distribution of Indian households by consumption expenditure, March fiscal year-ends, 2011-25E
2011 2012 2013 2014 2015E 2016E 2017E 2018E 2019E 2020E 2021E 2022E 2023E 2024E 2025E
Rural households (mn)
Real-rich — — — — — — — — — — — — — — —
Upper-class — — — — — — — — — — — — — — —
Prospering — — 1 2 3 4 5 6 7 8 9 10 12 13 14
Evolving 11 18 18 18 21 23 26 29 31 34 38 43 47.1 51 57
Emerging 51 70 77 84 88 91 96 100 104 107 109 110 111 112 111
Surviving 106 82 77 71 64 58 52 46 40 35 30 25 20 16 12
Total 169 170 172 174 175 177 179 181 183 184 186 188 190 192 194
Urban households (mn)
Real-rich — — — — — — — — — — — — — — 1
Upper-class — — 0 1 1 2 2 3 3 4 5 6 6 7 7
Prospering 6 9 9 9 10 12 13 14 16 17 19 20 21 24 27
Evolving 19 25 28 31 33 35 38 40 42 46 49 52 55 57 60
Emerging 38 40 42 43 43 44 45 45 46 46 46 45 44 42 41
Surviving 18 10 9 8 7 6 5 3 2 1 — — — — —
Total 81 84 88 91 95 98 102 106 110 114 118 122 126 131 135
Total households (mn)
Real-rich — — — — — — — — — — — — — — 1
Upper-class — — 0 1 1 2 2 3 3 4 5 6 6 7 7
Prospering 6 9 10 11 13 15 18 20 23 25 28 30 33 37 41
Evolving 30 43 46 48 54 59 64 68 74 79 87 95 102 109 117
Emerging 89 111 118 126 131 135 140 145 150 154 155 155 155 154 152
Surviving 124 92 86 78 71 64 57 50 43 36 30 25 20 16 12
Total 249 254 260 265 270 275 281 287 292 298 304 310 316 323 329
Source: Kotak Institutional Equities estimate
Infrastructure India
KOTAK INSTITUTIONAL EQUITIES RESEARCH 7
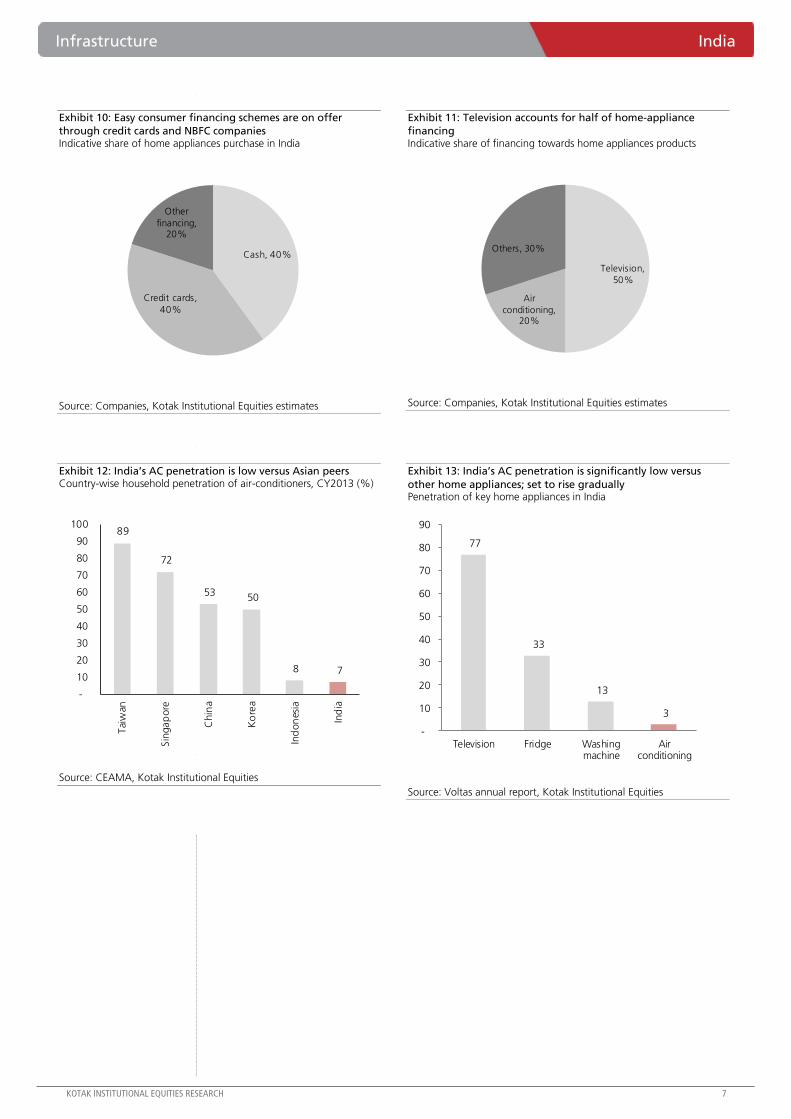
Exhibit 10: Easy consumer financing schemes are on offer
through credit cards and NBFC companies Indicative share of home appliances purchase in India
Cash, 40%
Credit cards,
40%
Other
financing, 20%
Source: Companies, Kotak Institutional Equities estimates
Exhibit 11: Television accounts for half of home-appliance
financing Indicative share of financing towards home appliances products
Television,
50%
Air
conditioning, 20%
Others, 30%
Source: Companies, Kotak Institutional Equities estimates
Exhibit 12: India’s AC penetration is low versus Asian peers Country-wise household penetration of air-conditioners, CY2013 (%)
89
72
53 50
8 7
-
10
20
30
40
50
60
70
80
90
100
Tai
wan
Sin
gap
ore
Chin
a
Ko
rea
Ind
on
esia
Ind
ia
Source: CEAMA, Kotak Institutional Equities
Exhibit 13: India’s AC penetration is significantly low versus
other home appliances; set to rise gradually Penetration of key home appliances in India
77
33
13
3
-
10
20
30
40
50
60
70
80
90
Television Fridge Washingmachine
Airconditioning
Source: Voltas annual report, Kotak Institutional Equities

India Infrastructure
8 KOTAK INSTITUTIONAL EQUITIES RESEARCH
Exhibit 14: A large part of India has temperatures that is suitable for AC installation Average annual temperatures and climatic zones in India
Source: Industry, Kotak Institutional Equities
Exhibit 15: ACs’ share among low versus other cooling products Cooling pyramid (Indian households in million)
Source: Symhony, Kotak Institutional Equities
Exhibit 16: Low penetration shows ample growth opportunity Penetration of air-conditioners versus other cooling products (%)
3
9
59
0
10
20
30
40
50
60
70
AC Air Cooler Fans
Source: Sympony, Kotak Institutional Equities
Air-coolers are appliances that can cool the room, but are not substitutes for air-conditioners
(Exhibit 17). Depending on the budget and preference, a person may opt to buy either a
cooler or an air-conditioner. Beyond initial capital cost, factors that may help in choosing the
right cooling product are recurring cost, cooling requirement, humidity level, space
constraint, impact of the appliance on the environment, etc.
AC 9.4
Air Cooler 24
No fans 82.6
Fans 164.1
Infrastructure India
KOTAK INSTITUTIONAL EQUITIES RESEARCH 9
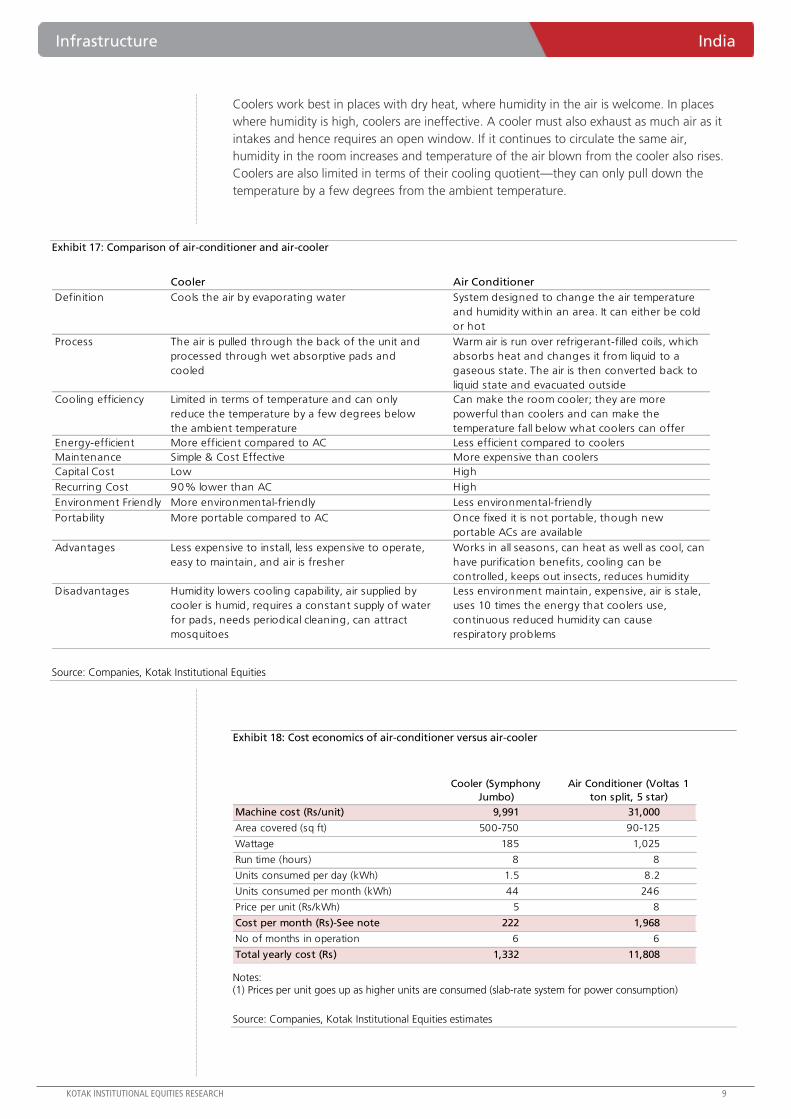
Coolers work best in places with dry heat, where humidity in the air is welcome. In places
where humidity is high, coolers are ineffective. A cooler must also exhaust as much air as it
intakes and hence requires an open window. If it continues to circulate the same air,
humidity in the room increases and temperature of the air blown from the cooler also rises.
Coolers are also limited in terms of their cooling quotient—they can only pull down the
temperature by a few degrees from the ambient temperature.
Exhibit 17: Comparison of air-conditioner and air-cooler
Cooler Air Conditioner
Definition Cools the air by evaporating water System designed to change the air temperature
and humidity within an area. It can either be cold
or hot
Process The air is pulled through the back of the unit and
processed through wet absorptive pads and
cooled
Warm air is run over refrigerant-filled coils, which
absorbs heat and changes it from liquid to a
gaseous state. The air is then converted back to
liquid state and evacuated outside
Cooling efficiency Limited in terms of temperature and can only
reduce the temperature by a few degrees below
the ambient temperature
Can make the room cooler; they are more
powerful than coolers and can make the
temperature fall below what coolers can offer
Energy-efficient More efficient compared to AC Less efficient compared to coolers
Maintenance Simple & Cost Effective More expensive than coolers
Capital Cost Low High
Recurring Cost 90% lower than AC High
Environment Friendly More environmental-friendly Less environmental-friendly
Portability More portable compared to AC Once fixed it is not portable, though new
portable ACs are available
Advantages Less expensive to install, less expensive to operate,
easy to maintain, and air is fresher
Works in all seasons, can heat as well as cool, can
have purification benefits, cooling can be
controlled, keeps out insects, reduces humidity
Disadvantages Humidity lowers cooling capability, air supplied by
cooler is humid, requires a constant supply of water
for pads, needs periodical cleaning, can attract
mosquitoes
Less environment maintain, expensive, air is stale,
uses 10 times the energy that coolers use,
continuous reduced humidity can cause
respiratory problems
Source: Companies, Kotak Institutional Equities
Exhibit 18: Cost economics of air-conditioner versus air-cooler
Cooler (Symphony
Jumbo)
Air Conditioner (Voltas 1
ton split, 5 star)
Machine cost (Rs/unit) 9,991 31,000
Area covered (sq ft) 500-750 90-125
Wattage 185 1,025
Run time (hours) 8 8
Units consumed per day (kWh) 1.5 8.2
Units consumed per month (kWh) 44 246
Price per unit (Rs/kWh) 5 8
Cost per month (Rs)-See note 222 1,968
No of months in operation 6 6
Total yearly cost (Rs) 1,332 11,808
Notes: (1) Prices per unit goes up as higher units are consumed (slab-rate system for power consumption)
Source: Companies, Kotak Institutional Equities estimates
India Infrastructure
10 KOTAK INSTITUTIONAL EQUITIES RESEARCH
Air-conditioning purchase – first-hand experience
While working on this report, the author decided it might be a good time to complete a
long-pending task and replace his old 3-star air-conditioner with the latest inverter
technology machine. Accordingly, he visited several local multi-brand outlets (on March 21,
2015) and these are his key takeaways:
Multi-brand stores typically house 10-15 brands. Top-eight AC companies’ brands (by
market share, Exhibit 5) find a place in most stores while the rest are scattered across
stores. This probably corroborates the thesis that ‘nothing succeeds like success’ and
implies that the smaller players have to work twice as hard to gain share.
Display models at the stores may not necessarily be the best products that a
company offers. Your own preparedness and a knowledgeable sales staff help you
choose the right product, which may not be displayed but is available on request.
Sharp variance between the MRP, store price and final negotiated price. For
example, the LG BSNQ186C844 that yours truly finally decided to buy had an MRP of
`59,990, store price of `51,000 and was finally offered for `43,400. We are sure that
comparable models such as Hitachi’s RAU018KVEA with a similar MRP and store price
(`51,690) and Voltas’ SAC18VDY) with an MRP of `54,490 and store price of `48,990,
would have been finally offered at much lower rates. It is interesting that the final price at
the physical store for the LG product was lower than its online prices (click here and here).
Different brands have promotion schemes for installation, which help save an
additional `1,000-1,500. For example, Carrier (promoting 100% copper machines) was
offering split AC installation for `499 versus `1,500 charged by other brands.
Consumer financing schemes. There were several consumer-financing schemes offered
through credit cards and NBFCs, with minimal document requirements (click here) and
low processing charges relative to the size of the purchase.
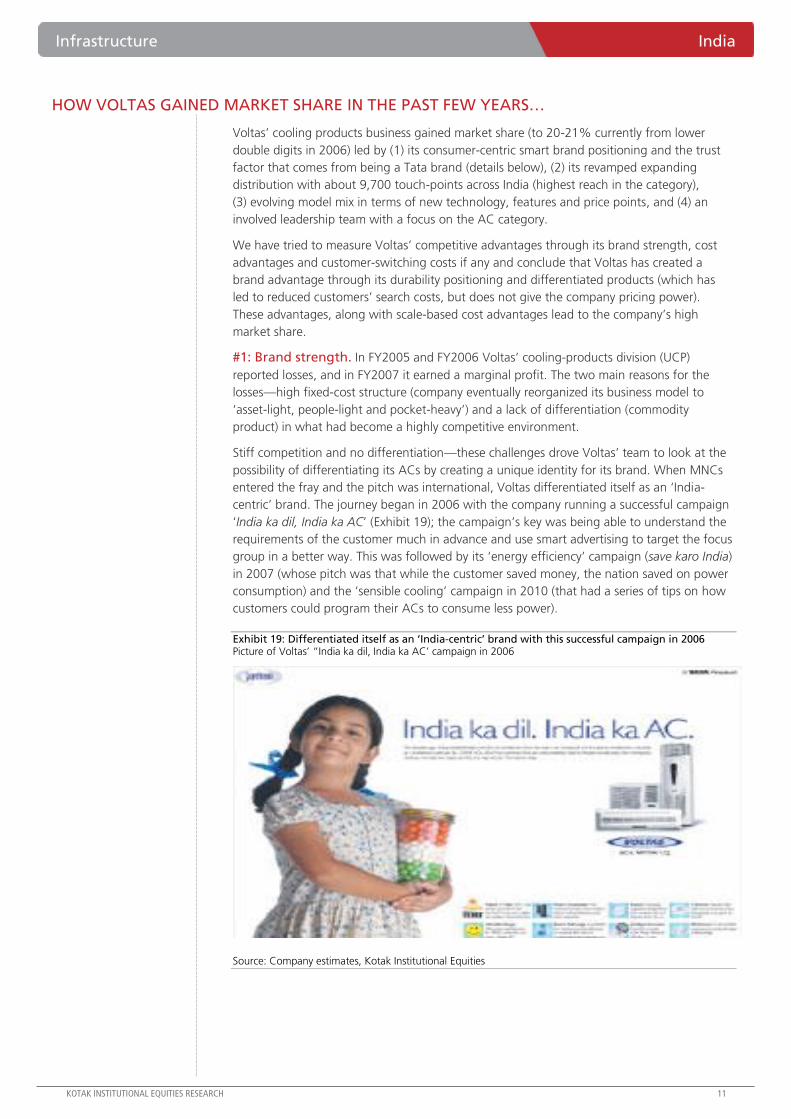
Infrastructure India
KOTAK INSTITUTIONAL EQUITIES RESEARCH 11
HOW VOLTAS GAINED MARKET SHARE IN THE PAST FEW YEARS…
Voltas’ cooling products business gained market share (to 20-21% currently from lower
double digits in 2006) led by (1) its consumer-centric smart brand positioning and the trust
factor that comes from being a Tata brand (details below), (2) its revamped expanding
distribution with about 9,700 touch-points across India (highest reach in the category),
(3) evolving model mix in terms of new technology, features and price points, and (4) an
involved leadership team with a focus on the AC category.
We have tried to measure Voltas’ competitive advantages through its brand strength, cost
advantages and customer-switching costs if any and conclude that Voltas has created a
brand advantage through its durability positioning and differentiated products (which has
led to reduced customers’ search costs, but does not give the company pricing power).
These advantages, along with scale-based cost advantages lead to the company’s high
market share.
#1: Brand strength. In FY2005 and FY2006 Voltas’ cooling-products division (UCP)
reported losses, and in FY2007 it earned a marginal profit. The two main reasons for the
losses—high fixed-cost structure (company eventually reorganized its business model to
‘asset-light, people-light and pocket-heavy’) and a lack of differentiation (commodity
product) in what had become a highly competitive environment.
Stiff competition and no differentiation—these challenges drove Voltas’ team to look at the
possibility of differentiating its ACs by creating a unique identity for its brand. When MNCs
entered the fray and the pitch was international, Voltas differentiated itself as an ‘India-
centric’ brand. The journey began in 2006 with the company running a successful campaign
‘India ka dil, India ka AC’ (Exhibit 19); the campaign’s key was being able to understand the
requirements of the customer much in advance and use smart advertising to target the focus
group in a better way. This was followed by its ‘energy efficiency’ campaign (save karo India)
in 2007 (whose pitch was that while the customer saved money, the nation saved on power
consumption) and the ‘sensible cooling’ campaign in 2010 (that had a series of tips on how
customers could program their ACs to consume less power).
Exhibit 19: Differentiated itself as an ‘India-centric’ brand with this successful campaign in 2006 Picture of Voltas’ “India ka dil, India ka AC’ campaign in 2006
Source: Company estimates, Kotak Institutional Equities
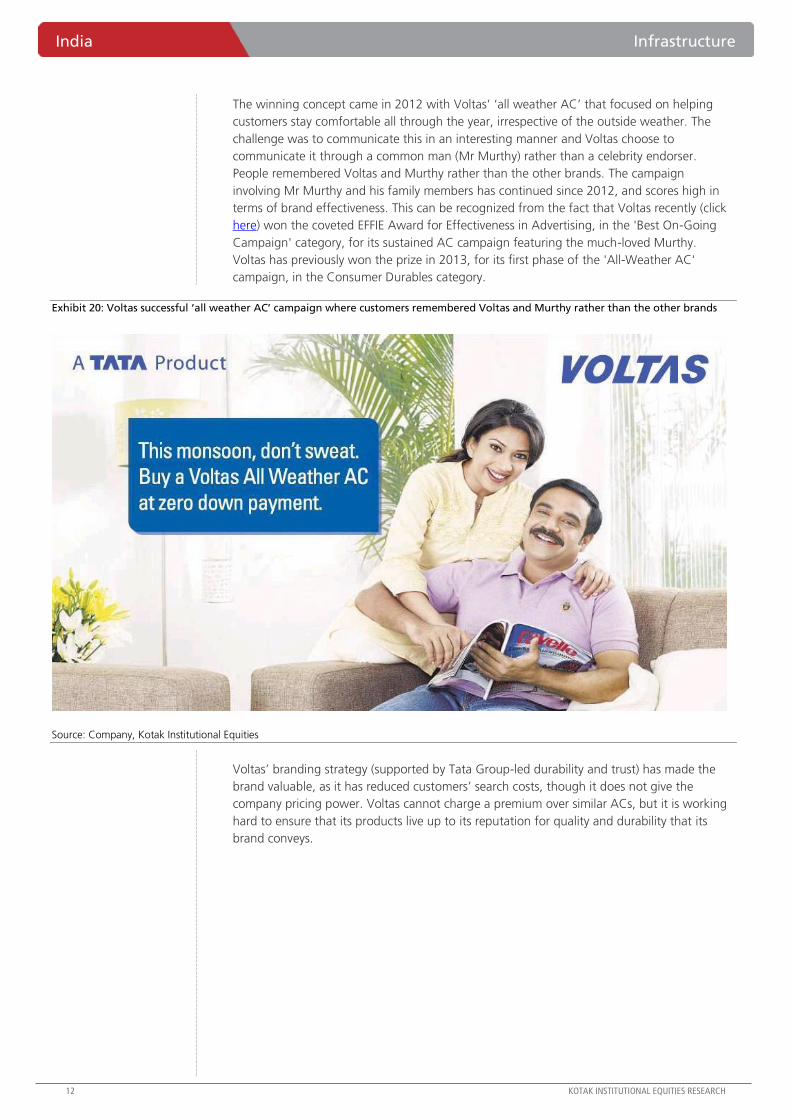
India Infrastructure
12 KOTAK INSTITUTIONAL EQUITIES RESEARCH
The winning concept came in 2012 with Voltas’ ‘all weather AC’ that focused on helping
customers stay comfortable all through the year, irrespective of the outside weather. The
challenge was to communicate this in an interesting manner and Voltas choose to
communicate it through a common man (Mr Murthy) rather than a celebrity endorser.
People remembered Voltas and Murthy rather than the other brands. The campaign
involving Mr Murthy and his family members has continued since 2012, and scores high in
terms of brand effectiveness. This can be recognized from the fact that Voltas recently (click
here) won the coveted EFFIE Award for Effectiveness in Advertising, in the 'Best On-Going
Campaign' category, for its sustained AC campaign featuring the much-loved Murthy.
Voltas has previously won the prize in 2013, for its first phase of the 'All-Weather AC'
campaign, in the Consumer Durables category.
Exhibit 20: Voltas successful ‘all weather AC’ campaign where customers remembered Voltas and Murthy rather than the other brands
Source: Company, Kotak Institutional Equities
Voltas’ branding strategy (supported by Tata Group-led durability and trust) has made the
brand valuable, as it has reduced customers’ search costs, though it does not give the
company pricing power. Voltas cannot charge a premium over similar ACs, but it is working
hard to ensure that its products live up to its reputation for quality and durability that its
brand conveys.
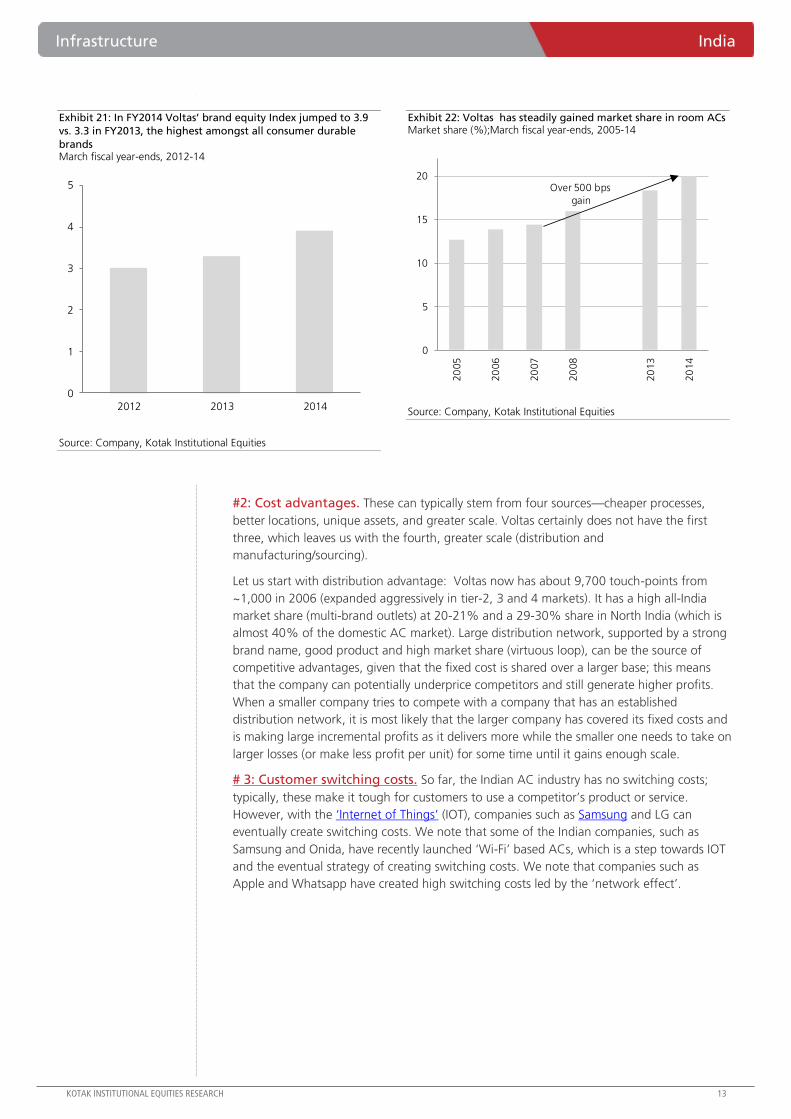
Infrastructure India
KOTAK INSTITUTIONAL EQUITIES RESEARCH 13
Exhibit 21: In FY2014 Voltas’ brand equity Index jumped to 3.9
vs. 3.3 in FY2013, the highest amongst all consumer durable
brands March fiscal year-ends, 2012-14
0
1
2
3
4
5
2012 2013 2014
Source: Company, Kotak Institutional Equities
Exhibit 22: Voltas has steadily gained market share in room ACs Market share (%);March fiscal year-ends, 2005-14
0
5
10
15
20
20
05
20
06
20
07
20
08
20
13
20
14
Over 500 bps
gain
Source: Company, Kotak Institutional Equities
#2: Cost advantages. These can typically stem from four sources—cheaper processes,
better locations, unique assets, and greater scale. Voltas certainly does not have the first
three, which leaves us with the fourth, greater scale (distribution and
manufacturing/sourcing).
Let us start with distribution advantage: Voltas now has about 9,700 touch-points from
~1,000 in 2006 (expanded aggressively in tier-2, 3 and 4 markets). It has a high all-India
market share (multi-brand outlets) at 20-21% and a 29-30% share in North India (which is
almost 40% of the domestic AC market). Large distribution network, supported by a strong
brand name, good product and high market share (virtuous loop), can be the source of
competitive advantages, given that the fixed cost is shared over a larger base; this means
that the company can potentially underprice competitors and still generate higher profits.
When a smaller company tries to compete with a company that has an established
distribution network, it is most likely that the larger company has covered its fixed costs and
is making large incremental profits as it delivers more while the smaller one needs to take on
larger losses (or make less profit per unit) for some time until it gains enough scale.
# 3: Customer switching costs. So far, the Indian AC industry has no switching costs;
typically, these make it tough for customers to use a competitor’s product or service.
However, with the ‘Internet of Things’ (IOT), companies such as Samsung and LG can
eventually create switching costs. We note that some of the Indian companies, such as
Samsung and Onida, have recently launched ‘Wi-Fi’ based ACs, which is a step towards IOT
and the eventual strategy of creating switching costs. We note that companies such as
Apple and Whatsapp have created high switching costs led by the ‘network effect’.

India Infrastructure
14 KOTAK INSTITUTIONAL EQUITIES RESEARCH
Exhibit 23: Advertising expenses steady for past few years Voltas’ advertising expenses as a percentage of UCP sales, March fiscal year-ends, 2007-14
0.0
0.5
1.0
1.5
2.0
2.5
20
07
20
08
20
09
20
10
20
11
20
12
20
13
20
14
Source: Company, Kotak Institutional Equities
Exhibit 24: Net warranty provisioning benign for past few years Voltas’ net warranty provisioning as a percentage of UCP sales, March fiscal year-ends, 2007-14
(2.0)
(1.5)
(1.0)
(0.5)
0.0
0.5
1.0
1.5
2.0
2.5
3.0
3.5
20
07
20
08
20
09
20
10
20
11
20
12
20
13
20
14
Source: Company, Kotak Institutional Equities
Exhibit 25: Commission paid has been benign for past few years Commission other than to Sole Selling Agents as a percentage of UCP sales, March fiscal year-ends, 2007-14
0
1
2
3
4
5
6
7
8
9
10
20
07
20
08
20
09
20
10
20
11
20
12
20
13
20
14
Source: Company, Kotak Institutional Equities
Exhibit 26: Cooling products EBIT margin has shown a sturdy
uptick last year, which the management expects will continue EBIT margin (%),March fiscal year-ends, 2007-14
0
2
4
6
8
10
12
14
20
07
20
08
20
09
20
10
20
11
20
12
20
13
20
14
Source: Company, Kotak Institutional Equities
Voltas: little margin of safety at CMP
We increase our target price to `275 (from `260 earlier) on rollover to March 2017
estimates. We have a REDUCE rating given little margin of safety at the CMP, which implies
(1) full recovery of its EMP business margin in FY2016-17 (we expect the issue to persist
longer than anticipated, as has been the case so far), and (2) cooling products business (ex-
other businesses value) trading at full valuations (Exhibit 27).
If Voltas was a pure cooling-products business, then we could have been more confident
about the estimates and would have been comfortable with slightly higher valuation than is
reasonably warranted for higher longer-term compounding.
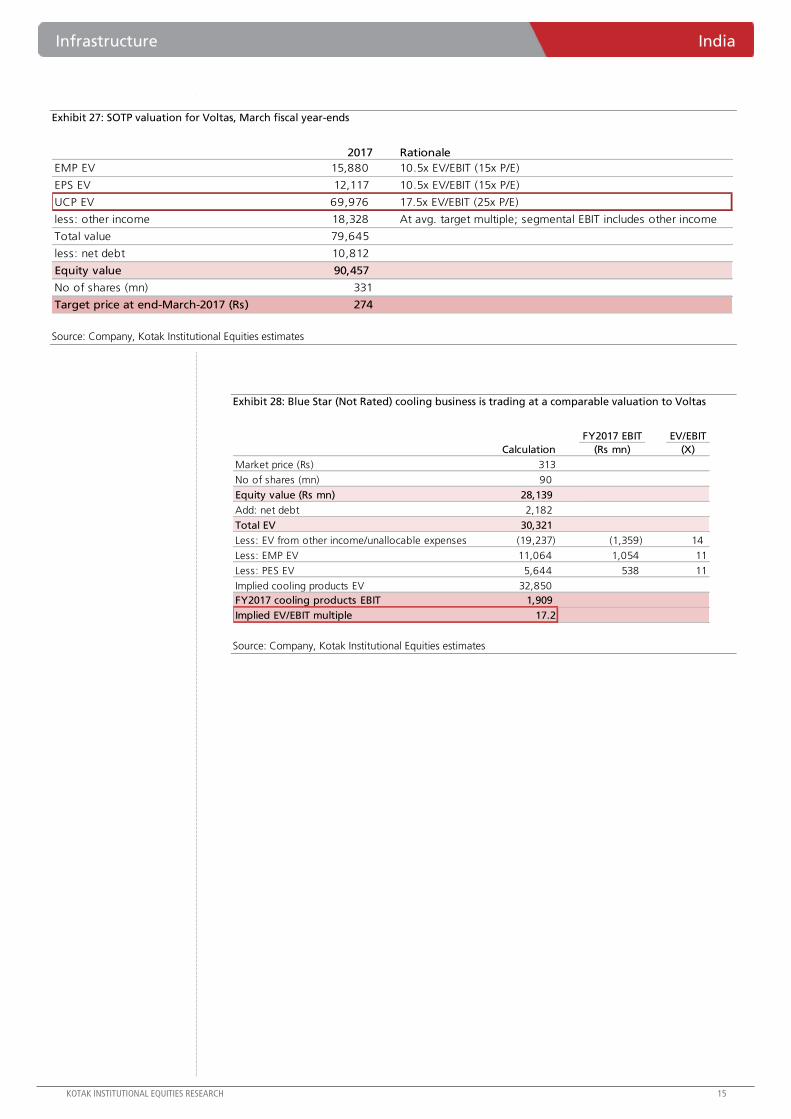
Infrastructure India
KOTAK INSTITUTIONAL EQUITIES RESEARCH 15
Exhibit 27: SOTP valuation for Voltas, March fiscal year-ends
2017 Rationale
EMP EV 15,880 10.5x EV/EBIT (15x P/E)
EPS EV 12,117 10.5x EV/EBIT (15x P/E)
UCP EV 69,976 17.5x EV/EBIT (25x P/E)
less: other income 18,328 At avg. target multiple; segmental EBIT includes other income
Total value 79,645
less: net debt 10,812
Equity value 90,457
No of shares (mn) 331
Target price at end-March-2017 (Rs) 274
Source: Company, Kotak Institutional Equities estimates
Exhibit 28: Blue Star (Not Rated) cooling business is trading at a comparable valuation to Voltas
FY2017 EBIT EV/EBIT
Calculation (Rs mn) (X)
Market price (Rs) 313
No of shares (mn) 90
Equity value (Rs mn) 28,139
Add: net debt 2,182
Total EV 30,321
Less: EV from other income/unallocable expenses (19,237) (1,359) 14
Less: EMP EV 11,064 1,054 11
Less: PES EV 5,644 538 11
Implied cooling products EV 32,850
FY2017 cooling products EBIT 1,909
Implied EV/EBIT multiple 17.2
Source: Company, Kotak Institutional Equities estimates

India Infrastructure
16 KOTAK INSTITUTIONAL EQUITIES RESEARCH
Exhibit 29: Relative valuation chart for key players in consumer durables space in India and overseas
Price Mcap.
Company name (Local currency) (USD mn) 2016E 2017E 2016E 2017E 2016E 2017E 2016E 2017E
Global companies
LG Electronics 60,500 8,952 8.8 7.6 0.8 0.7 4.1 3.6 9.0 9.6
Samsung Electronics 1,469,000 195,552 9.3 8.9 1.2 1.1 2.9 2.7 12.6 11.7
Electrolux AB 253 9,178 14.2 12.6 3.2 2.7 7.3 6.4 23.2 22.0
Panasonic Corp 1,549 31,731 16.9 14.6 1.8 1.6 5.1 4.5 11.0 11.8
Daikin Industries 8,010 19,623 17.6 15.9 2.3 2.1 9.2 8.3 13.7 13.6
Midea Group 32 21,526 8.7 NA 2.1 NA 5.2 NA 26.4 23.9
Qingdao Haier 23 11,496 10.4 NA 2.3 NA 3.6 NA 24.6 19.7
Average 12.3 11.9 2.0 1.6 5.3 5.1 17.2 16.0
Indian companies
Bajaj Electricals 212 343 17.0 12.4 2.8 2.4 7.9 6.2 16.6 19.9
Havells 305 3,062 32.1 26.7 6.9 6.2 18.0 14.9 27.8 28.7
TTK Prestige 3,509 657 27.6 22.0 5.2 4.5 17.9 14.0 20.7 22.7
Hitachi Home & Life Solutions India 1,333 583 35.8 24.2 8.7 6.5 18.0 14.3 28.6 30.8
Symphony 2,336 1,314 49.3 30.3 23.1 14.0 32.2 23.6 35.8 27.2
Voltas 280 1,487 23.0 18.9 3.9 3.4 17.9 13.9 17.8 19.4
Whirlpool of India 718 1,465 36.1 25.7 7.9 6.1 21.9 16.1 23.4 26.0
Average 31.5 22.9 8.4 6.2 19.1 14.7 24.4 24.9
ROE (%)EV/EBITDAP/E P/B
Source: Bloomberg, Company, Kotak Institutional Equities
Exhibit 30: Segmental estimates for Voltas, March fiscal year-ends, 2010-17E (` mn)
2010 2011 2012 2013 2014 2015E 2016E 2017E
Valuation
BVPS (Rs) 32.8 41.2 44.7 49.2 55.0 62.4 69.9 79.0
EPS (Rs) 11.3 10.0 9.4 5.9 6.8 9.1 11.5 14.0
P/E (X) 24.3 27.6 29.1 46.6 40.6 30.1 23.9 19.7
P/B (X) 8.4 6.7 6.2 5.6 5.0 4.4 3.9 3.5
Financials
Revenue 48,059 51,768 51,857 55,141 52,661 51,572 60,331 69,233
yoy growth (%) 7.7 0.2 6.3 (4.5) (2.1) 17.0 14.8
EBITDA 4,769 4,408 3,365 2,452 2,656 3,495 4,707 5,731
EBITDA margin (%) 9.9 8.5 6.5 4.4 5.0 6.8 7.8 8.3
PAT 3,737 3,291 3,125 1,950 2,239 3,017 3,800 4,627
Segmental
Electromechanical projects
Order inflow 31,848 31,397 25,872 26,265 25,854 24,561 28,246 35,307
yoy growth (%) 0.0 (1.4) (17.6) 1.5 (1.6) (5.0) 15.0 25.0
Order backlog 47,894 48,880 42,920 37,190 36,120 38,659 40,514 45,574
Revenue 31,134 30,411 31,832 31,995 26,924 22,022 26,391 30,247
yoy growth (%) 12.5 (2.3) 4.7 0.5 (15.8) (18.2) 19.8 14.6
EBIT 3,091 2,393 (1,042) (491) (395) 264 1,056 1,512
EBITmargin (%) 9.9 7.9 (3.3) (1.5) (1.5) 1.2 4.0 5.0
Engg products and services
Revenue 4,680 5,638 4,121 4,310 4,482 3,794 4,363 5,017
yoy growth (%) (13.7) 20.5 (26.9) 4.6 4.0 (15.4) 15.0 15.0
EBIT 768 1,031 687 821 1,247 1,024 1,004 1,154
EBITmargin (%) 16.4 18.3 16.7 19.0 27.8 27.0 23.0 23.0
Unitary cooling products
Revenue 11,871 15,608 15,388 18,356 20,514 25,196 28,976 33,322
yoy growth (%) 28.7 31.5 (1.4) 19.3 11.8 22.8 15.0 15.0
EBIT 1,203 1,599 1,298 1,727 2,519 3,049 3,477 3,999
EBITmargin (%) 10.1 10.2 8.4 9.4 12.3 12.1 12.0 12.0
Others
Revenue 391 126 427 502 520 559 601 647
yoy growth (%) (62) (68) 239 17 4 8 8 8
EBIT 72 16 42 3 6 50 30 32
EBITmargin (%) 18.3 12.7 9.7 0.6 1.1 8.9 5.0 5.0
Source: Company, Kotak Institutional Equities estimates
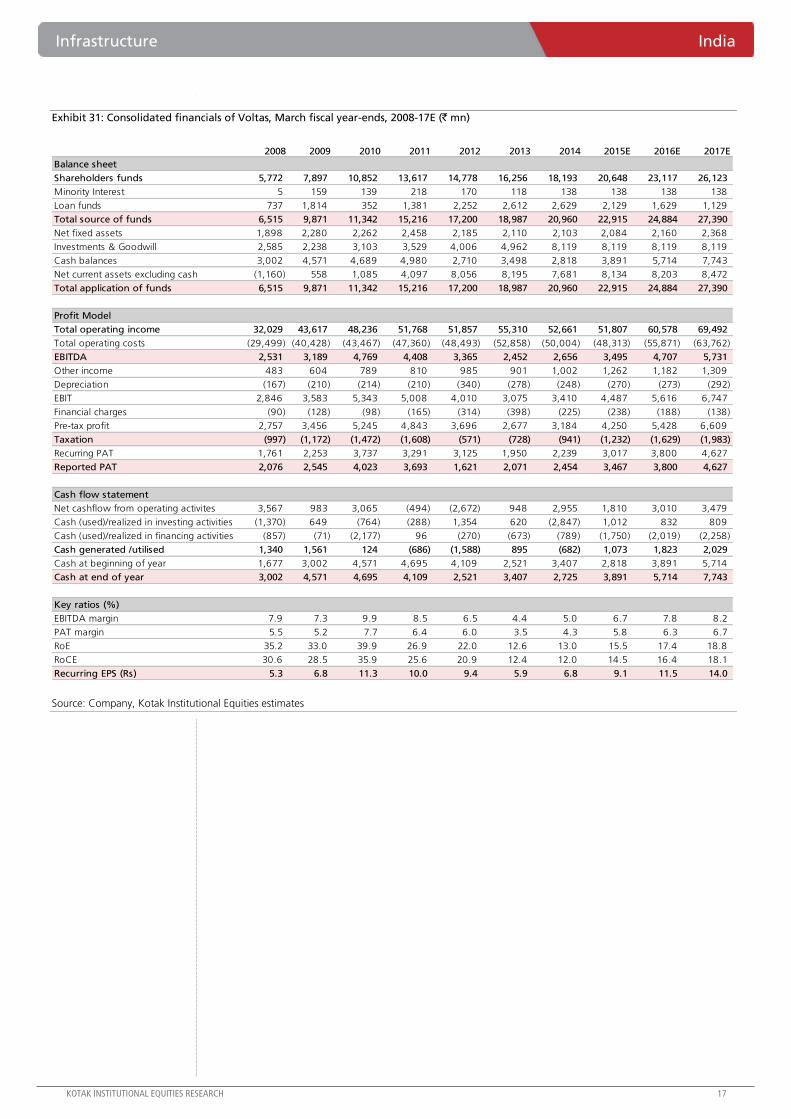
Infrastructure India
KOTAK INSTITUTIONAL EQUITIES RESEARCH 17
Exhibit 31: Consolidated financials of Voltas, March fiscal year-ends, 2008-17E (` mn)
2008 2009 2010 2011 2012 2013 2014 2015E 2016E 2017E
Balance sheet
Shareholders funds 5,772 7,897 10,852 13,617 14,778 16,256 18,193 20,648 23,117 26,123
Minority Interest 5 159 139 218 170 118 138 138 138 138
Loan funds 737 1,814 352 1,381 2,252 2,612 2,629 2,129 1,629 1,129
Total source of funds 6,515 9,871 11,342 15,216 17,200 18,987 20,960 22,915 24,884 27,390
Net fixed assets 1,898 2,280 2,262 2,458 2,185 2,110 2,103 2,084 2,160 2,368
Investments & Goodwill 2,585 2,238 3,103 3,529 4,006 4,962 8,119 8,119 8,119 8,119
Cash balances 3,002 4,571 4,689 4,980 2,710 3,498 2,818 3,891 5,714 7,743
Net current assets excluding cash (1,160) 558 1,085 4,097 8,056 8,195 7,681 8,134 8,203 8,472
Total application of funds 6,515 9,871 11,342 15,216 17,200 18,987 20,960 22,915 24,884 27,390
Profit Model
Total operating income 32,029 43,617 48,236 51,768 51,857 55,310 52,661 51,807 60,578 69,492
Total operating costs (29,499) (40,428) (43,467) (47,360) (48,493) (52,858) (50,004) (48,313) (55,871) (63,762)
EBITDA 2,531 3,189 4,769 4,408 3,365 2,452 2,656 3,495 4,707 5,731
Other income 483 604 789 810 985 901 1,002 1,262 1,182 1,309
Depreciation (167) (210) (214) (210) (340) (278) (248) (270) (273) (292)
EBIT 2,846 3,583 5,343 5,008 4,010 3,075 3,410 4,487 5,616 6,747
Financial charges (90) (128) (98) (165) (314) (398) (225) (238) (188) (138)
Pre-tax profit 2,757 3,456 5,245 4,843 3,696 2,677 3,184 4,250 5,428 6,609
Taxation (997) (1,172) (1,472) (1,608) (571) (728) (941) (1,232) (1,629) (1,983)
Recurring PAT 1,761 2,253 3,737 3,291 3,125 1,950 2,239 3,017 3,800 4,627
Reported PAT 2,076 2,545 4,023 3,693 1,621 2,071 2,454 3,467 3,800 4,627
Cash flow statement
Net cashflow from operating activites 3,567 983 3,065 (494) (2,672) 948 2,955 1,810 3,010 3,479
Cash (used)/realized in investing activities (1,370) 649 (764) (288) 1,354 620 (2,847) 1,012 832 809
Cash (used)/realized in financing activities (857) (71) (2,177) 96 (270) (673) (789) (1,750) (2,019) (2,258)
Cash generated /utilised 1,340 1,561 124 (686) (1,588) 895 (682) 1,073 1,823 2,029
Cash at beginning of year 1,677 3,002 4,571 4,695 4,109 2,521 3,407 2,818 3,891 5,714
Cash at end of year 3,002 4,571 4,695 4,109 2,521 3,407 2,725 3,891 5,714 7,743
Key ratios (%)
EBITDA margin 7.9 7.3 9.9 8.5 6.5 4.4 5.0 6.7 7.8 8.2
PAT margin 5.5 5.2 7.7 6.4 6.0 3.5 4.3 5.8 6.3 6.7
RoE 35.2 33.0 39.9 26.9 22.0 12.6 13.0 15.5 17.4 18.8
RoCE 30.6 28.5 35.9 25.6 20.9 12.4 12.0 14.5 16.4 18.1
Recurring EPS (Rs) 5.3 6.8 11.3 10.0 9.4 5.9 6.8 9.1 11.5 14.0
Source: Company, Kotak Institutional Equities estimates
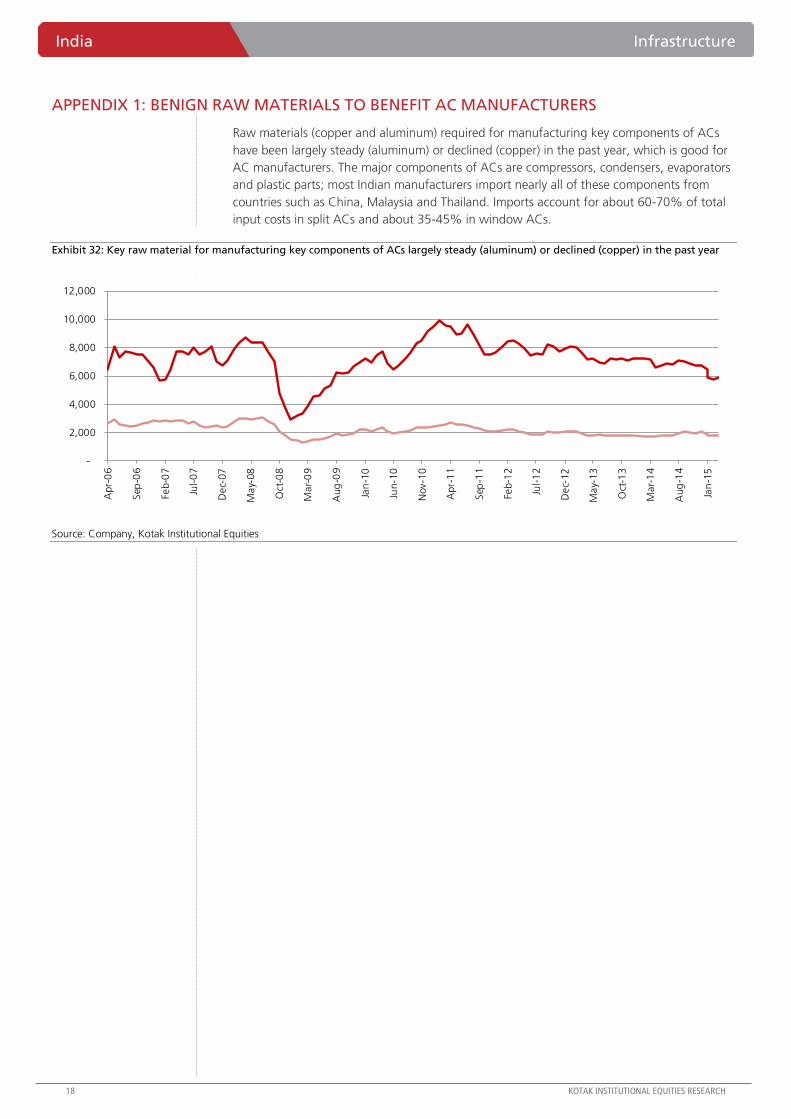
India Infrastructure
18 KOTAK INSTITUTIONAL EQUITIES RESEARCH
APPENDIX 1: BENIGN RAW MATERIALS TO BENEFIT AC MANUFACTURERS
Raw materials (copper and aluminum) required for manufacturing key components of ACs
have been largely steady (aluminum) or declined (copper) in the past year, which is good for
AC manufacturers. The major components of ACs are compressors, condensers, evaporators
and plastic parts; most Indian manufacturers import nearly all of these components from
countries such as China, Malaysia and Thailand. Imports account for about 60-70% of total
input costs in split ACs and about 35-45% in window ACs.
Exhibit 32: Key raw material for manufacturing key components of ACs largely steady (aluminum) or declined (copper) in the past year
-
2,000
4,000
6,000
8,000
10,000
12,000
Apr-
06
Sep
-06
Feb-0
7
Jul-0
7
Dec-
07
May-
08
Oct
-08
Mar-
09
Aug
-09
Jan
-10
Jun-1
0
Nov-
10
Apr-
11
Sep
-11
Feb-1
2
Jul-1
2
Dec-
12
May-
13
Oct
-13
Mar-
14
Aug
-14
Jan
-15
Source: Company, Kotak Institutional Equities

Infrastructure India
KOTAK INSTITUTIONAL EQUITIES RESEARCH 19
APPENDIX 2: NUMBER OF PRODUCTS ACROSS ALL CATEGORIES OF ACS FOR 32 COMPANIES
Exhibit 33: Number of products across all categories of ACs
5 4 3 2 1
1 LG 52 12 74 0 3 162
2 HITACHI 32 18 31 8 2 116
3 BLUESTAR 26 0 28 12 0 69
4 VOLTAS 16 0 30 0 0 59
5 SAMSUNG 14 2 15 1 0 37
6 VIDEOCON 14 1 19 1 0 35
7 WHIRLPOOL 12 1 9 1 0 23
8 ONIDA 11 1 27 13 0 58
9 GODREJ 9 0 10 2 0 21
10 PANASONIC 8 12 13 15 0 65
11 ELECTROLUX 8 0 12 0 0 20
12 MITSUBISHI ELECTRIC 6 4 5 0 2 25
13 HAIER 6 0 17 8 3 38
14 LLOYD 5 1 15 8 5 42
15 CARRIER 3 3 5 0 0 31
16 DAIKIN 2 5 3 3 0 46
17 MIDEA 2 1 11 3 0 17
18 GENERAL 2 0 4 3 6 27
19 KENSTAR 2 0 2 0 0 4
20 ZAMIL 1 2 4 2 1 10
21 INTEC 1 1 2 2 0 6
22 RECONNECT 1 1 1 0 0 3
23 IFB 1 0 4 3 0 8
24 KORYO 1 0 2 1 0 4
25 TRANE 0 2 4 3 0 9
26 KELVINATOR 0 1 0 2 2 5
27 TOSHIBA 0 1 0 0 0 1
28 TECUMSEH 0 0 4 0 0 4
29 CRUISE 0 0 2 0 0 2
30 TCL 0 0 2 0 0 2
31MITSUBISHI HEAVY
INDUSTRIES0 0 0 0 0 9
32 SHARP 0 0 0 0 0 12
No Brand
Star Rating
Total
Source: https://www.bijlibachao.com, Kotak Institutional Equities

India Infrastructure
20 KOTAK INSTITUTIONAL EQUITIES RESEARCH
Exhibit 34: Number of products across split ACs
5 4 3 2 1
1 LG 40 8 62 0 0 130
2 HITACHI 26 14 27 5 0 96
3 BLUESTAR 24 0 23 6 0 56
4 SAMSUNG 14 2 15 1 0 37
5 VIDEOCON 14 1 17 0 0 32
6 VOLTAS 12 0 24 0 0 47
7 ONIDA 11 1 25 10 0 53
8 WHIRLPOOL 10 1 9 0 0 20
9 GODREJ 9 0 9 1 0 19
10 ELECTROLUX 8 0 12 0 0 20
11 PANASONIC 7 12 12 15 0 63
12 MITSUBISHI ELECTRIC 6 4 5 0 2 25
13 HAIER 6 0 16 7 0 33
14 LLOYD 5 1 13 7 4 38
15 CARRIER 3 3 3 0 0 29
16 DAIKIN 2 5 3 3 0 46
17 MIDEA 2 1 9 3 0 15
18 GENERAL 2 0 4 2 3 23
19 KENSTAR 2 0 2 0 0 4
20 ZAMIL 1 1 3 1 0 6
21 INTEC 1 1 1 2 0 5
22 RECONNECT 1 1 1 0 0 3
23 IFB 1 0 4 3 0 8
24 KORYO 1 0 2 0 0 3
25 TRANE 0 2 4 3 0 9
26 KELVINATOR 0 1 0 2 2 5
27 TOSHIBA 0 1 0 0 0 1
28 TECUMSEH 0 0 4 0 0 4
29 CRUISE 0 0 2 0 0 2
30 TCL 0 0 2 0 0 2
31MITSUBISHI HEAVY
INDUSTRIES0 0 0 0 0 9
32 SHARP 0 0 0 0 0 12
No Brand
Star Rating
Total
Source: https://www.bijlibachao.com, Kotak Institutional Equities
Exhibit 35: Number of products across window ACs
5 4 3 2 1
1 LG 12 4 12 0 3 32
2 HITACHI 6 4 4 3 2 20
3 VOLTAS 4 0 6 0 0 12
4 BLUESTAR 2 0 5 6 0 13
5 WHIRLPOOL 2 0 0 1 0 3
6 PANASONIC 1 0 1 0 0 2
7 ZAMIL 0 1 1 1 1 4
8 ONIDA 0 0 2 3 0 5
9 LLOYD 0 0 2 1 1 4
10 VIDEOCON 0 0 2 1 0 3
11 CARRIER 0 0 2 0 0 2
12 MIDEA 0 0 2 0 0 2
13 HAIER 0 0 1 1 3 5
14 GODREJ 0 0 1 1 0 2
15 INTEC 0 0 1 0 0 1
16 GENERAL 0 0 0 1 3 4
17 KORYO 0 0 0 1 0 1
No Brand
Star Rating
Total
Source: https://www.bijlibachao.com, Kotak Institutional Equities
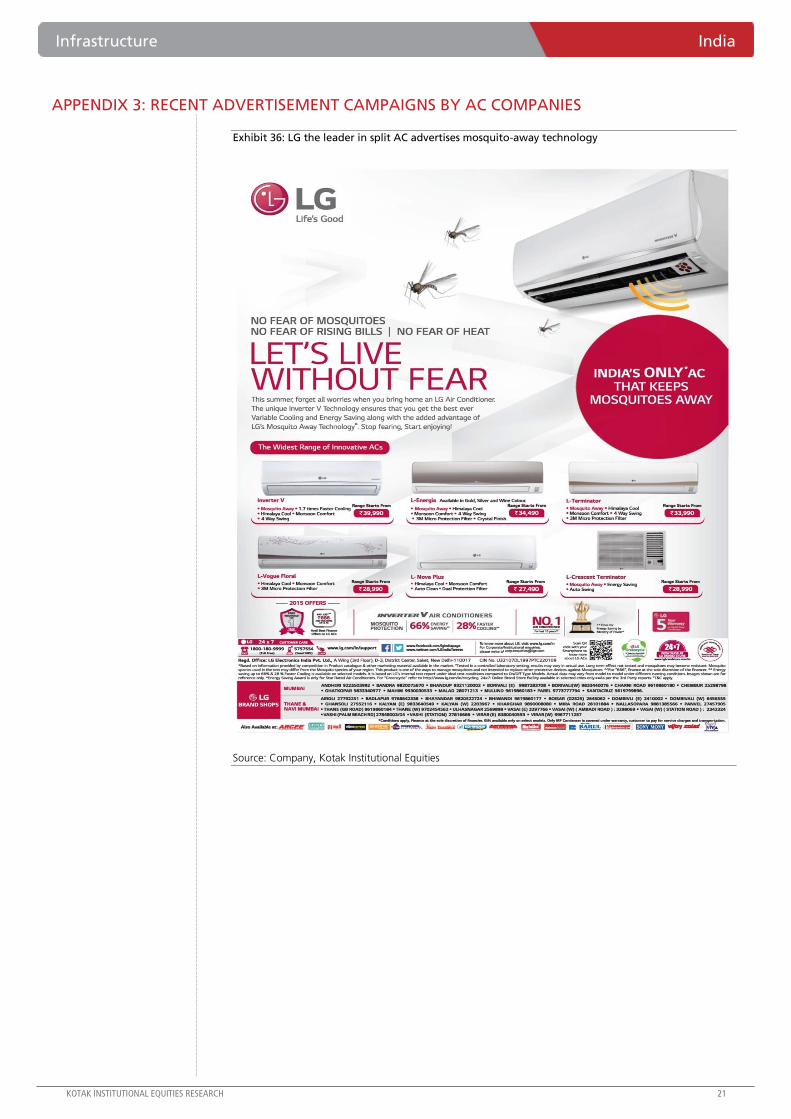
Infrastructure India
KOTAK INSTITUTIONAL EQUITIES RESEARCH 21
APPENDIX 3: RECENT ADVERTISEMENT CAMPAIGNS BY AC COMPANIES
Exhibit 36: LG the leader in split AC advertises mosquito-away technology
Source: Company, Kotak Institutional Equities
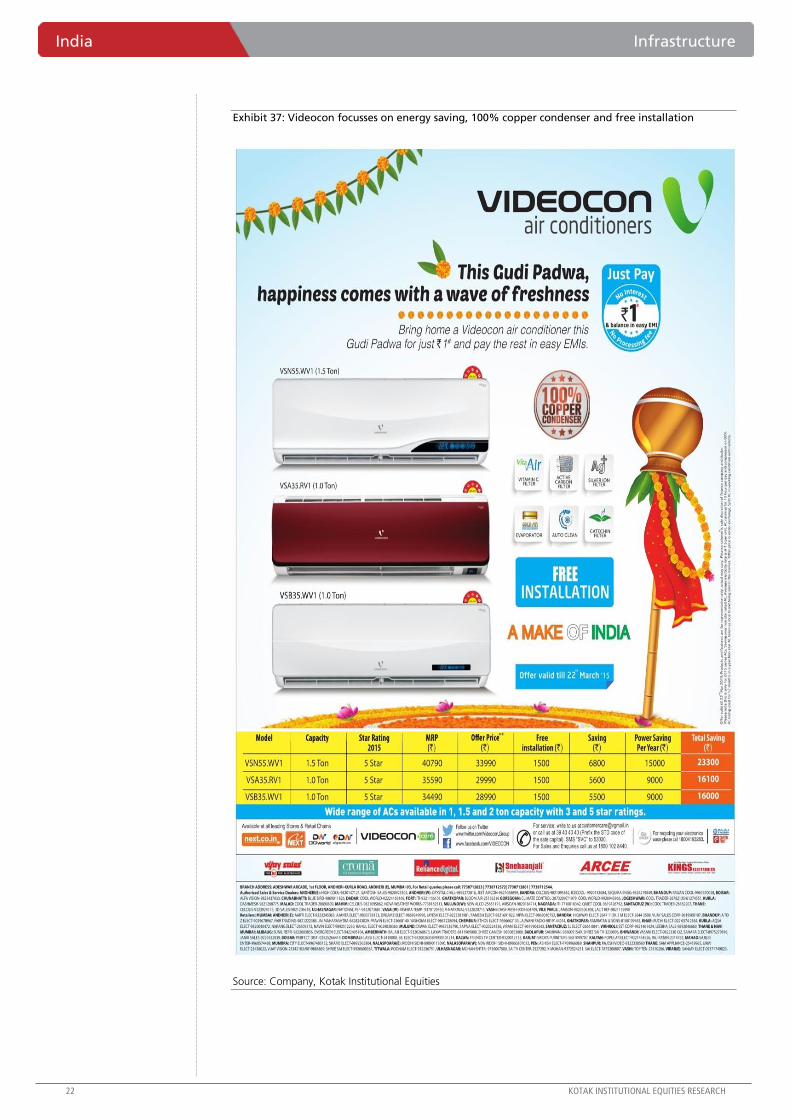
India Infrastructure
22 KOTAK INSTITUTIONAL EQUITIES RESEARCH
Exhibit 37: Videocon focusses on energy saving, 100% copper condenser and free installation
Source: Company, Kotak Institutional Equities

Infrastructure India
KOTAK INSTITUTIONAL EQUITIES RESEARCH 23
Exhibit 38: Carrier too focuses on features highlighted by Videocon above
Source: Company, Kotak Institutional Equities

India Infrastructure
24 KOTAK INSTITUTIONAL EQUITIES RESEARCH
Exhibit 39: Onida showcases its Wi-Fi connected AC (based on IOT)
Source: Company, Kotak Institutional Equities
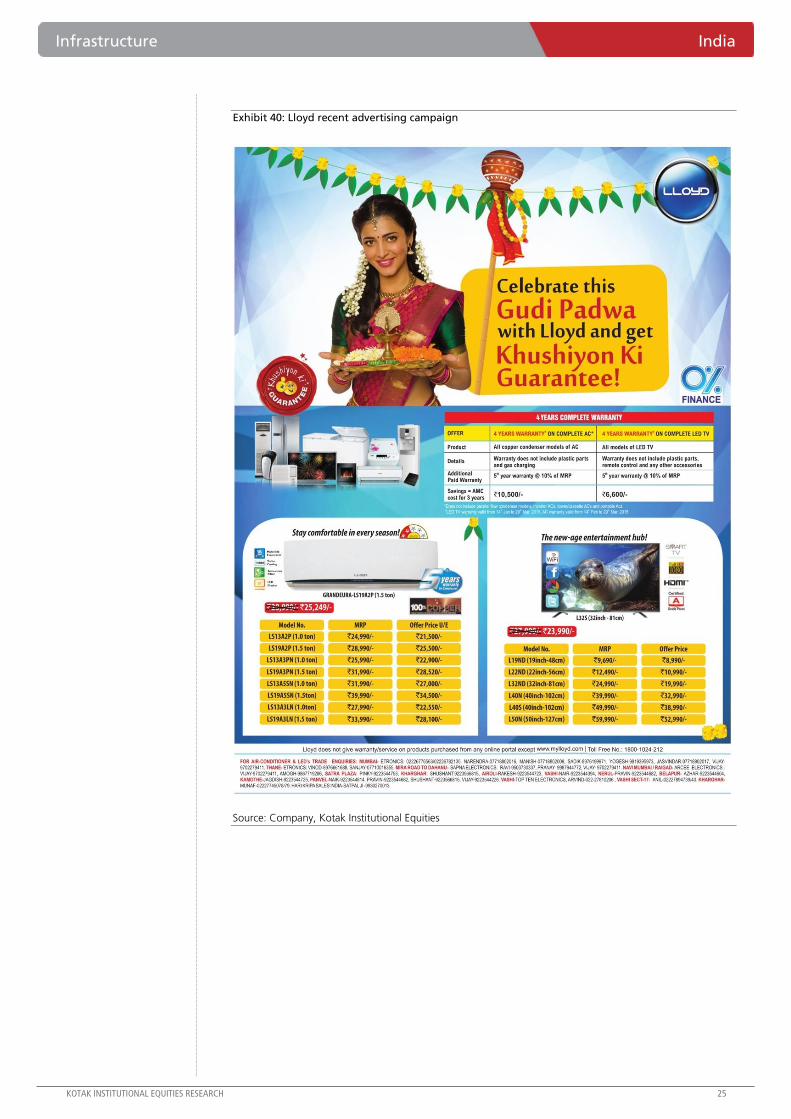
Infrastructure India
KOTAK INSTITUTIONAL EQUITIES RESEARCH 25
Exhibit 40: Lloyd recent advertising campaign
Source: Company, Kotak Institutional Equities

India Infrastructure
26 KOTAK INSTITUTIONAL EQUITIES RESEARCH
Exhibit 41: Mitsubishi has a rather simple advertisement pitch
Source: Company, Kotak Institutional Equities
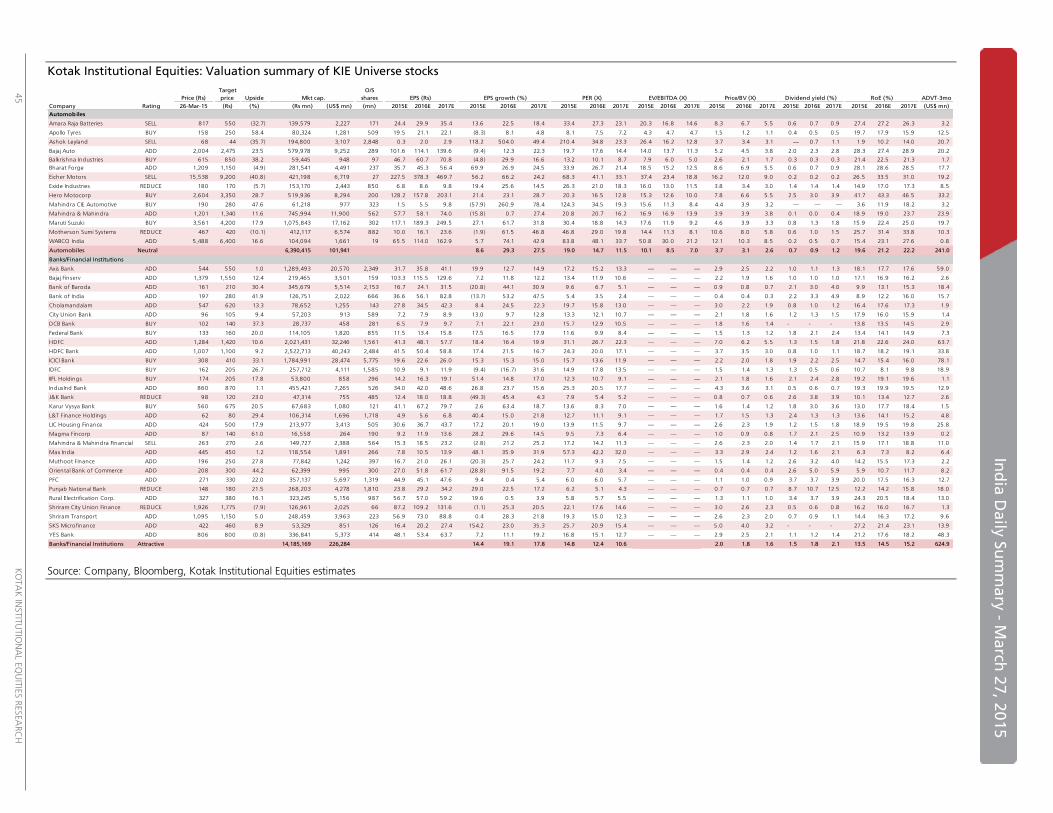
In
dia
Daily
Su
mm
ary
- Ma
rch 2
7, 2
015
45
K
OTA
K IN
STIT
UTIO
NA
L EQ
UIT
IES R
ESEA
RC
H
Kotak Institutional Equities: Valuation summary of KIE Universe stocks
Source: Company, Bloomberg, Kotak Institutional Equities estimates
Target O/S
Price (Rs) price Upside Mkt cap. shares EPS (Rs) EPS growth (%) PER (X) EV/EBITDA (X) ADVT-3mo
Company Rating 26-Mar-15 (Rs) (%) (Rs mn) (US$ mn) (mn) 2015E 2016E 2017E 2015E 2016E 2017E 2015E 2016E 2017E 2015E 2016E 2017E 2015E 2016E 2017E 2015E 2016E 2017E 2015E 2016E 2017E (US$ mn)
Automobiles
Amara Raja Batteries SELL 817 550 (32.7) 139,579 2,227 171 24.4 29.9 35.4 13.6 22.5 18.4 33.4 27.3 23.1 20.3 16.8 14.6 8.3 6.7 5.5 0.6 0.7 0.9 27.4 27.2 26.3 3.2
Apollo Tyres BUY 158 250 58.4 80,324 1,281 509 19.5 21.1 22.1 (8.3) 8.1 4.8 8.1 7.5 7.2 4.3 4.7 4.7 1.5 1.2 1.1 0.4 0.5 0.5 19.7 17.9 15.9 12.5
Ashok Leyland SELL 68 44 (35.7) 194,800 3,107 2,848 0.3 2.0 2.9 118.2 504.0 49.4 210.4 34.8 23.3 26.4 16.2 12.8 3.7 3.4 3.1 — 0.7 1.1 1.9 10.2 14.0 20.7
Bajaj Auto ADD 2,004 2,475 23.5 579,978 9,252 289 101.6 114.1 139.6 (9.4) 12.3 22.3 19.7 17.6 14.4 14.0 13.7 11.3 5.2 4.5 3.8 2.0 2.3 2.8 28.3 27.4 28.9 20.2
Balkrishna Industries BUY 615 850 38.2 59,445 948 97 46.7 60.7 70.8 (4.8) 29.9 16.6 13.2 10.1 8.7 7.9 6.0 5.0 2.6 2.1 1.7 0.3 0.3 0.3 21.4 22.5 21.3 1.7
Bharat Forge ADD 1,209 1,150 (4.9) 281,541 4,491 237 35.7 45.3 56.4 69.9 26.9 24.5 33.9 26.7 21.4 18.5 15.2 12.5 8.6 6.9 5.5 0.6 0.7 0.9 28.1 28.6 28.5 17.7
Eicher Motors SELL 15,538 9,200 (40.8) 421,198 6,719 27 227.5 378.3 469.7 56.2 66.2 24.2 68.3 41.1 33.1 37.4 23.4 18.8 16.2 12.0 9.0 0.2 0.2 0.2 26.5 33.5 31.0 19.2
Exide Industries REDUCE 180 170 (5.7) 153,170 2,443 850 6.8 8.6 9.8 19.4 25.6 14.5 26.3 21.0 18.3 16.0 13.0 11.5 3.8 3.4 3.0 1.4 1.4 1.4 14.9 17.0 17.3 8.5
Hero Motocorp BUY 2,604 3,350 28.7 519,936 8,294 200 128.2 157.8 203.1 21.4 23.1 28.7 20.3 16.5 12.8 15.3 12.6 10.0 7.8 6.6 5.5 2.5 3.0 3.9 41.7 43.3 46.5 33.2
Mahindra CIE Automotive BUY 190 280 47.6 61,218 977 323 1.5 5.5 9.8 (57.9) 260.9 78.4 124.3 34.5 19.3 15.6 11.3 8.4 4.4 3.9 3.2 — — — 3.6 11.9 18.2 3.2
Mahindra & Mahindra ADD 1,201 1,340 11.6 745,994 11,900 562 57.7 58.1 74.0 (15.8) 0.7 27.4 20.8 20.7 16.2 16.9 16.9 13.9 3.9 3.9 3.8 0.1 0.0 0.4 18.9 19.0 23.7 23.9
Maruti Suzuki BUY 3,561 4,200 17.9 1,075,843 17,162 302 117.1 189.3 249.5 27.1 61.7 31.8 30.4 18.8 14.3 17.6 11.9 9.2 4.6 3.9 3.3 0.8 1.3 1.8 15.9 22.4 25.0 19.7
Motherson Sumi Systems REDUCE 467 420 (10.1) 412,117 6,574 882 10.0 16.1 23.6 (1.9) 61.5 46.8 46.8 29.0 19.8 14.4 11.3 8.1 10.6 8.0 5.8 0.6 1.0 1.5 25.7 31.4 33.8 10.3
WABCO India ADD 5,488 6,400 16.6 104,094 1,661 19 65.5 114.0 162.9 5.7 74.1 42.9 83.8 48.1 33.7 50.8 30.0 21.2 12.1 10.3 8.5 0.2 0.5 0.7 15.4 23.1 27.6 0.8
Automobiles Neutral 6,390,415 101,941 8.6 29.3 27.5 19.0 14.7 11.5 10.1 8.5 7.0 3.7 3.1 2.6 0.7 0.9 1.2 19.6 21.2 22.2 241.0
Banks/Financial Institutions
Axis Bank ADD 544 550 1.0 1,289,493 20,570 2,349 31.7 35.8 41.1 19.9 12.7 14.9 17.2 15.2 13.3 — — — 2.9 2.5 2.2 1.0 1.1 1.3 18.1 17.7 17.6 59.0
Bajaj Finserv ADD 1,379 1,550 12.4 219,465 3,501 159 103.3 115.5 129.6 7.2 11.8 12.2 13.4 11.9 10.6 — — — 2.2 1.9 1.6 1.0 1.0 1.0 17.1 16.9 16.2 2.6
Bank of Baroda ADD 161 210 30.4 345,679 5,514 2,153 16.7 24.1 31.5 (20.8) 44.1 30.9 9.6 6.7 5.1 — — — 0.9 0.8 0.7 2.1 3.0 4.0 9.9 13.1 15.3 18.4
Bank of India ADD 197 280 41.9 126,751 2,022 666 36.6 56.1 82.8 (13.7) 53.2 47.5 5.4 3.5 2.4 — — — 0.4 0.4 0.3 2.2 3.3 4.9 8.9 12.2 16.0 15.7
Cholamandalam ADD 547 620 13.3 78,652 1,255 143 27.8 34.5 42.3 8.4 24.5 22.3 19.7 15.8 13.0 — — — 3.0 2.2 1.9 0.8 1.0 1.2 16.4 17.6 17.3 1.9
City Union Bank ADD 96 105 9.4 57,203 913 589 7.2 7.9 8.9 13.0 9.7 12.8 13.3 12.1 10.7 — — — 2.1 1.8 1.6 1.2 1.3 1.5 17.9 16.0 15.9 1.4
DCB Bank BUY 102 140 37.3 28,737 458 281 6.5 7.9 9.7 7.1 22.1 23.0 15.7 12.9 10.5 — — — 1.8 1.6 1.4 - - - 13.8 13.5 14.5 2.9
Federal Bank BUY 133 160 20.0 114,105 1,820 855 11.5 13.4 15.8 17.5 16.5 17.9 11.6 9.9 8.4 — — — 1.5 1.3 1.2 1.8 2.1 2.4 13.4 14.1 14.9 7.3
HDFC ADD 1,284 1,420 10.6 2,021,431 32,246 1,561 41.3 48.1 57.7 18.4 16.4 19.9 31.1 26.7 22.3 — — — 7.0 6.2 5.5 1.3 1.5 1.8 21.8 22.6 24.0 63.7
HDFC Bank ADD 1,007 1,100 9.2 2,522,713 40,243 2,484 41.5 50.4 58.8 17.4 21.5 16.7 24.3 20.0 17.1 — — — 3.7 3.5 3.0 0.8 1.0 1.1 18.7 18.2 19.1 33.8
ICICI Bank BUY 308 410 33.1 1,784,991 28,474 5,775 19.6 22.6 26.0 15.3 15.3 15.0 15.7 13.6 11.9 — — — 2.2 2.0 1.8 1.9 2.2 2.5 14.7 15.4 16.0 78.1
IDFC BUY 162 205 26.7 257,712 4,111 1,585 10.9 9.1 11.9 (9.4) (16.7) 31.6 14.9 17.8 13.5 — — — 1.5 1.4 1.3 1.3 0.5 0.6 10.7 8.1 9.8 18.9
IIFL Holdings BUY 174 205 17.8 53,800 858 296 14.2 16.3 19.1 51.4 14.8 17.0 12.3 10.7 9.1 — — — 2.1 1.8 1.6 2.1 2.4 2.8 19.2 19.1 19.6 1.1
IndusInd Bank ADD 860 870 1.1 455,421 7,265 526 34.0 42.0 48.6 26.8 23.7 15.6 25.3 20.5 17.7 — — — 4.3 3.6 3.1 0.5 0.6 0.7 19.3 19.9 19.5 12.9
J&K Bank REDUCE 98 120 23.0 47,314 755 485 12.4 18.0 18.8 (49.3) 45.4 4.3 7.9 5.4 5.2 — — — 0.8 0.7 0.6 2.6 3.8 3.9 10.1 13.4 12.7 2.6
Karur Vysya Bank BUY 560 675 20.5 67,683 1,080 121 41.1 67.2 79.7 2.6 63.4 18.7 13.6 8.3 7.0 — — — 1.6 1.4 1.2 1.8 3.0 3.6 13.0 17.7 18.4 1.5
L&T Finance Holdings ADD 62 80 29.4 106,314 1,696 1,718 4.9 5.6 6.8 40.4 15.0 21.8 12.7 11.1 9.1 — — — 1.7 1.5 1.3 2.4 1.3 1.3 13.6 14.1 15.2 4.8
LIC Housing Finance ADD 424 500 17.9 213,977 3,413 505 30.6 36.7 43.7 17.2 20.1 19.0 13.9 11.5 9.7 — — — 2.6 2.3 1.9 1.2 1.5 1.8 18.9 19.5 19.8 25.8
Magma Fincorp ADD 87 140 61.0 16,558 264 190 9.2 11.9 13.6 28.2 29.6 14.5 9.5 7.3 6.4 — — — 1.0 0.9 0.8 1.7 2.1 2.5 10.9 13.2 13.9 0.2
Mahindra & Mahindra Financial SELL 263 270 2.6 149,727 2,388 564 15.3 18.5 23.2 (2.8) 21.2 25.2 17.2 14.2 11.3 — — — 2.6 2.3 2.0 1.4 1.7 2.1 15.9 17.1 18.8 11.0
Max India ADD 445 450 1.2 118,554 1,891 266 7.8 10.5 13.9 48.1 35.9 31.9 57.3 42.2 32.0 — — — 3.3 2.9 2.4 1.2 1.6 2.1 6.3 7.3 8.2 6.4
Muthoot Finance ADD 196 250 27.8 77,842 1,242 397 16.7 21.0 26.1 (20.3) 25.7 24.2 11.7 9.3 7.5 — — — 1.5 1.4 1.2 2.6 3.2 4.0 14.2 15.5 17.3 2.2
Oriental Bank of Commerce ADD 208 300 44.2 62,399 995 300 27.0 51.8 61.7 (28.8) 91.5 19.2 7.7 4.0 3.4 — — — 0.4 0.4 0.4 2.6 5.0 5.9 5.9 10.7 11.7 8.2
PFC ADD 271 330 22.0 357,137 5,697 1,319 44.9 45.1 47.6 9.4 0.4 5.4 6.0 6.0 5.7 — — — 1.1 1.0 0.9 3.7 3.7 3.9 20.0 17.5 16.3 12.7
Punjab National Bank REDUCE 148 180 21.5 268,203 4,278 1,810 23.8 29.2 34.2 29.0 22.5 17.2 6.2 5.1 4.3 — — — 0.7 0.7 0.7 8.7 10.7 12.5 12.2 14.2 15.8 18.0
Rural Electrification Corp. ADD 327 380 16.1 323,245 5,156 987 56.7 57.0 59.2 19.6 0.5 3.9 5.8 5.7 5.5 — — — 1.3 1.1 1.0 3.4 3.7 3.9 24.3 20.5 18.4 13.0
Shriram City Union Finance REDUCE 1,926 1,775 (7.9) 126,961 2,025 66 87.2 109.2 131.6 (1.1) 25.3 20.5 22.1 17.6 14.6 — — — 3.0 2.6 2.3 0.5 0.6 0.8 16.2 16.0 16.7 1.3
Shriram Transport ADD 1,095 1,150 5.0 248,459 3,963 223 56.9 73.0 88.8 0.4 28.3 21.8 19.3 15.0 12.3 — — — 2.6 2.3 2.0 0.7 0.9 1.1 14.4 16.3 17.2 9.6
SKS Microfinance ADD 422 460 8.9 53,329 851 126 16.4 20.2 27.4 154.2 23.0 35.3 25.7 20.9 15.4 — — — 5.0 4.0 3.2 - - - 27.2 21.4 23.1 13.9
YES Bank ADD 806 800 (0.8) 336,841 5,373 414 48.1 53.4 63.7 7.2 11.1 19.2 16.8 15.1 12.7 — — — 2.9 2.5 2.1 1.1 1.2 1.4 21.2 17.6 18.2 48.3
Banks/Financial Institutions Attractive 14,185,169 226,284 14.4 19.1 17.8 14.8 12.4 10.6 2.0 1.8 1.6 1.5 1.8 2.1 13.5 14.5 15.2 624.9
Price/BV (X) Dividend yield (%) RoE (%)

K
OTA
K IN
STIT
UTIO
NA
L EQ
UIT
IES R
ESEA
RC
H
46
In
dia
Da
ily S
um
ma
ry - M
arch
27
, 20
15
Ind
ia D
aily
Su
mm
ary
- Ma
rch 2
7, 2
015
Kotak Institutional Equities: Valuation summary of KIE Universe stocks
Source: Company, Bloomberg, Kotak Institutional Equities estimates
Target O/S
Price (Rs) price Upside Mkt cap. shares EPS (Rs) EPS growth (%) PER (X) EV/EBITDA (X) ADVT-3mo
Company Rating 26-Mar-15 (Rs) (%) (Rs mn) (US$ mn) (mn) 2015E 2016E 2017E 2015E 2016E 2017E 2015E 2016E 2017E 2015E 2016E 2017E 2015E 2016E 2017E 2015E 2016E 2017E 2015E 2016E 2017E (US$ mn)
Cement
ACC SELL 1,580 1,400 (11.4) 296,553 4,731 188 45.7 63.4 84.7 (2.3) 38.6 33.7 34.5 24.9 18.6 22.5 13.2 9.9 3.6 3.3 2.9 1.5 1.5 1.5 10.7 13.8 16.7 11.0
Ambuja Cements SELL 250 235 (6.0) 387,652 6,184 1,522 8.7 11.8 14.2 28.3 36.5 19.6 28.8 21.1 17.7 19.5 13.5 11.0 3.6 3.3 2.9 1.2 1.7 1.7 12.7 16.3 17.6 6.9
Dalmia Bharat BUY 415 515 24.2 33,661 537 81 6.6 12.2 43.1 737.8 84.3 253.6 62.7 34.0 9.6 17.7 6.8 4.8 0.8 0.8 0.7 0.5 0.5 0.5 1.5 2.4 8.1 0.3
Grasim Industries ADD 3,549 4,130 16.4 325,997 5,200 92 195.1 248.2 333.2 (8.1) 27.2 34.2 18.2 14.3 10.7 7.6 5.3 3.6 1.4 1.3 1.2 1.1 1.1 1.1 8.0 9.5 11.6 5.2
India Cements REDUCE 88 110 25.4 26,955 430 307 2.7 7.2 9.6 220.9 169.2 33.1 32.7 12.1 9.1 8.0 6.2 4.9 0.7 0.7 0.6 3.1 3.0 3.0 2.2 5.7 7.3 5.2
J K Cement BUY 650 770 18.5 45,441 725 70 11.2 23.8 53.5 1.9 111.5 125.0 57.8 27.4 12.2 17.4 9.8 6.8 2.5 2.4 2.0 0.8 0.8 0.8 4.5 9.0 18.0 0.7
JK Lakshmi Cement BUY 354 450 27.1 41,655 664 118 14.2 23.8 35.5 48.3 67.7 49.3 25.0 14.9 10.0 15.0 9.3 6.5 2.9 2.5 2.0 0.6 0.6 0.6 12.1 17.8 22.1 2.0
Orient Cement BUY 162 200 23.2 33,271 531 205 7.9 11.8 18.0 60.3 49.9 51.8 20.5 13.7 9.0 14.7 8.9 5.9 3.5 2.9 2.3 0.9 1.2 1.2 18.2 23.1 28.2 0.6
Shree Cement SELL 11,066 7,165 (35.3) 385,523 6,150 35 206.8 350.4 473.7 (12.3) 69.4 35.2 53.5 31.6 23.4 24.8 16.6 12.6 7.5 6.2 5.0 0.2 0.2 0.2 14.9 21.5 23.6 3.6
UltraTech Cement SELL 2,796 2,370 (15.2) 767,180 12,238 274 75.6 101.8 141.4 1.2 34.7 38.9 37.0 27.5 19.8 20.0 13.9 10.4 4.1 3.6 3.1 0.4 0.4 0.4 11.5 13.9 16.7 14.1
Cement Cautious 2,343,889 37,390 5.3 40.9 37.4 32.1 22.8 16.6 15.9 10.6 7.8 3.0 2.7 2.4 0.8 0.9 0.9 9.4 12.0 14.4 49.6
Consumer products
Asian Paints REDUCE 793 750 (5.4) 760,740 12,135 959 15.4 20.9 23.9 20.3 35.9 14.1 51.5 37.9 33.2 32.3 23.8 20.7 16.0 12.9 10.7 0.8 1.0 1.2 33.6 37.7 35.2 23.2
Bajaj Corp. BUY 443 510 15.1 65,365 1,043 148 15.0 19.1 22.3 24.3 27.7 16.6 29.6 23.2 19.9 26.1 19.9 16.0 13.2 11.5 9.8 2.6 2.0 2.7 43.5 52.9 53.1 1.7
Britannia Industries ADD 2,194 2,050 (6.6) 263,093 4,197 120 47.6 60.0 70.7 44.3 26.1 17.8 46.1 36.6 31.0 30.2 23.8 20.2 20.7 15.3 11.7 0.7 0.9 1.0 55.1 48.0 42.7 7.2
Colgate-Palmolive (India) ADD 1,993 2,000 0.4 270,986 4,323 136 41.4 50.9 60.8 14.9 22.8 19.5 48.1 39.2 32.8 32.4 25.9 21.1 39.5 35.0 31.3 1.5 1.9 2.3 87.6 94.8 100.8 5.7
Dabur India ADD 263 280 6.6 461,524 7,362 1,744 6.1 7.9 9.0 17.3 29.4 14.5 43.1 33.3 29.1 34.2 26.4 22.7 13.9 11.2 9.1 0.9 1.1 1.2 35.7 37.2 34.6 5.5
GlaxoSmithKline Consumer ADD 6,300 6,100 (3.2) 264,950 4,227 42 142.5 170.7 195.4 (11.2) 19.8 14.5 44.2 36.9 32.2 32.8 26.1 22.2 12.2 10.3 8.8 0.8 1.0 1.2 30.1 30.2 29.3 1.9
Godrej Consumer Products REDUCE 1,074 1,070 (0.3) 365,552 5,831 340 26.6 33.9 39.7 19.0 27.6 17.1 40.4 31.7 27.0 26.8 21.3 17.9 8.2 7.0 5.9 0.6 0.7 0.9 22.0 23.8 23.7 3.2
Hindustan Unilever REDUCE 866 800 (7.6) 1,873,344 29,884 2,163 18.1 21.4 23.8 10.1 18.0 11.5 47.8 40.5 36.3 34.9 28.5 25.1 46.3 39.2 34.0 1.6 1.7 2.0 106.9 104.7 100.2 31.2
ITC ADD 322 370 14.8 2,584,203 41,224 8,096 12.0 13.0 14.7 12.4 8.0 12.9 26.8 24.8 22.0 17.9 16.3 14.1 8.9 8.0 7.3 2.1 2.4 2.8 31.4 31.1 33.9 59.5
Jubilant Foodworks SELL 1,491 1,175 (21.2) 97,778 1,560 66 17.8 25.5 36.1 16.3 43.2 41.4 83.6 58.4 41.3 37.8 27.0 19.6 14.7 11.8 9.2 — — 0.1 19.3 22.5 25.2 7.4
Jyothy Laboratories REDUCE 258 250 (3.1) 46,722 745 181 5.6 8.6 11.9 43.1 54.1 38.1 46.1 29.9 21.7 27.5 18.8 16.0 5.9 5.2 5.1 1.2 1.4 1.5 19.1 23.8 28.9 1.1
Marico ADD 374 370 (1.1) 241,191 3,848 645 9.0 11.8 13.4 13.6 32.2 13.5 41.7 31.6 27.8 27.3 20.6 17.9 13.8 10.7 8.5 0.7 0.9 1.1 37.1 38.1 34.1 8.8
Nestle India REDUCE 6,845 5,950 (13.1) 659,985 10,528 96 123.0 159.0 184.5 7.5 29.2 16.0 55.6 43.0 37.1 31.6 25.1 22.3 23.3 18.8 15.6 0.9 1.1 1.3 48.2 50.7 48.1 3.8
Page Industries SELL 14,136 8,000 (43.4) 157,676 2,515 11 181.5 224.3 275.1 31.6 23.6 22.7 77.9 63.0 51.4 48.6 39.5 32.2 40.1 29.6 21.6 0.5 0.6 0.6 59.4 54.0 48.6 2.4
Pidilite Industries REDUCE 599 540 (9.8) 306,829 4,895 513 10.7 15.4 17.8 20.7 43.1 15.7 55.7 38.9 33.7 37.3 26.2 22.3 13.5 11.1 9.3 0.6 0.8 1.0 26.0 31.2 30.0 4.9
Speciality Restaurants REDUCE 178 175 (1.7) 8,358 133 47 2.2 3.8 5.8 (45.6) 71.9 53.8 81.3 47.3 30.8 24.3 16.0 11.3 2.7 2.5 2.3 0.6 0.6 0.7 3.3 5.5 7.9 0.2
Tata Global Beverages REDUCE 147 160 8.6 91,090 1,453 631 5.4 7.1 8.3 (1.6) 32.0 16.2 27.3 20.7 17.8 12.4 10.7 9.2 1.5 1.5 1.4 1.5 1.7 2.0 5.8 7.3 8.2 5.2
Titan Company REDUCE 390 370 (5.1) 346,015 5,520 888 9.5 11.4 13.2 12.8 19.7 15.7 40.9 34.2 29.5 28.4 22.7 18.9 11.2 9.4 8.0 0.7 1.0 1.3 30.1 29.9 29.3 7.0
United Breweries SELL 965 700 (27.5) 255,164 4,070 264 10.1 13.6 17.4 18.1 34.0 28.7 95.4 71.2 55.3 39.0 32.5 27.2 13.8 11.9 10.1 0.2 0.2 0.3 15.0 17.9 19.7 3.6
United Spirits BUY 3,525 4,000 13.5 512,259 8,172 145 15.9 63.0 94.8 277.0 297.5 50.4 222.3 55.9 37.2 59.3 30.6 22.4 17.1 13.5 10.2 0.1 0.2 0.3 7.6 26.9 31.3 22.0
Consumer products Attractive 9,632,823 153,664 15.4 21.8 16.0 40.8 33.5 28.9 27.1 22.2 19.0 13.1 11.3 9.8 1.3 1.5 1.7 32.0 33.7 33.9 205.6
Energy
Aban Offshore RS 419 — — 24,176 386 57 98.4 112.2 113.3 17.4 14.0 1.0 4.3 3.7 3.7 6.5 6.0 5.9 0.5 0.4 0.4 1.7 1.4 1.4 12.2 12.2 11.4 14.7
BPCL BUY 762 830 8.9 551,207 8,793 723 54.6 59.2 61.4 (2.9) 8.6 3.7 14.0 12.9 12.4 7.7 6.8 6.6 2.5 2.2 2.0 2.1 2.2 2.3 19.0 18.3 16.9 17.3
Cairn India REDUCE 223 250 12.1 417,998 6,668 1,875 36.0 24.3 23.0 (44.7) (32.5) (5.2) 6.2 9.2 9.7 3.9 4.7 4.0 0.7 0.7 0.7 5.0 4.5 4.5 11.6 7.6 6.9 10.0
Castrol India SELL 463 410 (11.4) 228,932 3,652 495 9.6 13.2 14.5 (3.8) 37.9 9.4 48.2 35.0 32.0 31.3 23.0 21.0 46.2 43.4 40.8 1.6 2.3 2.5 76.1 127.9 131.6 2.7
GAIL (India) ADD 381 460 20.7 483,544 7,714 1,268 27.2 26.7 34.1 (16.7) (1.9) 27.8 14.0 14.3 11.2 10.2 9.4 7.3 1.7 1.6 1.4 2.1 2.2 3.1 12.3 11.2 13.3 10.9
GSPL ADD 124 125 0.6 69,950 1,116 563 7.0 8.8 10.0 (6.5) 26.4 14.0 17.8 14.1 12.4 8.1 6.8 6.0 1.9 1.8 1.6 1.1 2.1 3.2 11.3 13.0 13.7 2.7
HPCL REDUCE 615 570 (7.4) 208,374 3,324 339 51.2 63.5 65.1 0.1 24.0 2.5 12.0 9.7 9.5 10.1 7.6 6.8 1.3 1.2 1.1 2.5 3.1 3.2 11.2 12.8 12.1 17.7
IOCL ADD 350 370 5.9 848,691 13,538 2,428 13.2 33.6 36.5 (45.5) 155.2 8.5 26.5 10.4 9.6 13.6 6.2 5.3 1.2 1.1 1.0 1.5 3.3 3.5 4.8 11.4 11.4 5.3
ONGC ADD 302 365 21.0 2,580,336 41,162 8,556 26.3 32.6 38.5 (15.3) 23.9 18.1 11.5 9.3 7.8 4.6 3.7 3.2 1.4 1.3 1.2 3.1 4.1 4.8 12.5 14.4 15.7 25.1
Oil India BUY 468 615 31.3 281,512 4,491 601 47.3 59.1 65.7 (4.6) 25.0 11.2 9.9 7.9 7.1 6.4 5.0 4.5 1.3 1.2 1.1 4.3 5.1 5.8 13.3 15.4 15.8 3.9
Petronet LNG ADD 178 220 23.7 133,350 2,127 750 10.0 11.8 15.0 5.1 17.9 27.7 17.8 15.1 11.8 10.0 8.9 7.2 2.4 2.2 1.9 1.3 1.7 2.2 14.2 15.1 17.3 5.4
Reliance Industries ADD 829 1,000 20.6 2,436,743 38,871 3,233 68.4 73.4 87.4 0.6 7.3 19.1 12.1 11.3 9.5 9.5 8.7 6.0 1.2 1.1 1.0 1.1 1.2 1.5 10.7 10.5 11.4 50.8
Energy Attractive 8,264,814 131,841 (16.0) 17.0 14.9 12.0 10.3 8.9 7.2 5.9 4.8 1.3 1.2 1.1 2.3 2.9 3.3 10.8 11.7 12.4 166.5
Price/BV (X) Dividend yield (%) RoE (%)
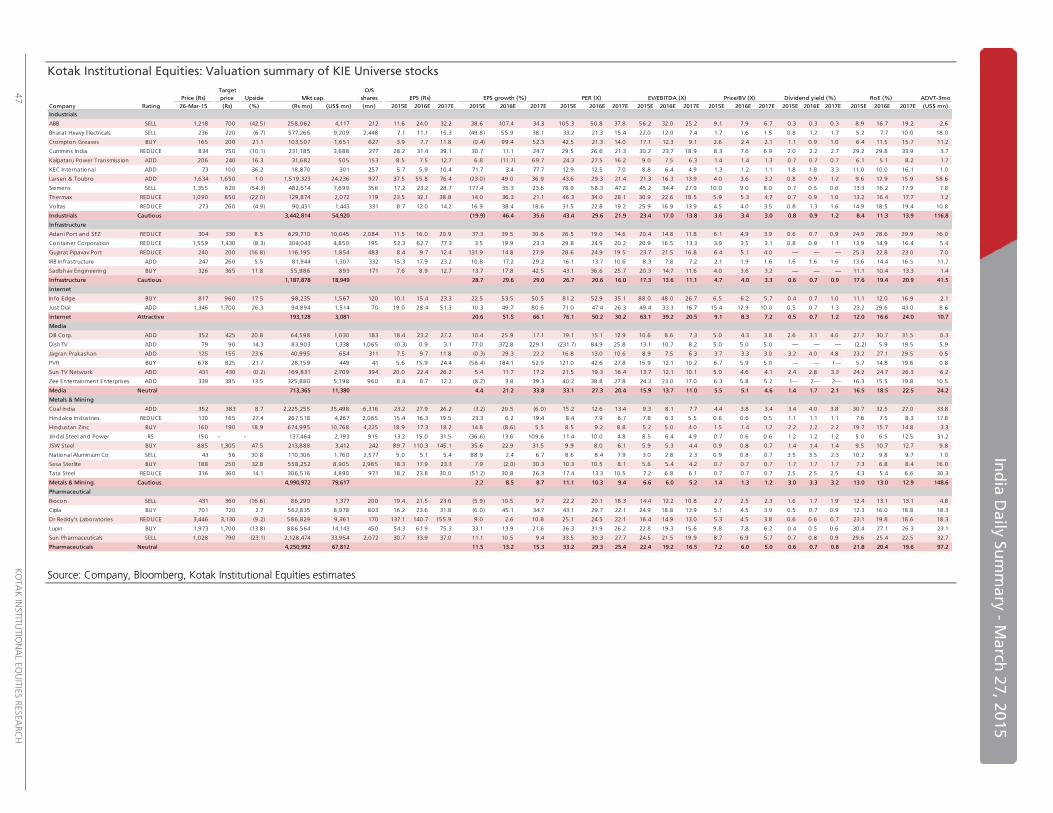
In
dia
Daily
Su
mm
ary
- Ma
rch 2
7, 2
015
47
K
OTA
K IN
STIT
UTIO
NA
L EQ
UIT
IES R
ESEA
RC
H
Kotak Institutional Equities: Valuation summary of KIE Universe stocks
Source: Company, Bloomberg, Kotak Institutional Equities estimates
Target O/S
Price (Rs) price Upside Mkt cap. shares EPS (Rs) EPS growth (%) PER (X) EV/EBITDA (X) ADVT-3mo
Company Rating 26-Mar-15 (Rs) (%) (Rs mn) (US$ mn) (mn) 2015E 2016E 2017E 2015E 2016E 2017E 2015E 2016E 2017E 2015E 2016E 2017E 2015E 2016E 2017E 2015E 2016E 2017E 2015E 2016E 2017E (US$ mn)
Industrials
ABB SELL 1,218 700 (42.5) 258,062 4,117 212 11.6 24.0 32.2 38.6 107.4 34.3 105.3 50.8 37.8 56.2 32.0 25.2 9.1 7.9 6.7 0.3 0.3 0.3 8.9 16.7 19.2 2.6
Bharat Heavy Electricals SELL 236 220 (6.7) 577,266 9,209 2,448 7.1 11.1 15.3 (49.8) 55.9 38.1 33.2 21.3 15.4 22.0 12.0 7.4 1.7 1.6 1.5 0.8 1.2 1.7 5.2 7.7 10.0 18.0
Crompton Greaves BUY 165 200 21.1 103,507 1,651 627 3.9 7.7 11.8 (0.4) 99.4 52.3 42.5 21.3 14.0 17.1 12.3 9.1 2.6 2.4 2.1 1.1 0.9 1.0 6.4 11.5 15.7 11.2
Cummins India REDUCE 834 750 (10.1) 231,185 3,688 277 28.2 31.4 39.1 30.7 11.1 24.7 29.5 26.6 21.3 30.2 23.7 18.9 8.3 7.6 6.9 2.0 2.2 2.7 29.2 29.8 33.9 3.7
Kalpataru Power Transmission ADD 206 240 16.3 31,682 505 153 8.5 7.5 12.7 6.8 (11.7) 69.7 24.3 27.5 16.2 9.0 7.5 6.3 1.4 1.4 1.3 0.7 0.7 0.7 6.1 5.1 8.2 1.7
KEC International ADD 73 100 36.2 18,870 301 257 5.7 5.9 10.4 71.7 3.4 77.7 12.9 12.5 7.0 8.8 6.4 4.9 1.3 1.2 1.1 1.8 1.8 3.3 11.0 10.0 16.1 1.0
Larsen & Toubro ADD 1,634 1,650 1.0 1,519,323 24,236 927 37.5 55.8 76.4 (23.0) 49.0 36.9 43.6 29.3 21.4 21.3 16.3 13.9 4.0 3.6 3.2 0.8 0.9 1.2 9.6 12.9 15.9 58.6
Siemens SELL 1,355 620 (54.3) 482,614 7,699 356 17.2 23.2 28.7 177.4 35.3 23.6 78.9 58.3 47.2 45.2 34.4 27.9 10.0 9.0 8.0 0.7 0.5 0.6 13.3 16.2 17.9 7.8
Thermax REDUCE 1,090 850 (22.0) 129,874 2,072 119 23.5 32.1 38.8 14.0 36.3 21.1 46.3 34.0 28.1 30.9 22.6 18.5 5.9 5.3 4.7 0.7 0.9 1.0 13.2 16.4 17.7 1.2
Voltas REDUCE 273 260 (4.9) 90,431 1,443 331 8.7 12.0 14.2 16.9 38.4 18.6 31.5 22.8 19.2 25.9 16.9 13.9 4.5 4.0 3.5 0.8 1.3 1.6 14.9 18.5 19.4 10.8
Industrials Cautious 3,442,814 54,920 (19.9) 46.4 35.6 43.4 29.6 21.9 23.4 17.0 13.8 3.6 3.4 3.0 0.8 0.9 1.2 8.4 11.3 13.9 116.8
Infrastructure
Adani Port and SEZ REDUCE 304 330 8.5 629,710 10,045 2,084 11.5 16.0 20.9 37.3 39.5 30.6 26.5 19.0 14.6 20.4 14.8 11.8 6.1 4.9 3.9 0.6 0.7 0.9 24.9 28.6 29.9 16.0
Container Corporation REDUCE 1,559 1,430 (8.3) 304,043 4,850 195 52.3 62.7 77.3 3.5 19.9 23.3 29.8 24.9 20.2 20.9 16.5 13.3 3.9 3.5 3.1 0.8 0.9 1.1 13.9 14.9 16.4 5.4
Gujarat Pipavav Port REDUCE 240 200 (16.8) 116,195 1,854 483 8.4 9.7 12.4 131.9 14.8 27.9 28.6 24.9 19.5 23.7 21.5 16.8 6.4 5.1 4.0 — — — 25.3 22.8 23.0 7.0
IRB Infrastructure ADD 247 260 5.5 81,944 1,307 332 15.3 17.9 23.2 10.8 17.2 29.2 16.1 13.7 10.6 8.3 7.8 7.2 2.1 1.9 1.6 1.6 1.6 1.6 13.6 14.4 16.5 11.7
Sadbhav Engineering BUY 326 365 11.8 55,986 893 171 7.6 8.9 12.7 13.7 17.8 42.5 43.1 36.6 25.7 20.3 14.7 11.6 4.0 3.6 3.2 — — — 11.1 10.4 13.3 1.4
Infrastructure Cautious 1,187,878 18,949 28.7 29.6 29.0 26.7 20.6 16.0 17.3 13.6 11.1 4.7 4.0 3.3 0.6 0.7 0.9 17.6 19.4 20.9 41.5
Internet
Info Edge BUY 817 960 17.5 98,235 1,567 120 10.1 15.4 23.3 22.5 53.5 50.5 81.2 52.9 35.1 88.0 48.0 26.7 6.5 6.2 5.7 0.4 0.7 1.0 11.1 12.0 16.9 2.1
Just Dial ADD 1,346 1,700 26.3 94,894 1,514 70 19.0 28.4 51.3 10.3 49.7 80.6 71.0 47.4 26.3 49.4 33.3 16.7 15.4 12.9 10.0 0.5 0.7 1.3 23.2 29.6 43.0 8.6
Internet Attractive 193,128 3,081 20.6 51.5 66.1 76.1 50.2 30.2 63.1 39.2 20.5 9.1 8.3 7.2 0.5 0.7 1.2 12.0 16.6 24.0 10.7
Media
DB Corp. ADD 352 425 20.8 64,598 1,030 183 18.4 23.2 27.2 10.4 25.9 17.1 19.1 15.1 12.9 10.6 8.6 7.3 5.0 4.3 3.8 2.6 3.1 4.0 27.7 30.7 31.5 0.3
DishTV ADD 79 90 14.3 83,903 1,338 1,065 (0.3) 0.9 3.1 77.0 372.8 229.1 (231.7) 84.9 25.8 13.1 10.7 8.2 5.0 5.0 5.0 — — — (2.2) 5.9 19.5 5.9
Jagran Prakashan ADD 125 155 23.6 40,995 654 311 7.5 9.7 11.8 (0.3) 29.3 22.2 16.8 13.0 10.6 8.9 7.5 6.3 3.7 3.3 3.0 3.2 4.0 4.8 23.2 27.1 29.5 0.5
PVR BUY 678 825 21.7 28,159 449 41 5.6 15.9 24.4 (56.4) 184.1 52.9 121.0 42.6 27.8 15.9 12.1 10.2 6.7 5.9 5.0 — — 1— 5.7 14.8 19.6 0.8
Sun TV Network ADD 431 430 (0.2) 169,831 2,709 394 20.0 22.4 26.2 5.4 11.7 17.2 21.5 19.3 16.4 13.7 12.1 10.1 5.0 4.6 4.1 2.4 2.8 3.3 24.2 24.7 26.3 6.2
Zee Entertainment Enterprises ADD 339 385 13.5 325,880 5,198 960 8.4 8.7 12.2 (8.2) 3.8 39.3 40.2 38.8 27.8 24.3 23.0 17.0 6.3 5.8 5.2 1— 2— 2— 16.3 15.5 19.8 10.5
Media Neutral 713,365 11,380 4.4 21.2 33.8 33.1 27.3 20.4 15.9 13.7 11.0 5.5 5.1 4.6 1.4 1.7 2.1 16.5 18.5 22.5 24.2
Metals & Mining
Coal India ADD 352 383 8.7 2,225,255 35,498 6,316 23.2 27.9 26.2 (3.2) 20.5 (6.0) 15.2 12.6 13.4 9.3 8.1 7.7 4.4 3.8 3.4 3.4 4.0 3.8 30.7 32.5 27.0 33.8
Hindalco Industries REDUCE 130 165 27.4 267,518 4,267 2,065 15.4 16.3 19.5 23.3 6.2 19.4 8.4 7.9 6.7 7.8 6.3 5.5 0.6 0.6 0.5 1.1 1.1 1.1 7.6 7.5 8.3 17.8
Hindustan Zinc BUY 160 190 18.9 674,995 10,768 4,225 18.9 17.3 18.2 14.8 (8.6) 5.5 8.5 9.2 8.8 5.2 5.0 4.0 1.5 1.4 1.2 2.2 2.2 2.2 19.7 15.7 14.8 3.3
Jindal Steel and Power RS 150 - - 137,464 2,193 915 13.2 15.0 31.5 (36.6) 13.6 109.6 11.4 10.0 4.8 8.5 6.4 4.9 0.7 0.6 0.6 1.2 1.2 1.2 5.0 6.5 12.5 31.2
JSW Steel BUY 885 1,305 47.5 213,888 3,412 242 89.7 110.3 145.1 35.6 22.9 31.5 9.9 8.0 6.1 5.9 5.3 4.4 0.9 0.8 0.7 1.4 1.4 1.4 9.5 10.7 12.7 9.8
National Aluminium Co. SELL 43 56 30.8 110,306 1,760 2,577 5.0 5.1 5.4 88.9 2.4 6.7 8.6 8.4 7.9 3.0 2.8 2.3 0.9 0.8 0.7 3.5 3.5 2.3 10.2 9.8 9.7 1.0
Sesa Sterlite BUY 188 250 32.8 558,252 8,905 2,965 18.3 17.9 23.3 7.9 (2.0) 30.3 10.3 10.5 8.1 5.6 5.4 4.2 0.7 0.7 0.7 1.7 1.7 1.7 7.3 6.8 8.4 16.0
Tata Steel REDUCE 316 360 14.1 306,516 4,890 971 18.2 23.8 30.0 (51.2) 30.8 26.3 17.4 13.3 10.5 7.2 6.8 6.1 0.7 0.7 0.7 2.5 2.5 2.5 4.3 5.4 6.6 30.3
Metals & Mining Cautious 4,990,972 79,617 2.2 8.5 8.7 11.1 10.3 9.4 6.6 6.0 5.2 1.4 1.3 1.2 3.0 3.3 3.2 13.0 13.0 12.9 148.6
Pharmaceutical
Biocon SELL 431 360 (16.6) 86,290 1,377 200 19.4 21.5 23.6 (5.9) 10.5 9.7 22.2 20.1 18.3 14.4 12.2 10.8 2.7 2.5 2.3 1.6 1.7 1.9 12.4 13.1 13.1 4.8
Cipla BUY 701 720 2.7 562,835 8,978 803 16.2 23.6 31.8 (6.0) 45.1 34.7 43.1 29.7 22.1 24.9 18.8 13.9 5.1 4.5 3.9 0.5 0.7 0.9 12.3 16.0 18.8 18.3
Dr Reddy's Laboratories REDUCE 3,446 3,130 (9.2) 586,829 9,361 170 137.1 140.7 155.9 9.0 2.6 10.8 25.1 24.5 22.1 16.4 14.9 13.0 5.3 4.5 3.8 0.6 0.6 0.7 23.1 19.8 18.6 18.3
Lupin BUY 1,973 1,700 (13.8) 886,564 14,143 450 54.3 61.9 75.3 33.1 13.9 21.6 36.3 31.9 26.2 22.8 19.3 15.6 9.8 7.8 6.2 0.4 0.5 0.6 30.4 27.1 26.3 23.1
Sun Pharmaceuticals SELL 1,028 790 (23.1) 2,128,474 33,954 2,072 30.7 33.9 37.0 11.1 10.5 9.4 33.5 30.3 27.7 24.5 21.5 19.9 8.7 6.9 5.7 0.7 0.8 0.9 29.6 25.4 22.5 32.7
Pharmaceuticals Neutral 4,250,992 67,812 11.5 13.2 15.3 33.2 29.3 25.4 22.4 19.2 16.5 7.2 6.0 5.0 0.6 0.7 0.8 21.8 20.4 19.6 97.2
Price/BV (X) Dividend yield (%) RoE (%)
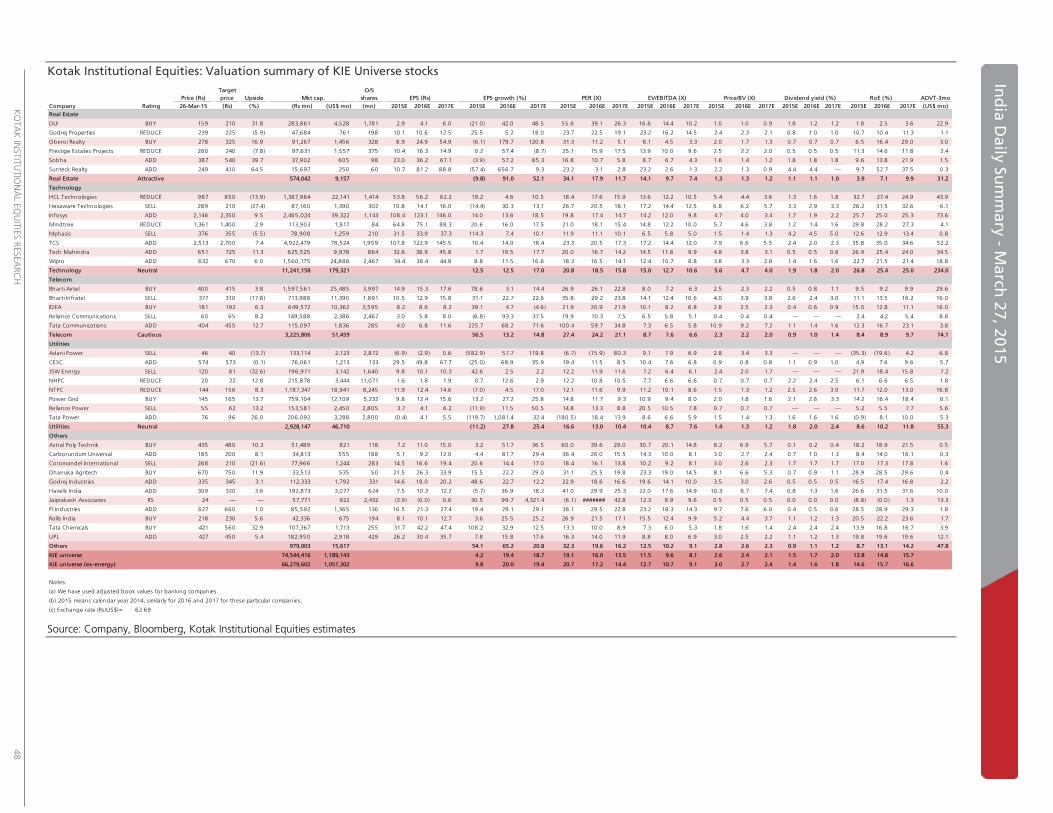
K
OTA
K IN
STIT
UTIO
NA
L EQ
UIT
IES R
ESEA
RC
H
48
In
dia
Da
ily S
um
ma
ry - M
arch
27
, 20
15
Ind
ia D
aily
Su
mm
ary
- Ma
rch 2
7, 2
015
Kotak Institutional Equities: Valuation summary of KIE Universe stocks
Source: Company, Bloomberg, Kotak Institutional Equities estimates
Target O/S
Price (Rs) price Upside Mkt cap. shares EPS (Rs) EPS growth (%) PER (X) EV/EBITDA (X) ADVT-3mo
Company Rating 26-Mar-15 (Rs) (%) (Rs mn) (US$ mn) (mn) 2015E 2016E 2017E 2015E 2016E 2017E 2015E 2016E 2017E 2015E 2016E 2017E 2015E 2016E 2017E 2015E 2016E 2017E 2015E 2016E 2017E (US$ mn)
Real Estate
DLF BUY 159 210 31.8 283,861 4,528 1,781 2.9 4.1 6.0 (21.0) 42.0 48.5 55.6 39.1 26.3 16.6 14.4 10.2 1.0 1.0 0.9 1.8 1.2 1.2 1.8 2.5 3.6 22.9
Godrej Properties REDUCE 239 225 (5.9) 47,684 761 198 10.1 10.6 12.5 25.5 5.2 18.0 23.7 22.5 19.1 23.2 16.2 14.5 2.4 2.3 2.1 0.8 1.0 1.0 10.7 10.4 11.3 1.1
Oberoi Realty BUY 278 325 16.9 91,267 1,456 328 8.9 24.9 54.9 (6.1) 179.7 120.8 31.3 11.2 5.1 8.1 4.5 3.3 2.0 1.7 1.3 0.7 0.7 0.7 6.5 16.4 29.0 3.0
Prestige Estates Projects REDUCE 260 240 (7.8) 97,631 1,557 375 10.4 16.3 14.9 0.2 57.4 (8.7) 25.1 15.9 17.5 13.9 10.0 9.6 2.5 2.2 2.0 0.5 0.5 0.5 11.3 14.6 11.8 2.4
Sobha ADD 387 540 39.7 37,902 605 98 23.0 36.2 67.1 (3.9) 57.2 85.3 16.8 10.7 5.8 8.7 6.7 4.3 1.6 1.4 1.2 1.8 1.8 1.8 9.6 13.8 21.9 1.5
Sunteck Realty ADD 249 410 64.5 15,697 250 60 10.7 81.2 88.8 (57.4) 656.7 9.3 23.2 3.1 2.8 23.2 2.6 1.3 2.2 1.3 0.9 4.4 4.4 — 9.7 52.7 37.5 0.3
Real Estate Attractive 574,042 9,157 (9.8) 91.0 52.1 34.1 17.9 11.7 14.1 9.7 7.4 1.3 1.3 1.2 1.1 1.1 1.0 3.9 7.1 9.9 31.2
Technology
HCL Technologies REDUCE 987 850 (13.9) 1,387,984 22,141 1,414 53.8 56.2 62.2 19.2 4.6 10.5 18.4 17.6 15.9 13.6 12.2 10.5 5.4 4.4 3.6 1.3 1.6 1.8 32.7 27.4 24.9 43.9
Hexaware Technologies SELL 289 210 (27.4) 87,160 1,390 302 10.8 14.1 16.0 (14.4) 30.3 13.1 26.7 20.5 18.1 17.2 14.4 12.5 6.8 6.2 5.7 3.3 2.9 3.3 26.2 31.5 32.6 6.1
Infosys ADD 2,146 2,350 9.5 2,465,024 39,322 1,143 108.4 123.1 146.0 14.0 13.6 18.5 19.8 17.4 14.7 14.2 12.0 9.8 4.7 4.0 3.4 1.7 1.9 2.2 25.7 25.0 25.3 73.6
Mindtree REDUCE 1,361 1,400 2.9 113,903 1,817 84 64.8 75.1 88.3 20.6 16.0 17.5 21.0 18.1 15.4 14.8 12.2 10.0 5.7 4.6 3.8 1.2 1.4 1.6 29.8 28.2 27.3 4.1
Mphasis SELL 376 355 (5.5) 78,908 1,259 210 31.5 33.9 37.3 114.3 7.4 10.1 11.9 11.1 10.1 6.5 5.8 5.0 1.5 1.4 1.3 4.2 4.5 5.0 12.6 12.9 13.4 0.8
TCS ADD 2,513 2,700 7.4 4,922,479 78,524 1,959 107.8 122.9 145.5 10.4 14.0 18.4 23.3 20.5 17.3 17.2 14.4 12.0 7.9 6.6 5.5 2.4 2.0 2.3 35.8 35.0 34.6 52.2
Tech Mahindra ADD 651 725 11.3 625,525 9,978 864 32.6 38.9 45.8 1.7 19.5 17.7 20.0 16.7 14.2 14.5 11.8 9.9 4.8 3.8 3.1 0.5 0.5 0.6 26.9 25.4 24.0 34.5
Wipro ADD 632 670 6.0 1,560,175 24,888 2,467 34.4 38.4 44.8 8.8 11.5 16.6 18.3 16.5 14.1 12.4 10.7 8.8 3.8 3.3 2.8 1.4 1.6 1.6 22.7 21.5 21.4 18.8
Technology Neutral 11,241,158 179,321 12.5 12.5 17.0 20.8 18.5 15.8 15.0 12.7 10.6 5.6 4.7 4.0 1.9 1.8 2.0 26.8 25.4 25.0 234.0
Telecom
Bharti Airtel BUY 400 415 3.8 1,597,561 25,485 3,997 14.9 15.3 17.6 78.6 3.1 14.4 26.9 26.1 22.8 8.0 7.2 6.3 2.5 2.3 2.2 0.5 0.8 1.1 9.5 9.2 9.9 29.6
Bharti Infratel SELL 377 310 (17.8) 713,988 11,390 1,891 10.5 12.9 15.8 31.1 22.7 22.6 35.8 29.2 23.8 14.1 12.4 10.6 4.0 3.9 3.8 2.6 2.4 3.0 11.1 13.5 16.2 16.0
IDEA BUY 181 192 6.3 649,572 10,362 3,595 8.2 8.6 8.2 39.1 4.7 (4.6) 21.9 20.9 21.9 10.1 8.2 6.8 2.8 2.5 2.3 0.4 0.6 0.9 15.0 12.8 11.1 16.0
Reliance Communications SELL 60 65 8.2 149,588 2,386 2,467 3.0 5.8 8.0 (6.8) 93.3 37.5 19.9 10.3 7.5 6.5 5.8 5.1 0.4 0.4 0.4 — — — 2.4 4.2 5.4 8.8
Tata Communications ADD 404 455 12.7 115,097 1,836 285 4.0 6.8 11.6 225.7 68.2 71.6 100.4 59.7 34.8 7.3 6.5 5.8 10.9 9.2 7.2 1.1 1.4 1.6 12.3 16.7 23.1 3.8
Telecom Cautious 3,225,806 51,459 56.5 13.2 14.8 27.4 24.2 21.1 8.7 7.6 6.6 2.3 2.2 2.0 0.9 1.0 1.4 8.4 8.9 9.7 74.1
Utilities
Adani Power SELL 46 40 (13.7) 133,114 2,123 2,872 (6.9) (2.9) 0.6 (582.9) 57.7 119.8 (6.7) (15.9) 80.3 9.1 7.9 6.9 2.8 3.4 3.3 — — — (35.3) (19.6) 4.2 6.8
CESC ADD 574 573 (0.1) 76,061 1,213 133 29.5 49.8 67.7 (25.0) 68.9 35.9 19.4 11.5 8.5 10.4 7.6 6.8 0.9 0.8 0.8 1.1 0.9 1.0 4.9 7.6 9.6 5.7
JSW Energy SELL 120 81 (32.6) 196,971 3,142 1,640 9.8 10.1 10.3 42.6 2.5 2.2 12.2 11.9 11.6 7.2 6.4 6.1 2.4 2.0 1.7 — — — 21.9 18.4 15.8 7.2
NHPC REDUCE 20 22 12.8 215,878 3,444 11,071 1.6 1.8 1.9 0.7 12.6 2.9 12.2 10.8 10.5 7.7 6.6 6.6 0.7 0.7 0.7 2.2 2.4 2.5 6.1 6.6 6.5 1.8
NTPC REDUCE 144 156 8.3 1,187,347 18,941 8,245 11.9 12.4 14.6 (7.0) 4.5 17.0 12.1 11.6 9.9 11.2 10.1 8.6 1.5 1.3 1.2 2.5 2.6 3.0 11.7 12.0 13.0 16.8
Power Grid BUY 145 165 13.7 759,104 12,109 5,232 9.8 12.4 15.6 13.2 27.2 25.8 14.8 11.7 9.3 10.9 9.4 8.0 2.0 1.8 1.6 2.1 2.6 3.3 14.2 16.4 18.4 6.1
Reliance Power SELL 55 62 13.2 153,581 2,450 2,805 3.7 4.1 6.2 (11.9) 11.5 50.5 14.8 13.3 8.8 20.5 10.5 7.8 0.7 0.7 0.7 — — — 5.2 5.5 7.7 5.6
Tata Power ADD 76 96 26.0 206,092 3,288 2,800 (0.4) 4.1 5.5 (119.7) 1,081.4 32.4 (180.5) 18.4 13.9 8.6 6.6 5.9 1.5 1.4 1.3 1.6 1.6 1.6 (0.9) 8.1 10.0 5.3
Utilities Neutral 2,928,147 46,710 (11.2) 27.8 25.4 16.6 13.0 10.4 10.4 8.7 7.6 1.4 1.3 1.2 1.8 2.0 2.4 8.6 10.2 11.8 55.3
Others
Astral Poly Technik BUY 435 480 10.3 51,489 821 118 7.2 11.0 15.0 3.2 51.7 36.5 60.0 39.6 29.0 30.7 20.1 14.8 8.2 6.9 5.7 0.1 0.2 0.4 18.2 18.9 21.5 0.5
Carborundum Universal ADD 185 200 8.1 34,813 555 188 5.1 9.2 12.0 4.4 81.7 29.4 36.4 20.0 15.5 14.3 10.0 8.1 3.0 2.7 2.4 0.7 1.0 1.3 8.4 14.0 16.1 0.3
Coromandel International SELL 268 210 (21.6) 77,966 1,244 283 14.5 16.6 19.4 20.6 14.4 17.0 18.4 16.1 13.8 10.2 9.2 8.1 3.0 2.6 2.3 1.7 1.7 1.7 17.0 17.3 17.8 1.6
Dhanuka Agritech BUY 670 750 11.9 33,513 535 50 21.5 26.3 33.9 15.5 22.2 29.0 31.1 25.5 19.8 23.3 19.0 14.5 8.1 6.6 5.3 0.7 0.9 1.1 28.9 28.5 29.6 0.4
Godrej Industries ADD 335 345 3.1 112,333 1,792 331 14.6 18.0 20.2 48.6 22.7 12.2 22.9 18.6 16.6 19.6 14.1 10.0 3.5 3.0 2.6 0.5 0.5 0.5 16.5 17.4 16.8 2.2
Havells India ADD 309 320 3.6 192,873 3,077 624 7.5 10.3 12.2 (5.7) 36.9 18.2 41.0 29.9 25.3 22.0 17.6 14.9 10.3 8.7 7.4 0.8 1.3 1.6 26.6 31.5 31.6 10.0
Jaiprakash Associates RS 24 — — 57,771 922 2,432 (3.9) (0.0) 0.6 30.5 99.7 4,321.4 (6.1) ####### 42.8 12.3 9.9 9.6 0.5 0.5 0.5 0.0 0.0 0.0 (8.8) (0.0) 1.3 13.3
PI Industries ADD 627 660 1.0 85,592 1,365 136 16.5 21.3 27.4 19.4 29.1 29.1 38.1 29.5 22.8 23.2 18.3 14.3 9.7 7.6 6.0 0.4 0.5 0.6 28.5 28.9 29.3 1.8
Rallis India BUY 218 230 5.6 42,336 675 194 8.1 10.1 12.7 3.6 25.5 25.2 26.9 21.5 17.1 15.5 12.4 9.9 5.2 4.4 3.7 1.1 1.2 1.3 20.5 22.2 23.6 1.7
Tata Chemicals BUY 421 560 32.9 107,367 1,713 255 31.7 42.2 47.4 108.2 32.9 12.5 13.3 10.0 8.9 7.3 6.0 5.3 1.8 1.6 1.4 2.4 2.4 2.4 13.9 16.8 16.7 3.9
UPL ADD 427 450 5.4 182,950 2,918 429 26.2 30.4 35.7 7.8 15.8 17.6 16.3 14.0 11.9 8.8 8.0 6.9 3.0 2.5 2.2 1.1 1.2 1.3 19.8 19.6 19.6 12.1
Others 979,003 15,617 54.1 65.2 20.8 32.3 19.6 16.2 12.5 10.2 9.1 2.8 2.6 2.3 0.9 1.1 1.2 8.7 13.1 14.2 47.8
KIE universe 74,544,416 1,189,143 4.2 19.4 18.7 19.1 16.0 13.5 11.5 9.6 8.1 2.6 2.4 2.1 1.5 1.7 2.0 13.8 14.8 15.7
KIE universe (ex-energy) 66,279,602 1,057,302 9.8 20.0 19.4 20.7 17.2 14.4 12.7 10.7 9.1 3.0 2.7 2.4 1.4 1.6 1.8 14.6 15.7 16.6
Notes:
(a) We have used adjusted book values for banking companies.
(b) 2015 means calendar year 2014, similarly for 2016 and 2017 for these particular companies.
(c) Exchange rate (Rs/US$)= 62.69
Price/BV (X) RoE (%)Dividend yield (%)
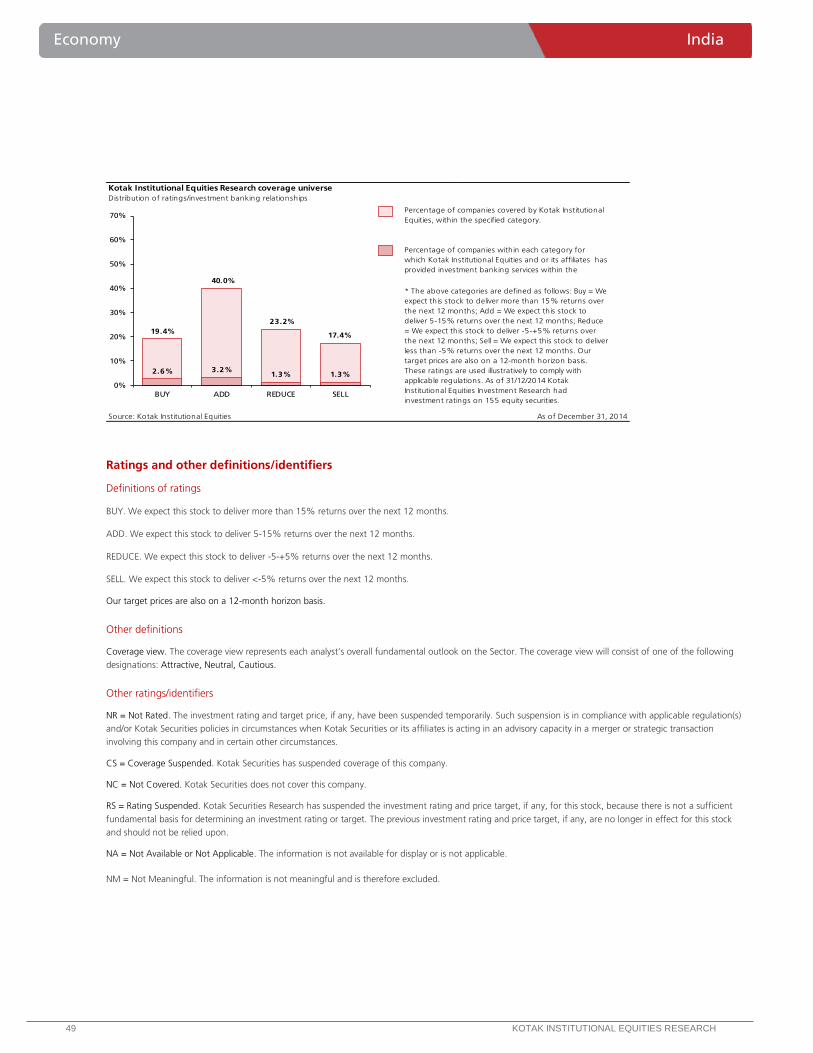
In
dia
Da
ily S
um
ma
ry - M
arch
27
, 20
15
49 KOTAK INSTITUTIONAL EQUITIES RESEARCH
Economy India
Kotak Institutional Equities Research coverage universe
Distribution of ratings/investment banking relationships
Source: Kotak Institutional Equities As of December 31, 2014
Percentage of companies covered by Kotak Institutional
Equities, within the specified category.
Percentage of companies within each category for
which Kotak Institutional Equities and or its affiliates has
provided investment banking services within the
* The above categories are defined as follows: Buy = We
expect this stock to deliver more than 15% returns over
the next 12 months; Add = We expect this stock to
deliver 5-15% returns over the next 12 months; Reduce
= We expect this stock to deliver -5-+5% returns over
the next 12 months; Sell = We expect this stock to deliver
less than -5% returns over the next 12 months. Our
target prices are also on a 12-month horizon basis.
These ratings are used illustratively to comply with
applicable regulations. As of 31/12/2014 Kotak
Institutional Equities Investment Research had
investment ratings on 155 equity securities.
19.4%
40.0%
23.2%
17.4%
2.6% 3.2%1.3% 1.3%
0%
10%
20%
30%
40%
50%
60%
70%
BUY ADD REDUCE SELL
Ratings and other definitions/identifiers
Definitions of ratings
BUY. We expect this stock to deliver more than 15% returns over the next 12 months.
ADD. We expect this stock to deliver 5-15% returns over the next 12 months.
REDUCE. We expect this stock to deliver -5-+5% returns over the next 12 months.
SELL. We expect this stock to deliver <-5% returns over the next 12 months.
Our target prices are also on a 12-month horizon basis.
Other definitions
Coverage view. The coverage view represents each analyst’s overall fundamental outlook on the Sector. The coverage view will consist of one of the following
designations: Attractive, Neutral, Cautious.
Other ratings/identifiers
NR = Not Rated. The investment rating and target price, if any, have been suspended temporarily. Such suspension is in compliance with applicable regulation(s)
and/or Kotak Securities policies in circumstances when Kotak Securities or its affiliates is acting in an advisory capacity in a merger or strategic transaction
involving this company and in certain other circumstances.
CS = Coverage Suspended. Kotak Securities has suspended coverage of this company.
NC = Not Covered. Kotak Securities does not cover this company.
RS = Rating Suspended. Kotak Securities Research has suspended the investment rating and price target, if any, for this stock, because there is not a sufficient
fundamental basis for determining an investment rating or target. The previous investment rating and price target, if any, are no longer in effect for this stock
and should not be relied upon.
NA = Not Available or Not Applicable. The information is not available for display or is not applicable.
NM = Not Meaningful. The information is not meaningful and is therefore excluded.


![[Kotak] India Daily, February 12, 2018 - Kotak Securities](https://static.cupdf.com/doc/110x72/631ae55ac51d6b41aa050374/kotak-india-daily-february-12-2018-kotak-securities.jpg)


![[Kotak] India Daily, October 16, 2015 - Kotak Securities](https://static.cupdf.com/doc/110x72/6328fa4009048e4b7c0629ed/kotak-india-daily-october-16-2015-kotak-securities.jpg)