Improving Energy Efficiency in Buildings using Machine Intelligence
Javier Sedano1, José Ramón Villar2, Leticia Curiel3, Enrique de la Cal2, Emilio Corchado3
1Department of Electromechanical Engineering. University of Burgos,
Burgos, Spain 2Department of Computer Science, University of Oviedo, Spain.
3Department of Civil Engineering, University of Burgos, Burgos, Spain.
emails:[email protected], [email protected], [email protected], [email protected], [email protected]
Abstract. Improving the detection of thermal insulation in buildings –which includes the development of models for heating and ventilation processes and fabric gain - could significantly increase building energy efficiency and substantially contribute to reductions in energy consumption and in the carbon footprints of domestic heating systems. Thermal insulation standards are now contractual obligations in new buildings, although poor energy efficiency is often a defining characteristic of buildings built before the introduction of those standards. Lighting, occupancy, set point temperature profiles, air conditioning and ventilation services all increase the complexity of measuring insulation efficiency. The identification of thermal insulation failure can help to reduce energy consumption in heating systems. Conventional methods can be greatly improved through the application of hybridized machine learning techniques to detect thermal insulation failures when a building is in operation. A three-step procedure is proposed in this paper that begins by considering the local building and heating system regulations as well as the specific features of the climate zone. Firstly, the dynamic thermal performance of different variables is specifically modelled, for each building type and climate zone. Secondly, Cooperative Maximum-Likelihood Hebbian Learning is used to extract the relevant features. Finally, neural projections and identification techniques are applied, in order to detect fluctuations in room temperatures and, in consequence, thermal insulation failures. The reliability of the proposed method is validated in three winter zone C cities in Spain. Although a great deal of further research remains to be done in this field, the proposed system is expected to outperform conventional methods described in Spanish building codes that are used to calculate energetic profiles in domestic and residential buildings.
1 Introduction
Machine Intelligence represents a collection or a set of various technologies involving non-linear dynamics, computational intelligence, ideas drawn from physics, physicology and several other computational frameworks. It investigates, simulates,
2 Javier Sedano, José R. Villar, Leticia Curiel, Enrique de la Cal and Emilio Corchado
and analyzes very complex issues and phenomena in order to solve real-world problems: one such problem is the detection of thermal insulation failure in buildings [1], [2], which requires a multidisciplinary approach [3].
On the one hand, local building regulations need to be analysed in order to profile the premises and the legal specifications for the physical parameters. In the case of a European country such as Spain, building and heating system regulations are adapted to five winter climate zones and five summer climate zones across the entire country. Building materials, insulation widths, materials, and so on, are calculated according to these <winter-zone, summer-zone> parameters. Further market-related factors should also be included: the geometric design and orientation of a building, aesthetic aspects and its internal layout, all of which have a significant impact on thermal dynamics. Taken together, they define what is known as the topology of the building. Nevertheless, predicting the thermal dynamics of a building is a complex task. The dynamic thermal performance of a building has mainly been used to estimate its power requirements. As an example, the difficulties of obtaining a black-box model for a generic building are documented in [4]. The influence of thermal efficiency is also analysed for a specific building component in [5], which examines the dynamic thermal performance of an aluminium roof and compares it with standard roofing materials.
A three-step procedure for testing and validating the model is proposed: firstly, the dynamic thermal behaviour of a specific configuration is calculated using HTB2 software [6]. The outcome of the HTB2 should then be post-processed to obtain a suitable dataset. Subsequently, the dataset is analysed using Cooperative Maximum-Likelihood Hebbian Learning (CMLHL) [7] to extract the dataset structure and key relationships between the variables. A model is then produced, at the modelling stage, to estimate the room temperature at a specific configuration. Finally, thermal insulation failure is identified when the temperature error, measured as the difference between the room temperature and the model output temperature, rises above a pre-set threshold.
This paper is organised as follows. Section 2 introduces the unsupervised connectionist techniques for analysing the datasets in order to extract their relevant internal structures. Section 3 deals with classical identification techniques used in the system modelling. Section 4 describes the problem details and the multi-step procedure. Finally, the conclusions are set out and comments are made on future lines of work.
2 System Analyses Using Unsupervised Learning
2.1. Data structure analysis using connectionist techniques
CMLHL [7] is used in this research to analyse the internal structure of datasets that describe the heating process, so as to establish whether it is “sufficiently informative”.
Improving Energy Efficiency in Buildings using Machine Intelligence 3
In the worse case, the experiments have to be performed again in order to gather a sufficiently informative dataset.
CMLHL is a Exploratory Projection Pursuit (EPP) method [8], [9], [10]. In general, EPP provides a linear projection of a dataset, but it projects the data onto a set of basic vectors which help reveal the most interesting data structures; interestingness is usually defined in terms of how far removed the distribution is from the Gaussian distribution [11].
One connectionist implementation is Maximum-Likelihood Hebbian Learning (MLHL) [10], [12]. It identifies interestingness by maximising the probability of the residuals under specific probability density functions that are non-Gaussian. An extended version is the CMLHL [7], [13] model, which is based on MLHL [10], [12] but adds lateral connections [7], [13] that have been derived from the Rectified Gaussian Distribution [11].
Considering an N-dimensional input vector ( x ), and an M-dimensional output vector ( y ), with ijW being the weight (linking input j to output i), then CMLHL can be expressed [7] as: 1. Feed-forward step:
ixWy1j
jiji ∀=∑=
N
, . (1)
2. Lateral activation passing: ( ) ( )[ ]+−+=+ Aybτ(t)yty ii 1 . (2)
3. Feedback step:
∑=
∀−=M
iiijjj jyWxe
1
, . (3)
4. Weight change: ( ) 1||.. −=Δ p
jjiij eesignyW η . (4)
Where: η is the learning rate,τ is the "strength" of the lateral connections, b the bias parameter, p a parameter related to the energy function [10], [12] and A a symmetric matrix used to modify the response to the data [11]. The effect of this matrix is based on the relation between the distances separating the output neurons.
2.2. Feature selection and extraction
Feature Selection and extraction [14], [15] entails feature construction, space dimensionality reduction, sparse representations and feature selection among others. They are all commonly used pre-processing tools in machine learning tasks, which include pattern recognition. Although researchers have grappled with such problems for many years, renewed interest has recently surfaced in feature extraction.
Our approach to feature selection in this study is based on the dimensionality reduction issue. Initially, we use the projection method CMLHL [7], [13], characterized by its capability to impose a sparser representation of each weight vector than other methods such as PCA [16], [17] or MLHL [10], [12] and its ability
4 Javier Sedano, José R. Villar, Leticia Curiel, Enrique de la Cal and Emilio Corchado
to preserve a degree of global ordering [13], due to the effect of the lateral connections.
3 System Modelling Using Classical Identification Algorithms
3.1. The ANN in the identification process
The identification criterion consists in evaluating the best adapted group of candidate models that best describes the dataset gathered for the experiment; i.e., given a certain model )( *θM , its prediction error may be defined as in Eq. (5). The aim is to obtain a model that complies with the following premise [18]: a good model is one that makes good predictions, and which produces small errors when the observed data is applied.
)|(ˆ)(),( ** θθε tytyt −= (5)
The use of Artificial Neural Networks (ANN) in the process of identification requires the selection of several parameters: the number of layers, the number of neurons per layer and the activation functions. The methods by which the parameters are set up are fully documented in the literature. It was found that ANN with two layers using sigmoidal or hyperbolic functions in the hidden layer are universal approximators or predictors [19], [20].
The number of neurons per layer is also a relevant design parameter. It should be analyzed in order to avoid over fitting [21], [22]. Each algorithm will introduce some restrictions in the weight matrix. The most widely used training algorithms in system identification are the Lenvenberg-Marquardt method [23], recursive Gauss-Newton method [18], the batch and recursive versions of the back-propagation algorithm [24].
3.2. The process of identification
When using ANN, the purpose of an identification process is to determine the weight matrix based on the observations tZ , so as to obtain the relationships between the nodes in the network. The weight matrix is usually referred as w, W or θ.
The supervised learning algorithm is then applied to find the estimator θ, so as to obtain the identification criterion. Several well-known model structures are used when merging system identification with ANN. If the ARX model is used as the regression vector θ, the model structure is called NNARX, as can be seen in Eq. (6). NNARX stands for neural network ARX. Likewise, NNFIR, Eq. (7), NNARMAX, Eq. (8) and NNOE structures, Eq. (9), are also extensively used. The polynomial degree values -na, nb, nc, nd, nf and nk- are given as parameters.
Improving Energy Efficiency in Buildings using Machine Intelligence 5
[ ]Tkbka nntuntuntytyt )1()()()1()( +−−−−−= KKϕ . (6)
[ ]Tkbk nntuntut )1()()( +−−−= Kϕ . (7)
[ ]Tckbka ntetenntuntuntytyt )()1()1()()()1()( −−+−−−−−= KKKϕ (8)
[ ]Tkbka nntuntuntytyt )1()()|(ˆ)|1(ˆ)( +−−−−−= KK θθϕ (9)
3.3. The system identification methodology
The best model for estimating the thermodynamic conditions must be chosen. The identification procedure used to generate the final model entails setting the identification techniques [18], [25], [26], selecting the model structure, estimating the most appropriate polynomial degree, the identification criterion, and the optimization techniques.
The identification procedure also includes a validation stage, which ensures that the selected model meets the necessary conditions for estimation and prediction. In order to validate the model, three tests were performed: residual analysis ))(ˆ,( tt θε , by means of a correlation test between inputs, residuals and their combinations; final prediction error (FPE) estimate as explained by Akaike and finally a graphical comparison between desired outputs and the outcome of the models through simulation one (or k) steps before.
4 The multi-step method for detecting thermal insulation failures in buildings
A three-step method is proposed to detect thermal insulation failures in buildings –by modelling fabric gain, heating and ventilation process. Firstly, a model of a building’s dynamic thermal performance in normal operation is determined. Once the thermodynamic data have been gathered, then a model for normal operation may be obtained. The second stage includes the use of CMLHL to extract features from the thermodynamic data using relevant information from the process. The CMLHL output data set is used as input to obtain the most suitable model, which is found by means of system identification techniques. Finally, thermal insulation failures can be detected using this model whenever significant fluctuations in room temperature are identified.
4.1. Thermal dynamics data gathering by means of simulation
Two methods are used to collect thermodynamic data on a building: either through a network of sensors placed in spaces of scale-model or actual building to measure the desired variables; or by using specific thermodynamic simulation software [6]. This
6 Javier Sedano, José R. Villar, Leticia Curiel, Enrique de la Cal and Emilio Corchado
second choice is more suitable than physical modelling due to its flexibility and scalable solutions, which save on resources.
In order to simulate the thermal behaviour of a building, the following data and data sets should be gathered: building topology; climate zone; meteorological data for the climate zone and the simulated time period; building materials that comply with local regulations for the chosen climate zone; realistic profiles for heating, lighting, small power devices, occupancy and ventilation.
Having defined and/or gathered these data sets, then the chosen simulation tool is applied to obtain the output data. This output includes data on the evolution of the indoor temperature and heating power for each space in the building according to the building operation. The typical values that each variable could take for a C winter climate zone of medium severity in Spain –i.e. the cities of Santander, Bilbao or Barcelona - are shown in Table 1.
Table 1. Typical values of each variable in a C winter climate zone city in Spain.
4.2. Extraction of the relevant internal structures
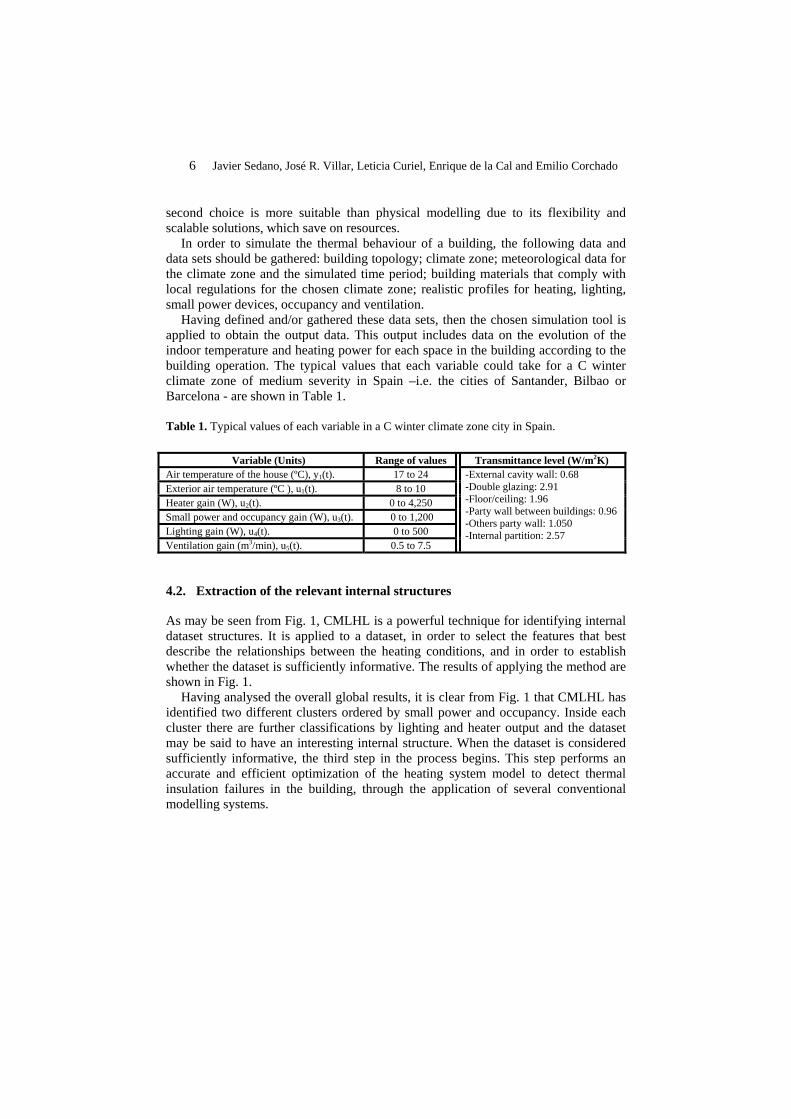
As may be seen from Fig. 1, CMLHL is a powerful technique for identifying internal dataset structures. It is applied to a dataset, in order to select the features that best describe the relationships between the heating conditions, and in order to establish whether the dataset is sufficiently informative. The results of applying the method are shown in Fig. 1.
Having analysed the overall global results, it is clear from Fig. 1 that CMLHL has identified two different clusters ordered by small power and occupancy. Inside each cluster there are further classifications by lighting and heater output and the dataset may be said to have an interesting internal structure. When the dataset is considered sufficiently informative, the third step in the process begins. This step performs an accurate and efficient optimization of the heating system model to detect thermal insulation failures in the building, through the application of several conventional modelling systems.
Variable (Units) Range of values Transmittance level (W/m2K) Air temperature of the house (ºC), y1(t). 17 to 24 Exterior air temperature (ºC ), u1(t). 8 to 10 Heater gain (W), u2(t). 0 to 4,250 Small power and occupancy gain (W), u3(t). 0 to 1,200 Lighting gain (W), u4(t). 0 to 500 Ventilation gain (m3/min), u5(t). 0.5 to 7.5
-External cavity wall: 0.68 -Double glazing: 2.91 -Floor/ceiling: 1.96 -Party wall between buildings: 0.96 -Others party wall: 1.050 -Internal partition: 2.57
Improving Energy Efficiency in Buildings using Machine Intelligence 7
Fig. 1. The CMLHL projection shows the internal structure of a dataset.
4.3. System identification applied to model normal building operation
Once the relevant variables and their transformations have been extracted from the thermal dynamics data, then a model to fit the normal building operation should be obtained in order to identify bias in the room temperature, which is in the end used for failure detection. The different model learning methods used were implemented in Matlab© [27]. The experiment followed the identification procedure detailed in Section 3.3: the model structures were analyzed in order to obtain the models that best suited the dataset. The Akaike Information Criterion (AIC) was used to obtain the best degree of the model and its delay for each model structure. A total of 70 techniques were carried out to obtain the models. Several different indexes have been used to validate the obtained models. The indexes are well-known and widely used measures in system identification [18], [25], [26]:
- The percentage representation of the estimated model: calculated as the normalized mean error for the one-step prediction (FIT1), for the ten-step prediction (FIT10) and with the ∞-step prediction (FIT). The FIT is widely used as a simulation technique in classical system identification.
- The graphical representation of the FIT1 – )|(ˆ1 mty –, the FIT10 – )|(ˆ10 mty – and the FIT – )|(ˆ mty∞ –.
- The loss function or error function (V): the numeric value of the mean square error that is computed using the estimation dataset.
- The generalization error value (NSSE): the numeric value of the mean square error that is computed with the validation dataset.
- The FPE calculated as the average generalization error value computed with the estimation dataset.
The heating process exhibits nonlinear behaviour between output and inputs, with the result that linear modelling techniques do not behave in an orthodox way except in the linear behaviour zones of the process. Consequently, the heating process has been modelled using soft-computing techniques, specifically an ANN.
Thus, an ANN was used to monitor the thermal dynamics of the building. The objective was to find the best suite of polynomial model orders [na nb1 nb2 nb3 nb4 nb5 nc nd nf nk1 nk2 nk3 nk4 nk5]. Using the data set from the previous stage and the Optimal
Ligthing
Smallpower
Heater Output
8 Javier Sedano, José R. Villar, Leticia Curiel, Enrique de la Cal and Emilio Corchado
Brain Surgeon (OBS) [19], [20] network pruning strategy to remove superfluous weights, the best suite model was found from the residual analysis. Table 2 shows the characteristics and qualities of estimation and prediction of the chosen ANN, along with their indexes.
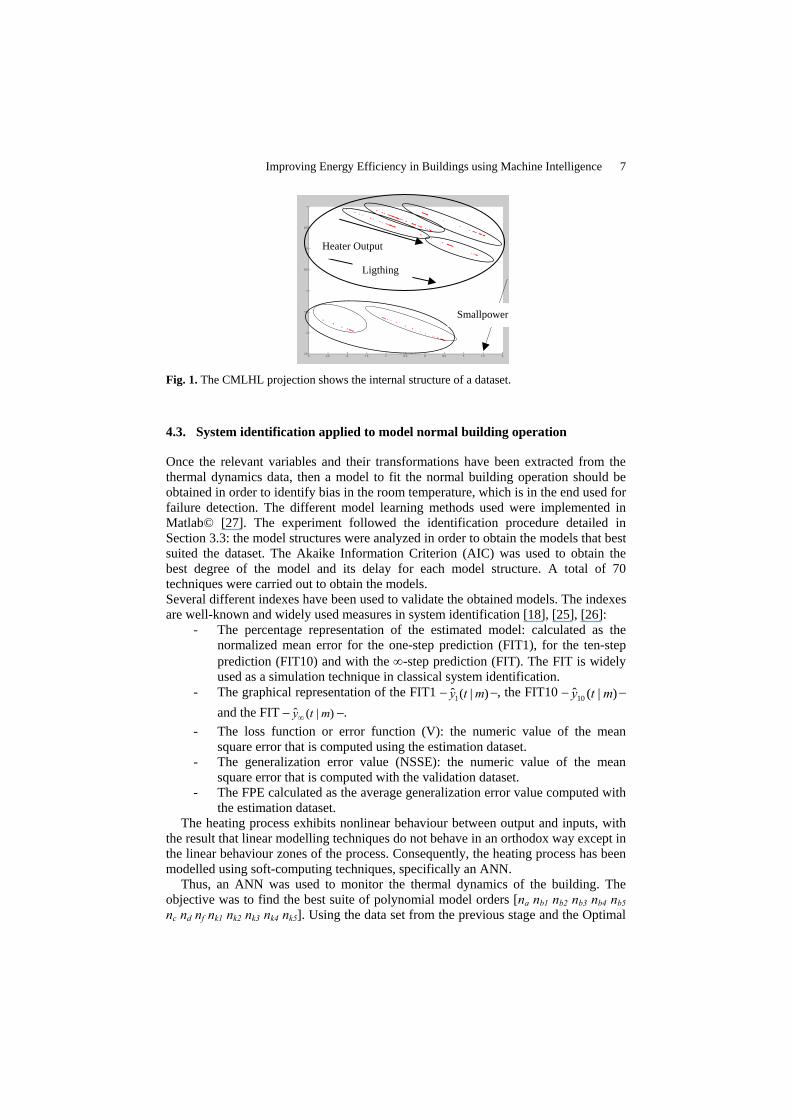
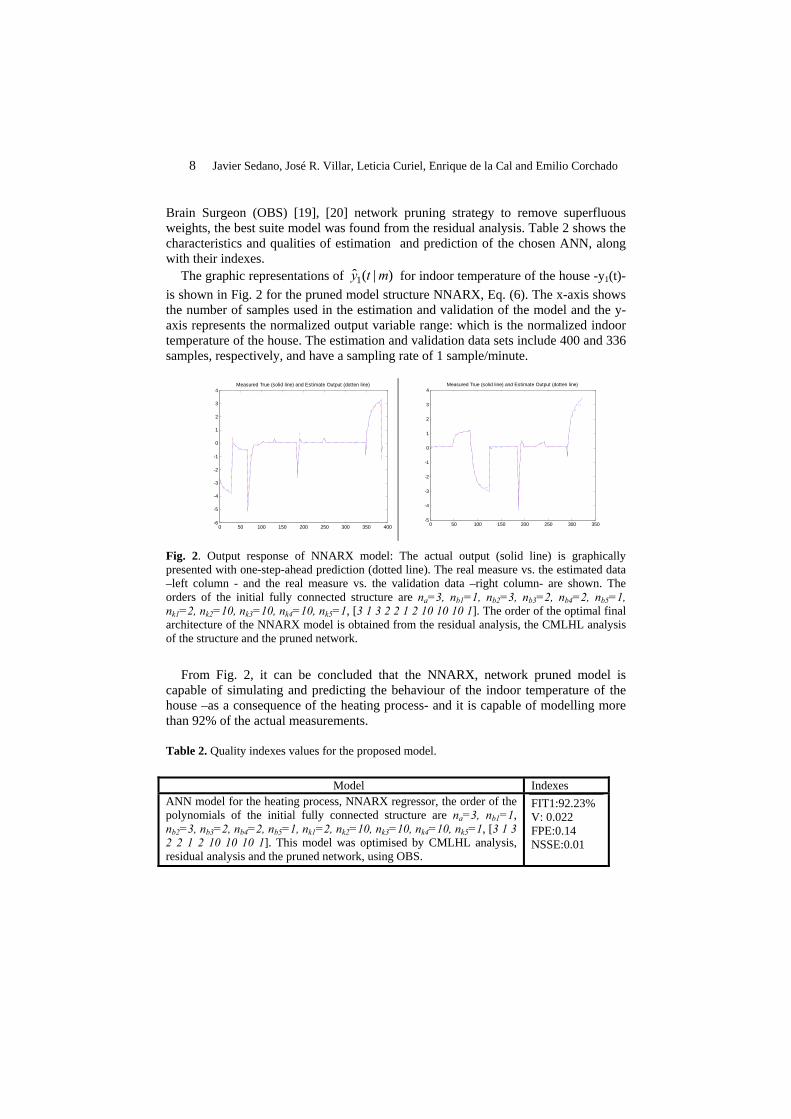
The graphic representations of )|(ˆ1 mty for indoor temperature of the house -y1(t)- is shown in Fig. 2 for the pruned model structure NNARX, Eq. (6). The x-axis shows the number of samples used in the estimation and validation of the model and the y-axis represents the normalized output variable range: which is the normalized indoor temperature of the house. The estimation and validation data sets include 400 and 336 samples, respectively, and have a sampling rate of 1 sample/minute.
0 50 100 150 200 250 300 350 400-6
-5
-4
-3
-2
-1
0
1
2
3
4Measured True (solid line) and Estimate Output (dotten line)
0 50 100 150 200 250 300 350-5
-4
-3
-2
-1
0
1
2
3
4Measured True (solid line) and Estimate Output (dotten line)
Fig. 2. Output response of NNARX model: The actual output (solid line) is graphically presented with one-step-ahead prediction (dotted line). The real measure vs. the estimated data –left column - and the real measure vs. the validation data –right column- are shown. The orders of the initial fully connected structure are na=3, nb1=1, nb2=3, nb3=2, nb4=2, nb5=1, nk1=2, nk2=10, nk3=10, nk4=10, nk5=1, [3 1 3 2 2 1 2 10 10 10 1]. The order of the optimal final architecture of the NNARX model is obtained from the residual analysis, the CMLHL analysis of the structure and the pruned network.
From Fig. 2, it can be concluded that the NNARX, network pruned model is
capable of simulating and predicting the behaviour of the indoor temperature of the house –as a consequence of the heating process- and it is capable of modelling more than 92% of the actual measurements.
Table 2. Quality indexes values for the proposed model.
Model Indexes ANN model for the heating process, NNARX regressor, the order of the polynomials of the initial fully connected structure are na=3, nb1=1, nb2=3, nb3=2, nb4=2, nb5=1, nk1=2, nk2=10, nk3=10, nk4=10, nk5=1, [3 1 3 2 2 1 2 10 10 10 1]. This model was optimised by CMLHL analysis, residual analysis and the pruned network, using OBS.
FIT1:92.23% V: 0.022 FPE:0.14 NSSE:0.01
Improving Energy Efficiency in Buildings using Machine Intelligence 9
5 Conclusions and future work
Effective thermal insulation is an essential component of energy efficient heating systems in buildings. The more effective the insulation in the buildings, the lower the energy losses due to insulation failures. Thus, the possibility of improving the detection of thermal insulation failures represents a fresh challenge for building energy management. The new methodology proposed in this study for detecting thermal insulation failures entails either a network of sensors in the building or specialized simulation software in cases where no such network is available. Finally, different techniques are applied to obtain a suitable model which will be responsible for detecting the failures as a fluctuation of predicted room temperature. Future work will examine fabric gain and ventilation processes in order to develop generic methods.
Acknowledgments.
We would like to extend our thanks to Phd. Magnus Nørgaard for his marvellous freeware version of Matlab Neural Network Based System Identification Toolbox. This research has been partially supported through projects BU006A08 of the JCyL and project CIT-020000-2008-2 of the Spanish Ministry of Education and Innovation. The authors would also like to thank the vehicle interior manufacturer, Grupo Antolin Ingenieria, S.A., within the framework of project MAGNO2008 - 1028.- CENIT also funded by the same Government Ministry.
References
1. Han, J., Lua, L. and Yang, H.: Investigation on the thermal performance of different lightweight roofing structures and its effect on space cooling load, Applied Thermal Engineering, Volume 29 (11-12), pp. 2491-2499, (2009).
2. Yu, J., Yang, C., Tian, L. and Liao, D.: Evaluation on energy and thermal performance for residential envelopes in hot summer and cold winter zone of China, Applied Energy Volume 86 (10), pp. 1970-1985, (2009).
3. Villar, J. R., de la Cal, E., Sedano, J.: A Fuzzy Logic Based Efficient Energy Saving Approach for Domestic Heating Systems, Integrated Computer Aided Engineering 16 (2), pp. 151-163 (2009).
4. Villar, J. R., de la Cal, E. and Sedano, J.: Minimizing energy consumption in heating systems under uncertainty, Lecture Notes in Artificial Intelligence 5271, pp. 583–590, (2008).
5. De la Cal, E., Villar, J. R. and Sedano, J.: A thermodynamical model study for an energy saving algorithm, to be published in Lecture Notes in Artificial Intelligence, (2009).
6. Lewis, P. T. and Alexander, D. K.: Htb2: A flexible model for dynamic building simulation, Building and Environment, 1, pp. 7-16, (1990).
7. Corchado E. and Fyfe C.: Connectionist Techniques for the Identification and Suppression of Interfering Underlying Factors. Int. Journal of Pattern Recognition and Artificial Intelligence, 17(8), pp. 1447-1466, (2003).
10 Javier Sedano, José R. Villar, Leticia Curiel, Enrique de la Cal and Emilio Corchado
8. Friedman, J.H. and Tukey, J.W.: Projection Pursuit Algorithm for Exploratory Data-Analysis, IEEE Transactions on Computers, 23(9), pp. 881-890, (1974).
9. Diaconis, P. and Freedman, D.: Asymptotics of Graphical Projections, The Annals of Statistics, 12(3), pp. 793-815, (1984.).
10. Corchado, E., MacDonald, D. and Fyfe, C.: Maximum and Minimum Likelihood Hebbian Learning for Exploratory Projection Pursuit. Data Mining and Knowledge Discovery, 8(3), pp. 203-225, (2004).
11. Seung, H.S., Socci, N.D. and Lee, D.: The Rectified Gaussian Distribution, Advances in Neural Information Processing Systems, 10, pp. 350-356, (1998).
12. Fyfe, C. and Corchado, E.: Maximum Likelihood Hebbian Rules, Proc. of the 10th European Symposium on Artificial Neural Networks (ESANN 2002), pp. 143-148, (2002).
13. Corchado,E., Han, Y. and Fyfe, C.: Structuring Global Responses of Local Filters Using Lateral Connections, Journal of Experimental & Theoretical Artificial Intelligence, 15(4), pp. 473-487, (2003).
14. Guyon, I. and Elisseeff, A.: An introduction to variable and feature selection. Journal of Machine Learning Research, Special Issue on variable and Feature Selection 3, pp. 1157-1182, (2003).
15. Liu, H. and Yu, L.: Toward integrating feature selection algorithms for classification and clustering. IEEE Knowledge and Data Engineering, IEEE Transactions on 17(4), pp. 491-502, (2005).
16. Pearson, K.: On Lines and Planes of Closest Fit to Systems of Points in Space, Philosophical Magazine, 2(6), pp. 559-572, (1901).
17. Hotelling, H.: Analysis of a Complex of Statistical Variables Into Principal Components, Journal of Education Psychology, 24, pp. 417-444, (1933).
18. Ljung, L.: System Identification, Theory for the User. Upper Saddle River, NJ 07458, USA, second edition Prentice-Hall, ISBN 0-13-656695-2, (1999).
19. Cybenko, G.: Aproximation by superpositions of sigmoidal function, Math. Control, Sygnals and System, 2(4), pp. 473-487, pp. 303-314, (1989).
20. Hornik, K., Stinchcombe, M. and White H.: Multilayer Feedforward Networks are Universal Aproximators, Neural Networks, 2(5), pp. 359-366, (1989).
21. Hansen, L.K. and Pedersen, M. W.: Controlled Growth of Cascade Correlation Nets, Proc. ICANN 94, Sorrento, Italia, Eds. M. Marinaro & P.G. Morasso, pp. 797-800, (1994).
22. Hassibi, B. and Stork D.G.: Second Order Derivatives for Network Pruning: Optimal Brain Surgeon, Advances in neural Information Processing System 5, Eds. S.J. Hanson et al., Proceedings of the 1992 Conference, San Mateo, CA. Morgan Kaufmann, pp. 164-171 (1993).
23. Fletcher, R.: Practical Methods of Optimization, Wiley & Sons, Chichester, 2nd edition, (1987).
24. Hertz, J., Krogh, A. and Palmer, R.G.: Introduction to the Theory of Neural Computation, Addison-Wesley, (1991).
25. Nögaard, M., Ravn, O., Poulsen, N. K. and Hansen, L. K.: Neural Networks for Modelling and Control of Dynamic Systems, Springer-Verlag, London, U.K., (2000).
26. Söderström, T. and Stoica, P.: System identification, Englewood Cliffs, NJ: Prentice Hall, (1989).
27. Nørgaard, M.: Neural network Based System Identification Toolbox, Report Technical Tecnico 00-E-891, Department de Automation Technical University of Denmark, (2000).