STRONG FUTURE.IMPROVING CAPITAL EFFICIENCIES.SOLID BALANCE SHEET.
MULTI-YEAR INVENTORY.
HIGHLIGHTS 04LETTER TO SHAREHOLDERS 08
RESERVES SUMMARY 12MANAGEMENT’S DISCUSSION AND ANALYSIS 19
INDEPENDENT AUDITORS’ REPORT 47FINANCIAL STATEMENTS 48
NOTES TO THE FINANCIAL STATEMENTS 52CORPORATE INFORMATION 76
DeeThree’s improved capital and operating efficiencies, strong balance sheet and massive inventory of
multi-zone drilling opportunities solidly position the Company to navigate through the current
commodity price weakness. DeeThree’s $160 million 2015 capital program will
increase average production to approximately 13,300 boe per day
while conserving the balance sheet and maintaining
financial flexibility.
ANNUAL REPORT2014

13Consecutive quarters of production growth through Q4 2014
39.4 Proved + probable reserves at year-end 2013
M I L L I O N B O E
51.8 FERGUSONProved + probable reserves at year-end 2014
M I L L I O N B O E
Gas injection EOR scheme mitigates declines and increases oil recoveries
Focused horizontal drilling in DeeThree Exploration Ltd.’s two core areas drove 58 percent year-over-year growth in average daily production, to 11,325 boe per day (80 percent oil and natural gas liquids) in 2014. Reducing technical risks and further refining our well drilling and completions processes improved per-well results and lifted operating netbacks. In 2014, DeeThree again recorded some of the best on-stream results for new oil wells drilled in western Canada. The average netback increased by over 12 percent, from $40.50 per boe in 2013 to $45.16 per boe in 2014, despite softening commodity prices toward year-end.
IMPROVING CAPITAL EFFICIENCIES
ALBERTA BAKKEN GAS INJECTION EOR SCHEME MODEL AREA
Oil Production (bbls/d) Gas Injection (mcf/d)
5,000 35
4,500
4,000
3,500
0 0
5005
1,000
101,500
152,000
20
Wel
l Cou
nt
2,500
25
3,000
30
Q2 2013 Q3 2013 Q4 2013 Q1 2014 Q2 2014 Q4 2014Q3 2014 Q1 2015
1415
1617
1819
2021
2223
24
25
2627
28
29 29

1
BRAZEAUSignificant pool extensions in the prolific Belly River C and D zones at Brazeau
New 12,000 bbl/d central oil battery improves operating efficiency
DTX .TO ANNUAL REPORT
2014
BRAZEAU BELLY RIVER – IMPROVING CAPITAL EFFICIENCIES
Drilling & Completion Costs ($ per boe/d of new production added*)
* Excludes tie-in costs
Average per well IP365 (boe/d)
50,000$
40,000
45,000
35,000
2012 2014 2015 Target2013
30,000
25,000
20,000
15,000
5,000
10,000
0
250
200
150
100
50
0

DTX .TO ANNUAL REPORT2014
2
A V E R A G E W E L L D R I L L E D A T B R A Z E A U I N 2 0 1 4 ( B O E / D )
B E S T W E L L A T B R A Z E A U I N 2 0 1 4 ( B O E / D )
672 30-day IP
1,24930-day IP
557 60-day IP
1,01460-day IP
90-day IP500
90-day IP900
HOW WE HAVE IMPROVED CAPITAL EFFICIENCIESImproved Per-Well Results: the Key to Capital and Operating EfficienciesDEETHREE MADE CAPITAL EFFICIENCIES A HIGH PRIORITY LONG BEFORE COMMODITY PRICES SOFTENED.
Seeking to build shareholder value for the long term, we worked hard to increase the reserves and production impact of each dollar of capital invested at both core areas. Many separate measures contributed. Longer-leg horizontal wells with more fracturing stages and heavier tonnage. Lowering geological risk as pool areas became delineated. State-of-the-art drilling tools to stay in the target reservoir and maximize the length of horizontal reservoir pay. Drilling multiple wells per pad to exploit common infrastructure.
THE RESULTS ARE CLEAR: HIGHER AVERAGE INITIAL PRODUCTIVITY PER WELL AND LOWER COST PER BOE OF DAILY PRODUCTION ADDED.
Brazeau Belly River SandsAt Brazeau, we completed numerous two-mile-long (or >10,000-foot) horizontal well legs in 2014, placing up to 950 tonnes of sand over 30 fracturing stages. We focused on increasing vertical fracture development to access geological
sub-units within the reservoir. To improve operating efficiency, we enlarged the central oil battery to 12,000 bbls per day capacity and completed a network of 8” gathering lines across the play.
We also found success through “exploration by development”, a low-risk tactic of pushing pool boundaries outward in small increments by drilling a long-leg horizontal well through a length of known pool area, then outward into an area without well control. DeeThree will pursue further capital and operating efficiencies in 2015, such as testing down-space drilling to eight wells per section of pool area, plus potentially drilling up to eight wells from a common pad.
Ferguson Upper Bakken SiltstoneIn Ferguson, a discovery well in 2014 extended the Upper Bakken pool by 7 miles to the southwest, setting up a new 30-section exploration area with minimal reserves booked at year-end 2014. Our primary focus at Ferguson in 2014 was to maximize the pool’s profitability and long-term resource recovery. The gas injection pressure maintenance scheme initiated in 2013 showed with very promising initial results, so in 2014 we expanded the program to three gas injection wells, high-pressure injection compression and flow lines.
BRAZEAU

DTX .TO ANNUAL REPORT
20143
25%Reduction in average per well
costs at Ferguson in 2014
FERGUSON
AlbertaBakken
Banff
BakkenSiltstone
ExshawShale
ProducerGas InjectorWater Injector
1,250 m
14 m
5.6 km25 km
R 16R 17
ALBERTA BAKKEN EOR PROCESS

DTX .TO ANNUAL REPORT2014
4
FINANCIAL AND OPERATING HIGHLIGHTSYears Ended December 31, 2014 2013 Change
Financial(000s, except per share amounts) ($) ($) (%)
Oil and natural gas revenues 303,348 177,991 70Funds from operations (1) 173,196 93,295 86 Per share – basic 2.01 1.23 63 Per share – diluted 1.95 1.18 65Cash flow from operating activities 184,239 97,448 89Net income 76,233 18,048 322 Per share – basic 0.89 0.24 271 Per share – diluted 0.86 0.23 274Capital expenditures (2) 296,549 211,885 40Working capital deficit (at year-end)(3) 171,347 119,787 43Bank debt (at year-end) 139,234 88,404 57Shareholders’ equity (at year-end) 463,509 311,070 49
Share Data(000s) (#) (#) (%)
At period-end 88,974 81,560 9Weighted average – basic 86,088 76,009 13Weighted average – diluted 88,763 78,892 13
Operating (4)
Production
Natural gas (mcf/d) 13,823 9,881 40 Crude oil (bbls/d) 8,353 5,205 60 NGLs (bbls/d) 668 332 101 Total (boe/d) 11,325 7,184 58Average wellhead prices Natural gas ($/mcf) 4.73 3.42 38 Crude oil and NGLs ($/bbl) 84.84 81.81 4 Combined average ($/boe) 73.38 67.88 8Netbacks Operating netback ($/boe) 45.16 40.50 12 Funds flow netback ($/boe) 41.86 35.51 18Reserves Proved (mboe) 35,354 26,285 35 Proved plus probable (mboe) 51,833 39,413 32 Total net present value – proved plus probable (10% discount, before taxes) ($000s) 893,934 703,716 27Undeveloped land Gross (acres) 466,554 334,252 40 Net (acres) 437,728 311,268 41Gross (net) wells drilled Gas (#) 1 (1.00) – (–) – (–) Oil (#) 43 (42.93) 32 (31.19) 34 (38) Dry and abandoned (#) 3 (3.00) 3 (2.97) – (1)
Total (#) 47 (46.93) 35 (34.15) 34 (37) Average working interest (%) 100 98 2
(1) Funds from operations and funds from operations per share are not recognized measures under International Financial Reporting Standards (IFRS). Refer to the commentary in the Management’s Discussion and Analysis under “Non-GAAP Measurements” for further discussion.
(2) Total capital expenditures, including acquisitions and excluding non-cash transactions. Refer to commentary in the Management’s Discussion and Analysis under “Capital Expenditures and Acquisitions” for further information.
(3) Working capital deficit, which is calculated as current liabilities (excluding derivative financial instruments) and bank debt less current assets (excluding derivative financial instruments), is not a recognized measure under IFRS. Please refer to the commentary under “Non-GAAP Measurements” for further discussion.
(4) For a description of the boe conversion ratio, refer to the commentary in the Management’s Discussion and Analysis under “Other Measurements”.

DTX .TO ANNUAL REPORT
20145
DEETHREE’S FOCUS ON HIGH PERFORMANCE AT THE FIELD LEVEL plus a disciplined financial approach have given the Company financial strength and flexibility. We are not sugar-coating the commodity price situation in 2015: DeeThree’s financial strength will be put to the test. Reduced capital spending – only slightly exceeding cash flow in the first half – will enable us to continue growing production while carefully managing our debt levels and ratios.
SOLID BALANCE SHEET
Much of what DeeThree talks about on the technical side – better results per well, higher IPs, improved type curves, more efficient infrastructure – is crystallized in this metric. We’re proud of our multi-year growth record, to some of the highest company-wide netbacks in western Canada’s producing sector. Last year’s Company-record netback provides a substantial cushion for this year’s more difficult conditions.
Operating costs are typically higher for oil-focused producers than for gas-weighted companies, especially as oil pools move into secondary or enhanced recovery. DeeThree has worked hard to maximize operating efficiencies – building centralized oil batteries and connecting wells via flow lines rather than trucking fluids. The results are clear in our record of declining operating costs per boe. This creates another strong advantage for navigating through lower commodity prices.
DeeThree’s bank lines provided overall borrowing capacity of $310 million at year-end 2014, of which $170.8 million remained available. Our reduced 2015 capital program will be over 90 percent directed to drilling and completing wells, focused on adding production to maximize the year’s cash flow. DeeThree expects to exit 2015 with a debt to funds from operations ratio of 1.1:1.
Growing production from the successful exploration and development of our liquids-producing plays at Brazeau and Ferguson, along with greater operating efficiencies, have delivered successive years of cash flow growth. The high quality of these two plays will support DeeThree in getting the most production and cash flow out of each dollar invested in 2015.
Funds from Operations($ millions, $/share)
Operating Netback($/boe)
Operating Costs($/boe)
Net Debt($ millions)
200
250 2.50
2.00
1.50
1.00
0.50
0.00
150
100
50
0
$ M
illio
ns
$/Sh
are
11 12 13 14
$23.
41 $32.
66 $40.
50
$45.
16
30
40
50
60
20
10
011 12 13 14
$14.
32
$10.
53
$9.9
1
$9.4
4
9
12
15
18
6
3
011 12 13 14
200 2.0
1.5
1.0
0.5
0
150
100
50
0
Net D
ebt (
$ M
illio
ns)
Debt
to F
unds
Flo
w Ra
tio
11 12 13 14

DTX .TO ANNUAL REPORT2014
6
338
2%
440Number of confirmed, de-risked horizontal drilling locations at Brazeau at year-end 2013
Estimated overall resource base booked as 2P reserves at both core areas, year-end 2014
Number of confirmed, de-risked horizontal drilling locations at Brazeau at year-end 2014
80 30Long-leg horizontal drilling locations in delineated Upper Bakken pool area at Ferguson
Sections of new development lands at Ferguson
MULTI-YEAR INVENTORYDeeThree has a Strong Future Our focus on “getting the most oil out” with each well – i.e., maximizing our capital efficiencies – while operating more efficiently through greater scale and dedicated new infrastructure will help DeeThree weather the current market weakness. Quite simply, moving up the performance ladder has pushed down our break-even commodity price. That gives us the confidence to continue investing this year, at a conservative rate tailored to today’s financial constraints.
High-Quality, Multi-Zone OpportunitiesThe quality of DeeThree’s resource base – reflected in the 44° API light oil produced from multiple stacked zones at Brazeau, the lower-decline production at Ferguson, and the high average IP we’re achieving at both plays – is enabling DeeThree to continue drilling this year. We are aiming for modest production growth in 2015, while remaining financially and operationally strong and flexible.

DTX .TO ANNUAL REPORT
20147
STRONG FUTURE
Ferguson Operations
Land (net)
Average working interest (earned lands)
Geology
Horizontal wells drilled in 2014
Production at year-end 2014
407,183 acres
99%
Upper Bakken Siltstone
18
3,540 boe per day
Brazeau Operations
Land (net)
Average working interest (earned lands)
Geology
Horizontal wells drilled in 2014
Production at year-end 2014
95,485 acres
97%
28
9,086 boe per day
With modern, high-capacity infrastructure in place at both plays, thanks to concerted investments over the previous two years, DeeThree is now able to focus almost entirely on adding production by drilling and completing wells. With two rigs running in 2015, we are drilling 13 net horizontal wells in the first half of 2015 and plan a further 16 net wells in the second half. Levering our years spent de-risking both plays, we are aiming to set new records in per-well results and capital efficiencies. This will maximize the production impact – and cash flow impact – of each dollar of capital invested.
The majority of our new wells drilled in 2015 will be in the highly productive, light-oil-producing Belly River sands at Brazeau. At Ferguson, substantially all of the solution gas produced will be reinjected and DeeThree expects this
program to materially reduce the asset’s overall production decline. With an estimated 500 million barrels of oil-in-place in the Upper Bakken, every 1 percent increase in the recovery factor represents 5 million barrels of oil, approximately 10 percent of DeeThree’s current booked reserves. With limited drilling required in 2015, Ferguson is expected to generate free cash flow even at current commodity prices.
DeeThree’s large inventory of high-working-interest wells at our two well-understood, largely de-risked core areas of Brazeau and Ferguson will support many years of more robust activity and faster production growth under appropriate commodity prices.
Land held at year-end 2014 Gas pipeline Oil pipelineDTX oil battery Keyera West Pembina gas plant Hz well
Belly River Cretaceous stacked sands 10 productive zones and
sub-zones established
ALBERTA
Ferguson
Brazeau

DTX .TO ANNUAL REPORT2014
8
LETTER TO SHAREHOLDERS
DeeThree had another highly successful year in 2014, increasing average daily production by 58 percent and funds from operations by 86 percent year-over-year, and adding over 12 million boe in proved plus probable reserves at year-end. All of our growth was achieved through successful drilling, complemented by minimal working interest acquisitions, with lower overall risks than in 2013.
With the severe reduction in oil and natural gas prices towards the end of 2014, we are fully cognizant that investors are concerned about the ongoing effects of commodity price weakness and volatility on exploration and production companies. Balance sheet health, production profiles, decline rates under reduced drilling programs and overall sustainability are key areas of focus.
Last year at this time, we talked about moving our drilling program into “manufacturing mode”, with a focus on improving per-well results and capital efficiencies – and we did so, as the graphics on the previous pages illustrate. We are generating greater production from each dollar of capital invested, a critical advantage in capital-constrained times. Additionally, we have reduced operating and G&A expenses per unit of production and are generating greater operating netbacks and funds from operations at a given commodity price, making the most of each boe produced. By remaining conservative with our balance sheet as we grew production, we entered 2015 with manageable debt and substantial unutilized borrowing capacity.
In sum, we are sustainable at current commodity prices and prepared on multiple levels to weather low commodity prices. We have reduced 2015’s capital spending in order to maintain our balance sheet. We are drilling fewer wells in 2015, all at high-graded locations, in order to achieve the greatest capital efficiency.
We are confident that DeeThree has a strong future despite this down phase in the commodity price cycle. The high quality of our resource base, the large size of our drilling inventory – now at 520 horizontal locations, enough to keep five drilling rigs busy for at least 10 years – and our record of drilling success over multiple years position DeeThree to resume its fast rate of growth to exploit a recovery in commodity prices.
2014 HighlightsSignificant achievements in 2014 included:
• Increased annual average production to 11,325 boe per day, a gain of 58 percent over 2013. Fourth quarter average production rose to a new three-month high of 12,842 boe per day, up by 49 percent from the same period in 2013. DeeThree’s crude oil and liquids weighting was 80 percent in 2014 compared to 77 percent in 2013;
• Increased oil and gas revenues by 70 percent from $178 million in 2013 to $303 million in 2014;
• Grew funds from operations from $93 million ($1.23 per basic share) in 2013 to $173 million ($2.01 per basic share) in 2014, an 86 percent increase;
• Reduced year-over-year net G&A costs per unit of production by 19 percent, from $2.48 per boe in 2013 to $2.01 per boe in 2014;

DTX .TO ANNUAL REPORT
20149
• Reduced operating costs year-over-year, showing particular improvement in the fourth quarter, with operating costs declining by 26 percent from $10.03 per boe in the fourth quarter of 2013 to $7.45 per boe in the fourth quarter of 2014;
• Improved the average operating netback by 12 percent to $45.16 per boe in 2014 from $40.50 per boe in 2013;
• Increased total proved plus probable reserves by 31 percent to 51.8 million boe as at December 31, 2014 from 39.4 million boe at year-end 2013;
• Increased the Company’s estimated net asset value, on a net present value, before tax, 10 percent discounted basis, to $8.75 per fully diluted share at December 31, 2014;
• Achieved all-in finding, development and acquisition costs, including the change in future development capital, of $21.51 per boe on proved plus probable reserve additions and $27.89 per boe on total proved reserve additions; and
• Increased the Company’s availability under its credit facility by 88 percent during the year to $310 million, exiting 2014 with net debt of $171 million.
Operations In 2014, we executed the largest exploration and development capital program in our history. The Company invested $297 million to drill a total of 47 gross (46.93 net) wells with a 94 percent success rate. Drilling activity was concentrated in
our two core areas, with 18 gross wells drilled in the Upper Bakken at Ferguson, 28 gross wells drilled in the multi-zone Belly River stacked sands at Brazeau and one gross well drilled on our non-core property in the Peace River Arch.
The Company achieved material improvements in operating and capital costs. On the operating cost side, previous investments in infrastructure, plus an additional $18 million invested in 2014 to enlarge the Brazeau oil battery to 12,000 bbls per day capacity, add gas compression and lay additional 8” flow lines, resulted in meaningfully lower operating costs. On the capital spending side, a combination of lower service costs, improved processes and careful execution of our program enabled DeeThree to materially improve capital efficiencies.
FERGUSON – UPPER BAKKEN SILTSTONE
DeeThree’s primary focus at its 100 percent working interest Ferguson property last year was further testing and development of the gas reinjection enhanced oil recovery (EOR) scheme. This program’s success was a major highlight for 2014. We initiated a pressure maintenance and resource conservation program in July 2013, reinjecting some of the solution gas produced along with the Bakken oil, using one converted producing well.
Last year we invested $7 million and enlarged the EOR scheme, adding two further injector wells and a built-for-purpose gas compressor plus high-pressure injection lines. This enabled the Company to reinject 100 percent of its produced gas into an EOR area covering 14 sections in the heart of the Ferguson pool. Production from the field averaged 4,284 boe per day in 2014, with producing wells experiencing an average decline rate of 40 percent.
We previously stated that sound reservoir management aimed at maximizing the long-term recovery of this reservoir’s large volume of oil-in-place should be our highest priority. DeeThree’s EOR scheme demonstrates this commitment, and the initial results suggest we are on the right path. The Upper Bakken reservoir is oil-saturated but shallow, naturally under-pressured and lacking in natural water drive. The reservoir pressure and production results demonstrate that the gas flood mitigates decline rates on offsetting producing wells, as the graph and illustration on the previous pages indicate.
FOURTH QUARTER AVERAGE PRODUCTION ROSE TO A NEW THREE-MONTH HIGH OF 12,842 BOE PER DAY, UP BY 49 PERCENT FROM THE SAME PERIOD IN 2013.

DTX .TO ANNUAL REPORT2014
10
Recent well results in the EOR injection area show very strong production results, with one well testing at up to 1,800 bbls per day and as of early March producing 370 bbls per day plus 450 mscf of gas per day. The results have encouraged us to accelerate the transition to full implementation of the EOR scheme. The scheme’s first water injection well and two more gas injection wells are planned in 2015.Initial results from a third-party computer simulation of the Ferguson pool suggest that the EOR scheme could triple the recovery factor (or percentage of the reservoir’s oil-in-place that can be ultimately produced) relative to primary production alone.
Going forward, we plan to increase production at Ferguson at a pace matching the growth of our EOR scheme. Lower decline rates along with improved drilling techniques, such as monobore drilling, which have reduced per-well capital costs by 25-30 percent in initial tests, should each help to further improve capital efficiencies at Ferguson.
Another significant event in 2014 was a discovery well confirming a 7-mile, 30-section western extension of our Upper Bakken play. This year we will drill one delineation well to follow-up on last year’s well, which could add materially to the current inventory of 80 long-leg horizontal drilling locations, giving DeeThree a 30-mile-long Upper Bakken fairway, all held at 100 percent working interest.
BRAZEAU – BELLY RIVER MULTI-ZONE STACKED SANDS
Last year, DeeThree drilled 28 of its 47 wells at Brazeau, where results continue to demonstrate the quality and scale of the multi-zone play. Drilling activity last year at Brazeau was generally on lower-risk locations than in 2013, focusing less on pool extensions and testing new zones, and more on improving per-well results. Capital efficiencies in Brazeau have improved from $41,000 per boe per day added in 2012 to $29,000 in 2013 and $24,000 in 2014, while average first-year per-well productivity improved from 114 boe per day in 2012 to 172 boe per day in 2013 and to 220 boe per day last year. Our best well in 2014 was better than the best well in 2013, and the average 2014 well was better than the average 2013 well.
These results came about through a number of technical refinements, including drilling two-mile-long horizontal well legs, increasing to 30 fracturing stages per well and up to 40 tonnes per stage, improved placement of the horizontal well leg within the pay zone through the use of rotary steerable bits, and greater use of multi-well pads to exploit existing infrastructure.
To date in 2015, the Company has drilled three 100 percent working interest, multi-stage fractured horizontal wells at Brazeau, all of which have met or exceeded expectations. Our results so far include a Belly River D zone well which tested at a final flowing rate of 1,700 bbls per day of crude oil and 1.9 mmscf per day of natural gas at 260 psi wellhead pressure after a four- day test. As such, DeeThree will be able to meet its production targets for the first quarter with fewer wells than originally planned. Capital cost reductions achieved to date are in-line with the 10 percent year-over-year cost reduction provided for in our 2015 budget.
Brazeau remains a growth play over the long term. The play now extends over 40 miles of multi-zone fairway held at nearly 100 percent average working interest, with a current inventory of 440 horizontal locations. Brazeau offers 70 sections of pool area, with up to 10 commercial zones, several of which have only been tested and remain essentially undeveloped. Brazeau is a critical part of DeeThree’s strong future.
CAPITAL EFFICIENCIES IN BRAZEAU HAVE IMPROVED FROM $41,000 PER BOE PER DAY ADDED IN 2012 TO $29,000 IN 2013 AND $24,000 IN 2014.

DTX .TO ANNUAL REPORT
201411
Risk ManagementDeeThree has secured several commodity contracts to protect its cash flow and support its 2015 capital budget. Prior to the decline in world oil prices last fall, the Company had 2,000 bbls per day of crude oil contracted for 2015 with 500 bbls per day in a U.S. dollar collar (US$85.00 per bbl floor and US$100.80 per bbl ceiling). The remaining 1,500 bbls per day are hedged at a fixed price in Canadian dollars ranging from $99.00 per bbl to $100.00 per bbl. Subsequent to year-end, the Company hedged an additional 500 bbls per day, 250 bbls per day for March 2015 to June 2016 at a fixed price of Cdn$72.92 per barrel and 250 bbls per day for 2016 at a fixed price of Cdn$78.00 per bbl.
In addition, the Company has one foreign exchange contract and one interest rate contract in place (please see the following Management’s Discussion and Analysis for further details).
OutlookAs we announced in mid-January, our 2015 capital program includes planned expenditures of up to $160 million. With 93 percent of 2015 capital spending focused on drilling and completing wells, we anticipate delivering production growth of 18 percent year-over-year, to 13,300 boe per day in 2015. We are prudently managing our capital expenditures and production levels in combination with our debt. At present, we are on-track to meet these targets. We will be focused throughout the year on meeting operational guidance while maintaining maximum financial and operational flexibility. As such, DeeThree will continue to re-evaluate its capital spending in the context of commodity prices.
The Company remains focused on improving capital costs through further service cost reductions and added improvements to well drilling and completion processes, including infill drilling with up to eight wells per common pad targeting multiple zones at Brazeau.
With a slower pace of activity in 2015, along with the EOR scheme on our Alberta Bakken property, we expect our production decline rate to improve by as much as 10 percent from the 40 percent corporate decline experienced in 2014. As we announced in early March, per-well results to date in 2015 have been so strong that we were able to reduce the planned number of first-half 2015 wells from 10 to six, conserving additional capital without affecting planned production. The combination of lower declines, improved capital efficiencies and reduced spending will enhance DeeThree’s sustainability.
Many thanks to our office staff, the management team and all our shareholders for their continued support and their trust in all of us at DeeThree.
On behalf of the Board of Directors,
Martin Cheyne President & Chief Executive Officer
March 25, 2015

DTX .TO ANNUAL REPORT2014
12
> RESERVES SUMMARY AND ADDITIONAL INFORMATIONSALES SUMMARY
Three Months Ended December 31, Years Ended December 31,
2014 2013 2014 2013
Natural gas (mcf/d) 16,510 10,251 13,823 9,881
Crude oil (bbls/d) 9,275 6,547 8,353 5,205
NGLs (bbls/d) 815 369 668 332
Total (boe/d) 12,842 8,625 11,325 7,184
LAND SUMMARY
Undeveloped Developed Total
Gross Net Gross Net Gross Net
(acres) (acres) (acres) (acres) (acres) (acres)
2014
Lethbridge 357,114 355,365 54,112 51,818 411,226 407,183Brazeau 76,960 63,072 47,400 32,413 124,360 95,485Peace River Arch 29,600 17,589 48,082 24,453 77,682 42,042Other 2,880 1,702 6,880 4,337 9,760 6,039
Total 466,554 437,728 156,474 113,021 623,028 550,749
2013
Lethbridge 254,412 253,223 50,890 48,773 305,302 301,996
Brazeau 33,600 27,066 26,720 22,746 60,320 49,812
Peace River Arch 42,560 28,837 51,612 25,290 94,172 54,127
Other 3,680 2,142 7,040 4,474 10,720 6,616
Total 334,252 311,268 136,262 101,283 470,514 412,551
As at December 31, 2014, DeeThree controlled petroleum and natural gas leases covering 437,728 net acres of
undeveloped land, a 41 percent increase from the 311,268 net acres held at the end of 2013.
During 2014, DeeThree invested $8.2 million for the acquisition of 131,666 net acres of petroleum and natural gas rights
in the Lethbridge area at an average cost of $61.92 per acre and $7.5 million for the acquisition of 29,356 net acres of
petroleum and natural gas rights in the Brazeau area at an average cost of $256.38 per acre.

DTX .TO ANNUAL REPORT
201413
RESERVES
Sproule Associates Limited (“Sproule”), an independent petroleum engineering firm, evaluated the natural gas, crude oil and NGLs reserves of the Company as at December 31, 2014 and 2013. Sproule based their evaluation on land data, well and geological information, reservoir studies, estimates of on-stream dates, contract information, current hydrocarbon product prices, operating cost data, capital budget forecasts and future operating plans provided by DeeThree, and prepared their report in accordance with the Canadian Securities Administrators’ National Instrument NI 51-101, “Standards of Disclosure for Oil and Gas Activities”. The required disclosure of the reserves estimates and future net revenue of the Company as at December 31, 2014, based on forecast prices and costs, is outlined below along with the economic assumptions used in preparing those estimates. For purposes of computing such units, natural gas is converted to equivalent barrels of oil using a conversion factor of six thousand cubic feet of gas to one barrel of oil. This conversion ratio of 6:1 is based on an energy-equivalent conversion for the individual products at the burner tip and does not represent a value equivalency at the wellhead. Such disclosure of boes may be misleading, particularly if used in isolation. Also refer to the disclosure under “Statement of Reserves Data and Other Oil and Gas Information” included in the Company’s Annual Information Form for the year ended December 31, 2014.
SUMMARY OF OIL AND GAS RESERVES
The following table outlines the oil and gas reserves of the Company by product type on a gross (before royalties) and net (after royalties) basis:
Crude Oil Natural Gas NGLs Total
Gross Net Gross Net Gross Net Gross Net
(mbbls) (mbbls) (mmcf) (mmcf) (mbbls) (mbbls) (mboe) (mboe)
Proved Developed producing 10,837 8,375 24,815 22,336 1,059 712 16,032 12,810 Developed non-producing 192 155 7,809 5,604 287 196 1,780 1,285 Undeveloped 12,388 10,248 23,053 20,915 1,312 982 17,542 14,716
Total proved 23,417 18,778 55,677 48,856 2,657 1,890 35,354 28,810Probable 11,830 8,674 21,735 18,528 1,027 685 16,479 12,447
Total proved plus probable 35,247 27,452 77,412 67,384 3,684 2,574 51,833 41,257
Note: Table may not be additive due to rounding.
NET PRESENT VALUES OF FUTURE NET REVENUE
The net present values of future net revenue of the Company’s reserves at various discount rates on a before-tax basis are outlined below.
Before Income Taxes Discounted At
0% 5% 10% 15% 20%
($000s)
Proved Developed producing 542,053 433,604 363,181 314,207 278,336 Developed non-producing 56,697 25,884 14,291 9,372 6,970 Undeveloped 508,124 343,569 245,083 180,754 135,908
Total proved 1,106,874 803,056 622,556 504,334 421,214Probable 599,905 381,846 271,378 207,168 165,832
Total proved plus probable 1,706,779 1,184,902 893,934 711,501 587,047
Note: Table may not be additive due to rounding.
DTX .TO ANNUAL REPORT2014
14
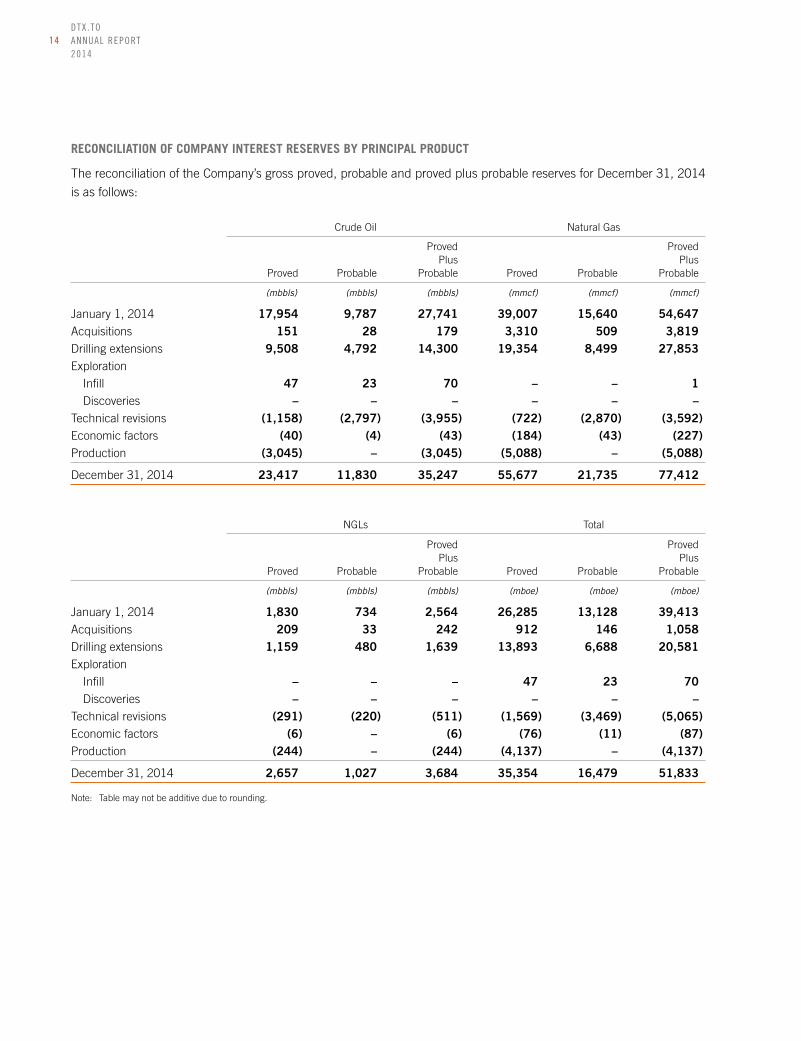
RECONCILIATION OF COMPANY INTEREST RESERVES BY PRINCIPAL PRODUCT
The reconciliation of the Company’s gross proved, probable and proved plus probable reserves for December 31, 2014
is as follows:
Crude Oil Natural Gas
Proved Proved Plus Plus Proved Probable Probable Proved Probable Probable
(mbbls) (mbbls) (mbbls) (mmcf) (mmcf) (mmcf)
January 1, 2014 17,954 9,787 27,741 39,007 15,640 54,647Acquisitions 151 28 179 3,310 509 3,819Drilling extensions 9,508 4,792 14,300 19,354 8,499 27,853Exploration
Infill 47 23 70 – – 1 Discoveries – – – – – –Technical revisions (1,158) (2,797) (3,955) (722) (2,870) (3,592)Economic factors (40) (4) (43) (184) (43) (227)Production (3,045) – (3,045) (5,088) – (5,088)
December 31, 2014 23,417 11,830 35,247 55,677 21,735 77,412
NGLs Total
Proved Proved Plus Plus Proved Probable Probable Proved Probable Probable
(mbbls) (mbbls) (mbbls) (mboe) (mboe) (mboe)
January 1, 2014 1,830 734 2,564 26,285 13,128 39,413Acquisitions 209 33 242 912 146 1,058Drilling extensions 1,159 480 1,639 13,893 6,688 20,581Exploration
Infill – – – 47 23 70 Discoveries – – – – – –Technical revisions (291) (220) (511) (1,569) (3,469) (5,065)Economic factors (6) – (6) (76) (11) (87)Production (244) – (244) (4,137) – (4,137)
December 31, 2014 2,657 1,027 3,684 35,354 16,479 51,833
Note: Table may not be additive due to rounding.

DTX .TO ANNUAL REPORT
201415
TOTAL FUTURE NET REVENUE
The following table provides a breakdown of the various components of total future net revenue on an undiscounted
basis for proved and proved plus probable reserves:
Future Net Revenue Well Before Operating Development Abandonment Income Revenue Royalties Costs Costs Costs Taxes
($000s)
Proved2015 258,485 51,018 45,913 137,500 – 24,054
2016 327,107 60,724 50,455 112,164 – 103,764
2017 313,129 58,083 48,921 42,366 – 163,759
2018 227,946 49,196 42,295 3,872 – 132,583
2019 183,228 42,168 38,760 – – 102,300
2020 154,523 35,363 36,400 – – 82,760
2021 131,831 28,474 34,135 – 197 69,025
2022 114,981 23,329 32,570 – – 59,082
2023 101,111 19,187 31,079 – 142 50,703
2024 89,879 16,118 29,802 – – 43,959
2025 80,383 13,681 28,979 – – 37,723
2026 72,102 11,791 27,920 – 56 32,335
Remainder 593,263 88,442 292,383 673 6,931 204,834
Total proved 2,647,968 497,577 739,612 296,575 7,326 1,106,874
Proved plus probable2015 316,774 64,711 52,578 176,025 – 23,460
2016 443,697 88,835 62,050 146,089 – 146,723
2017 435,033 97,571 60,986 56,849 – 219,627
2018 319,212 83,365 52,312 8,296 – 175,239
2019 261,810 68,337 48,055 – – 145,418
2020 223,681 57,999 44,811 – – 120,871
2021 193,467 48,696 42,579 – – 102,192
2022 170,131 40,773 40,633 – – 88,725
2023 151,053 33,818 38,986 – 255 77,994
2024 135,531 28,519 37,431 – – 69,851
2025 122,068 24,213 36,325 – 147 61,383
2026 110,795 20,891 35,301 – – 54,603
Remainder 1,159,620 183,688 543,779 792 10,448 420,913
Total proved plus probable 4,042,872 841,419 1,095,828 388,050 10,850 1,706,779
Note: Table may not be additive due to rounding.

DTX .TO ANNUAL REPORT2014
16
SUMMARY OF PRICING AND INFLATION RATE ASSUMPTIONS
The economic parameters, as determined by Sproule, assumed in preparing the forecast prices and costs reserves
report are outlined below.
Price Forecast – Effective December 31, 2014
Currency WTI Edmonton Henry Alberta Exchange Cushing, Light Hub, AECO-C Year Rate Oklahoma Par Louisiana Spot
(US$/Cdn$) (US$/bbl) (Cdn$/bbl) (US$/mmbtu) (Cdn$/GJ)
Historical2010 0.971 79.43 77.80 4.39 4.16
2011 1.012 95.00 95.16 4.04 3.72
2012 1.001 94.19 86.57 2.79 2.43
2013 0.971 97.98 93.24 3.68 3.13
2014 0.905 93.00 94.18 4.28 4.50
Forecast2015 0.850 65.00 70.35 3.25 3.32
2016 0.870 80.00 87.36 3.75 3.71
2017 0.870 90.00 92.28 4.00 3.90
2018 0.870 91.35 99.75 4.50 4.47
2019 0.870 92.72 101.25 5.00 5.05
2020 0.870 94.11 103.85 5.08 5.13
2021 0.870 95.52 105.40 5.15 5.22
2022 0.870 96.96 106.99 5.23 5.31
2023 0.870 98.41 108.59 5.31 5.40
2024 0.870 99.89 110.22 5.39 5.49
2025 0.870 101.38 111.87 5.47 5.58
Remainder +1.5%/yr +1.5%/yr +1.5%/yr +1.5%/yr +1.5%/yr
RESERVE LIFE INDEX
The reserve life index of DeeThree has been calculated using 2015 estimated gross production volumes and gross
proved and proved plus probable reserves using forecast prices and costs, all of which were taken from the December
31, 2014 Sproule reserves report. The reserve life index of the Company as at December 31, 2014, on a boe basis, was
7.8 years for total proved reserves and 6.7 years for total proved plus probable reserves.
Proved Plus Proved Probable Proved Expected Expected Proved Plus 2015 2015 Plus Proved Probable Production Production Proved Probable
(years) (years)
Natural gas (mmcf) 55,677 77,412 6,488 20,488 8.6 3.8Crude oil and NGLs (mbbls) 26,075 38,931 3,448 4,274 6.8 8.2
Total (mboe) 35,354 51,834 4,529 7,688 7.8 6.7

DTX .TO ANNUAL REPORT
201417
FINDING AND DEVELOPMENT COSTS AND RECYCLE RATIO
The recycle ratio is a measure for evaluating the effectiveness of a company’s re-investment program. The ratio measures
the efficiency of capital investment, which is accomplished by comparing the operating netback per boe to that year’s
reserves’ finding and development (F&D) cost per boe. For the year ended December 31, 2014, DeeThree’s recycle
ratio was 1.6 times on a proved basis and 2.1 times on a proved plus probable basis, while the Company achieved an
average F&D cost, including future development costs, of $27.89 per boe on a proved basis and $21.51 per boe on a
proved plus probable basis.
The table below provides detailed calculations relating to F&D costs and recycle ratios for the Company’s proved and
proved plus probable reserves for the years ended December 31, 2014 and 2013.
Years Ended December 31, 2014 2013
Proved ReservesCapital expenditures ($000s) 296,549 211,885
Change in future capital ($000s) 71,640 73,146
Total capital costs ($000s) 368,189 285,031
Reserve additions (mboe) 13,203 14,549
F&D costs, excluding future development costs ($/boe) 22.46 14.56
F&D costs, including future development costs ($/boe) 27.89 19.59
Operating netback ($/boe) 45.16 40.50
Recycle ratio 1.6 2.1
Proved Plus Probable ReservesCapital expenditures ($000s) 296,549 211,885
Change in future capital ($000s) 59,561 169,543
Total capital costs ($000s) 356,110 381,428
Reserve additions (mboe) 16,554 21,847
F&D costs, excluding future development costs ($/boe) 17.91 9.70
F&D costs, including future development costs ($/boe) 21.51 17.46
Operating netback ($/boe) 45.16 40.50
Recycle ratio 2.1 2.3
(1) For a description of the boe conversion ratio, refer to the commentary at the end of the Management’s Discussion and Analysis.(2) The aggregate of the exploration and development costs incurred in 2014 and 2013 and the change during the year in estimated future development costs
may not reflect total F&D costs related to reserve additions for the year.

DTX .TO ANNUAL REPORT2014
18
NET ASSET VALUE
Years Ended December 31, 2014 2013
(000s, except per share amounts) ($) ($)
Present value of petroleum and natural gas reserves (1) 893,934 373,009
Net undeveloped land (2) 77,954 62,483
Working capital deficit (171,347) (77,586)
Proceeds from stock options (3) 14,048 18,193
Net asset value 814,589 376,099
Diluted shares outstanding (#) (4) 93,137,688 76,779,805
Net asset value per share 8.75 4.90
(1) Total proved plus probable, discounted at 10%, before tax per the Sproule December 31 reserves evaluations.(2) Based on a third-party evaluation as at December 31, 2014 and 2013.(3) Calculated proceeds from in-the-money options using a 2014 year-end closing common share price of $5.11 per share (2013 – $9.57 per share).(4) Calculated as basic shares outstanding at December 31 plus in-the-money options.

DTX .TO ANNUAL REPORT
201419
> MANAGEMENT’S DISCUSSION AND ANALYSISThe following Management’s Discussion and Analysis (MD&A) of the financial condition and results of operations for
DeeThree Exploration Ltd. (“DeeThree” or “the Company”) is dated March 25, 2015 and should be read in conjunction
with the Company’s audited financial statements and related notes for the years ended December 31, 2014 and 2013
and with the MD&A and unaudited interim financial statements for the periods ended March 31, 2014, June 30, 2014
and September 30, 2014. All financial information is reported in Canadian dollars, unless otherwise noted.
This MD&A contains additional measures under generally accepted accounting principles (GAAP), non-GAAP measures
and forward-looking statements. Readers are cautioned that the MD&A should be read in conjunction with the Company’s
disclosure under “Non-GAAP Measures” and “Forward-looking Information and Statements” included at the end of
this MD&A.
ABOUT DEETHREE EXPLORATION LTD.
DeeThree is a Canadian company actively engaged in crude oil and natural gas exploration, development and production
in key areas of the Western Canada Sedimentary Basin. DeeThree is focused on creating long-term shareholder value
through a successful drilling program, growth-oriented field operations and prudent financial management.
DeeThree’s strategic platform for growth includes low-risk development and higher-risk exploration as well as strategic
acquisitions. The Company has two core operating areas: the Brazeau area of west central Alberta, which features crude
oil, natural gas and natural gas liquids (NGLs), and the Ferguson area of southern Alberta, which features Bakken oil
and shallow natural gas. These two core areas have provided the Company with a balanced and diverse production base.
The Company’s experienced technical team has a proven track record of driving quarter-over-quarter organic growth
with these assets.
DeeThree commenced operations in 2007 as a private company focused on development and production of natural
gas in southern Alberta. In late 2008, DeeThree completed its first significant acquisition from a major oil and natural
gas producer comprised of properties in the Lethbridge area of southern Alberta, which became known as the Ferguson
area. Ferguson was the Company’s primary focus until late in the first quarter of 2011, when DeeThree closed a
transformational acquisition of properties in the Brazeau and Peace River Arch areas. Since 2012, the Company has
been successful in exploration and development activities in the Brazeau and Ferguson areas and continues to achieve
growth in production, reserves and net asset value.
DeeThree is headquartered in Calgary, Alberta and the common shares of DeeThree are listed for trading on the Toronto
Stock Exchange under the symbol DTX and on the United States OTCQX under the symbol DTHRF.
2014 FINANCIAL AND OPERATING HIGHLIGHTS
DeeThree’s average annual production of 11,325 boe/d for 2014 reflects strong operating performance from existing
wells in the Ferguson and Brazeau areas as well as strong production from new wells drilled during the year.
For the year ended December 31, 2014, DeeThree realized a combined average sales price of $73.38/boe, an 8 percent
increase over the prior year. This was primarily due to increased market prices for crude oil for the majority of the

DTX .TO ANNUAL REPORT2014
20
year. With average operating costs of $9.44/boe, transportation costs of $2.18/boe and average royalties of 23 percent,
DeeThree achieved an operating netback of $45.16/boe, a 12 percent increase over the prior year.
DeeThree incurred $296.5 million of capital expenditures in 2014, with a capital program that focused on the drilling
of 47 gross (46.93 net) wells, with 18 gross (18.0 net) in the Ferguson area, 28 gross (27.93 net) in the Brazeau area,
and 1 gross (1.0 net) in the Peace River Arch area. The capital program also included approximately $22.6 million of
minor acquisitions, $8.9 million on land and $31.0 million related to upgrading of existing facilities as well as facility and
pipeline construction to handle the Company’s growing production.
During the year, DeeThree increased its proved plus probable reserves by 32 percent to 51.8 million boe (75 percent oil
and NGLs) at December 31, 2014 from 39.4 million boe (77 percent oil and NGLs) in the prior year. DeeThree’s reserve
additions were predominately a result of the successful 2014 drilling program in the Company’s Brazeau and Ferguson
areas, which continue to demonstrate their high quality and generate strong returns through the Company’s rapid pace
of development.
During 2014, DeeThree issued a total of 5,714,200 common shares and 752,000 flow-through shares for net proceeds
of approximately $69.4 million, and issued common shares on the exercise of options for $2.4 million, for total cash
proceeds of $71.8 million. This allowed the Company to reduce debt and free up borrowing capacity, which was redrawn
to fund the Company’s 2014 capital program.

DTX .TO ANNUAL REPORT
201421
FUNDS FROM OPERATIONS (1)
Three Months Ended December 31, Year Ended December 31,
2014 2013 2014 2013
($000s)
Net income 28,312 3,305 76,233 18,048
Non-cash items:
Depletion and depreciation (D&D) expense 23,785 15,984 80,799 51,309
Deferred income tax expense 10,285 1,974 28,331 9,253
Share-based compensation (2) 785 573 3,069 2,238
Accretion 229 188 850 497
Unrealized loss (gain) on financial instruments (22,572) (524) (25,494) 3,074
Loss on disposition 90 – 90 –
Exploration and evaluation (E&E) expense 859 3,160 9,318 8,876
Funds from operations (1) 41,773 24,660 173,196 93,295
(1) Funds from operations and funds from operations per share are not recognized measures under International Financial Reporting Standards (IFRS). Refer to “Non-GAAP Measurements” for further discussion.
(2) The share-based compensation amount included in the calculation of funds from operations was adjusted for the non-cash portion related to certain field employees that was reclassified to operating expenses for presentation in the statement of operations and comprehensive income.
During the three months ended December 31, 2014, the Company generated funds from operations totalling
$41.8 million ($0.47 per basic share and $0.46 per diluted share) compared to $24.7 million ($0.32 per basic share
and $0.31 per diluted share) in the comparative period of 2013 and $52.7 million ($0.59 per basic share and $0.57 per
diluted share) in the third quarter of 2014. The year-over-year increase is primarily attributable to increased revenue,
stemming from increased production and a higher realized price for the majority of the year. The quarter-over-quarter
decrease reflects decreased revenue associated with decreased commodity prices, partially offset by lower operating
and transportation costs.
Funds from operations totalled $173.2 million ($2.01 per basic share and $1.95 per diluted share) for the year ended
December 31, 2014 compared to $93.3 million ($1.23 per basic share and $1.18 per diluted share) recorded in 2013.
NET INCOME
For the three months ended December 31, 2014, the Company recorded net income of $28.3 million ($0.32 per basic
share and $0.31 per diluted share) compared to $3.3 million ($0.04 per basic and diluted share) in the same period
of 2013 and net income of $21.1 million ($0.24 per basic share and $0.23 per diluted share) in the third quarter of
2014. The Company’s increased net income for the year was primarily due to the impact of unrealized mark-to-market
gains recognized mostly in the fourth quarter of the year. The quarter-over-quarter increase was also primarily due to
the impact of the unrealized and realized gains relating to the Company’s mark-to-market assets and decreased E&E
expense, partially offset by decreased revenue from lower commodity prices.
Net income for the year ended December 31, 2014 was $76.2 million ($0.89 per basic share and $0.86 per diluted
share) compared to $18.0 million ($0.24 per basic share and $0.23 per diluted share) in 2013.

DTX .TO ANNUAL REPORT2014
22
FINANCIAL AND OPERATING RESULTS
SALES VOLUMES
Three Months Ended December 31, Year Ended December 31,
2014 2013 2014 2013
SalesNatural gas (mcf/d) 16,510 10,251 13,823 9,881
Crude oil (bbls/d) 9,275 6,547 8,353 5,205
NGLs (bbls/d) 815 369 668 332
Total sales (boe/d) 12,842 8,625 11,325 7,184
(%) (%)
Production SplitNatural gas 22 20 20 23
Crude oil 72 76 74 72
NGLs 6 4 6 5
Total 100 100 100 100
For the fourth quarter of 2014, the Company’s production averaged 12,842 boe/d compared to 8,625 boe/d in the
same period of 2013 and 12,294 boe/d in the third quarter of 2014. This represents a 49 percent year-over-year and a
4 percent quarter-over-quarter increase and reflects new production from the tie-in of wells drilled during 2014.
For the year ended December 31, 2014, DeeThree’s production averaged 11,325 boe/d compared to 7,184 boe/d in
the previous year, representing a 58 percent increase. During 2014, production was comprised of 13,823 mcf/d of gas,
8,353 bbls/d of crude oil and 668 bbls/d of NGLs, thereby increasing the Company’s crude oil and NGL production to
80 percent of total corporate production from 77 percent a year earlier.
REVENUE
Three Months Ended December 31, Year Ended December 31,
2014 2013 2014 2013
($000s)
Natural gas 5,833 3,777 23,848 12,347
Crude oil 61,530 46,747 267,527 159,555
NGLs and other 2,594 1,341 11,973 6,089
Total oil and natural gas revenue 69,957 51,865 303,348 177,991
During the three months ended December 31, 2014, revenue increased by 35 percent to $70.0 million from
$51.9 million in the comparative period of 2013. The year-over-year increase was a result of increased production. When
compared to the third quarter of 2014, revenue decreased by 20 percent to $70.0 million from $87.2 million due to
decreased commodity prices.
During 2014, revenue totalled $303.3 million compared to $178.0 million a year earlier. Total revenue increased by
70 percent over 2013 primarily as a result of the increase in sales volumes as well as higher crude oil market prices for
the year as a whole.

DTX .TO ANNUAL REPORT
201423
Pricing for both the three and 12-month periods ended December 31, 2014 is discussed in further detail in “Commodity
Prices and Foreign Exchange” below.
COMMODITY PRICES AND FOREIGN EXCHANGE
Three Months Ended December 31, Year Ended December 31,
2014 2013 2014 2013
Benchmark PricesCrude oil
WTI (US$/bbl) 73.15 97.46 93.00 97.97
Edmonton Light (MSW) (Cdn$/boe) 75.55 86.41 94.44 93.03
Differential – MSW/WTI (US$/bbl) (6.36) (14.93) (7.17) (7.57)
Hardisty Bow River (Cdn$/boe) 77.38 69.51 91.60 76.16
Differential – Bow River/WTI (US$/bbl) (13.65) (31.07) (18.95) (24.02)
Natural gas
NYMEX (US$/mmbtu) (1) 4.00 3.62 4.41 3.67
AECO (Cdn$/GJ) (2) 3.41 3.35 4.27 3.01
Average Realized PricesNatural gas ($/mcf) 3.84 4.00 4.73 3.42
Crude oil ($/bbl) 72.11 77.62 87.74 83.98
NGLs ($/bbl) 34.13 38.87 48.60 47.80
Combined average ($/boe) 59.21 65.37 73.38 67.88
Foreign ExchangeCdn$/US$ 1.14 1.05 1.10 1.03
US$/Cdn$ 0.88 0.95 0.91 0.97
(1) Mmbtu is the abbreviation for millions of British thermal units. One mcf of natural gas is approximately 1.02 mmbtu.(2) GJ is the abbreviation for gigajoule. One mcf of natural gas is approximately 1.05 GJ.
CRUDE OIL PRICING
The average realized price of DeeThree’s crude oil was $72.11/bbl for the fourth quarter of 2014 compared to $77.62/bbl
in the fourth quarter of 2013 and $91.60/bbl in the third quarter of 2014. DeeThree’s realized oil price decreased by
7 percent from the prior year’s fourth quarter and by 21 percent from the third quarter of 2014, due to a combination of a
decrease in the US$ WTI benchmark oil price, offset by the change in the differentials and a weakened Canadian dollar.
For the year ended December 31, 2014, the Company’s average realized crude oil price was $87.74/bbl compared
to $83.98/bbl during 2013, a 4 percent increase driven by higher average benchmark prices and a weakened
Canadian dollar.
NATURAL GAS PRICING
DeeThree receives a premium to the AECO gas index price due to the heat content of its sales gas. DeeThree’s average
realized natural gas price was $3.84/mcf in the fourth quarter of 2014 versus $4.00/mcf in the fourth quarter of 2013
and $4.39/mcf in the third quarter of 2014. The Company’s realized gas price decreased by 4 percent from the same
period of 2013 and 13 percent from the third quarter of 2014.

DTX .TO ANNUAL REPORT2014
24
For the year ended December 31, 2014, the Company’s average realized price for natural gas increased by 38 percent
to $4.73/mcf from $3.42/mcf in 2013, driven by a 42 percent increase in the AECO gas index price.
PRICE RISK & MITIGATION
Ongoing commodity price volatility may affect DeeThree’s funds from operations and rates of return on capital programs.
As continued volatility is expected in 2015, DeeThree will take steps to mitigate these risks and protect its financial
position, as it was doing in 2014. For example, in the first half of 2014, the Company was moving a portion of its crude oil
out of the Ferguson area via rail cars. The Company was able to attract better pricing on those volumes and will continue
to explore options to move its crude oil by rail when market conditions are favourable.
The Company’s financial results are significantly influenced by fluctuations in commodity prices, including price
differentials and foreign exchange rates. As a means of managing commodity price volatility and its impact on cash
flows, the Company seeks to protect itself from fluctuations in prices and exchange rates by maintaining an appropriate
hedging strategy. As at the date of this MD&A, DeeThree had six crude oil hedges (refer to “Risk Management” below
for details). Most commodity prices are based on US dollar benchmarks, which result in the Company’s realized prices
being influenced by the Canadian/US exchange rates. The Company does not sell or transact in foreign currency, but
is affected by foreign currency exchange rate changes related to commodity prices as outlined above. As at the date of
this MD&A, DeeThree had one foreign currency exchange risk management contract in place to mitigate these risks (see
“Risk Management” below for contract details).
ROYALTIES
Three Months Ended December 31, Year Ended December 31,
2014 2013 2014 2013
Oil and natural gas revenues ($000s) 69,957 51,865 303,348 177,991
Total royalties ($000s) 16,277 12,858 68,613 40,349
Total royalties ($/boe) 13.78 16.21 16.60 15.39
Percent of revenue (%) 23 25 23 23
The Ferguson property is primarily subject to freehold royalties, which work on a sliding-scale determined monthly
on a well-by-well basis using a calculation based on the new royalty regulation implemented in 2009 with a cap of
30 percent. The sliding scale provides varying rates based on productivity (a higher royalty is payable from wells with
higher production rates) and commodity prices (a higher royalty is payable in times of higher natural gas and crude
oil prices). This area is also subject to freehold mineral taxes (which are included as royalties for financial reporting
purposes) and overriding royalties related to farm-in arrangements.
The Brazeau property is primarily subject to Crown royalties payable to the provincial government and overriding royalties
on oil, natural gas and NGL production. These types of royalties are also sensitive to production levels and commodity
prices; therefore, the Company’s royalties will continue to fluctuate with commodity prices, well production rates,
production declines of existing wells along with the performance and location of new wells drilled.
For the fourth quarter of 2014, royalties totalled $16.3 million or 23 percent of revenue compared to $12.9 million or
25 percent of revenue for the same quarter in 2013 and $18.1 million or 21 percent of revenue in the third quarter of
2014. The year-over-year royalty rate decrease was due to new production from the Company’s wells brought on-stream
during the past few quarters, some of which qualify for the 5 percent royalty holiday under the Government of Alberta’s
royalty framework.

DTX .TO ANNUAL REPORT
201425
During the year ended December 31, 2014, royalties totalled $68.6 million or 23 percent of revenue compared to
$40.3 million or 23 percent of revenue for 2013.
OPERATING AND TRANSPORTATION EXPENSES
Three Months Ended December 31, Year Ended December 31,
2014 2013 2014 2013
Operating expenses ($000s) 8,798 7,962 39,032 25,998
Transportation expenses ($000s) 3,507 1,391 9,016 5,448
Total operating and transportation expenses ($000s) 12,305 9,353 48,048 31,446
Operating expenses ($/boe) 7.45 10.03 9.44 9.91
Transportation expenses ($/boe) 2.97 1.75 2.18 2.08
Total operating and transportation expenses ($/boe) 10.42 11.78 11.62 11.99
Operating costs include all costs associated with the production of crude oil and natural gas. The major components
of operating costs include charges for contract operating, processing fees, lease rentals, property and pipeline taxes,
utilities and well maintenance charges.
Operating expenses for the fourth quarter of 2014 totalled $8.8 million or $7.45/boe compared to $8.0 million or
$10.03/boe in the same period of 2013 and $10.9 million or $9.63/boe in the third quarter of 2014. The year-over year
decrease was driven by the Company ceasing to have any wells on extended flow-back until being tied into a pipeline
(which had contributed to higher operating costs for the past few quarters) as well as the effects of an over-estimation of
operating expenses in the third quarter of 2014.
Transportation expenses for the three months ended December 31, 2014 were $3.5 million or $2.97/boe compared to
$1.4 million or $1.75/boe in the fourth quarter of 2013 and $2.2 million or $1.95/boe in the third quarter of 2014. Over
the past year, the Company has increased production of crude oil and NGLs, and the transportation costs associated
with those products consist primarily of pipeline tariffs, terminal charges and trucking (crude oil and NGLs incur a higher
cost per boe for transportation than natural gas). When the Company experiences pipeline capacity constraints, it must
use alternative means of transportation to move production volumes to market. In particular, the Company saw a large
increase in the cost per barrel for clean oil trucking during the fourth quarter of 2014 and expects this to continue into
early 2015.
For the year ended December 31, 2014, the Company incurred operating expenses of $39.0 million or $9.44/boe compared
to $26.0 million or $9.91/boe in 2013. Transportation expenses for the year totalled $9.0 million or $2.18/boe versus
$5.4 million or $2.08/boe last year.
RISK MANAGEMENT
DeeThree maintains a risk management program to reduce the volatility of revenues and to increase the certainty of
funds from operations. DeeThree considers all of its risk management contracts to be effective economic hedges of
the underlying business transactions. The Company had the following crude oil, foreign exchange and interest rate risk
management contracts, with a short-term mark-to-market asset of $23.3 million at December 31, 2014 (September 30,
2014 – short-term asset of $0.6 million and $0.1 million long-term asset and December 31, 2013 – short-term liability of
$2.2 million):

DTX .TO ANNUAL REPORT2014
26
CRUDE OIL CONTRACTS
Period Commodity Type of Contract Quantity Pricing Point Contract Price
Jan.1/15 – Dec.31/15 Crude Oil Collar 500 bbls/d WTI-NYMEX US$85.00/bbl (floor) – US$100.80/bbl (cap)
Jan.1/15 – Dec.31/15 Crude Oil Fixed 500 bbls/d WTI-NYMEX Cdn$99.00/bbl
Jan.1/15 – Dec.31/15 Crude Oil Fixed 500 bbls/d WTI-NYMEX Cdn$99.39/bbl
Jan.1/15 – Dec.31/15 Crude Oil Fixed 500 bbls/d WTI-NYMEX Cdn$100.00/bbl
FOREIGN EXCHANGE CONTRACT
Pricing Point Period Currency Type of Contract Quantity (Cdn$/US$)
Jan. 1/15 – Dec. 31/15 US$ Average Rate Range Forward US$1,300,000 Trigger – 1.1300 Cdn$/US$ Floor – 1.100 Cdn$/US$ Ceiling – 1.1110 Cdn$/US$
INTEREST RATE CONTRACT
Term Amount Fixed Rate Index
Feb. 18 /14 – Feb. 18/16 Cdn$40 million 1.44% CDOR
Subsequent to December 31, 2014, DeeThree entered into the following crude oil risk management contracts:
CRUDE OIL CONTRACTS
Period Commodity Type of Contract Quantity Pricing Point Contract Price
March 1/15 – June 30/16 Crude Oil Fixed 250 bbls/d WTI-NYMEX Cdn$72.92/bbl
Jan.1/16 – Dec. 31/16 Crude Oil Fixed 250 bbls/d WTI-NYMEX Cdn$78.00/bbl
Gains and losses on risk management contracts are composed both of unrealized gains or losses that represent the
change in the mark-to-market position of those contracts throughout the period and of realized gains and losses
representing the portion of the contracts that have settled in cash during the period. The Company has elected not to
use hedge accounting for its current risk management contracts.
Three Months Ended December 31, Year Ended December 31,
2014 2013 2014 2013
Unrealized loss (gain) on financial instruments ($000s) (22,572) (524) (25,494) 3,074
Unrealized loss (gain) on financial instruments ($/boe) (19.11) (0.66) (6.17) 1.17
Three Months Ended December 31, Year Ended December 31,
2014 2013 2014 2013
Realized loss (gain) on financial instruments ($000s) (4,661) 548 426 2,226
Realized loss (gain) on financial instruments ($/boe) (3.95) 0.69 0.10 0.85

DTX .TO ANNUAL REPORT
201427
During the fourth quarter of 2014, the Company recorded an unrealized gain on financial instruments of $22.6 million
and a realized gain of $4.7 million. In the same period of the prior year, the Company recorded an unrealized gain of
$0.5 million and a realized loss of $0.5 million. In the previous quarter, the Company recorded an unrealized gain of
$6.1 million and a realized loss of $0.7 million. The unrealized gain resulted from the mark-to-market of financial risk
management contracts at the period end. These non-cash unrealized derivative gains are generated by the change
over the reporting period in the mark-to-market valuation of DeeThree’s risk management contracts, which fluctuated
significantly in the fourth quarter of 2014 due to the change in the forward price curves for crude oil. The realized
gains or losses represent actual cash settlements under the respective commodity, foreign exchange and interest rate
contracts in the respective periods.
For the year ended December 31, 2014, the Company recorded an unrealized gain of $25.5 million and a realized loss
of $0.4 million compared to an unrealized loss of $3.1 million and a realized loss of $2.2 million, respectively, for 2013.
GENERAL AND ADMINISTRATIVE (G&A) EXPENSES
Three Months Ended December 31, Year Ended December 31,
2014 2013 2014 2013
($000s except per boe)
Gross G&A expense 3,923 3,303 11,343 9,171
Capitalized G&A (direct) (863) (848) (2,297) (2,012)
Overhead recoveries (163) (225) (735) (651)
G&A expense (net) 2,897 2,230 8,311 6,508
G&A expense (net) ($/boe) 2.45 2.81 2.01 2.48
Gross G&A expense totalled $3.9 million for the three-month period ended December 31, 2014 compared to
$3.3 million in the comparable period of 2013 and $2.2 million in the third quarter of 2014. Net G&A costs were
$2.9 million or $2.45/boe in the fourth quarter of 2014 compared to $2.2 million or $2.81/boe a year earlier and
$1.6 million or $1.41/boe in the third quarter of 2014. When compared to the same quarter of the prior year, gross G&A
costs increased on an absolute basis due to increased staffing costs (including salaries, bonuses, consulting and office
rent) required to manage DeeThree’s growing business. Additionally, $0.5 million in bad debt expense was recognized
during the fourth quarter of 2014, compared to $nil in the same period in 2013. In the fourth quarter of 2014, the
Company had an average of 37 full-time employees and three consultants versus 26 full-time employees and seven
consultants in the same period of 2013.
The Company capitalized direct G&A expenses amounting to $0.9 million and had overhead recoveries of $0.2 million
in the fourth quarter of 2014 versus $0.8 million and $0.2 million, respectively, in the comparative period of 2013, and
$0.4 million and $0.2 million, respectively, in the third quarter of 2014.
Net G&A expenses for the year ended December 31, 2014 totalled $8.3 million or $2.01/boe compared to $6.5 million
or $2.48/boe for 2013. During the year ended December 31, 2014, the Company capitalized $2.3 million in direct costs
related to its exploration and development efforts and $0.7 million of overhead recoveries compared to $2.0 million and
$0.7 million, respectively, in 2013.

DTX .TO ANNUAL REPORT2014
28
SHARE-BASED COMPENSATION
Three Months Ended December 31, Year Ended December 31,
2014 2013 2014 2013
($000s except per boe)
Gross share-based compensation 1,346 948 5,036 3,613
Share-based compensation reclassified to operating costs (43) (43) (167) (188)
Capitalized share-based compensation (561) (375) (1,967) (1,375)
Share-based compensation expense (net) 742 530 2,902 2,050
Share-based compensation expense (net) ($/boe) 0.63 0.67 0.70 0.78
The Company has a stock option plan, which is described in note 10 to the financial statements for the years ended
December 31, 2014 and 2013. Options granted under the plan have a four-year vesting term and expire five years from
the grant date, with the fair value of options granted estimated at the grant date using the Black-Scholes option-pricing
model. At December 31, 2014, the Company had 7,676,328 options outstanding under this plan.
Share-based compensation expense is a non-cash expense that reflects the amortization over the vesting period of
the fair value of stock options granted to the Company’s employees, consultants and directors. For those stock options
granted to field employees, their portion of the share-based compensation is reclassified to operating expenses, in order
to be consistent with the recognition of their salaries on the statement of operations and comprehensive income.
For the quarter ended December 31, 2014, the Company incurred net share-based compensation expense of
$0.7 million or $0.63/boe versus $0.5 million or $0.67/boe in the same period of 2013 and $0.9 million or $0.80/boe in
the third quarter of 2014. The year-over-year absolute increase was directly attributable to grants issued during the year
and the resulting share-based compensation from those issuances.
During 2014, DeeThree incurred net share-based compensation expense of $2.9 million or $0.70/boe compared to
$2.1 million or $0.78/boe recorded in 2013.
DEPLETION AND DEPRECIATION (D&D) EXPENSE
Three Months Ended December 31, Year Ended December 31,
2014 2013 2014 2013
Depletion and depreciation expense ($000s) 23,785 15,984 80,799 51,309
Depletion and depreciation expense ($/boe) 20.14 20.15 19.55 19.57
DeeThree records D&D expense on its property and equipment over the individual useful lives of the assets, employing
the unit-of-production method using proved plus probable reserves and associated estimated future development capital
required for its oil and natural gas assets, the straight-line method for field facilities (20-year useful life) and the declining-
balance method on corporate assets (20 to 30 percent). Assets in the E&E phase are not amortized.
For the three months ended December 31, 2014, the Company recorded D&D expense of $23.8 million or $20.14/boe
compared to $16.0 million or $20.15/boe in the same period of 2013 and $21.8 million or $19.25/boe in the third
quarter of 2014. The absolute increase in D&D expense year-over-year is attributable to the 49 percent and 4 percent
respective increases in production volumes, slightly offset by lower costs related to finding and developing reserves.
During 2014, D&D expense was $80.8 million or $19.55/boe compared to $51.3 million or $19.57/boe in 2013.

DTX .TO ANNUAL REPORT
201429
LOSS ON DISPOSITIONS
Three Months Ended December 31, Year Ended December 31,
2014 2013 2014 2013
Loss on dispositions ($000s) 90 – 90 –
Loss on dispositions ($/boe) 0.08 – 0.02 –
For the three months ended December 31, 2014, the Company recorded a loss on dispositions of $0.09 million or
$0.08/boe. The loss was the result of the disposition of a minor property to the joint venture partner during the fourth
quarter. There were no such expenses during the same quarter of the prior year or in the third quarter of 2014.
During 2014, the loss on dispositions was $0.09 million or $0.02/boe.
IMPAIRMENT OF OIL AND GAS PROPERTIES
Impairment is recognized when the carrying value of an asset or group of assets (referred to as a cash-generating unit or
CGU) exceeds its recoverable amount, defined as the higher of its value in use and fair value less costs to sell. Any asset
impairment is recoverable to its original value less associated D&D expense should there be indicators that the asset’s
recoverable value has increased since the time of recording the initial impairment. Impairment testing is performed at
the CGU level and is required when there are indicators of impairment, such as a significant drop in commodity prices
or a write-down of proved or probable reserves. No impairment charges were recorded in 2014.
IMPAIRMENT OF FIELD FACILITIES
Three Months Ended December 31, Year Ended December 31,
2014 2013 2014 2013
Impairment of field facilities ($000s) – 1,317 – 1,317
Impairment of field facilities ($/boe) – 1.66 – 0.50
During the fourth quarter of 2013, DeeThree expensed some costs related to an original facility in the Ferguson area. No
such expenses were incurred during the year ended December 31, 2014.

DTX .TO ANNUAL REPORT2014
30
EXPLORATION AND EVALUATION (E&E) EXPENSE
Three Months Ended December 31, Year Ended December 31,
2014 2013 2014 2013
Exploration and evaluation expense ($000s) 859 3,160 9,318 8,876
Exploration and evaluation expense ($/boe) 0.73 3.98 2.25 3.39
DeeThree accumulates costs related to its E&E assets in one pool pending determination of an asset’s technical feasibility
and commercial viability. E&E costs are primarily for seismic data, undeveloped land and drilling until the well in question
is complete and results have been evaluated. Costs related to wells determined to be uneconomical as well as costs of
undeveloped land lease expiries are expensed as they occur.
During the fourth quarter of 2014, the Company recorded E&E expense of $0.9 million or $0.73/boe, which included
$0.2 million of lease expiries in several of the Company’s areas, $0.7 million related to the write-off of preliminary drilling
costs, and a $0.2 million dollar recovery related to a dry and abandoned well that was written off during the third quarter
of 2014. This compares to $3.2 million or $3.98/boe in the same period of 2013. During the third quarter of 2014, E&E
expense consisted of $6.5 million or $5.75/boe of lease expiries and costs related to dry and abandoned wells.
During the year ended December 31, 2014, the Company recorded E&E expense of $9.3 million or $2.25/boe compared
to $8.9 million or $3.39/boe during 2013.
ACCRETION AND FINANCE EXPENSES
Three Months Ended December 31, Year Ended December 31,
2014 2013 2014 2013
($000s except per boe)
Accretion expense on decommissioning liabilities 228 188 850 497
Finance expense 1,410 942 4,921 3,038
Total accretion and finance expenses 1,638 1,130 5,771 3,535
Accretion expense on decommissioning liabilities ($/boe) 0.19 0.24 0.21 0.19
Finance expense ($/boe) 1.19 1.19 1.19 1.16
Total accretion and finance expenses ($/boe) 1.38 1.43 1.40 1.35
Accretion expense represents the increase in the present value of the Company’s decommissioning liabilities. In the
fourth quarter of 2014, the Company recorded accretion expense of $0.2 million or $0.19/boe compared to $0.2 million
or $0.24/boe in the same period of 2013 and $0.2 million or $0.19/boe in the third quarter of 2014.
During the three months ended December 31, 2014, the Company recorded interest and finance expenses of
$1.4 million or $1.19/boe compared to $0.9 million or $1.19/boe in the same period of 2013 and $1.0 million or
$0.92/boe in the previous quarter. The Company incurred interest charges and standby fees related to the $310 million
credit facility, which was drawn to $139.2 million at the end of the year (December 31, 2013 – $88.4 million; September
30, 2014 – $107.5 million).
For the year ended December 31, 2014, the Company recorded accretion expense of $0.9 million or $0.21/boe compared
to $0.5 million or $0.19/boe in 2013. The Company also recorded finance expense of $4.9 million or $1.19/boe in 2014
compared to $3.0 million or $1.16/boe in the prior year.

DTX .TO ANNUAL REPORT
201431
INCOME TAXES
Three Months Ended December 31, Year Ended December 31,
2014 2013 2014 2013
Deferred income tax expense ($000s) 10,285 1,974 28,331 9,253
Deferred income tax expense ($/boe) 8.71 2.49 6.85 3.53
During the fourth quarter of 2014, the Company recorded a deferred income tax expense of $10.3 million or
$8.71/boe compared to $2.0 million or $2.49/boe in the same period of 2013 and $8.2 million or $7.28/boe in the third
quarter of 2014. The fourth quarter expense was primarily related to positive net income in the period as well as an
increase in the taxable base of the oil and natural gas assets, driven by capital spending during the period as well as
the impact of capital spending associated with flow-through shares. As costs are incurred, the Company reverses the
flow-through share liability and recognizes the deferred income tax expense at that time. During the three months ended
December 31, 2014, the Company spent approximately $4.7 million in eligible exploration expenditures related to the
May 2014 issuance of flow-through shares.
For the year ended December 31, 2014, the Company recorded a deferred income tax expense of $28.3 million or
$6.85/boe compared to $9.3 million or $3.53/boe in 2013. During 2014, the Company spent approximately $14.4 million
in eligible exploration expenditures related to the December 2013 and May 2014 issuances of flow-through shares.
DeeThree does not have current income taxes payable and does not expect to pay current income taxes in 2014 as the
Company had estimated tax pools available at December 31, 2014 of $499 million (December 31, 2013 – $386 million).

DTX .TO ANNUAL REPORT2014
32
NETBACKS (PER UNIT) (1)
Three Months Ended December 31, Year Ended December 31,
2014 2013 2014 2013
($/boe)
Average sales price 59.21 65.37 73.38 67.88
Royalties (13.78) (16.21) (16.60) (15.39)
Operating expenses (7.45) (10.03) (9.44) (9.91)
Transportation expenses (2.97) (1.75) (2.18) (2.08)
Operating netback (2) 35.01 37.38 45.16 40.50
G&A and other expenses (excludes non-cash items) (2.45) (2.81) (2.01) (2.48)
Realized gain (loss) on financial instruments 3.95 (0.69) (0.10) (0.85)
Impairment of field facilities – (1.66) – (0.50)
Finance expense (1.19) (1.19) (1.19) (1.16)
Funds flow netback (2) 35.32 31.03 41.86 35.51
D&D expense (20.14) (20.15) (19.55) (19.57)
Loss on dispositions (0.08) – (0.02) –
Accretion (0.19) (0.24) (0.21) (0.19)
Share-based compensation (0.63) (0.67) (0.70) (0.78)
Unrealized gain (loss) on financial instruments 19.11 0.66 6.17 (1.17)
E&E expense (0.73) (3.98) (2.25) (3.39)
Deferred income tax expense (8.71) (2.49) (6.85) (3.53)
Net income netback (2) 23.95 4.16 18.45 6.88
(1) For a description of the boe conversion ratio, refer to “Other Measurements” below.(2) Non-GAAP measure; refer to the commentary below. Operating netback, funds flow netback and net income netback are calculated by dividing operating
income, funds flow from operations and net income by the sales volume in boe for the period then ended. For a description of the boe conversion ratio, refer to “Other Measurements” below.
The operating netback was $35.01/boe for the three months ended December 31, 2014 compared to $37.38/boe in the
same period of 2013 and $49.50/boe in the third quarter of 2014. The Company experienced a lower realized average
sales price in the three months ended December 31, 2014 as well as lower royalties and operating expenses but higher
transportation costs than in the prior year’s fourth quarter, resulting in a lower operating netback. As compared to the
third quarter of 2014, the Company also realized a lower average price due to a decrease in WTI prices, contributing to
the decrease in operating netback quarter-over-quarter.
For 2014, DeeThree achieved an operating netback of $45.16/boe compared to $40.50/boe in 2013, due to higher
average pricing throughout the year, partially offset by higher royalties and transportation costs and slightly lower
operating expenses.

DTX .TO ANNUAL REPORT
201433
INVESTMENT AND INVESTMENT EFFICIENCIES
CAPITAL EXPENDITURES AND ACQUISITIONS (excluding decommissioning liabilities and capitalized share-based compensation)
Three Months Ended December 31, Year Ended December 31,
2014 2013 2014 2013
($000s except number of wells)
Property acquisitions and adjustments 11,282 5,228 22,599 11,694
Drilling and completions
Completion of prior-period drilled wells (727) 1,399 2,287 1,874
Current-period drilling and completion 38,282 33,415 202,579 144,890
Future drilling and work-overs 1,069 1,078 2,714 2,333
38,624 35,892 207,580 149,097
Equipment and facilities
Tie-in of prior-period drilled wells 402 1,304 709 1,477
Tie-in of current-period drilled wells 2,857 2,718 17,441 14,852
Facilities, pipelines and work-overs 7,968 7,129 35,752 20,073
11,227 11,151 53,902 36,402
Land and lease retention 2,933 934 8,931 9,650
Geological and geophysical 12 1,924 1,184 2,923
Capitalized G&A and other 886 943 2,353 2,119
Total capital expenditures 64,964 56,072 296,549 211,885
Total wells drilled (#) 8 (8.0) 7 (7.0) 47 (46.93) 35 (34.15)
During the fourth quarter of 2014, the Company incurred a total of $65.0 million (fourth quarter 2013 – $56.1 million) in
capital expenditures, excluding non-cash decommissioning liabilities and capitalized share-based compensation. During
the period, $11.3 million was spent to complete several minor acquisitions (fourth quarter 2013 – $5.2 million). Drilling
and completion expenditures totalled $38.6 million in the fourth quarter of 2014 (fourth quarter 2013 – $35.9 million),
$11.2 million was spent on tie-ins and facilities (fourth quarter 2013 – $11.2 million), $2.9 million on land sales (fourth
quarter 2013 – $0.9 million) and $0.01 million related to seismic programs (fourth quarter 2013 – $1.9 million). The
remaining $0.9 million in the fourth quarter of 2014 (fourth quarter 2013 – $0.9 million) was invested in capitalized G&A
and other corporate assets.
For the year ended December 31, 2014, the Company incurred a total of $296.5 million (2013 – $211.9 million) in
capital expenditures, excluding the non-cash decommissioning liabilities and capitalized share-based compensation.
During the year, the Company spent $22.6 million to complete several minor acquisitions (2013 – $11.7 million). Drilling
and completion expenditures totalled $207.6 million (2013 – $149.1 million), $53.9 million was spent on tie-ins and
facilities (2013 – $36.4 million), $8.9 million on land sales (2013 – $9.7 million) and $1.2 million related to seismic
programs (2013 – $2.9 million). The remaining $2.4 million spent during the year ended December 31, 2014 (2013 –
$2.1 million) was invested in capitalized G&A and other corporate assets.

DTX .TO ANNUAL REPORT2014
34
DRILLING ACTIVITY
Exploration Development Total
Gross Net Gross Net Gross Net
(#) (#) (#) (#) (#) (#)
Three Months Ended December 31, 2014
Crude oil – – 8 8.00 8 8.00Dry and abandoned – – – – – –
Total wells – – 8 8.00 8 8.00
Success rate (%) – 100 100Average working interest (%) – 100 100
Three Months Ended December 31, 2013
Crude oil 1 1.00 5 5.00 6 6.00
Dry and abandoned 1 1.00 – – 1 1.00
Total wells 2 2.00 5 5.00 7 7.00
Success rate (%) 50 100 86
Average working interest (%) 100 100 100
Year Ended December 31, 2014
Gas – – 1 1.00 1 1.00Crude oil 2 2.00 41 40.93 43 42.93Dry and abandoned 3 3.00 – – 3 3.00
Total wells 5 5.00 42 41.93 47 46.93
Success rate (%) 40 100 94Average working interest (%) 100 100 100
Year Ended December 31, 2013
Crude oil 4 3.97 28 27.22 32 31.19
Dry and abandoned 3 2.97 – – 3 2.97
Total wells 7 6.94 28 27.22 35 34.16
Success rate (%) 57 100 91
Average working interest (%) 99 97 98
During the fourth quarter of 2014, DeeThree drilled a total of 8 gross (8.0 net) crude oil development wells with a
100 percent success rate. During the three months ended December 31, 2013, the Company drilled 5 gross (5.0 net)
development wells, all of which were targeting crude oil. The Company also drilled 2 gross (2.0 net) exploratory wells,
one of which was a successful crude oil exploratory well, and one of which was dry and abandoned.
During the year ended December 31, 2014, DeeThree drilled 47 gross (46.93 net) wells in total, including 41 gross
(40.93 net) development wells targeting crude oil, 1 gross (1.0 net) development gas well and 5 gross (5.0 net) exploration
wells, 3 of which were vertical stratigraphic test wells outside the core Ferguson area and were deemed to be dry and
abandoned in the period, and 2 of which were crude oil wells. During the year ended December 31, 2013, the Company

DTX .TO ANNUAL REPORT
201435
drilled a total of 35 gross (34.16 net) wells, including 28 gross (27.22 net) development wells targeting crude oil, and 7
gross (6.94 net) exploration wells, of which 4 gross (3.97 net) successfully targeted oil and 3 gross (2.97 net) were dry
and abandoned.
DRILLING ACTIVITY BY AREA
Peace River Brazeau Ferguson Arch Total
(#) (#) (#) (#)
Three Months Ended December 31, 2014
Crude oil 8 (8.00) – (–) – (–) 8 (8.00)Dry and abandoned – (–) – (–) – (–) – (–)
Total wells 8 (8.00) – (–) – (–) 8 (8.00)
Success rate (%) 100 – – 100Average working interest (%) 100 – – 100
Three Months Ended December 31, 2013
Crude oil 5 (5.00) 1 (1.00) – (–) 6 (6.00)
Dry and abandoned 1 (1.00) – (–) – (–) 1 (1.00)
Total wells 6 (6.00) 1 (1.00) – (–) 7 (7.00)
Success rate (%) 83 100 – 86
Average working interest (%) 100 100 – 100
Year Ended December 31, 2014
Gas 1 (1.00) – (–) – (–) 1 (1.00)Crude oil 27 (26.93) 15 (15.00) 1 (1.00) 43 (42.93)Dry and abandoned – (–) 3 (3.00) – (–) 3 (3.00)
Total wells 28 (27.93) 18 (18.00) 1 (1.00) 47 (46.93)
Success rate (%) 100 83 100 94Average working interest (%) 100 100 100 100
Year Ended December 31, 2013
Crude oil 15 (14.90) 16 (16.00) 1 (0.29) 32 (31.19)
Dry and abandoned 2 (1.97) 1 (1.00) – (–) 3 (2.97)
Total wells 17 (16.87) 17 (17.00) 1 (0.29) 35 (34.16)
Success rate (%) 88 94 100 91
Average working interest (%) 99 100 29 98
During the fourth quarter of 2014, DeeThree drilled a total of 8 gross (8.0 net) wells, all on its Brazeau property, with a
100 percent success rate. During the three months ended December 31, 2013, the Company drilled 7 gross (7.0 net)
wells for an 86 percent success rate, including 6 gross (6.0 net) horizontal Belly River wells in the Brazeau area, and
1 gross (1.0 net) Bakken well in the Ferguson area.

DTX .TO ANNUAL REPORT2014
36
During 2014, DeeThree drilled 47 gross (46.93 net) wells in total, including 28 gross (27.93 net) wells on its Brazeau
property, 18 gross (18 net) Bakken wells on its Ferguson property and 1 gross (1 net) well in the Peace River Arch area,
with a 94 percent success rate. During 2013, the Company drilled 35 gross (34.16 net) wells for a 91 percent success
rate, including 17 gross (16.87 net) horizontal Belly River wells in the Brazeau area, 17 gross (17.0 net) Bakken wells in
the Ferguson area and 1 gross (0.29 net) non-operated well in the Peace River Arch area.
LIQUIDITY AND FINANCIAL RESOURCES
WORKING CAPITAL (1)
The following table summarizes the change in working capital during the years ended December 31, 2014 and 2013:
Years Ended December 31, 2014 2013
($000s)
Working capital deficit (1) – beginning of period (119,787) (77,586)
Funds from operations 173,196 93,295
Capital expenditures (273,950) (200,191)
Acquisitions (22,599) (11,694)
Issuance of capital stock for cash (net of share issuance costs) 71,810 76,822
Abandonment and reclamation costs (17) (433)
Working capital deficit (1) – end of period (171,347) (119,787)
(1) Working capital deficit, which is calculated as current liabilities (excluding derivative financial instruments) and bank debt less current assets (excluding derivative financial instruments), is not a recognized measure under IFRS. Please refer to the commentary under “Non-GAAP Measurements” for further discussion.
DeeThree entered 2014 with a working capital deficit of $119.8 million. During the year, the Company generated funds
from operations of $173.2 million and invested $274 million in capital expenditures and $22.6 million in acquisitions for
total capital spending of $296.5 million. In the second quarter of 2014, the Company issued 5,714,200 common shares
at a price of $11.10 per share for total gross proceeds of $63.4 million ($60.0 million net of estimated share issuance
costs), including 304,200 common shares issued pursuant to the partial exercise of the over-allotment and 752,000
flow-through shares at a price of $13.30 per share for total gross proceeds of $10.0 million ($9.4 million net of estimated
share issuance costs). The Company also issued common shares on the exercise of options for $2.4 million, for total
cash proceeds of $71.8 million. DeeThree exited 2014 with a working capital deficit of $171.3 million.
The Company may utilize any of the following strategies to address its working capital deficiency and to fund its capital
program: (i) issue new shares; (ii) issue new debt securities; (iii) amend, revise, renew or extend the terms of the
existing $310 million committed term syndicated credit facility (the “Syndicated Facility”); (iv) enter into new agreements
establishing new credit facilities; and (v) adjust its capital spending.
At December 31, 2014, the Company’s Syndicated Facility had an authorized borrowing base of $310 million, including
a $280 million extendible revolving facility and a $30 million operating facility. At the period end, the facility was drawn
to approximately $139.2 million with $170.8 million of unused borrowing capacity.
The Syndicated Facility is available for a revolving period of 364 days plus a one-year term-out, which is extendible
annually, subject to syndicate approval. Repayments of principal are not required provided that the borrowings under the
Syndicated Facility do not exceed the authorized borrowing amount and the Company is in compliance with covenants,
representations and warranties. As at December 31, 2014, the Company was in compliance with all covenants. Covenants
include reporting requirements, permitted indebtedness, permitted hedging and other standard business operating
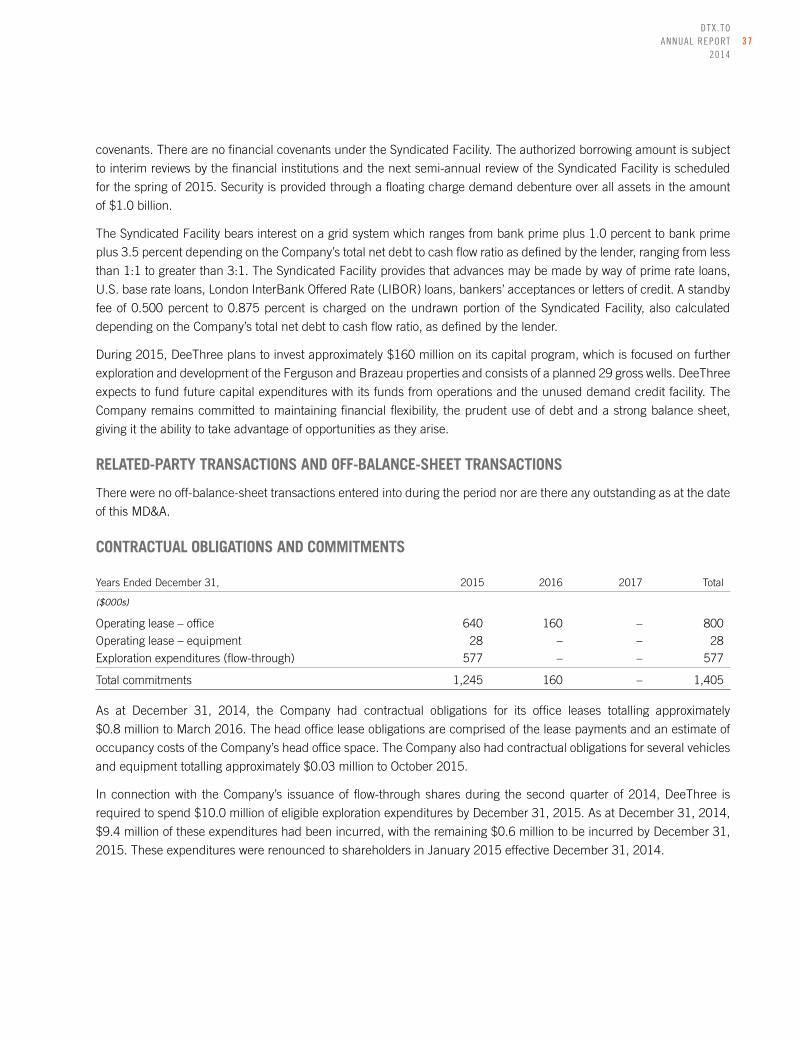
DTX .TO ANNUAL REPORT
201437
covenants. There are no financial covenants under the Syndicated Facility. The authorized borrowing amount is subject
to interim reviews by the financial institutions and the next semi-annual review of the Syndicated Facility is scheduled
for the spring of 2015. Security is provided through a floating charge demand debenture over all assets in the amount
of $1.0 billion.
The Syndicated Facility bears interest on a grid system which ranges from bank prime plus 1.0 percent to bank prime
plus 3.5 percent depending on the Company’s total net debt to cash flow ratio as defined by the lender, ranging from less
than 1:1 to greater than 3:1. The Syndicated Facility provides that advances may be made by way of prime rate loans,
U.S. base rate loans, London InterBank Offered Rate (LIBOR) loans, bankers’ acceptances or letters of credit. A standby
fee of 0.500 percent to 0.875 percent is charged on the undrawn portion of the Syndicated Facility, also calculated
depending on the Company’s total net debt to cash flow ratio, as defined by the lender.
During 2015, DeeThree plans to invest approximately $160 million on its capital program, which is focused on further
exploration and development of the Ferguson and Brazeau properties and consists of a planned 29 gross wells. DeeThree
expects to fund future capital expenditures with its funds from operations and the unused demand credit facility. The
Company remains committed to maintaining financial flexibility, the prudent use of debt and a strong balance sheet,
giving it the ability to take advantage of opportunities as they arise.
RELATED-PARTY TRANSACTIONS AND OFF-BALANCE-SHEET TRANSACTIONS
There were no off-balance-sheet transactions entered into during the period nor are there any outstanding as at the date
of this MD&A.
CONTRACTUAL OBLIGATIONS AND COMMITMENTS
Years Ended December 31, 2015 2016 2017 Total
($000s)
Operating lease – office 640 160 – 800
Operating lease – equipment 28 – – 28
Exploration expenditures (flow-through) 577 – – 577
Total commitments 1,245 160 – 1,405
As at December 31, 2014, the Company had contractual obligations for its office leases totalling approximately
$0.8 million to March 2016. The head office lease obligations are comprised of the lease payments and an estimate of
occupancy costs of the Company’s head office space. The Company also had contractual obligations for several vehicles
and equipment totalling approximately $0.03 million to October 2015.
In connection with the Company’s issuance of flow-through shares during the second quarter of 2014, DeeThree is
required to spend $10.0 million of eligible exploration expenditures by December 31, 2015. As at December 31, 2014,
$9.4 million of these expenditures had been incurred, with the remaining $0.6 million to be incurred by December 31,
2015. These expenditures were renounced to shareholders in January 2015 effective December 31, 2014.

DTX .TO ANNUAL REPORT2014
38
SHARE CAPITAL
As at March 25, 2015, the Company had the following equity securities outstanding:
Common shares outstanding 88,974,460
Stock options outstanding 7,676,328
SELECTED QUARTERLY INFORMATION (1)
Three Months Ended Dec. 31, Sept. 30, June 30, March 31, Dec. 31, Sept. 30, June 30, March 31, 2014 2014 2014 2014 2013 2013 2013 2013
(000s, except per share amounts ($) ($) ($) ($) ($) ($) ($) ($) and production figures)
Oil and natural gas revenues 69,957 87,188 80,560 65,643 51,865 55,754 39,882 30,490
Funds from operations 41,773 52,720 43,167 35,536 24,660 29,410 22,437 16,788
Per share – basic 0.47 0.59 0.51 0.43 0.32 0.38 0.29 0.23
Per share – diluted 0.46 0.57 0.49 0.42 0.31 0.37 0.28 0.23
Cash flow from operating activities 54,239 62,290 44,103 23,607 25,499 32,073 21,876 18,000
Net income (loss) 28,312 21,106 18,133 8,682 3,305 8,570 6,800 (627)
Per share – basic 0.32 0.24 0.21 0.11 0.04 0.11 0.09 (0.01)
Per share – diluted 0.31 0.23 0.21 0.10 0.04 0.11 0.09 (0.01)
Total assets 743,202 686,496 626,620 564,393 497,280 457,679 387,056 353,574
Capital expenditures (2) 64,964 84,985 74,288 72,312 56,072 74,969 39,286 41,558
Working capital deficit (3) 171,347 148,329 116,064 155,517 119,787 131,295 86,338 70,174
Shareholders’ equity 463,509 433,613 410,944 321,640 311,070 263,800 253,336 244,909
Production
Natural gas (mcf/d) 16,510 13,395 12,967 12,381 10,251 8,910 10,093 10,279
Crude oil (bbls/d) 9,275 9,322 8,033 6,743 6,547 5,765 4,550 3,924
NGLs (bbls/d) 815 739 550 565 369 323 346 289
Total (boe/d) 12,842 12,294 10,744 9,372 8,625 7,573 6,578 5,926
(1) The selected quarterly information was prepared in accordance with the accounting principles described in the notes to the financial statements, except for funds from operations, which is not prescribed under IFRS (see “Non-GAAP Measurements” below).
(2) Total capital expenditures, including acquisitions.(3) Working capital deficit, which is calculated as current liabilities (excluding derivative financial instruments) and bank debt less current assets (excluding
derivative financial instruments), is not a recognized measure under IFRS. Please refer to the commentary under “Non-GAAP Measurements” for further discussion.

DTX .TO ANNUAL REPORT
201439
SELECTED ANNUAL INFORMATION (1)
Years Ended December 31, 2014 2013 2012 2011
(000s, except per share amounts and production figures) ($) ($) ($) ($)
Oil and natural gas revenues 303,348 177,991 85,112 32,747
Funds from operations 173,196 93,295 46,088 11,833
Per share – basic 2.01 1.23 0.69 0.21
Per share – diluted 1.95 1.18 0.68 0.21
Cash flow from operating activities 184,239 97,448 62,292 7,100
Net income (loss) 76,233 18,048 7,181 (12,573)
Per share – basic 0.89 0.24 0.11 (0.22)
Per share – diluted 0.86 0.23 0.11 (0.22)
Total assets 743,202 497,280 329,666 213,329
Capital expenditures 296,549 211,885 144,753 187,557
Working capital deficit 171,347 119,787 77,586 16,901
Shareholders’ equity 463,509 311,070 212,090 167,568
Production
Natural gas (mcf/d) 13,823 9,881 8,902 6,974
Crude oil (bbls/d) 8,353 5,205 2,472 561
NGL (bbls/d) 668 332 267 137
Total (boe/d) 11,325 7,184 4,223 1,860
(1) The selected annual information was prepared in accordance with the accounting principles described in the notes to the financial statements for the years in question, except for funds from operations, which is not prescribed under IFRS (see “Non-IFRS Measurements” below).
OUTLOOK
As announced in mid-January, the Company’s 2015 capital program includes planned expenditures of up to $160 million.
With 93 percent of capital spending focused on drilling and completing wells, DeeThree anticipates delivering production
growth of 18 percent year-over-year, to 13,300 boe per day in 2015. The Company is prudently managing its capital
expenditures and production levels in combination with debt and, at present, is on-track to meet these targets. DeeThree
will be focused throughout the year on meeting operational guidance while maintaining maximum financial and operational
flexibility. As such, the Company will continue to re-evaluate its capital spending in the context of commodity prices.
DeeThree remains focused on improving capital costs through further service cost reductions and added improvements
to well drilling and completion processes, including infill drilling with up to eight wells per common pad targeting multiple
zones at Brazeau.
With a slower pace of activity in 2015, along with the enhanced oil recovery (EOR) scheme on the Ferguson property,
the Company expects its production decline rate to improve by as much as 10 percent from the 40 percent corporate
decline experienced in 2014. DeeThree is targeting a further material improvement in capital efficiencies this year,
budgeting below $30,000 per flowing barrel of production added, Company-wide. As was announced in early March,
per-well results to date in 2015 have been so strong that the Company was able to reduce the planned number of first-
half 2015 wells from 10 to six, conserving additional capital without affecting planned production. The combination of
lower declines, improved capital efficiencies and reduced spending will enhance DeeThree’s sustainability.

DTX .TO ANNUAL REPORT2014
40
BUSINESS RISKS AND RISK MITIGATION
The DeeThree management team conducts focused strategic planning and has identified the key risks, uncertainties
and opportunities associated with the Company’s business that can affect its financial results. They include, but are not
limited to:
RESERVES AND RESOURCE ESTIMATES
DeeThree’s exploration and production activities are concentrated in the Western Canada Sedimentary Basin, where the
industry is very competitive. There are a number of risks facing participants in the oil and natural gas industry, some
of which are common to all businesses, while others are specific to the sector. These include risks such as finding
and developing oil and natural gas reserves economically, estimating reserves, producing the reserves in commercial
quantities, finding a suitable market at attractive commodity prices, financial and liquidity risks, and environmental and
safety risks.
DeeThree’s future oil and natural gas reserves and production and, therefore, its cash flows, will be highly dependent
on the Company’s success in exploiting its reserve base and acquiring additional reserves. The Company mitigates the
risk of finding and developing economical oil and natural gas reserves by utilizing a team of highly qualified professionals
with expertise and experience in these areas. DeeThree attempts to maximize drilling success by exploring areas that
have multi-zone opportunities, including targeting deeper horizons with uphole potential, continuously assessing new
acquisition opportunities to complement existing activities and balancing higher-risk exploratory drilling with lower-risk
development drilling.
Beyond exploration risk, there is the potential that the Company’s oil and natural gas reserves may not be economically
produced at prevailing prices. DeeThree minimizes this risk by generating exploration prospects internally, targeting
high-quality projects, operating the project, and by attempting to access sales markets through Company-owned
infrastructure or mid-stream operators.
DeeThree has retained an independent engineering consulting firm that assists the Company in evaluating oil and natural
gas reserves. Reserve values are based on a number of variable factors and assumptions such as commodity prices,
projected production, future production costs and governmental regulation. The reserves and recovery information
contained in the independent reserves evaluation is an estimate. The actual production and ultimate reserves from the
properties may be greater or less than the estimates prepared by the independent reserves evaluator.
VOLATILITY OF OIL AND NATURAL GAS PRICES
The Company’s operational results and financial condition depend on the prices received for oil and natural gas production.
Differentials on Canadian crude oil showed significant volatility throughout 2014 due to pipeline and infrastructure
constraints. There are numerous projects proposed to alleviate pipeline bottlenecks into and in the United States, expand
refinery capacity and expand or build new pipelines in Canada and the United States to source new markets, many of
which are in the regulatory application phase. There can be no assurance that such regulatory approvals will be secured
on a timely basis or at all. Any movement in oil and natural gas prices will have an effect on DeeThree’s ability to conduct
its capital expenditure program. Oil and natural gas prices are determined by economic and, in some circumstances,
political factors. Supply and demand factors, including weather and general economic conditions as well as conditions
in other oil and natural gas regions, influence prices.
DeeThree is exposed to commodity price risk whereby the fair value of future cash flows will fluctuate as a result of
changes in commodity prices. Commodity prices for oil and natural gas are affected by not only the relationship between
the Canadian and United States dollars, but also global economic events that dictate the levels of supply and demand.

DTX .TO ANNUAL REPORT
201441
The Company protects itself from fluctuations in prices by maintaining an appropriate hedging strategy and may enter
into oil and natural gas risk management contracts. If the Company engages in activities to manage its commodity price
exposure, it may forego the benefits it would otherwise experience if commodity prices were to increase. In addition,
commodity derivatives contract activities could expose DeeThree to losses. To the extent that DeeThree engages in risk
management activities related to commodity prices, it will be subject to credit risks associated with the counterparties
with which it contracts. As at the date of this MD&A, DeeThree has six crude oil hedges (refer to “Risk Management”
above for details).
OPERATIONAL MATTERS
The operation of oil and natural gas wells involves a number of operating and natural hazards that may result in blowouts,
environmental damage and other unexpected or dangerous conditions causing damage to DeeThree and possible liability
to third parties. DeeThree has established an environmental, health and safety program and has updated its operational
emergency response plan and operational safety manual to address these operational issues. DeeThree maintains a
comprehensive insurance plan, which includes liability insurance, where available, in amounts consistent with industry
standards, as well as business interruption insurance for selected facilities, to the extent that such insurance is available,
to mitigate risks and protect against significant losses where possible. DeeThree may become liable for damages arising
from such events against which it cannot insure or against which it may elect not to insure because of high premiums
or other reasons. DeeThree operates in accordance with all applicable environmental legislation and strives to maintain
compliance with such regulations. DeeThree’s mandate includes ongoing development of procedures, standards and
systems to allow its staff to make the best decisions possible and ensuring those decisions are in compliance with the
Company’s environmental, health and safety policies.
ACCESS TO CAPITAL
The oil and natural gas industry is a very capital-intensive industry and, in order to fully realize the Company’s strategic
goals and business plans, DeeThree will rely on equity markets as a source of new capital in addition to bank financing
and internally generated cash flow to fund its ongoing capital investments. DeeThree’s ability to raise additional capital
will depend on a number of factors that are beyond the Company’s control, such as general economic and market
conditions. Internally generated funds will also fluctuate with changing commodity prices. DeeThree currently has a
$310 million syndicated facility with five banks. The Company is required to comply with covenants under this facility and
in the event it does not comply, access to capital could be restricted or repayment could be required. DeeThree routinely
reviews the covenants based on actual and forecast results and has the ability to make changes to development plans
to comply with the covenants under the credit facility. DeeThree anticipates it will continue to have adequate liquidity to
fund its financial liabilities through its future funds from operations and available bank credit. DeeThree is committed
to maintaining a strong balance sheet along with an adaptable capital expenditure program that can be adjusted to
capitalize on, or reflect, acquisition opportunities and, if necessary, a tightening of liquidity sources. From its founding
to the date of this MD&A, DeeThree has had no defaults or breaches on its bank debt or any of its financial liabilities.
COUNTERPARTY RISK
DeeThree assumes customer credit risk associated with oil and gas sales, financial hedging transactions and joint
venture participants. In the event that DeeThree’s counterparties default on payments to DeeThree, cash flows will be
impacted. The Company may be exposed to third-party credit risk through its contractual arrangements with its current
or future joint venture partners, marketers of its commodities and other parties. DeeThree has established credit policies
and controls designed to mitigate the risk of default or non-payment with respect to oil and natural gas sales, financial
hedging transactions and joint venture participants. The Company makes every effort to sell its commodities to major
companies with excellent credit ratings.

DTX .TO ANNUAL REPORT2014
42
VARIATIONS IN INTEREST RATES AND FOREIGN EXCHANGE RATES
Variations in interest rates could result in an increase in the amount DeeThree pays to service debt. World oil prices
are quoted in US dollars and the price received by Canadian producers is therefore affected by the Canadian/US dollar
exchange rate, which may fluctuate over time. A material increase in the value of the Canadian dollar would, other
variables remaining constant, reduce DeeThree’s net production revenue. Volatility in interest rates and the Canadian
dollar may affect future cash flow from operations and reduce funds available for capital expenditures. DeeThree may
initiate certain derivative contracts to attempt to mitigate these risks. To the extent DeeThree engages in risk management
activities related to foreign exchange rates, it will be subject to credit risk associated with counterparties with which it
contracts. At the date of this MD&A, DeeThree has one foreign currency exchange risk management contract and one
interest rate swap risk management contract in place.
CHANGES IN INCOME TAX LEGISLATION
In the future, income tax laws or other laws may be changed or interpreted in a manner that adversely affects DeeThree
or its shareholders. Tax authorities having jurisdiction over DeeThree or its shareholders may disagree with how DeeThree
calculates its income for tax purposes to the detriment of DeeThree and its shareholders.
ENVIRONMENTAL CONCERNS
The oil and natural gas industry is subject to environmental regulation pursuant to local, provincial and federal legislation.
A breach of such legislation may result in the imposition of fines or issuance of clean-up orders in respect of DeeThree or
its working interests. Such legislation may be changed to impose higher standards and potentially more costly obligations
to DeeThree. DeeThree focuses on conducting transparent, safe and responsible operations in the communities in which
its people live and work.
PROJECT RISKS
DeeThree’s ability to execute projects and market oil and natural gas depends on numerous factors beyond its control,
including: availability of processing capacity, availability and proximity of pipeline capacity, availability of storage capacity,
supply of and demand for oil and natural gas, availability of alternative fuel sources, effects of inclement weather,
availability of drilling and related equipment, unexpected cost increases, accidental events, change in regulations, and
availability and productivity of skilled labour. Because of these factors, DeeThree could be unable to execute projects on
time, on budget or at all, and may not be able to effectively market the oil and natural gas that it produces.
In addition, DeeThree is also subject to other risks and uncertainties which are described in the Company’s Annual
Information Form (AIF) dated March 25, 2015.
CRITICAL ACCOUNTING ESTIMATES
The preparation of the Company’s financial statements requires management to adopt accounting policies that involve
the use of significant estimates and assumptions. They are developed based on the best available information and
are believed by management to be reasonable under the circumstances. New events or additional information may
result in the revision of these estimates over time. DeeThree’s financial and operating results incorporate certain
estimates, including:
• Estimated revenues, royalties and operating expenses on production as at a specific reporting date but for which actual
revenues and costs have not yet been received;
• Estimated capital expenditures on projects that are in progress;

DTX .TO ANNUAL REPORT
201443
• Estimated D&D charges that are based on estimates of oil and gas reserves that DeeThree expects to recover in the
future;
• Estimated fair values of financial instruments that are subject to fluctuation depending on underlying commodity
prices, foreign exchange rates and interest rates, volatility curves and the risk of non-performance;
• Estimated value of decommissioning liabilities that depend on estimates of future costs and timing of expenditures;
• Estimated future recoverable value of PP&E and any associated impairment charges or recoveries; and
• Estimated compensation expense under DeeThree’s share-based compensation plan.
DeeThree has hired individuals and consultants who have the skills required to make such estimates and ensures
that individuals or departments with the most knowledge of the activity are responsible for the estimates. Further, past
estimates are reviewed and compared to actual results, and actual results are compared to budget in order to make more
informed decisions on future estimates. For further information on certain estimates inherent in the financial statements,
refer to note 2 in the audited financial statements for the years ended December 31, 2014 and 2013.
INTERNAL CONTROL OVER FINANCIAL REPORTING
Internal control over financial reporting is a process designed to provide reasonable assurance that all the assets are
safeguarded and transactions are appropriately authorized, and to facilitate the preparation of relevant, reliable and
timely information. Because of its inherent limitations, internal control over financial reporting may not prevent or
detect misstatements.
DeeThree is required to comply with National Instrument 52-109 – “Certification of Disclosure in Issuers’ Annual and
Interim Filings” and management has assessed the effectiveness of the Company’s internal control over financial
reporting as defined by this instrument. The assessment was based on the framework in Internal Control – Integrated Framework (1992) issued by the Committee of Sponsoring Organizations of the Treadway Commission. Management
concluded that DeeThree’s internal control over financial reporting was effective as of December 31, 2014. No changes
were made to DeeThree’s internal control over financial reporting during the year ended December 31, 2014 that have
materially affected, or are reasonably likely to materially affect, the internal control over financial reporting.
It should be noted that while DeeThree’s Chief Executive Officer (CEO) and Chief Financial Officer (CFO) believe that
the Company’s internal controls and procedures provide a reasonable level of assurance and are effective, they do not
expect that these controls will prevent all errors or fraud. A control system, no matter how well conceived or operated,
can provide only reasonable, not absolute, assurance that its objectives are met.
CHANGES IN ACCOUNTING POLICIES
As of January 1, 2014, the Company adopted several new IFRS standards and amendments in accordance with the
transitional provisions of each standard. A brief description of each new or amended standard and its impact on the
Company’s financial statements follows:
• Amendments to International Accounting Standard (IAS) 36 “Impairment of Assets” reduce the circumstances in which
the recoverable amount of CGUs is required to be disclosed and clarify the disclosures required when an impairment loss
has been recognized or reversed in the period. The amendments must be adopted retrospectively for fiscal years beginning
January 1, 2014, with earlier adoption permitted. These amendments were applied by the Company on January 1, 2014
with no material impact on the financial statements. The adoption will only impact its disclosures in the notes to the
financial statements in periods when an impairment loss or impairment reversal is recognized.

DTX .TO ANNUAL REPORT2014
44
• Amendments to IAS 32 “Offsetting Financial Assets and Financial Liabilities” clarify the requirements for offsetting
financial assets and liabilities. The amendments clarify that the right to offset must be available on the current date and
cannot be contingent on a future event. The adoption of this standard did not have a material impact on the Company’s
financial statements.
• IFRIC 21 “Levies,” which was developed by the IFRS Interpretations Committee, clarifies that an entity recognizes
a liability for a levy when the activity that triggers payment, as identified by the relevant legislation, occurs. The
interpretation also clarifies that no liability should be recognized before the specified threshold to trigger that levy is
reached. IFRIC 21 must be adopted retrospectively for fiscal years beginning January 1, 2014, with earlier adoption
permitted. The Company adopted IFRIC 21 in its financial statements for the annual period beginning January 1, 2014
and there has been no impact on the financial statements.
FUTURE ACCOUNTING POLICY CHANGES
In July 2014, IFRS 9 “Financial Instruments” was issued as a complete standard, including the requirements previously
issued related to classification and measurement of financial assets and liabilities, and additional amendments to
introduce a new expected loss impairment model for financial assets, including credit losses. Retrospective application
of this standard with certain exemptions is effective for fiscal years beginning on or after January 1, 2018, with earlier
application permitted. The full impact of the standard on the Company’s financial statements will not be known until the
project is complete.
In December 2014, the IASB issued narrow-focus amendments to IAS 1 “Presentation of Financial Statements” to
clarify existing requirements related to materiality, order of notes, subtotals, accounting policies and disaggregation.
Retrospective application of this standard is effective for fiscal years beginning on or after January 1, 2016, with earlier
application permitted. The adoption of this amended standard is not expected to have a material impact on the Company’s
disclosure.
In May 2014, the IASB issued IFRS 15 “Revenue from Contracts with Customers”. It replaces existing revenue
recognition guidance and provides a single, principles-based five-step model to be applied to all contracts with customers.
Retrospective application of this standard is effective for fiscal years beginning on or after January 1, 2017, with earlier
application permitted. The Company is currently assessing the impact of this standard.
NON-GAAP MEASUREMENTS
FUNDS FROM OPERATIONS
This MD&A contains the terms “funds from operations” and “funds from operations per share”, which should not be
considered an alternative to or more meaningful than cash flow from (used in) operating activities as determined in
accordance with IFRS. These terms do not have any standardized meaning under IFRS. DeeThree’s determination of
funds from operations and funds from operations per share may not be comparable to that reported by other companies.
Management uses funds from operations to analyze operating performance and leverage, and considers funds from
operations to be a key measure as it demonstrates the Company’s ability to generate cash necessary to fund future
capital investments and to repay debt, if applicable. Funds from operations is calculated using cash flow from operating
activities as presented in the statement of cash flows, before changes in non-cash working capital. DeeThree presents
funds from operations per share whereby per share amounts are calculated using weighted-average shares outstanding,
consistent with the calculation of earnings per share.

DTX .TO ANNUAL REPORT
201445
The following table reconciles funds from operations with cash flow from operating activities, which is the most directly
comparable measure calculated in accordance with IFRS:
Three Months Ended December 31, Year Ended December 31,
2014 2013 2014 2013
($000s)
Cash flow from operating activities 54,239 25,499 184,239 97,448
Changes in non-cash working capital (12,466) (839) (11,043) (4,153)
Funds from operations 41,773 24,660 173,196 93,295
The Company considers corporate netbacks to be a key measure as they demonstrate DeeThree’s profitability relative
to current commodity prices. Corporate netbacks are comprised of operating, funds flow and net income netbacks.
Operating netback is calculated as the average sales price of the Company’s commodities, less royalties, operating
costs and transportation expenses. Funds flow netback starts with the operating netback and further deducts general
and administrative costs and finance expense, and then adds finance income as well as realized gains on financial
instruments. To calculate the net income netback, DeeThree takes the funds flow netback and deducts share-based
compensation expense as well as depletion and depreciation charges, accretion expense, unrealized gains or losses
on financial instruments, any impairment or exploration and evaluation expense and deferred income taxes. No IFRS
measure is reasonably comparable to netbacks. See “Netbacks (per unit)” for the netback calculations.
NET DEBT AND WORKING CAPITAL DEFICIT
Net debt and working capital deficit, which represent current liabilities (excluding derivative financial instruments) and
bank debt less current assets (excluding derivative financial instruments), are used to assess efficiency, liquidity and the
Company’s general financial strength. No IFRS measure is reasonably comparable to net debt or working capital deficit.
OTHER MEASUREMENTS
All financial figures are in Canadian dollars. Where amounts are expressed on a barrel of oil equivalent (boe) basis,
natural gas volumes have been converted to oil equivalence at 6,000 cubic feet of gas to 1 barrel of oil. This conversion
ratio of 6:1 is based on an energy-equivalent conversion for the individual products, primarily applicable at the burner
tip, and does not represent a value equivalency at the wellhead. Such disclosure of boe may be misleading, particularly
if used in isolation. Readers should be aware that historical results are not necessarily indicative of future performance.
FORWARD-LOOKING INFORMATION AND STATEMENTS
Certain statements in this MD&A may constitute forward-looking statements. These statements relate to future events
or the Company’s future performance. All statements other than statements of historical fact may be forward-looking
statements. Forward-looking statements are often, but not always, identified by the use of words such as “seek”,
“anticipate”, “plan”, “continue”, “estimate”, “expect”, “may”, “will”, “project”, “predict”, “potential”, “targeting”,
“intend”, “could”, “might”, “should”, “believe” and similar expressions. These statements involve known and unknown
risks, uncertainties and other factors that may cause actual results or events to differ materially from those anticipated
in such forward-looking statements. The Company believes that the expectations reflected in those forward-looking
statements are reasonable, but no assurance can be given that these expectations will prove to be correct and such
forward-looking statements included in this MD&A should not be unduly relied upon by investors. These statements
speak only as of the date of this MD&A and are expressly qualified, in their entirety, by this cautionary statement.

DTX .TO ANNUAL REPORT2014
46
In particular, this MD&A contains forward-looking statements pertaining to the following: projections of market prices and
costs, supply and demand for natural gas and crude oil, the quantity of reserves, natural gas and crude oil production
levels, capital expenditure programs, treatment under governmental regulatory and taxation regimes, and expectations
regarding the Company’s ability to raise capital and to continually add to reserves through acquisitions and development.
With respect to forward-looking statements in this MD&A, the Company has made assumptions regarding, among
other things, the legislative and regulatory environments of the jurisdictions where the Company carries on business
or has operations, the impact of increasing competition and the Company’s ability to obtain additional financing on
satisfactory terms.
The Company’s actual results could differ materially from those anticipated in these forward-looking statements as a
result of the risk factors discussed in this MD&A, such as: volatility in the market prices for natural gas and crude oil;
uncertainties associated with estimating reserves; geological, technical, drilling and processing problems; liabilities and
risks, including environmental liabilities and risks inherent in natural gas and crude oil operations; incorrect assessments
of the value of acquisitions; and competition for, among other things, capital, acquisitions of reserves, undeveloped
lands and skilled personnel. In addition, test results are not necessarily indicative of long-term performance or of
ultimate recovery.
This forward-looking information represents the Company’s views as of the date of this MD&A and such information
should not be relied upon as representing its views as of any subsequent date. DeeThree has attempted to identify
important factors that could cause actual results, performance or achievements to vary from those current expectations
or estimates expressed or implied by the forward-looking information. There may be other factors, however, that
cause results, performance or achievements not to be as expected or estimated and that could cause actual results,
performance or achievements to differ materially from current expectations. There can be no assurance that forward-
looking information will prove to be accurate, as results and future events could differ materially from those expected or
estimated in such statements. Accordingly, readers should not place undue reliance on forward-looking information. The
Company disclaims any intention or obligation to update or revise any forward-looking statements, whether as a result of
new information, future events or otherwise, except as expressly required by applicable securities legislation.
Additional information regarding the Company and factors that could affect its operations and financial results are
included in reports on file with Canadian securities regulatory authorities, including the Company’s Annual Information
Form, and may be accessed through the SEDAR website (www.sedar.com), or at the Company’s website (www.
deethree.ca). Furthermore, the forward-looking statements contained in this MD&A are made as of the date of this
MD&A and the Company does not undertake any obligation to update publicly or to revise any of the included forward-
looking statements, whether as a result of new information, future events or otherwise, except as may be required by
applicable securities laws. The Company’s forward-looking statements are expressly qualified in their entirety by this
cautionary statement.

DTX .TO ANNUAL REPORT
201447
> INDEPENDENT AUDITORS’ REPORTTo the Shareholders of DeeThree Exploration Ltd.
We have audited the accompanying financial statements of DeeThree Exploration Ltd., which comprise the statements of
financial position as at December 31, 2014 and 2013, the statements of operations and comprehensive income, changes
in shareholders’ equity and cash flows for the years then ended, and notes, comprising a summary of significant accounting
policies and other explanatory information.
Management’s Responsibility for the Financial Statements
Management is responsible for the preparation and fair presentation of these financial statements in accordance with
International Financial Reporting Standards, and for such internal control as management determines is necessary to enable
the preparation of financial statements that are free from material misstatement, whether due to fraud or error.
Auditors’ Responsibility
Our responsibility is to express an opinion on these financial statements based on our audits. We conducted our audits in
accordance with Canadian generally accepted auditing standards. Those standards require that we comply with ethical
requirements and plan and perform the audit to obtain reasonable assurance about whether the financial statements are
free from material misstatement. An audit involves performing procedures to obtain audit evidence about the amounts and
disclosures in the financial statements. The procedures selected depend on our judgment, including the assessment of the
risks of material misstatement of the financial statements, whether due to fraud or error. In making those risk assessments,
we consider internal control relevant to the entity’s preparation and fair presentation of the financial statements in order to
design audit procedures that are appropriate in the circumstances, but not for the purpose of expressing an opinion on the
effectiveness of the entity’s internal control. An audit also includes evaluating the appropriateness of accounting policies used
and the reasonableness of accounting estimates made by management, as well as evaluating the overall presentation of the
financial statements.
We believe that the audit evidence we have obtained in our audits is sufficient and appropriate to provide a basis for our
audit opinion.
Opinion
In our opinion, the financial statements present fairly, in all material respects, the financial position of DeeThree Exploration Ltd.
as at December 31, 2014 and 2013, and its financial performance and its cash flows for the years then ended in accordance
with International Financial Reporting Standards.
Chartered Accountants
March 25, 2015
Calgary, Canada

DTX .TO ANNUAL REPORT2014
48
> STATEMENTS OF FINANCIAL POSITIONAs at December 31, December 31,
2014 2013
(000s) ($) ($)
AssetsCurrent assets Accounts receivable (note 16) 29,524 22,308
Deposits and prepaid expenses 682 596
Derivative financial instruments (note 16) 23,270 –
53,476 22,904
Non-current assets Exploration and evaluation assets (note 5) 62,784 45,611
Property and equipment (note 6) 626,942 428,765
Total assets 743,202 497,280
LiabilitiesCurrent liabilities Bank debt (note 7) – 88,404
Accounts payable and accrued liabilities (note 16) 62,319 54,287
Derivative financial instruments (note 16) – 2,224
62,319 144,915
Non-current liabilities Bank debt (note 7) 139,234 –
Decommissioning liabilities (note 8) 34,165 26,291
Flow-through share premium liabilities (note 9) 95 699
Deferred tax liability (note 11) 43,880 14,305
Total liabilities 279,693 186,210
Shareholders’ equity Share capital (note 9) 381,540 309,323
Contributed surplus 12,591 8,602
Retained earnings (deficit) 69,378 (6,855)
Total shareholders’ equity 463,509 311,070
Total liabilities and shareholders’ equity 743,202 497,280
Commitments (note 17)
Subsequent Events (note 16)
See accompanying notes to the financial statements.
On behalf of the Board of Directors,
Michael Kabanuk Dennis Nerland
Director Director

DTX .TO ANNUAL REPORT
201449
> STATEMENTS OF OPERATIONS AND COMPREHENSIVE INCOMEYears Ended December 31, 2014 2013
(000s, except per share amounts) ($) ($)
Revenue Oil and natural gas revenues 303,348 177,991
Royalties (68,613) (40,349)
Oil and natural gas revenues, net of royalties 234,735 137,642
Expenses Operating and transportation 48,048 31,446
General and administrative 8,311 6,508
Depletion and depreciation (note 6) 80,799 51,309
Share-based compensation (note 10) 2,902 2,050
Impairment on field facilities – 1,317
Loss on dispositions 90 –
Exploration and evaluation expense (note 5) 9,318 8,876
149,468 101,506
Unrealized loss (gain) on financial instruments (25,494) 3,074
Realized loss on financial instruments 426 2,226
Accretion and finance expenses (note 14) 5,771 3,535
130,171 110,341
Income before income tax 104,564 27,301
Taxes Deferred income tax expense (note 11) 28,331 9,253
Net income and comprehensive income for the period 76,233 18,048
Deficit, beginning of the period (6,855) (24,903)
Retained earnings (deficit), end of the period 69,378 (6,855)
Net income per share (note 9)
Basic 0.89 0.24
Diluted 0.86 0.23
See accompanying notes to the financial statements.

DTX .TO ANNUAL REPORT2014
50
> STATEMENTS OF CHANGES IN SHAREHOLDERS’ EQUITY Retained Share Contributed Earnings Total Capital Surplus (Deficit) Equity
(000s) ($) ($) ($) ($)
Balance – January 1, 2014 309,323 8,602 (6,855) 311,070Common shares issued 63,428 – – 63,428Flow-through shares issued 10,002 – – 10,002Premium on flow-through shares (1,654) – – (1,654)Share issuance costs (4,048) – – (4,048)Tax benefit of share issuance costs 1,010 – – 1,010Share-based compensation – 5,040 – 5,040Exercise of options 3,479 (1,051) – 2,428Net income – – 76,233 76,233
Balance – December 31, 2014 381,540 12,591 69,378 463,509
Balance – January 1, 2013 231,415 5,578 (24,903) 212,090
Common shares issued 74,986 – – 74,986
Flow-through shares issued 5,008 – – 5,008
Premium on flow-through shares (699) – – (699)
Share issuance costs (4,786) – – (4,786)
Tax benefit of share issuance costs 1,196 – – 1,196
Share-based compensation – 3,613 – 3,613
Exercise of options 2,203 (589) – 1,614
Net income – – 18,048 18,048
Balance – December 31, 2013 309,323 8,602 (6,855) 311,070
See accompanying notes to the financial statements.

DTX .TO ANNUAL REPORT
201451
> STATEMENTS OF CASH FLOWSYears Ended December 31, 2014 2013
(000s) ($) ($)
Cash flow from (used in):Operating activities Net income for the period 76,233 18,048
Adjustments for:
Depletion and depreciation expense (note 6) 80,799 51,309
Deferred income tax expense (note 11) 28,331 9,253
Share-based compensation (note 10) 3,069 2,238
Accretion (note 8) 850 497
Unrealized loss (gain) on financial instruments (25,494) 3,074
Loss on disposition 90 –
Exploration and evaluation expense (note 5) 9,318 8,876
173,196 93,295
Change in non-cash working capital (note 12) 11,043 4,153
184,239 97,448
Financing activities Increase in bank debt 50,830 25,300
Issuance of share capital 75,858 81,608
Share issuance costs (4,048) (4,786)
122,640 102,122
Investing activities Property and equipment expenditures (254,057) (177,164)
Exploration and evaluation expenditures (19,893) (23,027)
Property acquisitions (note 4) (22,599) (11,694)
Changes in non-cash working capital (note 12) (10,330) 12,315
(306,879) (199,570)
Change in cash and cash equivalents – –
Cash and cash equivalents – beginning of period – –
Cash and cash equivalents – end of period – –
See accompanying notes to the financial statements.
DTX .TO ANNUAL REPORT2014
52
> NOTES TO THE FINANCIAL STATEMENTSAs at and for the years ended December 31, 2014 and 2013
01 REPORTING ENTITY
DeeThree Exploration Ltd. (“DeeThree” or the “Company”) is a publicly traded company incorporated under the
laws of Alberta. The Company is principally engaged in the exploration for and exploitation, development and
production of oil and natural gas, and conducts many of its activities jointly with others. These financial statements
reflect only the Company’s interests in such activities. DeeThree is registered and domiciled in Canada. Its main
office is at Suite 2200, 520 Third Avenue S.W., Calgary, Alberta.
02 BASIS OF PRESENTATION
(a) STATEMENT OF COMPLIANCE
These financial statements were prepared in accordance with International Financial Reporting Standards and
interpretations (collectively referred to as IFRS) as issued by the International Accounting Standards Board (IASB).
The financial statements were authorized for issuance by the Board of Directors on March 25, 2015.
(b) BASIS OF MEASUREMENT
The financial statements of DeeThree were prepared on the historical cost basis, except for derivative financial
instruments, which are measured at fair value. The methods used to measure fair values are discussed in note 15.
(c) FUNCTIONAL AND PRESENTATION CURRENCY
The financial statements are presented in Canadian dollars, the Company’s functional currency.
(d) USE OF ESTIMATES AND JUDGEMENTS
The preparation of financial statements in conformity with IFRS requires management to make judgements,
estimates and assumptions that affect the application of accounting policies and the reported amounts of assets,
liabilities, income and expenses. Actual results may differ from these estimates and affect the results reported
in these financial statements, and could be material. Estimates and underlying assumptions are reviewed on an
ongoing basis. Revisions to accounting estimates are recognized in the year in which the estimates are revised
and in any future years affected.
i) KEY SOURCES OF ESTIMATION UNCERTAINTY
The following are key estimates and the underlying assumptions made by management affecting the
measurement of balances and transactions in these financial statements.
ACQUISITIONS
In a business combination, management makes estimates of the fair value of assets acquired and liabilities
assumed, which includes assessing the value of oil and natural gas properties based on the estimation of
recoverable quantities of proved plus probable reserves being acquired.

DTX .TO ANNUAL REPORT
201453
VALUATION OF PROPERTY AND EQUIPMENT
• Estimation of recoverable quantities of proved plus probable reserves includes assumptions regarding future
commodity prices, exchange rates, discount rates and production and transportation costs for future cash flows
as well as the interpretation of complex geological and geophysical models and data. Changes in reported
reserves can affect the impairment of assets, the decommissioning obligations, the economic feasibility of
exploration and evaluation assets and the amounts reported for depletion, depreciation and amortization of
property, plant and equipment. These reserve estimates are verified by third-party professional engineers, who
work with information provided by the Company to establish reserve determinations in accordance with National
Instrument (NI) 51-101, “Standards of Disclosure for Oil and Gas Activities”.
• Oil and natural gas development and production assets are depleted on a unit-of-production basis at a rate
calculated by reference to proved and probable reserves determined in accordance with NI 51-101 and
incorporate the estimated future cost of developing and extracting those reserves. Proved and probable reserves
are estimated using independent reserve engineers’ reports and represent the estimated quantities of oil, natural
gas and NGLs that geological, geophysical and engineering data demonstrate with a specified degree of certainly
to be recoverable in future years from known reservoirs and which are considered commercially producible.
Proved reserves are those reserves that can be estimated with a high degree of certainty to be recoverable, it
being 90 percent likely that the actual remaining quantities recovered will exceed the estimated proved reserves.
Probable reserves are those additional reserves that are less certain to be recovered than proved reserves, it being
equally likely that the actual remaining quantities recovered will be greater or less than the sum of the estimated
proved plus probable reserves. The volume of estimated reserves is also a key determinant in assessing whether
the carrying value of any of the Company’s development and production assets has been impaired.
• The recoverable amounts of cash-generating units (CGUs) and individual assets have been determined based on
the higher of the present value of value-in-use calculations and discounted fair values less costs to sell. These
calculations require the use of estimates and assumptions, including the discount rate. It is reasonably possible
that the commodity price assumptions may change, which may then impact the estimated life of the field
and economically recoverable reserves, and may then require a material adjustment to the carrying value of property
and equipment. The Company monitors internal and external indicators of impairment relating to its tangible assets.
PROVISIONS FOR DECOMMISSIONING COSTS
The Company estimates the decommissioning obligations for oil and natural gas wells and their associated
production facilities and pipelines. In most instances, removal of assets and remediation occurs many years
into the future. Amounts recorded for the decommissioning obligations and related accretion expense require
assumptions regarding removal date, future environmental legislation, the extent of reclamation activities
required, the engineering methodology for estimating cost, inflation estimates, future removal technologies in
determining the removal cost, and the estimate of the liability-specific discount rates to determine the present
value of these cash flows.
MEASUREMENT OF SHARE-BASED COMPENSATION
The Company’s estimate of stock-based compensation depends on estimates of historical volatility, dividend
yield, expected term and forfeiture rates.
VALUATION AND UTILIZATION OF TAX LOSSES
The deferred tax liability is based on estimates as to the timing of the reversal of temporary differences,
substantively enacted tax rates and the likelihood of assets being realized.

DTX .TO ANNUAL REPORT2014
54
VALUATION OF DERIVATIVE FINANCIAL INSTRUMENTS
The Company’s estimate of the fair value of derivative financial instruments depends on estimated forward
prices and volatility in those prices.
ii) JUDGEMENTS
The following are critical judgements that management has made in the process of applying accounting
policies and that have the most significant effect on the amounts recognized in the financial statements.
IMPAIRMENT
The Company’s assets are aggregated into CGUs for the purpose of calculating impairment. CGUs are
based on an assessment of the unit’s ability to generate independent cash inflows. The determination of the
Company’s CGUs was based on management’s judgement in regards to shared infrastructure, geographical
proximity, petroleum type and similar exposure to market risk and materiality.
Judgments are required to assess when impairment indicators are evident and impairment testing is required.
In determining the recoverable amount of assets, in the absence of quoted market prices, impairment tests
are based on estimates of reserves, production rates, future oil and natural gas prices, future costs, discount
rates, market value of land and other relevant assumptions.
EXPLORATION AND EVALUATION ASSETS
The application of the Company’s accounting policy for exploration and evaluation assets requires management
to make certain judgments as to future events and circumstances as to whether economic quantities of
reserves have been found.
03 SIGNIFICANT ACCOUNTING POLICIES
The accounting policies set out below were applied consistently to all periods presented in these financial
statements. Certain comparative amounts were reclassified to conform with the current period’s presentation, as
noted below.
(a) PROPERTY AND EQUIPMENT
CAPITALIZATION
Items of property and equipment, which include oil and natural gas development and production assets, are
measured at cost less accumulated depletion, depreciation and impairment losses.
The initial cost of an asset comprises its purchase price or construction cost, any costs directly attributable to
bringing the asset into operation, the initial estimate of decommissioning obligation, if any, and, for qualifying
assets, borrowing costs. Costs incurred subsequent to the determination of technical feasibility and commercial
viability and the costs of replacing parts of property and equipment are recognized as petroleum and natural gas
properties only when they increase the future economic benefits embodied in the specific asset to which they
relate. All other expenditures are recognized in profit or loss as incurred. Such capitalized petroleum and natural
gas properties generally represent costs incurred in developing proved and/or probable reserves and bringing in
or enhancing production from such reserves, and are accumulated on a field or geotechnical area basis.

DTX .TO ANNUAL REPORT
201455
DEPLETION AND DEPRECIATION
The net carrying value of development and production assets is depleted using the unit-of-production method by
reference to the ratio of production in the year to the related proved plus probable reserves, taking into account
estimated future development costs necessary to convert those reserves into production. Proved plus probable
reserves are estimated annually by independent qualified reserves evaluators and represent the estimated
quantities of crude oil, natural gas and NGLs which geological, geophysical and engineering data demonstrate with
a specified degree of certainty to be recoverable in future years from known reservoirs and which are considered
commercially producible. Future development costs are estimated taking into account the amount of physical
development that will be required to produce the reserves. For interim financial statements, internal estimates of
changes in reserves and future development costs are used for determining depletion for the period.
For depletion purposes, relative volumes of petroleum and natural gas production and reserves are converted at
the energy-equivalent conversion rate of 6,000 cubic feet of natural gas to 1 barrel of crude oil.
Other property and equipment are stated in the statement of financial position at cost less accumulated
depreciation. Depreciation is calculated over the estimated useful life of the asset based on the original cost
less estimated residual value. The methods and useful lives of the Company’s other property and equipment are
as follows:
• Facilities 20 years straight-line
• Office equipment Five years declining balance
• Computer equipment Three years declining balance
Depreciation methods, useful lives and residual values are reviewed at each reporting date.
IMPAIRMENT
At each reporting date, DeeThree assesses its development and production assets for possible impairment if there
are events or changes in circumstances that indicate that carrying values of the assets may not be recoverable.
Such indicators include changes in the business plans, significant downward revisions of estimated volumes,
significant declines in commodity prices, increases in estimated future development expenditures, changes in
regulations, evidence of physical damage and low plant utilization. If any such indicator is evident, the asset’s
recoverable amount is estimated.
The assessment for impairment entails comparing the carrying value of the CGU with its recoverable amount, that
is, the higher of fair value less costs to sell and value in use. Each CGU is identified in accordance with International
Accounting Standard (IAS) 36 – “Impairment of Assets”. If necessary, impairment is charged through the statement
of operations and comprehensive income if the capitalized costs of the CGU exceed the recoverable amount.
Impairment losses recognized in prior periods are assessed at each reporting date for any indication that the loss
has decreased or been erased. An impairment loss is reversed if there has been an increase in the estimated
recoverable amount of a previously impaired asset. An impairment loss may never be reversed beyond the asset’s
original carrying amount, net of depreciation or depletion.

DTX .TO ANNUAL REPORT2014
56
(b) EXPLORATION AND EVALUATION (E&E) ASSETS
CAPITALIZATION
Pre-licence costs are recognized in the statement of operations as incurred.
Oil and natural gas E&E assets are accounted for in accordance with IFRS 6 “Exploration for and Evaluation
of Mineral Resources”, whereby costs associated with the exploration for and evaluation of oil and natural gas
reserves are accumulated on an area-by-area basis and are capitalized as either tangible or intangible E&E assets
when incurred. Pre-licence costs are recognized in the statement of operations and comprehensive income as
incurred. E&E costs, including the costs of acquiring licences and of drilling and completing wells, initially are
capitalized as E&E assets according to the expenditure’s nature. The costs are accumulated in cost centres by
well, field or exploration area pending determination of technical feasibility and commercial viability.
When a specific well, field or area is determined to be technically feasible and commercially viable, the
accumulated costs are transferred to property and equipment. When a specific well, field or area is determined
not to be technically feasible or commercially viable, or the Company decides not to continue with the project, the
unrecoverable costs are charged to profit or loss as E&E expenses.
No depletion or depreciation is provided for E&E assets.
IMPAIRMENT
E&E assets are assessed for impairment if (i) sufficient data exists to determine technical feasibility and commercial
viability, and (ii) facts and circumstances suggest that the carrying amount exceeds the recoverable amount. For
purposes of impairment testing, E&E assets are tested at an operating segment level.
(c) BUSINESS COMBINATIONS
The purchase method of accounting is used to account for corporate acquisitions and assets that meet the
definition of a business combination under IFRS. The cost of an acquisition is measured as the fair value of the
assets given, equity instruments issued and liabilities incurred or assumed at the date of closing. Identifiable
assets acquired and liabilities and contingent liabilities assumed in a business combination are measured initially
at their fair values at the acquisition date. The excess of the cost of acquisition over the fair value of the identifiable
assets, liabilities and contingent liabilities acquired is recorded as goodwill. If the cost of the acquisition is less
than the fair value of the net assets acquired, the difference is recognized immediately in the statement of
operations and comprehensive income.
(d) LEASED ASSETS
Other leases are operating leases, which are not recognized on the Company’s statement of financial position.
Payments made under operating leases are recognized in profit or loss on a straight-line basis over the lease’s
term. Lease incentives received are recognized as an integral part of the total lease expense over the lease’s term.
(e) JOINT INTEREST ACTIVITIES
Some of the Company’s exploration, development and production activities are conducted jointly with other entities
and, accordingly, the financial statements reflect only the Company’s proportionate interest in such activities.

DTX .TO ANNUAL REPORT
201457
(f) REVENUE RECOGNITION
Oil, natural gas and NGL sales are recognized when commodities are sold and title passes to the customer.
Royalty expense is recognized as it accrues, in accordance with the overriding royalty agreements.
(g) DECOMMISSIONING LIABILITIES
The present value of expected future abandonment and reclamation costs is recorded on the statement of
financial position as both a decommissioning liability and a charge to property and equipment at the time the
obligation is incurred. The amount recognized is the present value of the estimated future expenditure determined
in accordance with local conditions and is discounted using a risk-free interest rate. The amount included as
property and equipment is depleted over the life of the reserves by the unit-of-production method. The liability
accretes until the Company settles the decommissioning liability; this accretion charge is included as a finance
cost on the statement of operations and comprehensive income. Actual reclamation and abandonment costs
incurred are charged against the liability to the extent the liability was established.
Estimates for future abandonment and reclamation costs are based on historical costs to abandon and reclaim
similar sites, taking into consideration current costs. The liability is based on the Company’s net interest in the
respective sites.
(h) INCOME TAXES
Income tax expense comprises current and deferred tax. Income tax expense is recognized in profit or loss, except
to the extent that it relates to items recognized directly in equity, in which case it is recognized in equity.
Current tax is the expected tax payable on the taxable income for the year, using tax rates enacted or substantively
enacted at the reporting date, and any adjustment to tax payable in respect of previous years.
Deferred tax is recognized on the temporary differences between the carrying amounts of assets and liabilities for
financial reporting purposes and the amounts used for taxation purposes. Deferred tax is not recognized on the
initial recognition of assets or liabilities in a transaction that is not a business combination.
Deferred tax is measured at the tax rates that are expected to be applied to temporary differences when they are
reversed, based on the laws that have been enacted or substantively enacted by the reporting date. Deferred
tax assets and liabilities are offset if there is a legally enforceable right to do so, and they relate to income taxes
levied by the same tax authority on the same taxable entity, or on different taxable entities, but they intend to settle
current tax liabilities and assets on a net basis or their tax assets and liabilities will be realized simultaneously.
A deferred tax asset is recognized to the extent that it is probable that future taxable profits will be available against
which the temporary difference can be utilized. Deferred tax assets are reviewed at each reporting date and are
reduced to the extent that it is no longer probable that the related tax benefit will be realized.
(i) FLOW-THROUGH SHARES
The Company finances a portion of its exploration and development activities through the issuance of flow-through
shares. Under flow-through share agreements, the resource expenditure deductions for income tax purposes
related to exploratory development activities are renounced to subscribers in accordance with tax legislation.
Flow-through shares issued are recorded in share capital at the fair value of common shares on the date of
issuance. The premium received on issuing flow-through shares is initially recorded as a long-term premium
liability. As qualifying expenditures are incurred, the premium is reversed and a deferred income tax liability is
recorded. The net amount is then recognized as deferred income tax expense.

DTX .TO ANNUAL REPORT2014
58
(j) CASH AND CASH EQUIVALENTS
Cash and cash equivalents comprise cash on hand, term deposits held with banks and other short-term, highly
liquid investments with maturities of three months or less at the time of purchase.
(k) SHARE-BASED COMPENSATION
The fair value of the options is determined using the Black-Scholes option pricing model and each tranche in an
award is considered a separate award with its own vesting period and grant date fair value. The grant date fair
value of options granted to officers, directors, employees and certain consultants is recognized as compensation
expense with a corresponding increase in contributed surplus over the vesting period. A forfeiture rate is estimated
on the grant date and is adjusted to reflect the actual number of options that vest.
Upon the exercise of the stock options, consideration paid together with the amount previously recognized in
contributed surplus is recorded as an increase in share capital. In the event that vested options expire, previously
recognized compensation expense associated with such stock options is not reversed. In the event that options
are forfeited, previously recognized compensation expense associated with the unvested portion of such stock
options is reversed.
(l) FINANCIAL INSTRUMENTS
i) NON-DERIVATIVE FINANCIAL INSTRUMENTS
Non-derivative financial instruments comprise cash and cash equivalents, accounts receivable, bank debt,
and accounts payable and accrued liabilities. Non-derivative financial instruments are recognized initially at
fair value plus, for instruments not at fair value through profit or loss, any directly attributable transaction costs.
Subsequent to initial recognition, non-derivative financial instruments are measured as described below.
CASH AND CASH EQUIVALENTS
Cash and cash equivalents comprise cash on hand, term deposits held with banks and other short-term,
highly liquid investments with maturities of three months or less. Bank overdrafts that are repayable on
demand and form an integral part of the Company’s cash management, whereby Company management
has the ability and intent to net bank overdrafts against cash, are included as a component of cash and cash
equivalents for the purpose of the statement of cash flows.
FINANCIAL ASSETS AT FAIR VALUE THROUGH PROFIT OR LOSS
An instrument is classified as fair value through profit or loss if it is held for trading or is designated as
such upon initial recognition. Financial instruments are designated as fair value through profit or loss if the
Company manages such investments and makes purchase and sale decisions based on their fair value in
accordance with the Company’s risk management or investment strategy. Upon initial recognition, attributable
transaction costs are recognized in profit or loss when incurred. Financial instruments at fair value through
profit or loss are measured at fair value, and changes therein are recognized in profit or loss. The Company
has designated cash and cash equivalents at fair value.
OTHER
Other non-derivative financial instruments, which may include accounts receivable, accounts payable and
accrued liabilities, and bank debt, are measured at amortized cost using the effective interest rate method
less any impairment losses.

DTX .TO ANNUAL REPORT
201459
ii) DERIVATIVE FINANCIAL INSTRUMENTS
The Company may enter into certain financial derivative contracts in order to manage the exposure to market risks from fluctuations in commodity prices. These instruments are not used for trading or speculative purposes. The Company has not designated its financial derivative contracts as effective accounting hedges and, therefore, has not applied hedge accounting, even though the Company considers all commodity contracts to be economic hedges. As a result, all financial derivative contracts are classified as fair value through profit or loss and are recorded on the statement of financial position at fair value. Transaction costs are recognized in profit or loss when incurred. As at December 31, 2014, the Company has commodity and foreign exchange financial derivative contracts.
Embedded derivatives are separated from the host contract and accounted for separately if the economic characteristics and risks of the host contract and the embedded derivative are not closely related, a separate instrument with the same terms as the embedded derivative would meet the definition of a derivative, and the combined instrument is not measured at fair value through profit or loss. Changes in the fair value of separable embedded derivatives are recognized immediately in profit or loss. The Company does not have any embedded derivatives that are separately accounted for.
(m) SHARE CAPITAL
Common shares are classified as equity. Incremental costs directly attributable to the issuance of common shares and stock options are recognized as a deduction from equity, net of deferred income taxes.
(n) PER SHARE AMOUNTS
Basic net income or loss per share is calculated by dividing the profit or loss attributable to common shareholders of the Company by the weighted-average number of common shares outstanding during the period. Diluted per share amounts are determined by adjusting the profit or loss attributable to common shareholders and the weighted-average number of common shares outstanding for the effects of dilutive instruments, such as stock options and warrants granted using the treasury stock method. Should the Company have a loss for the period, options and warrants would be anti-dilutive and, therefore, will have no effect on the determination of loss per share.
(o) CHANGES IN ACCOUNTING POLICIES
As of January 1, 2014, the Company adopted several new IFRS standards and amendments in accordance with the transitional provisions of each standard. A brief description of each new or amended standard and its impact on the Company’s financial statements follows:
• Amendments to International Accounting Standard (IAS) 36 “Impairment of Assets” reduce the circumstances in
which the recoverable amount of CGUs is required to be disclosed and clarify the disclosures required when an
impairment loss has been recognized or reversed in the period. The amendments must be adopted retrospectively
for fiscal years beginning January 1, 2014, with earlier adoption permitted. These amendments were applied by the
Company on January 1, 2014 and have not had any material impact on the financial statements. The adoption will
only impact its disclosures in the notes to the financial statements in periods when an impairment loss or impairment
reversal is recognized.
• Amendments to IAS 32 “Offsetting Financial Assets and Financial Liabilities” clarify the requirements for offsetting
financial assets and liabilities. The amendments clarify that the right to offset must be available on the current date
and cannot be contingent on a future event. The adoption of this standard did not have a material impact on the
Company’s financial statements.

DTX .TO ANNUAL REPORT2014
60
• IFRIC 21 “Levies,” which was developed by the IFRS Interpretations Committee, clarifies that an entity recognizes
a liability for a levy when the activity that triggers payment, as identified by the relevant legislation, occurs. The
interpretation also clarifies that no liability should be recognized before the specified threshold to trigger that levy is
reached. IFRIC 21 must be adopted retrospectively for fiscal years beginning January 1, 2014, with earlier adoption
permitted. The Company adopted IFRIC 21 in its financial statements for the annual period beginning January 1,
2014 and there has been no impact on the financial statements.
(p) FUTURE ACCOUNTING POLICY CHANGES
In July 2014, IFRS 9 “Financial Instruments” was issued as a complete standard, including the requirements
previously issued related to classification and measurement of financial assets and liabilities, and additional
amendments to introduce a new expected loss impairment model for financial assets, including credit losses.
Retrospective application of this standard with certain exemptions is effective for fiscal years beginning on or after
January 1, 2018, with earlier application permitted. The full impact of the standard on the Company’s financial
statements will not be known until the project is complete.
In December 2014, the IASB issued narrow-focus amendments to IAS 1 “Presentation of Financial Statements” to
clarify existing requirements related to materiality, order of notes, subtotals, accounting policies and disaggregation.
Retrospective application of this standard is effective for fiscal years beginning on or after January 1, 2016, with
earlier application permitted. The adoption of this amended standard is not expected to have a material impact
on the Company’s disclosure.
In May 2014, the IASB issued IFRS 15 “Revenue from Contracts with Customers”. It replaces existing revenue
recognition guidance and provides a single, principles-based five-step model to be applied to all contracts with
customers. Retrospective application of this standard is effective for fiscal years beginning on or after January 1,
2017, with earlier application permitted. The Company is currently assessing the impact of this standard.

DTX .TO ANNUAL REPORT
201461
04 ACQUISITIONS
During the year ended December 31, 2014, the Company completed several minor transactions to acquire interests
in producing oil and natural gas assets principally located in the Brazeau area of Alberta for total consideration of
$22.6 million. Had the acquisitions closed on January 1, 2014, the Company estimates that its pro forma revenue
and net income for the period would not have been significantly affected.
Year ended December 31, 2014
($000s)
Net assets acquired Petroleum and natural gas assets 17,268 E&E assets 6,746 Decommissioning liabilities (1,415)
22,599
Consideration Total cash consideration 22,599
During the year ended December 31, 2013, the Company completed several minor transactions to acquire interests
in producing oil and natural gas assets principally located in the Brazeau area of Alberta for total consideration of
$11.7 million. Had the acquisitions closed on January 1, 2013, the Company estimates that its pro forma revenue
and net loss for the period would not have been significantly affected.
Year ended December 31, 2013
($000s)
Net assets acquired Petroleum and natural gas assets 12,202 E&E assets 901 Decommissioning liabilities (1,409)
11,694
Consideration Total cash consideration 11,694
05 EXPLORATION AND EVALUATION ASSETS
Years Ended December 31, 2014 2013
($000s)
Balance – January 1 45,611 29,893
Additions 23,454 33,164
Acquisitions through business combinations 6,746 901
Transfers to property and equipment (3,709) (9,471)
E&E expenses (8,570) (8,594)
Lease expiries (748) (282)
Balance – December 31 62,784 45,611

DTX .TO ANNUAL REPORT2014
62
E&E assets consist of the Company’s exploration projects that are pending the determination of proved or probable reserves. Additions represent the Company’s share of costs incurred on E&E assets during the year and acquisitions represent E&E assets included in business combinations during the year.
During the year ended December 31, 2014, the Company incurred $8.6 million to drill three vertical stratigraphic test wells in Ferguson and one well in the Peace River Arch area that was determined to be unsuccessful (December 31, 2013 – $8.6 million on three dry and abandoned wells and preliminary drilling costs) and $0.7 million related to lease expiries on undeveloped land (December 31, 2013 – $0.3 million).
During the year ended December 31, 2014, approximately $0.6 million of directly attributable general and administrative expense and $0.5 million of directly attributable share-based compensation expense were capitalized as expenditures on exploration and evaluation assets (December 31, 2013 – $1.2 million and $0.7 million, respectively).
06 PROPERTY AND EQUIPMENT
Oil and Natural Gas Office Properties Equipment Total
($000s)
Cost or deemed costBalance – January 1, 2013 345,000 309 345,309Additions 179,132 109 179,241Acquisitions (note 4) 12,202 – 12,202Transfers from E&E assets 9,471 – 9,471
Balance – December 31, 2013 545,805 418 546,223Additions 257,943 56 257,999Acquisitions (note 4) 17,268 – 17,268Transfers from E&E assets 3,709 – 3,709
Balance – December 31, 2014 824,725 474 825,199
Accumulated depletion and depreciationBalance – January 1, 2013 66,053 96 66,149Depletion and depreciation for the year 51,252 57 51,309
Balance – December 31, 2013 117,305 153 117,458Depletion and depreciation for the year 80,730 69 80,799Balance – December 31, 2014 198,035 222 198,257
Net book valueDecember 31, 2013 428,500 265 428,765December 31, 2014 626,690 252 626,942
(a) CAPITALIZATION OF GENERAL AND ADMINISTRATIVE AND SHARE-BASED COMPENSATION EXPENSES
During the year ended December 31, 2014, approximately $1.7 million of directly attributable general and administrative expense and $1.5 million of directly attributable share-based compensation expense were capitalized as expenditures on property and equipment (December 31, 2013 – $0.8 million and $0.7 million, respectively).
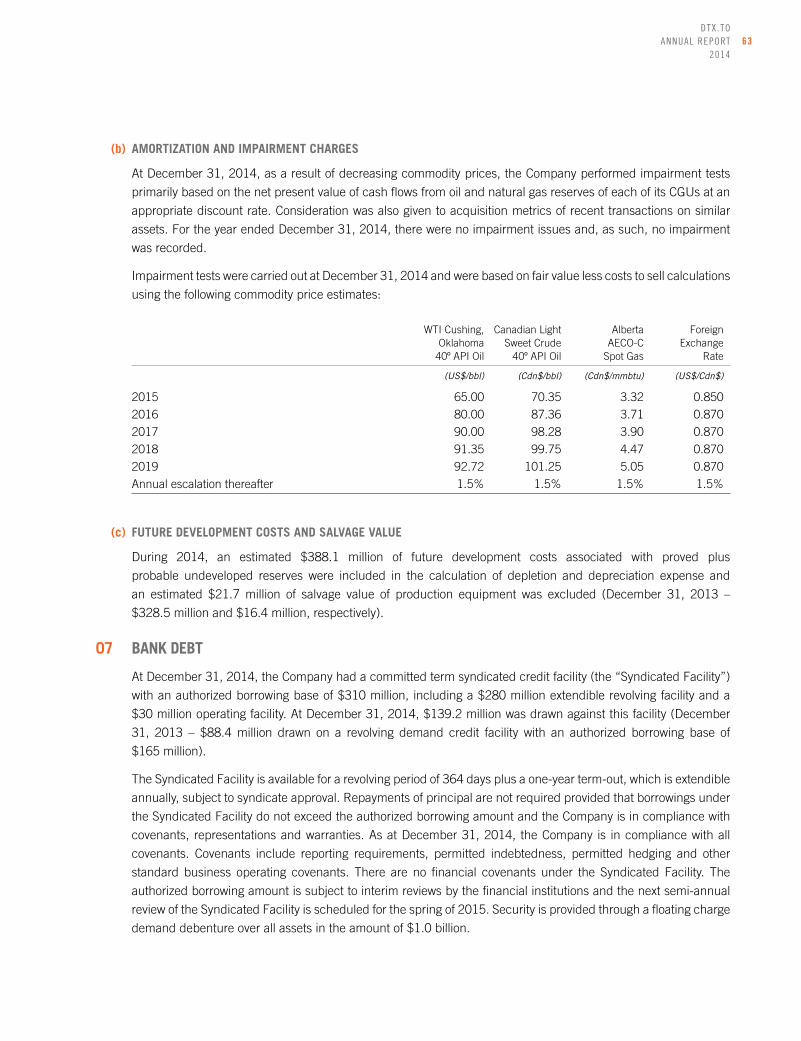
DTX .TO ANNUAL REPORT
201463
(b) AMORTIZATION AND IMPAIRMENT CHARGES
At December 31, 2014, as a result of decreasing commodity prices, the Company performed impairment tests
primarily based on the net present value of cash flows from oil and natural gas reserves of each of its CGUs at an
appropriate discount rate. Consideration was also given to acquisition metrics of recent transactions on similar
assets. For the year ended December 31, 2014, there were no impairment issues and, as such, no impairment
was recorded.
Impairment tests were carried out at December 31, 2014 and were based on fair value less costs to sell calculations
using the following commodity price estimates:
WTI Cushing, Canadian Light Alberta Foreign Oklahoma Sweet Crude AECO-C Exchange 40º API Oil 40º API Oil Spot Gas Rate
(US$/bbl) (Cdn$/bbl) (Cdn$/mmbtu) (US$/Cdn$)
2015 65.00 70.35 3.32 0.850
2016 80.00 87.36 3.71 0.870
2017 90.00 98.28 3.90 0.870
2018 91.35 99.75 4.47 0.870
2019 92.72 101.25 5.05 0.870
Annual escalation thereafter 1.5% 1.5% 1.5% 1.5%
(c) FUTURE DEVELOPMENT COSTS AND SALVAGE VALUE
During 2014, an estimated $388.1 million of future development costs associated with proved plus
probable undeveloped reserves were included in the calculation of depletion and depreciation expense and
an estimated $21.7 million of salvage value of production equipment was excluded (December 31, 2013 –
$328.5 million and $16.4 million, respectively).
07 BANK DEBT
At December 31, 2014, the Company had a committed term syndicated credit facility (the “Syndicated Facility”)
with an authorized borrowing base of $310 million, including a $280 million extendible revolving facility and a
$30 million operating facility. At December 31, 2014, $139.2 million was drawn against this facility (December
31, 2013 – $88.4 million drawn on a revolving demand credit facility with an authorized borrowing base of
$165 million).
The Syndicated Facility is available for a revolving period of 364 days plus a one-year term-out, which is extendible
annually, subject to syndicate approval. Repayments of principal are not required provided that borrowings under
the Syndicated Facility do not exceed the authorized borrowing amount and the Company is in compliance with
covenants, representations and warranties. As at December 31, 2014, the Company is in compliance with all
covenants. Covenants include reporting requirements, permitted indebtedness, permitted hedging and other
standard business operating covenants. There are no financial covenants under the Syndicated Facility. The
authorized borrowing amount is subject to interim reviews by the financial institutions and the next semi-annual
review of the Syndicated Facility is scheduled for the spring of 2015. Security is provided through a floating charge
demand debenture over all assets in the amount of $1.0 billion.

DTX .TO ANNUAL REPORT2014
64
Borrowings under the Syndicated Facility are available on a fully revolving basis for a period of 364 days until
April 29, 2015, at which time the Company can request approval by the lenders for an extension of an
additional 364 days or convert the outstanding indebtedness to a one-year term loan with full repayment due on
April 29, 2016. As a result of these terms, the bank debt is classified as a long-term liability on the statement of
financial position at December 31, 2014.
The Syndicated Facility bears interest on a grid system which ranges from bank prime plus 1.0 percent to bank
prime plus 3.5 percent depending on the Company’s total net debt to cash flow ratio as defined by the lender,
ranging from less than 1:1 to greater than 3:1. The Syndicated Facility provides that advances may be made by way
of prime rate loans, U.S. base rate loans, London InterBank Offered Rate (LIBOR) loans, bankers’ acceptances
or letters of credit. A standby fee of 0.500 percent to 0.875 percent is charged on the undrawn portion of the
Syndicated Facility, also calculated depending on the Company’s total net debt to cash flow ratio, as defined by
the lender.
08 DECOMMISSIONING LIABILITIES
The Company has estimated the net present value of decommissioning obligations to be $34.2 million as at
December 31, 2014 (December 31, 2013 – $26.3 million) based on an undiscounted total future liability of
$47.1 million (December 31, 2013 – $34 million). These payments are expected to be incurred over a period
of two to 20 years with the majority of costs to be incurred between 2016 and 2026. At December 31, 2014, a
risk-free rate of 2.5 percent (December 31, 2013 – 3.00 percent) and an inflation rate of 2 percent (December
31, 2013 – 2 percent) were used to calculate the net present value of the decommissioning liabilities. Revisions
to estimates are comprised of $1.7 million related to change in the risk-free interest rate, $0.5 million related to
the change in the interest rate used to record acquired decommiissioning liabilities from the credit-adjusted rate
to the risk-free rate and $0.7 million related to change in cost estimates.
Years Ended December 31, 2014 2013
($000s)
Balance – January 1 26,291 13,982
Liabilities incurred 2,722 2,164
Liabilities acquired 1,415 1,409
Revisions 2,904 8,672
Settlements (17) (433)
Accretion of decommissioning liabilities 850 497
Balance – December 31 34,165 26,291
09 SHARE CAPITAL
(a) AUTHORIZED
Unlimited number of common voting shares, no par value.
Unlimited number of preferred shares, no par value, issuable in series.

DTX .TO ANNUAL REPORT
201465
(b) ISSUED – COMMON SHARES
Years Ended December 31, 2014 2013
Shares Amount Shares Amount
(#) ($000s) (#) ($000s)
Balance – January 1 81,560,316 309,323 71,080,173 231,415
Common shares issued (i) 5,714,200 63,428 9,453,000 74,986
Flow-through shares issued (ii) 752,000 10,002 465,900 5,008
Premium on flow-through shares (ii) – (1,654) – (699)
Exercise of options (iii) 947,944 3,479 561,243 2,203
Share issuance costs – (4,048) – (4,786)
Tax benefit of share issuance costs – 1,010 – 1,196
Balance – December 31 88,974,460 381,540 81,560,316 309,323
i) COMMON SHARE ISSUANCES
In May 2014, DeeThree issued 5,714,200 common shares at a price of $11.10 per share for total gross
proceeds of $63.4 million ($60.0 million net of estimated share issuance costs), including 304,200 common
shares issued pursuant to the partial exercise of the over-allotment.
In December 2013, DeeThree issued 3,800,000 common shares at a price of $9.25 per share for total
gross proceeds of $35.2 million ($33.2 million net of estimated share issuance costs). Subsequent to the
original issuance, DeeThree also issued 570,000 common shares at a price of $9.25 per share for total
gross proceeds of $5.3 million ($5 million net of estimated share issue costs) on the exercise in full of the
underwriters’ over-allotment option.
In February 2013, the Company issued 4,420,000 common shares at a price of $6.80 per share for total
gross proceeds of $30.1 million ($28.1 million net of estimated share issuance costs). In March 2013, the
Company issued 663,000 common shares at a price of $6.80 per share for total gross proceeds of $4.5 million
($4.2 million net of estimated share issuance costs) on the exercise in full of the underwriters’ over-allotment
option from the February issuance.
ii) FLOW-THROUGH SHARE ISSUANCES
In May 2014, DeeThree issued 752,000 flow-through shares at a price of $13.30 per share for total gross
proceeds of $10.0 million ($9.4 million net of estimated share issuance costs). The implied premium on the flow-
through shares of $2.20 per share or $1.7 million was recorded as a liability on the statement of financial position
and $0.1 million remains at December 31, 2014. To date, the Company has incurred $9.4 million of the total
$10.0 million of qualifying exploration expenditures, with the entire amount to be spent by December 31, 2015.
In December 2013, DeeThree issued 465,900 flow-through shares at a price of $10.75 per share for total
gross proceeds of $5 million ($4.8 million net of estimated share issue costs). The implied premium on the
flow-through shares of $1.50 per share or $0.7 million was initially recorded as a liability on the statement
of financial position and $nil remains at December 31, 2014. To date, the Company has incurred all of the
qualifying exploration expenditures and the commitment has been fulfilled.

DTX .TO ANNUAL REPORT2014
66
iii) EXERCISING OF OPTIONS
During 2014, 947,944 options were exercised at a weighted-average price of $2.56 per share for total cash
proceeds of $2.4 million and previously recognized share-based compensation expense of $1.1 million.
During 2013, 561,243 options were exercised at a weighted-average price of $2.875 per share for total cash
proceeds of $1.6 million and previously recognized share-based compensation expense of $0.6 million.
(c) PER SHARE AMOUNTS
Per share amounts were calculated on the weighted-average number of shares outstanding. The basic and diluted
shares outstanding were as follows:
Years Ended December 31, 2014 2013
(000s, except per share amounts) ($) ($)
Net income for the period 76,233 18,048
Weighted-average number (#) (#)
of common shares
– basic 86,088 76,009
– diluted 88,763 78,892
Net income per weighted ($) ($)
average common share
– basic 0.89 0.24
– diluted 0.86 0.23
10 SHARE-BASED COMPENSATION
The Company has an option program that entitles officers, directors, employees and certain consultants to
purchase Company shares. Options are granted based on the five-day volume-weighted average common share
price prior to the date of grant, vest 20 percent after six months and then 20 percent on the first, second, third
and fourth anniversaries from the grant date and expire five years from the grant date.
The number and weighted-average exercise prices of stock options are as follows:
Years Ended December 31, 2014 2013
Weighted- Weighted- Average Average Exercise Exercise Options Price Options Price
(#) ($) (#) ($)
Outstanding – January 1 6,524,272 4.21 5,699,632 3.19
Issued 2,165,000 9.77 1,414,000 7.83
Exercised (947,944) 2.56 (561,243) 2.87
Forfeited (65,000) 9.25 (28,117) 6.67
Outstanding – December 31 7,676,328 5.94 6,524,272 4.21
Exercisable – December 31 3,916,972 4.39 3,258,136 3.37

DTX .TO ANNUAL REPORT
201467
Weighted- Average Weighted-Average Options Contractual Options Exercise Price Outstanding Life Exercisable
($) (#) (years) (#)
As at December 31, 20142.00 – 2.99 1,824,250 1.31 1,532,2503.00 – 3.99 962,820 2.09 559,0874.00 – 4.99 1,376,158 1.60 981,3355.00 – 5.99 9,000 2.70 3,0006.00 – 6.99 100,000 2.93 38,0007.00 – 7.99 1,154,100 3.34 450,3008.00 – 8.99 90,000 3.87 28,0009.00 – 9.99 1,335,000 4.23 277,00010.00 – 10.99 635,000 4.52 28,00011.00 – 11.84 190,000 4.47 20,000
7,676,328 2.67 3,916,972
The fair value of the common share purchase options granted during the year was estimated as at the date of
grant using the Black-Scholes option-pricing model and the following weighted-average assumptions:
As at December 31, 2014 2013
Risk-free interest rate (%) 1.28 1.13
Expected life (years) 3.10 3.10
Expected volatility (%) 49 66
Expected dividend yield (%) 0 0
Fair value of options granted during the year ($/option) 3.36 3.45
A forfeiture rate of 2 percent for options granted during 2014 (2013 – 2 percent) was used when recording
share-based compensation expense. This estimate is adjusted to the actual forfeiture rate. Gross share-based
compensation was $5.0 million for the year ended December 31, 2014 (December 31, 2013 – $3.6 million).
Of this amount, $0.2 million was reclassified to operating expense for the amount related to field employees
(December 31, 2013 – $0.2 million) and $1.9 million was capitalized (December 31, 2013 – $1.4 million),
resulting in total net share-based compensation expense of $2.9 million for the year (December 31, 2013 –
$2.1 million).

DTX .TO ANNUAL REPORT2014
68
11 INCOME TAXES
The actual income tax provision differs from the expected amount calculated by applying the Canadian combined
federal and provincial corporate tax rates to income before income taxes. These differences are explained
as follows:
Years Ended December 31, 2014 2013
($000s except percentages)
Income before income tax 104,564 27,301
Tax rate 25% 25%
Computed income tax expense provision 26,141 6,825
Increase (decrease) in income taxes resulting from:
Share-based compensation 841 611
Flow-through shares 3,608 4,763
Non-deductible expenses 9 9
Other (10) –
Subtotal 30,589 12,208
Flow-through share premium (2,258) (2,955)
Income tax expense 28,331 9,253
Deferred income taxes reflect the net tax effects of temporary differences between the carrying amounts of assets
and liabilities for financial reporting purposes and the amounts used for income tax purposes. The components
of the Company’s net deferred income tax assets and liabilities are as follows:
Years Ended December 31, 2014 2013
($000s)
Deferred income tax assets (liabilities)
Non-capital losses carried forward 6,865 5,200
Share issuance costs 2,428 3,438
Derivative financial instruments (5,818) 555
Decommissioning liabilities 8,542 6,574
Net book value of property and equipment in excess of tax basis (55,897) (30,072)
Deferred income tax liabilities (43,880) (14,305)

DTX .TO ANNUAL REPORT
201469
Balance, Recognized Balance, January 1, Directly in Recognized in December 31, 2014 Equity Profit or Loss 2014
($000s)
E&E, and property and equipment (30,072) – (25,825) (55,897)Derivative financial instruments 555 – (6,373) (5,818)Decommissioning liabilities 6,574 – 1,968 8,542Share issuance costs 3,438 1,010 (2,020) 2,428Non-capital losses carried forward 5,200 – 1,665 6,865
(14,305) 1,010 (30,585) (43,880)
Balance, Recognized Balance, January 1, Directly in Recognized in December 31, 2013 Equity Profit or Loss 2013
($000s)
E&E, and property and equipment (15,769) – (14,303) (30,072)
Derivative financial instruments (212) – 767 555
Decommissioning liabilities 3,496 – 3,078 6,574
Share issuance costs 3,063 1,196 (821) 3,438
Non-capital losses carried forward 6,132 – (932) 5,200
(3,290) 1,196 (12,211) (14,305)
The Company has $27.5 million of non-capital losses that begin to expire in 2029.
12 SUPPLEMENTAL CASH FLOW INFORMATION
Changes in non-cash working capital are comprised of:
Years Ended December 31, 2014 2013
($000s)
Accounts receivable (7,216) (3,485)
Deposits and prepaid expenses (86) 344
Accounts payable and accrued liabilities 8,032 20,042
Abandonment and reclamation costs (17) (433)
713 16,468
Related to operating activities 11,043 4,153
Related to financing activities – –
Related to investing activities (10,330) 12,315
713 16,468

DTX .TO ANNUAL REPORT2014
70
13 SUPPLEMENTAL DISCLOSURE
The aggregate payroll expense of employees and executive management was as follows:
Years Ended December 31, 2014 2013
($000s)
Salaries and wages (including bonuses) 7,004 5,618
Benefits and other personnel costs 508 301
Share-based compensation (gross) 5,039 3,613
Total employee remuneration 12,551 9,532
Capitalized portion of total remuneration (4,432) (3,387)
8,119 6,145
Personnel expenses directly attributable to capital activities have been capitalized and included in property and
equipment and E&E assets.
In addition to paying salaries, the Company also provides non-cash benefits to executive officers. The executive
officers include the Executive Chairman, Chief Executive Officer (CEO), Chief Financial Officer (CFO), the
Vice Presidents and the Controller. Executive officers also participate in the Company’s stock option program.
Compensation of key management personnel is comprised of the following:
Years Ended December 31, 2014 2013
($000s)
Salaries and wages (including bonuses) 2,422 1,801
Benefits and other personnel costs 167 96
Share-based compensation (1) 1,761 1,076
4,350 2,973
(1) Represents the amortization of share-based compensation associated with options granted to executive officers as recorded in the financial statements.
14 FINANCE EXPENSES
Years Ended December 31, 2014 2013
($000s)
Finance expenses:
Interest on bank debt 4,275 2,839
Standby and other fees related to credit facility 636 137
Part XII.6 tax related to flow-through shares 10 62
Accretion expense 850 497
Net finance expenses recognized in net income 5,771 3,535
15 DETERMINATION OF FAIR VALUES
A number of the Company’s accounting policies and disclosures require the determination of fair value for financial
and non-financial assets and liabilities. Fair values have been determined for measurement and/or disclosure
purposes based on the following methods. When applicable, further information about the assumptions made in
determining fair values is disclosed in the notes specific to that asset or liability.

DTX .TO ANNUAL REPORT
201471
(a) PROPERTY AND EQUIPMENT AND E&E ASSETS
The fair value of property and equipment recognized in a business combination is based on market values. The
market value of property and equipment is the estimated amount for which property and equipment could be
exchanged on the acquisition date between a willing buyer and a willing seller in an arm’s-length transaction after
proper marketing wherein the parties had each acted knowledgeably, prudently and without compulsion. The
market value of petroleum and natural gas properties (included in property and equipment) and E&E assets is
estimated with reference to the discounted cash flows expected to be derived from oil and natural gas production
based on externally prepared reserve reports. The risk-adjusted discount rate is specific to the asset with reference
to general market conditions.
The market value of other items of property and equipment is based on the quoted market prices for similar items.
(b) CASH AND CASH EQUIVALENTS, ACCOUNTS RECEIVABLE, ACCOUNTS PAYABLE AND ACCRUED LIABILITIES
The fair value of cash and cash equivalents, accounts receivable, accounts payable and accrued liabilities is
estimated as the present value of future cash flows, discounted at the market rate of interest at the reporting date.
The fair value of these balances approximated their carrying value at December 31, 2014 due to their short term
to maturity.
(c) STOCK OPTIONS
The fair value of stock options is measured using the Black-Scholes option-pricing model. Measurement inputs
include share price on measurement date, exercise price of the instrument, expected volatility (based on weighted-
average historical volatility adjusted for changes expected due to publicly available information), weighted-average
expected life of the instruments (based on historical experience and general option-holder behaviour) and the
risk-free interest rate (based on Government of Canada bonds).
(d) DERIVATIVE FINANCIAL INSTRUMENTS
DeeThree classifies the fair value of these transactions according to the following hierarchy based on the nature
of the observable inputs used to value the instrument.
• Level 1 – Quoted prices are available in active markets for identical assets or liabilities as of the reporting date.
Active markets are those in which transactions occur in sufficient frequency and volume to provide continuous
pricing information.
• Level 2 – Pricing inputs are other than quoted prices in active markets included in Level 1. Prices are either directly
or indirectly observable as of the reporting date. Level 2 valuations are based on inputs, including quoted forward
prices for commodities, time value and volatility factors, which can be substantially observed or corroborated in
the marketplace.
• Level 3 – Valuations are derived from inputs that are not based on observable market data.
The carrying values of cash and cash equivalents, accounts receivable, accounts payable and accrued liabilities
included in the statement of financial position approximate fair value due to the short-term nature of those instruments.
The fair value measurement of the derivative financial instruments has a fair value classification of Level 2.
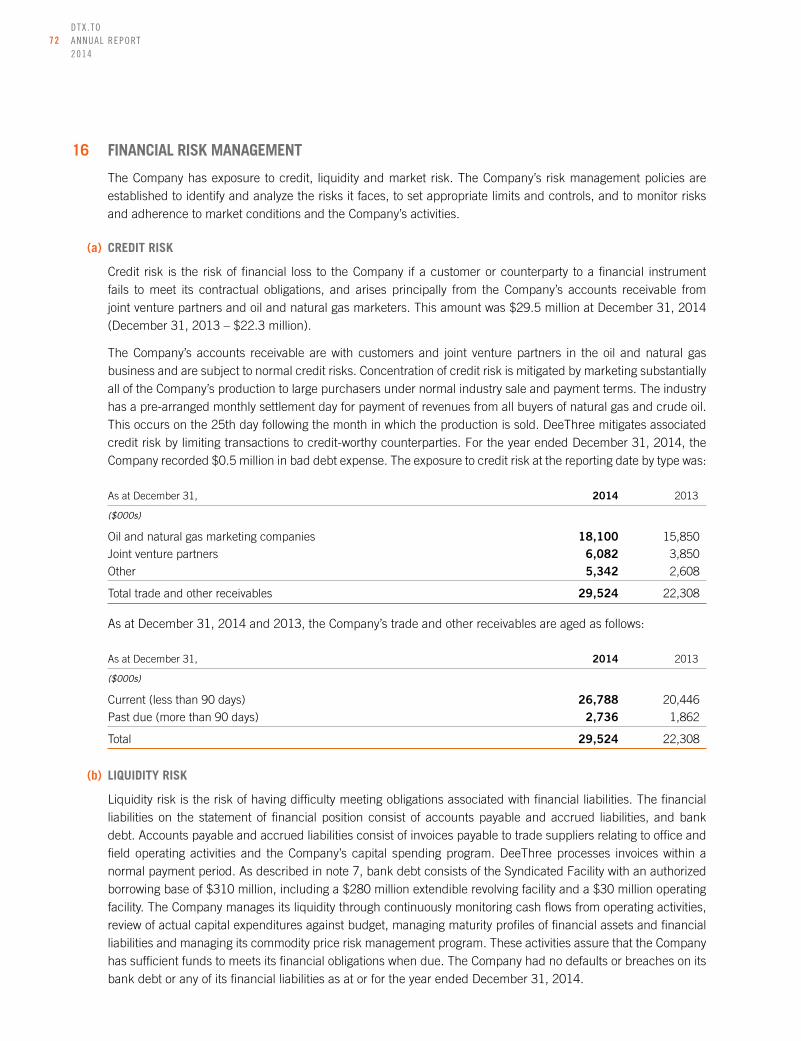
DTX .TO ANNUAL REPORT2014
72
16 FINANCIAL RISK MANAGEMENT
The Company has exposure to credit, liquidity and market risk. The Company’s risk management policies are established to identify and analyze the risks it faces, to set appropriate limits and controls, and to monitor risks and adherence to market conditions and the Company’s activities.
(a) CREDIT RISK
Credit risk is the risk of financial loss to the Company if a customer or counterparty to a financial instrument fails to meet its contractual obligations, and arises principally from the Company’s accounts receivable from joint venture partners and oil and natural gas marketers. This amount was $29.5 million at December 31, 2014 (December 31, 2013 – $22.3 million).
The Company’s accounts receivable are with customers and joint venture partners in the oil and natural gas business and are subject to normal credit risks. Concentration of credit risk is mitigated by marketing substantially all of the Company’s production to large purchasers under normal industry sale and payment terms. The industry has a pre-arranged monthly settlement day for payment of revenues from all buyers of natural gas and crude oil. This occurs on the 25th day following the month in which the production is sold. DeeThree mitigates associated credit risk by limiting transactions to credit-worthy counterparties. For the year ended December 31, 2014, the Company recorded $0.5 million in bad debt expense. The exposure to credit risk at the reporting date by type was:
As at December 31, 2014 2013
($000s)
Oil and natural gas marketing companies 18,100 15,850
Joint venture partners 6,082 3,850
Other 5,342 2,608
Total trade and other receivables 29,524 22,308
As at December 31, 2014 and 2013, the Company’s trade and other receivables are aged as follows:
As at December 31, 2014 2013
($000s)
Current (less than 90 days) 26,788 20,446
Past due (more than 90 days) 2,736 1,862
Total 29,524 22,308
(b) LIQUIDITY RISK
Liquidity risk is the risk of having difficulty meeting obligations associated with financial liabilities. The financial liabilities on the statement of financial position consist of accounts payable and accrued liabilities, and bank debt. Accounts payable and accrued liabilities consist of invoices payable to trade suppliers relating to office and field operating activities and the Company’s capital spending program. DeeThree processes invoices within a normal payment period. As described in note 7, bank debt consists of the Syndicated Facility with an authorized borrowing base of $310 million, including a $280 million extendible revolving facility and a $30 million operating facility. The Company manages its liquidity through continuously monitoring cash flows from operating activities, review of actual capital expenditures against budget, managing maturity profiles of financial assets and financial liabilities and managing its commodity price risk management program. These activities assure that the Company has sufficient funds to meets its financial obligations when due. The Company had no defaults or breaches on its bank debt or any of its financial liabilities as at or for the year ended December 31, 2014.

DTX .TO ANNUAL REPORT
201473
The following table details the Company’s financial liabilities as at December 31, 2014:
As at December 31, 2014 Within Over Total 1 Year 1 Year
($000s)
Non-derivative financial liabilities: Bank debt 139,234 – 139,234 Accounts payable and accrued liabilities 62,319 62,319 –
Total financial liabilities 201,553 62,319 139,234
(c) MARKET RISK
Market risk is the risk of changes in market prices, such as commodity prices, foreign currency exchange rates
and interest rates, affecting the Company’s net earnings or value of its financial instruments. The objective of
managing market risk is to control market risk exposure within acceptable limits, while optimizing returns. The
Company will enter into such transactions in accordance with the risk management policy approved by the Board
of Directors.
COMMODITY PRICE RISK
Commodity price risk is the risk that the fair value of future cash flows will fluctuate as a result of changes in
commodity prices. Commodity prices for crude oil and natural gas are influenced not only by the relationship
between the Canadian and United States dollars, as outlined below, but also by global economic events that
dictate the levels of supply and demand. The Company has attempted to mitigate commodity price risk through
the use of financial contracts for its crude oil production.
As at December 31, 2014, the Company had the following crude oil and foreign exchange risk management
contracts, with a total mark-to-market asset of $23.3 million (December 31, 2013 – liability of $2.2 million):
CRUDE OIL CONTRACTS
Period Commodity Type of Contract Quantity Pricing Point Contract Price
Jan. 1/15 – Dec. 31/15 Crude Oil Collar 500 bbls/d WTI-NYMEX US$85.00/bbl (floor) – US$100.80/bbl (cap)
Jan. 1/15 – Dec. 31/15 Crude Oil Fixed 500 bbls/d WTI-NYMEX Cdn$99.00/bbl
Jan. 1/15 – Dec. 31/15 Crude Oil Fixed 500 bbls/d WTI-NYMEX Cdn$99.39/bbl
Jan. 1/15 – Dec. 31/15 Crude Oil Fixed 500 bbls/d WTI-NYMEX Cdn$100.00/bbl
FOREIGN EXCHANGE CONTRACT
Pricing Point Period Currency Type of Contract Quantity (Cdn$/US$)
Jan. 1/15 – Dec. 31/15 US$ Average Rate Range Forward US$1,300,000 Trigger – 1.1300 Cdn$/US$ Floor – 1.100 Cdn$/US$ Ceiling – 1.1110 Cdn$/US$

DTX .TO ANNUAL REPORT2014
74
INTEREST RATE CONTRACT
Term Amount Fixed Rate Index
Feb. 18 /14 – Feb. 18/16 Cdn$40 million 1.44% CDOR
Subsequent to December 31, 2014, DeeThree entered into the following crude oil risk management contracts:
CRUDE OIL CONTRACTS
Period Commodity Type of Contract Quantity Pricing Point Contract Price
March 1/15 – June 30/16 Crude Oil Fixed 250 bbls/d WTI-NYMEX Cdn$72.92/bbl
Jan. 1/16 – Dec. 31/16 Crude Oil Fixed 250 bbls/d WTI-NYMEX Cdn$78.00/bbl
(d) CAPITAL MANAGEMENT
The Company’s policy is to maintain a strong but flexible capital structure so as to maintain investor, creditor
and market confidence and to sustain its future development. The Company manages its capital structure and
adjusts it in light of changes in economic conditions. The Company, upon approval from its Board of Directors,
will balance its overall capital structure through issuance of new shares or additional debt, or by undertaking other
activities as deemed appropriate for the circumstances. The Company’s capital structure consists of bank debt
and shareholders’ equity comprising issued share capital, contributed surplus and deficit.
The following summarizes the Company’s capital structure:
As at December 31, 2014 2013
($000s)
Bank debt 139,234 88,404
Shareholders’ equity 463,509 311,070
In order to maintain or adjust its capital structure, DeeThree may issue new common shares, issue new debt,
adjust exploration and development capital expenditures or acquire or dispose of assets.
To facilitate its capital management, the Company prepares annual capital expenditure budgets which are
updated as necessary in light of varying factors including: current economic conditions, the risk characteristics of
the Company’s petroleum and natural gas assets, the Company’s inventory of investment opportunities, current
and forecast net debt, current and forecast commodity prices, and other factors that influence commodity prices
and funds from operations, such as quality and basis differentials, royalties and operating costs. The Company will
continually evaluate available sources of funds to finance its capital expenditures and may from time to time issue
new equity if available on favourable terms or seek additional debt financing at levels consistent with its policy of
optimizing the cost of capital.
There were no changes in the Company’s approach to capital management during the year ended
December 31, 2014.

DTX .TO ANNUAL REPORT
201475
17 COMMITMENTS
Years Ended December 31, 2015 2016 2017 Total
($000s)
Operating lease – office 640 160 – 800
Operating lease – equipment 28 – – 28
Exploration expenditures (flow-through) 577 – – 577
Total commitments 1,245 160 – 1,405
As at December 31, 2014, the Company had contractual obligations for its office leases totalling approximately
$0.8 million to March 2016. The head office lease obligations are comprised of the lease payments and an
estimate of occupancy costs of the Company’s head office space. The Company also had contractual obligations
for several vehicles and equipment totalling approximately $0.03 million to October 2015.
In connection with the Company’s issuance of flow-through shares during the second quarter of 2014, DeeThree
is required to spend $10.0 million of eligible exploration expenditures. As at December 31, 2014, $9.4 million of
these expenditures have been incurred, with the remaining $0.6 million to be spent by December 31, 2015. The
expenditures were renounced to shareholders in January 2015, effective December 31, 2014.

DTX .TO ANNUAL REPORT2014
76
CORPORATE INFORMATIONBoard of DirectorsMichael KabanukExecutive ChairmanDeeThree Exploration Ltd.
Brendan CarrigyIndependent Businessman
Martin CheynePresident & Chief Executive Officer DeeThree Exploration Ltd.
Henry Hamm (1)(2)(3)(4) Independent Businessman
Dennis Nerland (1)(2)(3)
Partner Shea Nerland Calnan LLP
Brad Porter (1)(2)(3)(4) Independent Businessman
Kevin Andrus (1)(2)(3)(4) Portfolio Manager of Energy Investments GMT Capital Corp.
(1) Audit Committee Member(2) Reserves Committee Member(3) Corporate Governance & Compensation Committee Member (4) Nominating Committee Member
OfficersMartin CheynePresident & Chief Executive Officer
Gail HannonChief Financial Officer
Trevor MurrayVice President, Land
Clayton ThatcherVice President, Exploration
Jonathan FlemingVice President, Capital Markets
Casey PaulhusController
Daniel KenneyCorporate Secretary
Head OfficeSuite 2200 520 Third Avenue S.W. Calgary, Alberta T2P 0R3 Telephone: 403-767-3060 Facsimile: 403-263-9710 Website: www.deethree.ca
AuditorsKPMG LLPCalgary, Alberta
BankersNational Bank of CanadaCalgary, Alberta
ATB FinancialCalgary, Alberta
The Bank of Nova ScotiaCalgary, Alberta
The Toronto-Dominion BankCalgary, Alberta
Union Bank, Canada BranchCalgary, Alberta
Evaluation EngineersSproule Associates LimitedCalgary, Alberta
Legal CounselDavis LLPCalgary, Alberta
Registrar and Transfer AgentComputershare Trust Company of CanadaCalgary, Alberta
Stock TradingToronto Stock ExchangeTrading Symbol: DTX
OTCQXTrading Symbol: DTHRF

Prod
uced
by M
erlin
Edg
e In
c.
www.
mer
lined
ge.c
om
Prin
ted
in C
anad
a
Abbreviations
bbls barrelsboe barrels of oil equivalentGJ gigajoules/d per daymbbls thousand barrelsmboe thousand barrels of
oil equivalentmcf thousand cubic feetmm million mmbtu million British
thermal unitsmmcf million cubic feetNGLs natural gas liquids
Conversion of Units
1.0 mcf = 1.02 mmbtu1.0 mcf = 1.05 GJ1.0 acre = 0.40 hectares2.5 acres = 1.0 hectare1.0 bbl = 0.159 cubic metres6.29 bbls = 1.0 cubic metre1.0 foot = 0.3048 metres3.281 feet = 1.0 metre1.0 mcf = 28.2 cubic metres0.035 mcf = 1.0 cubic metre1.0 mile = 1.61 kilometres0.62 miles = 1.0 kilometre
Natural gas is equated to oil on the basis of 6 mcf : 1 bbl

2200, 520 – 3rd Ave. SWCalgary, Alberta T2P 0R3
Telehone: 403-767-3060Fax: 403-263-9710
www.deethree.ca