1EuMW Seminars 2013
Improved Measurements Overcome High-Speed Interconnect Challenges
October 2013
Bob Buxton
EuMW Seminars 2013
Agenda
• Background• S-parameter measurements - frequency range considerations• Eye Diagrams and low frequency measurement data issues• De-embedding• Correlation – measurements and simulation• Setting emphasis levels• Superposition vs. true mode stimulus for active device
measurement• Resources• Questions
2

EuMW Seminars 2013
Background – challenge for SI Engineers
• Compliance with higher data rate standards
• Cost/performance trade-offs
• Locating Defects
• Measurement – simulation correlation
• Dealing with test fixtures
3

EuMW Seminars 2013 4
8B/10B Encoder
SerializerEqualizer Driver
Clock/PLL
10B/8B Decoder
De-SerializerEqualizerData
Recovery
CR/PLL
ParallelData
ParallelData
SerialData
Jitter and Noise
Channel Issues
Challenges for SI Engineers

EuMW Seminars 2013 5
Types of Channel

EuMW Seminars 2013 6
Tx Rx
0 2 4 6 8 10 1205
101520253035404550
FR-4 Electrical Loss Function (1 m)
SkinDielectricTotal
Frequency (GHz)
Loss
(dB)
Channel Issues - Loss
EuMW Seminars 2013 7
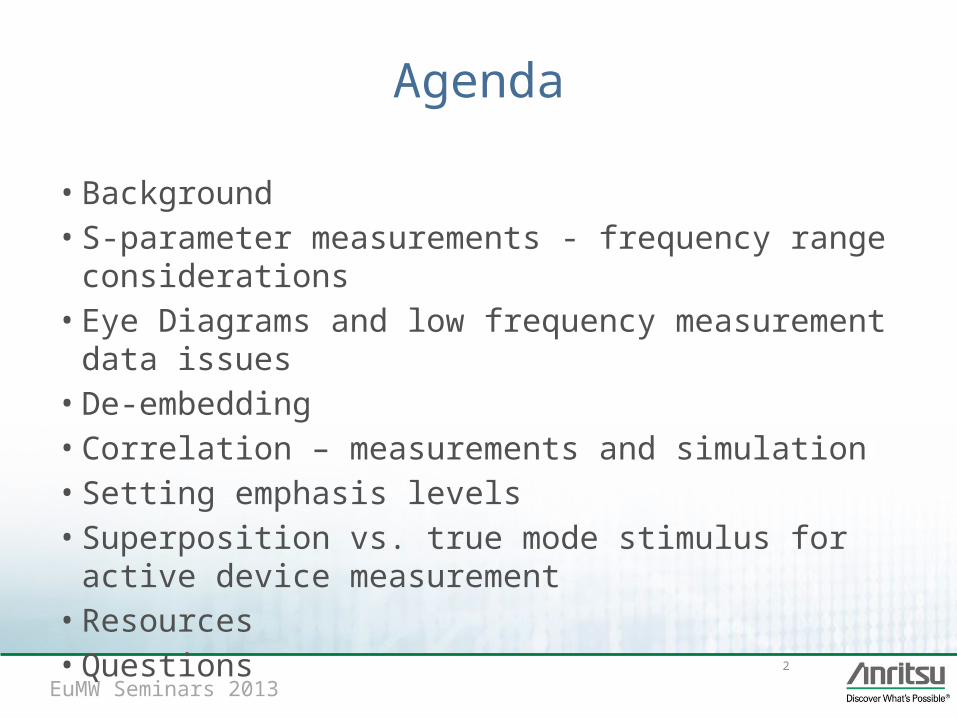
Channel artifacts (vias, impedance changes, ground plane issues etc.)
Channel Issues - Structures

EuMW Seminars 2013 8
Backplane Transmission Measurement
EuMW Seminars 2013 9
Tx Rx
Tx Rx
TxRx
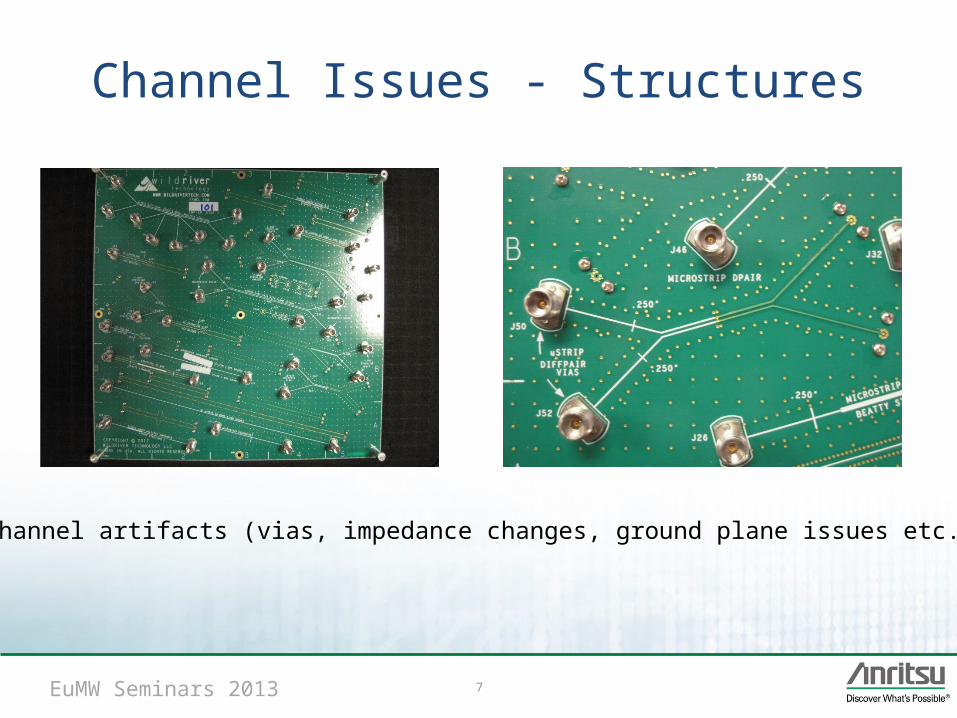
FEXT
NEXT
Channel Issues – Crosstalk

EuMW Seminars 2013 10
Harmonic Content of 28 Gbps NRZ clock signal
• Attenuating harmonics distorts signal
• Ideally measure to 5th harmonic
Importance of Maximum Frequency Range

EuMW Seminars 2013
High Frequency VNA impact – resolution
• Rule of thumb(air dielectric)
• Time = 1/BW
• Distance (reflect) = 150mm/BW (GHz)– 40 GHz = 3.7 mm– 110 GHz = 1.4 mm
• Non-air distance : divide by
11
TWO MISMATCHES SEPARATEDBy 2 mm (AIR)
span resolution1) 40 GHz 3.75
mm2) 50 GHz 3.0
mm3) 60 GHz 2.5
mm

EuMW Seminars 2013
High Frequency VNA impact - causality• Lack of causality
means output appears to occur prior to stimulus
• Can cause unstable simulations
• Higher frequency data improves causality
12
Non-Causal Results

EuMW Seminars 2013
Need for Low Frequency Data – 2 Reasons
1. DC Extrapolation
2. Sampling in the frequency domain and aliasing*– Max unambiguous time domain result: Tmax = 1/(2fs)– Need to consider multiple reflections
13
* A Reverse Nyquist Approach to Understanding the Importance of Low Frequency Information in Scattering Matrices Daniel Dvorscak and Michael Tsuk, ANSYSInc, DesignCon 2013

EuMW Seminars 2013
VNA performance and DC Extrapolation• Series of measurements
made on same 40 inch line
• VNA 1– 40 MHz to 40 GHz– Couplers for entire band
• VNA 2– 4 MHz to 40 GHz– Hybrid of bridges and couplers
14

EuMW Seminars 201315
VNA performance and DC Extrapolation• DC extrapolation depends on
quality of S-parameter measurement
• Left trace from VNA limited low frequency performance– Coupler based– 92 dB DR at 40 MHz
• Right trace from VNA with better low frequency performance– Bridges at LF– 115 dB DR at 4 MHz

EuMW Seminars 2013
Impact on step response
16
40 MHz to 40 GHz data VNA 1 4 MHz to 40 GHz data VNA 2
Slope due to poor DC extrapolation
Aliasing due to 40 MHz sampling
• Good low start frequency data improves DC extrapolation
• Low start frequency sets frequency domain sampling for low pass step response and hence alias free range

EuMW Seminars 2013
Stability at low frequency also critical
17
-40
-30
-20
-10
0
0 2 4
|S11
| (d
B)
Frequency (GHz)
Low frequency anomalies
nominal
major drift
minor drift
30
50
70
90
0.04 0.05 0.06 0.07 0.08
Impe
danc
e (o
hms)
Distance (m)
Low frequency drift impact
nominal
major drift
minor drift
-40
-30
-20
-10
0
0 20 40 60
|S11
| (d
B)
Frequency (GHz)
Low frequency anomalies
Low frequency data issues (drift/instability…) can have an out-sized effect on transformed data because of its criticality to large-distance-scale structure.

EuMW Seminars 201318
Eye diagrams – 10 Gbit• 10 Gbit
– data from VNA 1– 40 MHz to 40 GHz
• 10 Gbit– Data from VNA 2– 4 MHz to 40 GHz
0 0.05 0.1 0.15 0.2 0.25Time (ns)
Veye of Bit Stream
-0.2
-0.1
0
0.1
0.2
0.3
Vo
ltag
e (
V)
Eye at Port 2 (V)
0 0.05 0.1 0.15 0.2 0.25Time (ns)
Veye of Bit Stream
0
0.1
0.2
0.3
0.4
0.5
Vo
ltag
e (
V)
Eye at Port 2 (V)
19EuMW Seminars 2013
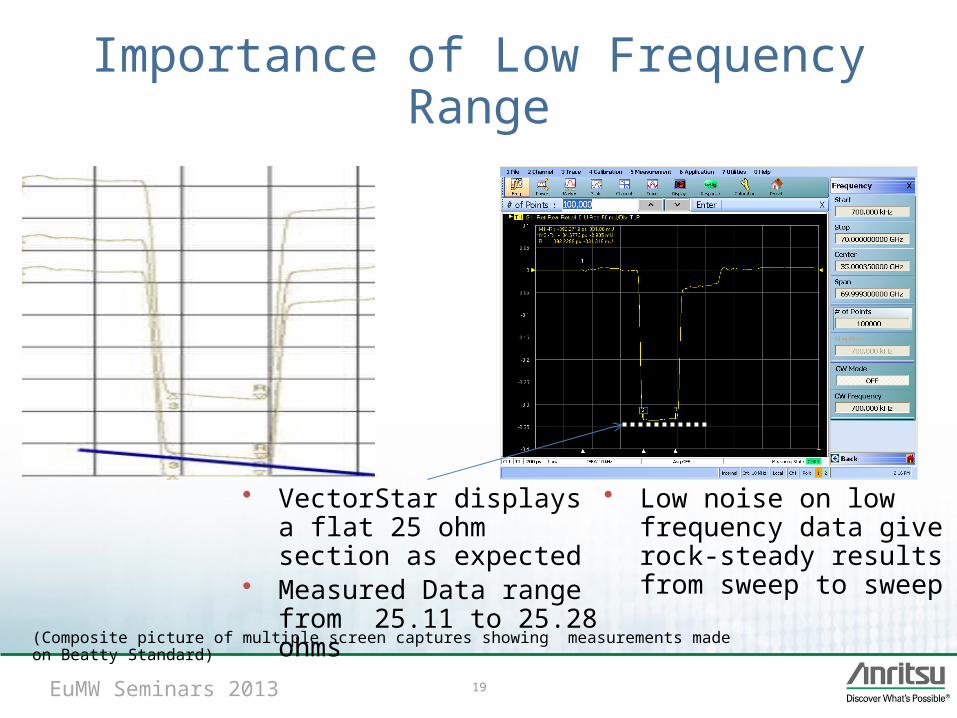
Importance of Low Frequency Range
• VectorStar displays a flat 25 ohm section as expected
• Measured Data range from 25.11 to 25.28 ohms
(Composite picture of multiple screen captures showing measurements made on Beatty Standard)
• Low noise on low frequency data give rock-steady results from sweep to sweep

20EuMW Seminars 2013
VectorStar Architecture: Two VNAs in One!
< 2.5 GHzLow Band
> 2.5 GHzHigh Band
Port 1 Port 2
a2a1
b1
b1
a1
b2
a2
b2
MS4640A Block Diagram(Fully Loaded Configuration)
optional
Bias 1 Bias 2

21
Unique Hybrid VNA Architecture• Two VNAs in parallel: Almost the only way to get 6 decades of coverage
(from kHz to GHz frequencies)– Each receiver technology (sampler or mixer) used in its best range– Each coupling technology (coupler or bridge) used in its best range– Both share a common IF path and fully synthesized source

EuMW Seminars 2013 22
Method Standards complexity
Fundamental accuracy
Sensitivity to standards
Media preferences
Type A (adapter removal)
High High
High (refl.) Need good reflect and thru stds
Type B (Bauer-Penfield)
Medium High High (refl.) Only need reflect standards, not great for coupled lines
Type C (inner-outer)
High High Medium (refl.) More redundant than A so less sensitive but need good stds still
Type D(2-port lines)
Med
Low for low-loss or mismatched fixtures
Medium (line def’n.)
Only need decent lines; match relegated to lower dependence; can handle coupled lines
Type E(4 port inner-outer)
High High Medium (refl.) Somewhat redundant (like C) but need decent standards. Best for uncoupled multiport fixtures
Type F(4-port uncoupled)
Med
Low for low-loss or mismatched fixtures
Medium (line def’n.)
Only need decent lines; match relegated to lower dependence; can handle coupled lines
Type G(4-port coupled)
Med
Low for low-loss or mismatched fixtures
Medium (line def’n.)
Only need decent lines; match relegated to lower dependence; can handle coupled lines well
Backplanes
Best AccuracyRequires good repeatability
De-embeddingMethods available within VectorStar

EuMW Seminars 2013
Correlation - Measurement and Simulation
• Use Channel Modeling Platform
• Use time domain equipment to measure Eye and compare with simulated Eye
23

EuMW Seminars 2013
Use of Channel Modeling Platform
• A set of known structures• Feed data into models• Make measurements• Make comparison
24

EuMW Seminars 2013
Correlation – Measurement and Simulation
25
Tx Rx
Simulated Using measured S-parameter data
Measured using Oscilloscope
Input waveform with no emphasis
Simulated Using measured S-parameter data
Measured using Oscilloscope
Input waveform with emphasis
- 80
- 60
- 40
- 20
0
0 10 20 30 40
Frequency [GHz]
Tra
nsm
issi
on C
hara
cter
istic
s [d
B]

26EuMW Seminars 2013
• Challenge: Difficult to find the ideal emphasis settings from the many possibilities
• Problem: Searching for ideal settings while verifying the output waveform– takes an extremely long time– hard to explain why those settings are ideal.
• Solution: Use VNA-captured S-parameter data to apply inverse DUT characteristics to input waveform
Setting Ideal Emphasis

EuMW Seminars 2013
Time and Frequency Domain – a merged solution
27
DUT (27inch PCB)
- 80
- 60
- 40
- 20
0
0 10 20 30 40
Frequency [GHz]
Tran
smis
sion
Cha
ract
eris
tics
[dB
]
Tap Settings

28EuMW Seminars 2013
MS4640B now with:• Option 031 Dual Source Architecture• Option 043 DifferentialViewTM

29EuMW Seminars 2013
VectorStar PROVIDES
• Broadest frequency span: 70 kHz to 70/110 GHz• Best time domain analysis capability• Widest range of calibration & de-embedding methods• Upgradeable in frequency range, port count &
option additions• Choice of TMS or Superposition•
Good S-parameter DataPoor S-parameter Data

30EuMW Seminars 2013
with DifferentialView and Dual Source
• True Mode Stimulus capability• Differential, common and mixed mode S-parameters• Adjust differential phase & amplitude• Instant view of results during parameter change
+
_
+ +
__
+ +
__
Differential Mode Common Mode Mixed Mode

31EuMW Seminars 2013
Port 1 Port 2 Port 3 Port 4
Time-coherent in phase and amplitude
Port 1 Port 2 Port 3 Port 4
DUT DUT
Superposition and True Mode Stimulus

EuMW Seminars 2013 32
Applicability of the two methodsDevice to be measured: Superposition True Mode
Stimulus
Passive Balanced / Differential DUT
Transmission Lines X X
PCB X X
Lumped Components X X
Passive Filters X X
Unshielded and Shielded Twisted Pair, Quad Cables X X
Connectors / Interfaces X X
Linear Active Balanced / Differential DUT
Linear Amplifiers, Differential Amplifiers X X
Linear Active Filters X X
Input / Output Match ADC / DAC X X
Non Linear Active Balanced / Differential DUT
Devices in Compression / Saturation X
Log Amplifiers X

EuMW Seminars 2013 33
Trade OffsSuperposition True Mode Stimulus
Type of VNA Single source VNA Dual source required
Method of obtaining Differential and Mixed Mode Parameters
Calculated
Measured directly
Type of DUTs
Passive and active linear Necessary only for non-linear
Available Frequency Range 70 kHz to 110 GHz 70 kHz - 110 GHz (with VectorStar)
Calibration Complexity
Typical 4-port
Typical 4-port plus calibration of dual sources
Average Calibration Time
T (Time depends on number of points, IF BW, skill of operator)
Approx. 2T
Calibration stability considerations Normal measurement calibration intervals
Calibrate more frequently due to stability issues if VNA does not feature advanced correction algorithms
Overall Solution Cost $ $$
• VectorStar MS4640B has a second source option and DifferentialViewTM for true mode stimulus measurement
• Only recommended when device is non-linear

EuMW Seminars 2013 34
To Use or Not Use True Mode Stimulus?
• Amplifier in non-linear region
• Difference between superposition and TMS apparent
• Amplifier in linear region
• Difference between superposition and TMS not discernable

35EuMW Seminars 2013
• Broadest frequency span: 70 kHz to 70/110 GHz• Best time domain analysis capability• 4-port test set upgrades 2 port VectorStar to 4-
port performance.• Widest range of calibration & de-embedding
methods• Choice of TMS or Superposition
Good S-parameter DataPoor S-parameter Data
DifferentialViewTM for Signal Integrity Measurements

36EuMW Seminars 2013
DifferentialViewTM for Broadband and mmWave Measurements
• Compact size and high performance make the Anritsu mmWave modules ideal for broadband differential analysis

37EuMW Seminars 2013
DifferentialViewTM True Mode Stimulus Interface
• DifferentialView offers easy configuration for differential and mixed mode measurements for thorough analysis

38EuMW Seminars 2013
DifferentialViewTM TMS Setup and Editing
• DifferentialView menu provides real time display of measurement parameters
• Immediately observe DUT performance changes with changes in setup
• Example of modifying phase sweep parameters while observing effects

EuMW Seminars 2013 39
• Option 031 Dual Source eliminates the need for a transfer switch
• Provides up to 7 dB of additional power at 70 GHz
• MS4640B series improves noise floor specification as much as 9 dB
• Combined, results in improved dynamic range performance up to 16 dB at 70 GHz!
+ +
__
Dual Source VectorStar
a1 b1
a2 b2
xN
xN
VectorStarTM Dual Source Option

EuMW Seminars 2013 40
+ +
__
1800 Phase Offset at Test Port Non-1800 Phase Offset at DUT Input
Dual Source VectorStar
a1 b1
a2 b2
xN
xN
No TMS correction applied.
• Characterizing differential devices with a 1800 offset is the goal of component designers• Nonlinear devices are sensitive to source mismatch• Source mismatch will shift stimulus signals to non-ideal offset• Without proper offset correction performance of device will vary• Anritsu white paper discusses this issue
Measurements of Nonlinear Differential Devices

EuMW Seminars 2013 41
+ +
__
1800 Phase Offset at Test Port 1800 Phase Offset at DUT Input
• Applying TMS correction within DifferentialView corrects offset shift
• Monitoring the applied signals (a3/a1) will provide an indication on the success of correction
Opt 043 DifferentialViewTM: Measure mismatch and apply correction during measurement
Dual Source VectorStar
a1 b1
a3 b3
xN
xN
Measurements of Nonlinear Differential Devices

42EuMW Seminars 2013
• Sweep to sweep phase variations from 1800 differential while driving nonlinear DUT at -12 dBm. 10 MHz to 50 GHz.
• Measured result showing < 1 degree sweep to sweep stability
DifferentialViewTM Phase Stability

43EuMW Seminars 2013
Resource Materials• MS4640B Technical Data Sheet• Signal Integrity Application Brief• White Papers
– Overcoming High Speed Interconnect Challenges– Signal Integrity: Frequency Range Matters– High Data rates Require New De-embedding Techniques– Superposition vs. True balanced: What’s Required for Your Signal
Integrity Application– True Mode Stimulus and Stability
• Application Note: Ideal Pre-Emphasis Constant Settinghttp://www.anritsu.com/en-us/products-solutions/products/ms4640b-series.aspx
http://www.anritsu.com/en-US/Products-Solutions/Products/MP1800A.aspx
44EuMW Seminars 2013
• Solutions available to 20, 40, 50, 70 and 110 GHz
• 70 kHz start frequency and low frequency dynamic range of VectorStarTM critical to signal integrity application and to ensuring measurement-simulation correspondence
• MS4640B now offers DifferentialViewTM and 2nd internal source option for true mode stimulus measurements– Easy to use graphical set-up– Real-time view of measurement while making parameter changes– Advanced true mode stimulus corrections hold phase relationship at DUT
• Upgradeable in frequency, port count and options– E.g. can add second source and DifferentialView later
Summary