Immune Responses Elicited in Tertiary Lymphoid TissuesDisplay Distinctive FeaturesOlivier Thaunat1,2,3*, Stephanie Graff-Dubois4, Sophie Brouard5, Chantal Gautreau6, Aditi Varthaman4,
Nicole Fabien1,2,7, Anne-Christine Field8, Liliane Louedec4, Jianping Dai4, Etienne Joly9, Emmanuel
Morelon1,2,3, Jean-Paul Soulillou5, Jean-Baptiste Michel4, Antonino Nicoletti4,10
1 Universite Lyon 1, Villeurbanne, France, 2 Unite 851, Institut national de la Sante et de la Recherche Medicale, Lyon, France, 3 Service de Transplantation Renale et
d’Immunologie Clinique, Hopital Edouard Herriot, Lyon, France, 4 Unite 698, Institut national de la Sante et de la Recherche Medicale, Hopital Xavier Bichat, Paris, France,
5 Unite Mixte de Recherche en Sante 643, Institut de Transplantation et de Recherche en Transplantation, Hopital Hotel Dieu, Nantes, France, 6 Laboratoire Regional
d’Histocompatibilite IR7, Assistance publique-Hopitaux de Paris, Hopital Saint Louis, Paris, France, 7 Laboratoire d’immunologie, Hospices Civils de Lyon, Centre
Hospitalier Lyon-Sud, Pierre-Benite, France, 8 Molecular Immunology Unit, Institute of Child Health, University College London, London, United Kingdom, 9 Unite Mixte de
Recherche 5089, Institut de pharmacologie et de biologie structurale, Toulouse, France, 10 Universite Denis Diderot - Paris VII, Paris, France
Abstract
During chronic inflammation, immune effectors progressively organize themselves into a functional tertiary lymphoid tissue(TLT) within the targeted organ. TLT has been observed in a wide range of chronic inflammatory conditions but itspathophysiological significance remains unknown. We used the rat aortic interposition model in which a TLT has beenevidenced in the adventitia of chronically rejected allografts one month after transplantation. The immune responses elicitedin adventitial TLT and those taking place in spleen and draining lymph nodes (LN) were compared in terms of antibodyproduction, T cell activation and repertoire perturbations. The anti-MHC humoral response was more intense and more diversein TLT. This difference was associated with an increased percentage of activated CD4+ T cells and a symmetric reduction ofregulatory T cell subsets. Moreover, TCR repertoire perturbations in TLT were not only increased and different from thecommon pattern observed in spleen and LN but also ‘‘stochastic,’’ since each recipient displayed a specific pattern. Wepropose that the abnormal activation of CD4+ T cells promotes the development of an exaggerated pathogenic immunehumoral response in TLT. Preliminary findings suggest that this phenomenon i) is due to a defective immune regulation in thisnon-professional inflammatory-induced lymphoid tissue, and ii) also occurs in human chronically rejected grafts.
Citation: Thaunat O, Graff-Dubois S, Brouard S, Gautreau C, Varthaman A, et al. (2010) Immune Responses Elicited in Tertiary Lymphoid Tissues Display DistinctiveFeatures. PLoS ONE 5(6): e11398. doi:10.1371/journal.pone.0011398
Editor: Ramy K. Aziz, Cairo University, Egypt
Received October 20, 2009; Accepted May 21, 2010; Published June 30, 2010
Copyright: � 2010 Thaunat et al. This is an open-access article distributed under the terms of the Creative Commons Attribution License, which permitsunrestricted use, distribution, and reproduction in any medium, provided the original author and source are credited.
Funding: OT is supported by the Fondation pour la Recherche Medicale, the Societe de Nephrologie, the Hospices Civils de Lyon, and the CENTAURETransplantation Research Network. The funders had no role in study design, data collection and analysis, decision to publish, or preparation of the manuscript.
Competing Interests: The authors have declared that no competing interests exist.
* E-mail: [email protected]
Introduction
The progression towards chronic inflammation is characterized
by a gradual shift in the type of immune effectors present at the site
of inflammation i.e. an enrichment in cells from the adaptive
immune system [1]. Besides this change in the composition of the
inflammatory infiltrate, the organization of infiltrated cells is also
modified. Indeed, it has long been observed that the inflammatory
cells can organize themselves into structures displaying the same
microarchitecture as secondary lymphoid organs [2]. The process
by which a highly organized tertiary lymphoid tissue (TLT) arise de
novo during chronic inflammation has been referred to as lymphoid
neogenesis [3].
Immune response elicited in TLT develops in a microenviron-
ment that differs from canonical secondary lymphoid organs
because: i) surrounding inflammatory cells produce huge amounts
of cytokines [4] and growth factors [5], ii) injured tissue constantly
releases neoantigens, iii) defective lymphatic drainage traps neoanti-
gens and immune effectors [6], and iv) absence of prepositioned
regulatory subsets in TLT. We therefore hypothesized that immune
response elicited in TLT could display distinctive features.
Chronic rejection, a prototypical chronic inflammatory disease,
is an optimal situation to address this question since tertiary
lymphoid tissues have systematically been detected in chronically
rejected grafts [7,8,9], and the antigens targeted by the immune
system are known (recipient-mismatched HLA antigens of the
transplanted tissues). The aortic orthotopic transplantation
between histoincompatible rat strains is a reliable model for
chronic rejection [10] and a previous study has documented the
development of TLT in the adventitia of chronically rejected
allogenic aorta one month post-transplantation [9].
We therefore compared the characteristics of the immune
responses elicited in the spleen, the draining lymph node, and the
adventitial TLT during the chronic rejection of rat aortic
allografts.
Results
TLT develops in the adventitia of chronically rejectedaortic allograft
Kinetic analysis of aortic allograft rejection corroborated our
previous observations [9,11]: infiltration of the adventitia by
PLoS ONE | www.plosone.org 1 June 2010 | Volume 5 | Issue 6 | e11398
recipient’s lymphocytes began 5 days post transplantation,
increased rapidly to peak at 10–15 days, remained stable 2–4
weeks and decreased thereafter, leaving an acellular fibrous scar 2
months post-transplantation (Figure 1A). Of note, because the
number of cells in the adventitia was very low at this time point, no
reliable analysis of adventitial infiltrate could be performed.
T lymphocytes were the main cell population infiltrating the
adventitia. Initially, T cell infiltrate was made of similar
proportions of CD8+ and CD4+ T cells but the percentage of
the latter tended to increase and helper T cells were the dominant
subset 1 month post-transplantation (Figure 1A). Of note, one
month post-transplantation, the distribution of the CD4+ and
CD8+ subpopulations among the CD3+ T lymphocytes was
similar in spleen, draining lymph node and adventitial TLT
(Figure 1B).
In line with what we have previously reported [9], the scattered
immune cells infiltrating the adventitia at the beginning of aortic
allograft rejection (Figure 1 C, left panel) progressively
structured themselves into an ectopic tertiary lymphoid tissue
(TLT) typified by its organized microarchitecture observed 1
month post-transplantation (Figure 1 C, right panel).
Anti-MHC humoral response is more intense and morediverse in TLT than in canonical secondary lymphoidorgans
Chronically rejected aortic grafts, recipient spleen and draining
lymph nodes, were harvested 1 month post-transplantation and
tissue-cultured so as to collect immunoglobulins produced within
these tissues. The amount of anti-donor alloantibodies in tissue-
culture supernatants was quantified by flow cytometry. The
supernatants were tested on recipient fibroblasts, or on the same
cell line transfected with the RT1.A1n or the RT1.A2n donor
MHC molecules (Figure 1D). We found that TLT produced 1.5
to 2 fold more alloantibodies than spleen and lymph nodes.
Furthermore, the humoral response elicited in TLT appeared
more diverse since reactivity against RT1.A2n, known to display a
lower allogenic potential than RT1.A1n [12], was detected only in
the supernatant of aortic allograft tissue cultures.
Over-activation of CD4+ T lymphocytes in TLTBecause the development of humoral responses against donor’s
MHC molecules is known to be dependant upon the help of CD4+T cells to B cells [13,14,15], we focused the analysis on T helper
subset.
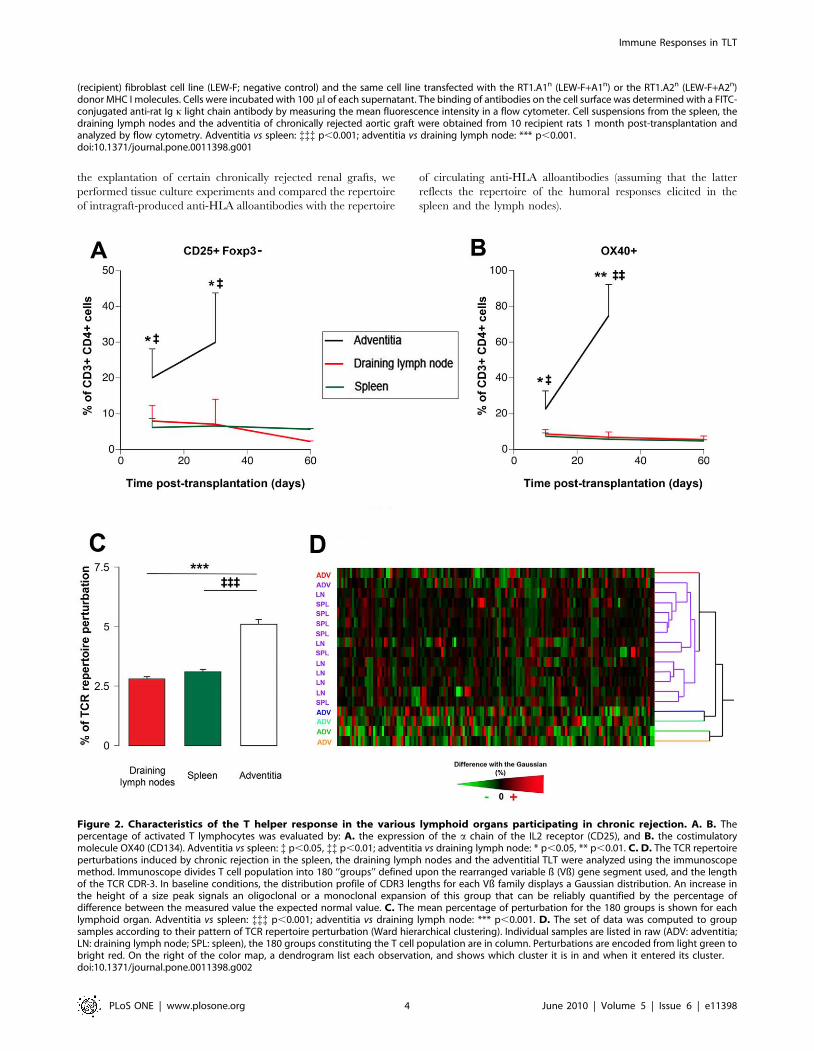
We found that the percentage of activated CD4+ T cells, i.e.
Foxp32 CD25+, was markedly increased in TLT as compared
with the 2 canonical lymphoid tissues. This difference already
significant 10 days post transplantation tended to increase at 1
month (Figure 2A).
Strikingly, this over-activation coincided with the over-expres-
sion of OX40 (Figure 2B), a costimulatory molecule from the
TNF super-family known to play a crucial role in T cell-dependent
help for humoral immune responses [16,17].
Stochastic bias in the TCR repertoire of TLTAlthough providing a plausible explanation for the increased
amount of alloantibody produced in adventitial TLT, the mere
over-activation of CD4+ T cells cannot explain the more diverse
repertoire of intragraft humoral response. In an attempt to
understand the mechanisms underlying this distinctive feature of
TLT humoral response, an analysis of the TCR repertoire was
performed using an RT-PCR based approach named ‘‘Immuno-
scope’’ [18]. This method subdivides the bulk T cell population
into 180 ‘‘groups’’ defined upon i) the rearranged variable ß (Vß)
gene segment used, and ii) the length of the T cell receptor (TCR)
third complementarity determining region (CDR3). The distribu-
tion profile of CDR3 lengths for each of the 20 Vß families is
typically represented with 7–11 peaks each separated by 3 nuclear
templates. Each peak represents a group of T cell clones using the
same Vß gene segment and sharing the same CDR3 length.
In baseline conditions, the distribution profile of CDR3 lengths
for each Vß family displays a Gaussian distribution [19].
Oligoclonal or monoclonal expansions are therefore reliably
quantified by the percentage of difference between the observed
peak size distribution value and the expected normal value [20].
During chronic rejection, the alloimmune responses taking
place in the spleen and the draining LN induced a similar level of
perturbation (,3%) of the TCR repertoire (Figure 2C).Interestingly, we found that the TCR repertoire in intragraft
TLT was at least two fold more perturbed (Figure 2C).The data set was subsequently processed using the Ward’s
method for hierarchical clusterization allowing grouping the
samples sharing similar TCR repertoire perturbations (Figure 2D).We found that all the ‘‘canonical’’ lymphoid organs were in the
same cluster (violet cluster in Figure 2D), with a strong tendency
for spleens and lymph nodes to form sub-clusters according to the
nature of the tissue. Surprisingly, we found that none but one
adventitial TLT was distributed in the violet cluster. More
interestingly the adventitial TLT, were not assembled in a cluster
but rather split apart (as assessed by the hierarchical tree in
Figure 2D), suggesting that each of the adventitial TLT displayed
original, ‘‘stochastic’’, perturbations of the TCR repertoire.
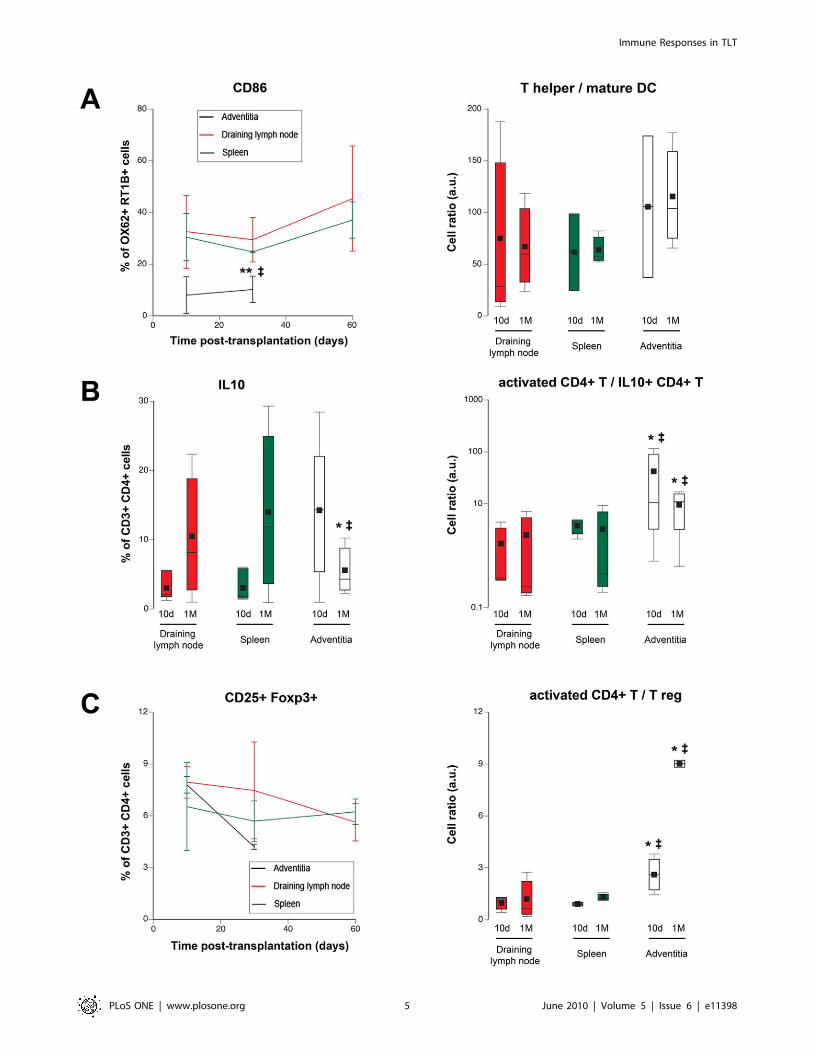
Clues for a defective immune regulation in TLTSince the activation of CD4+ T cells is critically depend upon
professional antigen presenting cells, the number and the
proportion of mature dendritic cells (DC) were compared in
adventitial TLT, draining lymph node and spleen. The percentage
of CD86-expressing mature DC, was significantly reduced in TLT
at every time points (Figure 3A, left panel). Moreover, the ratio
between the number of CD4+ T cells and mature DC was also
increased in TLT (Figure 3A, right panel), making increased
priming by DC an unlikely sufficient explanation for the
adventitial stochastic over-activation of CD4+ T cells.
Alternatively, CD4+ T cell over-activation in TLT could be the
consequence of a defective immune regulation in this ‘‘non-
canonical’’ lymphoid tissue. In accordance with this latter
hypothesis, a drop in T cell subsets endowed with immune
regulatory properties was observed in TLT 1 month post-
transplantation. Indeed, while the proportion of IL10-producing
CD4+ T cells, i.e. Tr1 cells [21], tended to be higher in TLT 10
days post-transplantation, this percentage declined at one month
post-transplantation, an opposite evolution as compared as what
was observed in canonical secondary lymphoid organs
(Figure 3B, left panel). Of note, when the ratio between
activated CD4+ T cells and Tr1 cells were compared, they were
always significantly higher in TLT (Figure 3B, right panel).Furthermore, similar observations were also made for another
major regulatory subset [22]: the CD4+ CD25+ Foxp3+ T cells
(Figure 3C).
Clinical relevance of experimental findingsOur group has previously reported the development of
functional TLT within chronically rejected human grafts
[9,23,24]. However, paired analysis of the immune responses
elicited in the spleen, the draining lymph node, and intragraft
TLT is unachievable in the clinical setting. Taking advantage of
Immune Responses in TLT
PLoS ONE | www.plosone.org 2 June 2010 | Volume 5 | Issue 6 | e11398
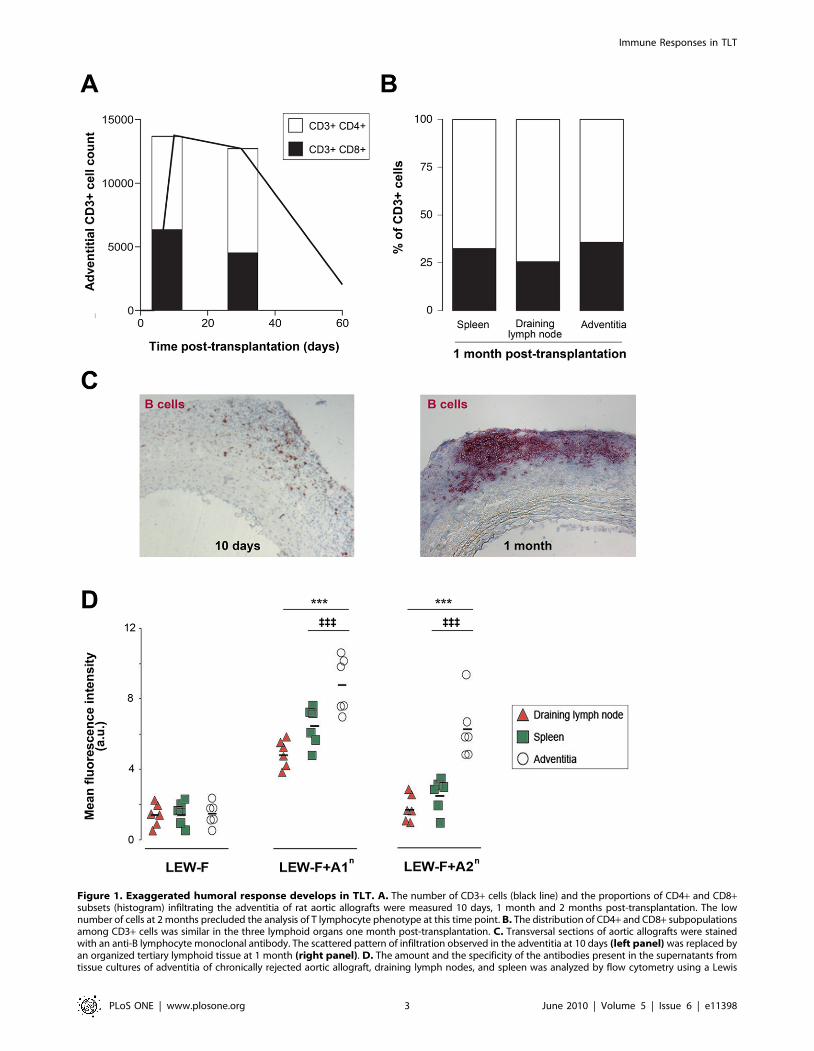
Figure 1. Exaggerated humoral response develops in TLT. A. The number of CD3+ cells (black line) and the proportions of CD4+ and CD8+subsets (histogram) infiltrating the adventitia of rat aortic allografts were measured 10 days, 1 month and 2 months post-transplantation. The lownumber of cells at 2 months precluded the analysis of T lymphocyte phenotype at this time point. B. The distribution of CD4+ and CD8+ subpopulationsamong CD3+ cells was similar in the three lymphoid organs one month post-transplantation. C. Transversal sections of aortic allografts were stainedwith an anti-B lymphocyte monoclonal antibody. The scattered pattern of infiltration observed in the adventitia at 10 days (left panel) was replaced byan organized tertiary lymphoid tissue at 1 month (right panel). D. The amount and the specificity of the antibodies present in the supernatants fromtissue cultures of adventitia of chronically rejected aortic allograft, draining lymph nodes, and spleen was analyzed by flow cytometry using a Lewis
Immune Responses in TLT
PLoS ONE | www.plosone.org 3 June 2010 | Volume 5 | Issue 6 | e11398
the explantation of certain chronically rejected renal grafts, we
performed tissue culture experiments and compared the repertoire
of intragraft-produced anti-HLA alloantibodies with the repertoire
of circulating anti-HLA alloantibodies (assuming that the latter
reflects the repertoire of the humoral responses elicited in the
spleen and the lymph nodes).
Figure 2. Characteristics of the T helper response in the various lymphoid organs participating in chronic rejection. A. B. Thepercentage of activated T lymphocytes was evaluated by: A. the expression of the a chain of the IL2 receptor (CD25), and B. the costimulatorymolecule OX40 (CD134). Adventitia vs spleen: { p,0.05, {{ p,0.01; adventitia vs draining lymph node: * p,0.05, ** p,0.01. C. D. The TCR repertoireperturbations induced by chronic rejection in the spleen, the draining lymph nodes and the adventitial TLT were analyzed using the immunoscopemethod. Immunoscope divides T cell population into 180 ‘‘groups’’ defined upon the rearranged variable ß (Vß) gene segment used, and the lengthof the TCR CDR-3. In baseline conditions, the distribution profile of CDR3 lengths for each Vß family displays a Gaussian distribution. An increase inthe height of a size peak signals an oligoclonal or a monoclonal expansion of this group that can be reliably quantified by the percentage ofdifference between the measured value the expected normal value. C. The mean percentage of perturbation for the 180 groups is shown for eachlymphoid organ. Adventitia vs spleen: {{{ p,0.001; adventitia vs draining lymph node: *** p,0.001. D. The set of data was computed to groupsamples according to their pattern of TCR repertoire perturbation (Ward hierarchical clustering). Individual samples are listed in raw (ADV: adventitia;LN: draining lymph node; SPL: spleen), the 180 groups constituting the T cell population are in column. Perturbations are encoded from light green tobright red. On the right of the color map, a dendrogram list each observation, and shows which cluster it is in and when it entered its cluster.doi:10.1371/journal.pone.0011398.g002
(recipient) fibroblast cell line (LEW-F; negative control) and the same cell line transfected with the RT1.A1n (LEW-F+A1n) or the RT1.A2n (LEW-F+A2n)donor MHC I molecules. Cells were incubated with 100 ml of each supernatant. The binding of antibodies on the cell surface was determined with a FITC-conjugated anti-rat Ig k light chain antibody by measuring the mean fluorescence intensity in a flow cytometer. Cell suspensions from the spleen, thedraining lymph nodes and the adventitia of chronically rejected aortic graft were obtained from 10 recipient rats 1 month post-transplantation andanalyzed by flow cytometry. Adventitia vs spleen: {{{ p,0.001; adventitia vs draining lymph node: *** p,0.001.doi:10.1371/journal.pone.0011398.g001
Immune Responses in TLT
PLoS ONE | www.plosone.org 4 June 2010 | Volume 5 | Issue 6 | e11398
Immune Responses in TLT
PLoS ONE | www.plosone.org 5 June 2010 | Volume 5 | Issue 6 | e11398
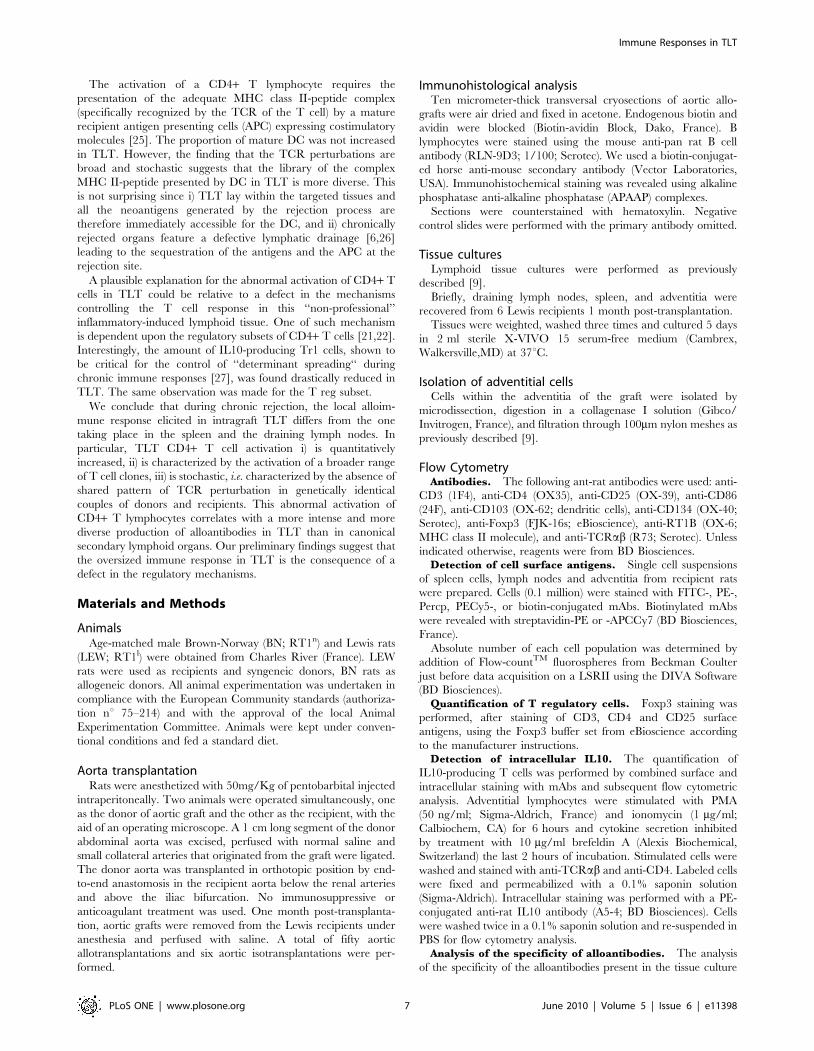
Fourteen chronically rejected human renal grafts were analyzed
(Figure 4A). No anti-HLA antibody was detected, (neither in the
circulation, nor in tissue culture supernatants) in 3 samples. In the
remaining 11, the diversity of the repertoire of intragraft-produced
alloantibodies was . to the diversity of circulating alloantibodies
in 9 (82%). Strikingly, a consistent trend (p = 0.088) for a positive
correlation between intragraft humoral response diversity and the
percentage of CD25-expressing activated CD4+ T cells infiltrating
these 9 grafts was observed (Figure 4B).
Discussion
In the present study we compared the immune responses
elicited in intragraft TLT, spleen and draining lymph nodes
during chronic rejection of a rat aortic allograft. We observed an
increased production of alloantibodies in TLT as compared with
canonical secondary lymphoid organs. Not only were the humoral
alloimmune responses elicited in TLT quantitatively enhanced,
but they also displayed a more diverse repertoire, a finding that we
have validated in the clinical setting by the analysis of chronically
rejected human kidney allografts.
Given the critical role of CD4+ T cells in the generation of the
humoral alloimmune response [13,14,15], we hypothesized that
the difference in the production of alloantibodies could reflect
disparities between the T cell responses elicited in the various
immune compartments. Accordingly, we observed a drastic
increase in the percentage of activated CD4+ T cell in intragraft
TLT, in both murine experimental model and human samples.
The comparative analysis of the TCR repertoires of the three
lymphoid tissues showed that during experimental chronic
rejection, the TCR repertoire in intragraft TLT was at least two
fold more perturbed than in canonical secondary lymphoid
organs. At this stage, two hypotheses could be proposed to explain
our results: i) an increased expansion of the alloreactive T cell
clones in TLT but of the same specificities as those of the spleen
and the draining LN, or ii) a broader activation of T lymphocytes
in TLT resulting in the activation of additional T cell clones that
were found resting in the draining LN and the spleen. To test these
two hypotheses the ward’s clustering method was applied to the
dataset in order to group the samples together that shared similar
TCR repertoire perturbation profiles. All the canonical secondary
lymphoid organs were grouped in a single cluster. Surprisingly,
none but one adventitial TLT was distributed in this cluster.
Moreover, the adventitial TLT were not assembled in a cluster but
rather split apart, suggesting that each of the adventitial TLT
displayed original, ‘‘stochastic’’, perturbations of the TCR
repertoire. These results were unexpected since the TCR
repertoire analysis was conducted at the same time point during
the course of a chronic rejection in genetically identical couples of
donors and recipients.
Figure 4. Analysis of chronically rejected human renal grafts. A. Fourteen human renal grafts, explanted for terminal chronic rejection, wereanalyzed. Anti-HLA antibodies were sought by luminex in tissue-culture supernatants and in the sera obtained immediately before detransplantation.Delta alloantibody repertoire diversity was calculated as the difference between the number of specificities identified in the tissue-culturesupernatants and in the serum. No alloantibody was detected for 3 samples (0), among the remaining 11, the diversity of the repertoire of intragraft-produced alloantibodies was . to the diversity of circulating alloantibodies in 9 (82%). B. The percentage of activated (CD25+) CD4+ T cellsinfiltrating these 9 chronically rejected renal grafts was measured by flow cytometry. The linear regression model showed a trend for a positivecorrelation between the percentage of activated CD4+ T cells and the delta alloantibody repertoire diversity. The formula of the linear regression isprovided, as well as R2: the coefficient of determination, and the p value of the regression.doi:10.1371/journal.pone.0011398.g004
Figure 3. Clues for a defective immune regulation in TLT. A. The percentage of CD86-expressing mature dendritic cells (OX62+ MHC II+) wasmeasured in the three lymphoid organs (left panel). The ratio: number of CD4+ T cells/number of mature dendritic cells was also calculated (rightpanel). Adventitia vs spleen: { p,0.05; adventitia vs draining lymph node: ** p,0.01. B. The percentage of IL10-producing CD4+ T cells (Tr1) droppedin TLT between 10 days and 1 month post-transplantation, an evolution inverted as compared with spleen and draining lymph node (left panel). Theratio: number of activated (CD25+ Foxp32) CD4+ T cells/number of Tr1 cells was increased in TLT at each time points (right panel). Adventitia vsspleen: { p,0.05; adventitia vs draining lymph node: * p,0.05. C. The percentage of regulatory T cells (CD4+ CD25+ Foxp3+) tended to decrease inTLT between 10 days and 1 month post-transplantation (left panel). The ratio: number of activated (CD25+ Foxp32) CD4+ T cells/number of T regwas increased in TLT at each time points (right panel). Adventitia vs spleen: { p,0.05; adventitia vs draining lymph node: * p,0.05.doi:10.1371/journal.pone.0011398.g003
Immune Responses in TLT
PLoS ONE | www.plosone.org 6 June 2010 | Volume 5 | Issue 6 | e11398
The activation of a CD4+ T lymphocyte requires the
presentation of the adequate MHC class II-peptide complex
(specifically recognized by the TCR of the T cell) by a mature
recipient antigen presenting cells (APC) expressing costimulatory
molecules [25]. The proportion of mature DC was not increased
in TLT. However, the finding that the TCR perturbations are
broad and stochastic suggests that the library of the complex
MHC II-peptide presented by DC in TLT is more diverse. This
is not surprising since i) TLT lay within the targeted tissues and
all the neoantigens generated by the rejection process are
therefore immediately accessible for the DC, and ii) chronically
rejected organs feature a defective lymphatic drainage [6,26]
leading to the sequestration of the antigens and the APC at the
rejection site.
A plausible explanation for the abnormal activation of CD4+ T
cells in TLT could be relative to a defect in the mechanisms
controlling the T cell response in this ‘‘non-professional’’
inflammatory-induced lymphoid tissue. One of such mechanism
is dependent upon the regulatory subsets of CD4+ T cells [21,22].
Interestingly, the amount of IL10-producing Tr1 cells, shown to
be critical for the control of ‘‘determinant spreading‘‘ during
chronic immune responses [27], was found drastically reduced in
TLT. The same observation was made for the T reg subset.
We conclude that during chronic rejection, the local alloim-
mune response elicited in intragraft TLT differs from the one
taking place in the spleen and the draining lymph nodes. In
particular, TLT CD4+ T cell activation i) is quantitatively
increased, ii) is characterized by the activation of a broader range
of T cell clones, iii) is stochastic, i.e. characterized by the absence of
shared pattern of TCR perturbation in genetically identical
couples of donors and recipients. This abnormal activation of
CD4+ T lymphocytes correlates with a more intense and more
diverse production of alloantibodies in TLT than in canonical
secondary lymphoid organs. Our preliminary findings suggest that
the oversized immune response in TLT is the consequence of a
defect in the regulatory mechanisms.
Materials and Methods
AnimalsAge-matched male Brown-Norway (BN; RT1n) and Lewis rats
(LEW; RT1l) were obtained from Charles River (France). LEW
rats were used as recipients and syngeneic donors, BN rats as
allogeneic donors. All animal experimentation was undertaken in
compliance with the European Community standards (authoriza-
tion nu 75–214) and with the approval of the local Animal
Experimentation Committee. Animals were kept under conven-
tional conditions and fed a standard diet.
Aorta transplantationRats were anesthetized with 50mg/Kg of pentobarbital injected
intraperitoneally. Two animals were operated simultaneously, one
as the donor of aortic graft and the other as the recipient, with the
aid of an operating microscope. A 1 cm long segment of the donor
abdominal aorta was excised, perfused with normal saline and
small collateral arteries that originated from the graft were ligated.
The donor aorta was transplanted in orthotopic position by end-
to-end anastomosis in the recipient aorta below the renal arteries
and above the iliac bifurcation. No immunosuppressive or
anticoagulant treatment was used. One month post-transplanta-
tion, aortic grafts were removed from the Lewis recipients under
anesthesia and perfused with saline. A total of fifty aortic
allotransplantations and six aortic isotransplantations were per-
formed.
Immunohistological analysisTen micrometer-thick transversal cryosections of aortic allo-
grafts were air dried and fixed in acetone. Endogenous biotin and
avidin were blocked (Biotin-avidin Block, Dako, France). B
lymphocytes were stained using the mouse anti-pan rat B cell
antibody (RLN-9D3; 1/100; Serotec). We used a biotin-conjugat-
ed horse anti-mouse secondary antibody (Vector Laboratories,
USA). Immunohistochemical staining was revealed using alkaline
phosphatase anti-alkaline phosphatase (APAAP) complexes.
Sections were counterstained with hematoxylin. Negative
control slides were performed with the primary antibody omitted.
Tissue culturesLymphoid tissue cultures were performed as previously
described [9].
Briefly, draining lymph nodes, spleen, and adventitia were
recovered from 6 Lewis recipients 1 month post-transplantation.
Tissues were weighted, washed three times and cultured 5 days
in 2 ml sterile X-VIVO 15 serum-free medium (Cambrex,
Walkersville,MD) at 37uC.
Isolation of adventitial cellsCells within the adventitia of the graft were isolated by
microdissection, digestion in a collagenase I solution (Gibco/
Invitrogen, France), and filtration through 100mm nylon meshes as
previously described [9].
Flow CytometryAntibodies. The following ant-rat antibodies were used: anti-
CD3 (1F4), anti-CD4 (OX35), anti-CD25 (OX-39), anti-CD86
(24F), anti-CD103 (OX-62; dendritic cells), anti-CD134 (OX-40;
Serotec), anti-Foxp3 (FJK-16s; eBioscience), anti-RT1B (OX-6;
MHC class II molecule), and anti-TCRab (R73; Serotec). Unless
indicated otherwise, reagents were from BD Biosciences.Detection of cell surface antigens. Single cell suspensions
of spleen cells, lymph nodes and adventitia from recipient rats
were prepared. Cells (0.1 million) were stained with FITC-, PE-,
Percp, PECy5-, or biotin-conjugated mAbs. Biotinylated mAbs
were revealed with streptavidin-PE or -APCCy7 (BD Biosciences,
France).
Absolute number of each cell population was determined by
addition of Flow-countTM fluorospheres from Beckman Coulter
just before data acquisition on a LSRII using the DIVA Software
(BD Biosciences).Quantification of T regulatory cells. Foxp3 staining was
performed, after staining of CD3, CD4 and CD25 surface
antigens, using the Foxp3 buffer set from eBioscience according
to the manufacturer instructions.Detection of intracellular IL10. The quantification of
IL10-producing T cells was performed by combined surface and
intracellular staining with mAbs and subsequent flow cytometric
analysis. Adventitial lymphocytes were stimulated with PMA
(50 ng/ml; Sigma-Aldrich, France) and ionomycin (1 mg/ml;
Calbiochem, CA) for 6 hours and cytokine secretion inhibited
by treatment with 10 mg/ml brefeldin A (Alexis Biochemical,
Switzerland) the last 2 hours of incubation. Stimulated cells were
washed and stained with anti-TCRab and anti-CD4. Labeled cells
were fixed and permeabilized with a 0.1% saponin solution
(Sigma-Aldrich). Intracellular staining was performed with a PE-
conjugated anti-rat IL10 antibody (A5-4; BD Biosciences). Cells
were washed twice in a 0.1% saponin solution and re-suspended in
PBS for flow cytometry analysis.Analysis of the specificity of alloantibodies. The analysis
of the specificity of the alloantibodies present in the tissue culture
Immune Responses in TLT
PLoS ONE | www.plosone.org 7 June 2010 | Volume 5 | Issue 6 | e11398
supernatants was performed by flow cytometry as previously
described [9]. Briefly, the tissue culture supernatants were tested
on Lewis (recipient) fibroblasts (LEW-F), or on the same cell line
transfected with the RT1.A1n (LEW-F+A1n) or the RT1.A2n
(LEW-F+A2n) Brown-Norway (donor) MHC I molecules [12]. The
binding of antibodies on the cell surface was then determined with
an anti-rat Ig k light-chain FITC-conjugated antibody (MARK 1).
Analysis of the TCR repertoireRNA extraction and cDNA synthesis. RNA was isolated
from the spleen, the draining lymph nodes, and the microdissected
adventitia from 6 BN aortic alllografts, using the guanidinium
isothiocyanate procedure and purified on a cesium chloride
gradient [28]. RNA (10 mg) was reverse transcribed using a cDNA
synthesis kit (Roche, Indianapolis, IN) and was diluted to a final
volume of 100 ml.Immunoscope. cDNA was amplified by PCR using a Cß
primer and one of the 20 Vß-specific primers [29].The
amplifications were performed in a 9600 PerkinElmer Automate
(PE Applied Biosystems, Foster City, CA). PCR amplification
conditions were as previously described [30]. Each amplification
product was used for an elongation reaction using a dye-labeled
Cß primer [29], then heat-denatured, loaded onto a 6%
acrylamide-8 M urea gel, and electrophoresed for 5 h using an
Applied Biosystems 373A DNA sequencer (PerkinElmer).
Immunoscope software (Institut Pasteur, Paris, France) provides
distribution profiles of CDR3 lengths, in amino acids, of the
amplified and elongated products [18]. Each profile is composed
of between 7 and 11 peaks, spaced by three nucleotides,
corresponding to 7 to 11 possible lengths of the CDR3 region.
A given length of the CDR3 is not necessarily associated with the
same sequence, and the number of transcripts with a given length
is proportional to the area under the peak [18].
In baseline conditions, the distribution profile of CDR3 lengths
for each Vß family displays a Gaussian distribution [19].
Oligoclonal or monoclonal expansions are therefore reliably
quantified by the percentage of difference between the observed
peak size distribution value and the expected normal value,
providing that the size of the T lymphocyte population analyzed is
$1 106 cells [20]. Indeed, when the number of T cells is below this
threshold, artifactual biases related to ‘‘sample effect’’ can occur.
The technique of enzymatic digestion allowed to harvest only a
fraction of the cells infiltrating the adventitia: 2.8761.86 106
among which 35.04618.47% were T cells.
It was therefore impossible to carry out the individual TCR
repertoire analysis using sorted adventitial CD4+ and CD8+ T
lymphocytes. To ensure that the T cell population analyzed was
.1 106 cells, the Immunoscope analysis was performed on the
total adventitial tissue.
Human studyChronically rejected human allografts. Fourteen renal
allografts, removed due to terminal chronic active rejection, were
collected in 4 transplantation centers. The tissues were maintained
in germ-free conditions at 4uC and were processed ,24 hours
after explantation.
All the patients gave informed consent for the use of the samples
for research purposes.
Tissue cultures. Twenty-four randomly selected fragments
(,0.5 mm3) of the renal cortex of freshly explanted allografts were
washed 3 times and cultured in a 24-well plate in 1ml RPMI 1640
medium (Cambrex) supplemented with 100U/ml penicillin/
streptomycin and 25mg/ml Fungizone (Gibco). Culture supernatants
were harvested after 5 days of culture and stored at 220uC until
further analysis.
Luminex. Luminex assays were used to detect the presence of
anti-HLA alloantibodies in the supernatants (LifeScreenH, Tepnel
Lifecodes Corporation) and subsequently, to determine their
specificity (LABScreenH single antigen HLA class I and class II
detection tests, One Lambda).
Flow cytometry. Fresh explanted grafts were cut with a
sterile razor blade into ,0.125mm3 fragments which were
incubated in a solution of 1 mg/ml collagenase A and 0.1 mg/
ml DNAse I (Roche) for 1 hour at 37uC. Cell suspensions were
passed through a 70 mm cell strainer, and mononuclear cells were
separated over Ficoll-Paque Plus (Amersham).
Ten million cells were incubated with a cocktail of fluorescent
monoclonal antibodies specific for the following human cell
surface markers: CD3 (PE-Texas Red, clone 7D6), CD4 (Alexa
Fluor 700, clone RPA-T4), CD8 (Pacific Blue, clone RPA-T8),
CD25 (FITC, clone M-A251), All these antibodies were from BD
Biosciences except the anti-CD3 from Caltag Laboratories.
More than 1.106 events in the lymphoid FSC/SSC gate were
acquired on an LSRII flow cytometer and analyzed with DIVA
software (BD Biosciences).
Statistical analysisData were analyzed using the JMP 6.0 software (SAS Institute
Inc., Cary, NC). Statistical significance of results was determined
by analysis of variance with one-way ANOVA followed by
Fischer’s PLSD tests; p values of less than 0.05 were considered as
statistically significant.
Acknowledgments
We thank the urologists, pathologists, and nephrologists from the Edouard
Herriot, Foch, Henri Mondor, Necker, and Pasteur Hospitals for their help
in the collection of the human explanted grafts. We are grateful to Michael
Dussiot for excellent technical assistance.
Author Contributions
Conceived and designed the experiments: OT. Performed the experiments:
OT SGD SB CG AV NF ACF LL JD. Analyzed the data: OT SGD SB
CG AV NF ACF JD AN. Contributed reagents/materials/analysis tools:
EJ EM JPS JBM AN. Wrote the paper: OT EJ EM JPS JBM AN.
References
1. Rosenberg HF, Gallin JI (2003) Inflammation. In: Paul WE, ed. Fundamental
Immunology. 5th ed Lippincott Williams & Wilkins.
2. Prineas JW (1979) Multiple sclerosis: presence of lymphatic capillaries and
lymphoid tissue in the brain and spinal cord. Science 203: 1123–1125.
3. Kratz A, Campos-Neto A, Hanson MS, Ruddle NH (1996) Chronic
inflammation caused by lymphotoxin is lymphoid neogenesis. J Exp Med 183:
1461–1472.
4. Deteix C, Attuil-Audenis V, Duthey A, Patey N, McGregor B, et al. (2010)
Intragraft Th17 infiltrate promotes lymphoid neogenesis and hastens clinical
chronic rejection. J Immunol 184: 5344–5351.
5. Thaunat O, Patey N, Gautreau C, Lechaton S, Fremeaux-Bacchi V, et al. (2008)
B cell survival in intragraft tertiary lymphoid organs after rituximab therapy.
Transplantation 85: 1648–1653.
6. Thaunat O, Kerjaschki D, Nicoletti A (2006) Is defective lymphatic drainage a
trigger for lymphoid neogenesis? Trends Immunol 27: 441–445.
7. Baddoura FK, Nasr IW, Wrobel B, Li Q, Ruddle NH, et al. (2005) Lymphoid
neogenesis in murine cardiac allografts undergoing chronic rejection.
Am J Transplant 5: 510–516.
8. Kerjaschki D, Regele HM, Moosberger I, Nagy-Bojarski K, Watschinger B,
et al. (2004) Lymphatic neoangiogenesis in human kidney transplants is
Immune Responses in TLT
PLoS ONE | www.plosone.org 8 June 2010 | Volume 5 | Issue 6 | e11398
associated with immunologically active lymphocytic infiltrates. J Am Soc
Nephrol 15: 603–612.
9. Thaunat O, Field AC, Dai J, Louedec L, Patey N, et al. (2005) Lymphoid
neogenesis in chronic rejection: evidence for a local humoral alloimmune
response. Proc Natl Acad Sci U S A 102: 14723–14728.
10. Plissonnier D, Levy BI, Salzmann JL, Nochy D, Watelet J, et al. (1991) Allograft-
induced arterial wall injury and response in normotensive and spontaneously
hypertensive rats. Arterioscler Thromb 11: 1690–1699.
11. Plissonnier D, Nochy D, Poncet P, Mandet C, Hinglais N, et al. (1995)
Sequential immunological targeting of chronic experimental arterial allograft.
Transplantation 60: 414–424.
12. Gonzalez AL, Ruffell D, Butcher GW, Joly E (1995) Identification of
complementary DNAs for RT1.A(n) and an additional class I molecule in the
RT1n haplotype. Transplant Proc 27: 1516–1518.
13. Auchincloss H, Jr., Ghobrial RR, Russell PS, Winn HJ (1988) Prevention of
alloantibody formation after skin grafting without prolongation of graft survival
by anti-L3T4 in vivo. Transplantation 45: 1118–1123.
14. Morton AL, Bell EB, Bolton EM, Marshall HE, Roadknight C, et al. (1993)
CD4+ T cell-mediated rejection of major histocompatibility complex class I-
disparate grafts: a role for alloantibody. Eur J Immunol 23: 2078–2084.
15. Pettigrew GJ, Lovegrove E, Bradley JA, Maclean J, Bolton EM (1998) Indirect T
cell allorecognition and alloantibody-mediated rejection of MHC class I-
disparate heart grafts. J Immunol 161: 1292–1298.
16. Stuber E, Neurath M, Calderhead D, Fell HP, Strober W (1995) Cross-linking of
OX40 ligand, a member of the TNF/NGF cytokine family, induces proliferation
and differentiation in murine splenic B cells. Immunity 2: 507–521.
17. Stuber E, Strober W (1996) The T cell-B cell interaction via OX40-OX40L is
necessary for the T cell-dependent humoral immune response. J Exp Med 183:
979–989.
18. Pannetier C, Even J, Kourilsky P (1995) T-cell repertoire diversity and clonal
expansions in normal and clinical samples. Immunol Today 16: 176–181.
19. Guillet M, Brouard S, Gagne K, Sebille F, Cuturi MC, et al. (2002) Different
qualitative and quantitative regulation of V beta TCR transcripts during earlyacute allograft rejection and tolerance induction. J Immunol 168: 5088–5095.
20. Miqueu P, Guillet M, Degauque N, Dore JC, Soulillou JP, et al. (2007) Statistical
analysis of CDR3 length distributions for the assessment of T and B cellrepertoire biases. Mol Immunol 44: 1057–1064.
21. Groux H, O’Garra A, Bigler M, Rouleau M, Antonenko S, et al. (1997) A CD4+T-cell subset inhibits antigen-specific T-cell responses and prevents colitis.
Nature 389: 737–742.
22. O’Garra A, Vieira P (2004) Regulatory T cells and mechanisms of immunesystem control. Nat Med 10: 801–805.
23. Thaunat O, Nicoletti A (2008) Lymphoid neogenesis in chronic rejection. CurrOpin Organ Transplant 13: 16–19.
24. Thaunat O, Patey N, Morelon E, Michel JB, Nicoletti A (2006) Lymphoidneogenesis in chronic rejection: the murderer is in the house. Curr Opin
Immunol 18: 576–579.
25. Banchereau J, Steinman RM (1998) Dendritic cells and the control of immunity.Nature 392: 245–252.
26. Ruggiero R, Fietsam R, Jr., Thomas GA, Muz J, Farris RH, et al. (1994)Detection of canine allograft lung rejection by pulmonary lymphoscintigraphy.
J Thorac Cardiovasc Surg 108: 253–258.
27. Wildbaum G, Netzer N, Karin N (2002) Tr1 cell-dependent active toleranceblunts the pathogenic effects of determinant spreading. J Clin Invest 110:
701–710.28. Chirgwin JM, Przybyla AE, MacDonald RJ, Rutter WJ (1979) Isolation of
biologically active ribonucleic acid from sources enriched in ribonuclease.Biochemistry 18: 5294–5299.
29. Douillard P, Pannetier C, Josien R, Menoret S, Kourilsky P, et al. (1996) Donor-
specific blood transfusion-induced tolerance in adult rats with a dominant TCR-Vbeta rearrangement in heart allografts. J Immunol 157: 1250–1260.
30. Brouard S, Vanhove B, Gagne K, Neumann A, Douillard P, et al. (1999) T cellrepertoire alterations of vascularized xenografts. J Immunol 162: 3367–3377.
Immune Responses in TLT
PLoS ONE | www.plosone.org 9 June 2010 | Volume 5 | Issue 6 | e11398