1
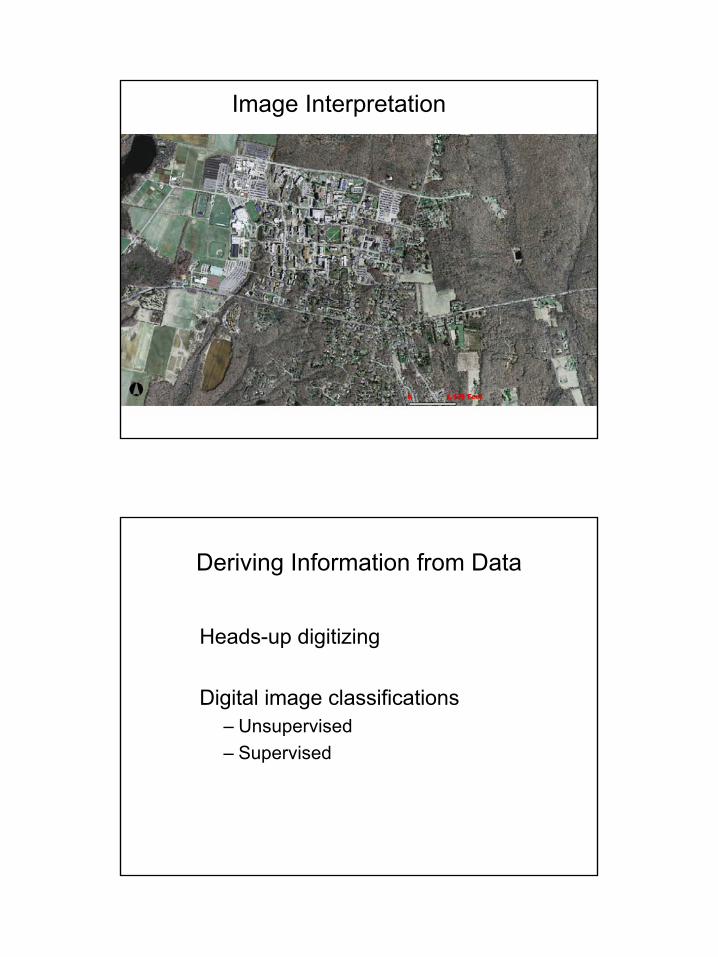
Image Interpretation
Deriving Information from Data
Heads-up digitizing
Digital image classifications– Unsupervised– Supervised
2
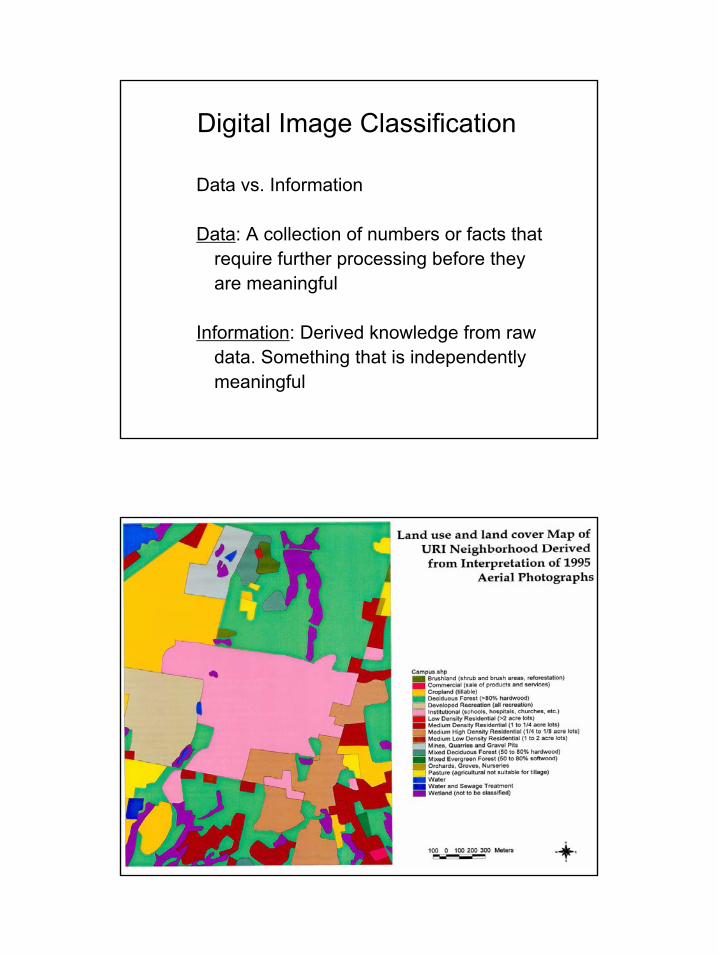
Data vs. Information
Data: A collection of numbers or facts that require further processing before they are meaningful
Information: Derived knowledge from raw data. Something that is independently meaningful
Digital Image Classification
3
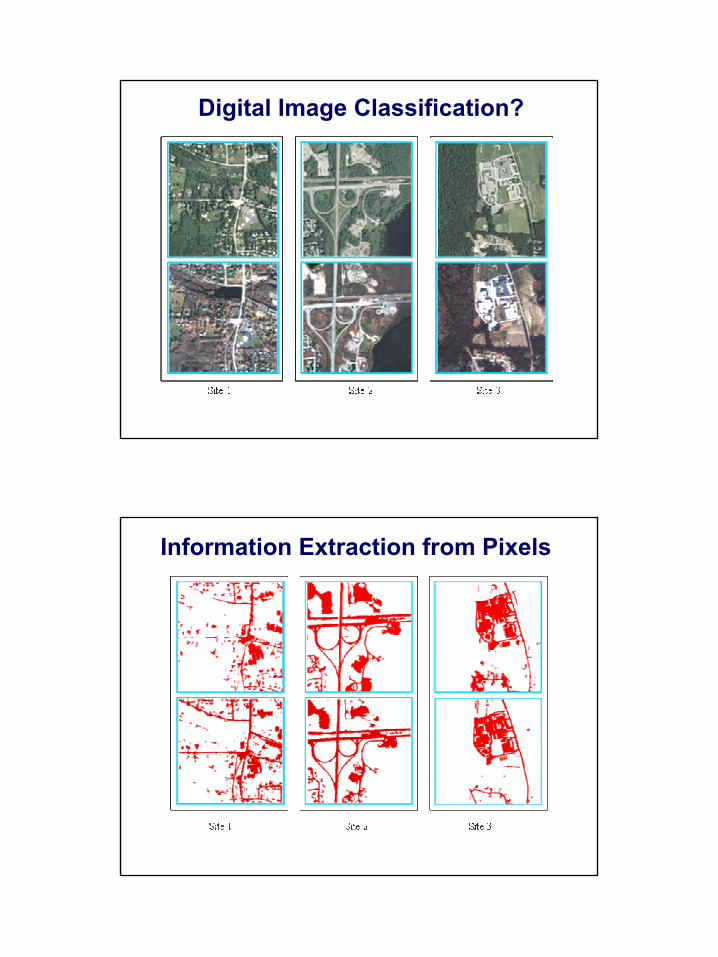
Digital Image Classification?
Information Extraction from Pixels

4
Digital Image Classification?
Information Extraction from Pixels
5
Which method is better?
Principals and Elements of Visual Image Interpretation

1
Fundamentals of Photographic Interpretation
Photo Interpretation:The examination of aerial photographs/images for the purpose of identifying objects and judging their significance.
Observation & Inference:Observation provides the raw data for interpretation. Inference is the logical process by which observation and interpretation are made.
Fundamentals of Photographic Interpretation
• Observation and inference depend on interpreter’s training, experience, bias, natural visual and analytical abilities.
• Human visual or manual interpretation is still a dominant approach to day-to-day applications of remote sensing.
• Observation and understanding of the basic elements of photo interpretation are critical.

2
Why photo/image interpretation?
• Aerial/Regional Perspective:– Examination of the Earth from an aerial
perspective allows us to identify objects, patterns, and man-land interrelationships.
– Remotely sensed image provides “spatial terrain” information.
Why photo/image interpretation?
• Three-Dimensional Depth Perception:– We can obtain a 3-dimensional view of the terrain by
viewing the two images of the terrain from two slightly different vantage points at the same time.
– Stereoscopic analysis process provides us the information of object’s height, depth, and volume.

3
Why photo/image interpretation?
• The ability to obtain a historical image record to document change:– The photographs or images are valuable historical
records of the spatial distribution of natural and man-made phenomena.
– The study of change increases our understanding about the natural and human-induced processes in the landscape.
Photointerpretation for Land Use Mapping
4
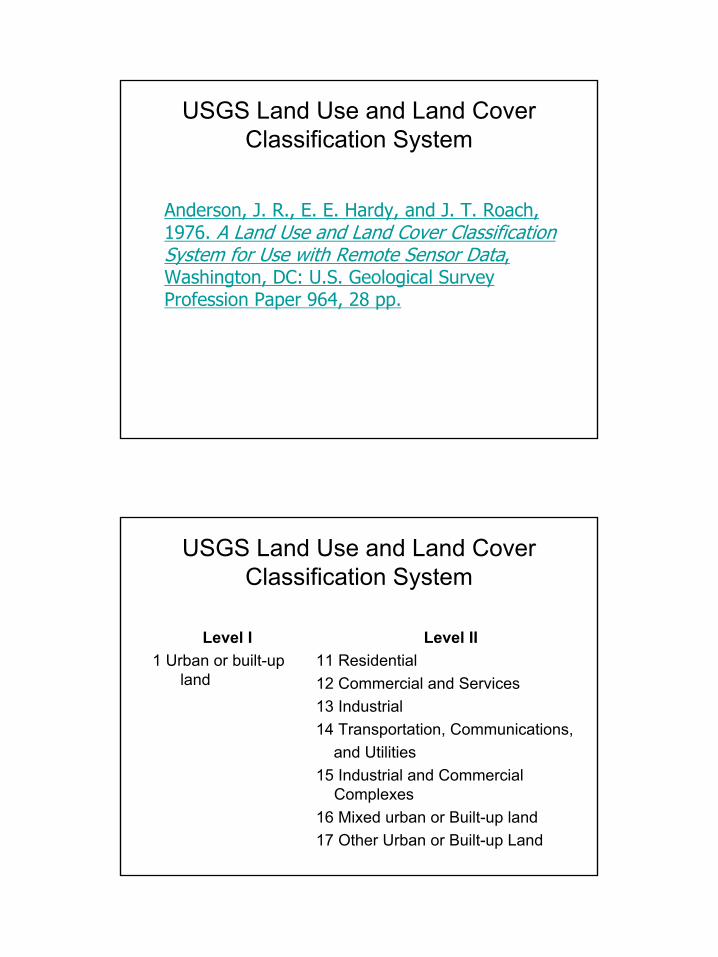
USGS Land Use and Land Cover Classification System
Anderson, J. R., E. E. Hardy, and J. T. Roach, 1976. A Land Use and Land Cover Classification System for Use with Remote Sensor Data, Washington, DC: U.S. Geological Survey Profession Paper 964, 28 pp.
USGS Land Use and Land Cover Classification System
Level I1 Urban or built-up
land
Level II11 Residential12 Commercial and Services13 Industrial14 Transportation, Communications,
and Utilities15 Industrial and Commercial
Complexes16 Mixed urban or Built-up land17 Other Urban or Built-up Land

5
USGS Land Use and Land Cover Classification System
Level I2 Agricultural land
Level II21 Cropland and pasture22 Orchards, groves, vineyards,
nurseries, and ornamental horticultural areas
23 Confined feeding operations24 Other agricultural land
USGS Land Use and Land Cover Classification System
Level I3 Rangeland
4 Forest land
Level II31 Herbaceous rangeland32 Shrub and brush rangeland33 Mixed rangeland41 Deciduous forest land42 Evergreen forest land43 Mixed forest land

1
USGS Land Use and Land Cover Classification System
Level I5 Water
6 Wetland
Level II51 Streams and canals52 Lakes53 Reservoirs54 Bays and estuaries61 Forested wetland62 Nonforested wetland
USGS Land Use and Land Cover Classification System
Level I7 Barren land
Level II71 Dry salt flats72 Beaches73 Sandy areas other than
beaches74 Bare exposed rock75 Strip mines, Quarries, and
gravel pits76 Transitional areas77 Mixed barren land
2
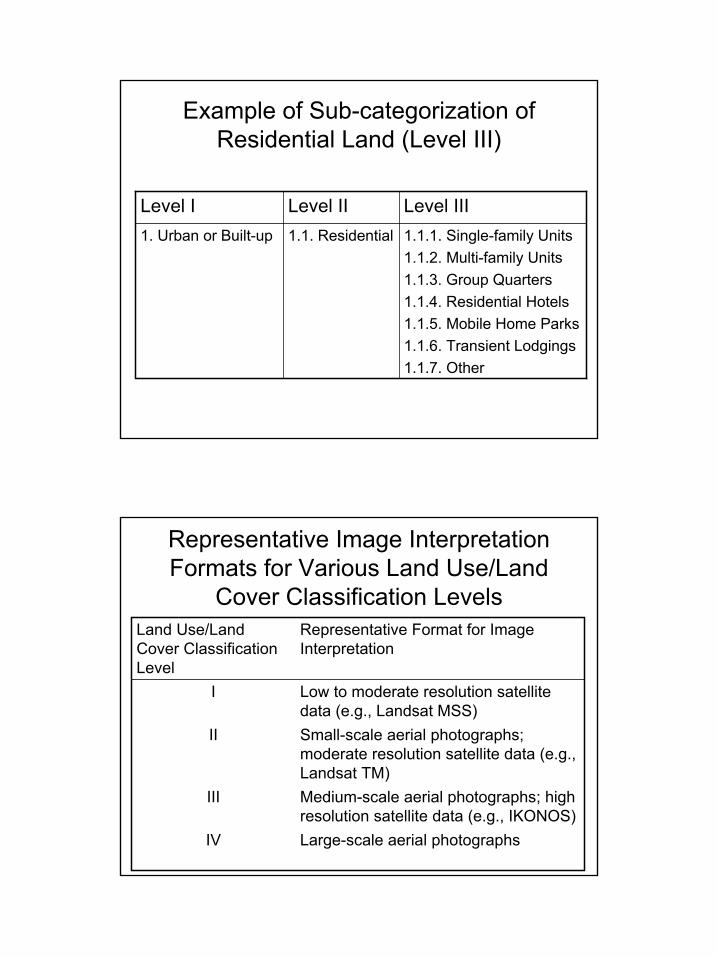
Example of Sub-categorization of Residential Land (Level III)
1.1.1. Single-family Units1.1.2. Multi-family Units1.1.3. Group Quarters1.1.4. Residential Hotels1.1.5. Mobile Home Parks1.1.6. Transient Lodgings1.1.7. Other
1.1. Residential1. Urban or Built-up
Level IIILevel IILevel I
Representative Image Interpretation Formats for Various Land Use/Land
Cover Classification Levels
Large-scale aerial photographsIV
Medium-scale aerial photographs; high resolution satellite data (e.g., IKONOS)
III
Small-scale aerial photographs; moderate resolution satellite data (e.g., Landsat TM)
II
Low to moderate resolution satellite data (e.g., Landsat MSS)
I
Representative Format for Image Interpretation
Land Use/Land Cover Classification Level

3
Elements of Image Interpretation
• x,y Location • Size• Shape• Shadow• Tone/Color• Texture
• Pattern• Height/Depth • Site (elevation, slope,
aspect)• Situation • Association
Elements of Image Interpretation
An object’s geometric characteristics: linear, curvilinear, circular, elliptical, radial, square, rectangular, triangular, hexagonal, pentagonal, star, amorphous, etc.
Shape
Length, width, perimeter, area (m2)small, medium (intermediate), large
Size
x,y coordinate: longitude and latitude or meters easting and northing in a UTM map grid
x,y location
Common Adjectives(Quantitative and qualitative)Element
4
Elements of Image Interpretation
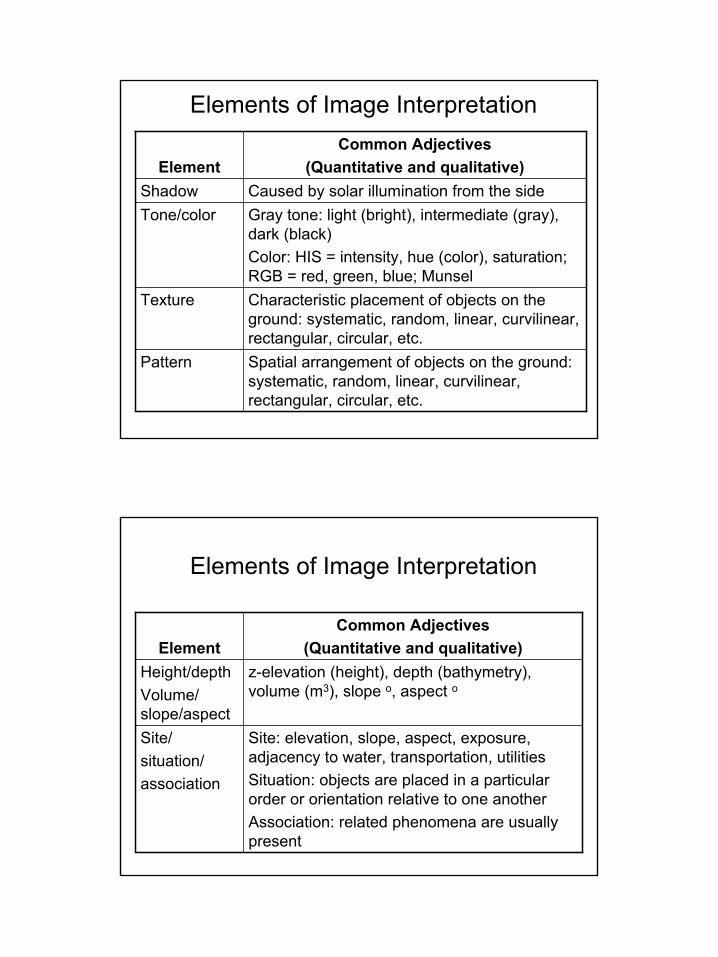
Characteristic placement of objects on the ground: systematic, random, linear, curvilinear, rectangular, circular, etc.
Texture
Spatial arrangement of objects on the ground: systematic, random, linear, curvilinear, rectangular, circular, etc.
Pattern
Gray tone: light (bright), intermediate (gray), dark (black)Color: HIS = intensity, hue (color), saturation; RGB = red, green, blue; Munsel
Tone/colorCaused by solar illumination from the sideShadow
Common Adjectives(Quantitative and qualitative)Element
Elements of Image Interpretation
Site: elevation, slope, aspect, exposure, adjacency to water, transportation, utilitiesSituation: objects are placed in a particular order or orientation relative to one anotherAssociation: related phenomena are usually present
Site/situation/association
z-elevation (height), depth (bathymetry), volume (m3), slope o, aspect o
Height/depthVolume/ slope/aspect
Common Adjectives(Quantitative and qualitative)Element

5
The size of an object is one of the most distinguishing characteristics and one of the most important elements of image interpretation.
Many natural and man-made features on the ground have very unique shapes that can be referenced in photo and image interpretation.
Gray Tone Pseudo Color Image
The electromagnetic radiation (EMR) recorded byremote sensing system can be displayed in shades of gray ranging from black to white – tone.
We may use additive color-combining techniques to create color composite images.

6
Texture Pattern
Texture is the characteristic placement and arrangement of repetitions of tones or color in an image.
Pattern is the spatial arrangement of objects in the landscape.
Both texture and pattern are scale independent.
The shadow in the image provides real clue to an object’s identification, e.g., height.
The ability to visually appreciate or measure the height (elevation) or depth (bathymetry) of an object or landform is one of the most diagnostic elements of image interpretation.

7
Site, situation, and association characteristics are very important when trying to identify an object or activity. They are always used together.
Site:- physical (elevation, slope, aspect, type of surface cover) - socioeconomic (value of the land, adjacency to water)Situation:How objects are organized and oriented relative to one another.Association:When you find a certain activity or phenomena, you almost invariably encounter related or associated features or activities.
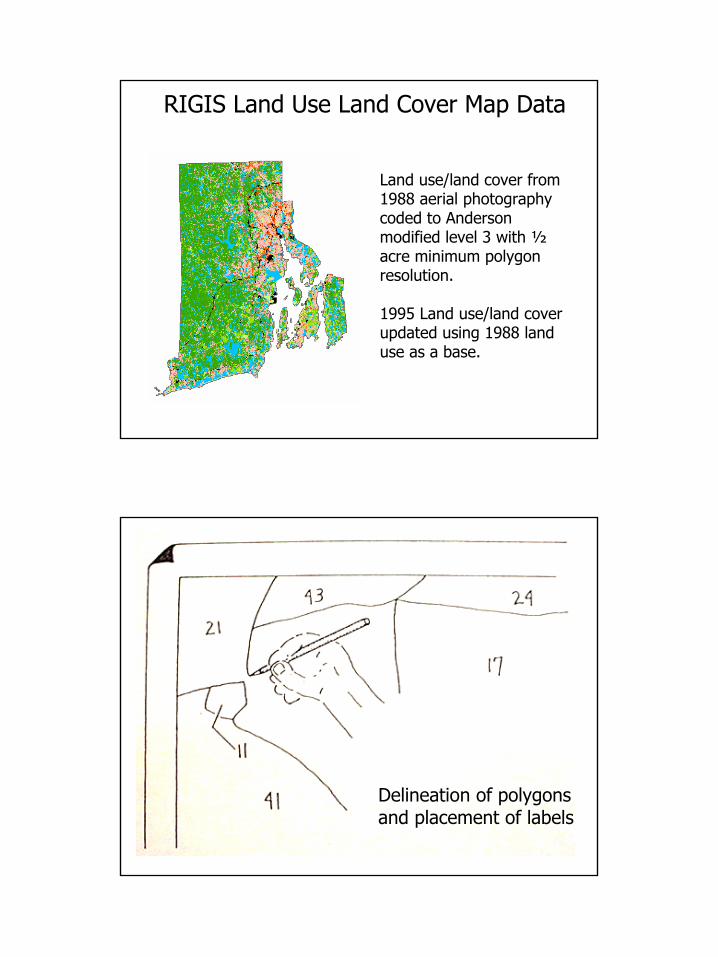
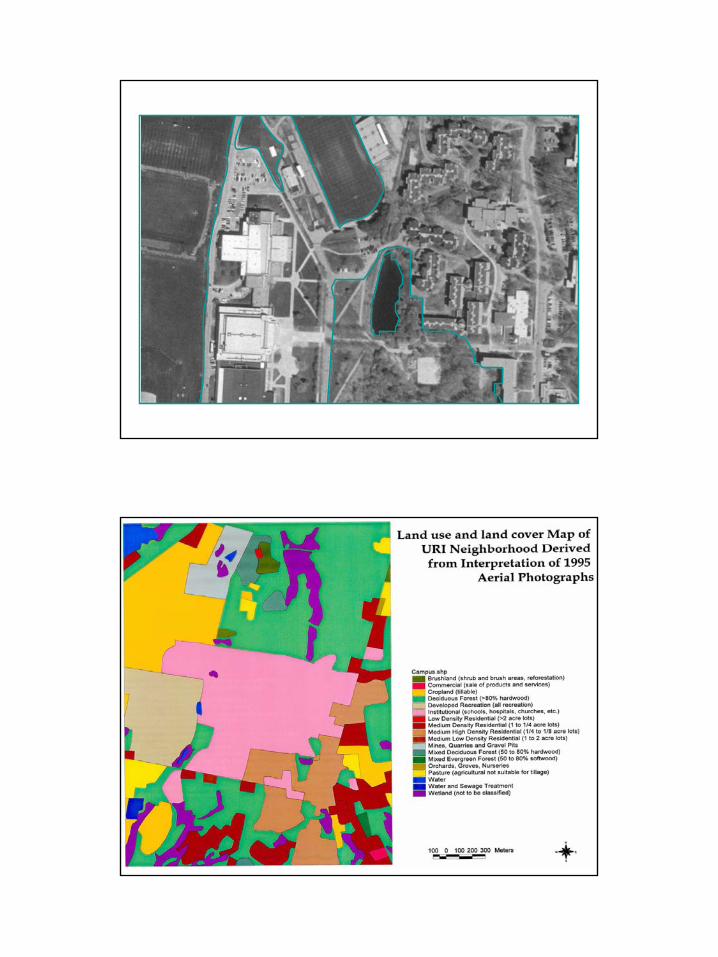
http://www.edc.uri.edu/rigis/
On-line reviewRIGIS land use/land cover map data
8
Land use/land cover from 1988 aerial photography coded to Anderson modified level 3 with ½acre minimum polygon resolution.
1995 Land use/land cover updated using 1988 land use as a base.
RIGIS Land Use Land Cover Map Data
Delineation of polygonsand placement of labels

9
A: Error in matching boundariesB: Error in labeling parcels
A
B
The Photo-OverlayLeft: aerial photograph Right: land cover boundaries as interpreted from the photographs; numbers corresponded to Anderson Level II classification system.

10
The delineation of a land use polygon includes the entire area devoted to a particular use. In this example the entire area inside the boundaries of an airfield is represented on the land use map as a single polygon, even though it is composed of several recognizable components.
11
12
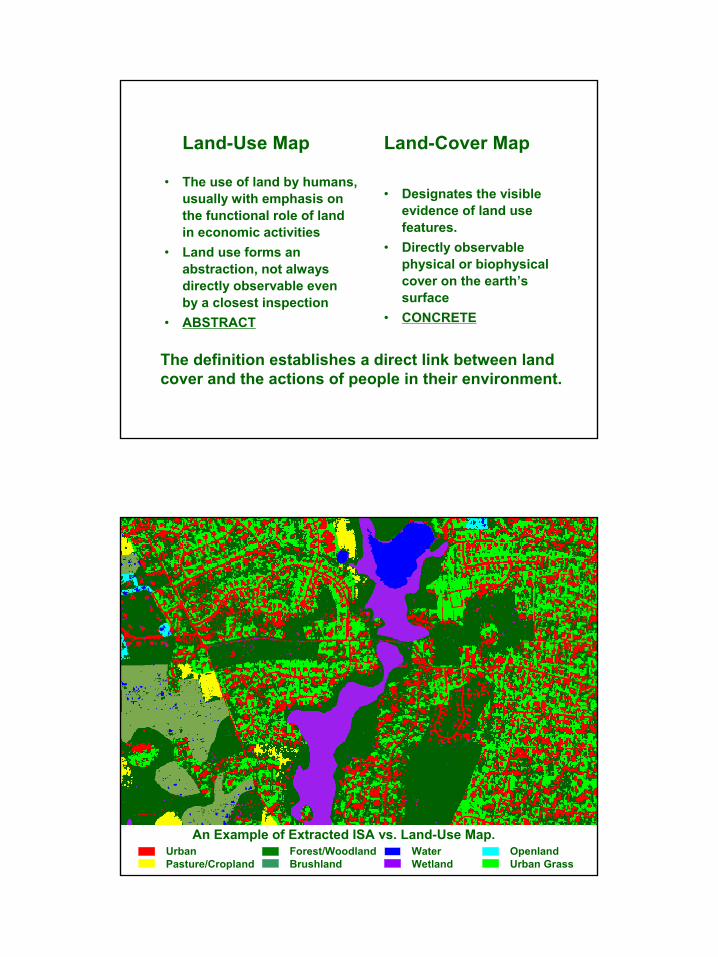
Land-Cover Map
• Designates the visible evidence of land use features.
• Directly observable physical or biophysical cover on the earth’s surface
• CONCRETE
Land-Use Map
• The use of land by humans, usually with emphasis on the functional role of land in economic activities
• Land use forms an abstraction, not always directly observable even by a closest inspection
• ABSTRACT
The definition establishes a direct link between land cover and the actions of people in their environment.
An Example of Extracted ISA vs. Land-Use Map.OpenlandUrban Grass
WaterWetland
Forest/WoodlandBrushland
UrbanPasture/Cropland
13
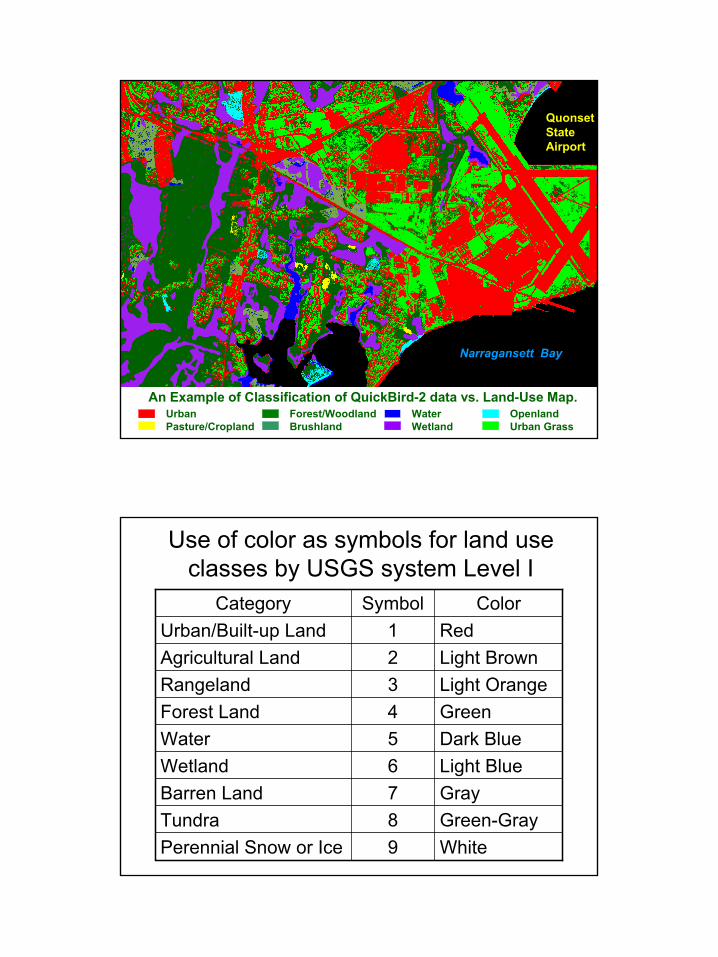
An Example of Classification of QuickBird-2 data vs. Land-Use Map.OpenlandUrban Grass
WaterWetland
Forest/WoodlandBrushland
UrbanPasture/Cropland
Quonset StateAirport
Narragansett Bay
Use of color as symbols for land use classes by USGS system Level I
White9Perennial Snow or IceGreen-Gray8TundraGray7Barren LandLight Blue6WetlandDark Blue5WaterGreen4Forest LandLight Orange3RangelandLight Brown2Agricultural LandRed1Urban/Built-up Land
ColorSymbolCategory
14
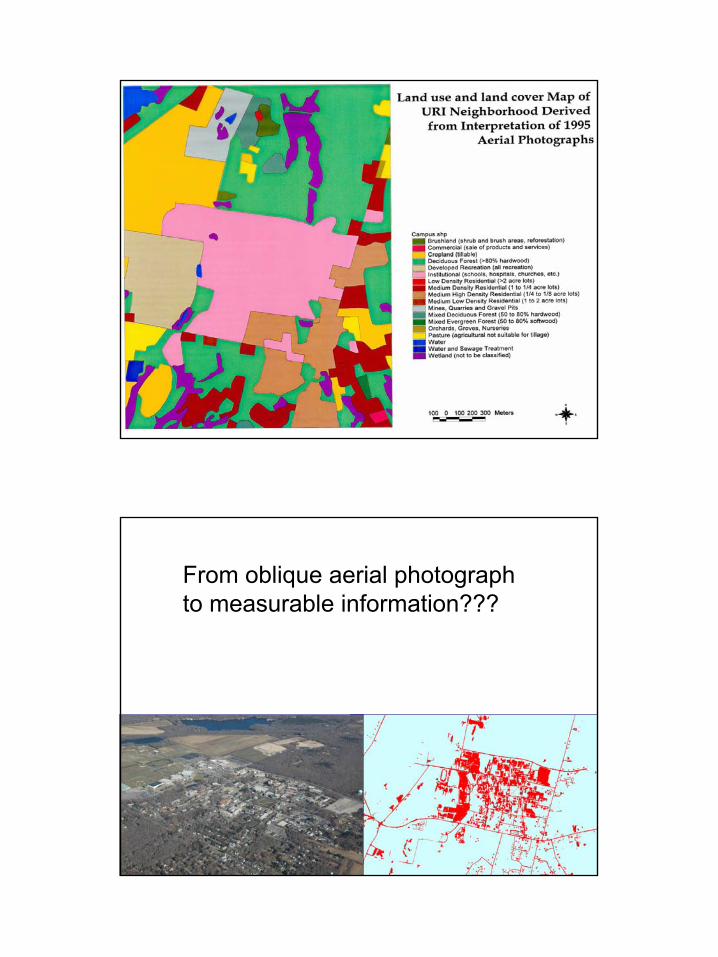
From oblique aerial photograph to measurable information???

15
Reading & Other Reference
John R. Jensen Chapter 5Remote Sensing Core Curriculum,
Elements, Aids, Techniques & Methods of Photographic/Image Interpretation
http://www.research.umbc.edu/~tbenja1/umbc7/santabar/vol1/lec2/2lecture.html