19 MAY 2017 | NEW DELHI
IESA Knowledge Paper
On
“Energy Storage for Electric Vehicles in India”

Authors:
Dr. Rahul Walawalkar
Debi Prasad Dash
Girish Shivakumar
Pradeep Kumar Saini
Aradhana Gahlaut
Contents Intoduction .................................................................................................................................................... 4
Global EV Market Overview: ......................................................................................................................... 4
India EV Market Overview: ........................................................................................................................... 5
Government support and Policies: ........................................................................................................... 6
Change in Trend: ....................................................................................................................................... 7
Battery Technologies for electric Vehicle: Past, Present and Futures .......................................................... 8
Business Case .............................................................................................................................................. 10
EV Adoption in India ............................................................................................................................... 10
Total Cost of Ownership (TCO) ............................................................................................................... 10
The impact of subsidy ......................................................................................................................... 11
Societal cost ........................................................................................................................................ 11
Lack of adoption .................................................................................................................................. 11
Range Anxiety ..................................................................................................................................... 11
EV charging infrastructure ...................................................................................................................... 12
Policy support for EV charging infrastructure ......................................................................................... 12
Challenges and Road Ahead: ...................................................................................................................... 13
IESA Initiatives in Electric Vehicle Segment ................................................................................................ 14
India Energy Storage Alliance (IESA):
The India Energy Storage Alliance (IESA) is a membership driven alliance launched in 2012 by Customized
Energy Solutions to promote energy storage & micro grid technologies and their applications in India.
IESA’s vision to make India a global leader in energy storage & microgrid technology adoption and hub for
manufacturing of these emerging technologies by 2020. IESA’s mission is to make energy sector in India
more competitive and efficient by creating awareness among various stakeholders in the industry and by
promoting information exchange with the end users. IESA also provides insights to technology developers,
original equipment manufacturers, policymakers, renewable players and system integrators on the policy
landscape and business opportunities in India through frequent interaction with all key stakeholders. As
estimated by IESA, the Indian energy storage market is expected to grow to 70 GW by 2022.
Please find more information on IESA at http://www.indiaesa.info/

Intoduction
Electric Vehicles were invented in mid 19th
century and enjoyed dominance till early 20th
century, before giving way to age of gasoline
powered vehicles that have dominated transport
sector for almost 100 years. Past decade has
seen renewed focus on electric vehicles from
various stake holders around the globe. The
desire for rapid adoption of EVs stems from need
for reducing dependance on fossile fuels for
transportation sector for improving national
energy security as well as desire for cleaner air.
One of the hurdles for mass adption of EVs was
cost effective energy storage that can compete
with the coveneince provided by gasoline fueled
vehicles. Rapid advances in technology
development as well as significant investments
in scaling up manufacturing of energy storage
technologies has brought us to an inflexion
point, where with the right policy support we can
start witnessing rapid adoption of EVs around
the globe.
Global EV Market Overview: The global EV market is rapidly gaining
momentum towards the target set by Electric
Vehicle initiative (EVI) of global deployment of
20 million electric vehicles by 2020. EVI was
launched by Clean Energy Ministarial with US
and China taking lead. Since 2014, the sale of
EV’s have more than the doubled. In the year
2015, we had seen the electric cars cross the
global threshold of 1 million electric cars on the
roads. The market share of electric cars rose
above 1% in seven countries in 2015: Norway,
Netherlands, Sweden, Denmark, France, China
and United Kingdom. The United States was
overtaken by China as the largest market for
electric cars in 2015 with over 200,000 new
registrations.
Currently, China is the biggest market for electric
vehicles across the globe. China has registered
around 3,52,000 new electric cars registration in
2016 as compared to 1,59,000 cars registered in
US. China has a massive target of putting 5
million plug-in cars on road by 2020.
Apart from the electric cars, China is also the
biggest market for electric two wheelers and
electric buses and sold around more than 30
million electric two wheelers and more than
100,000 electric buses in 2016. Restrictions on
the sales of conventional vehicles in urban areas
and huge subsidy by the government are the key
reasons for the rapid growth of EV market in
China. To further accelerate the growth of EV’s
in the country, China has planned to spend a
large amount of money towards development of
charging infrastructure. As per a Chinese state
news agency, the government will install
100,000 public charging stations in 2017.
Currently China has around 150,000 public
charging stations.
EV market in the United States, has seen sales of
electric cars increased by 37% in 2016. More
than half of all EV sales took place in California,
driven by the State’s zero-emission vehicle
mandate. California has a goal to put 1.5 million
zero-emission vehicles on the state’s road by
2025. Along with the zero-emission vehicle
mandate, tax credits and several regulations are
key policies promoted by the Federal and State
governments in the United States to promote
electric and alternate fuel vehicles.
The sales of electric vehicles in Europe has
reached over 3% of the total car sales in 2016. As
per the recent report published by European
Federation for Transport & Environment, more
than 5,00,000 electric vehicles are currently
running on Europe’s roads. Netherlands and the
Norway are leading in terms of new electric
vehicle registrations and both have already
announced their plans of phasing out petrol and
diesel vehicle by 2025. In January 2017, Norway

has recorded the highest market share of 37%
sales of Plug-in electric vehicles in the country’s
passenger car market. Incentives such as 25%
VAT exemption, no purchase and import taxes,
access to bus lanes, free parking in city centers,
and no road tolls are playing a significant role in
the growth of sales of EV’s in the country.
Furthermore, UK, Germany, Italy, Spain and
France are the major car markets of Europe.
Policies like mandatory emission reduction
targets set by EU legislation for new cars and
incentives provided by several European
countries will further play a significant role in the
increase in sales of EV’s in the continent.
India EV Market Overview: The EV Industry in India is at a nascent stage. As
of March 2016, 400-500,000 EV’s had been sold
in the country – around 0.1% of the global
market share. Now, the EV Industry has started
gaining momentum once again towards the
target set under National Electric Mobility
Mission Plan (NEMMP) 2020 of 6-7 million sales
of EV’s by 2020. Government of India has
indicated a desire that by 2030 all new vehicles
should be EVs. The EV Industry had noticed an
increase of 37.5% in the sales of electric vehicles
in FY 2015-16 and sold around 22,000 units in
that year as compared to 16,000 units in FY
2014-15.
The EV Industry is currently dominated by
electric two wheelers. More than 95% of the
electric vehicles on Indian roads are low speed
electric vehicles. If we talk about the sales trend
of electric two wheelers in India, the EV industry
noticed the highest sales (100000 units) in FY
2011-12. After that, there was a continuous drop
in the sales of two wheelers due to the removal
of AFSTP scheme by MNRE. The sales of electric
two wheelers has started increasing once again
with the introduction of FAME Scheme by DHI in
2015. As per the estimation done by IESA, 5 to 6
lakh electric two wheelers would be sold till
2022.
The electric three wheeler market is mainly
dominated by e-rickshaws in the country.
Approximately 4 to 4.5 lakh e-rickshaws are
currently running on Indian roads. Kinetic green,
a Pune based company has launched e-rickshaws
based on lithium ion battery this year to
overcome the limitations of frequent battery
replacement and higher charging time of 8 to 10
hours. But again the cost of the lithium ion
battery is more than 2 times the cost of lead acid
battery used in these e-rickshaws, but this
scenario is expected to change fast with global
increase in li-ion manufacturing capacity and
setting up assembly facilitis for battery pack
manufacturing in India in 2017. As per the IESA’s
estimation, this segment would grow rapidly
with a CAGR of 40 to 45% in coming years.
The sales of electric passenger vehicles in India
are very low. This segment is continuously
lagging in maintaining healthy sales traction due
to several barriers associated with these vehicles
such as high initial cost, lack of charging
infrastructure, higher battery replacement cost,
and low driving range. The second biggest
problem with this segment is the lack of
competition in the market. Other than Mahindra
Electric, there are no major players available in
the market.
As per Mahindra officials, the company has sold
around 1000 to 1200 units of e2O / year. With
the launch of new e2o plus and e-verito in the
market, the company is expecting further
increase in the sales of vehicles. In 2017-18 it is
anticipated that number of multinational car
manfuacturers will introduce EV models in India.
As per the analysis done by IESA, 30,000 to
40,000 cars would be sold till 2022 based on
current policy drivers.
India has a tremendous opportunity to leapfrong
in EV adoption with commercial vehicle

segments focusing on public transport. Since
2016, pilot projects have been carried out so far
in cities such as Bangalore, Delhi and Himachal.
High Initial Cost and lack of charging
infrastructure are key barriers which are
hindering the growth of electric buses in India.
Table 1: Electric vehicles benefitted by FAME Scheme during 2015-2017
Companies like KPIT, BYD, Ashok Leyland, Tata
Motors and JBM Auto in association with Solaris
have already launched their electric buses in the
market. With the increase in number of players
and competition, everybody is expecting the
initial cost of these buses to come down further.
And as per Hon. Minsiter for Road Transport,
Shri. Nitin Gadkari’s recent statement, Electric
buses would be available soon at a price of INR
95 Lakh by 2018 as compared to INR 2.5 crore
earlier.
Government is working on a policy where if the
buses of the state road transport undertakings
are converted into electric, then it is possible to
run them with private investment. IESA urges
policy makers to set realistic targets by analyzing
the traffic patterns and identifying cities and
routes that are most suited for introduction of
electric buses in India. There is also a need to
scale up the rollout target as by lauching 10-25
vehicle pilots, policy makers are sending mixed
signals to the industry. By focusing on shorter
and pre-defined routes as well as by providing
charging stations at multiple lcoations, the cost
of the electric buses can be brought down
immediately rather than waiting for the cost of
storage to drop.
To remove the barrier of lack of charging
infrastructure, the government is currently
considering an option of battery swapping along
with the installations of new charging stations.
This segment has also started gaining
momentum slowly as the state government of
Himachal has already released a tender to
procure 75 electric buses. Bangalore
Metropolitan Transport Corporation (BMTC)
board has also given the confirmation to procure
150 electric buses for Bangalore City. Pune City
has also floated a tender to procure 100 electric
buses. And as per the estimation done by IESA,
1500 to 2000 electric buses would be sold till
2022.
Government support and Policies: The Department of Heavy Industries (DHI)
launched the National Electric Mobility Mission
Plan (NEMPP) 2020 in 2013 with a view to sell 6
to 7 million electric & Hybrid vehicles by 2020 to
reduce India’s dependency on crude oil imports
and also to reduce carbon emissions. In 2015,
DHI launched the FAME India scheme for faster
adoption and manufacturing of electric and
hybrid vehicles in India with an approved outlay
of Rs. 795 Crore for Phase 1 which was initially
for 2 years i.e. FY 2015-16 and FY 2016-17. The
outline of the planned scheme was following:
Components of Scheme
2015-16 (INR)
2016-17 (INR)
Technology Platform
70 Crore 120 Crore
Demand Incentives
155 Crore 340 Crore
Charging Infrastructure
10 Crore 20 Crore
Pilot projects 20 Crore 50 Crore
IEC/ Operations 5 Crore 5 Crore
Total 260 Crore 535 Crore
Grand Total INR 795 Crore
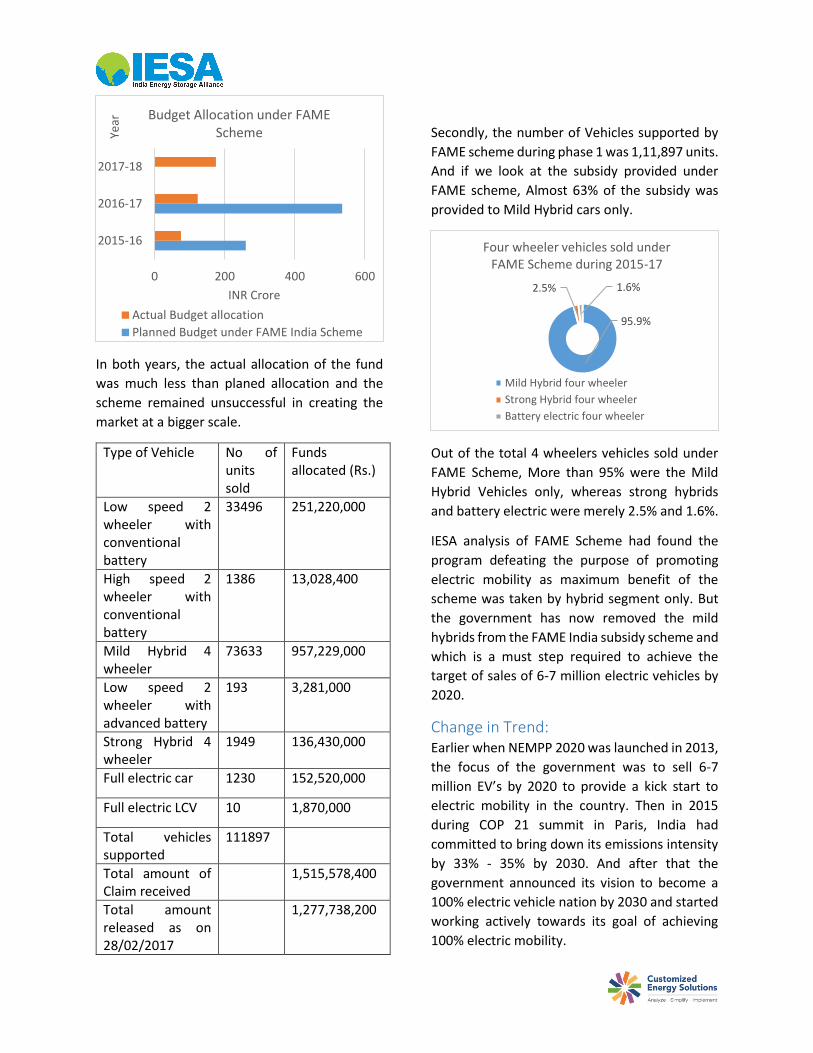
In both years, the actual allocation of the fund
was much less than planed allocation and the
scheme remained unsuccessful in creating the
market at a bigger scale.
Type of Vehicle No of units sold
Funds allocated (Rs.)
Low speed 2 wheeler with conventional battery
33496 251,220,000
High speed 2 wheeler with conventional battery
1386 13,028,400
Mild Hybrid 4 wheeler
73633 957,229,000
Low speed 2 wheeler with advanced battery
193 3,281,000
Strong Hybrid 4 wheeler
1949 136,430,000
Full electric car 1230 152,520,000
Full electric LCV 10 1,870,000
Total vehicles supported
111897
Total amount of Claim received
1,515,578,400
Total amount released as on 28/02/2017
1,277,738,200
Secondly, the number of Vehicles supported by
FAME scheme during phase 1 was 1,11,897 units.
And if we look at the subsidy provided under
FAME scheme, Almost 63% of the subsidy was
provided to Mild Hybrid cars only.
Out of the total 4 wheelers vehicles sold under
FAME Scheme, More than 95% were the Mild
Hybrid Vehicles only, whereas strong hybrids
and battery electric were merely 2.5% and 1.6%.
IESA analysis of FAME Scheme had found the
program defeating the purpose of promoting
electric mobility as maximum benefit of the
scheme was taken by hybrid segment only. But
the government has now removed the mild
hybrids from the FAME India subsidy scheme and
which is a must step required to achieve the
target of sales of 6-7 million electric vehicles by
2020.
Change in Trend: Earlier when NEMPP 2020 was launched in 2013,
the focus of the government was to sell 6-7
million EV’s by 2020 to provide a kick start to
electric mobility in the country. Then in 2015
during COP 21 summit in Paris, India had
committed to bring down its emissions intensity
by 33% - 35% by 2030. And after that the
government announced its vision to become a
100% electric vehicle nation by 2030 and started
working actively towards its goal of achieving
100% electric mobility.
0 200 400 600
2015-16
2016-17
2017-18
INR Crore
Year Budget Allocation under FAME
Scheme
Actual Budget allocation
Planned Budget under FAME India Scheme95.9%
2.5% 1.6%
Four wheeler vehicles sold under FAME Scheme during 2015-17
Mild Hybrid four wheeler
Strong Hybrid four wheeler
Battery electric four wheeler

But lack of charging infrastructure, high initial
cost, and lack of consumer awareness are the
key barriers which are continuously hindering
the growth of EV’s in India. But the positive sign
for the EV industry is that the government has
started addressing all these issues and working
hard towards bridging the gap.
The government is currently working on various
policies to put the electric vehicles at larger front
in the country and has already defined a
roadmap to convert the public transport into
electric in phase 1 and kept the private vehicles
the in last phase. As per Niti Aayog’s latest policy,
Rohtang in Himachal Pradesh had already begun
tests for using only electric vehicles for public
transport. Five cities, namely Bengaluru and
Mysore in Karnataka and Amaravati, Kakinada,
and Vishakhapatnam in Andhra Pradesh have
been selected further for the implementation of
new policy.
Furthermore, the government is also working on
a model where electric two wheelers, electric
three wheelers, and non-air-conditioned city
buses made by automobile companies in India
will be sold without batteries as part of the plan
thus slashing the initial cost of vehicles up to
70%. The batteries will be leased at a specific
cost and can be swapped easily with the
recharged ones at stations within a short span of
time.
Along with the government, companies like BHEL
are also planning to manufacture electric
vehicles in the country and has also tied up with
ISRO to provide low cost lithium ion batteries for
electric vehicles in India. Tata Power Delhi
Distribution Ltd (TPDDL) is also planning to install
1000 charging stations across Delhi in next four
to five years. PGCIL and NTPC are also exploring
opportunities to install charging infrastructure
for EV’s across the country.
As compared to the earlier scenario, all
stakeholders are working more actively towards
achieving the goal of 100% electric mobility in
the country and currently exploring all possible
solutions to counter barriers associated with the
use of electric vehicles in the country.
Battery Technologies for electric
Vehicle: Past, Present and
Futures Batteries have come a long way over the last few
hundred years although admittedly a lot has
changed only in the last fifty years and continues
to change at an ever increasing rate. In the
beginning of the 20th century the only battery
commercially available was lead acid. When
Ferdinand Porsche made his first car (an electric
car!) it used lead acid batteries and had a range
of only 10 kms under ideal conditions. The main
challenge then was the reduction of the weight
of the batteries. Not much changed until the
1950s when the alkaline batteries were
introduced for the first time. We know these
batteries most commonly as NiMH or NiCd or
Zinc Alkaline batteries. These were much lighter
but had a very limited rechargeability which
means that their cycle life was very limited. Since
they were much lighter a lot of applications such
as hand held radio sets became possible but
were not really ideal for electric vehicles.

Undoubtedly the weight and size are the most
critical factors when designing a battery for an
electric vehicle. A lighter and smaller battery can
mean that we can pack additional batteries to
give a longer driving range and reduce the ‘range
anxiety’ for the driver. This critical parameter is
defined by the energy density of the battery.
Simply put it is how much energy (Wh) you can
store in 1 kg or 1 L of battery and the unit for this
is Wh/kg or Wh/L. If a phone battery which has
approximately 10 Wh of stored energy and
weighs about 50 grams; the energy density of
this battery is 200 Wh/kg. This simple calculation
can be used to compare batteries of all types and
the comparison is shown in the graph above. In
the graph we can quickly see why lead acid
batteries are far from ideal for use in electric
vehicles; they are simply too heavy. The alkaline
batteries (NiCd and NiMH) have a higher energy
density compared to lead acid batteries.
However, the category that really stands out is
the family of Li-ion batteries. Currently, these are
the state of the art for use in electric vehicles and
are used ubiquitously for this purpose. They
have gradually replaced the other battery types
in the electric cars.
The first commercial lithium ion cell was
introduced by Sony in the year 1991 for their
cordless phones. Since the introduction more
than three decades ago the technology has
made tremendous progress in reducing its size
and weight and increasing its cycle life. If we
were using the same battery introduced in 1991
then our cell phone battery would last only 8
hours on one charge (assuming it lasts 24 hours
now). Similarly an electric car such as Nissan Leaf
or Chevy Volt, would only have a driving range of
30 km instead of the 90 km it offers now. There
is however a physical limit to how light the
batteries can become and it looks like the
current Lithium ion technology is fast
approaching that limit. The energy density of the
individual cells has not changed greatly in the
past ten years. It seems to be plateauing around
Make Year
Introduced Type of Battery
Porsche (P1) 1898 Lead acid
GM (EV1) 1996 Lead acid
Toyota RAV4 1997 NiMH
Honda EV Plus 1997 NiMH
GM (EV1 (Gen II)) 1998 NiMH
Nissan (Leaf) 2010 Li-ion
Tesla (Model S) 2012 Li-ion
Honda (Fit EV) 2012 Li-ion
BMW (i3) 2014 Li-ion
TESLA
Figure 1: Energy Density of Various Tecnhologies
Figure 2: energy Density over the Years

values of 200 Wh/kg which certainly opens door
for the next generation of batteries.
Irrespective of all the progress which has already
been made, one thing is for sure that the time is
just about right for the next technology. We
already know that we would like to have a larger
driving range (> 600 km) for our electric cars. This
is where the next generation lightweight
batteries come in. Depending on the
technologies these are anywhere between the
research, prototype or pilot plant stage just
about ready to be commercialized. These new
technologies are Lithium Sulphur (LiS), Lithium-
Air and zinc air. The achievable energy density of
these batteries can be anywhere between 6-8X
of the current state of the art lithium ion. An air
cathode is the ultimate holy grail in batteries
because it does not actually have to contain any
cathode material (thus reducing weight); instead
it uses the oxygen in the air to produce
electricity. For this reason these batteries have
often been referred to as breathable batteries.
Our car are already ready for these new
technologies and now it remains to be seen how
long it will take for them to be a part of our lives.
Business Case
EV Adoption in India A 2016 study1 conducted across major Indian
cities concluded that average Vehicle-Kilometers
driven per year by an Indian household was
8817kms. The vehicle usage frequency average
was 226 days per year which indicates an
average use of 40km/day. Mahindra E20, the
passenger Electric Vehicle (EV) claims a range of
110km/charge, yet India has an electric car
market share of 0.1%2. The lack of EV adoption
at the passenger car level could be due to various
factors ranging from the Total Cost of Ownership
1 Schievelbein, W., Kockelman, K.M., Bansal, P. and Schauer-West, S., 2017. Indian Vehicle Ownership and Travel Behaviors: A Case Study of Bangalore, Delhi and Kolkata (No. 17-01171).
(TCO), lack of policy and infrastructure support
or lack of options in the market.
Total Cost of Ownership (TCO) A preliminary evaluation of TCO was done by
comparing Mahindra E20 with the base model of
Maruti Suzuki Swift. The cost of ownership
accounted for the interest cost, fuel and
maintenance cost. Depreciation and insurance
costs were kept out of the analysis. Interest costs
were calculated based on the landed cost for
Swift and E20 minus the subsidy which is
currently ₹1,24,000 under the FAME (Faster
Adoption and Manufacturing of Electric
Vehicles) scheme. Assuming a maximum run of
10000 km/yr., the equivalent fuel costs were
calculated based on the claimed mileages, i.e.
km/l for Swift and km/charge for E20.
Maintenance cost for E20 are minimal until
batteries are replaced post the claim period of
60,000 kms. The prevailing market prices were
considered for fuel prices and the average
household electricity tariff with annual
escalation was considered to calculate the yearly
running costs.
2 Global EV outlook, 2016 Cost of ownership (Up to 5 yrs. /50,000kms)
Figure 3:Cost of ownership (Up to 5 yrs. /50,000kms)
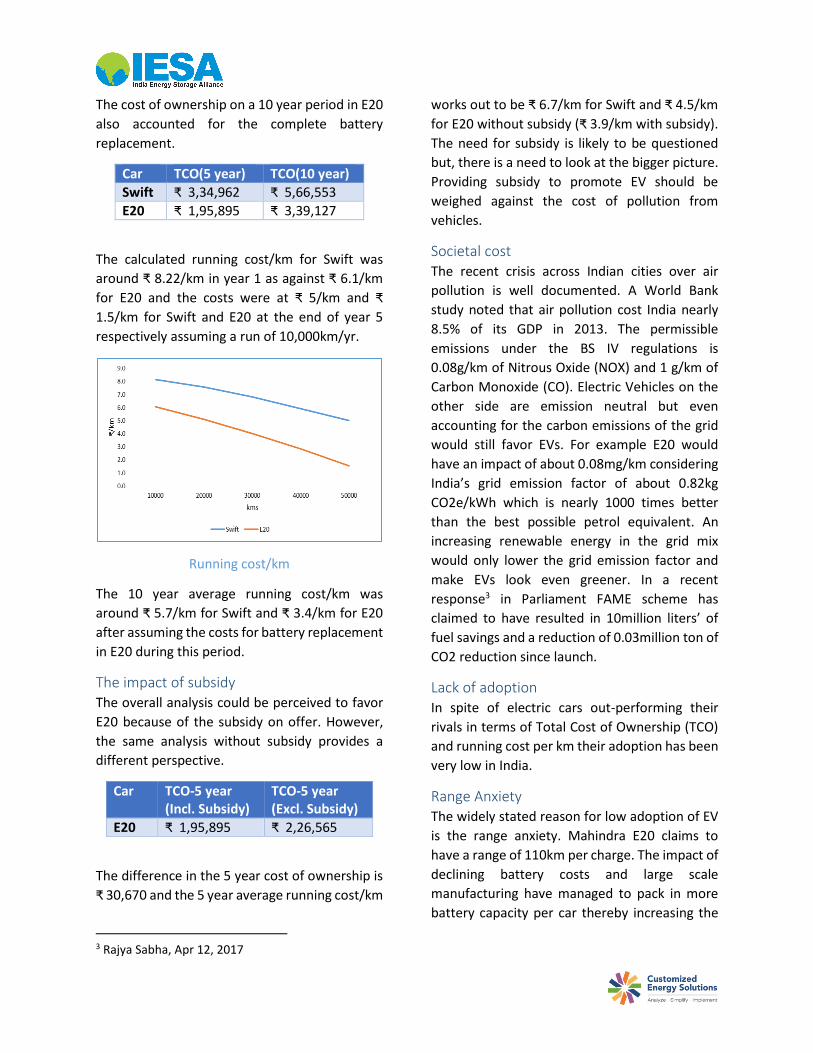
The cost of ownership on a 10 year period in E20
also accounted for the complete battery
replacement.
Car TCO(5 year) TCO(10 year)
Swift ₹ 3,34,962 ₹ 5,66,553
E20 ₹ 1,95,895 ₹ 3,39,127
The calculated running cost/km for Swift was
around ₹ 8.22/km in year 1 as against ₹ 6.1/km
for E20 and the costs were at ₹ 5/km and ₹
1.5/km for Swift and E20 at the end of year 5
respectively assuming a run of 10,000km/yr.
Running cost/km
The 10 year average running cost/km was
around ₹ 5.7/km for Swift and ₹ 3.4/km for E20
after assuming the costs for battery replacement
in E20 during this period.
The impact of subsidy The overall analysis could be perceived to favor
E20 because of the subsidy on offer. However,
the same analysis without subsidy provides a
different perspective.
Car TCO-5 year (Incl. Subsidy)
TCO-5 year (Excl. Subsidy)
E20 ₹ 1,95,895 ₹ 2,26,565
The difference in the 5 year cost of ownership is
₹ 30,670 and the 5 year average running cost/km
3 Rajya Sabha, Apr 12, 2017
works out to be ₹ 6.7/km for Swift and ₹ 4.5/km
for E20 without subsidy (₹ 3.9/km with subsidy).
The need for subsidy is likely to be questioned
but, there is a need to look at the bigger picture.
Providing subsidy to promote EV should be
weighed against the cost of pollution from
vehicles.
Societal cost The recent crisis across Indian cities over air
pollution is well documented. A World Bank
study noted that air pollution cost India nearly
8.5% of its GDP in 2013. The permissible
emissions under the BS IV regulations is
0.08g/km of Nitrous Oxide (NOX) and 1 g/km of
Carbon Monoxide (CO). Electric Vehicles on the
other side are emission neutral but even
accounting for the carbon emissions of the grid
would still favor EVs. For example E20 would
have an impact of about 0.08mg/km considering
India’s grid emission factor of about 0.82kg
CO2e/kWh which is nearly 1000 times better
than the best possible petrol equivalent. An
increasing renewable energy in the grid mix
would only lower the grid emission factor and
make EVs look even greener. In a recent
response3 in Parliament FAME scheme has
claimed to have resulted in 10million liters’ of
fuel savings and a reduction of 0.03million ton of
CO2 reduction since launch.
Lack of adoption In spite of electric cars out-performing their
rivals in terms of Total Cost of Ownership (TCO)
and running cost per km their adoption has been
very low in India.
Range Anxiety The widely stated reason for low adoption of EV
is the range anxiety. Mahindra E20 claims to
have a range of 110km per charge. The impact of
declining battery costs and large scale
manufacturing have managed to pack in more
battery capacity per car thereby increasing the

range. Tesla model 3 claims a mileage of
346km/charge. The trend will certainly reduce
the range anxiety. Equally, having public fast
charging infrastructures installed on major
routes in cities and highways will help consumers
switch to EV sans range anxiety.
EV charging infrastructure Charging infrastructure is widely classified under
Electric Vehicle Supply Equipment (EVSE) that
includes connectors, coupling and control
devices and power unit. Typically its classified
under 3 types, Level 1 for half/one day cycles at
110V AC; Level 2 for 8-hour cycles at 220V AC
and Level 3 fast charging based on DC grid.
Figure 4 Charging stations in India (Source: Plugin India)
The total number of electric vehicles sold in India
would be around 500,000 of which electric 3
wheelers account for a significant number. On a
low side, the total EVs currently running on road
could be assumed to be the EVs sold through
FAME scheme during Apr’15 to Feb’17 which is
close to 120,000. Neglecting the 2 wheeler sales
of 35,000 which is mostly charged at private
facilities the total vehicle count reduces to
85,000. Currently in India, there are around 300
publicly available charging stations, nearly one-
thirds are in Mahindra outlets or its group
company owned facilities. The EV-public
charging station ratio stands at 283:1. The
number is in sharp contrast to China and Japan
which is at 30:1. Similarly the ratio is between
60-90 for US and Canada. It clearly illustrates a
wide gap in the market.
Policy support for EV charging
infrastructure The National Electric Mobility Mission plan
envisaged charging points between 175,000-
227,000 by 2020 with fast charging points
accounting 10% of the total. The FAME scheme
which followed up on this plan envisaged fund
allocation in developing the infrastructure but
unfortunately it has not taken off as proposed.
Figure 5 Summary of policy support for EVSE (Source: Global EV outlook, 2016)
Development of charging infrastructure would
hinge on
- Regulations that classify energy storage
as an asset that could also be traded.
- Standards for charging stations,
connectors and hardware protocols. The
Automotive Research Association of
India (ARAI) has recently released an
industry charging standard for AC
systems and is likely to release one for
DC systems soon.
- Utility’s preparedness to witness a surge
in demand.
- Incentive to charge vehicles through a
time of use/ off-peak charging tariffs.

Challenges and Road Ahead: There are a lot of challenges associated with
electric vehicles which need to be addressed first
before the adoption of EV’s at a larger scale:
The first issue is what should be the appropriate
EV Charging infrastructure model for the urban
areas, highways and rural India. Lots of
discussions are already going on regarding what
type of charging infrastructure should be
deployed in different areas. But no concrete
model has been finalised yet. As per IESA
recommendation, Type 1 chargers are most
suitable for residential townships and
workplaces. Type 1 charger takes around 8 to 10
hours for complete charging and people
generally spend around 8 to 10 hours at their
workplaces where they can charge their vehicles
easily. Type 2, which takes around 3 to 4 hours
for complete charging, is most suitable for the
commercial purpose such as Malls, Parking lots
etc. For highways and other places where fast
charging is required throughout, Type 3 chargers
should be considered. Additionally a
combination of type 1 and type 2 should be
installed in petrol pumps and auto stands.
The next issue is what the right tariff for the
charging of electric vehicles should be – whether
we choose commercial rates/promotional rates
for the promotion of EV’s in India or consider
Time of day (ToD) requirements for the grid. As
per IESA recommendations, it could be
dependent on the customer usage such as
residential users may be able to charge at
residential rates while the commercial users or
the public charging spaces paying at commercial
rates. ToD aspect should be considered as well
as incentives should be available for Vehicle to
grid (V2G) for providing ancillary services and
demand response to grid.
The next biggest challenge is to find out the
appropriate battery technology for the electric
vehicles whether it should be lead acid or the
lithium ion. Also the technology should be
environment friendly. Currently, most of the EV
manufacturers are shifting towards lithium ion
batteries but considering advanced lead acid
could also be a suitable option. Lead acid
batteries will have an advantage in terms of
recycling and also will not have dependency on
other countries for importing lead acid batteries
as we have a well-established in-house facility in
the country. For other technologies, we need to
develop the recycling unit first along with the
development of infrastructure and technology.
Apart from these major issues, there are various
other issues as well, such as:
• What would be the impact of EV charging over
grid?
• Who will operate the EV charging stations?
• What kind of incentives should be provided for
the faster adoption of electric vehicles?

IESA Initiatives in Electric Vehicle Segment India Energy storage Alliance (IESA) has been actively involved in development of Electric Vehicle market
in India since inception in various capacities.
In IESA’s Annual International Conference and Expo “Energy Storage India”, IESA created a special
track on Electric Mobility and transportation since 2013. The conference and expo has brought
together key policy makers, researchers, technology developers and automotive manufactuers each
year since then.
IESA was actively involved in Smart Utility Group (SUG) created by ISGF on providing inputs to
Department of Heavy Industries (DHI) on “Effect of Electric Vehicle Penetration on Electric Grid and
charging Infrastructure” during 2015-16.
IESA organised an open webinar on “Indian Electric Vehicle (& Hybrid Vehicle) Market” in July 2015.
The presenters include Mr. Robert (Bob) Galyon, CTO, CATL, Mr. Basant Vaishya, Sr. Vice President
and Yo–Bikes, ELECTROTHERM, Mr. Maheshwar Babu, Sales & Marketing Head, Firefly Batteries and
Sumit Dhanuka, VP & Lead- Private Investments, Sar Group, LivGuard Batteries.
IESA supported as an Association Partner and also presented on energy storage requirement for the
electric vehicle at the “Energy Conclave on Electric Vehicle” organized by IIT Bombay in August 2016.
IESA has provided inputs to Department of Science and Technology (DST) on battery module
standardisation efforts.
IESA submitted a paper to NITI Aayog on advanced energy storage manufacturing policy for India,
which will boost Electric Vehicle manufacturing in India in 2016.
IESA team presented its view on energy storage requirement for e-rickshaws at EV Expo 2016
IESA organised its regional event on energy storage for Electric Vehicle at Pune in October 2016. The
conference saw participation from Tata Motors, Go Green BoV, CECRI, ARAI, Octilion Power Systems,
and CMET.
IESA team created and released an Industry landscape report on Indian Electric Vehicle Market
Overview 2017.
IESA participated in the Strategy development workshop organized by The International Council on
Clean Transportation (ICCT) in association with the Shakti Sustainable Energy Foundation to promote
electric vehicles in India in January 2017. IESA provided its inputs to overcome the barriers associated
with the electric vehicles in India.
IESA is founding member of Transportation Electrification Special Interest Group being created by IEEE
and IET in 2017. TESIG will focus on pollution control by EV adaptation, Employment generation
adopting Make in India for EV and India’s Energy Security.

IESA Members
Contact Us
Dr. Rahul Walawalkar CEM, CDSM
President & MD, Customized Energy Solutions
(India)
Executive Director, India Energy Storage
Alliance (IESA)
Mr. Debi Prasad Dash
Director, India Energy Storage Alliance (IESA)
Customized Energy Solutions
Cell: +91-96-9971-9818
Phone: +91- 020-3063 8311/12/13
A501, GO Square, Aundh Hinjewadi Link Road, Wakad | Pune, MH India – 411057
Email: [email protected]
Website: www.indiaesa.info

![Transport Supporting Paper_1[1]](https://static.cupdf.com/doc/110x72/55cf94d4550346f57ba4aa70/transport-supporting-paper11.jpg)