Philippine Health Status
PIDS Team
Celia Reyes Oscar Picazo Ida Marie Pantig Valerie Ulep Nina Ashley Dela Cruz Danica Ortiz
Kalusugang Pangkalahatan Program
General Health Status
Accessibility, Availability and Affordability of Health Services

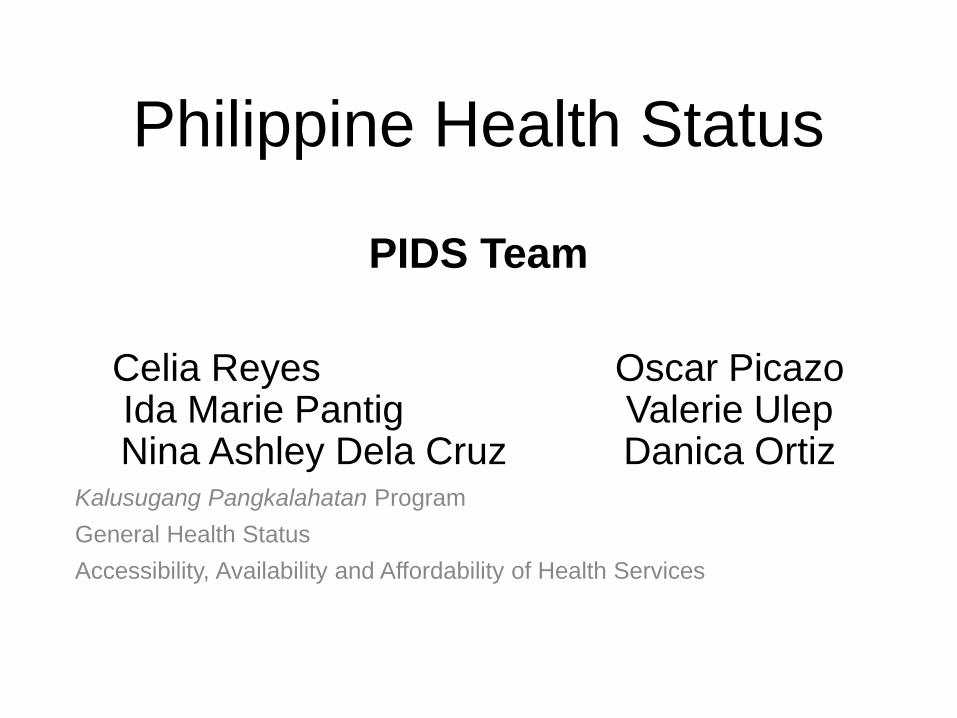
Philippine economy has been growing, but perennial poverty and income inequality remain as major challenges.
The upward trend in the economic growth has not translated to better and equitable social outcomes, particularly for health status.
Latest Poverty Trends (2006, 2009, 2012 and 2013 First Semester)
23.4 22.9 22.3
19.1
28.8 28.6 27.9
24.9
10.8 10.0 10.0
7.7
14.2 13.3 13.4
10.7
0.0
5.0
10.0
15.0
20.0
25.0
30.0
35.0
2006 2009 2012 2013
In P
erc
en
t
Poverty incidence among families Poverty incidence among population
Subsistence incidence among families Subsistence incidence among population
Note: - The 2006, 2009 and 2012 estimates are based on the first visit of the Family Income and Expenditure
Survey (FIES), which used four replicates of the 2003 Master Sample or approximately 51,000 sample. These
estimates were released last 23 April 2013.
- The 2013 poverty estimates are based on the 2013 Annual Poverty Indicator Survey (APIS) conducted in July
2013, which adopted the income module of the FIES (with some modifications in the section containing the list of
wage and salary workers in the family), and used one replicate of the 2003 Master Sample or approximately
12,000 sample.
Source: Philippine Statistics Authority (PSA)

Government Response: Kalusugang Pangkalahatan or Universal Healthcare (2010)
UHC-KP
Financial Risk Protection
Health Facilities
Improvement
Attainment of Health-
Related MDGs

Improve financial risk protection
• Expand enrolment of the poor in the NHIP to improve population coverage
• Promote the availment of the quality outpatient and inpatient services at accredited facilities through reformed capitation and no balance billing arrangements for sponsored members
• Increase the support value of health insurance for the poor
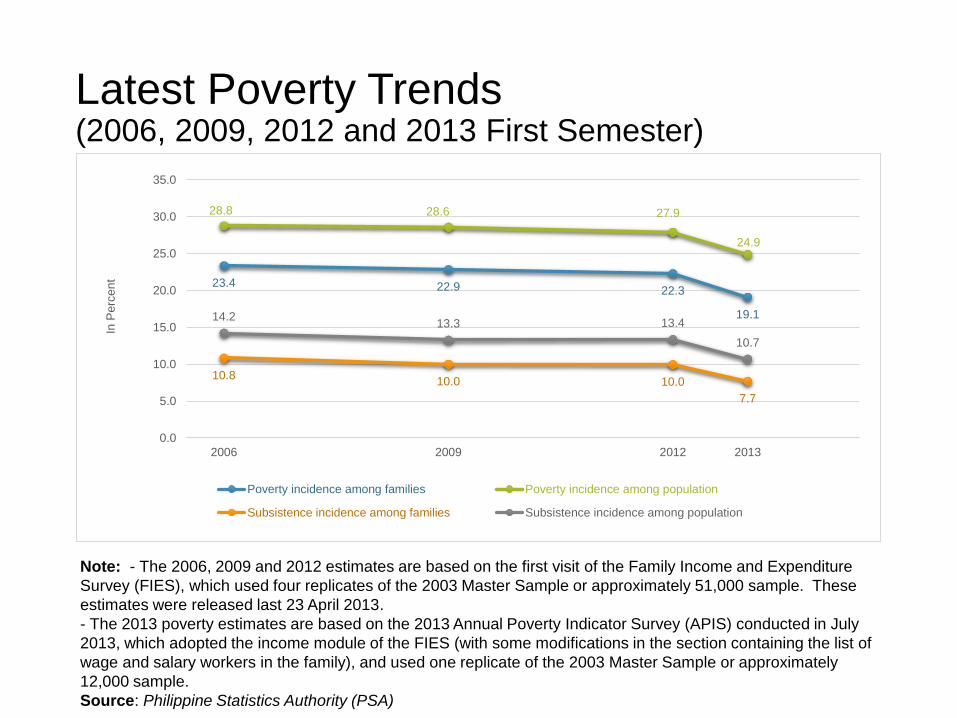
Improve health facilities
• Targeted health facility enhancement program
• Fiscal autonomy and income retention schemes for government hospitals and health facilities
• Access to quality drugs, and deployment of health professionals
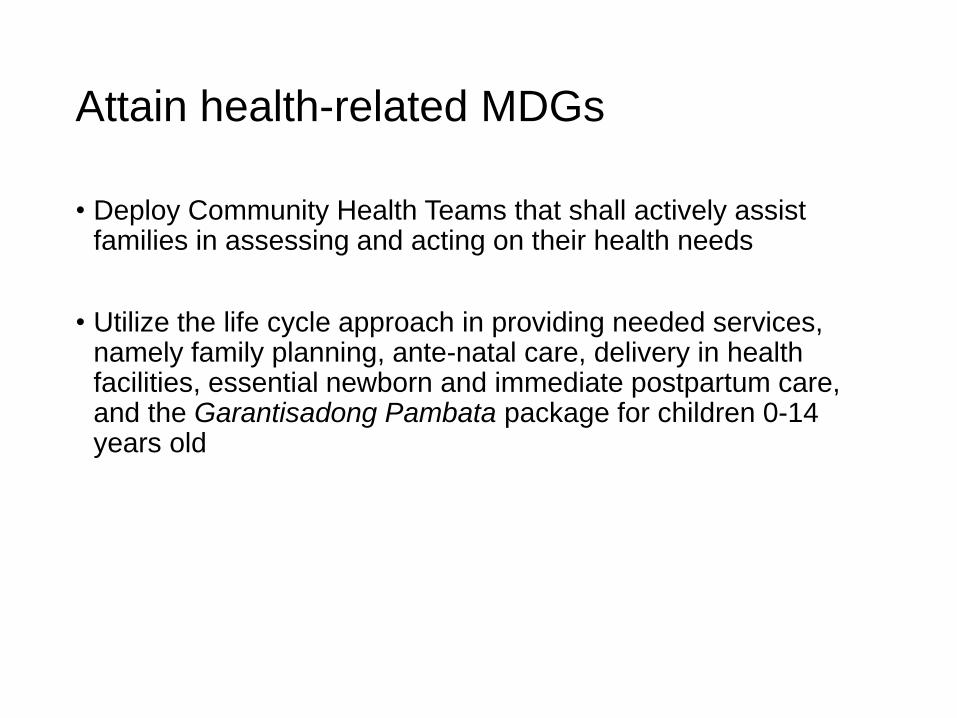
Attain health-related MDGs
• Deploy Community Health Teams that shall actively assist families in assessing and acting on their health needs
• Utilize the life cycle approach in providing needed services, namely family planning, ante-natal care, delivery in health facilities, essential newborn and immediate postpartum care, and the Garantisadong Pambata package for children 0-14 years old
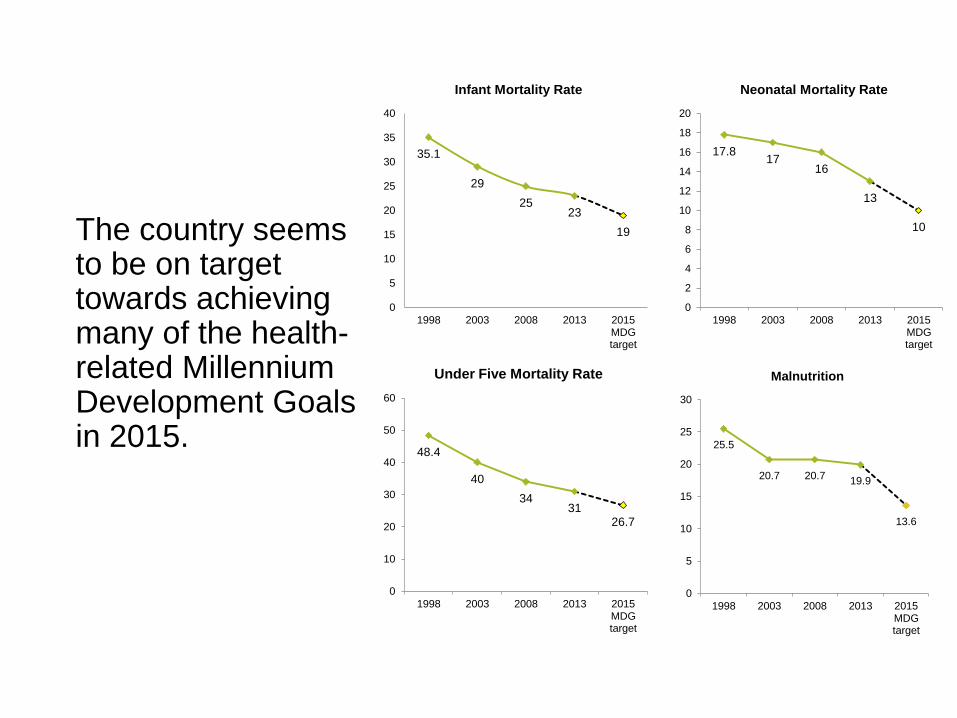
The country seems to be on target towards achieving many of the health-related Millennium Development Goals in 2015.
35.1
29
25 23
19
0
5
10
15
20
25
30
35
40
1998 2003 2008 2013 2015MDGtarget
Infant Mortality Rate
17.8 17
16
13
10
0
2
4
6
8
10
12
14
16
18
20
1998 2003 2008 2013 2015MDGtarget
Neonatal Mortality Rate
48.4
40
34 31
26.7
0
10
20
30
40
50
60
1998 2003 2008 2013 2015MDGtarget
Under Five Mortality Rate
25.5
20.7 20.7 19.9
13.6
0
5
10
15
20
25
30
1998 2003 2008 2013 2015MDGtarget
Malnutrition
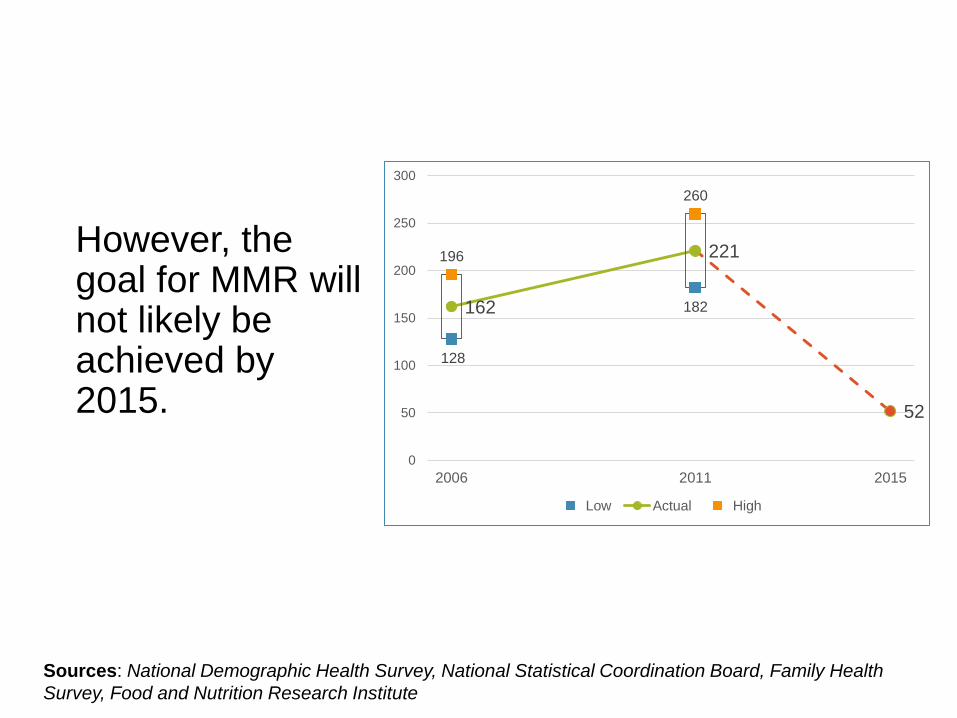
However, the goal for MMR will not likely be achieved by 2015.
Sources: National Demographic Health Survey, National Statistical Coordination Board, Family Health
Survey, Food and Nutrition Research Institute
128
182 162
221
52
196
260
0
50
100
150
200
250
300
2006 2011 2015
Low Actual High

Target 6.A: Have halted by 2015 and begun to reverse the spread of HIV/AIDS
Source: Philippine HIV Registry, National Epidemiology Center
"90 "91 "92 "93 "94 "95 "96 "97 "98 "99 "00 "01 "02 "03 "04 "05 "06 "07 "08 "09 "10 "11 "12 "13
Asymptomatic 48 68 51 64 61 65 104 94 144 80 83 118 140 140 162 171 273 311 505 804 156 223 315 447
AIDS 18 17 21 38 57 51 50 23 45 78 40 56 44 53 37 39 36 31 23 31 29 110 186 338
0
500
1000
1500
2000
2500
3000
3500
4000
Total Reported Cases HIV/AIDS, 1990-2013
AIDS Asymptomatic

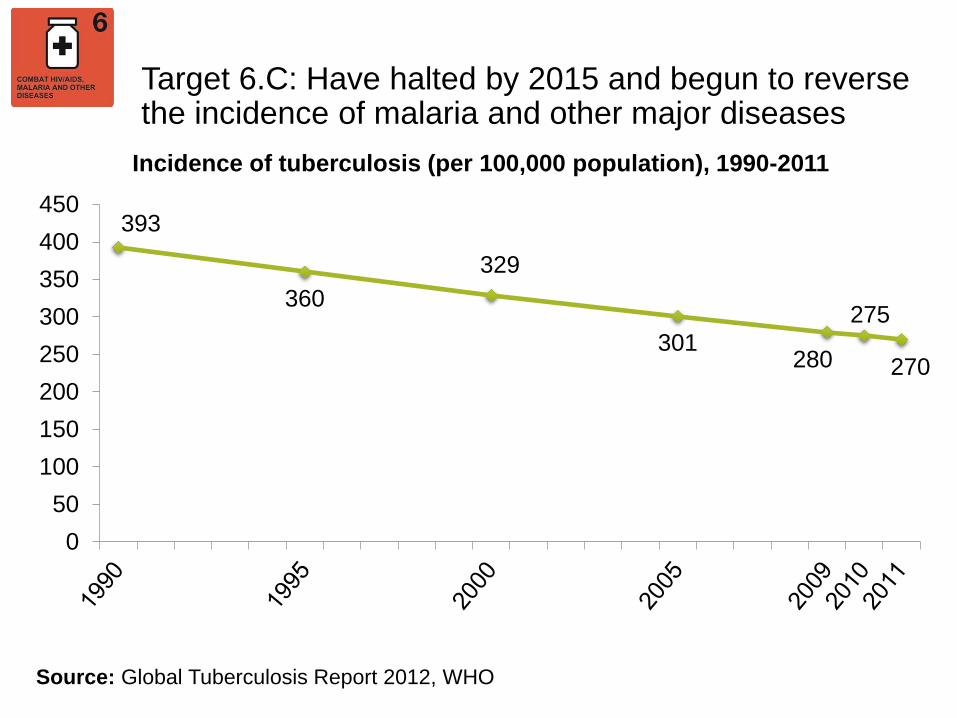
Target 6.C: Have halted by 2015 and begun to reverse the incidence of malaria and other major diseases
Note: 2009-Partial Data Source of basic data: DOH
123
86
72
55
41
26 20
9.5
0
20
40
60
80
100
120
140
Malaria morbidity rate (cases per 100,000 population), 1990-2011
Target 6.C: Have halted by 2015 and begun to reverse the incidence of malaria and other major diseases
393
360
329
301 280
275
270
0
50
100
150
200
250
300
350
400
450
Incidence of tuberculosis (per 100,000 population), 1990-2011
Source: Global Tuberculosis Report 2012, WHO
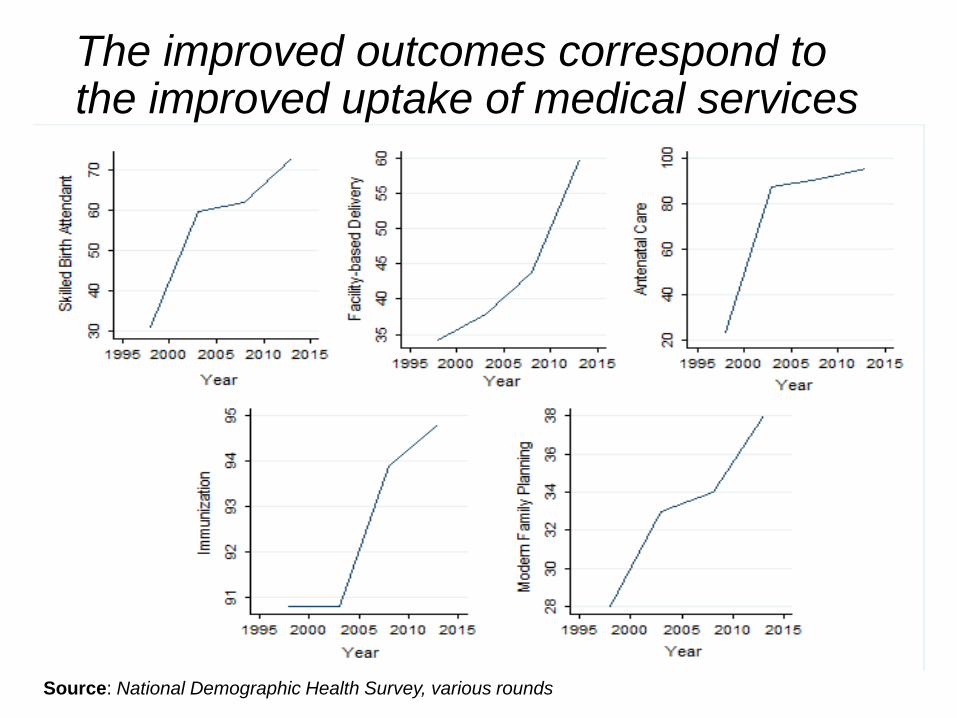
The improved outcomes correspond to the improved uptake of medical services
Source: National Demographic Health Survey, various rounds
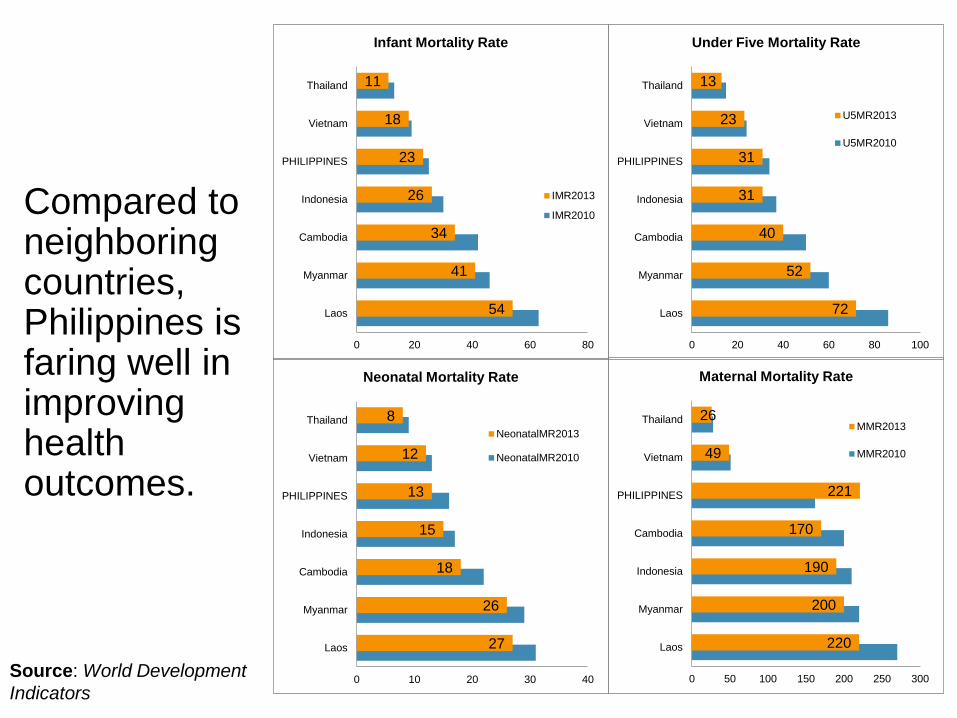
Compared to neighboring countries, Philippines is faring well in improving health outcomes.
54
41
34
26
23
18
11
0 20 40 60 80
Laos
Myanmar
Cambodia
Indonesia
PHILIPPINES
Vietnam
Thailand
Infant Mortality Rate
IMR2013
IMR2010
27
26
18
15
13
12
8
0 10 20 30 40
Laos
Myanmar
Cambodia
Indonesia
PHILIPPINES
Vietnam
Thailand
Neonatal Mortality Rate
NeonatalMR2013
NeonatalMR2010
72
52
40
31
31
23
13
0 20 40 60 80 100
Laos
Myanmar
Cambodia
Indonesia
PHILIPPINES
Vietnam
Thailand
Under Five Mortality Rate
U5MR2013
U5MR2010
220
200
190
170
221
49
26
0 50 100 150 200 250 300
Laos
Myanmar
Indonesia
Cambodia
PHILIPPINES
Vietnam
Thailand
Maternal Mortality Rate
MMR2013
MMR2010
Source: World Development
Indicators
However, regional disparities are still evident.

NCR
NCR
CAR
CAR
24
23
Reg II
Reg II
Reg III
Reg III
Reg IV-A
Reg IV-A
Reg IV-B
Reg IV-B
19
25
Reg VI
Reg VI
Reg VII
Reg VII
Reg VIII
Reg VIII
Reg IX
Reg IX
Reg X
Reg X
Reg XI
Reg XI
Reg XII
Reg XII
Reg XIII
Reg XIII
ARMM
ARMM
PHILIPPINES
PHILIPPINES
0
10
20
30
40
50
60
Infant Mortality Rate 2008 and 2011
NCR
NCR
CAR CAR
26
28
Reg II
Reg III
Reg III
Reg IV-A Reg IV-A
Reg IV-B Reg IV-B
Reg V
Reg V
Reg VI
Reg VI
Reg VII Reg VII
Reg VIII
Reg VIII
Reg IX
Reg IX
Reg X
Reg X
Reg XI
Reg XI Reg XII
Reg XII Reg XIII
Reg XIII
ARMM
ARMM
PHILIPPINES
PHILIPPINES
15
25
35
45
55
65
75
85
95
105
U5 Mortality Rate 2008 and 2011
NCR
NCR
CAR
CAR
26.1
21.4
Reg II
Reg II Reg III
Reg III
Reg IV-A
Reg IV-A
Reg IV-B
Reg IV-B
33.8
24.6
Reg VI
Reg VI Reg VII
Reg VII
Reg VIII
Reg VIII
Reg IX
Reg IX
Reg X
Reg X
Reg XI
Reg XI
Reg XII
Reg XII
Reg XIII
Reg XIII
ARMM
ARMM
PHILIPPINES
PHILIPPINES
0
5
10
15
20
25
30
35
40
Malnutrition 2008 and 2013
Sources: National Demographic and Health Survey (NDHS), 2008 and Family Health Survey (FSH), 2011, DOST-Food and Nutrition Research Institute (FNRI), using WHO-CGS

NCR
NCR
CAR
CAR
Reg I
Reg I
Reg II
Reg II
Reg III
Reg III
Reg IV-A
Reg IV-A
Reg IV-B
Reg IV-B Reg V
Reg V
Reg VI
Reg VI Reg VII
Reg VII
Reg VIII
Reg VIII
Reg IX
Reg IX
Reg X
Reg X
Reg XI
Reg XI
Reg XII
Reg XII
Reg XIII Reg XIII
ARMM
ARMM
40
50
60
70
80
90
100
110
Antenatal Care 2008 and 2013
NCR NCR
CAR
CAR Reg I
Reg I
Reg II
Reg II
Reg III
Reg III Reg IV-A
Reg IV-A
Reg IV-B Reg IV-B
Reg V
Reg V
Reg VI
Reg VI
Reg VII Reg VII
Reg VIII
Reg VIII
Reg IX
Reg IX
Reg X
Reg X Reg XI
Reg XI
Reg XII
Reg XII
Reg XIII
Reg XIII
ARMM
ARMM
50
60
70
80
90
100
110
Immunization (BCG) 2008 and 2013
NCR
NCR
CAR
CAR
Reg I
Reg I
Reg II
Reg II
Reg III
Reg III
Reg IV-A
Reg IV-A
Reg IV-B
Reg IV-B
Reg V
Reg V
Reg VI
Reg VI Reg VII
Reg VII
Reg VIII
Reg VIII
Reg IX
Reg IX
Reg X
Reg X
Reg XI
Reg XI
Reg XII
Reg XII
Reg XIII
Reg XIII
ARMM ARMM
0
10
20
30
40
50
60
70
80
90
100
SBA 2008 and 2013
NCR
NCR
CAR
CAR
Reg I
Reg I
Reg II
Reg II
Reg III
Reg III
Reg IV-A
Reg IV-A
Reg IV-B
Reg IV-B
Reg V
Reg V
Reg VI
Reg VI
Reg VII
Reg VII
Reg VIII
Reg VIII
Reg IX
Reg IX
Reg X
Reg X
Reg XI
Reg XI
Reg XII
Reg XII
Reg XIII
Reg XIII
ARMM
ARMM
0
10
20
30
40
50
60
70
80
90
100
FBD 2008 and 2013
Source: National Demographic Health Survey
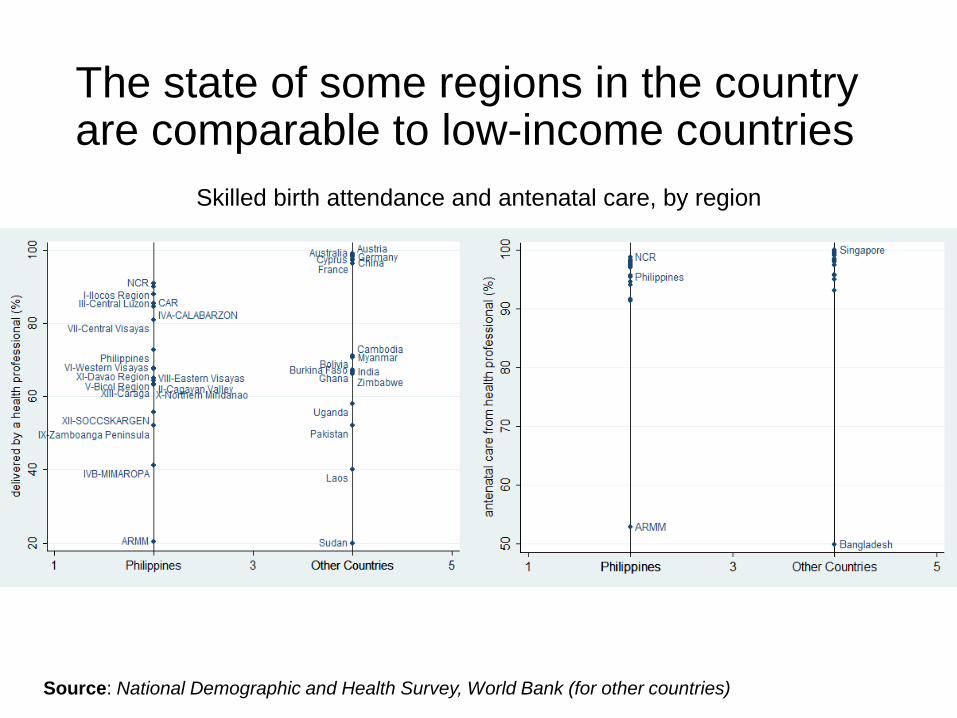
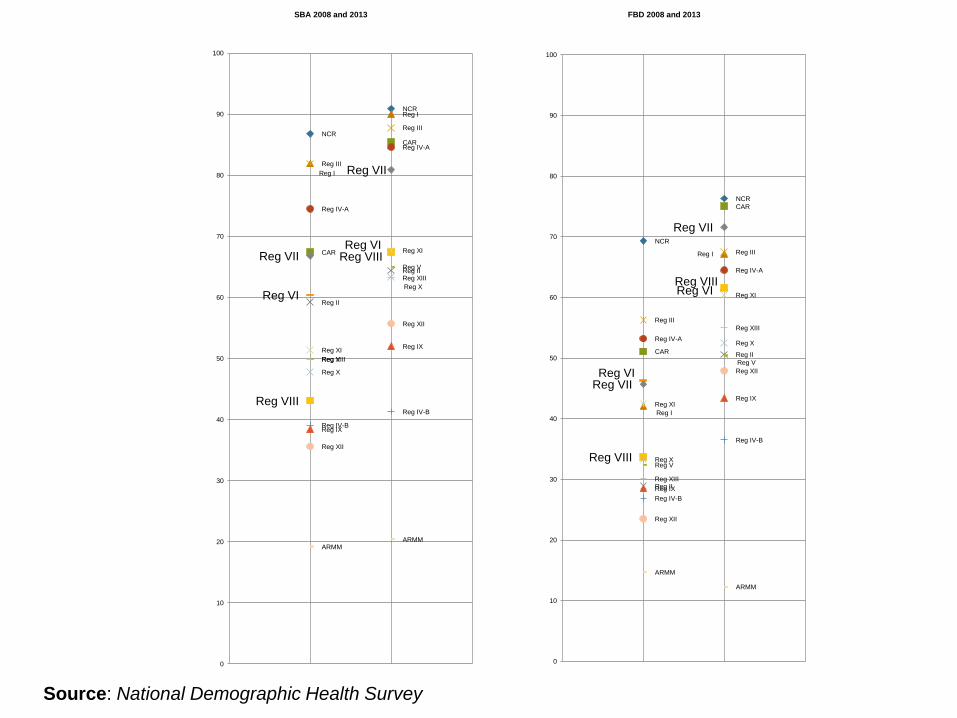
The state of some regions in the country are comparable to low-income countries
Skilled birth attendance and antenatal care, by region
Source: National Demographic and Health Survey, World Bank (for other countries)
Despite this, there have been improvements in regional health status from 2008 to 2013.
Sources: National Demographic and Health Survey (NDHS), 2008 and Family Health Survey (FSH), 2011
14 – 18
19 – 22
23 – 25
26.– 56
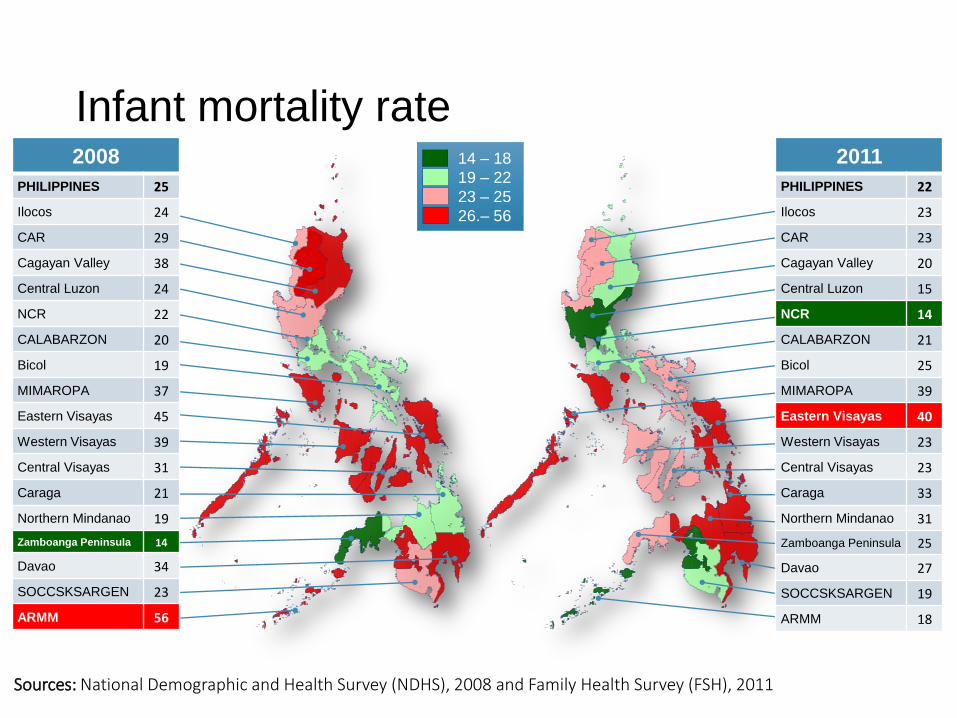
2011
PHILIPPINES 22
Ilocos 23
CAR 23
Cagayan Valley 20
Central Luzon 15
NCR 14
CALABARZON 21
Bicol 25
MIMAROPA 39
Eastern Visayas 40
Western Visayas 23
Central Visayas 23
Caraga 33
Northern Mindanao 31
Zamboanga Peninsula 25
Davao 27
SOCCSKSARGEN 19
ARMM 18
2008
PHILIPPINES 25
Ilocos 24
CAR 29
Cagayan Valley 38
Central Luzon 24
NCR 22
CALABARZON 20
Bicol 19
MIMAROPA 37
Eastern Visayas 45
Western Visayas 39
Central Visayas 31
Caraga 21
Northern Mindanao 19
Zamboanga Peninsula 14
Davao 34
SOCCSKSARGEN 23
ARMM 56
Infant mortality rate

Sources: National Demographic and Health Survey (NDHS), 2008 and Family Health Survey (FSH), 2011
20 – 28
29 – 30
31 – 34
35 - 94
2011
PHILIPPINES 30
Ilocos 28
CAR 31
Cagayan Valley 28
Central Luzon 21
NCR 20
CALABARZON 29
Bicol 39
MIMAROPA 50
Eastern Visayas 53
Western Visayas 28
Central Visayas 34
Caraga 48
Northern Mindanao 40
Zamboanga Peninsula 30
Davao 32
SOCCSKSARGEN 29
ARMM 32
2008
PHILIPPINES 34
Ilocos 26
CAR 31
Cagayan Valley 46
Central Luzon 29
NCR 24
CALABARZON 28
Bicol 34
MIMAROPA 49
Eastern Visayas 64
Western Visayas 43
Central Visayas 35
Caraga 30
Northern Mindanao 27
Zamboanga Peninsula 31
Davao 44
SOCCSKSARGEN 34
ARMM 94
Under-five mortality rate
Source: DOST-Food and Nutrition Research Institute (FNRI), using WHO-CGS
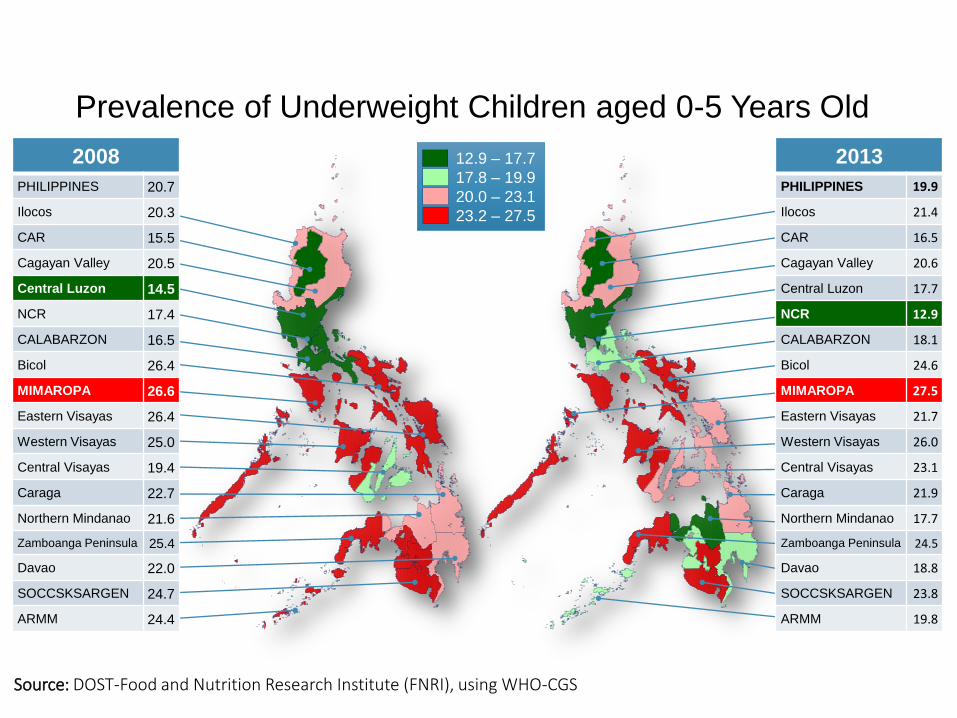
12.9 – 17.7
17.8 – 19.9
20.0 – 23.1
23.2 – 27.5
2013
PHILIPPINES 19.9
Ilocos 21.4
CAR 16.5
Cagayan Valley 20.6
Central Luzon 17.7
NCR 12.9
CALABARZON 18.1
Bicol 24.6
MIMAROPA 27.5
Eastern Visayas 21.7
Western Visayas 26.0
Central Visayas 23.1
Caraga 21.9
Northern Mindanao 17.7
Zamboanga Peninsula 24.5
Davao 18.8
SOCCSKSARGEN 23.8
ARMM 19.8
2008
PHILIPPINES 20.7
Ilocos 20.3
CAR 15.5
Cagayan Valley 20.5
Central Luzon 14.5
NCR 17.4
CALABARZON 16.5
Bicol 26.4
MIMAROPA 26.6
Eastern Visayas 26.4
Western Visayas 25.0
Central Visayas 19.4
Caraga 22.7
Northern Mindanao 21.6
Zamboanga Peninsula 25.4
Davao 22.0
SOCCSKSARGEN 24.7
ARMM 24.4
Prevalence of Underweight Children aged 0-5 Years Old
Source: National Demographic and Health Survey (NDHS)
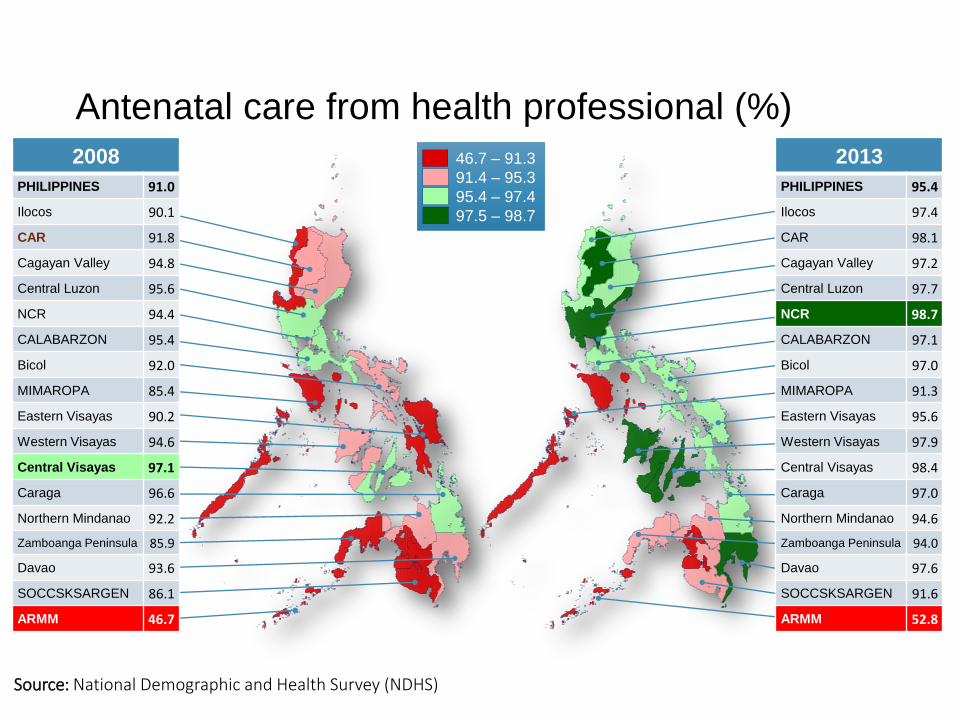
46.7 – 91.3
91.4 – 95.3
95.4 – 97.4
97.5 – 98.7
2013
PHILIPPINES 95.4
Ilocos 97.4
CAR 98.1
Cagayan Valley 97.2
Central Luzon 97.7
NCR 98.7
CALABARZON 97.1
Bicol 97.0
MIMAROPA 91.3
Eastern Visayas 95.6
Western Visayas 97.9
Central Visayas 98.4
Caraga 97.0
Northern Mindanao 94.6
Zamboanga Peninsula 94.0
Davao 97.6
SOCCSKSARGEN 91.6
ARMM 52.8
2008
PHILIPPINES 91.0
Ilocos 90.1
CAR 91.8
Cagayan Valley 94.8
Central Luzon 95.6
NCR 94.4
CALABARZON 95.4
Bicol 92.0
MIMAROPA 85.4
Eastern Visayas 90.2
Western Visayas 94.6
Central Visayas 97.1
Caraga 96.6
Northern Mindanao 92.2
Zamboanga Peninsula 85.9
Davao 93.6
SOCCSKSARGEN 86.1
ARMM 46.7
Antenatal care from health professional (%)
Source: National Demographic and Health Survey (NDHS)
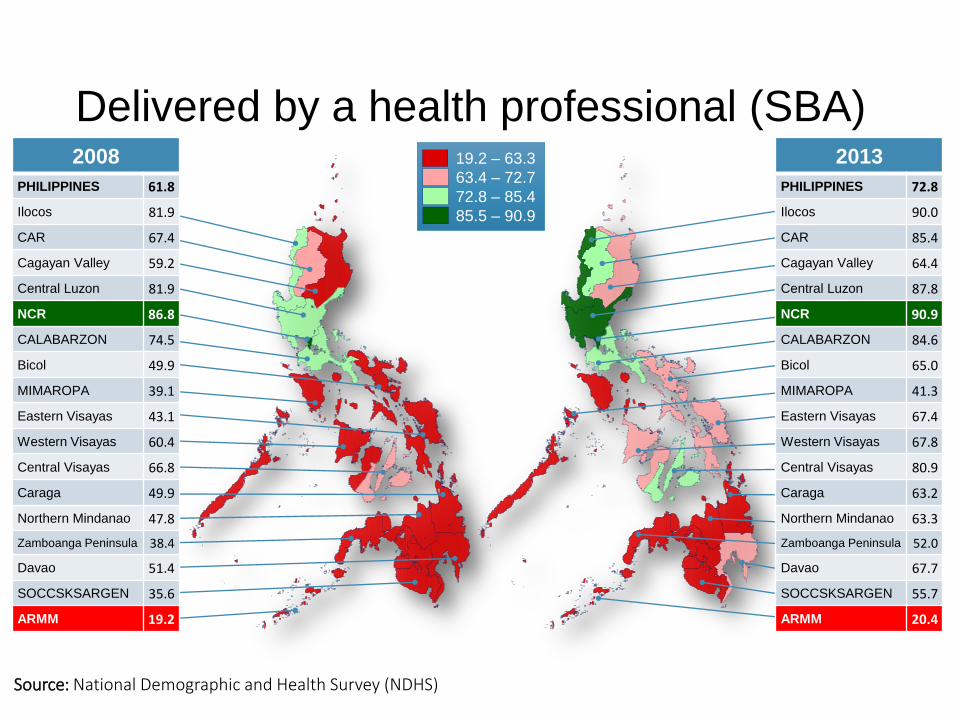
19.2 – 63.3
63.4 – 72.7
72.8 – 85.4
85.5 – 90.9
2013
PHILIPPINES 72.8
Ilocos 90.0
CAR 85.4
Cagayan Valley 64.4
Central Luzon 87.8
NCR 90.9
CALABARZON 84.6
Bicol 65.0
MIMAROPA 41.3
Eastern Visayas 67.4
Western Visayas 67.8
Central Visayas 80.9
Caraga 63.2
Northern Mindanao 63.3
Zamboanga Peninsula 52.0
Davao 67.7
SOCCSKSARGEN 55.7
ARMM 20.4
2008
PHILIPPINES 61.8
Ilocos 81.9
CAR 67.4
Cagayan Valley 59.2
Central Luzon 81.9
NCR 86.8
CALABARZON 74.5
Bicol 49.9
MIMAROPA 39.1
Eastern Visayas 43.1
Western Visayas 60.4
Central Visayas 66.8
Caraga 49.9
Northern Mindanao 47.8
Zamboanga Peninsula 38.4
Davao 51.4
SOCCSKSARGEN 35.6
ARMM 19.2
Delivered by a health professional (SBA)
Source: National Demographic and Health Survey (NDHS)
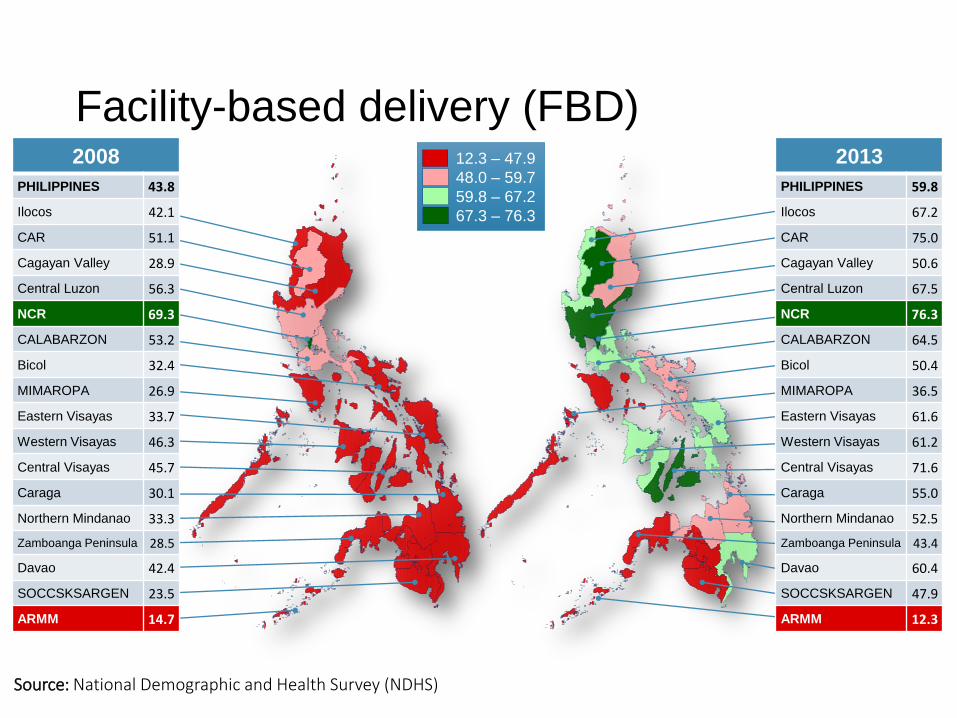
12.3 – 47.9
48.0 – 59.7
59.8 – 67.2
67.3 – 76.3
2013
PHILIPPINES 59.8
Ilocos 67.2
CAR 75.0
Cagayan Valley 50.6
Central Luzon 67.5
NCR 76.3
CALABARZON 64.5
Bicol 50.4
MIMAROPA 36.5
Eastern Visayas 61.6
Western Visayas 61.2
Central Visayas 71.6
Caraga 55.0
Northern Mindanao 52.5
Zamboanga Peninsula 43.4
Davao 60.4
SOCCSKSARGEN 47.9
ARMM 12.3
2008
PHILIPPINES 43.8
Ilocos 42.1
CAR 51.1
Cagayan Valley 28.9
Central Luzon 56.3
NCR 69.3
CALABARZON 53.2
Bicol 32.4
MIMAROPA 26.9
Eastern Visayas 33.7
Western Visayas 46.3
Central Visayas 45.7
Caraga 30.1
Northern Mindanao 33.3
Zamboanga Peninsula 28.5
Davao 42.4
SOCCSKSARGEN 23.5
ARMM 14.7
Facility-based delivery (FBD)
Source: National Demographic and Health Survey (NDHS)
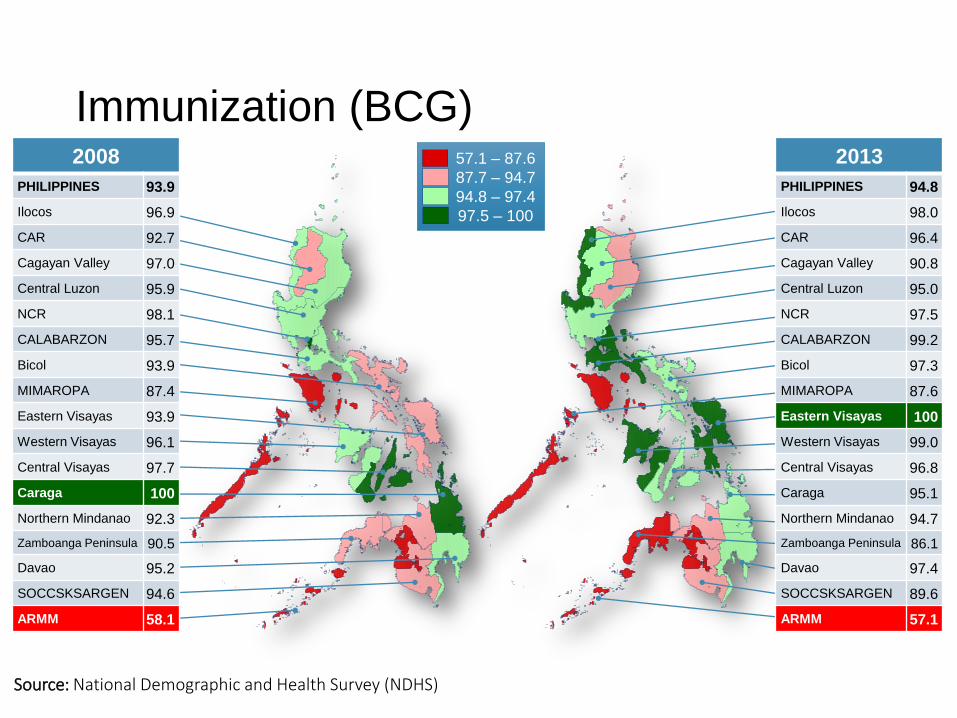
57.1 – 87.6
87.7 – 94.7
94.8 – 97.4
97.5 – 100
2013
PHILIPPINES 94.8
Ilocos 98.0
CAR 96.4
Cagayan Valley 90.8
Central Luzon 95.0
NCR 97.5
CALABARZON 99.2
Bicol 97.3
MIMAROPA 87.6
Eastern Visayas 100
Western Visayas 99.0
Central Visayas 96.8
Caraga 95.1
Northern Mindanao 94.7
Zamboanga Peninsula 86.1
Davao 97.4
SOCCSKSARGEN 89.6
ARMM 57.1
2008
PHILIPPINES 93.9
Ilocos 96.9
CAR 92.7
Cagayan Valley 97.0
Central Luzon 95.9
NCR 98.1
CALABARZON 95.7
Bicol 93.9
MIMAROPA 87.4
Eastern Visayas 93.9
Western Visayas 96.1
Central Visayas 97.7
Caraga 100
Northern Mindanao 92.3
Zamboanga Peninsula 90.5
Davao 95.2
SOCCSKSARGEN 94.6
ARMM 58.1
Immunization (BCG)
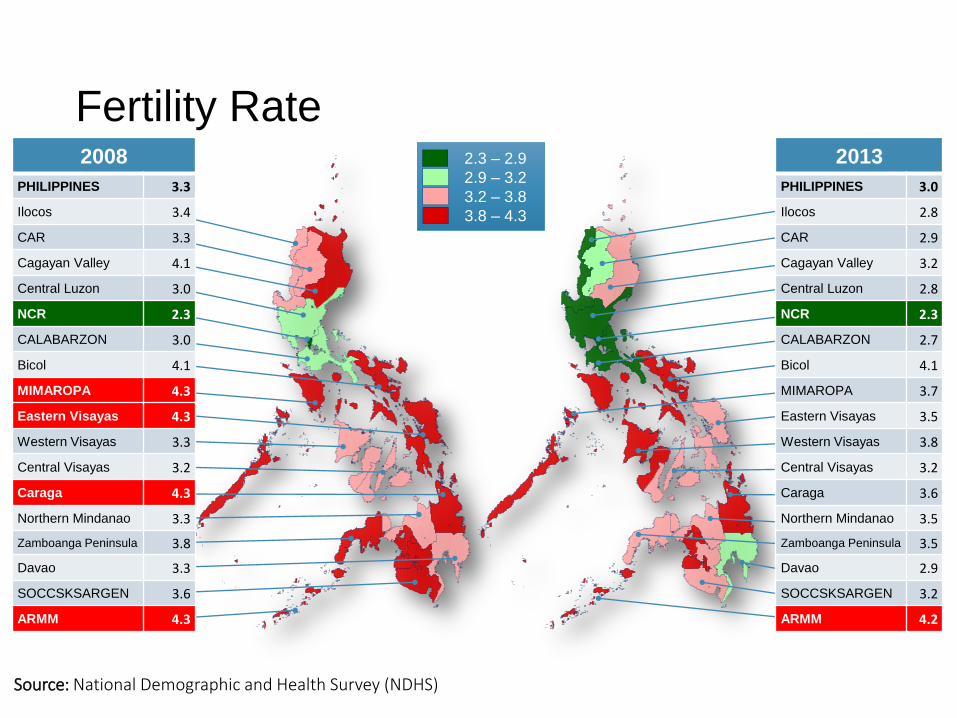
Fertility Rate
Source: National Demographic and Health Survey (NDHS)
2.3 – 2.9
2.9 – 3.2
3.2 – 3.8
3.8 – 4.3
2013
PHILIPPINES 3.0
Ilocos 2.8
CAR 2.9
Cagayan Valley 3.2
Central Luzon 2.8
NCR 2.3
CALABARZON 2.7
Bicol 4.1
MIMAROPA 3.7
Eastern Visayas 3.5
Western Visayas 3.8
Central Visayas 3.2
Caraga 3.6
Northern Mindanao 3.5
Zamboanga Peninsula 3.5
Davao 2.9
SOCCSKSARGEN 3.2
ARMM 4.2
2008
PHILIPPINES 3.3
Ilocos 3.4
CAR 3.3
Cagayan Valley 4.1
Central Luzon 3.0
NCR 2.3
CALABARZON 3.0
Bicol 4.1
MIMAROPA 4.3
Eastern Visayas 4.3
Western Visayas 3.3
Central Visayas 3.2
Caraga 4.3
Northern Mindanao 3.3
Zamboanga Peninsula 3.8
Davao 3.3
SOCCSKSARGEN 3.6
ARMM 4.3

In the past decade, non-communicable diseases have become the leading causes of mortality in the country
Causes of mortality Type of Disease 2000 2001 2002 2005 2006 2007 2008 2009
Diseases of the Heart
Non-Communicable
79.1 80.8 88.2 90.4 95.5 99.7 101.9 109.4 Diseases of the Vascular System 63.2 68.1 62.3 63.8 63.8 65.1 67.2 71.0
Malignant Neoplasms 47.7 48.5 48.8 48.9 49.5 50.1 51.1 51.8
Diabetes Mellitus 14.1 16.0 17.5 21.6 23.3 23.7 25.2 24.2
Nephritis, nephritic syndrome and nephritis 10.4 13.0 14.2 13.8 13.9 15.0
Chronic lower respiratory diseases
Infectious 20.8 21.8 24.3 24.6 24.4 23.9 24.2 24.7
Pneumonia 42.7 43.6 43.0 42.8 41.6 40.1 43.9 46.2
Tuberculosis, all forms 36.1 35.1 35.9 31.2 29.7 27.1 27.2 27.6 Certain conditions originating in the perinatal period MCH-related 19.8 21.8 17.9 14.5 13.8 14.1 13.9 12.5
Accidents 42.4 42.2 42.3 39.1 40.2 38.4 39.3 39
Leading Causes of Mortality, 2000-2009 *Number of Deaths per 100,000 population
Source: Analysis of data from DOH

What are the drivers of the current health status of our country?

Only a third of all provinces meets the bed-to-population ratio
0.00 – 0.49 0.50 – 0.99 1.00 – 1.50 1.51 – 5.00
Source: Bureau of Health Facilities and Services, 2011
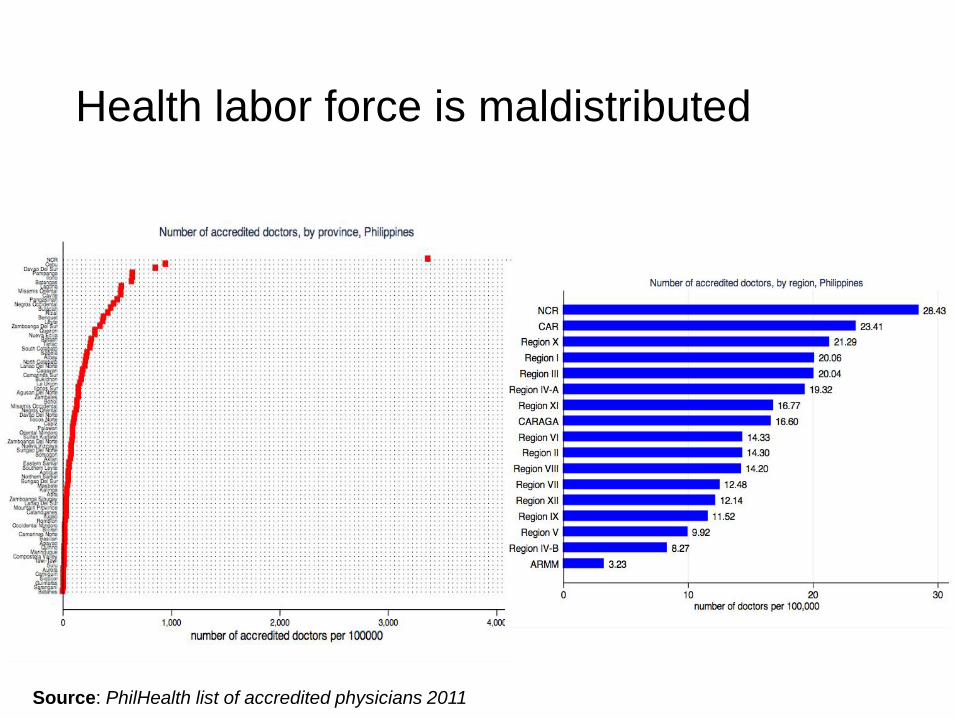
Health labor force is maldistributed
Source: PhilHealth list of accredited physicians 2011

Not all hospitals have X-Ray and Ultrasound Machines
43%
48%
59%
61%
61%
62%
62%
63%
66%
67%
75%
75%
78%
79%
85%
88%
92%
0% 20% 40% 60% 80% 100%
CARAGA
ARMM
REGION VIII
REGION V
REGION II
CAR
REGION XII
REGION IVB
REGION X
REGION XI
REGION VII
REGION IX
REGION VI
REGION I
REGION IVA
REGION III
NCR
Percent of Hospitals with X-Ray
24%
27%
29%
30%
35%
38%
39%
42%
45%
47%
47%
47%
57%
60%
63%
66%
87%
0% 20% 40% 60% 80% 100%
CARAGA
REGION V
REGION VIII
ARMM
CAR
REGION XII
REGION II
REGION IVB
REGION IX
REGION VI
REGION VII
REGION X
REGION I
REGION XI
REGION IVA
REGION III
NCR
Percent of Hospitals with Ultrasound
Source: Estimates were generated using 2011 services and equipment census from DOH

Also, not all hospitals have complete basic emergency equipment
7%
13%
15%
19%
19%
19%
19%
25%
26%
28%
29%
31%
32%
38%
38%
40%
41%
56%
0% 10% 20% 30% 40% 50% 60%
CARAGA
REGION IVB
ARMM
REGION VIII
REGION V
CAR
REGION II
REGION IX
REGION XII
REGION VII
REGION I
REGION VI
PHILIPPINES
REGION X
REGION XI
REGION III
REGION IVA
NCR
Percent of hospitals with complete basic emergency equipment
Source: Estimates were generated using 2011 services and equipment census from DOH
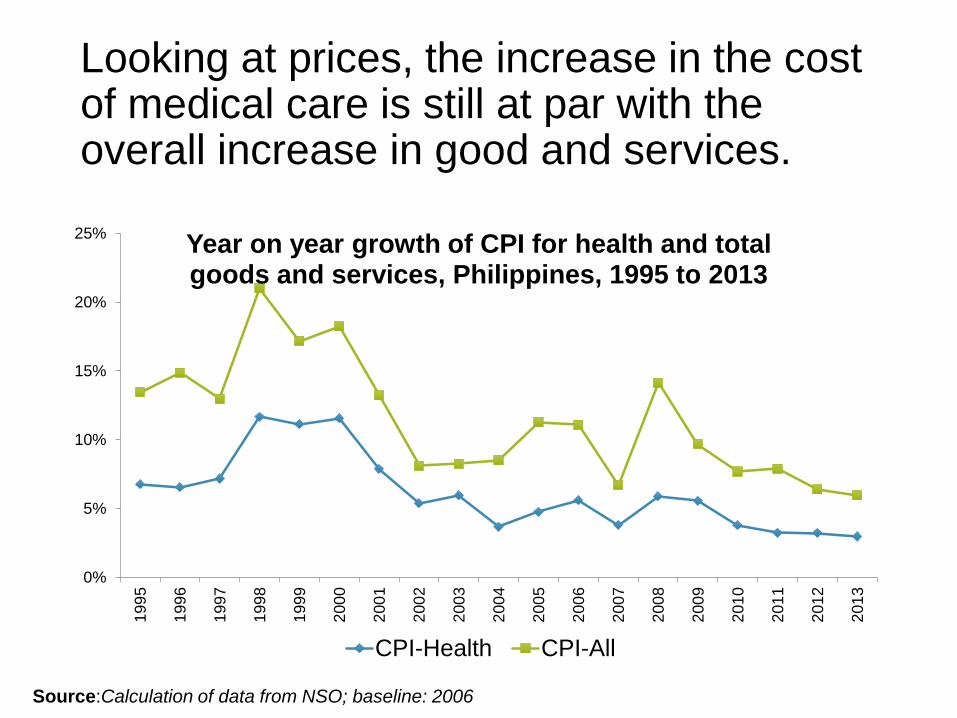
Looking at prices, the increase in the cost of medical care is still at par with the overall increase in good and services.
0%
5%
10%
15%
20%
25%
199
5
199
6
199
7
199
8
199
9
200
0
200
1
200
2
200
3
200
4
200
5
200
6
200
7
200
8
200
9
201
0
201
1
201
2
201
3
Year on year growth of CPI for health and total goods and services, Philippines, 1995 to 2013
CPI-Health CPI-All
Source:Calculation of data from NSO; baseline: 2006
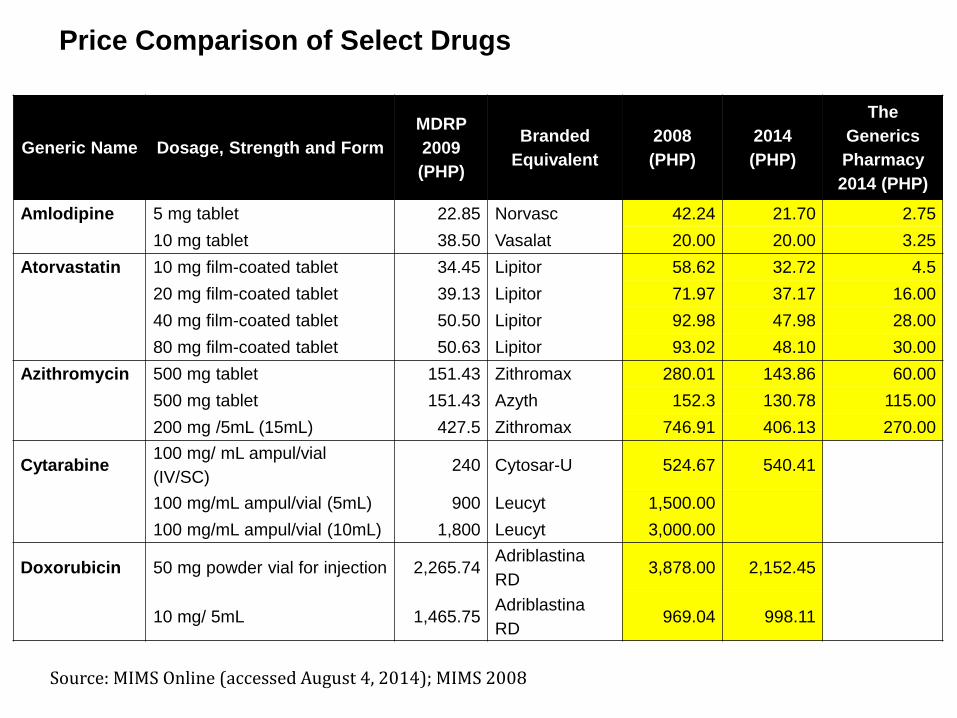
Price Comparison of Select Drugs
Source: MIMS Online (accessed August 4, 2014); MIMS 2008
Generic Name Dosage, Strength and Form
MDRP
2009
(PHP)
Branded
Equivalent
2008
(PHP)
2014
(PHP)
The
Generics
Pharmacy
2014 (PHP)
Amlodipine 5 mg tablet 22.85 Norvasc 42.24 21.70 2.75
10 mg tablet 38.50 Vasalat 20.00 20.00 3.25
Atorvastatin 10 mg film-coated tablet 34.45 Lipitor 58.62 32.72 4.5
20 mg film-coated tablet 39.13 Lipitor 71.97 37.17 16.00
40 mg film-coated tablet 50.50 Lipitor 92.98 47.98 28.00
80 mg film-coated tablet 50.63 Lipitor 93.02 48.10 30.00
Azithromycin 500 mg tablet 151.43 Zithromax 280.01 143.86 60.00
500 mg tablet 151.43 Azyth 152.3 130.78 115.00
200 mg /5mL (15mL) 427.5 Zithromax 746.91 406.13 270.00
Cytarabine 100 mg/ mL ampul/vial
(IV/SC) 240 Cytosar-U 524.67 540.41
100 mg/mL ampul/vial (5mL) 900 Leucyt 1,500.00
100 mg/mL ampul/vial (10mL) 1,800 Leucyt 3,000.00
Doxorubicin 50 mg powder vial for injection 2,265.74 Adriblastina
RD 3,878.00 2,152.45
10 mg/ 5mL 1,465.75 Adriblastina
RD 969.04 998.11
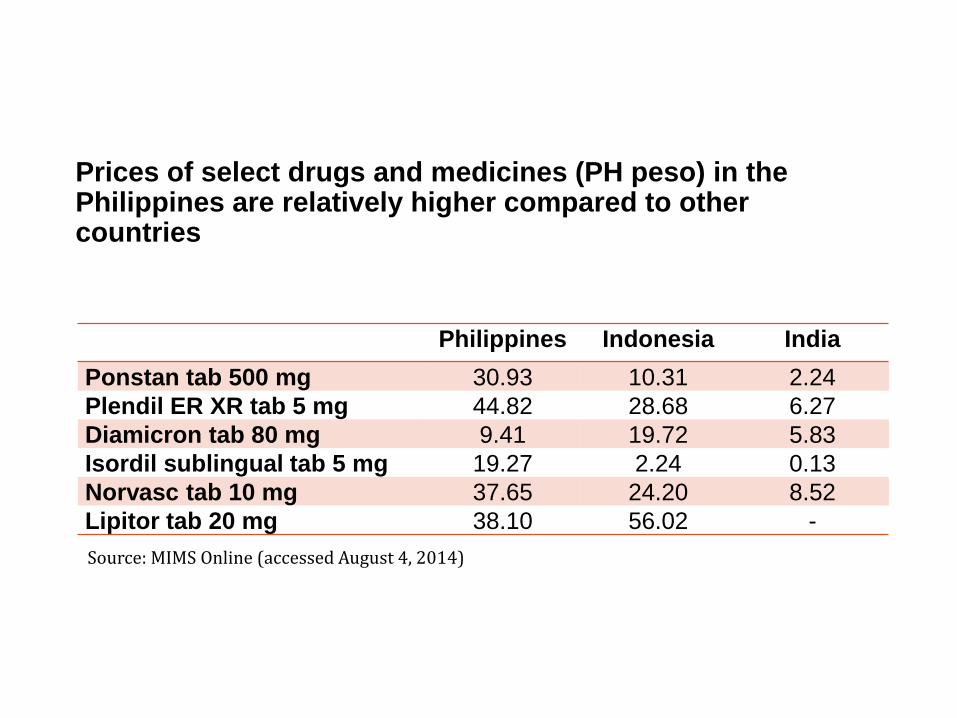
Prices of select drugs and medicines (PH peso) in the Philippines are relatively higher compared to other countries
Philippines Indonesia India
Ponstan tab 500 mg 30.93 10.31 2.24
Plendil ER XR tab 5 mg 44.82 28.68 6.27
Diamicron tab 80 mg 9.41 19.72 5.83
Isordil sublingual tab 5 mg 19.27 2.24 0.13
Norvasc tab 10 mg 37.65 24.20 8.52
Lipitor tab 20 mg 38.10 56.02 -
Source: MIMS Online (accessed August 4, 2014)

PhilHealth coverage stands at 75%* and varies across regions. However, there is no clear pattern of benefit utilization and coverage. Reg X and ARMM: high coverage, low utilization
94%
89%
84%
83%
82%
80%
78%
77%
76%
75%
74%
74%
73%
70%
70%
68%
68% 3.3%
0.0%
1.0%
1.2%
4.8%
3.4%
2.4%
4.0%
3.4%
1.5%
7.4%
1.3%
2.1%
2.2%
2.6%
2.2%
0.5%
0% 1% 2% 3% 4% 5% 6% 7% 8%
0% 20% 40% 60% 80% 100%
NCR
ARMM
Reg IV
Reg XI
Reg X
CAR
Reg VIII
Reg XIII
Reg I
PHILIPPINES
Reg XII
Reg VI
Reg V
Reg VII
Reg IX
Reg III
Reg II
Estimated Benefit Utilization
Coverage Rate
Coverage Rate Estimated Benefit utilization
*Coverage Rate: total number of members and dependents for 2012/total projected population: Source: PhilHealth and projected population from NSO **Number of population who utilized PHIC benefits. Source: Analysis of APIS 2011 data

0.0% 50.0% 100.0%
PHILIPPINES
NCR
CAR
Reg I
Reg II
Reg III
Reg IV-A
Reg IV-B
Reg V
Reg VI
Reg VII
Reg VIII
Reg IX
Reg X
Reg XI
Reg XII
Reg XIII
ARMM
Estimated Support Value*
*Analysis of APIS 2011
Survey data
shows that on
average,
PhilHealth
support value is
at 41.4%.*
SUMMARY
• The Philippines is on track in achieving many of the health-related MDGs.
• Regional disparities are evident in health outcomes.
• Inequities in accessibility, availability and affordability of health services need to be addressed to
• continue the gains that have been achieved.

Thank you