wine makin
HSC Edition No 1 2017Busting the bands Hints and tips for new teachers to maximise student performance in the HSC 5
Fieldwork data Incorporating fieldwork references into HSC answers 9
Ecosystems at risk The role of traditional strategies in managing coral reefs 12
Evaluating Traditional and contemporary management strategies applied to coral reefs 17
Ecosystems at risk Coral bleaching events 23
Introducing People and Economic Activity Advice for those new to teaching senior Geography 29
Classroom activities Inspiration for introducing People and Economic Activity 40
Urban dynamics Sydney: A Tale of Two Cities? 45
Geography Bulletin Past and upcoming editions with HSC relevance 48
HSC preparation Using organisational templates and checklists 53
PROJECTS • REPORTS • RESOURCES • ARTICLES • REVIEWS

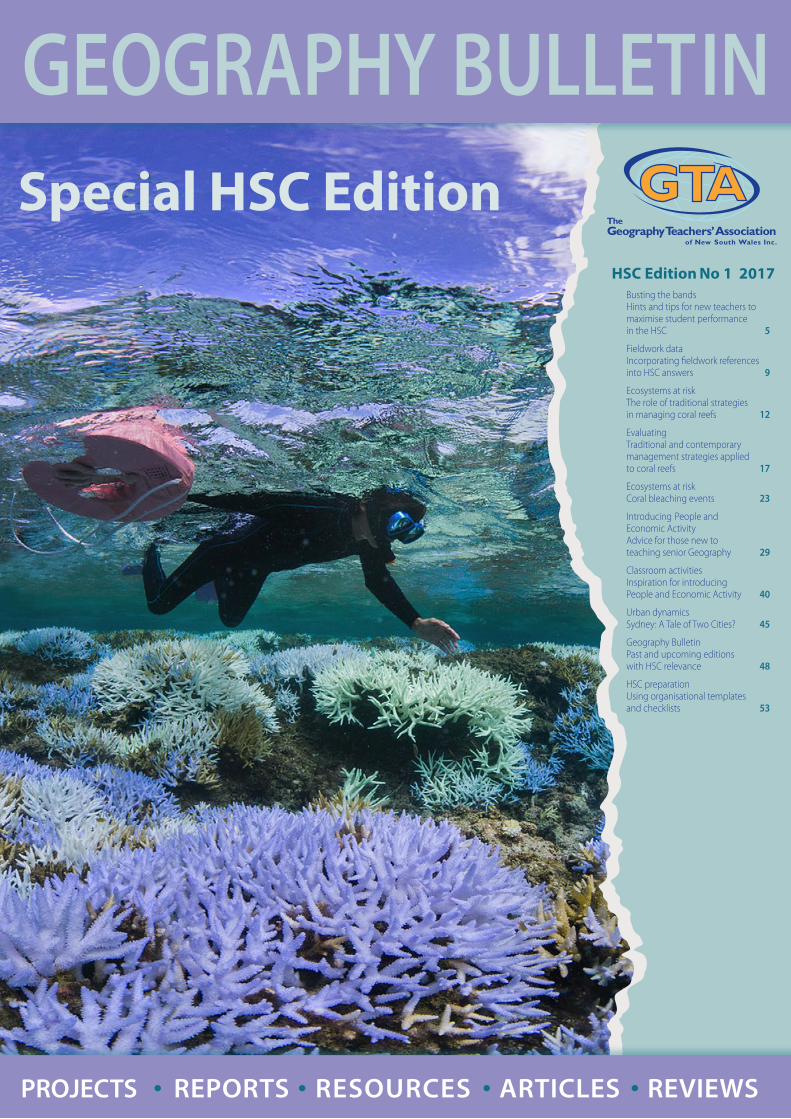
Cover: Okinawa coral beds
President Lorraine Chaffer
Vice Presidents Milton Brown
Susan Caldis
Grant Kleeman
Sharon McLean
Minutes Secretary Milton Brown
Honorary Treasurer Grant Kleeman
Councillors Paul Alger
Karen Bowden
Michael Da Roza (ACT)
Catherine Donnelly
Adrian Harrison
Keith Hopkins
Nick Hutchinson
Grace Larobina
David Latimer
John Lewis
Alexandra Lucas
Martin Pluss
Louise Swanson
Steve Weingarth
Public Officer Louise Swanson
The Geography Bulletin is a quarterly journal of The Geography Teachers’ Association of New South Wales. The ‘Bulletin’ embraces those natural and human phenomena which fashion the character of the Earth’s surface. In addition to this it sees Geography as incorporating ‘issues’ which confront the discipline and its students. The Geography Bulletin is designed to serve teachers and students of Geography. The journal has a specific role in providing material to help meet the requirements of the Geography syllabuses. As an evolving journal the Geography Bulletin attempts to satisfy the requirements of a broad readership and in so doing improve its service to teachers. Those individuals wishing to contribute to the publication are directed to the ‘Advice to contributors’ inside the back cover. Articles are submitted to two referees. Any decisions as to the applicability to secondary and/or tertiary education are made by the referees. Authors, it is suggested, should direct articles according to editorial policy.
© Copyright 2017 Geography Teachers’ Association of New South Wales Inc.
Unless otherwise indicated in an article, non-profit organisations such as schools and universities may make up to 30 photocopies of any article in this journal without obtaining further permission.
EXECUTIVE 2017
GEOGRAPHY BULLETIN
OFFICE OF THE GEOGRAPHY TEACHERS’ ASSOCIATION OF NEW SOUTH WALES
ABN 59246850128
Address: 25 Nyrang Street Lidcombe NSW 2141
Postal Address: PO Box 699 Lidcombe NSW 1825, Australia
Telephone: (02) 9716 0378, Fax: (02) 9564 2342
Website: www.gtansw.org.au
Email: [email protected]
ANNUAL MEMBERSHIP (Subscriptions include GST)
Personal membership $90.00
Corporate membership (school, department or business) $180.00
Concessional membership (retiree, part-time teacher or student) $40.00
Primary corporate membership $50.00
Editor Lorraine Chaffer
Articles and letters should be sent to the Editor: Lorraine Chaffer Email: [email protected]
Design and layout:Jill Sillar, Professional Teachers’ Council NSW [email protected]
ISSN 0156-9236

Geography Bulletin – HSC Edition No 1 2017 1
EDITOR: Lorraine ChafferHSC Edition No1 2017
Editorial Lorraine Chaffer ............................................................................................................................... 2
Busting the bands Hints and tips for new teachers to maximise student performance in the Higher School Certificate (HSC) .............................................................................. 5
Fieldwork data Incorporating fieldwork references into HSC answers ............................................. 9
Ecosystems at risk The role of traditional strategies in managing coral reefs ....................................12
Evaluating Traditional and contemporary management strategies applied to coral reefs ...................................................................................................................17
Ecosystems at risk Coral bleaching events ..............................................................................................................23
Introducing People and Economic Activity Advice for those new to teaching senior Geography .............................................29
Classroom activities Inspiration for introducing People and Economic Activity ................................40
Urban dynamics Sydney: A Tale of Two Cities? ..................................................................................................45
Geography Bulletin Past and upcoming editions with HSC relevance ...................................................48
HSC preparation Using organisational templates & checklists ................................................................53
Advice to contributors ...............................................................................................................63
2 Geography Bulletin – HSC Edition No 1 2017
Lorraine Chaffer, Editor
EDITORIAL
Welcome to this special HSC edition of the Geography Bulletin. The purpose of producing two editions during 2017 is to address increasing demand for guidance by those new to teaching senior Geography and new teaching resources, ideas and strategies to “Bust the bands” by those more experienced in teaching years 11 and 12.
Teachers new to teaching senior Geography need guidance and advice to support their teaching in the absence of updated and contemporary textbook material and confronted by a wealth of online resources that are often not readily organised to match syllabus content and skills.
There is also a restlessness among experienced teachers in regards to the lack progress in the provision of a new senior Geography syllabus and the desire to find new and interesting teaching materials and ideas to invigorate teaching and enhance student interest and progress.
This first HSC edition is a mix of advice and teaching materials to support the teaching of preliminary and HSC skills and content.
Busting the Bands by Matt Carroll gives tips on how to move all students forward whether it be from a Band 2 to 3 or from Band 5 to Band 6. Matt’s comments are based on his experiences teaching and HSC marking.
My article on Integrating fieldwork activities into HSC answers expands on advice provided by Matt, focusing on a common feature of better student responses in the HSC – the integration of fieldword data.
Louise Swanson has directed her passion for coral reefs into three separate, yet connected articles:• The role of traditional strategies in managing coral reefs, • Evaluating traditional and contemporary management
strategies applied to coral reefs • Coral bleaching eventsLouise gives valuable advice and structure that can be applied in other topics where an evaluation style question is common.
In People and Economic Activity: Advice for those new to teaching senior Geography I have provided a set of slides previously used for GTA HSC student lectures. The slides contain suggestions for introducing the topic, given that there is no introductory section in the syllabus. The PDF of the slides will be made available on the GTA website for teachers wishing to use them with their classes.
The following article Inspiration for introducing People and Economic Activity by Alexandra Lucas provides activities that can be used to build student skills and knowledge about economic activity in general to prepare them for answering stimulus based questions in the HSC.

Geography Bulletin – HSC Edition No 1 2017 3
Each year GTANSW produces four editions of the Geography Bulletin. Many contain many articles relevant to senior Geography (although they may have been written initially for the new 7–10 syllabus). I have referred to those published since 2015 in Geography Bulletin: Past editions with HSC relevance.
Marco Cimino has provided an article titled Sydney: A tale of two cities for the topic Urban Places in which he examines the impacts of urban dynamics on the social and cultural structure of the city.
Most teachers use templates and checklists somewhere in their teaching. In Using organisational templates and checklists I have provided some examples to encourage students to become more organised or promote deeper thinking and understanding about the content they are learning. These organisers and lists can be adapted to suit the content of any topic.
Lorraine ChafferPresident GTANSW
Upcoming events to watch for:
• HSC student lectures in June (see information on the next page)
• HSC Teacher 1 Day Conferences in term 4.
• Webinar relevant to HSC skills – Tuesday, 23 May, 4.00 – 5.00pm The Challenging HSC Skills – cross section, gradient, vertical exaggeration and others.
Contribute to the next HSC edition
GTANSW is seeking contributions for future HSC editions of the Geography Bulletin. Contributing to a professional journal is recognised teacher professional learning.
Suggestions for submissions include content or skills based articles on sections of preliminary or HSC topics; classroom or fieldwork activites; assessment tasks and organisational templates or scaffolds.
Your submission will need to contain the following:
– a suitable title plus your name, school and position
– relevant syllabus topic and dot-point/focus area
– references to sources (images, content and factual material or ideas) used throughout
– a brief statement introducing the material
– for assessment tasks, provide a marking guideline or suggested answers or permitted student samples.
Email your submission to the Geography Bulletin Editor. Provide your name address and school details.
You will receive feedback from the editors on your submission, some changes may be suggested or format changed to suit the style of the Bulletin. You will get final approval for what is published.
4 Geography Bulletin – HSC Edition No 1 2017
I wish to attend the HSC Geography Lectures 2017to be held at ........................................................................ on ...................................... (please specify locality and date of lecture you wish to attend)
There will be .................... students attending from our school.
REGISTRATION – by attending teacher
FIRST & SURNAME ………………………………………………………................................................................…
SCHOOL NAME ……………………………………………………………............................................................……
SCHOOL ADDRESS.....................................................……………….......……………………………………….……
SUBURB…………………………….................................................… POSTCODE…………………..................…
PHONE (W)…………...............…… FAX (W)………….......................... MOBILE ……........……….........……
EMAIL ………………………………………………...............… MEMBER OF GTA …….YES /....... NO
Your email required to receive link to lecture notes If Yes provide member # .....................
Please make cheques payable to: Geography Teachers’ Association of NSW Inc
OR
Charge $........................... to my credit card: Mastercard Visa
Card Number: ....................... /....................... /...................... /...................... Expiry date: ..... /.....
Name on card: .........................................................................................................
Signature:...................................................................................................................
PLEASE EMAIL YOUR FORM – attach a list of student names AND name(s) of teacher attending to [email protected]
ENQUIRIES: Phone: 02 9716 0378, Fax: 02 9564 2342 Email: [email protected] THIS FORM BECOMES A TAX INVOICE – ABN 59 246 850 128
GTA NSW respects your privacy. Any data collected is for the purpose of registration only.
HSC GEOGRAPHY LECTURES 2017
DATES AND LOCATIONS*
Monday 5 June – Wollongong University of Wollongong (Room 20.3, Northfields Ave, Gwynneville)
Wednesday 7 June – Newcastle Callaghan Secondary College, Newcastle (Jesmond Campus, Janet St, Jesmond)
Tuesday 13 June – Sydney CBD St Andrews Cathedral School, Sydney (Ground Floor, 51 Druitt St, Sydney)
TIME 9.00am – 3.00pm, registration from 8.30pm * Please check for updates on – www.gtansw.org.au
Once again this year, GTANSW has organised lectures for HSC Geography students and teachers. The presenters are experienced educators and HSC markers. The sessions cover: Ecosystems at Risk, Urban Places, People and Economic Activity and Geography skills and exam advice.
ONLINE REGISTRATION CLICK HERESupply a list of attendees with your school’s registrationRegistration closes one week prior to each event Students are encouraged to bring writing equipment and paper or
tablet devices to mind map key concepts and advice.
COST (inc GST)
$30 per student for member schools/teacher$50 per student for non-member schools/teacherTeacher attending with students admitted FREE.
Teachers attending with students will receive a link to lectures presented on the day for distribution to students after the event.
Teacher attending without students: $80 member and $100 non-member (This event contibutes 5 hours self identified Professional Learning)

Geography Bulletin – HSC Edition No 1 2017 5
BUSTING THE BANDS Hints and tips for new teachers to maximise student performance in the Higher School Certificate (HSC)
Matt Carroll, Engadine High School
Firstly, ‘Busting the Bands’ is the process of implementing techniques and strategies into our Geography lessons to move students up into the next Band. Personally, there is nothing more frustrating than seeing students score 79 or 89 in the HSC. This is a highly valuable method of boosting the profile of Geography in our schools whilst creating a dominant culture that will ultimately boost our subject numbers. If we can get this right, we can certainly attract talented students into our subject and work to target Band 4-6 in the HSC. I am certainly one who in my initial years of teaching had been guilty of measuring my success on the number of Band 5’s or Band 6’s in the HSC. I have slowly learnt that it’s not always about Band 6’s. Moving a student from a 60 to a 75 or from a 77 to an 85 is far more rewarding. So how do we hone in on our 79 and 88 kids who could so easily be a Band 5 and Band 6? Identifying what our top students are doing right and teaching the knowledge and skill to your cohort is imperative. One of the most effective starting points is to identify the subjects and the relevant subject teachers in your school that have scored or continue to score quality results in the HSC and ask to sit in on lessons where possible. Over the past 12 months our school has established a ‘Bowerbirds’ program in order to create meaningful whole staff discussions about the teaching techniques or methods being used within our school that maximise student performance in the HSC. As our HSC results continue to improve each year, we rarely stopped and shared meaningful classroom experiences and utilised the talent we had (both experiences and early career teachers).
Busting the Bands should be a focus from day one in Year 11 and could easily form the basis of key learning in numerous lessons throughout the week. Its really not about starting again from scratch, its about making small changes to the way we sometimes deliver content and engage our students in collaborative tasks within and outside of the classroom in Geography.
The following hints and tips are designed for those teachers who are teaching HSC Geography for the first time or who are simply looking for some inspiration on revitalising your approach to the HSC. These
are techniques and activities that should build the foundations of your lessons to ‘Bust the Bands’ for our Geography students.
1. Know the syllabus and how to scaffold student study notes that mirror HSC questions
When I first picked up the syllabus and began planning for my first Geography class, its safe to say I had no idea about what some of the dot points actually meant! I learnt this the hard way, when marking the HSC for the first time. I marked for tw weeks on a question I had almost taught completely wrong. The lesson here is always seeking professional advice from HSC teachers either by email or through social media. It does take a complete mastery of the syllabus to feel confident that your students know their content and are able to successfully respond to questions in assessment tasks and in the HSC exam. It is absolutely essential that teachers explicitly teach the syllabus, have their students scaffold their study notes under the relevant headings and subheadings and deconstruct each syllabus dot point to develop a deeper understanding of the key concepts. Try teaching strategies such as syllabus jigsaw or even ‘speed dating’ with the syllabus and consider prediction games to breakdown the syllabus dot point. Ask the students to take notes firstly on ‘what does this syllabus dot point actually mean’ and ‘how do you successfully demonstrate your knowledge and understanding of these concepts’. Before the TRIAL and HSC students should be able to rewrite the syllabus word for word and be shown HSC style questions and immediately match up the correct syllabus dot point and relevant content. All to often, good quality students are completely misinterpreting questions in the HSC and is the best way to ‘bust the bands’.
2. Teach students to decode questions and consolidate their knowledge using ‘dirt, grass and sky’ concepts
Many of you may already be familiar with ALARM and actively utilise the tools and resources to maximise student marks in extended responses. This method simply breaks down questions into ‘dirt’ (identify,
6 Geography Bulletin – HSC Edition No 1 2017
BUSTING THE BANDS
outline), ‘grass’ (explain, describe) or ‘sky’ (analyse, evaluate, justify). Teach students how to flag the higher order questions in exams and understand that questions like these will firstly require some dirt, then some grass and finish with the sky. Many students simply go to the sky, without building upon the necessary content to form their argument, or fail to ‘evaluate’ at all, restricting their marks to a C range response. In addition to this, I have found it useful to provide students with a practice exam (this could be a HSC exam or TRIAL paper). Students then read the entire exam and flag the Band 5 and Band 6 questions. Let’s face it; every exam has at least one question that throws our students. The more experience they have decoding questions and identifying where they will need to take more time and care could prove effective in maximising student performance in Geography.
3. ‘Speak Geography to Geographers’ This has been the single best advice as a new HSC
teacher. Its what makes our subject unique to all others and it is imperative that students speak the language of Geography in their responses. Terminology, statistics, fieldwork and media are what I feel are the four biggest contributors to moving our students into the next band. Each syllabus dot point should have its own unique set of notes on these four aspects of Geography and it is these students responses that really do stand out in the marking process, where they are not simply regurgitating content form class or from the textbook, instead they are demonstrating higher order concepts that are contemporary. Consider playing games in class with terminology and forming micro-groups of students that work with key terms from the three core topics.
4. Use contemporary content to engage your students and to push the high achievers
Geography is a dynamic subject and it is vital that we teach students using contemporary examples such as Brexit and its potential impact on the European subsystem or London as one of the ‘Big 4’, or even its impact on viticulture and the tourism industry. Additionally concepts such as ‘Connectography’ (see TED talk Parag Khanna) are contemporary ways of understanding the changing nature and character of both world cities and megacities, in addition to the creation of dominant clusters of innovation and decision-making through cities growing ‘spheres of influence’. For those studying the Great Barrier Reef, showing students the new science on ‘pulsed inflation’ (ABC Catalyst) or the Outlook Report
would also develop a deeper understanding of the contemporary impacts on the reef and could enable students to ‘bust the bands’ in an essay response. If this seems all to much, maybe even consider a media journal where students could be finding and analysing these additional sources and adding them to their study notes themselves.
5. Sample responses Most of our students are visual learners and need to
constantly look as benchmark responses so they can see how they can constantly improve their writing. Once you have a HSC class up and running, keep samples of every task from a range of students and build your portfolio. If this is not possible, or you are starting from scratch, use the ARC website, write them yourself or ask for help from other HSC teachers online. One useful example could be
‘Know Your Grade Ranges’. As a means of applying what they’ve learnt/revised, student’s work in groups to construct responses that fit into different grade ranges (A–E). One group could be in charge of the A-range, another the B-range, and so on. The teacher works with groups to ensure that they are accurate, and then the class discusses each grade sample (what makes it a certain grade, how to ‘bust the next band’, etc.). The C and B-grade sample could be collectively improved if needed, then shared as a class resource. Sometimes you could literally start a dot point by showing students the end result in the form of an essay or short answer, and then unpack the key components of a quality response. They could then mind map the key aspects of the dot point before they have even learnt the content.
6. Peer marking I admit, this does take some time to establish with
a HSC class, especially for those that are not open to sharing responses. This is the best way of sharing better response with the class and providing students with the opportunity of seeing what their peers are writing. I have found that setting an occasional task for homework or under exam conditions in class and then allowing students to move around the room, spending a few minutes at each students response, highlighting key terms, statistics and leaving feedback is a powerful way of students reading multiple samples to broaden their skill set. This is one way of building an unstoppable classroom culture of collaboration, which is the driving force of a quality cohort.
Geography Bulletin – HSC Edition No 1 2017 7
7. Gamification This is a great way to consolidate student learning
in HSC Geography. Using Kahoot, Quizlet, prediction bingo and speed dating are just some strategies you could utilize to ‘bust the bands’ in Geography. For example, with speed dating, students are allocated topic areas, ideas, or syllabus dot points to revise in depth and detail, possibly with a set of questions. The class ‘speed dates’ through these topics/dot points so that they revise content through a peer – a good way to refresh, move around, and get talking. Students could then summarise their speed dating talk and add to a class set of study notes (perhaps a Google Doc).
8. Pick good case studies and master your knowledge of the subject content
It seems pretty simply, but so many teachers simply choose the safest option, or run with what they have notes on. Chose a case study that you, first and foremost are absolutely passionate about and are highly skilled. This will give your students the best opportunity to feed off your enthusiasm and this will transfer into quality assessment. Ask online for alternative case studies and even swap notes with another teacher. This seems fairly obvious, but ensuring your students have the best possible access to the top bands is imperative. Making sure your case study successfully applies to all the syllabus dot points is really important. Be careful when choosing a ‘local case study’ of an Economic Activity, ensuring that is does not operate in complete isolation and is affected in some ways by global changes. Another key point would be to ensure two ecosystems have ‘traditional’ management associated with it and that they are different biomes. I always feel that good case studies should also have a wide range of reading online for students to seek additional sources. This will challenge the higher achievers and ensure that students are able to extend themselves above your classroom content and the textbook.
9. Visual learning and fieldwork Teachers need to invest time into establishing
fieldwork where possible. Fieldwork allows students to ground source their classroom content and is a method not being utilised to its full potential in the
BUSTING THE BANDS
HSC. Teach students explicitly how to write about fieldwork in written responses, which go well beyond just having ‘fieldwork, 2017’ in brackets. Consider using an observation or measurement from fieldwork such as a cross-section or transect in paragraph form and how it demonstrates ‘human impacts’ or a ‘rapid rate of change’ in an ecosystem such as a coastal dune. You could even get creative and use virtual fieldwork if your case study is a global example such as the Amazon Rainforest or the Everglades. If we invest so much time planning fieldwork, we really need to utilise it to its potential in the HSC exam. It is a sign of ‘good geography’ for HSC markers and can ‘bust the bands’ for our students.
10. Networking Sharing resources, ideas and teaching strategies is
essential to building teacher confidence in preparing students for the HSC. Joining professional associations such as GTA, attending conferences or workshops, sharing on social media forums such as Twitter and Facebook and HSC marking provide the best networking opportunities. Students can also be given opportunities to network with teachers and other students at events such as HSC student lectures and other revision forums.
Editor’s note: In 2016 Matt presented at the GTANSW HSC Student Lectures on Ecosystems at Risk. His specific advice on how to “Bust the Bands” for this topic were extremely well received.
A PPT slide from Matt Carroll’s HSC lecture on Ecosystems at Risk
8 Geography Bulletin – HSC Edition No 1 2017
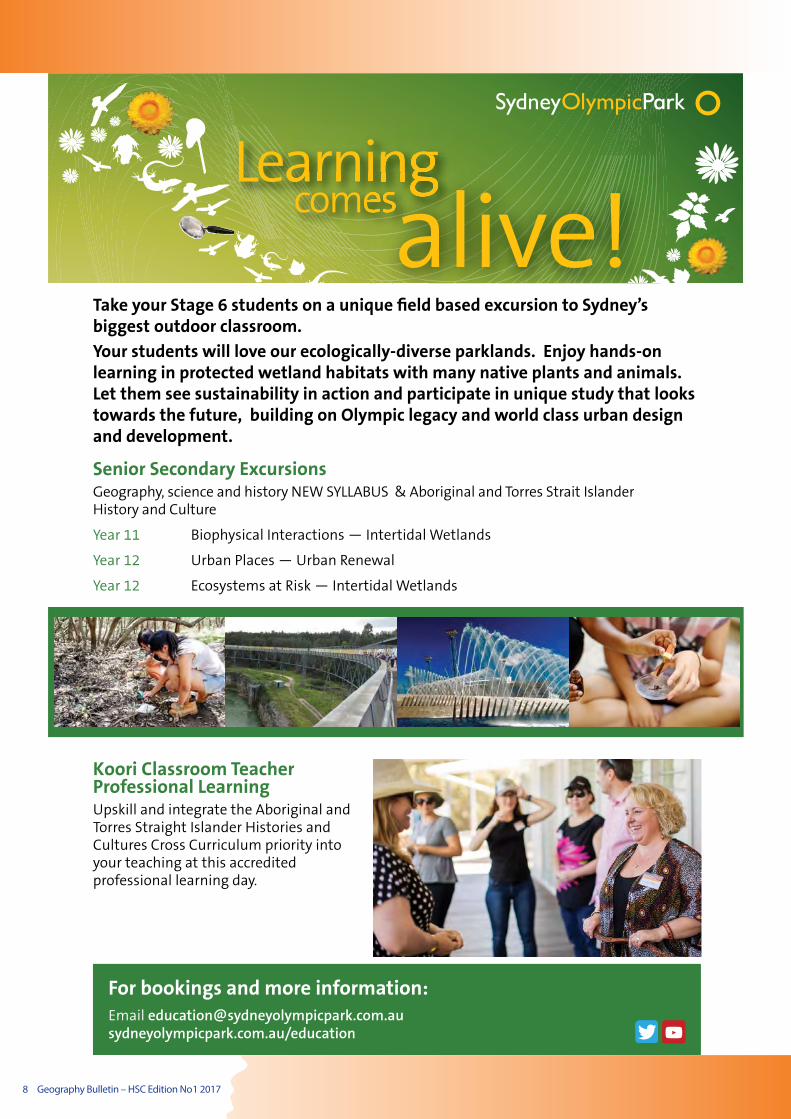
Take your Stage 6 students on a unique field based excursion to Sydney’s biggest outdoor classroom.
Your students will love our ecologically-diverse parklands. Enjoy hands-on learning in protected wetland habitats with many native plants and animals. Let them see sustainability in action and participate in unique study that looks towards the future, building on Olympic legacy and world class urban design and development.
Senior Secondary ExcursionsGeography, science and history NEW SYLLABUS & Aboriginal and Torres Strait Islander History and Culture
Year 11 Biophysical Interactions — Intertidal Wetlands
Year 12 Urban Places — Urban Renewal
Year 12 Ecosystems at Risk — Intertidal Wetlands
Koori Classroom Teacher Professional LearningUpskill and integrate the Aboriginal and Torres Straight Islander Histories and Cultures Cross Curriculum priority into your teaching at this accredited professional learning day.
www.sydneyolympicpark.com.au/education
Sign up to our Learning Comes Alive e newsletter
Book your sports programs and sports carnival at Sydney Olympic Park
Book your sports carnival at Sydney Olympic Park Athletic Centre
Book your sports programs and sports carnival at Sydney Olympic Park Aquatic Centre
Book your sports programs and sports carnival at Sydney Olympic Park Aquatic Centre
Book your sports programs and sports carnival at Sydney Olympic Park
Refer a friend and get 10% off your next excursion
Book your sports carnival at Sydney Olympic Park Athletic Centre
Accredited teacher professional learning workshops. Book now
30 hands-on unique curriculum-based nature excursions for K-12. Book now
30 hands-on unique curriculum-based nature excursions for K-12. Book now
30 hands-on unique curriculum-based nature excursions for K-12. Book now
547 x 82 px email sig nature
Wetland Education and Training programs
Wetland Education and Training programs
For bookings and more information:Email [email protected] sydneyolympicpark.com.au/education

Geography Bulletin – HSC Edition No 1 2017 9
Incorporating fieldwork references into HSC answers
Lorraine Chaffer President GTANSW
Geography Education Consultant
FIELDWORK DATA
Better HSC answers integrate information obtained during fieldwork activities and from the examination stimulus booklet.
Students often forget to do this unless they have completed post fieldwork activities that require linking fieldwork data to syllabus content.
A valuable exercise is to provide templates, scaffolds, close activities or example that illustrates how this can be achieved. Gradually give students less guidance as they develop the skill of supporting written answers with fieldwork data.
Fieldwork must be seen as an essential source of topic content and therefore an important inclusion into written responses. This skill should be developed during the Preliminary HSC year. The following examples illustrate close activities, paragraphs in which fieldwork data is integrated and targeted questioning.
EXAMPLES USING PORTERS CREEK WETLAND (Ecosystem case study)Nature and functioning of the wetlandExample 1: Biosphere and high levels of biodiversityDuring fieldwork to PCW observations of the biodiversity in the wetland were made. Several species of paperbark trees (Melaleuca) were identified, and photographed, such as ……………, ………………, ……………… Other species of plants were observed and recorded including the Woollybut and Swamp Mahogany trees, bullrushes, vines and small floating plants called ………………… Insects, especially mosquitoes, and spiders were in abundance, while dip netting showed a small amount of aquatic biodiversity including …………………… and …………………….
Observations of canopy cover and tree height were used to classify the vegetation community as a forest.
Example 2: Interactions between biosphere, hydrosphereA transect constructed in the wetland during fieldwork activities revealed the changes in vegetation communities in response to the hydrology in different parts of the of the wetland. In the drier, outer sections
species such as ………. were observed while in the sections where water covered the surface, plants such as mosses, ………… (floating plants) and ferns were abundant under a canopy of mainly paperbark trees.
Example 3: LithosphereA dumpy level was used to determine the gradient of the wetland. The result showed a very low gradient moving inland from the perimeter confirming the description of the site as a shallow basin. The land dropped only …….… over a distance of …………
Soil testing revealed a high clay content which increased moving deeper into the basin. Fine sediments such as clay are transported during flood times and deposited on the floor of the wetland helping to create an impervious lining that holds water, an important function of wetlands such as PCW.
Example 4: Post fieldwork photo interpretation Examine each photograph. Students answer the questions:What did we do here?
What fieldwork technique or equipment did we use?
What did I learn?
I could use this information when writing an answer about ………
Write one factual statement linked to syllabus content beginning “During a fieldtrip to ………”
Note: This could be organised into a table.
Collecting water samples from a constructed wetland. (Photos L Chaffer)
10 Geography Bulletin – HSC Edition No 1 2017
FIELDWORK DATA
Observation and measurement of features of a wetland ecosystem at risk. (Photos L Chaffer)
Human impactsExample 5: Human interactions
Water testing carried out at Fishburn drain, a stormwater outlet at Watanobbi, a suburb adjacent to the wetland, revealed high levels of phosphorus, Nitrogen and suspended sediment. (Readings included …. compare to normal readings). High nutrient levels and excess water entering PCW at this site are thought to be responsible for the dieback of Woollybut trees observed near the testing site. Wollybut trees like conditions that are dry for part of the year and stormwater runoff changes the natural hydrology. If species are lost, biodiversity decreases, as does resilience.
OR create a small table with a reference
Table 1 shows …………….
Table 1: Water Quality Testing at PCW
Component PCW Acceptable level
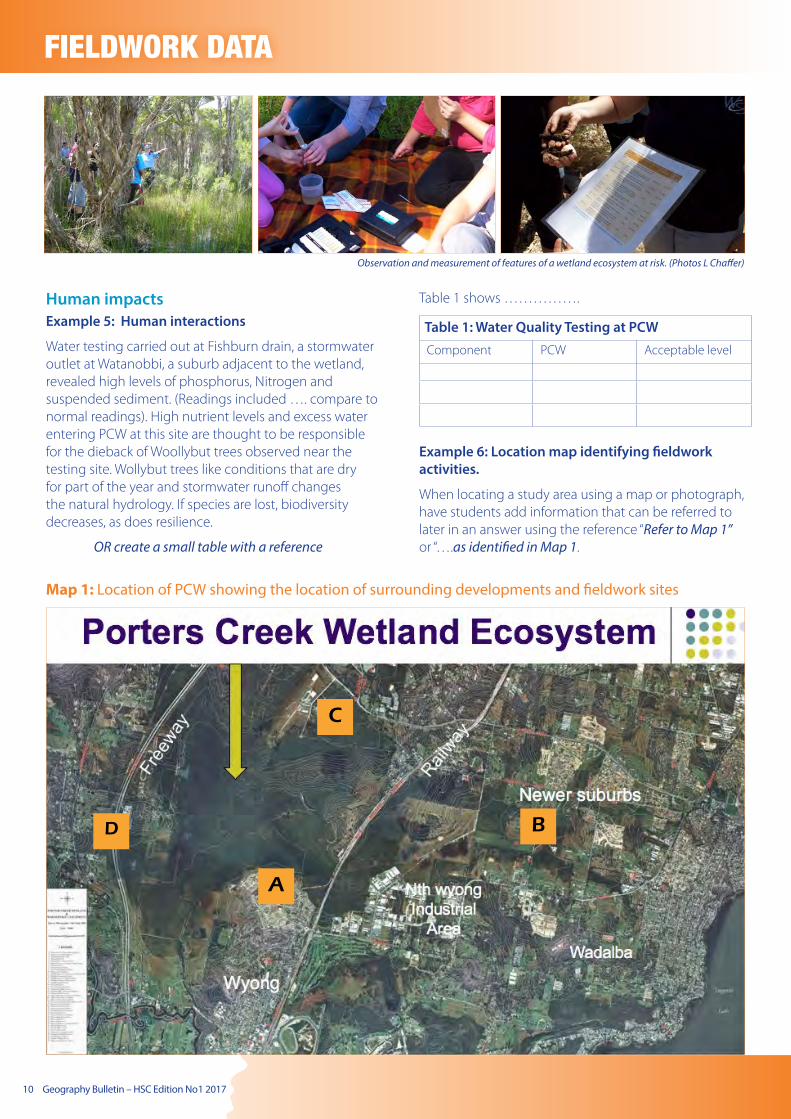
Example 6: Location map identifying fieldwork activities.
When locating a study area using a map or photograph, have students add information that can be referred to later in an answer using the reference “Refer to Map 1” or “….as identified in Map 1.
Map 1: Location of PCW showing the location of surrounding developments and fieldwork sites
A
D
C
B

Geography Bulletin – HSC Edition No 1 2017 11
FIELDWORK DATA Information relating to the fieldwork can be part of the legend of the map OR be referred to in the body of an answer, for example:
Human impacts on PCW observed during fieldwork activities can be seen in Map 1 (Sites A, B, C & D). At A … Sample map legend:
A – Water quality testing at Fishburn drain and observation of tree diebackB – Rapid suburbanisation increasing hard surfaces and runoff / constructed wetlands to slow runoff and improve water qualityC & D – Car and plane fumes, noise (Decibel metre readings), runoff (water infiltration test on different surfaces)
NOTE: When diagrams, maps or tables & graphs are included in student answers reference must be made in the text. Careful labelling eg Map 1, Table 2 etc makes referencing easier.
Underling or highlighting the word fieldwork in an answer draws a markers attention to the fact students
have made this reference. The same applies to the use of the stimulus booklet.
A variety of fieldwork activities Apply the same activities to fieldwork on Urban places and People and Economic Activity
Change the scaffolds or questions to suit the nature of the fieldwork and activities undertaken
The following examples of fieldwork activities focus on observation, recording qualitative data and interviews. It is equally important to refer to fieldwork data for these topics as it is when integrating statistics and data obtained using fieldwork equipment.
It is important that throughout Stage 6 students undertake a variety of fieldwork activities that build skills and develop the ability to use fieldwork equipment. This will increase the opportunities for answering skills questions based on fieldwork and applying knowledge and understanding of fieldwork methods to different scenarios and examples in an examination paper or assessment task.
Example 7: Reference to observations and interviews
An interview with one of the last remaining residents at Millers Point conducted during a fieldwork visit highlighted …………….
During a whale watching fieldwork activity at Port Stevens …………… were observed.
When whales appeared strategies to ensure boats complied with maritime regulations regarding distances from boats were explained by the skipper and seen first hand as tour boats frequently moved their locations.
Above: Whale watching – an Economic Enterprise Economic activity – tourism / ecotourism (Photos L Chaffer)
Left: Urban change at Millers Point and Barrangaroo (Photos L Chaffer)

12 Geography Bulletin – HSC Edition No 1 2017
ECOSYSTEMS AT RISK
The role of traditional strategies in managing coral reefs
Louise Swanson, Deputy Principal, Sydney Secondary College, Balmain Campus
GTANSW Councillor
The Stage 6 Geography syllabus requires that students examine two case studies of Ecosystems at Risk. This article examines the case study of coral reefs and focuses on traditional management strategies in place to address the natural and human impacts on coral reefs. It will draw on examples of coral reefs around the world.
Traditional management practices to protect coral reefsMany traditional cultures see themselves as the custodians of the land and water, and its plants and animals. Many indigenous peoples have a profound spiritual attachment to the environment that is central to their culture and identity. Mythical stories and relationships emphasise the significance of particular sites and species and as such these are particularly important for conservations and protection. Coupled with this, many indigenous cultures have social and governmental structures that value the authority of elders of the community, who hold the ecological knowledge that enable their communities to survive and flourish. Traditional management practices tend to be simple, practical and encourage conservation and preservation.
Some common underlying concepts in indigenous cultures are:
• Subsistence – traditional, indigenous communities are self sufficient in that they are able to rely on the environment to provide for their basic needs such as food or shelter.
• Sustainability – indigenous communities are reliant on the continued access to environmental resources for their survival. As such, the concept of sustainability underpins the activities and management strategies of these communities.
• Custodianship – communities, and individuals have a responsibility to act as guardians or caretakers of the environment and the plants and animals within it.
• Reciprocity – communities are built on the concept that families and individuals will pay back deeds or goods which have been given to them. Borrowing and sharing are basic principles:“Today you, me tomorrow”. Sharing resources ensures future security.
Traditional ecological knowledge (TEK)Traditional management strategies are based on cultural knowledge that has been gained and passed on over generations through stories, ceremonies and rituals. This cultural knowledge is based on experiences, traditions and beliefs of the indigenous culture. Many indigenous cultures have beliefs of ancestor beings and creation stories which are integrally entwined with elements of the environment. As such, many indigenous cultures believe that aspects of the environment have sacred, spiritual significance. This is significant in that it contributes to the conservation ideology of many traditional indigenous cultures. Environmental knowledge held by these cultures includes counting and predicting seasons, knowledge of the reproduction cycles of species and knowledge of moon cycles, winds and seasonal availability of different species. This knowledge is used to ensure the sustainability of coral resources.
The Convention on Biological Diversity recognises the significance of traditional knowledge in Article 8(j):
“Each contracting Party shall, as far as possible and as appropriate:
Subject to national legislation, respect, preserve and maintain knowledge, innovations and practices of indigenous and local communities
Geography Bulletin – HSC Edition No 1 2017 13
ECOSYSTEMS AT RISK embodying traditional lifestyles relevant for the conservation and sustainable use of biological diversity and promote their wider application with the approval and involvement of the holders of such knowledge, innovations and practices and encourage the equitable sharing of the benefits arising from the utilisation of such knowledge innovations and practices.”
Controlled access to reefsAccess to reef resources can be restricted by customary tenure arrangements. The right to fish in a particular area is controlled by a clan, chief, or family who regulated the exploitation of their own marine resources. Areas of land and water are owned by particular groups or communities, and administered under customary law. Customary tenure is the primary ownership in many Pacific Islands including Papua New Guinea, Vanuatu, Fiji, the Solomon Islands and Samoa. Tribes or communities have rights over particular reefs, and people are granted fishing rights in specific areas of the reef at specific times. Local knowledge of the seasons, spawning sites and times, phases of the moon and tides, is used to make decisions about appropriate use of reef resources at different times. Due to only one group using the reef resources at any one time it is easy to monitor use and its impact. As a result, this traditional practice is very effective for small communities. A factor which limits its effectiveness is use of reef resources by traditional owners in conjunction with other users such as commercial fishers who do not abide by the same customary laws and restrictions.
Fishing techniquesTraditional fishing techniques and tools are fairly labour intensive but effective in catching fish and other marine organisms for consumption. They are relatively low intensity, small-scale, and only allow for limited removal of species. Fishing instruments include long multi-pronged spears, nets, fish traps and barbed harpoons with detachable heads. Underpinning philosophies tend to encourage conservative harvesting, using only what you need and preserving what you can, and care not to overfish. Rather than targeting individual species
for consumption, a variety of species are intentionally targeted when fishing, so there is little impact on any one species. Limits on the size of fish is common to discourage the removal of small organisms and ensure future numbers. As such, these techniques are in line with the subsistence lifestyle of indigenous cultures, where communities only take as much as they need. However, in some communities, dolphins are hunted for food, and their teeth are used as currency. Turtle eggs and meat are considered a delicacy and consumed on special occasions. For special events like wedding or funerary celebrations increases in marine catches are commonplace.
Totems A totem is an animal or natural figure that a clan or tribe believes spiritually defines them. Each clan holds responsibility for looking after the totem and natural features connected to them, to ensure their survival. These spiritual emblems can’t be hunted or killed. Indigenous culture around the world have a range of terms for totems and their relationship with them.
TaboosTaboo (or tapu) areas are sites where hunting or fishing is prohibited or highly restricted, and there are prohibitions of consumption from these areas. Prohibitions include access to and exploitation of resources within culturally significant geographic areas. This provides protection for these areas and the species within them. Some species can be taboo as well, meaning that these can not be killed.
Nomadic lifestyleMany traditional indigenous cultures were hunter-gatherer nomads, and groups generally moved on regularly, allowing areas to regenerate and species to replenish. The lifestyle of many traditional, indigenous cultures limits the amount of organisms that were removed due to the issue with storing food. The stress placed on ecosystems was limited as a result of maintaining relatively small population levels and relatively low-level technology so it did not place stress on the ecosystem.
14 Geography Bulletin – HSC Edition No 1 2017
ECOSYSTEMS AT RISK Traditional management practices in action
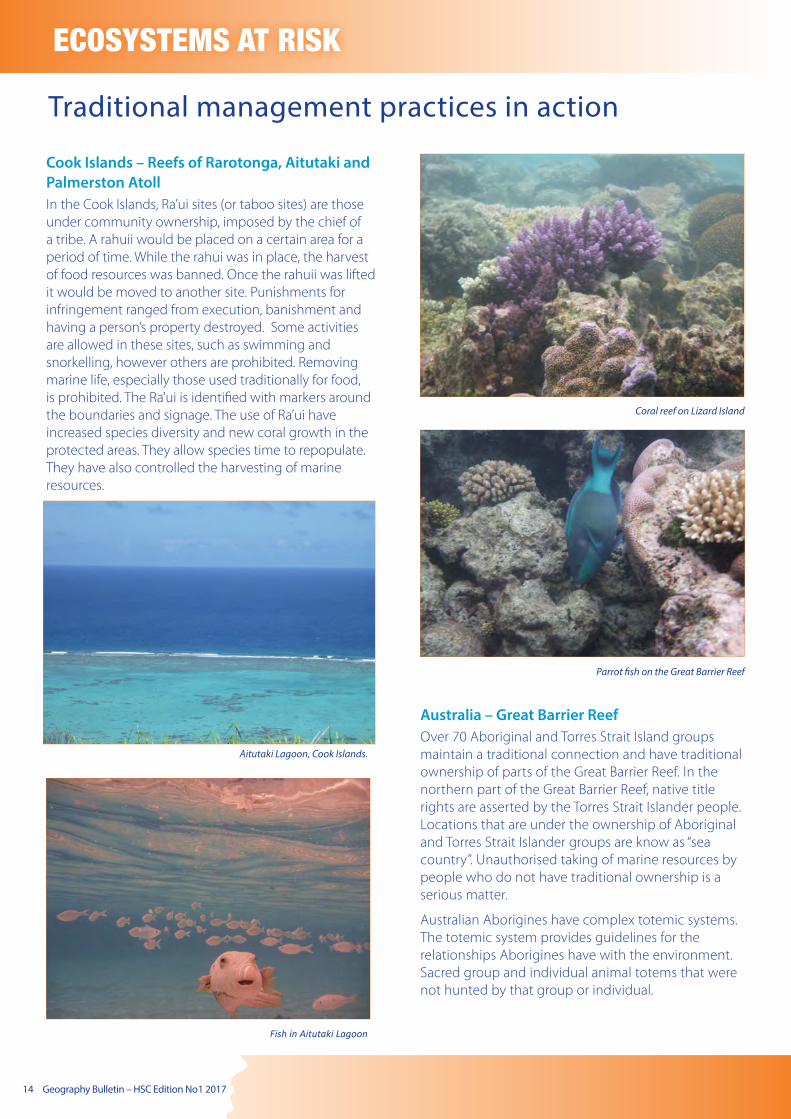
Cook Islands – Reefs of Rarotonga, Aitutaki and Palmerston AtollIn the Cook Islands, Ra’ui sites (or taboo sites) are those under community ownership, imposed by the chief of a tribe. A rahuii would be placed on a certain area for a period of time. While the rahui was in place, the harvest of food resources was banned. Once the rahuii was lifted it would be moved to another site. Punishments for infringement ranged from execution, banishment and having a person’s property destroyed. Some activities are allowed in these sites, such as swimming and snorkelling, however others are prohibited. Removing marine life, especially those used traditionally for food, is prohibited. The Ra’ui is identified with markers around the boundaries and signage. The use of Ra’ui have increased species diversity and new coral growth in the protected areas. They allow species time to repopulate. They have also controlled the harvesting of marine resources.
Fish in Aitutaki Lagoon
Aitutaki Lagoon, Cook Islands.
Australia – Great Barrier ReefOver 70 Aboriginal and Torres Strait Island groups maintain a traditional connection and have traditional ownership of parts of the Great Barrier Reef. In the northern part of the Great Barrier Reef, native title rights are asserted by the Torres Strait Islander people. Locations that are under the ownership of Aboriginal and Torres Strait Islander groups are know as “sea country”. Unauthorised taking of marine resources by people who do not have traditional ownership is a serious matter.
Australian Aborigines have complex totemic systems. The totemic system provides guidelines for the relationships Aborigines have with the environment. Sacred group and individual animal totems that were not hunted by that group or individual.
Parrot fish on the Great Barrier Reef
Coral reef on Lizard Island

Geography Bulletin – HSC Edition No 1 2017 15
ECOSYSTEMS AT RISK
“Each clan family belonging to the group is responsible for the stewardship of their totem: the flora and fauna of their area as well as the stewardship of the sacred sites attached to their area. This stewardship consists not only of the management of the physical resources ensuring that they are not plundered to the point of extinction, but also the spiritual management of all the ceremonies necessary to ensure adequate rain and food resources at the change of each season.”
Australian Together
The Wuthathi tribe in northern Queensland has the Diamond Stingray is their totem and the shark is the totem for the Meriam.
Federated States of MicronesiaThe Federated States of Micronesia consists of 607 islands including coral atolls and low reefs islands, and covers 1.6 million square km of ocean. In Micronesia, communities have a tremendous amount of traditional knowledge about their reefs. A range of strategies are implemented including closed seasons during spawning, closed areas, bans on small-sized catches and restrictions on number of traps.
Samoa and American Samoa – Samoa Reefs (including Palolo Deep Marine Reserve, Aleipata Islands)Traditionally, marine resources were controlled by customary marine tenure held by villagers. This gave them specific rights to specific areas of the ocean and coral reefs and provided a system of management involving local rules and regulations including taboos, seasonal limitations on harvesting particular species, “special” fishing areas and preventing outsiders from fishing in waters near villages. Various restrictions were in place including forbidding the sale or trade of certain species (Levine and Sauafea-Leau, 2013).
In Samoa communities use cowrie shells as lures and snare sharks with pig innards. Atule (big eyes scad) were caught in communal traps. Villagers would stand in the water in a curved line while holding palm leaves in the water and would then move inwards to trap the fish. The catch would then by distributed equally. If there was a large fish, fish would be given to nearby villages, cemented the reciprocal relationship. Spears were (and are) commonly used.
Lalomanu Beach, SamoaTraditional-style boats - north-west coast of Samoa.

16 Geography Bulletin – HSC Edition No 1 2017
ECOSYSTEMS AT RISK
MelanesiaIn reef and lagoon areas in Ouvea atoll, New Caledonia, tribal or clan fishing grounds or territories and very well-defined. Restrictions are placed on the type of fishing instruments that can be used and the species that can be taken.
In Papua New Guinea, over 90% of coastal and near shore resources are under customary ownership. Cultural practices in Ahus Island restrict fishing in parts of the reef after the death of an important person in the community. This can last for several years.
Fishing is restricted in six areas of the reef lagoon on Ahus Island, Papua New Guinea. Net and spear fishing is restricted but line fishing is allowed. These restrictions have been in place for generations and are based on cultural traditions.
ReferencesGreat Barrier Reef Marine Park Authority. 2011. Traditional Owners of the Great Barrier Reef. [ONLINE] Available at: http://www.gbrmpa.gov.au/__data/assets/pdf_file/0016/11257/4-Traditional-Owners-of-the-GBR.pdf [Accessed 19 March 2017].
The ABS Capacity Development Initiative. 2005. Access and Benefit Sharing, Traditional Knowledge and Customary Law Workshop, Cairns, Australia . [ONLINE] Available at: http://www.abs-initiative.info/fileadmin//media/Stakeholders_and_Topics/TK/CAIRNS_DRAFT_REPORT.pdf [Accessed 19 March 2017].
Blue Earth Consultants. 2005. The Reimplementation of of Ra’ui Coral Reef Management in Rarotonga, Cook Islands. [ONLINE] Available at: http://blueearthconsultants.com/pdf/CM_RauiTCH-pubs1.pdf [Accessed 19 March 2017].
Research Online. 2008. Status of Coral Reef Resources in Micronesia and American Samoa: 2008. [ONLINE] Available at: http://researchonline.jcu.edu.au/24211/1/Status_of_Micronesia_and_AS.pdf. [Accessed 19 March 2017].
Earth Observatory. 2006. Coral Reef Mangement, 2006. [ONLINE] Available at: https://earthobservatory.nasa.gov/IOTD/view.php?id=6276 [Accessed 19 March 2017].
Research Gate. 2006. The Relevance of Traditional Ecological Knowledge for Modern Management of Coral Reef Fisheries in Melanesia. [ONLINE] Available at: https://www.researchgate.net/publication/265285644_The_Relevance_of_Traditional_Ecological_Knowledge_for_Modern_Management_of_Coral_Reef_Fisheries_in_Melanesia.[Accessed 19 March 2017].
Pacific Science. 2013. Traditional Knowledge, use, and management of living marine resources in American Samoa: documenting changes over time through interviews with elder fishermen . [ONLINE] Available at: https://pacificscience.files.wordpress.com/2013/02/pac-sci-early-view-67-3-7.pdf. [Accessed 19 March 2017].
Australians Together. 2016. Indigenous Spirituality. [ONLINE] Available at: http://www.australianstogether.org.au/stories/detail/indigenous-spirituality [Accessed 19 March 2017].
Great Barrier Reef Marine Park Authority. 2017. Language, Totems and Stories. [ONLINE] Available at: http://www.gbrmpa.gov.au/our-partners/traditional-owners/traditional-owners-of-the-great-barrier-reef/language-totems-and-stories [Accessed 19 March 2017].
Western Pacific Regional Fishery Management Council. 2017. Traditional Samoan Expressions about Fishing and Weather. [ONLINE] Available at: http://www.wpcouncil.org/wp-content/uploads/2013/04/Traditional-Samoan-expression-about-fishing-and-weather_Display_05_v02.pdf [Accessed 19 March 2017].
Traditional Timorese fish trap. Photo: Wikimedia Commons
Local catch, Papua New Guinea. Photo: Taro Taylor

Geography Bulletin – HSC Edition No 1 2017 17
Traditional and contemporary management strategies applied to coral reefs
Louise Swanson, Deputy Principal, Sydney Secondary College, Balmain Campus
GTANSW Councillor
EVALUATING
Evaluate: presenting and defending opinions by making judgments about information, validity of ideas or quality of work based on a set of criteria.
What is a criteria?
A criteria is a set of standards that you use to judge something. For example, students would refer to the criteria to decide how successful the management strategies have been.
An evaluation of management strategies focuses on
the concept of sustainability. The criteria to judge management strategies are:
• Intragenerational equity
• Intergenerational equity
• The precautionary approach
• Biological diversity
What do the criteria mean?
Intragenerational equity Are people able to benefit from the ecosystem?
Are people able to access various part of the ecosystem?
Is the present generation of people able to use the resources within the ecosystem? (Consider what use of resources actually means).
Is the current population able to benefit from the ecosystem’s aesthetic values (the way the ecosystem looks)?
Intergenerational equity Is the use and management of the ecosystem maintaining the quality of the ecosystem for the future?
Will people in the future be able to access various parts of the ecosystem?
Will people in the future be able to use the resources of the ecosystem?
Is the current population able to benefit from the ecosystem’s aesthetic values (the way the ecosystem looks)?
The precautionary approach
Has the ecosystem become more or less susceptible to human or natural stress?
Are there attempts to improve knowledge of the threats to the ecosystem?
Do management strategies take into account best and worst case scenarios for threats to the ecosystem?
Are historical processes maintained (e.g. the ability to adapt to changes)?
Biological diversity What changes have taken place within food webs/chains?
Are there still as many links within the chains and webs?
Has the diversity of the ecosystem been diminished in any way?
Is genetic diversity maintained?
Has there been a reduction or increase of any species? What impact will this have?
Is the ecosystem still functioning effectively in terms of biological processes, etc?
18 Geography Bulletin – HSC Edition No 1 2017
EVALUATING
Students need to describe the management strategy, and make a judgement about how effective it is. Use terms such as totally ineffective, somewhat ineffective, moderately effective, very effective. Can you think of some other terms that you could use to describe the effectiveness of a management strategy?
Totally ineffective Somewhat ineffective Moderately effective Very effective
LEAST MOST
Unsuccessful
Unproductive
Impractical
Useless
Fruitless
Impractical
Inadequate
Unworkable
Highly Successful
Productive
Practical
Useful
Fruitful
Practical
Adequate
Workable

Geography Bulletin – HSC Edition No 1 2017 19
EVALUATING
Evaluate extended response scaffoldEvaluate the effectiveness of traditional and contemporary management strategies with reference to ONE Ecosystem at Risk (applied to coral reefs).
Introduction
Traditional management strategies (you may choose to have a sub-heading)
Paragraph 1:
• Describe the management strategy
• Judgement statement about effectiveness
• Reference to criteria
• Evidence to support your judgement
Paragraph 2:
• Describe the management strategy
• Judgement statement about effectiveness
• Reference to criteria
• Evidence to support your judgement
Include as many paragraphs as is necessary…

20 Geography Bulletin – HSC Edition No 1 2017
EVALUATING
Contemporary management strategies (you may choose to have a sub-heading)
Paragraph 3 (the number will depend on how many paragraphs you included on traditional management strategies):
• Describe the management strategy
• Judgement statement about effectiveness
• Reference to criteria
• Evidence to support your judgement
Paragraph 4 (again, dependent on the number of previous paragraphs):
• Describe the management strategy
• Judgement statement about effectiveness
• Reference to criteria
• Evidence to support your judgement
Include as many paragraphs as is necessary…
Conclusion

Geography Bulletin – HSC Edition No 1 2017 21
EVALUATING
Writing paragraphs – evaluationQuestion: Evaluate traditional and contemporary management strategies applied to coral reefs.
It is important, particularly when you are learning to write responses to have a method or pattern that you follow. In this case the paragraph structure you could use is:
• Describe the management strategy
• Make a judgement statement about the effectiveness of the management strategy
• Refer to the specific criteria that helped you make your decision and explain how it justifies your decision
• Provide evidence to support your judgement
Examine the paragraph below:
Traditional Management Strategies
Description of the management
strategy. Judgement statement. Was it
effective?
Reference to the criteria.
Evidence of the management
strategy addressing the
criteria.
Totemism
Totemism identifies an individual person with a particular
plant or animal species. Individuals are prohibited from
killing or eating their totem. Individuals must perform rites
(balance or increase/decrease rites) to ensure the continued
proliferation of their totemic species. Totemism was a
relatively successful means of ensuring that ecosystems
remained largely unchanged, through the protection of
a collection of individual species. Ecological diversity is
maintained because no particular species was targeted
by a community as a food source. A variety of different
food sources were used by the community to ensure that
members of the community are not eating a taboo animal
or plant. No one animal or plant was over-hunted. Diamond
Stingray, the totem of the Wuthathi tribe in Northern
Queensland is abundant in numbers in the eastern Pacific.
22 Geography Bulletin – HSC Edition No 1 2017
EVALUATING
What are the positives and negatives about this paragraph?A few ides have already been written in the table, but write down your own thoughts about the paragraph.
Positives Negatives
• made reference to the evaluation criteria • not enough information specifically about coral reefs
• evidence was limited
• used past tense – these practices are still in use today
Now you can begin to write your own paragraph on nomadism and traditional land and sea tenure. You can see that some sections of the paragraph have already been written for you.
Nomadism and traditional land and sea tenure
Description: Aborigines did not have permanent settlements, but were nomadic. They had large tribal lands, and clans would move within these boundaries to areas with abundant food and water supply.
Judgement:
……………………………………………………………………………………………………………………………
……………………………………………………………………………………………………………………………
……………………………………………………………………………………………………………………………
……………………………………………………………………………………………………………………………
Criteria: This strategy related to intragenerational and intergenerational equity. It addressed intragenerational in that people could make use of the ecosystem as a food source. It also addressed intergenerational equity in that the use of the ecosystem did not hinder or threaten the use of the ecosystem by future generations.
Evidence:
……………………………………………………………………………………………………………………………
……………………………………………………………………………………………………………………………
……………………………………………………………………………………………………………………………
……………………………………………………………………………………………………………………………
Now it is time to complete the rest of your response without a scaffold in your exercise book/on your laptop.
Geography Bulletin – HSC Edition No 1 2017 23
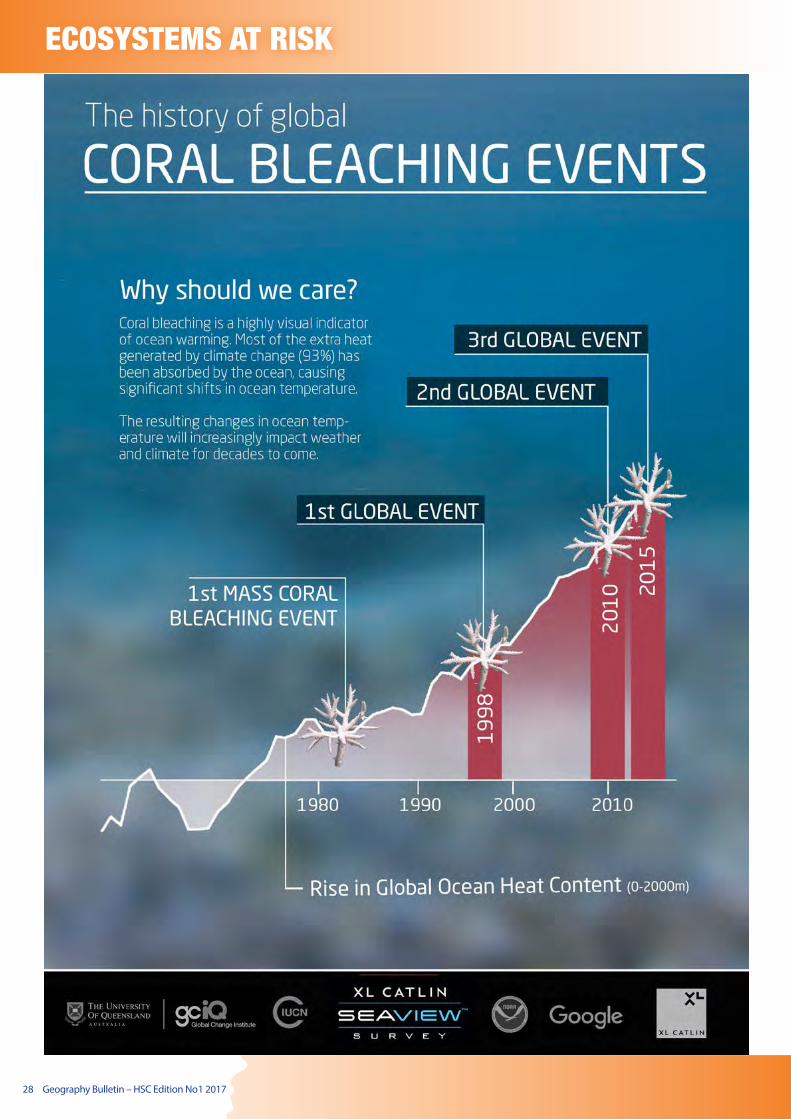
Coral bleaching events Louise Swanson, Deputy Principal,
Sydney Secondary College, Balmain CampusGTANSW Councillor
ECOSYSTEMS AT RISK
Climate change impacts on coral reef health and resilience through a range of associated and interconnected processes and feedbacks including sea level rise, ocean acidification, increased ocean temperatures and coral bleaching.
Impacts of climate change
Sea surface temperatures have been increasing by approximately 0.07oC per decade over the past century.
Cyclones, winds and storms are common natural stresses that impact on coral reefs, sometimes devastating whole reefs. The natural processes involved in breaking down dead organisms, ensures that a basis is provided for the growth of new polyp colonies. An increasing number and severity of extreme weather events are likely to impact coral reefs as a result of climate change.
Carbon dioxide from the atmosphere is absorbed by the ocean. This carbon dioxide reacts with the seawater to create carbonic acid. Coral reefs consist of accumulated skeletal fragments of calcium carbonate (limestone). Reefs grow on the surface of the limestone. When corals die the coral fragments are added to the limestone. A result of increased ocean acidity is that corals are unable to build their skeletons from calcium carbonate.
Climate change is likely to exacerbate the spread of invasive species, changing climatic restraints on the species and shifting their species distribution.
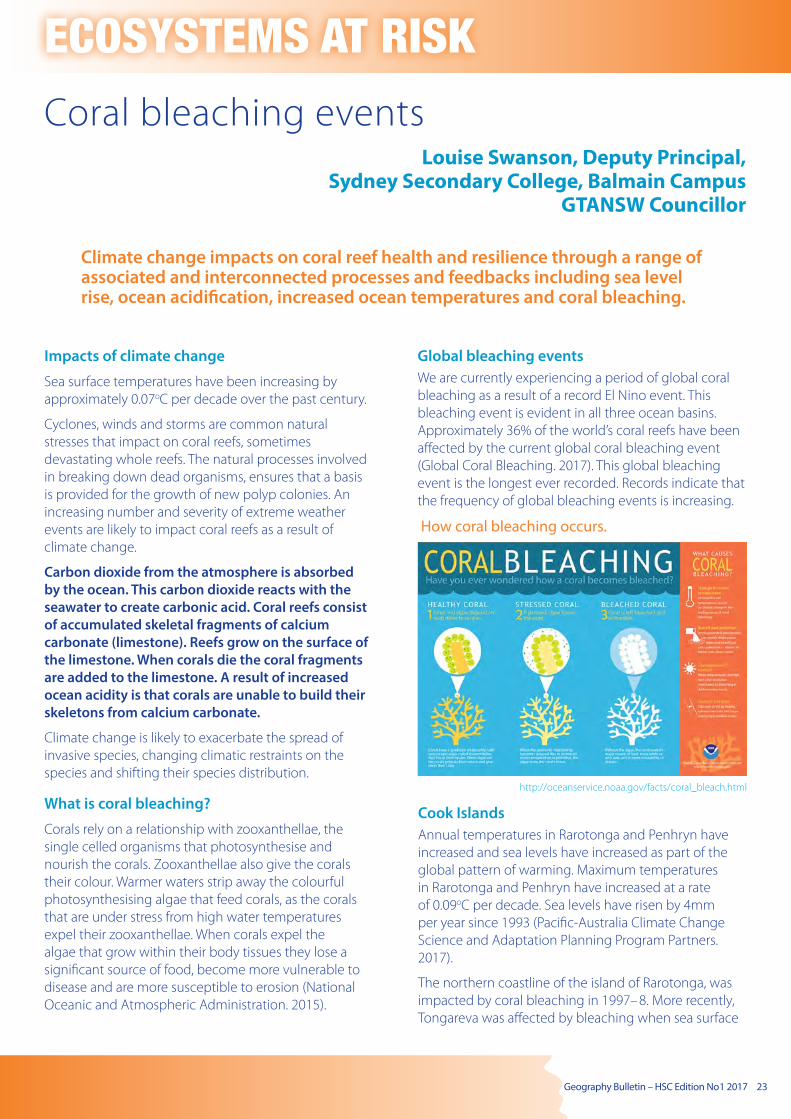
What is coral bleaching?
Corals rely on a relationship with zooxanthellae, the single celled organisms that photosynthesise and nourish the corals. Zooxanthellae also give the corals their colour. Warmer waters strip away the colourful photosynthesising algae that feed corals, as the corals that are under stress from high water temperatures expel their zooxanthellae. When corals expel the algae that grow within their body tissues they lose a significant source of food, become more vulnerable to disease and are more susceptible to erosion (National Oceanic and Atmospheric Administration. 2015).
Global bleaching eventsWe are currently experiencing a period of global coral bleaching as a result of a record El Nino event. This bleaching event is evident in all three ocean basins. Approximately 36% of the world’s coral reefs have been affected by the current global coral bleaching event (Global Coral Bleaching. 2017). This global bleaching event is the longest ever recorded. Records indicate that the frequency of global bleaching events is increasing.
How coral bleaching occurs.
http://oceanservice.noaa.gov/facts/coral_bleach.html
Cook IslandsAnnual temperatures in Rarotonga and Penhryn have increased and sea levels have increased as part of the global pattern of warming. Maximum temperatures in Rarotonga and Penhryn have increased at a rate of 0.09oC per decade. Sea levels have risen by 4mm per year since 1993 (Pacific-Australia Climate Change Science and Adaptation Planning Program Partners. 2017).
The northern coastline of the island of Rarotonga, was impacted by coral bleaching in 1997–8. More recently, Tongareva was affected by bleaching when sea surface

24 Geography Bulletin – HSC Edition No 1 2017
ECOSYSTEMS AT RISK
temperatures hit 32oC, and possibly as high as 35oC. Branching corals and puau (clams) were particularly affected. Large scale bleaching also occurred on the northern group atolls (Cook Islands News, 2016).
MicronesiaReefs in Palua were impacted by coral bleaching during the 1998 global bleaching event. At this time, much of the coral was killed. In some reefs there was up to 90% coral mortality. Branching corals were particularly hard hit, with their branches disintegrating and turning to rubble (Bruckner, 2015). Palua reefs were also affected by two typhoons – Bopha (2012) and Haiyan (2013), however, they were largely unaffected by the 2016 bleaching event. Recovery of Palua’s reefs has indicated high levels of reef resilience.
Great Barrier ReefCoral bleaching events have been recorded since the 1980s. The Great Barrier Reef has been affected by bleaching events in 1998, 2002, 2016 and most recently 2017. The geographic distribution of coral bleaching is determined by temperatures of ocean currents at the time of each event.
Atuitaki Lagoon, Cook Islands. Rarotonga, Cook Islands.
In 2016–17, record high temperatures resulted in coral bleaching episode that affected all tropical areas (known as pan-tropical). The 2016 bleaching event occurred during February and March 2016. During the 2016 bleaching event, only 7% of the Great Barrier Reef avoided bleaching. In the northern section of the GBR 81% of the reefs were severely affected by bleaching, while in the central section 33% were severely bleached. The 1000km region north of Port Douglas up to the Torres Strait is classified as having suffered extreme bleaching. Coral mortality north of Port Douglas is likely to be between 50% and 90%. Only 1% of the southern sector was severely bleached.
In the 2017 bleaching event, the central 500km section of the Great Barrier Reef has been severely damaged. In March 2017 it was reported that the southern offshore reefs of the Great Barrier Reef had escaped the impacts of the latest coral bleaching event, with no bleaching evident in 149 southern offshore reefs (Climate Council. 2016).
The impact of having two consecutive bleaching events on the GBR has reduced stress tolerances of the corals. The resilience of corals has been weakened by persistent, high temperatures. The northern sector of the GBR has suffered severe damage.
Images below: Coral bleaching evident April 2016 at Fitzroy Island Great Barrier Reef

Geography Bulletin – HSC Edition No 1 2017 25
South China Sea (Dongsha Atoll)A 2015 bleaching event in Dongsha Atoll in the South China Sea was the most devastating to hit the area in over 40 years. In northern parts of the South China Sea, sea-surface temperatures reached 6oC above average. This killed 40% of the coral in Dongsha Atoll. Increased ocean temperatures as a result of climate change and a normal El Nino pattern were exacerbated by local climatic conditions (unusually low winds). The shallow water of the atoll heated more than surrounding areas. The lack of wind trapped the heat in and around the atoll.
HawaiiThe first coral bleaching event in Hawaii occurred in 1996, affecting the northern part of the mainland Hawaiian islands, with little impact on the Northwestern Hawaiian Islands. Coral bleaching then occurred again in 2002. Coral health in parts of Hawaii was also impacted by a freshwater “kill” event during July 2014. This particularly affected Kaneohe Bay where coral cover was reduced by 22.5% as a result of flooding. Extreme warming was reported during August-September 2014, resulting in large scale bleaching throughout Hawaii. As temperatures rose corals began to show signs of stress such as discolouration and contracted polyps. Bleaching of 80-100% of total coral cover was reported. The cumulative effect of the freshwater flooding and extreme high temperatures had a devastating effect on Hawaii’s coral reefs (Keisha, et al 2015). Coral mortality was reported at 50% in the West Hawaii region in 2015.
ReferencesBahr, K. Jokiel, P. and Rodgers, K. 2015. The 2014 coral bleaching and freshwater flood events in Kāne’ohe Bay, Hawai’i. [ONLINE] Available at: https://www.researchgate.net/publication/280638495_The_2014_coral_bleaching_and_freshwater_flood_events_in_Kane%27ohe_Bay_Hawai%27i [Accessed 25 March 2017].
Bruckner, A. 2015. Rebirth of the Forest. [ONLINE] Available at: https://www.livingoceansfoundation.org/coral-bleaching-and-rebirth-of-palaus-reefs/ [Accessed 25 March 2017].
Climate Council. 2016. Australia’s Coral Reefs Under Threat from Climate Change. [ONLINE] Available at: https://www.climatecouncil.org.au/reefreport [Accessed 25 March 2017].
Cook Islands News. 2016. Alarming coral bleaching taking place on Penrhyn. [ONLINE] Available at: http://www.cookislandsnews.com/item/56553-alarming-coral-bleaching-taking-place-on-penrhyn/56553-alarming-coral-bleaching-taking-place-on-penrhyn [Accessed 25 March 2017].
Global Coral Bleaching. 2017. The Third Global Coral Bleaching Event 2014/2017. [ONLINE] Available at: http://www.globalcoralbleaching.org/ [Accessed 25 March 2017].
National Oceanic and Atmospheric Administration. 2015. What is Coral Bleaching?. [ONLINE] Available at: http://oceanservice.noaa.gov/facts/coral_bleach.html [Accessed 25 March 2017].
Pacific-Australia Climate Change Science and Adaptation Planning Program Partners. 2017. Pacific-Australia Climate Change Science and Adaptation Planning Program - Current and Future Climate of the Cook Islands. [ONLINE] Available at: http://www.pacificclimatechangescience.org/wp-content/uploads/2013/06/9_PACCSAP-Cook-Islands-11pp_WEB.pdf [Accessed 25 March 2017].
ECOSYSTEMS AT RISK
American Samoa coral bleaching event

26 Geography Bulletin – HSC Edition No 1 2017
Source: http://www.globalcoralbleaching.org/
ECOSYSTEMS AT RISK
Source: http://www.globalcoralbleaching.org/wp-content/uploads/2016/06/CoralReefsJeopardy1058px.png

Geography Bulletin – HSC Edition No 1 2017 27
ECOSYSTEMS AT RISK
28 Geography Bulletin – HSC Edition No 1 2017
ECOSYSTEMS AT RISK
Geography Bulletin – HSC Edition No 1 2017 29
Advice for those new to teaching senior GeographyLorraine Chaffer
President GTANSW Geography Education Consultant
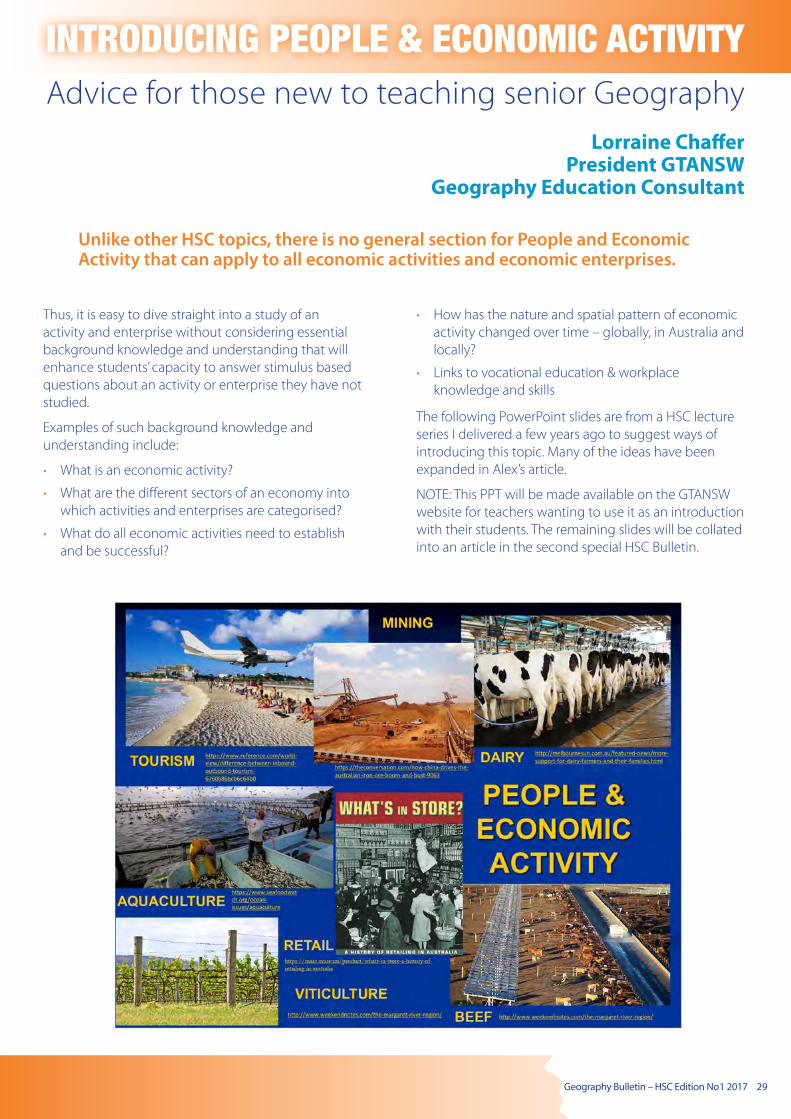
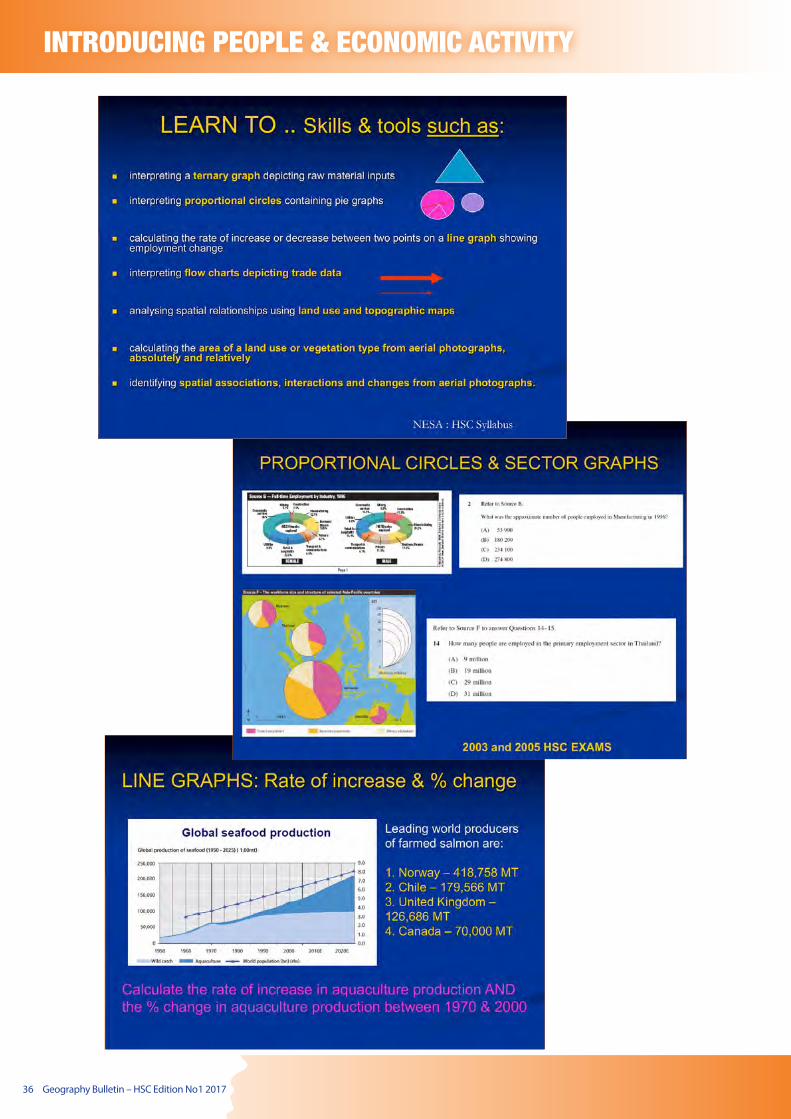
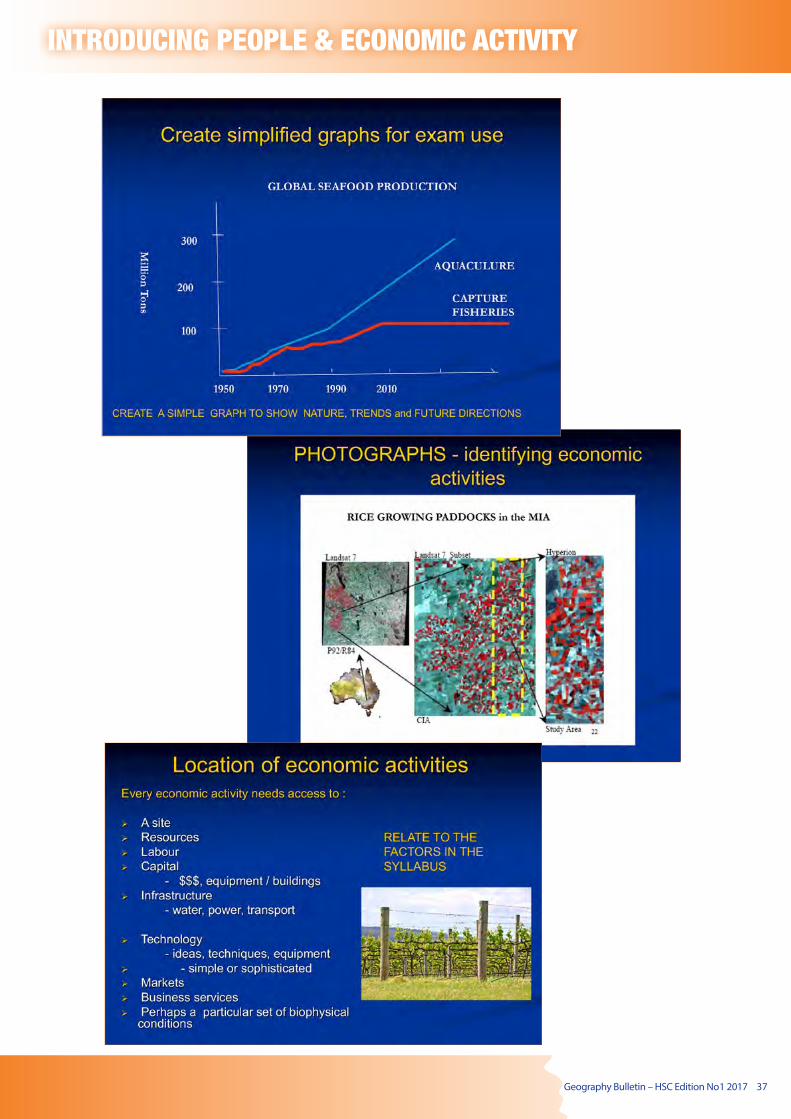
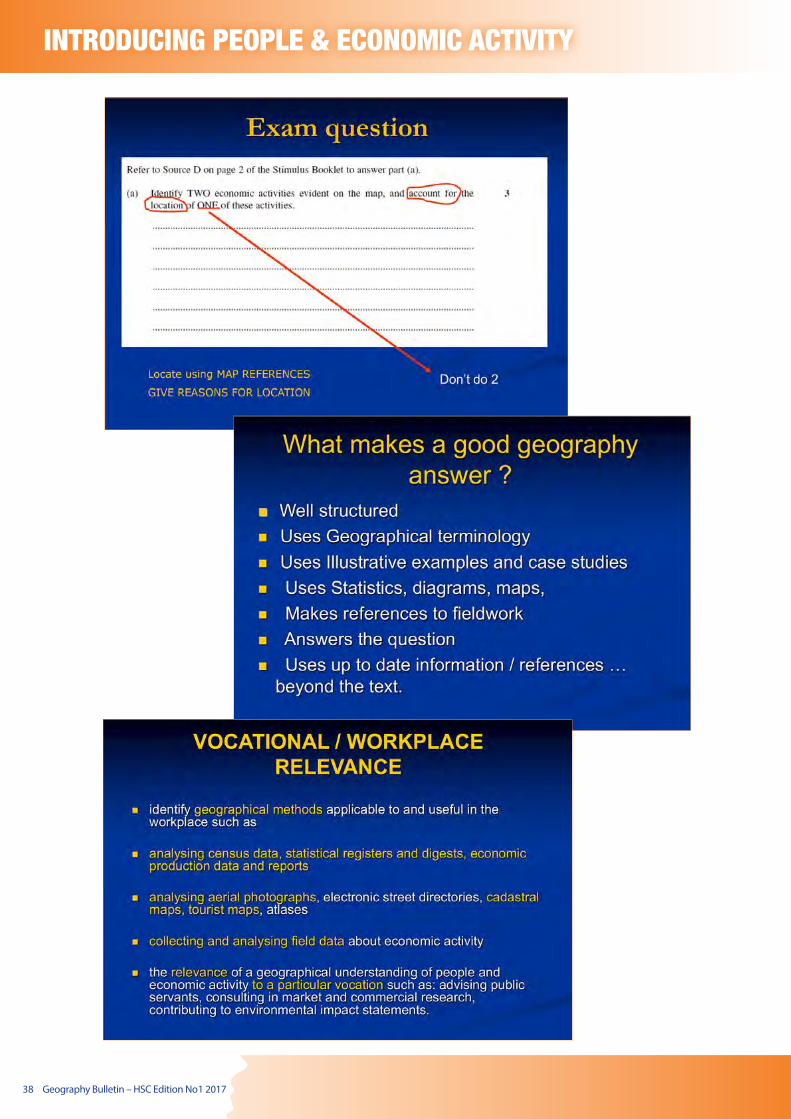
INTRODUCING PEOPLE & ECONOMIC ACTIVITY
Unlike other HSC topics, there is no general section for People and Economic Activity that can apply to all economic activities and economic enterprises.
Thus, it is easy to dive straight into a study of an activity and enterprise without considering essential background knowledge and understanding that will enhance students’ capacity to answer stimulus based questions about an activity or enterprise they have not studied.
Examples of such background knowledge and understanding include:
• What is an economic activity?
• What are the different sectors of an economy into which activities and enterprises are categorised?
• What do all economic activities need to establish and be successful?
• How has the nature and spatial pattern of economic activity changed over time – globally, in Australia and locally?
• Links to vocational education & workplace knowledge and skills
The following PowerPoint slides are from a HSC lecture series I delivered a few years ago to suggest ways of introducing this topic. Many of the ideas have been expanded in Alex’s article.
NOTE: This PPT will be made available on the GTANSW website for teachers wanting to use it as an introduction with their students. The remaining slides will be collated into an article in the second special HSC Bulletin.
30 Geography Bulletin – HSC Edition No 1 2017
INTRODUCING PEOPLE & ECONOMIC ACTIVITY

Geography Bulletin – HSC Edition No 1 2017 31
INTRODUCING PEOPLE & ECONOMIC ACTIVITY

32 Geography Bulletin – HSC Edition No 1 2017
INTRODUCING PEOPLE & ECONOMIC ACTIVITY

Geography Bulletin – HSC Edition No 1 2017 33
INTRODUCING PEOPLE & ECONOMIC ACTIVITY

34 Geography Bulletin – HSC Edition No 1 2017
INTRODUCING PEOPLE & ECONOMIC ACTIVITY
Geography Bulletin – HSC Edition No 1 2017 35
INTRODUCING PEOPLE & ECONOMIC ACTIVITY
36 Geography Bulletin – HSC Edition No 1 2017
INTRODUCING PEOPLE & ECONOMIC ACTIVITY
Geography Bulletin – HSC Edition No 1 2017 37
INTRODUCING PEOPLE & ECONOMIC ACTIVITY
38 Geography Bulletin – HSC Edition No 1 2017
INTRODUCING PEOPLE & ECONOMIC ACTIVITY

Geography Bulletin – HSC Edition No 1 2017 39
INTRODUCING PEOPLE & ECONOMIC ACTIVITY
HSC Geography in the MediaLorraine Chaffer’s Scoop.it page for senior geography is regularly updated with media reports linked to preliminary and HSC topics. Better HSC answers will contain media references that demonstrate that students are aware of recent issues, changes, statistics or events related to their topics.
Source: http://www.scoop.it/t/nsw-senior-geography-current-syllabus

40 Geography Bulletin – HSC Edition No 1 2017
Inspiration for introducing People and Economic Activity
Alexandria Lucas, Warners Bay High School
GTANSW Councillor
CLASSROOM ACTIVITIES
Trends in the HSC Geography examination indicate that we can expect one short answer question that will involve a skills construction and/or ask students to apply one of the ‘learn to’ dot points of our syllabus. Asking students to recommend a management strategy for an ecosystem presented in the stimulus seems quite achievable as the syllabus requires students to do an overview of Ecosystems at Risk before launching into their case studies. But what about People and Economic Activity? In this topic, teachers generally launch straight into a chosen economic activity and work through the ‘learn about’ dot points . Examples include viticulture, chocolate, coffee, dairying and tourism.
The syllabus doesn’t require a general overview of what economic activity is, or the relevance of Geography to economic activity, however the ‘learn to’ points of the syllabus expect students to apply a range of skills to a variety of stimulus on this topic. This poses the question of how to prepare students to respond to stimulus on an economic activity they haven’t studied in the HSC examination.
In the 2016 HSC Student Lecture series, I presented on this possibility; focusing on construction of precis maps and using stimulus to describe factors affecting the nature, spatial patterns and future directions of any economic activity and possible impacts. This article describes how this could be broken down into a series of exercises that could be used in the classroom when introducing the topic ‘People and Economic Activity’.
Activity One: So what is economic activity and why are geographers concerned with it?The students could write the following up as notes, or use the information as a discussion starter to get them thinking about the topic.
So what is economic activity?Economic activity is any action that involves the production, distribution and consumption of goods and services at all levels within a society. We generally divide economic activity into a number of sectors:
• Primary – hunters, gathers, mining, agriculture, forestry
• Secondary – auto production, construction, textiles (value is added to a raw material eg making furniture)
• Tertiary – service industries, infrastructure to transport goods and services.
• Quaternary – the knowledge economy, a high percentage of population working in research
• Quinary – services that focus on the creation, re-arrangement and interpretation of new and existing ideas; data interpretation and the use and evaluation of new technologies.
Why are Geographers concerned with Economic Activity?• We are Geographers so naturally we are concerned
with any economic activity that uses the physical environment to produce/consume goods and services.
• We want to know the spatial dimension – what and where?
• We want to know the ecological dimension – how does the environment affect us producing or consuming the activity, how do we affect the environment by producing or consuming the activity?
Geographers are concerned with spatial associations; the study of the location, distribution and spatial organisation of economic activities across the world. Often it is this spatial association that will have a close tie to political links, cultural integration, urban agglomerations, human development and ecosystems at risk. In addition, primary, secondary and tertiary sectors of the economy rely on physical environments and the resources they yield to produce goods and services. Finally Geographers are also concerned with the impacts these activities will have on ecosystems, how they will inform culture and ultimately improve quality of life.
Geography Bulletin – HSC Edition No 1 2017 41
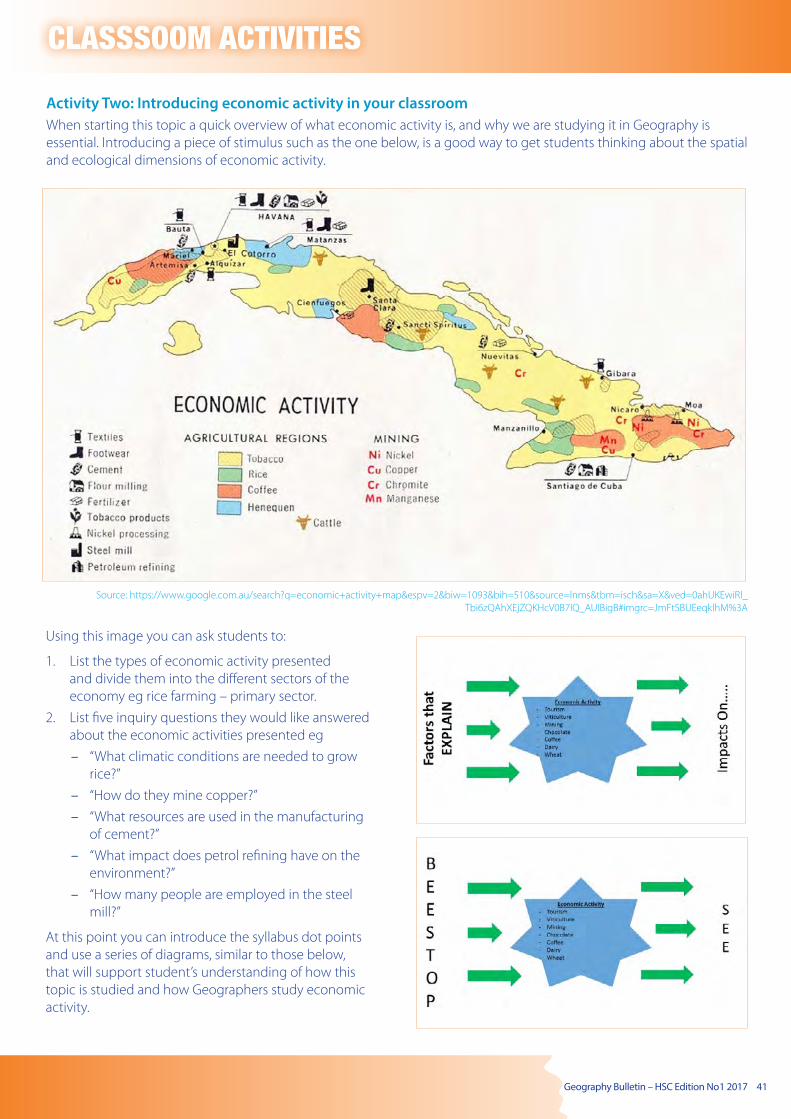
Activity Two: Introducing economic activity in your classroomWhen starting this topic a quick overview of what economic activity is, and why we are studying it in Geography is essential. Introducing a piece of stimulus such as the one below, is a good way to get students thinking about the spatial and ecological dimensions of economic activity.
CLASSSOOM ACTIVITIES
Using this image you can ask students to:
1. List the types of economic activity presented and divide them into the different sectors of the economy eg rice farming – primary sector.
2. List five inquiry questions they would like answered about the economic activities presented eg
– “What climatic conditions are needed to grow rice?”
– “How do they mine copper?”
– “What resources are used in the manufacturing of cement?”
– “What impact does petrol refining have on the environment?”
– “How many people are employed in the steel mill?”
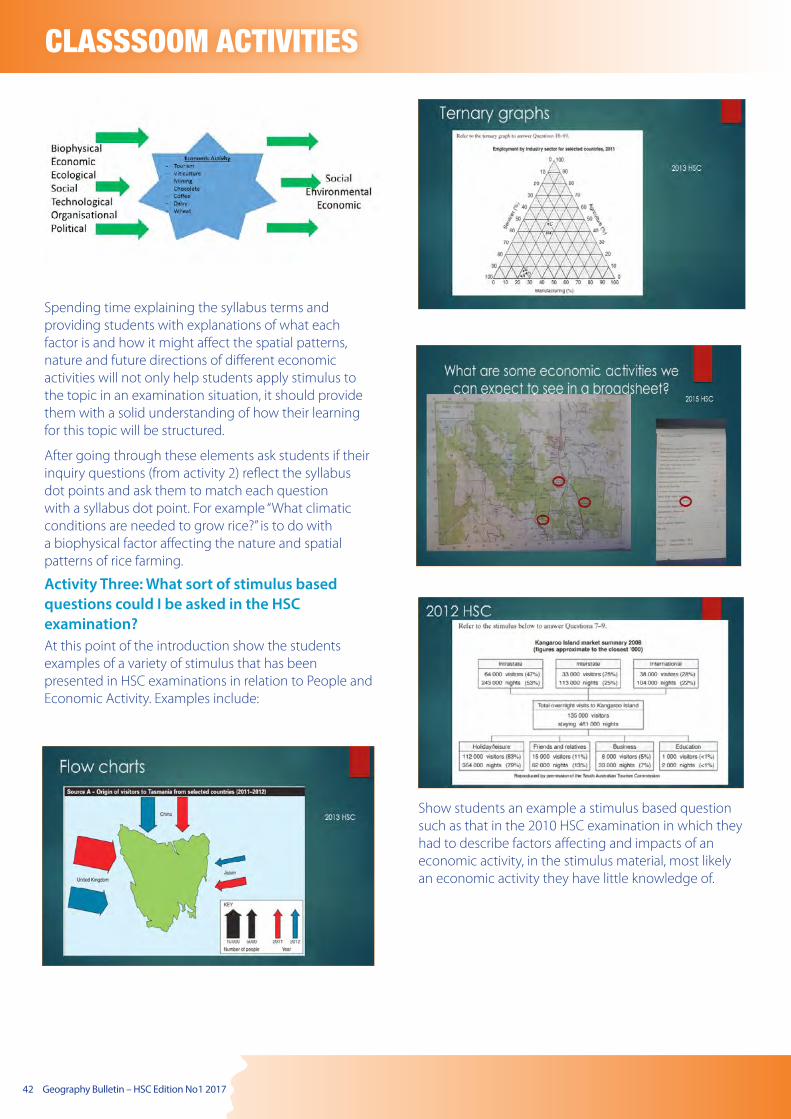
At this point you can introduce the syllabus dot points and use a series of diagrams, similar to those below, that will support student’s understanding of how this topic is studied and how Geographers study economic activity.
Source: https://www.google.com.au/search?q=economic+activity+map&espv=2&biw=1093&bih=510&source=lnms&tbm=isch&sa=X&ved=0ahUKEwiRl_Tbi6zQAhXEjZQKHcV0B7IQ_AUIBigB#imgrc=JmFtSBUEeqklhM%3A
42 Geography Bulletin – HSC Edition No 1 2017
CLASSSOOM ACTIVITIES
Spending time explaining the syllabus terms and providing students with explanations of what each factor is and how it might affect the spatial patterns, nature and future directions of different economic activities will not only help students apply stimulus to the topic in an examination situation, it should provide them with a solid understanding of how their learning for this topic will be structured.
After going through these elements ask students if their inquiry questions (from activity 2) reflect the syllabus dot points and ask them to match each question with a syllabus dot point. For example “What climatic conditions are needed to grow rice?” is to do with a biophysical factor affecting the nature and spatial patterns of rice farming.
Activity Three: What sort of stimulus based questions could I be asked in the HSC examination?At this point of the introduction show the students examples of a variety of stimulus that has been presented in HSC examinations in relation to People and Economic Activity. Examples include:
Show students an example a stimulus based question such as that in the 2010 HSC examination in which they had to describe factors affecting and impacts of an economic activity, in the stimulus material, most likely an economic activity they have little knowledge of.
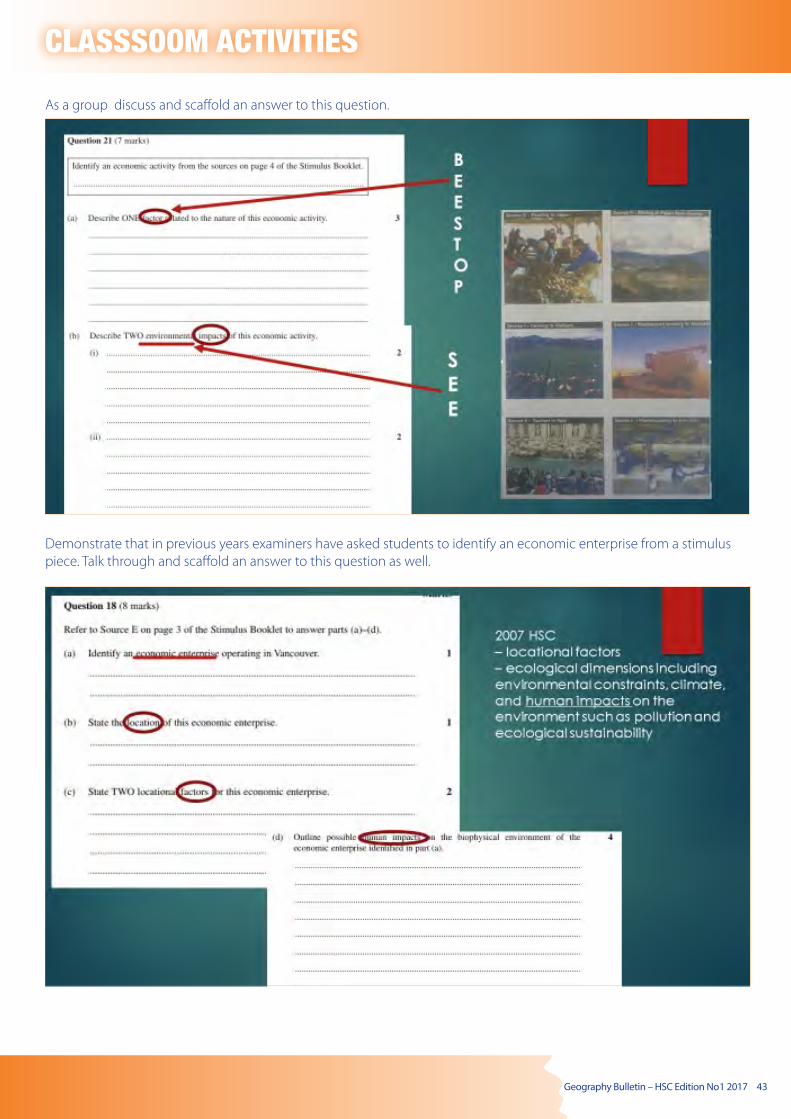
Geography Bulletin – HSC Edition No 1 2017 43
CLASSSOOM ACTIVITIES As a group discuss and scaffold an answer to this question.
Demonstrate that in previous years examiners have asked students to identify an economic enterprise from a stimulus piece. Talk through and scaffold an answer to this question as well.
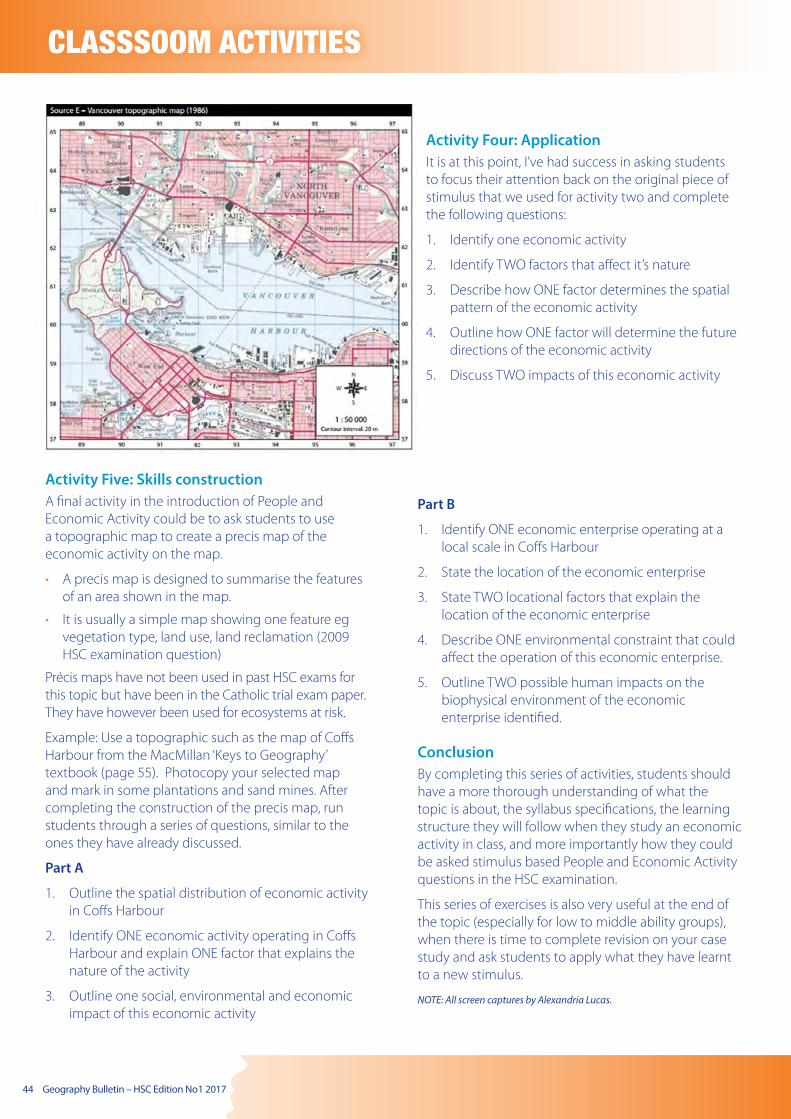
44 Geography Bulletin – HSC Edition No 1 2017
Activity Four: ApplicationIt is at this point, I’ve had success in asking students to focus their attention back on the original piece of stimulus that we used for activity two and complete the following questions:
1. Identify one economic activity
2. Identify TWO factors that affect it’s nature
3. Describe how ONE factor determines the spatial pattern of the economic activity
4. Outline how ONE factor will determine the future directions of the economic activity
5. Discuss TWO impacts of this economic activity
CLASSSOOM ACTIVITIES
Activity Five: Skills constructionA final activity in the introduction of People and Economic Activity could be to ask students to use a topographic map to create a precis map of the economic activity on the map.
• A precis map is designed to summarise the features of an area shown in the map.
• It is usually a simple map showing one feature eg vegetation type, land use, land reclamation (2009 HSC examination question)
Précis maps have not been used in past HSC exams for this topic but have been in the Catholic trial exam paper. They have however been used for ecosystems at risk.
Example: Use a topographic such as the map of Coffs Harbour from the MacMillan ‘Keys to Geography’ textbook (page 55). Photocopy your selected map and mark in some plantations and sand mines. After completing the construction of the precis map, run students through a series of questions, similar to the ones they have already discussed.
Part A
1. Outline the spatial distribution of economic activity in Coffs Harbour
2. Identify ONE economic activity operating in Coffs Harbour and explain ONE factor that explains the nature of the activity
3. Outline one social, environmental and economic impact of this economic activity
Part B
1. Identify ONE economic enterprise operating at a local scale in Coffs Harbour
2. State the location of the economic enterprise
3. State TWO locational factors that explain the location of the economic enterprise
4. Describe ONE environmental constraint that could affect the operation of this economic enterprise.
5. Outline TWO possible human impacts on the biophysical environment of the economic enterprise identified.
ConclusionBy completing this series of activities, students should have a more thorough understanding of what the topic is about, the syllabus specifications, the learning structure they will follow when they study an economic activity in class, and more importantly how they could be asked stimulus based People and Economic Activity questions in the HSC examination.
This series of exercises is also very useful at the end of the topic (especially for low to middle ability groups), when there is time to complete revision on your case study and ask students to apply what they have learnt to a new stimulus.
NOTE: All screen captures by Alexandria Lucas.
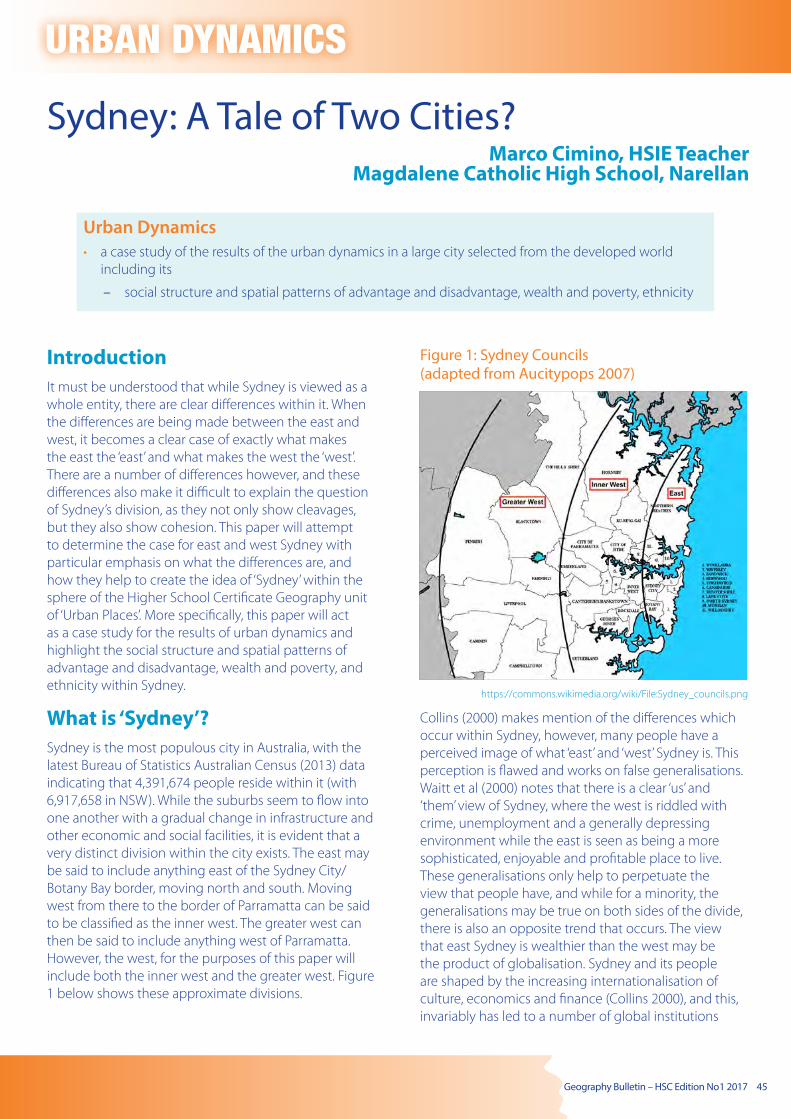
Geography Bulletin – HSC Edition No 1 2017 45
URBAN DYNAMICS
Sydney: A Tale of Two Cities?Marco Cimino, HSIE Teacher
Magdalene Catholic High School, Narellan
Urban Dynamics• a case study of the results of the urban dynamics in a large city selected from the developed world
including its
– social structure and spatial patterns of advantage and disadvantage, wealth and poverty, ethnicity
IntroductionIt must be understood that while Sydney is viewed as a whole entity, there are clear differences within it. When the differences are being made between the east and west, it becomes a clear case of exactly what makes the east the ‘east’ and what makes the west the ‘west’. There are a number of differences however, and these differences also make it difficult to explain the question of Sydney’s division, as they not only show cleavages, but they also show cohesion. This paper will attempt to determine the case for east and west Sydney with particular emphasis on what the differences are, and how they help to create the idea of ‘Sydney’ within the sphere of the Higher School Certificate Geography unit of ‘Urban Places’. More specifically, this paper will act as a case study for the results of urban dynamics and highlight the social structure and spatial patterns of advantage and disadvantage, wealth and poverty, and ethnicity within Sydney.
What is ‘Sydney’?Sydney is the most populous city in Australia, with the latest Bureau of Statistics Australian Census (2013) data indicating that 4,391,674 people reside within it (with 6,917,658 in NSW). While the suburbs seem to flow into one another with a gradual change in infrastructure and other economic and social facilities, it is evident that a very distinct division within the city exists. The east may be said to include anything east of the Sydney City/Botany Bay border, moving north and south. Moving west from there to the border of Parramatta can be said to be classified as the inner west. The greater west can then be said to include anything west of Parramatta. However, the west, for the purposes of this paper will include both the inner west and the greater west. Figure 1 below shows these approximate divisions.
Figure 1: Sydney Councils (adapted from Aucitypops 2007)
https://commons.wikimedia.org/wiki/File:Sydney_councils.png
Collins (2000) makes mention of the differences which occur within Sydney, however, many people have a perceived image of what ‘east’ and ‘west’ Sydney is. This perception is flawed and works on false generalisations. Waitt et al (2000) notes that there is a clear ‘us’ and ‘them’ view of Sydney, where the west is riddled with crime, unemployment and a generally depressing environment while the east is seen as being a more sophisticated, enjoyable and profitable place to live. These generalisations only help to perpetuate the view that people have, and while for a minority, the generalisations may be true on both sides of the divide, there is also an opposite trend that occurs. The view that east Sydney is wealthier than the west may be the product of globalisation. Sydney and its people are shaped by the increasing internationalisation of culture, economics and finance (Collins 2000), and this, invariably has led to a number of global institutions
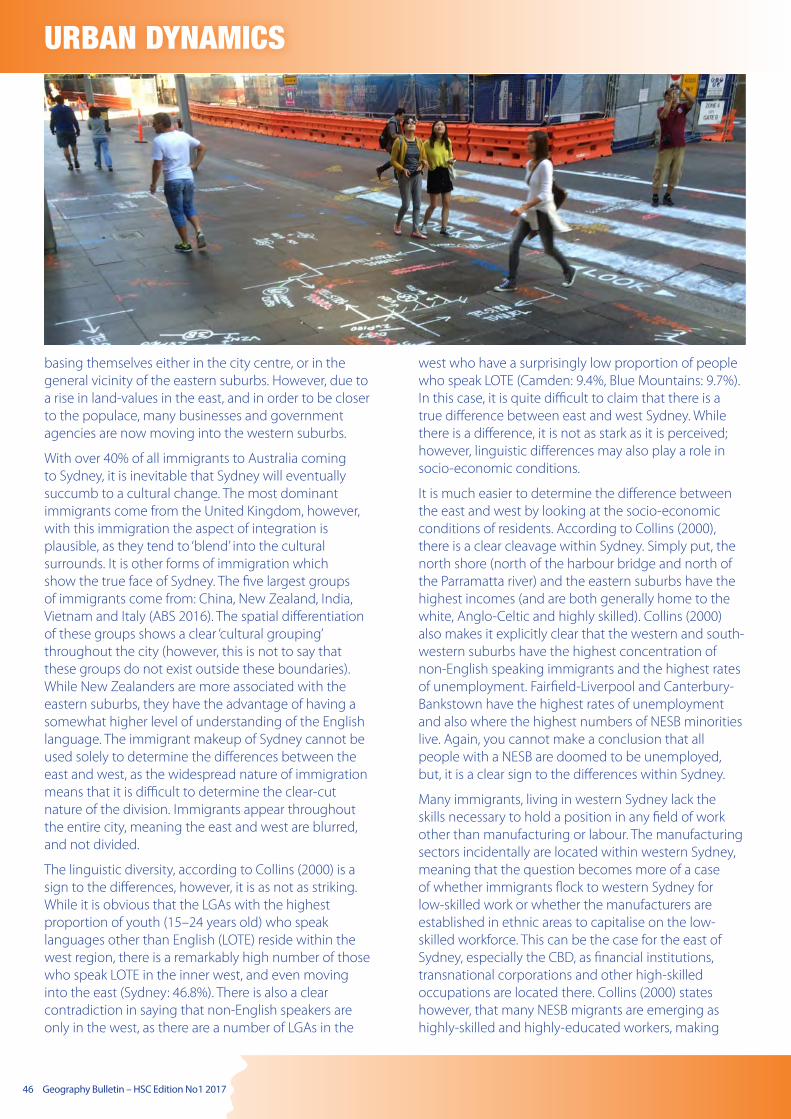
46 Geography Bulletin – HSC Edition No 1 2017
URBAN DYNAMICS
basing themselves either in the city centre, or in the general vicinity of the eastern suburbs. However, due to a rise in land-values in the east, and in order to be closer to the populace, many businesses and government agencies are now moving into the western suburbs.
With over 40% of all immigrants to Australia coming to Sydney, it is inevitable that Sydney will eventually succumb to a cultural change. The most dominant immigrants come from the United Kingdom, however, with this immigration the aspect of integration is plausible, as they tend to ‘blend’ into the cultural surrounds. It is other forms of immigration which show the true face of Sydney. The five largest groups of immigrants come from: China, New Zealand, India, Vietnam and Italy (ABS 2016). The spatial differentiation of these groups shows a clear ‘cultural grouping’ throughout the city (however, this is not to say that these groups do not exist outside these boundaries). While New Zealanders are more associated with the eastern suburbs, they have the advantage of having a somewhat higher level of understanding of the English language. The immigrant makeup of Sydney cannot be used solely to determine the differences between the east and west, as the widespread nature of immigration means that it is difficult to determine the clear-cut nature of the division. Immigrants appear throughout the entire city, meaning the east and west are blurred, and not divided.
The linguistic diversity, according to Collins (2000) is a sign to the differences, however, it is as not as striking. While it is obvious that the LGAs with the highest proportion of youth (15–24 years old) who speak languages other than English (LOTE) reside within the west region, there is a remarkably high number of those who speak LOTE in the inner west, and even moving into the east (Sydney: 46.8%). There is also a clear contradiction in saying that non-English speakers are only in the west, as there are a number of LGAs in the
west who have a surprisingly low proportion of people who speak LOTE (Camden: 9.4%, Blue Mountains: 9.7%). In this case, it is quite difficult to claim that there is a true difference between east and west Sydney. While there is a difference, it is not as stark as it is perceived; however, linguistic differences may also play a role in socio-economic conditions.
It is much easier to determine the difference between the east and west by looking at the socio-economic conditions of residents. According to Collins (2000), there is a clear cleavage within Sydney. Simply put, the north shore (north of the harbour bridge and north of the Parramatta river) and the eastern suburbs have the highest incomes (and are both generally home to the white, Anglo-Celtic and highly skilled). Collins (2000) also makes it explicitly clear that the western and south-western suburbs have the highest concentration of non-English speaking immigrants and the highest rates of unemployment. Fairfield-Liverpool and Canterbury-Bankstown have the highest rates of unemployment and also where the highest numbers of NESB minorities live. Again, you cannot make a conclusion that all people with a NESB are doomed to be unemployed, but, it is a clear sign to the differences within Sydney.
Many immigrants, living in western Sydney lack the skills necessary to hold a position in any field of work other than manufacturing or labour. The manufacturing sectors incidentally are located within western Sydney, meaning that the question becomes more of a case of whether immigrants flock to western Sydney for low-skilled work or whether the manufacturers are established in ethnic areas to capitalise on the low-skilled workforce. This can be the case for the east of Sydney, especially the CBD, as financial institutions, transnational corporations and other high-skilled occupations are located there. Collins (2000) states however, that many NESB migrants are emerging as highly-skilled and highly-educated workers, making
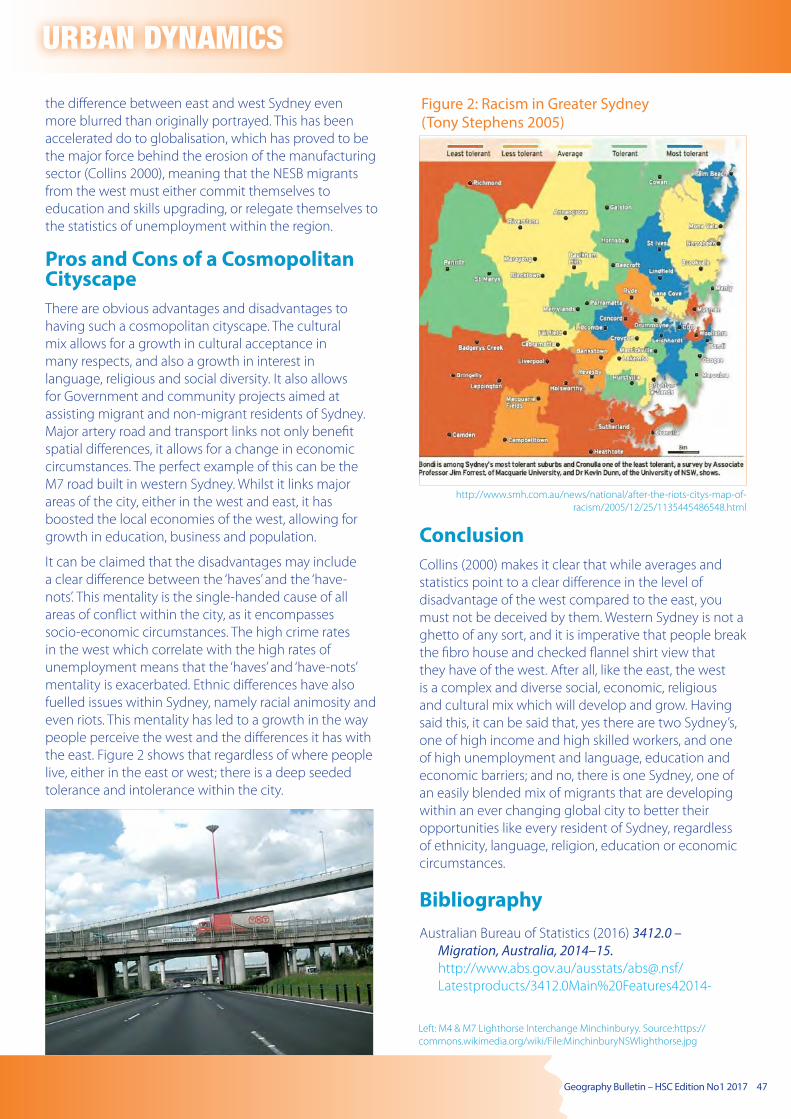
Geography Bulletin – HSC Edition No 1 2017 47
URBAN DYNAMICS the difference between east and west Sydney even more blurred than originally portrayed. This has been accelerated do to globalisation, which has proved to be the major force behind the erosion of the manufacturing sector (Collins 2000), meaning that the NESB migrants from the west must either commit themselves to education and skills upgrading, or relegate themselves to the statistics of unemployment within the region.
Pros and Cons of a Cosmopolitan CityscapeThere are obvious advantages and disadvantages to having such a cosmopolitan cityscape. The cultural mix allows for a growth in cultural acceptance in many respects, and also a growth in interest in language, religious and social diversity. It also allows for Government and community projects aimed at assisting migrant and non-migrant residents of Sydney. Major artery road and transport links not only benefit spatial differences, it allows for a change in economic circumstances. The perfect example of this can be the M7 road built in western Sydney. Whilst it links major areas of the city, either in the west and east, it has boosted the local economies of the west, allowing for growth in education, business and population.
It can be claimed that the disadvantages may include a clear difference between the ‘haves’ and the ‘have-nots’. This mentality is the single-handed cause of all areas of conflict within the city, as it encompasses socio-economic circumstances. The high crime rates in the west which correlate with the high rates of unemployment means that the ‘haves’ and ‘have-nots’ mentality is exacerbated. Ethnic differences have also fuelled issues within Sydney, namely racial animosity and even riots. This mentality has led to a growth in the way people perceive the west and the differences it has with the east. Figure 2 shows that regardless of where people live, either in the east or west; there is a deep seeded tolerance and intolerance within the city.
Figure 2: Racism in Greater Sydney (Tony Stephens 2005)
http://www.smh.com.au/news/national/after-the-riots-citys-map-of-racism/2005/12/25/1135445486548.html
ConclusionCollins (2000) makes it clear that while averages and statistics point to a clear difference in the level of disadvantage of the west compared to the east, you must not be deceived by them. Western Sydney is not a ghetto of any sort, and it is imperative that people break the fibro house and checked flannel shirt view that they have of the west. After all, like the east, the west is a complex and diverse social, economic, religious and cultural mix which will develop and grow. Having said this, it can be said that, yes there are two Sydney’s, one of high income and high skilled workers, and one of high unemployment and language, education and economic barriers; and no, there is one Sydney, one of an easily blended mix of migrants that are developing within an ever changing global city to better their opportunities like every resident of Sydney, regardless of ethnicity, language, religion, education or economic circumstances.
BibliographyAustralian Bureau of Statistics (2016) 3412.0 –
Migration, Australia, 2014–15. http://www.abs.gov.au/ausstats/[email protected]/Latestproducts/3412.0Main%20Features42014-
Left: M4 & M7 Lighthorse Interchange Minchinburyy. Source:https://commons.wikimedia.org/wiki/File:MinchinburyNSWlighthorse.jpg

48 Geography Bulletin – HSC Edition No 1 2017
GEOGRAPHY BULLETIN
Past and upcoming editions with HSC relevance
Collated by Lorraine Chaffer President and editor GTANSW
Although most articles written in the past three year have focused on supporting the implementation of the new K–10 Geography Syllabus, there has been material published specifically for Stage 6 teachers.
Materials written for Stages 4 & 5 can be adapted for Stage 6 studies in both the preliminary and HSC courses. The most recent articles are identified below. These are accessible to GTANSW members through their login on the GTANSW website at www.gtansw.org.au/index.php
Templates based on syllabus headings can be used to identify information relevant to different syllabus sections.
HSC PEOPLE and ECONOMIC ACTIVITYChocolate (cocoa) by Dr Susan Bliss (Sample pages Volume 49 No1 2017)
Use a template containing syllabus content sections to locate the information relevant to a study of Cocoa/chocolate production at a global scale
Global Tourism Update, Las Vegas and Global Cruise Industry by Dr Grant Kleeman
(Sample pages Volume 46 No 1 2014)

Geography Bulletin – HSC Edition No 1 2017 49
GEOGRAPHY BULLETIN HSC ECONOMIC ACTIVITY
http://cimbaliuk.com/current-position-global-coffee-trade/
Upcoming Geography Bulletin 3 2017
Coffee an economic activity and economic enterprise study (Sample pages No 3 2017)
http://www.iflscience.com/environment/climate-change-set-to-halve-global-coffee-production-by-2050/
HSC URBAN PLACESHong Kong as a large city study by Timothy Kelleher(Sample pages Volume 48 No 1 2016)
Detroit: A large city in the developed world by Alexandria Lucas (Sample pages Volume 47 No 2 2015)

50 Geography Bulletin – HSC Edition No 1 2017
GEOGRAPHY BULLETIN Reflections: HSC Geography via regional NSW and Central Australia by Susan Caldis (Sample pages Volume 47 No 1 2015)
These articles could be used as an introduction to People and Economic Activity or the basis for a similar investigation in a selected location.
PRELIMINARY: BIOPHYSICAL INTERACTIONSBiophysical Interactions: flipped classroom approach by Susan Caldis
(Sample pages Volume 47 No 3 2015)
Canada: Beautiful, liveable yet vulnerable series by Lorraine Chaffer This series, written to support various topics in the 7-10 syllabus, can be used to study biophysical Interactions using Canada as an illustrative example or case study. The components of the biophysical environment (atmosphere, hydrosphere, lithosphere and atmosphere) can be studied separately or through the interactions that produce Canada’s unique landscapes.
Hydrosphere & Atmosphere (Parts 3 and 4)(Sample pages Volume 48 No 1 & No 3 2016)

Geography Bulletin – HSC Edition No 1 2017 51
GEOGRAPHY BULLETIN Hydrosphere, lithosphere, atmosphere and biosphere (Parts 1 & 2)
(Sample pages Volume 47 No 4 2015)
Biophysical interactions: Malaria by Marco Cimino A study of the biophysical interactions that create a natural biological hazard
(Sample pages Volume 48 No 2 2016)
Invasive species in Australia’s aquatic environments by Lorraine Chaffer
Written to support a study of inland water environments in Stage 5 this contemporary issue also illustrates consequences to changes to biophysical interactions.
(Sample pages Volume 48 No 3 2016)

52 Geography Bulletin – HSC Edition No 1 2017
GEOGRAPHY BULLETIN PRELIMINARY: DEVELOPMENT
India: A nation in transition and India: Impediments to development by Dr. Grant Kleeman
(Sample pages Volume 47 No 1 and No 3, 2015
PRELIMINARY: NATURAL RESOURCESSand as a natural resourceUpcoming Geography Bulletin 3 2017
Screen captures from upcoming article by Dr. Susan Bliss
India’s ‘Blood’ Mica Upcoming Geography Bulletin 3 2017

Geography Bulletin – HSC Edition No 1 2017 53
HSC PREPARATION
Using organisational templates & checklistsLorraine Chaffer
President GTANSW Geography Education Consultant
To reach their potential in the HSC students need to have their work for each topic organised and apply their content knowledge and understanding in different contexts to encourage deeper knowledge and higher order thinking.
Providing organisational templates for summarising ideas or notes can assist less organised students while checklists can assist revision and exam preparation when the volume of work seems overwhelming.
A whole of topic organiser can be a good starting point to give students the “Big Picture”. This particularly suits students who like visual prompts to “see” how and where everything fits.
There are several ways these organisers and checklists can completed:
• Individually or in groups
• Digital or hard copy (A3 is best)
• At home, school or in tutorials
• By topic sections, complete topic or whole course (End of course exam preparation)
Template 1: THE “BIG PICTURE” TOPIC SUMMARYThis circular mind map is a good example of a “Big Picture” organiser. When used in a digital platform students can work individually or collaboratively to add content.
A selection of templates and checklists are included here to demonstrate the potential.
Some examples of content have been included:
Template 1: The “Big Picture” topic summary
Template 2: Encouraging deep understanding and use of directive terms
Template 3: Categorising content
Checklist 1: Revision and exam preparation by topic content
Checklist 2: Skills revision and exam preparation by skills

54 Geography Bulletin – HSC Edition No 1 2017
HSC PREPARATIONTe
mpl
ate
2: D
EEP
KNO
WLE
DG
E O
F M
AN
AG
EMEN
T ST
RATE
GIE
S &
APP
LYIN
G D
IREC
TIV
E TE
RMS
C
ASE
STU
DY
Exam
ple
PO
RTER
’S C
REEK
WET
LAN
D (P
CW
) L C
haffe
r
DES
CRIB
E TH
E ST
RATE
GIE
SLo
catio
n /
Feat
ures
EXPL
AIN
/ A
CCO
UN
T FO
RW
hy w
as th
is s
trat
egy
used
? A
ims
EVA
LUAT
ION
W
hat h
ave
stra
tegi
es a
chie
ved
Use
crit
eria
her
e
How
doe
s th
is s
trat
egy
cont
ribut
e to
EC
OLO
GIC
AL
SUST
AIN
ABI
LITY
?
1 Co
nstr
ucte
d w
etla
nds
dow
nstr
eam
of
new
sub
urba
n de
velo
pmen
ts e
g at
“Mon
arch
Hill
s” ob
serv
ed d
urin
g fie
ldw
ork.
Man
y ha
ve a
lread
y be
en
cons
truc
ted
and
a ne
twor
k of
thes
e is
pla
nned
thro
ugho
ut th
e PC
W
catc
hmen
t. Th
ese
artifi
cial
wet
land
s us
e re
eds
to re
mov
e nu
trie
nts
and
pond
s to
allo
w s
ilt to
set
tle. S
till w
ater
in th
e po
nds
allo
ws
sunl
ight
to p
enet
rate
. UV
rays
kill
viru
ses
and
path
ogen
s. A
erat
ion
devi
ces
in p
onds
mai
ntai
n ox
ygen
co
nten
t to
supp
ort t
he b
iosp
here
–
impo
rtan
t for
a h
ealth
y aq
uatic
ec
osys
tem
.
DIA
GRA
M
The
aim
of t
hese
con
stru
cted
wet
land
s is
to re
duce
nut
rient
, sed
imen
t and
wee
d flo
ws
into
the
wet
land
. The
intr
oduc
tion
of c
onst
ruct
ed w
etla
nds
sign
ifica
ntly
im
prov
es w
ater
qua
lity
ente
ring
PCW
. (F
ield
wor
k W
ater
test
ing
stat
istic
s).
Goo
d w
ater
qua
lity
mai
ntai
ns a
hea
lthy
ecos
yste
m, t
he s
ize
of th
e w
etla
nd (l
ess
dieb
ack)
and
bio
dive
rsity
ther
eby
redu
cing
vu
lner
abili
ty to
cha
nges
in th
e ca
tchm
ent.
The
aim
is E
colo
gica
lly s
usta
inab
le
deve
lopm
ent t
hrou
gh th
e PC
W
catc
hmen
t.
Wat
er q
ualit
y in
the
wet
land
is
gene
rally
goo
d (t
he e
valu
atio
n cr
iteria
) -
Wyo
ng C
ounc
il St
ate
of T
he E
nviro
nmen
t Re
port
20.
... Th
e m
ajor
pro
blem
is in
th
e m
aint
enan
ce o
f the
con
stru
cted
w
etla
nds
in n
ew u
rban
sub
divi
sion
s. Th
ere
are
plac
es w
here
reed
s ha
ve b
een
pois
oned
and
oth
er p
lace
s w
here
silt
has
no
t bee
n re
gula
rly re
mov
ed. D
evel
oper
s ar
e on
ly re
spon
sibl
e fo
r mai
nten
ance
fo
r a li
mite
d tim
e. A
sug
gest
ed
envi
ronm
enta
l lev
y fo
r the
mai
nten
ance
of
thes
e st
ruct
ures
by
loca
l cou
ncil
is y
et
to b
e im
plem
ente
d. C
urre
nt u
rban
isat
ion
is o
ccur
ring
fast
er th
an th
e cr
eatio
n of
ne
w w
etla
nds
mak
ing
the
futu
re h
ealt
h of
PCW
unc
erta
in.
By c
ontr
ibut
ing
to th
e m
aint
enan
ce
of b
iodi
vers
ity
ensu
ring
the
wet
land
is
larg
e en
ough
to m
aint
ain
the
ecol
ogic
al p
roce
sses
ass
ocia
ted
with
w
ater
flow
this
str
ateg
y is
con
trib
utin
g to
the
sust
aina
bilit
y of
Por
ter’s
Cre
ek
Wet
land
.
If th
e w
etla
nd c
an b
e m
aint
aine
d in
it’
s pr
esen
t sta
te fo
r the
ben
efit o
f fu
ture
gen
erat
ions
then
intr
a an
d in
terg
ener
atio
nal e
quit
y is
ens
ured
.
(The
se a
re a
lso
eval
uatio
n cr
iteria
)
2 Ca
tchm
ent M
anag
emen
t
3 Re
habi
litat
ion

Geography Bulletin – HSC Edition No 1 2017 55
HSC PREPARATION
Template 3: CATEGORISING CONTENT
CASE STUDY 1: GREAT BARRIER REEF
TYPE OF MANAGEMENT ACTION EXAMPLES OF STRATEGIES USED TO MANAGE GBR
Exclusion
Zoning – to allow multiple uses in different locations. Access to some places is restricted to scientific study
Tourism – access in selected areas and within those areas in restricted locations that are changed by relocating pontoons
Shipping restrictions and rules of access to shipping channels (Use of pilots)
Action eg. – controlled use eg zoning,
quotas
– restoration eg. revegetation of native species
– rehabilitation eg. revegetation
– replacement eg. constructed wetlands
Surveillance of activities and enforcement of rules – fines for infringements or confiscation of boats and licences
Reef Water Quality protection plan to reduce sediment and nutrient loads from catchment activities.
Design eg.
– constructed wetlands, fences, urban planning
Farmers fence riparian zones to reduce access by cattle and livestock. This reduces sediment and nutrients from farming activities entering GBR inland catchments.
Legislation eg
– water tanks on new houses
Great Barrier Reef Marine Park creation
Land clearing in GBR catchments
Fishing and shipping laws and regulations
EducationTourism operators conduct informational session on all GBR tours.
Websites created to provide educational materials.

56 Geography Bulletin – HSC Edition No 1 2017
HSC PREPARATION
Case study 2: PORTER’S CREEK WETLAND
TYPE OF MANAGEMENT ACTION EXAMPLES OF STRATEGIES USED TO MANAGE PCW
Exclusion Exclusion due to lack of access rather than and specific exclusion zones
Action eg. – controlled use eg zoning, quotas
– restoration eg. revegetation of native species
– rehabilitation eg. revegetation
– replacement eg. constructed wetlands
Buyback to increase wetland size and reduce vulnerability
Replanting native species on edges of the wetland
Reducing stormwater runoff to reduce tree dieback
Design eg.
– constructed wetlands, fences, urban planning
Constructed wetlands, roads running around contours of hills, grassed swales in housing estates, houses facing wetlands reduce illegal dumping and clearing.
Legislation eg
– water tanks on new houses
Identified wetland of significance in state legislation
Council regulations on land clearing, sediment controls on housing subdivisions, water tanks to reduce runoff and erosion, fines for dumping rubbish.
Education Educational signs on the edges of the wetland and around constructed wetlands in new suburbs.

Geography Bulletin – HSC Edition No 1 2017 57
HSC PREPARATION
Checklist 1: REVISION and EXAM PREPARATION by topic
TOPIC CONTENT STUDY SUMMARY STUDIED
PRACTICE QUESTIONS ATTEMPTED
TUTORIALS or GROUP REVISION
URBAN PLACES CompletedTick each time
you study a section
Tick when you complete an
answerTick each time
you attend
world cities• the nature, character and spatial distribution of
world cities
• the role of world cities as powerful centres of economic and cultural authority
• the operation of global networks
• the relationships of dominance and dependence between world cities and other urban centres and the changing role of regional centres and the demise of the small town.
mega cities• the nature, character and spatial distribution of
mega cities in the developing world
• the challenges of living in mega cities such as housing, traffic infrastructure, water and power supplies, sanitation services, employment, and other social and health issues
• the responses to these challenges such as self-help projects, community self-government, cooperation from NGOs, urban protest and the operations of informal economies.
urban dynamics• the urban dynamics of change:
suburbanisation, exurbanisation, counterurbanisation, decentralisation, consolidation, urban decay, urban renewal, urban village, spatial exclusion
• a case study of the results of the urban dynamics in a large city selected from the developed world including its
– social structure and spatial patterns of advantage and disadvantage, wealth and poverty, ethnicity
– changing economic character, nature and location of residential land, commercial and industrial development
– culture of place as expressed in the architecture, streetscape, heritage architecture, noise, colour, street life, energy, vitality and lifestyles
– growth, development, future trends and ecological sustainability
• a case study showing one of the urban dynamics listed above, operating in a country town or suburb.

58 Geography Bulletin – HSC Edition No 1 2017
HSC PREPARATION
TOPIC CONTENT STUDY SUMMARY STUDIED PRACTICE
QUESTIONS
TUTORIALS or GROUP REVISION
PEOPLE & ECONOMIC ACTIVITY CompletedTick each time
you study a section
Tick when you complete an
answer
Tick each time you attend
global economic activity• a description of the nature, spatial patterns and
future directions of ONE economic activity in a global context.
• factors explaining the nature, spatial patterns and future directions of the selected economic activity such as:
– biophysical: climate, soils, topography, site
– ecological: sustainability and resource use
– economic: competitive advantage, consumer demand, mobility of labour and capital
– sociocultural: tradition, changing lifestyles, labour participation rates
– organisational: ownership, decision making and control
– technological: transportation, information transmission and flows, biotechnology
– political: quotas, tariffs, compacts, agreements
• the environmental, social and economic impacts of the economic activity such as pollution, resource depletion, labour exploitation, cultural integration, provision of infrastructure, job creation, transfer pricing.
local case study• a geographical study of an economic enterprise
operating at a local scale.
The case study should explore:
– the nature of the economic enterprise
– locational factors
– ecological dimensions including environmental constraints, climate, and human impacts on the environment such as pollution and ecological sustainability
– internal and external linkages and flows of people, goods, services and ideas
– effects of global changes in the economic activity on the enterprise.

Geography Bulletin – HSC Edition No 1 2017 59
HSC PREPARATION
TOPIC CONTENT STUDY SUMMARY STUDIED PRACTICE
QUESTIONS
TUTORIALS or GROUP REVISION
ECOSYSTEMS AT RISK CompletedTick each time
you study a section
Tick when you complete an
answer
Tick each time you attend
* Biophysical interactions which lead to diverse ecosystems and their functioning • vulnerability and resilience of ecosystems
– impacts due to natural stress
– impacts due to human induced modifications to energy flows, nutrient cycling, and relationships between biophysical components
• the importance of ecosystem management and protection
– maintenance of genetic diversity
– utility values
– intrinsic values
– heritage values
– need to allow natural change to proceed
• evaluation of traditional and contemporary management strategies.
Case study 1 • spatial patterns and dimensions: location, altitude,
latitude, size, shape and continuity
• biophysical interactions including:
– the dynamics of weather and climate
– geomorphic and hydrologic processes such as earth movements, weathering, erosion, transport and deposition, soil formation
– biogeographical processes: invasion, succession, modification, resilience
– adjustments in response to natural stress
• the nature and rate of change which affects ecosystem functioning
– human impacts (both positive and negative)
• traditional and contemporary management practices.
Case study 2• spatial patterns and dimensions: location, altitude,
latitude, size, shape and continuity
• biophysical interactions including:
– the dynamics of weather and climate
– geomorphic and hydrologic processes such as earth movements, weathering, erosion, transport and deposition, soil formation
– biogeographical processes: invasion, succession, modification, resilience
– adjustments in response to natural stress the nature and rate of change which affects ecosystem functioning
– human impacts (both positive and negative)
– traditional and contemporary management practices.

60 Geography Bulletin – HSC Edition No 1 2017
HSC PREPARATION
Checklist 2: GEOGRAPHICAL TOOLS and SKILLS
SKILLS FROM HSC SYLLABUS DOCUMENT Attempt 1 Attempt 2 Confident
Students learn to interpret maps by:
• calculating the gradient of a slope as a ratio
• calculating the vertical exaggeration of a cross-section
• determining sight lines between two points
• constructing a transect between two points and describing the changes along it
• identifying spatial interaction and change using a variety of sources
• describing patterns, relationships, networks, linkages and evidence of change within and between regions or areas
• determining the density of a specific feature on a map
• reading, constructing and interpreting choropleth maps
• recognising the key features of changing pressure patterns on weather maps
• designing and interpreting flowcharts.
Students learn to analyse graphs and statistics by:
• calculating the rate of increase or decrease between two points
• estimating the value of proportional circles of different size using a key
• estimating the value of particular segments in pie graphs of different size
• identifying the three elements depicted in a ternary graph and the line scale of each
• stating the ‘mix’ of elements at any point on a ternary graph
• identifying clusters and patterns on a ternary graph
• constructing and interpreting proportional divided circles
• interpreting frequency distributions and diagrams
• reading and interpreting logarithmic and semilogarithmic graphs
• interpreting and analysing population pyramid data.
Students learn to interpret photographs by:
• orientating a photo to a map
• estimating the scale of aerial photographs and satellite images
• estimating the time of day at which a photograph was taken
• calculating areas of land use as a ratio
• identifying spatial associations, interactions and change
• constructing a precis map from an aerial photograph or satellite image
• using Geographic Information Systems (GIS) to examine spatial and ecological issues.
Students learn to conduct fieldwork by:
• formulating a geographical question or issue for study• identifying, collecting and recording geographical data from a variety of primary
sources• constructing a log of events and activities, which records the development of a
fieldwork activity
• synthesising data and evaluating the fieldwork activity.
*** Attempt Fieldwork related skills questions
NOTE: These skills and tools may be applied and assessed in any of the course topics. Examples of their application are provided in each of the Preliminary and HSC topics in the syllabus. The HSC ones are shown below.

Geography Bulletin – HSC Edition No 1 2017 61
8.3.1 Ecosystems at Risk
use geographical skills and tools such as:
• calculating the gradient of a slope as a ratio
• calculating the vertical exaggeration of a cross section describing a specific ecosystem
• determining sight lines between two points
• recognising features of changing pressure patterns on weather maps in order to describe characteristics of different ecosystems
• constructing a log of events and activities to manage the development of a fieldwork activity explaining human impacts on an ecosystem at risk
• interpreting frequency distributions and diagrams about energy flows in different ecosystems
• constructing a precis map from an aerial photo or satellite image to describe spatial patterns of overland flow
• using GIS to examine spatial and ecological issues relevant to the protection and management of ecosystems.
identify geographical methods applicable to, and useful in, the workplace such as:
• using meteorological data, satellite imagery and aerial photography
• constructing environmental maps and compiling environmental impact reports
• the relevance of a geographical understanding of ecosystems at risk to a particular vocation such as: managing a national park, guiding tourist groups, ecological mapping for surveyors, evaluating dune stabilisation programs preserving heritage sites.
8.3.2 Urban Places
use geographical skills and tools such as:
• calculating population density using maps of a large city
• constructing a transect to show land use change in a local area
• describing patterns, linkages, networks and change, using maps of large cities and other urban areas
• constructing and interpreting choropleth maps
• synthesising and evaluating fieldwork data about the dynamics of change in a country town or suburb
• interpreting trends from logarithmic and semilogarithmic data about the growth of mega cities
• analysing population pyramid data to investigate the implications on health and social issues of a rapidly growing city
• calculating the time of day when a photograph was taken and relating a photo to a map of a streetscape.
identify geographical methods applicable to and useful in the workplace such as:
• using GIS, satellite imagery and aerial photography
• analysing maps including topographic, cadastral and land use maps
• collecting and analysing urban field data
• the relevance of a geographical understanding of urban places to a particular vocation such as: urban and regional planning, designing effective city infrastructure, planning the delivery of social services, monitoring environmental quality and sustainability, preserving heritage sites
HSC PREPARATION

62 Geography Bulletin – HSC Edition No 1 2017
HSC PREPARATION
8.3.3 People and Economic Activity
use geographical skills and tools such as:
• analysing spatial relationships using land use and topographic maps
• interpreting flow charts depicting trade data
• identifying, collecting and recording geographical data from primary sources through fieldwork
• calculating the rate of increase or decrease between two points on a line graph showing employment change
• interpreting a ternary graph depicting raw material inputs
• interpreting proportional circles containing pie graphs
• calculating the area of a land use or vegetation type from aerial photographs, absolutely and relatively
• identifying spatial associations, interactions and changes from aerial photographs.
identify geographical methods applicable to and useful in the workplace such as:
• analysing census data, statistical registers and digests, economic production data and reports
• analysing aerial photographs, electronic street directories, cadastral maps, tourist maps, atlases
• collecting and analysing field data about economic activity
• the relevance of a geographical understanding of people and economic activity to a particular vocation such as: advising public servants, consulting in market and commercial research, contributing to environmental impact statements.
Meet a Geographer – Caring for the environment
Kathryn GoyenProfessional Development Coordinator – LandLearnDepartment of Primary Industries (DPI)
In my work every day is different! Some examples of things that I do, include researching issues relating to sustainable agriculture and natural resource management, writing the information up into activities, and trialling these activities with school students. I also run workshops with teachers showing them ideas of activities that can be undertaken in schools. On some days I will be in the office, however on other days I am out in forests or paddocks taking teachers and students on fieldwork looking at salinity, or issues associated with water use or land management.
Read more about Kathryn Goyen at GeoCareers – http://geocareers.net.au/environmental_care/goyen_k.htm
The GeoCareers website is an initiative of the Australian Geography Teachers’ Association (AGTA).
www.geocareers.net.au

Geography Bulletin – HSC Edition No 1 2017 63
1. Objective: The Geography Bulletin is the quarterly journal of the New South Wales Geography Teachers’ Association, Inc. The role of the Geography Bulletin is to disseminate up-to-date geographical information and to widen access to new geographic teaching ideas and methods. Articles of interest to teachers and students of geography in both secondary and tertiary institutions are invited, and contributions of factually correct, informed analyses, and case studies suitable for use in secondary schools are particularly welcomed.
2. Content: Articles, not normally exceeding 5000 words (no minimum specification), should be submitted to the GTANSW Office [email protected] or by mail to: . PO Box 699, Lidcombe, NSW 1825 who will forward to the editor: Submissions can also be sent directly to the editor: Lorraine Chaffer ([email protected])
Articles are welcomed from tertiary and secondary teachers, students, business and government representatives. Articles may also be solicited from time to time. Articles submitted will be evaluated according to their ability to meet the objectives outlined above.
3. Format: Digital submission in Word format. Tables should be on separate pages, one per page, and figures should be clearly drawn, one per page, in black on opaque paper suitable for reproduction. Photographs should be in high resolution digital format. An indication should be given in the text of approximate location of tables, figures and photographs. Every illustration needs a caption. Photographs, tables and illustrations sourced from the internet must acknowledge the source and have a URL link to the original context.
4. Title: The title should be short, yet clear and descriptive. The author’s name should appear in full, together with a full title of position held and location of employment.
5. Covering Letter: As email with submitted articles. If the manuscript has been submitted to another journal, this should be stated clearly.
6. Photo of Contributor: Contributors may enclose a passport-type photograph and a brief biographical statement as part of their article.
7. References: References should follow the conventional author-date format: Abbott, B. K. (1980) The Historical and Geographical
Development of Muswellbrook Newcastle: Hunter Valley Press.
Harrison, T. L. (1973a) Railway to Jugiong Adelaide: The Rosebud Press. (2nd Ed.)
Harrison, T. L. (1973b) The Spatial Distribution of Macadamia Plantations on the Far North Coast of New South Wales, Journal of Rural and Agricultural Problems, 13, 4, Oct. pp. 347–359.
O’Donovan, M. J., et. al. (1980) “Animal life in the North Star District of New South Wales”. In W.W. Murphy, (Ed.) Readings in Regional Geography (Vol. 2), Sydney: Williams and Sons.
8. Spelling should follow the Macquarie Dictionary, and Australian place names should follow the Geographical Place Names Board for the appropriate state.
Editorial policy attempts to:
• promote material which will assist the study and teaching of geography
• encourage teachers to share their ideas on teaching geography
• provide a means by which teachers can publish articles
• inform readers of developments in geographical education
Articles are sought reflecting research and innovations in teaching practices in schools. From time to time issues of the Bulletin address specific themes.
Refereeing
All suitable manuscripts submitted to the Geography Bulletin are subject to the process of review. The authors and contributors alone are responsible for the opinions expressed in their articles and while reasonable checks are made to ensure the accuracy of all statements, neither the editor nor the Geography Teachers’ Association of New South Wales Inc accepts responsibility for statements or opinions expressed herein.
Books for review should be sent to:The GTA NSW CouncilPO Box 699Lidcombe NSW 1825
Editions
There are four bulletins each year – two published each semester.
Notice to Advertisers
‘Geography Bulletin’ welcomes advertisements concerning publications, resources, workshops, etc. relevant to geography education.
FULL PAGE (26 x 18cm) – $368.50 Special issues $649.00
HALF PAGE (18 x 13cm or 26 x 8.5cm) – $214.50 Special Issues $382.80
QUARTER PAGE (13 x 8.5cm or 18 x 6.5cm) – $132.00 Special issues $242.00
INSERTS (A4 supplied) – $374.00 All prices include GST
Advertising bookings should be directed to: GTA NSW OfficeTelephone: (02) 9716 0378Fax: (02) 9564 2342Email: [email protected]
ADVICE TO CONTRIBUTORS

64 Geography Bulletin – HSC Edition No 1 2017
AGTA ANNOUNCES AN ESSENTIAL NEW GEOGRAPHY RESOURCE
Geography Skills Unlocked is an exciting new skills book for Australian secondary schools
KEY FEATURES: Contents aligned to the inquiry and skills-based
requirements of Australian Curriculum: Geography
An engaging, easy to navigate design
A student friendly approach with step-by-step explanations, descriptions and worked examples
A focus on emerging technologies used to gather, analyse and present geographical data
GeoSkills and GeoInquiry activities that scaffold student learning
A wealth of stimulus material including a diverse range of maps, graphs, aerial photographs, satellite images, diagrams and photographs
Examples drawn from each Australian state and territory with additional international material
Key terms explained in embedded glossary boxes
Geography Skills Unlocked is published by the Australian Geography Teachers Association and written by a team of experienced Geography teachers.
Geography Skills Unlocked will be published mid 2016 and will be available for purchase via the AGTA website: www.agta.asn.au/Products


![walkeronline.files.wordpress.com · Web viewQuestion 26] 2011 HSC. Question 27) 2009 HSC. Question 26 OR 27 – 2008 HSC. Question 22c – 2007 HSC. Question 25 – 2007 HSC . Question](https://static.cupdf.com/doc/110x72/5f729fa6ab3ff2103b11719e/web-view-question-26-2011-hsc-question-27-2009-hsc-question-26-or-27-a-2008.jpg)