RIO DE JANEIRO / BR
BUENOS AIRES / AR
HOW GREEN IS A CITY? Group: Angélica Vidal, Cadu Canto, Caio Ramiro, Hugo Lopez, Ricardo Comin, Ricardo Shoji, Marcelo Figueiredo.

OVERVIEW RIO:
Since 1565
Population : 6.323.037
Area (km2) : 1.264,296
Density (inhabitants/km2) : 5.002
GDP/capita : R$ 28.405 (2009)
Greater Rio de Janeiro
Pop.: 13.000.000 (Latin America 2nd) [2010]
BAIRES:
Since 1536
Population : 3.050.000
Area (km2) : 203,000
Density (inhabitants/km2) : 14.826
GDP/capita : ARS$ 40.482 (2008)
Greater Buenos Aires
Pop.: 11.812.482 (Latin America 3rd)
RIO DE JANEIRO
BUENOS AIRES
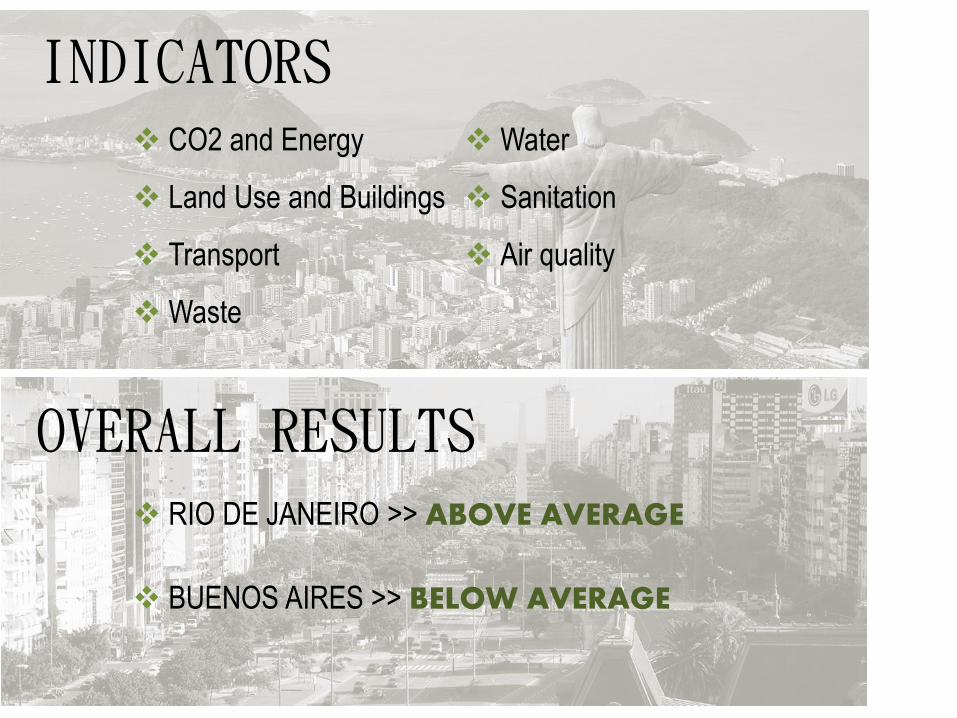
OVERALL RESULTS
INDICATORS CO2 and Energy
Land Use and Buildings
Transport
Waste
Water
Sanitation
Air quality
RIO DE JANEIRO >> ABOVE AVERAGE
BUENOS AIRES >> BELOW AVERAGE
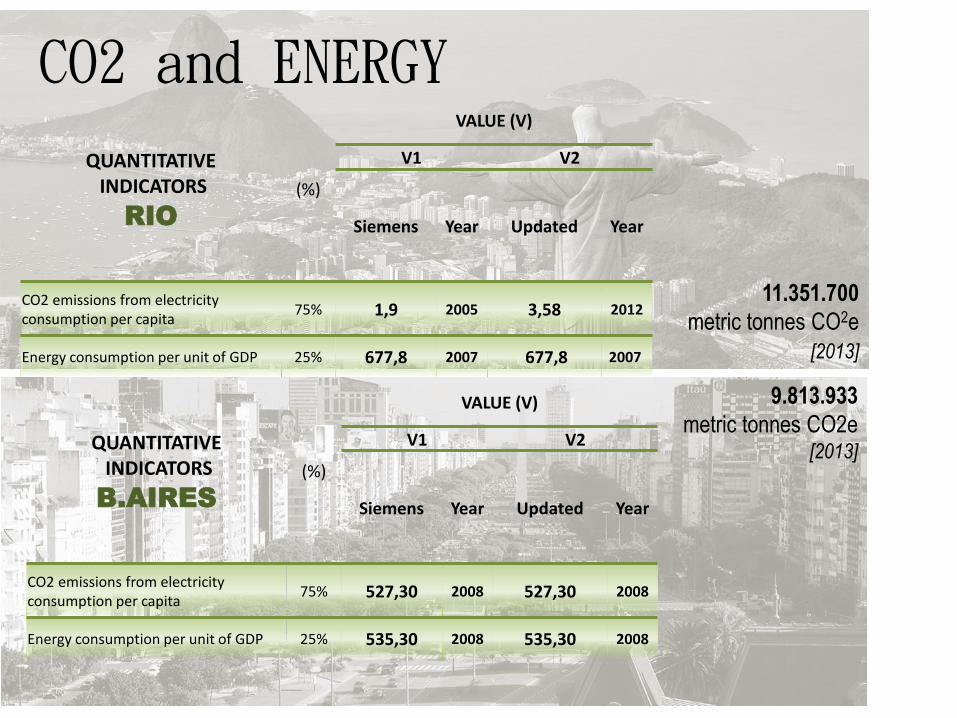
CO2 and ENERGY
QUANTITATIVE INDICATORS
RIO
(%)
VALUE (V)
V1 V2
Siemens Year Updated Year
CO2 emissions from electricity consumption per capita
75% 1,9 2005 3,58 2012
Energy consumption per unit of GDP 25% 677,8 2007 677,8 2007
QUANTITATIVE INDICATORS
B.AIRES
(%)
VALUE (V)
V1 V2
Siemens Year Updated Year
CO2 emissions from electricity consumption per capita
75% 527,30 2008 527,30 2008
Energy consumption per unit of GDP 25% 535,30 2008 535,30 2008
11.351.700
metric tonnes CO2e
[2013]
9.813.933
metric tonnes CO2e [2013]
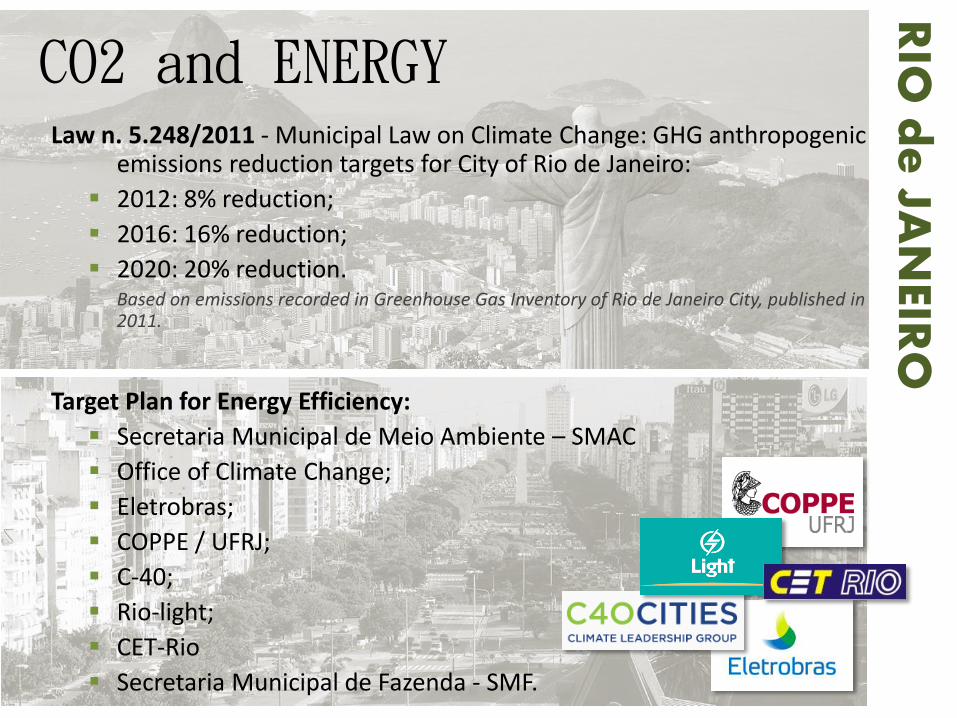
CO2 and ENERGY Law n. 5.248/2011 - Municipal Law on Climate Change: GHG anthropogenic
emissions reduction targets for City of Rio de Janeiro:
2012: 8% reduction;
2016: 16% reduction;
2020: 20% reduction. Based on emissions recorded in Greenhouse Gas Inventory of Rio de Janeiro City, published in
2011.
Target Plan for Energy Efficiency:
Secretaria Municipal de Meio Ambiente – SMAC
Office of Climate Change;
Eletrobras;
COPPE / UFRJ;
C-40;
Rio-light;
CET-Rio
Secretaria Municipal de Fazenda - SMF.
RIO
de
JAN
EIRO

CO2 and ENERGY Rio de Janeiro Low Carbon City Development Program:
Rio +20 – June 2012
ISO
World Bank
DNV KEMA Energy & Sustainability
RELUZ Program:
Eletrobras;
RIOLUZ;
development of efficient systems of street lighting;
replace 32,480 luminaires;
Reduced consumption of 33.243,32 MWh.
RIO
de
JAN
EIRO

CO2 and ENERGY Climate Change Action Plan:
Reduction target: 30%
Target date: 2030
First target period to achieve in 2015: awareness and training
campaigns in order to encourage the use of clean energy while offering
subsidies and financial incentives.
Cleaner Production Program (P + L):
Environmental Protection Agency (EPA);
Agreements with 60 companies; designing, implementing, and
evaluating Environmental Improvement Programs;
Promoting energy efficiency to reduce consumption.
BU
ENO
S A
IRES

CO2 and ENERGY Finance Clean technology funds:
Agencia de Protección Ambiental;
City of Buenos Aires Bank;
credits with subsidized rates to SMEs (small and medium enterprises)
working on environmental improvement projects.
Environmental Education Law (N°1687)/2007:
Students study the environment and its complex interactions with
political, social, cultural, economic and ethics aspects.
The Program Green Schools acts:
Energy efficiency;
renewable energy;
climate change.
BU
ENO
S A
IRES

LAND USE and BUILDINGS
QUANTITATIVE INDICATORS
RIO
(%)
VALUE (V)
V1 V2
Siemens Year Updated Year
Green spaces per capita 50% 58 2001 58 2001
Population density 50% 5234,1 2009 5265,81 2010
QUANTITATIVE INDICATORS
B.AIRES
(%)
VALUE (V)
V1 V2
Siemens Year Updated Year
Green spaces per capita 50% 6,1 2008 3,9 2014
Population density 50% 15013,4 2009 14307,6 2010

LAND USE and BUILDINGS R
IO d
e JA
NEIR
O
Strategic Plan of the Municipality of Rio de Janeiro (2013-2016)
The strategic plan comprises several sectors and when it comes to land
use and buildings, it brings the following goals:
Reforesting 1100 ha until 2016;
Consolidate the maintenance of already reforested 2000 ha;
Implantation of ‘green corridors’ in 3 different regions of the city;
Refurbish 170000 m² of squares and parks
Elaboration of 15 ‘forest management plans’ to be followed in the city;
Achieve the eco-efficiency of the City Hall.

LAND USE and BUILDINGS R
IO d
e JA
NEIR
O
Marvelous Port Project (Projeto Porto Maravilha)
Land use changes in the port area of the city
Increase density by replacing the main coastal roads and viaducts by underground
tunnels for cars and public transport (VLT/tram) and dedicating the resulting space
above of them to afforestation and pedestrian ways.
Increase arborization and green spaces
Re-urbanization of 70km of existing streets.
Construction of new networks of water, sewage and drainage and implementation
of selective waste collection in the region.

LAND USE and BUILDINGS B
UEN
OS
AIR
ES
Green Buenos Aires Program (Programa Buenos Aires Verde):
The program, to be executed in 20 years, intends to make that each
resident have a public green space at a distance of at least 350 meters, and for
that aims:
The construction of 78 new squares;
Planting 400.000 trees;
The construction of spaces with pedestrian priority;
Embed 1 million square meters of public green area to the existing 750.000.
Energy Efficiency Program in Public Buildings:
The program aimed the reduction of 20% in the energy consumption of
100 public buildings (offices, schools and hospitals for instance) and
expected to eliminate 5000 tons of CO² emission by the end of 2012;
Currently, approximately 20 buildings undergo an energy audit and are
implementing recommended efficiency improvements;
New public buildings are required to meet certain environmental criteria.

TRANSPORT
QUANTITATIVE INDICATORS
RIO
(%)
VALUE (V)
V1 V2
Siemens Year Updated Year
Length of mass transport network 70% 8,6 2009 8,6 2009
Stock of cars and motorcycles (vehicles/p)
30% 0,26 2010 0,32 2013
QUANTITATIVE INDICATORS
B.AIRES
(%)
VALUE (V)
V1 V2
Siemens Year Updated Year
Length of mass transport network 75% 7,0 2008 7,0 2008
Stock of cars and motorcycles (vehicles/p)
25% 0,66 2008 0,66 2008

TRANSPORT
• BRT
• RIO OPERATION SYSTEM
RIO
de
JAN
EIRO
• TRANSOESTE
• TRANSCARIOCA
• TRANSOLÍMPICA

TRANSPORT
• METROBUS
• HYBRID BUSES
BU
ENO
S A
IRES

WASTE QUANTITATIVE
INDICATORS
RIO
(%)
VALUE (V)
V1 V2
Siemens Year Updated Year
Share of waste collected and adequately disposed (%) 40% 98,6% 2008 98,6% 2008
Waste generated per person (kg/person/year) 60% 525,2 2008 525,2 2008
QUANTITATIVE INDICATORS
B.AIRES
(%)
VALUE (V)
V1 V2
Siemens Year Updated Year
Share of waste collected and adequately disposed (%) 40% 100% 2008 100% 2008
Waste generated per person (kg/person/year) 60% 606,1 2008 606,1 2008
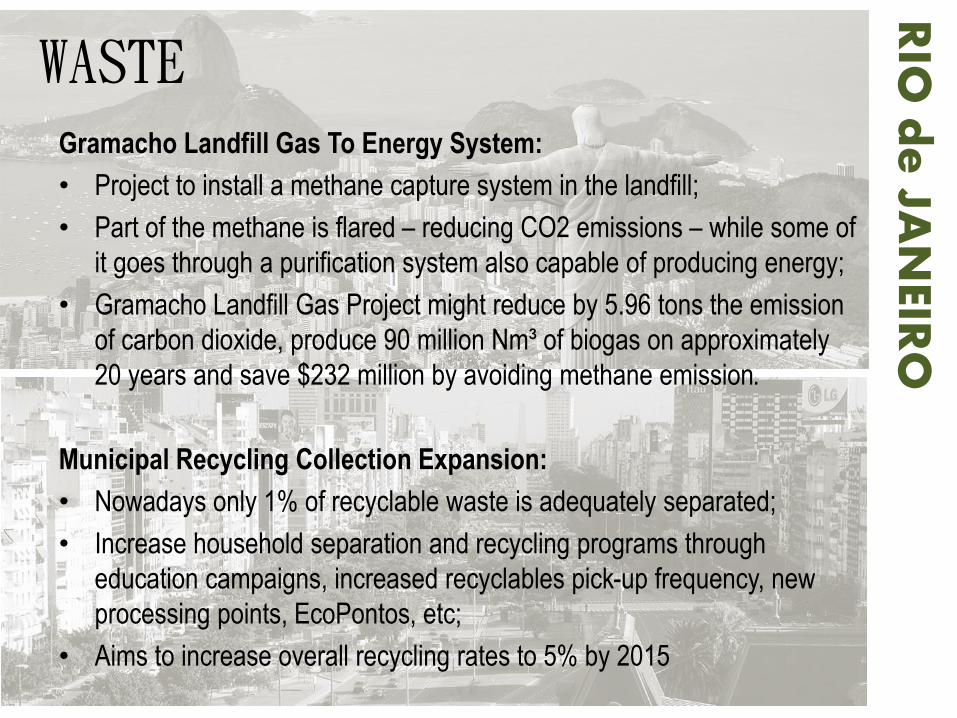
WASTE Gramacho Landfill Gas To Energy System:
• Project to install a methane capture system in the landfill;
• Part of the methane is flared – reducing CO2 emissions – while some of
it goes through a purification system also capable of producing energy;
• Gramacho Landfill Gas Project might reduce by 5.96 tons the emission
of carbon dioxide, produce 90 million Nm³ of biogas on approximately
20 years and save $232 million by avoiding methane emission.
Municipal Recycling Collection Expansion:
• Nowadays only 1% of recyclable waste is adequately separated;
• Increase household separation and recycling programs through
education campaigns, increased recyclables pick-up frequency, new
processing points, EcoPontos, etc;
• Aims to increase overall recycling rates to 5% by 2015
RIO
de
JAN
EIRO

WASTE Zero Waste, Cartoneros
• Redesign products so they last longer and its materials are recycled (or composted);
• Reduce use of landfills, improve recycling and ban incineration;
• Main cause is environmental: landfill and incinerators produce greenhouse gasses such as methane.
Gramacho Landfill Gas To Energy System, Recycling Collection Expansion
• Workers that search for recyclable materials in landfills before the trash is taken away;
• A former irregular profession that is now being regularized by Buenos Aires;
• Nowadays there are 5000 “cartoneros” that form a cooperative;
• They are provided with a living wage, health and pension benefits, transportation, uniform and gloves;
BU
ENO
S A
IRES

WATER QUANTITATIVE
INDICATORS
RIO
(%)
VALUE (V)
V1 V2
Siemens Year Updated Year
Water consumption per capita (l/hab/day) 40% 301,3 2008 312,2 2012
Access to potable water (%) 30% 98,4 2007 100 2013
Water system leakages 30% 57,7% 2008 32,8% 2012
QUANTITATIVE INDICATORS
B.AIRES
(%)
VALUE (V)
V1 V2
Siemens Year Updated Year
Water consumption per capita (l/hab/day) 40% 669,2 2008 378 - 400 2009
Access to potable water (%) 30% 100 2008 100 2013
Water system leakages 30% 40% 2008 37% 2009

WATER Program to Control Water Supply Scams
• Since 2007, CEDAE have been conducting operations to combat
clandestine facilities and regularize them.
Support for Operation and Maintenance of Water Supply Systems
Services in Low-income Areas
RIO
de
JAN
EIRO

WATER
Improvement And Preservation Of Water
Quality
• 40% decrease in water consumption and
improve it’s quality;
• Prevent the discharge of pollutants into
waterways;
BU
ENO
S A
IRES

SANITATION QUANTITATIVE
INDICATORS
RIO
(%)
VALUE (V)
V1 V2
Siemens Year Updated Year
Population with access to improved sanitation 50% 83,4% 2007 78,3% 2010
Share of waste water treated 50% 85,3% 2008 86,8% 2012
QUANTITATIVE INDICATORS
B.AIRES
(%)
VALUE (V)
V1 V2
Siemens Year Updated Year
Population with access to improved sanitation 50% 99,3% 2008 97,9% 2010
Share of waste water treated 50% 0 2008 0* 2010
* No values found regarding the city but only the whole country
SANITATION R
IO d
e JA
NEIR
O
Municipality Approach on Development Projects and Policies
• Pact for Sanitation: universalization of sanitation within the whole
state
• Morar Carioca Program: urban reintegration in slums and irregular
areas through infrastructure improvement
• Porto Maravilha Program: revitalization of the harbor area

SANITATION B
UEN
OS
AIR
ES
• Desarollo del Milenio (Millennium
Development)
• In 2003: Argentinian Government adopts and suits the millennium
goals for attending the population
• Until 2015, reduce in two-thirds the amount of people without
access to sanitation, compared to 1990
• Buenos Aires City in 2010: Increase from 94,6% to 97,9% of
population with access to sewage system, since 1990

AIR QUALITY QUANTITATIVE
INDICATORS
RIO
(%)
VALUE (V)
V1 V2
Siemens Year Updated Year
Nitrogen dioxide concentration levels 40% 57,5 2009 49,04 2015
Sulphur dioxide concentation levels 40% 3,5 2009 6,63 2015
Suspended particulate matter concentration levels
20% 24 2009 50,73 2015
QUANTITATIVE INDICATORS
B.AIRES
(%)
VALUE (V)
V1 V2
Siemens Year Updated Year
Nitrogen dioxide concentration levels 40% 27 2009 22,9 2010
Sulphur dioxide concentation levels 40% 16 1997 20 2010
Suspended particulate matter concentration levels
20% 107 1999 50 2010

AIR QUALITY MonitorAR Rio
To monitor the air quality in the city;
Inform the results to population;
To empower the population with knowledge;
Finance.
Portaria Conjunta DETRAN-RJ/FEEMA nó 17. 21/03/2022
Emission tests every year;
CO indicator.
RIO
de
JAN
EIRO

AIR QUALITY Biodiesel B20
Based on a Federal law (11.097/2005);
80% diesel and 20% bio-diesel;
8500 buses by 2016;
148.000 tonnes of CO2 and 3300 tonnes of PM10.
RIO
de
JAN
EIRO

AIR QUALITY Ecobus
Gradual replacement of circulating buses;
PM10 75%, CO 55% and 40% of other GHG;
Consumes 40% less.
BU
ENO
S A
IRES

REFERENCES • Municipal Law on Climate Change, Municipal Law Noº 5.248, 27/01/2011.
• CDP Drivng Sustainable Economies 2013, Data provided for the CDP Cities 2013 Report City of Rio de
Janeiro, Available from: C-40 Cities. [20 January 2015].
• CDP Drivng Sustainable Economies 2013, Data provided for the CDP Cities 2013 Report City of Buenos
Aires, Available from: C-40 Cities. [20 January 2015].
• Secretaria do Meio Ambiente da cidade do Rio de Janeiro, 2013, Greenhouse Gas Emissions Inventory of
the city of Rio de Janeiro in 2012 and updating the municipal plano f action for emission reduction.
• Diário Oficial do Estado do Rio de Janeiro, Decree Noº 43.216, 30/09/2011.
• Administração da prefeitura do Rio de Janeiro, Decree Noº 37.775, 10/10/2013.
• World Bank Institute, 2013, The Rio de Janeiro Low Carbon City Development Program.
• Centro de Ciência do Sistema Terrestre do Instituto Nacional de Pesquisas Espaciais & Núcleo de Estudos
de População da Universidade de Campinas, 2011, Megacidades, Vulnerabilidades e Mudanças
Climáticas: Região Metropolitana do Rio de Janeiro.
• Latin American Green City Index: Assessing the environmental performance of Latin America’s major cities

REFERENCES • http://www.epa.gov/jius/policy/rio_de_janeiro/municipal_recycling_collection_expansion.html
• http://www.epa.gov/jius/projects/rio_de_janeiro/gramacho_landfill_gas_to_energy_system.html
• http://citiscope.org/story/2014/buenos-aires-embraces-cartoneros-push-zero-waste
• http://www.greenpeace.org/international/en/news/features/ZerowastevictoryArgentina
• SECRETARIA NACIONAL DE SANEAMENTO AMBIENTAL: http://www.snis.gov.br/
• WWF REPORT: “Big Cities, Big Challenge”:
http://www.wwf.se/source.php/1390895/Big%20Cities_Big%20Water_Big%20Challenges_2011.pdf
• http://indicadores.cidadessustentaveis.org.br/static/user/user_675_programa_metas_planejamento_estrategico_13-16.pdf
• http://portomaravilha.com.br/web/sup/OperUrbanaApresent.aspx
• http://www.worldgbc.org/files/3014/0982/5868/Buenos_Aires_-_City_Market_Brief_Final.pdf
• http://www.rj.gov.br/web/sea/exibeconteudo?article-id=330838
• http://www.tratabrasil.org.br/trata-brasil-apresenta-pesquisa-sobre-necessidades-de-expansao-do-saneamento-no-rio-de-
janeiro-para-copa-2014
• http://www.epa.gov/jius/policy/rio_de_janeiro/pact_for_sanitation.html
• http://rioonwatch.org.br/?p=7342
• http://www.tratabrasil.org.br/datafiles/estudos/ranking/relatorio-completo-2014.pdf
• http://www.fao.org/fileadmin/user_upload/rlc/utf017arg/estudio/aguasresiduales/REUSO_SEGURO_DE_AGUAS_RESIDUALES_EN_ARG
ENTINA.pdf
• http://www.vocesenelfenix.com/content/agua-y-saneamiento-un-objetivo-de-desarrollo-del-milenio-los-avances-en-la-
argentina