HIV-1 Attachment Inhibitor ProdrugBMS-663068: Exposure-Response Modeling to Predict QTcF Interval
Prolongation Supporting Quantitative Dose Selection for the Phase 3 Program
I Landry, M Luo, DW Boulton, M AbuTarif
16th HIV/HEPPK Workshop27th May 2015
Bristol-Myers Squibb, Princeton, NJ, USA

Disclosure
Ishani Landry is a full time employee and stockholder of Bristol-Myers Squibb
This study was sponsored and funded by Bristol-Myers Squibb

BMS-663068 Introduction BMS-663068 is a prodrug metabolized to the active moiety
BMS-626529, a first-in-class attachment inhibitor that binds to HIV-1 gp120, preventing initial viral attachment and entry into the host CD4+ T cell, and:1,2
has a unique resistance profile with no in vitro cross-resistance to other classes of antiretrovirals3,6
has in vitro activity against HIV-1 viruses (except subtype AE and Group O)3
is active against CCR5-, CXCR4- and dual-tropic (R5X4) strains of HIV-13-6
BMS-626529 inhibits virus entry at a step prior to that inhibited by CCR5 antagonists and fusion inhibitors and does not exhibit cross-resistance to viruses resistant to these agents.
BMS-626529 is further metabolized by CYP3A4 and hydrolysis
Virologic response rates (HIV-1 RNA <50 c/mL) appear to be similar across the BMS-663068 and ATV/r treatment arms.
BMS-663068 is generally well tolerated with no dose-related safety signals or AEs led to discontinuation.
Conversion of BMS-663068 to BMS-626529
1. Langley DR et al. Proteins; 2015; 83: 331–350. 2. Brown J et al. J Pharm Sci 2013; 102: 1742–1751. 3. Nowicka-Sans B et al. Antimicrob Agents Chemother 2012; 56: 3498-3507. 4.Ray N et al. JAIDS 2013; 64: 7–15. 5. Zhou N et al. JAC 2014; 69: 573–581.6.Li Z et al. AAC 2013; 57: 4172–4180.

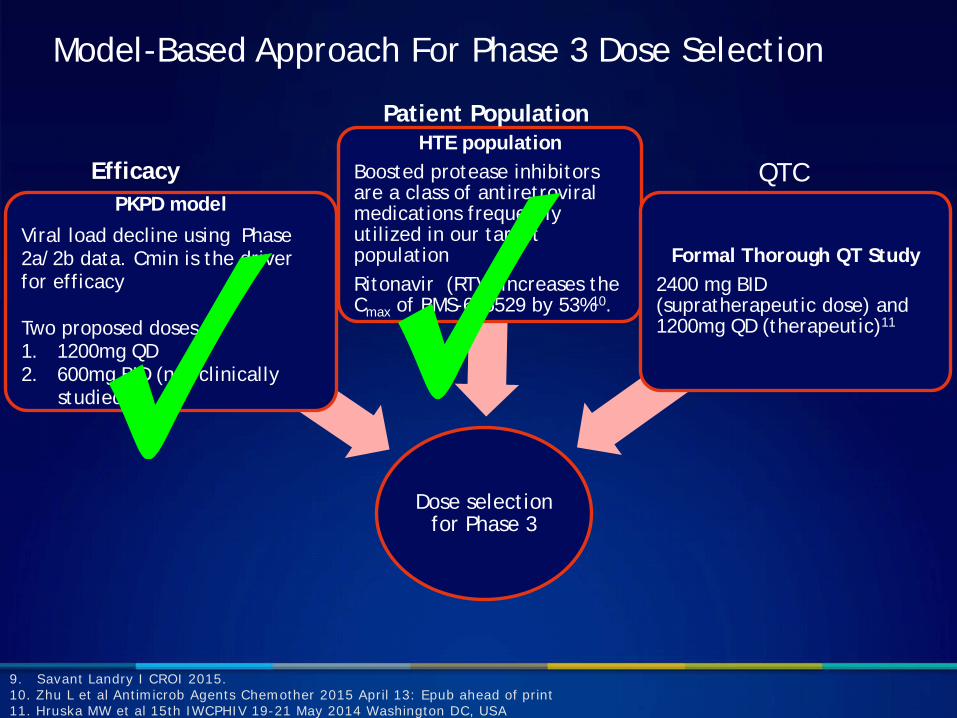
Model-Based Approach For Phase 3 Dose Selection
9. Savant Landry I CROI 2015.10. Zhu L et al Antimicrob Agents Chemother 2015 April 13: Epub ahead of print 11. Hruska MW et al 15th IWCPHIV 19-21 May 2014 Washington DC, USA
Dose selection for Phase 3
PKPD model
Viral load decline using Phase 2a/2b data. Cmin is the driver for efficacy
Two proposed doses : 1. 1200mg QD 2. 600mg BID (not clinically
studied)9
HTE populationBoosted protease inhibitors are a class of antiretroviral medications frequently utilized in our target populationRitonavir (RTV) increases the Cmax of BMS-626529 by 53%10.
Formal Thorough QT Study2400 mg BID(supratherapeutic dose) and 1200mg QD (therapeutic)11
Efficacy
Patient Population
QTC
Model-Based Approach For Phase 3 Dose Selection
Dose selection for Phase 3
PKPD model
Viral load decline using Phase 2a/2b data. Cmin is the driver for efficacy
Two proposed doses : 1. 1200mg QD 2. 600mg BID (not clinically
studied)9
HTE populationBoosted protease inhibitors are a class of antiretroviral medications frequently utilized in our target populationRitonavir (RTV) increases the Cmax of BMS-626529 by 53%10.
Formal Thorough QT Study2400 mg BID(supratherapeutic dose) and 1200mg QD (therapeutic)11
Efficacy
Patient Population
QTC
9. Savant Landry I CROI 2015.10. Zhu L et al Antimicrob Agents Chemother 2015 April 13: Epub ahead of print 11. Hruska MW et al 15th IWCPHIV 19-21 May 2014 Washington DC, USA
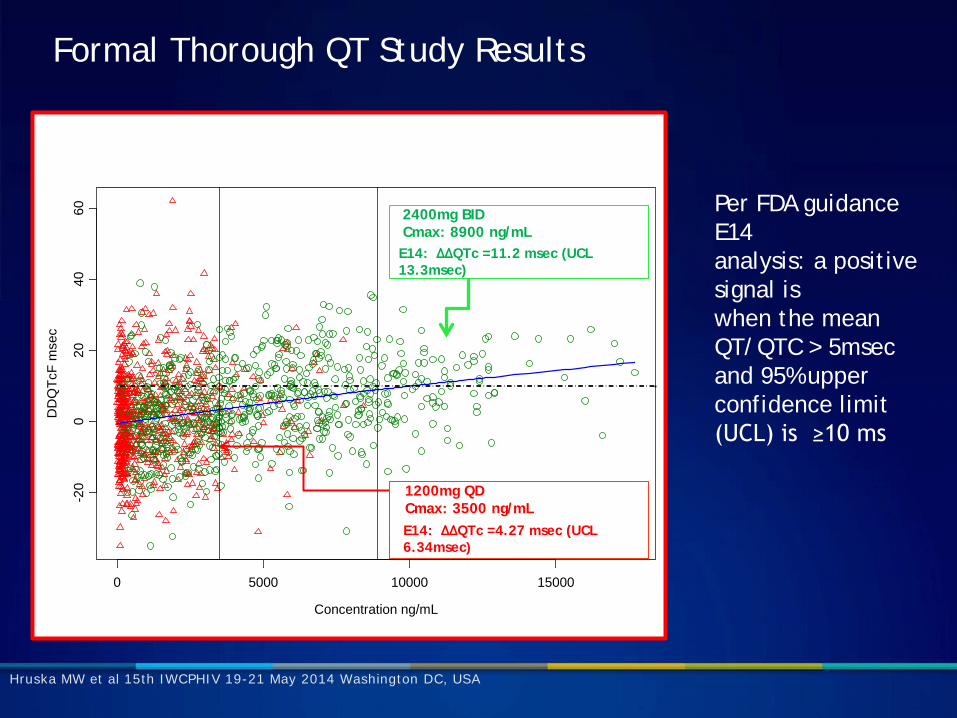
Formal Thorough QT Study Results
Hruska MW et al 15th IWCPHIV 19-21 May 2014 Washington DC, USA
Concentration ng/mL
DD
QTc
F m
sec
0 5000 10000 15000
-20
020
4060
1200mg QD Cmax: 3500 ng/mL
2400mg BIDCmax: 8900 ng/mLE14: ΔΔQTc =11.2 msec (UCL 13.3msec)
E14: ΔΔQTc =4.27 msec (UCL 6.34msec)
Per FDA guidance E14analysis: a positive signal iswhen the mean QT/QTC > 5msecand 95% upper confidence limit(UCL) is ≥10 ms

Objectives
To characterize the relationship between BMS-626529 systemic exposure and QTcF interval changes
To predict QTcF effects of the two potential BMS-663068 Phase 3 doses (1200 mg QD; 600 mg BID) when administered with a boosted protease inhibitors using this model-based analysis

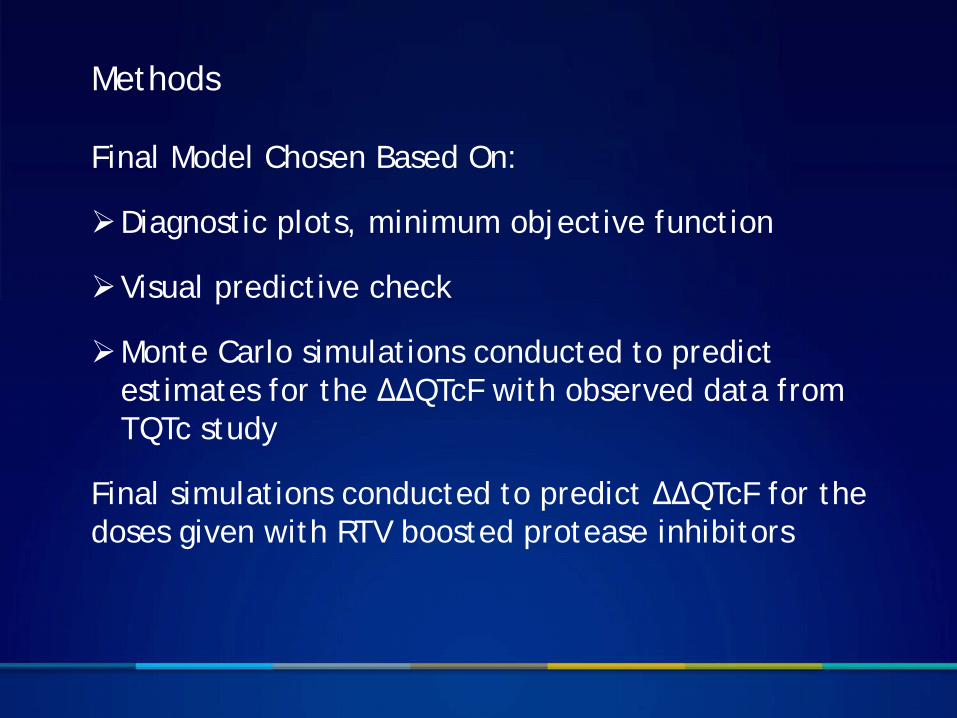
Methods
Four models exposure-QTc explored
A model that assumed the relationship between BMS-626529 plasma concentration ∆∆QTcF was linear
An Emax model that assumed a saturable relationship between BMS-626529 plasma concentration and ∆∆QTcF
A sigmoid Emax model
An indirect response model
𝐸𝐸𝑖𝑖𝑖𝑖 = 𝐸𝐸0 ∗ 𝑒𝑒𝑒𝑒𝑒𝑒�η5𝑖𝑖� +�𝐸𝐸𝑚𝑚𝑚𝑚𝑒𝑒 ∗ 𝑒𝑒𝑒𝑒𝑒𝑒�η6𝑖𝑖�� ∗∗ �𝑔𝑔𝑚𝑚𝑚𝑚𝑚𝑚𝑚𝑚 ∗ 𝑒𝑒𝑒𝑒𝑒𝑒�η8𝑖𝑖�� ∗ 𝐶𝐶𝐶𝐶𝐶𝐶𝐶𝐶𝑖𝑖𝑖𝑖 ∗∗ �𝑔𝑔𝑚𝑚𝑚𝑚𝑚𝑚𝑚𝑚 ∗ 𝑒𝑒𝑒𝑒𝑒𝑒�η8𝑖𝑖��
�𝐸𝐸𝐶𝐶50 ∗ 𝑒𝑒𝑒𝑒𝑒𝑒�η7𝑖𝑖�� ∗∗ �𝑔𝑔𝑚𝑚𝑚𝑚𝑚𝑚𝑚𝑚 ∗ 𝑒𝑒𝑒𝑒𝑒𝑒�η8𝑖𝑖�� + 𝐶𝐶𝐶𝐶𝐶𝐶𝐶𝐶𝑖𝑖𝑖𝑖 ∗∗ �𝑔𝑔𝑚𝑚𝑚𝑚𝑚𝑚𝑚𝑚 ∗ 𝑒𝑒𝑒𝑒𝑒𝑒�η8𝑖𝑖��+ 𝜖𝜖𝑖𝑖𝑖𝑖
𝐸𝐸𝑖𝑖𝑖𝑖 = �𝑠𝑠𝑠𝑠𝑠𝑠𝑒𝑒𝑒𝑒 ∗ exp�η2𝑖𝑖�)) ∗ 𝐶𝐶𝐶𝐶𝐶𝐶𝐶𝐶𝑖𝑖𝑖𝑖
�� + 𝜖𝜖𝑖𝑖𝑖𝑖
𝐸𝐸𝑖𝑖𝑖𝑖 = 𝐸𝐸0 ∗ 𝑒𝑒𝑒𝑒𝑒𝑒�η4𝑖𝑖� +�𝐸𝐸𝑚𝑚𝑚𝑚𝑒𝑒 ∗ 𝑒𝑒𝑒𝑒𝑒𝑒�η5𝑖𝑖�� ∗ 𝐶𝐶𝐶𝐶𝐶𝐶𝐶𝐶𝑖𝑖𝑖𝑖
�𝐸𝐸𝐶𝐶50 ∗ 𝑒𝑒𝑒𝑒𝑒𝑒�η6𝑖𝑖�� + 𝐶𝐶𝐶𝐶𝐶𝐶𝐶𝐶𝑖𝑖𝑖𝑖
+ 𝜖𝜖𝑖𝑖𝑖𝑖
𝐷𝐷𝐷𝐷𝐷𝐷𝐷𝐷 = 𝐾𝐾𝑖𝑖𝑖𝑖 (1 + 𝐸𝐸 ) � − 𝐾𝐾𝑠𝑠𝑜𝑜𝑜𝑜 ∗ 𝐷𝐷(1)
Dire
ct R
espo
nse
Mod
els
Methods
Final Model Chosen Based On:
Diagnostic plots, minimum objective function
Visual predictive check
Monte Carlo simulations conducted to predict estimates for the ΔΔQTcF with observed data from TQTc study
Final simulations conducted to predict ΔΔQTcF for the doses given with RTV boosted protease inhibitors

Evaluation of the Final Indirect Response Model (Visual Predictive Check)
1200 mg QD 2400 mg BID
1200mg QD and 2400 mg BID : doses from TQTc study
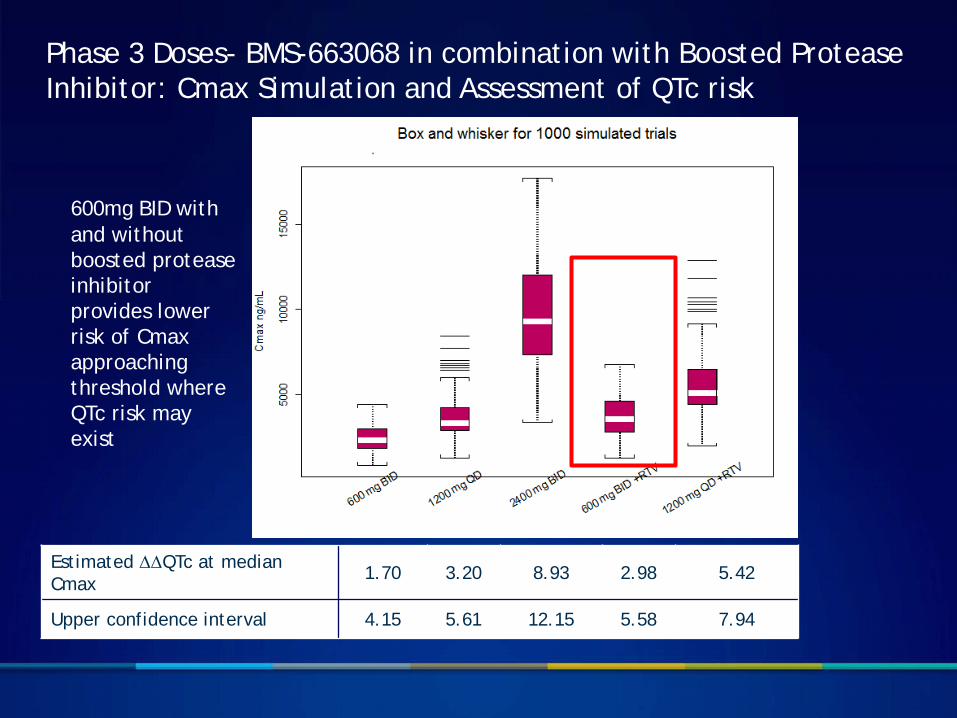
Phase 3 Doses- BMS-663068 in combination with Boosted Protease Inhibitor: Cmax Simulation and Assessment of QTc risk
600mg BID with and without boosted protease inhibitor provides lower risk of Cmaxapproaching threshold where QTc risk may exist
Estimated ∆∆QTc at median Cmax 1.70 3.20 8.93 2.98 5.42
Upper confidence interval 4.15 5.61 12.15 5.58 7.94
Conclusions
An indirect response sigmoid Emax model with Hill coefficient best described the relationship between individual observed ΔΔQTcF and plasma exposure of BMS-626529
BMS-663068 600 mg BID dose was predicted to have the optimum benefit–risk profile
BMS-663068 600mg BID was chosen for the Phase 3 trial in treatment-experienced subjects based on quantitative modeling, clinical and safety observations