1
Hirschi’s Reconceptualization of Self-Control:
Is Truth Truly the Daughter of Time? Evidence from Eleven Cultures
Alexander, T. Vazsonyi1
Li Huang2
Corresponding Author, Department of Family Sciences, University of Kentucky1
316 Funkhouser Building
Lexington, KY 40506-0054 (USA)
P. 859-257-9762 F. 859-257-3212
Department of Psychology and Sociology, Tuskegee University2
Acknowledgements We are indebted to all the schools, its administrators, and the students who completed the surveys; we would also like to thank Drs. Dick Hessing and Marianne Junger, Ginesa Torrente-Hernandez, and Chuen-Jim Sheu for their assistance in collecting data in the Netherlands, Spain, and Taiwan, respectively. Thank you also to Joshua Roberts who assisted with literature searches and reviews. Partial support for data collections in Slovenia and the Czech Republic were provided to the first author by a Fulbright grant and by the Fulbright-Masaryk Distinguished Chair in Social Studies, respectively. Additional support for the data collection in Japan was provided by Auburn University’s Competitive Research Grant-In-Aid Program. Please address any correspondence to the first author: [email protected].
2
Abstract
Purpose: The conceptualization and measurement of self-control remains a debated topic, in
criminology as well as other social and behavioral sciences. The current study compared the
relationships between the Grasmick and colleagues (1993) self-control scale and the redefined
self-control measure by Hirschi (2004) on measures of deviance in samples of adolescents.
Methods: Anonymous, self-report data were collected from over N = 16,000 middle and late
adolescents in China, the Czech Republic, Hungary, Japan, the Netherlands, Slovenia, Spain,
Switzerland, Taiwan, Turkey, and the United States.
Results: Based on latent constructs with items parcels in an SEM framework, multi-group tests
were used to examine both the relative predictive utility of each self-control measure on deviance
and the extent to which these relationships varied across cultures. Both scales appear to tap into
self-control; however, findings provide evidence that the Grasmick et al. measure explains more
variance. These links did not vary across cultural contexts.
Conclusions: Hirschi provocatively suggested that the truth is the daughter of time; yet, we find
that the measure developed by Grasmick and colleagues, the most widely used scale, retains
greater explanatory power, and does so in an invariant manner across all eleven developmental
contexts examined.
Highlights
Anonymous, self-report data from over 16,000 adolescents, eleven cultures
Cross-cultural study tests self-control-deviance links (Hirschi versus Grasmick et al.)
SEM multi-group tests reveal invariance in these relationships across countries
Hirschi’s reconceptualization has merit, yet explains less variability in deviance Keywords: General Theory of Crime, self-regulation, delinquency, cross-national.
3
Hirschi’s Reconceptualization of Self-Control:
Is Truth Truly the Daughter of Time? Evidence from Eleven Cultures
The study examined one specific redefinition to one of the most influential recent
criminological theories, namely self-control theory (Gottfredson & Hirschi, 1990). Hirschi
(2004) to differently conceptualized and operationalized self-control by linking self and with
social control theory (Hirschi, 1969); specifically, self-control was redefined to encompass
indicators of social bonds (both in number and salience). He argued that doing so truly captured
the essence of self-control, which of course departs quite radically from some of the original
arguments presented in The General Theory of Crime (Gottfredson & Hirschi, 1990), but also
from most empirical work completed over the past two decades. On the other hand, some of
Hirschi’s argument is consistent with what he has argued previously (e.g., Hirschi &
Gottfredson, 1993), namely that behavioral measures of self-control (see e.g., Keane, Maxim, &
Teevan, 1993) are preferred over attitudinal measures, such as the one developed by Grasmick
and colleagues1 (1993). In the current study, we review the modest number of scholarly efforts
that have been based on Hirschi’s (2004) redefinition of self-control, based mostly on college-
aged youth from the United States, followed by our own empirical test which juxtaposes the
Grasmick et al. measure against the redefined Hirschi measure in explaining deviance. For this,
we employ large samples of over 16,000 youth from eleven different cultural contexts, thus
adding a novel quasi-experimental (van de Vijver & Leung, 1997), cross-national comparative
piece to this literature that has followed Hirschi’s redefinition.
Literature Review
The General Theory of Crime (Gottfredson & Hirschi, 1990) has sparked a substantial
amount of empirical inquiry on self-control and its effects on crime and deviance (DeLisi &
4
Piquero, 2011; Pratt & Cullen, 1990), but also victimization (Pratt, Turanovic, Fox, & Wright,
2014); this work has also often transcended disciplinary boundaries (de Ridder, Lensvelt-
Mulders, Finkenauer, Stok, & Baumeister, 2012), thus establishing self-control as a pivotal
individual difference in behavioral adjustment and developmental outcomes over the lifecourse
(Moffitt, Arsenault, Belsky, Dickson, Hancox, Harrington, Houts, Poulton, Roberts, Ross, Sears,
Thomson, & Caspi, 2011). Much of this work has been carried out with attitudinal measures of
low self-control, particularly within criminology and criminal justice, but less so in the
psychological or developmental sciences. Almost a decade and a half after the publication of the
seminal theory, Hirschi (2004) redefined what self-control was and how it should be
operationalized.
Self-Control Redefined
Hirschi (2004) redefined self-control as “the tendency to consider the full range of
potential costs of a particular act” (p. 543). This departs from the original conceptualization in
which self-control was termed to be “the tendency to avoid acts whose long-term costs exceed
their momentary advantages” (Gottfredson & Hirschi, 1990, p. 3). The redefined self-control
encompasses both short- and long-term costs, instead of merely long-term costs of deviant acts.
Self-control, as redefined by Hirschi (2004), seems more akin to rational choice theories, as
decisions are made within the moment of an act and less attuned to persistent trait-like,
individual differences. He notes, “Fortunately, in this case at least, truth is indeed the daughter of
time, and we can now see the errors introduced by our excursion into psychology and by the
measures of self-control stemming from it” (p. 542) and that most measures used since the
publication of the theory have lost what he considered “elements of cognizance and rational
choice” (p., 542).
5
Hirschi (2004) further notes that self-control is a “set of inhibitions one carries with one
wherever one happens to go” (p. 543). These inhibitions are linked to social bonds (attachments,
commitments, involvements and beliefs) that Hirschi (1969) identified as part of social control
theory. The more “bonded” an individual is or the more inhibitions a person has the higher level
of self-control the person exhibits. Hirschi (2004) also includes a salience dimension, so it is not
merely a large number of inhibitions affecting self-control, but also the level or importance of
those inhibitions to the individual. This redefinition seems to offer a combination of social
control and self-control theories, perhaps a joining or equilibrating of social and self-control.
Hirschi (2004) found empirical support for this redefinition by developing a nine item
dichotomous scale, focusing on social bonds and their importance based on the Richmond Youth
Project. The items focused on parents, teachers, and school. He found that the more inhibitions
an individual possessed, the less likely the person was to commit delinquent acts. Basing the
measure upon inhibitions, instead of traits or behaviors (i.e., past offenses predicting future
offenses), permitted Hirschi to effectively address one of the strongest criticisms of self-control
theory, namely the tautology issue raised by Akers (1991), although Hirschi (2004) suggests that
the redefinition was not influenced by the issue. Self-control, redefined, according to Hirschi
(2004), enhances the General Theory by placing self-control decisions into the realm of cognitive
processes in a given instance. The redefinition of self-control encompasses elements of social
control theory and also aligns with rational choice theory, attempting to expand self-control into
a truly “general” theory.
While the redefinition of self-control would seem to be a turning point, the empirical
evidence following this fairly strong departure from the original theoretical work has generated
6
only a handful of empirical efforts, which mostly mixed and inconsistent findings. Table 1
provides an overview of these studies, along with a brief synopsis of each.
_____________________
Insert Table 1 About here _____________________
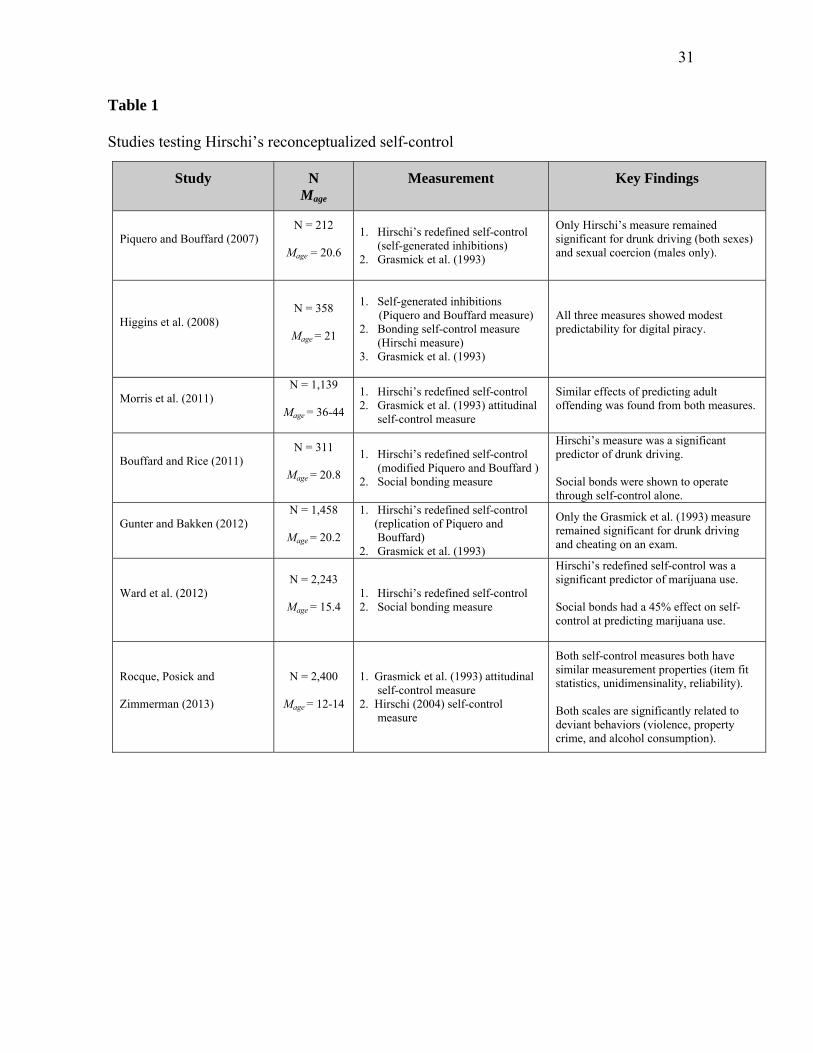
Two main themes of findings emerge from these studies. Five of the studies (Piquero &
Bouffard, 2007; Gunter & Bakken, 2012; Higgins, Wolfe & Marcum, 2008; Morris, Gerber, &
Menard, 2011; Rocque, Posick, & Zimmerman, 2013) compare and contrast different measures
of self-control. Each study uses a measure developed based on the redefinition of self-control
and compares its effectiveness of predicting or explaining deviance against the most commonly
used scale by Grasmick and colleagues (1993). The other two studies (Bouffard & Rice, 2011;
Ward, Boman, & Jones, 2012) measure self-control according to the redefinition and then
examine the influence of social bonds on self-control.
Empirical Tests of Hirschi’s Redefined Self-Control Measure
Piquero and Bouffard’s (2007) provided the initial empirical test of Hirschi’s (2004)
reformulation based on a sample of N = 212 college students, and focused on drunk driving and
sexual coercion. The study used vignettes about drunk driving as well as one about sexual
coercion (males only). Following each vignette, respondents were asked to list up to seven “bad”
things that may happen if they engaged in the activity, capturing Hirschi’s redefined self-control.
Participants rated importance of “bad” things and likelihood of not engaging in the act. Findings
showed that only the redefined self-control measure remained significant when both the
Grasmick et al. measure and the “new” measure were tested simultaneously, for both dependent
measures, thus leading Piquero and Bouffard to conclude that found potential within Hirschi’s
redefinition of self-control was more effective in predicting the likelihood of engaging in deviant
7
acts. Gunter and Bakken (2012) essentially replicated this work in a random sample of N = 1,458
college students, with some minor modifications, including the focus on cheating on a test
instead of sexual coercion; they also used controls for previous offending (past-DUI’s or past-
cheating) in their analyses. Interestingly, this work showed that only the Grasmick et al. (1993)
measure remained statistically significant once combined with a reconceptualized Hirschi (2004)
measure in a regression model. Finally, Higgins, Wolfe and Marcum (2008) focused on testing
three different measures of self-control in predicting digital piracy based on a sample N = 358
college students. In contrast to previous work, the authors tested the Grasmick et al. (1993), the
Piquero and Bouffard (2007) measure based on self-generated inhibitions, and the measure
developed by Hirschi (2004) which focuses on the presence of social bonds. Based on regression
analyses, the authors found that all three measures remained statistically significant in explaining
digital piracy when tested simultaneously, where predictive strength by the Grasmick et al. scale
was largest, followed by the Piquero and Buffard measures, and Hirschi’s bonding scale.
Morris and colleagues (2011) took a slightly different approach based on data from the
National Youth Survey Family Study and focused on self-reported adult criminality. The
redefined measure by Hirschi was operationalized by different bonds (spouse or partner,
children, friends, career, involvement in community activities and religiosity) and rating the
salience of each and then compared to the Grasmick et al. (1993) measure. The authors found
that both measures predicted adult crime with similar effectiveness, but suggested that each
measures captured different self-control concepts when considering adult criminality. Most
recently, Rocque, Posick and Zimmerman (2013) used the U.S. sample part of the second
International Self-Report Delinquency (ISRD-II) project and applied Rasch analysis and negative
binomial regressions to compare both the Grasmick et al. (1993) and Hirschi’s (2004)
8
reconceptualized self-control measures. Findings provided evidence that both measures were
quite similar in measurement properties and construct validity, although there was also some
evidence that the Grasmick et al. measure provided a better fit to the data. They concluded that
both measures appear to play an important and complimentary role in explaining variability in
violence, property offending, and alcohol consumption.
Redefined Self-Control and the Impact of Social Bonds
Bouffard and Rice (2011) took a slightly different approach and sought to address
response bias issues in their redefined self-control measure over work done by Piquero and
Bouffard (2007). Based on a sample of N = 311 college students and also using short vignettes
about drunk driving, the authors interpreted low salience score as indicating low self-control,
regardless of the number of inhibitions reported. This operationalization found Hirschi’s (2004)
redefinition did predict a tendency to drink and drive. Of course, it is not known the extent to
which it predicted other measures of deviance, related to the fairly narrow focus.
The study also explored the influence social bonds on self-control by considering
attachment, belief in the law, and commitment to religion, thus testing how social bonds affect
momentary self-control decisions. Path analysis provided evidence that social bonds had an
indirect effect on decisional self-control although no evidence was found that bonding itself had
a direct effect on drunk driving. Instead individuals who were more bonded to society were less
likely to drink and drive. Thus, findings provide some evidence supportive of the notion that
social bonds operate through self-control on offending.
Finally, Ward, Boman and Jones (2012) focused on testing Hirschi’s impetus based on a
Boys Town sample of N = 2,243 adolescents between the seventh and twelfth grades focused on
marijuana use. Previous efforts had difficulties with fully capturing Hirschi’s (2004) redefinition
9
of self-control, as they did not tap into both number of inhibitions as well as salience. In this
effort, the number of costs was measured by using predetermined cost categories rather than
relying on self-generated costs (e.g., Piquero & Bouffard, 2007), thus more breadth of costs.
Salience on the other hand was measured by asking participants how important “others” (parents,
family members, friends, peers, older others and the law) were in helping them to decide whether
to use or not use marijuana. This operationalization replies on the salience of “others”
specifically. Based on clustering of the sample by these two constructs, findings showed that
those who have more costs and that consider “others” more are less likely to use marijuana. They
also found that individuals who faced a high number of costs but did not consider “others” in
their decisions tended to refrain from using marijuana. However, the inverse (low number of
costs but high salience) did not show similar results. Again, this emphasized the importance of
social bonds and how they impact momentary decision making about norm-violating conduct. As
in some previous work, Ward et al. (2012) also found that social bonds had an influence on
marijuana use through the redefined self-control measure, where almost half of this effect (45%)
was indirect or mediated.
In conclusion, the empirical evidence on Hirschi’s (2004) redefined self-control remains
inconclusive and often contradictory, depending on the specific manner in which self-control
was redefined and assessed, depending on what norm-violating conduct was tested, and
depending on the sample used, mostly US college students. Clearly, a number of studies do find
merit to the Hirschi’s redefinition, yet some simply show that very little is added by Hirschi’s
reconceptualization, in terms of understanding and explanatory power. Support for strongly
linking self-control to social bonds has also been inconsistent, though not surprisingly, there is a
link, since self-control theory in fact specifies that social bonds (parents, teachers and so forth)
10
are instrumental in the development and establishment of self-control during the first decade of
life (in addition to individual differences present at birth).
The Current Study
In the current investigation, we were interested in adding to this relatively modest body
of literature, characterized by inconsistent and at times contradictory evidence related to the
conceptual as well as the practical significance of Hirschi’s (2004) reconceptualization of self-
control in the understanding of and prediction of norm violating, deviant behaviors. To do so, we
applied a quasi-experimental, cross-national comparative lens to improve upon mostly local
efforts in terms of sampling, with some exceptions, but also to apply more rigorous analytic tests
of an idea or competing ideas. Gottfredson and Hirschi (1990) spent a sizable amount of their
theoretical treaties on self-control theory focused on this hallmark of science, namely the idea
that powerful concepts, predictions, or relationships should, in fact, hold up across different
developmental contexts, across different cultures.
We apply sophisticated data analytic techniques (item parceling, structural equation
modeling, and multi-group structural equation modeling) to test a relatively simple, yet elegant
idea, namely, to what extent is Hirschi’s re-conceptualized self-control measure unique or
redundant in our understanding of explaining variability in deviant behaviors vis-à-vis the most
frequently used attitudinal self-control measure control, the Grasmick et al. (1993) scale. We
hypothesize direct effects by Hirschi’s self-control measure as well as Grasmick et al.’s measure
and seek to develop a greater understanding the extent to which they explain unique variability in
deviance and the extent to which one or the other has the greater explanatory power. In addition,
and related to using a cross national comparative approach, we examine the extent to which these
11
observed links between the self-control measures and deviance very as a function of cultural
developmental context. Based on previous empirical work as well as conceptual work by
Gottfredson and Hirschi, we expect great similarity in the extent to which the hypothesized
model will fit the data; on the other hand, we do not have specific hypotheses related to whether
one measure or the other measure will be a more potent predictor of deviant behaviors, simply
related to previous empirical efforts as well as to conceptual issues rooted Hirschi’s (2004)
chapter.
Method
Participants
Anonymous self-report data were collected from convenience samples of middle and late
adolescents in medium-sized cities in China (n=1,373), the Czech Republic (n=890), Hungary (n
= 871), Japan (n = 355), the Netherlands (n = 1,315), Slovenia (n = 1,422), Spain (n = 1,030),
Switzerland (n = 4,018), Taiwan (n = 1,443), Turkey (n = 1,447), and the United States (n =
2,213). The samples include youth from secondary schools in all countries except Japan as well
as college students in Slovenia, Spain, and the United States. Cities and schools were
purposively sampled in each country based on established relationships. For each some European
country (Netherlands, Spain, and Switzerland), different schools (college bound versus non-
college bound, technical schools) were selected to obtain representative samples of the local
population. Usually the entire student population was invited to participate at each school;
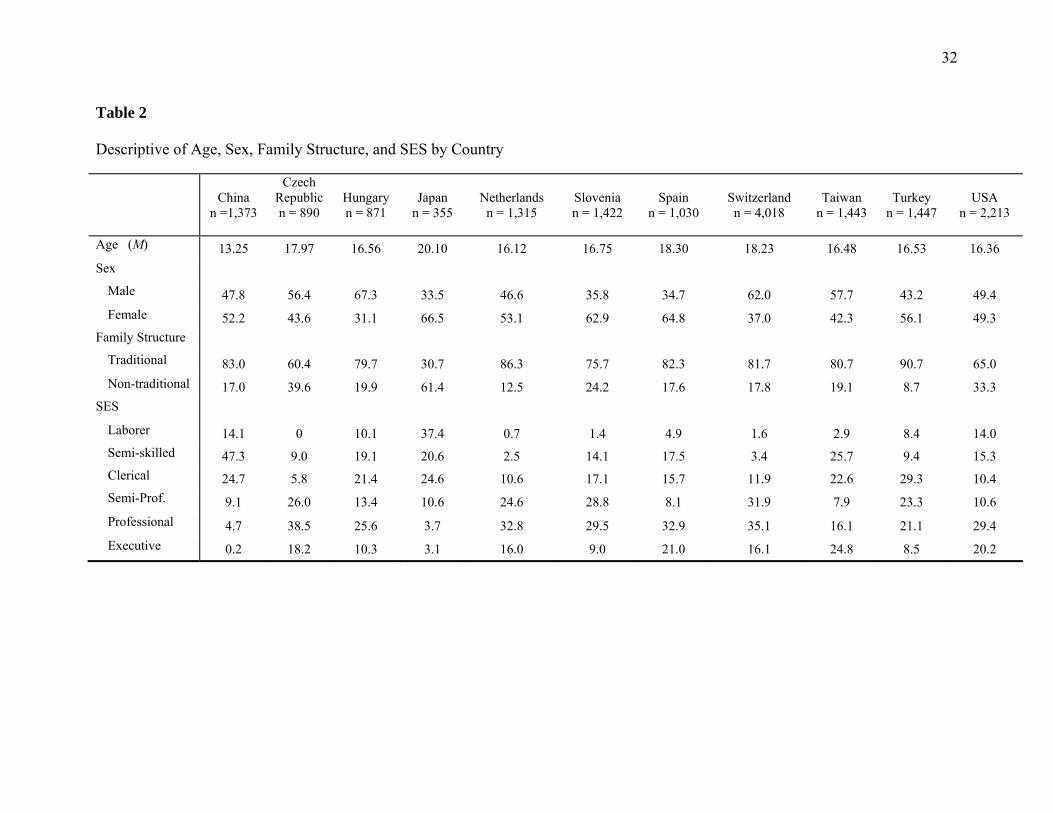
response rates at schools varied (range: 73% to 95% at individual schools). Table 2 includes
descriptive statistics by country on background variables (age, sex, family structure,
SES/primary wage earner).
_____________________
12
Insert Table 2 About here _____________________
Procedures
A standard data collection protocol was followed across all study locations. The study
was approved by a university institutional review board and consisted of a self-report data
collection instrument that included instructions on how to complete the survey, a description of
the project, and assurances of anonymity. The questionnaires were administered in classrooms by
project staff or teachers who had received extensive verbal and written instructions. This was
done to maintain a standardized protocol across all study locations. Students had a 1- to 2- hour
period to complete the survey. Much attention was given to the development of the survey
instrument, particularly by developing new or employing existing behavioral measures that could
be used cross-culturally without losing nuances or changing meanings. To illustrate with some
concrete examples from the deviance measures: Although it may have been appropriate to ask
European youth about the theft of mopeds, American adolescents generally are unaware of this
mode of transportation. Americans use checks writing as legal tender, on the other hand, most
Europeans have never written a check. The survey was translated from English into the target
languages (Chinese, Czech, Dutch, German, Hungarian, Japanese, Slovenian, Spanish, and
Turkish) and back translated by bilingual translators. Surveys were examined by additional
bilingual translators, and when translation was difficult or ambiguous, consensus was used to
produce the final translation.
Measures
Participants in all countries were asked to fill out the same questionnaire including
demographic variables (age, sex, family structure, and socioeconomic indictors), measures of
family processes, school behaviors, and deviance.
13
Age. Adolescents indicated their birth month and year. To maintain anonymity, the 15th
of each month was used to calculate participants’ ages.
Sex. Participants were asked to indicate their gender. Responses were given as 1 (male) or
2 (female).
Family Structure. Adolescents were asked, “Which of the following home situations best
applies to you?” Responses included 1 (biological parents), 2 (biological mother only),
3(biological father only), 4 (biological mother and stepfather), 5 ( biological father and
stepmother), 6 ( biological parent and significant other), and 7 (other). In the current study, we
coded this variable as 1 (two biological parent family) and 0 (other).
SES. This variable was computed based on one item. Adolescents were asked to indicate
the job type of the primary wage earner in their family, ranging from 1 (laborer) to 6 (executive).
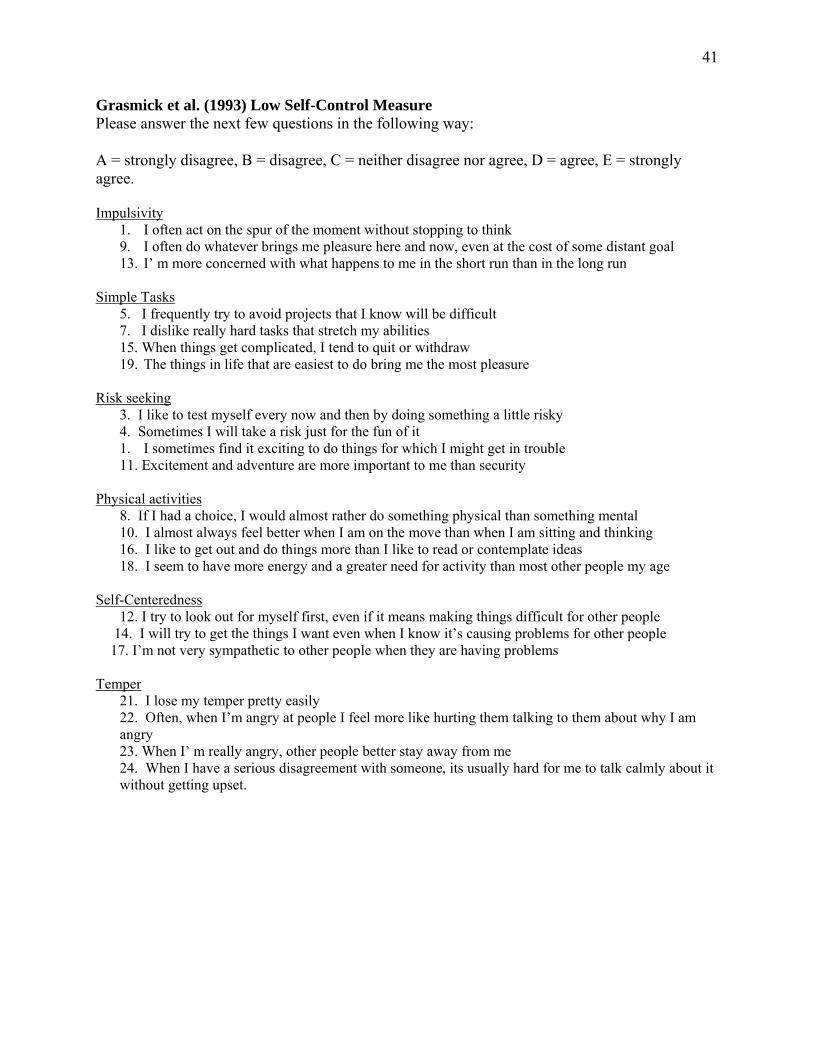
Grasmick et al.’s Low Self-Control. A revised 22-item version of Grasmick, Bursik, and
Arneklev’s (1993) low self-control measure was used (Vazsonyi et al., 2001; Vazsonyi &
Belliston, 2007). Previous studies provided evidences that the instrument was both valid and
reliable. The measure includes six subscales: Impulsiveness, simple tasks, risk seeking, physical
activity, self-centeredness, and temper. Responses were given on a 5-point, Likert-type scale,
instead of a 4-point scale as originally proposed, ranging from 1 (strongly disagree) to 5
(strongly agree). In the current study, items were assigned into two parcels to measure a latent
self-control construct.
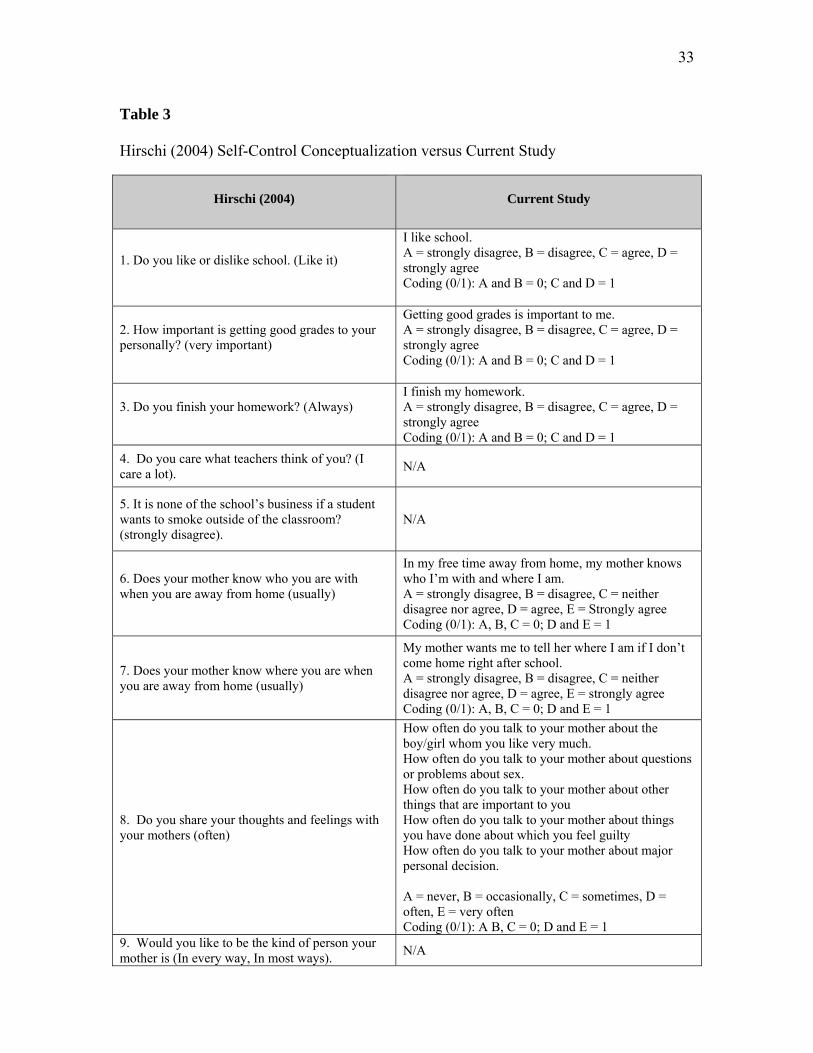
Hirschi’s Self-Control. Hirschi (2004) measure of self-control included items, such as
“Do you like or dislike school?”, “How important is getting good grades to your personally?”
“Do you finish your homework?”, “Does your mother know who you are with when you are
away from home?”, and “Do you share your thoughts and feelings with your mothers?”
14
Responses to these items were either no (0) or yes (1), where yes indicated evidence of self-
control; the nine items were then summed to obtain a self-control score ranging from 0 to 9.
In the current study, we used very similar items as Hirschi proposed, including “I like
school”, “Getting good grades is important to me”, “I finish my homework”, “In my free time
away from home, my mother knows who I’m with and where I am”, “My mother wants me to
tell her where I am if I don’t come home right after”, “How often do you talk to your mother
about the boy/girl whom you like very much”, “How often do you talk to your mother about
questions or problems about sex”, “How often do you talk to your mother about other things that
are important to you”, “How often do you talk to your mother about things you have done about
which you feel guilty”, and “How often do you talk to your mother about major personal
decision.” However, to capture greater variability, we used 4 and 5 point response scales for the
items; in the case of the 4-point scale, we did the following coding: A = strong disagree to D =
strongly agree, which we coded as A and B = 0, C and D = 1. For the 5 points scale, = strongly
disagree, B = disagree, C = neither disagree nor agree, D = agree, E = strongly agree, we coded
as A, B, C = 0, D and E = 1). So, for instance, for Hirschi’s (2004) item: “Do you like or dislike
school,” in the current study we used “I like school” and coded responses A and B as 0, while C
and D as 1. Similarly, for the item “In my free time away from home, my mother knows who
I’m with and where”, we coded A, B, and C as 0, whereas D and E as 1. Table 3 provides the full
details on both Hirschi’s (2004) reconceptualization as well as the measurement used in the
current study.
_____________________
Insert Table 3 About here ______________________
15
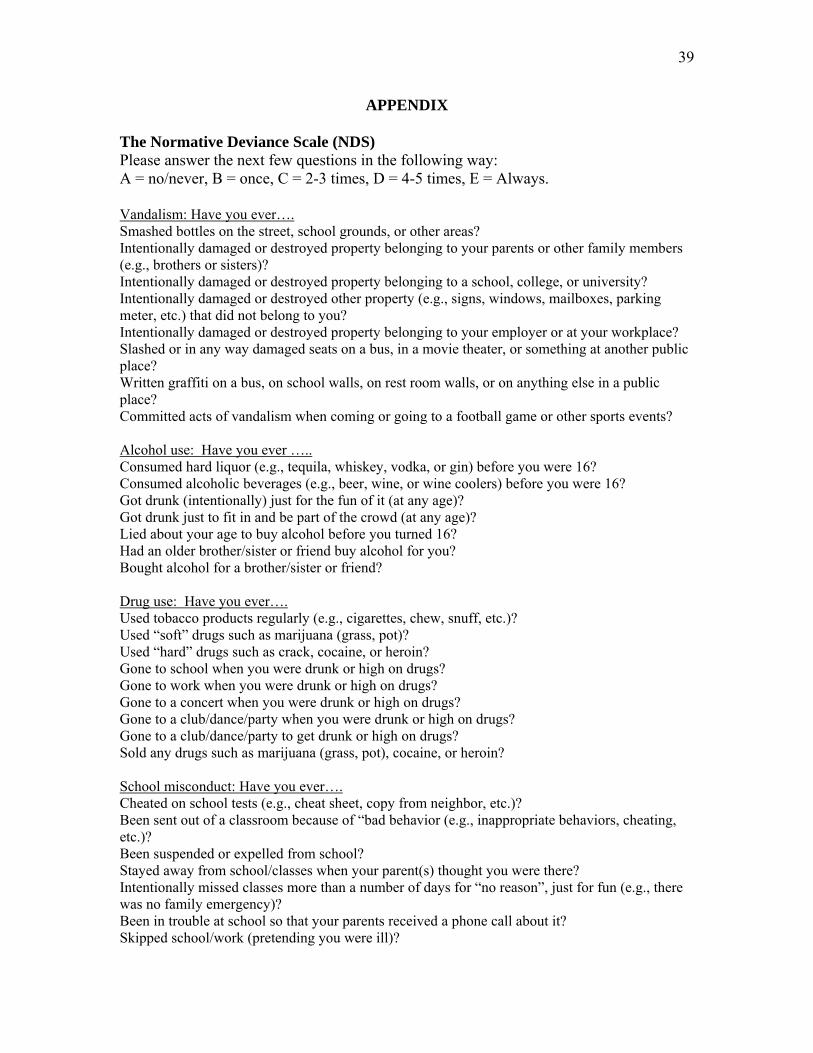
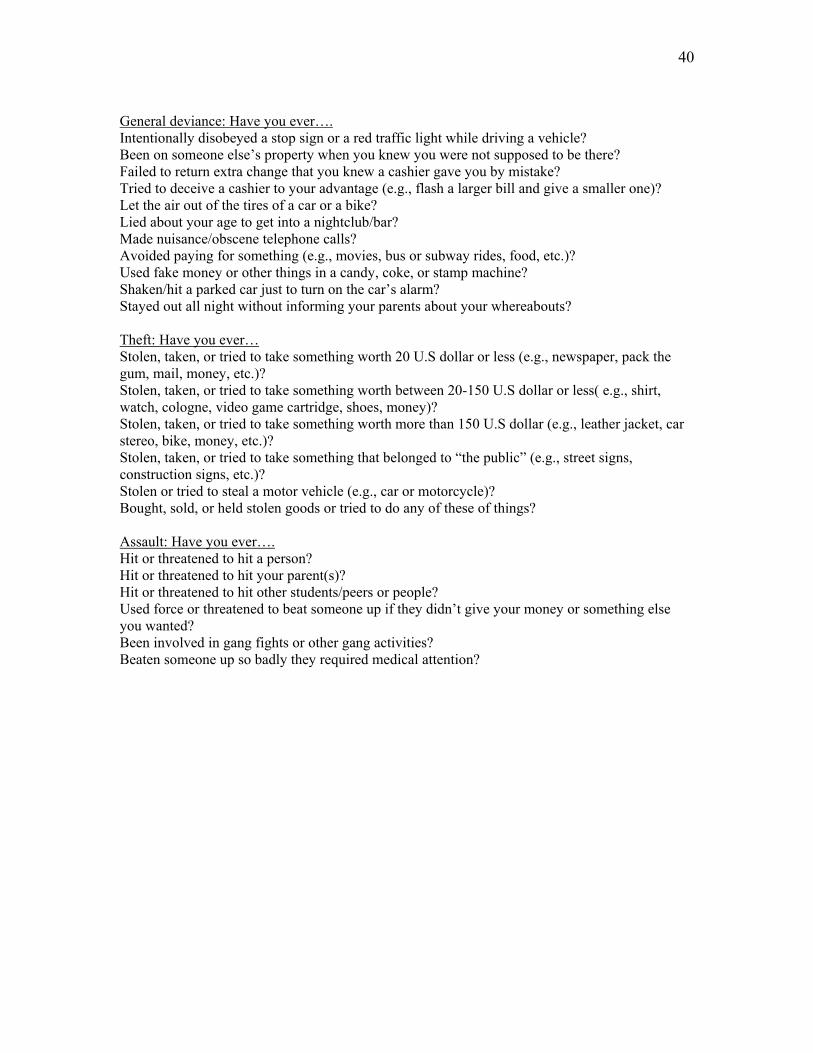
Normative Deviance Scale (NDS). Total deviance was measured by the 55-item
Normative Deviance Scale (NDS; Vazsonyi et al., 2001; Vazsonyi & Belliston, 2007). The NDS
assessed a broad spectrum of deviant activities and norm-violating conduct independent of
cultural definitions of crime and deviance. A total deviance score was computed by summing
items measuring vandalism, alcohol use, drug use, school misconduct, general deviance, theft,
and assault. Responses for items were given on a 5-point, Likert-type scale and identified
lifetime frequency of norm-violating behaviors. Responses included 1 (never), 2 (one time), 3
(two to three times), 4 (four to six times), and 5 (more than six times).
Plan of Analysis
To test the study hypotheses, we used structural equation modeling (SEM) with latent
constructs, based on multiple observed indicators. SEM has numerous advantages over analyses
simply focused on observed variables, including modeling and specifying measurement error,
and the explicit application of hypothesis testing. Model fit was evaluated by the standard chi-
square fit statistics as well as the Comparative Fit Index (CFI) and the Root Mean Square Error
of Approximation (RMSEA) (Browne & Cudeck, 1993; Loehlin, 1992). For the CFI, a fit
between .90 and 1.0 is considered an acceptable (Bentler, 1992). An RMSEA value of less than
.05 demonstrates excellent fit, while a value between .05 and .08 suggests a reasonable fit
(Browne et al., 1993). In addition, differences in model fit as part of multi-group modeling were
evaluated following the recommendation by Cheung and Rensvold (2002), which addresses the
sensitivity of the chi square statistics to sample size which was certainly an issue in our analyses,
where a difference in the CFI of +/- .01 or smaller was insufficient evidence to reject model
comparisons, or in other words, considered sufficient evidence of no difference between the free
and constrained models. We used item parcels as a more efficient means of modeling latent
16
constructs, as recommended by Little, Cunningham, and Shahar (2002). In the work, Little and
colleagues carefully describe and weigh the philosophical, conceptual, and empirical pros and
cons of using parcels in SEM; they recommend parceling if researchers are interested in
understanding and modeling the relationships among a set of constructs, what one might consider
a more molar approach. Using such an approach in effect minimizes or reduces “nuisance
factors,” what we consider “noise” (lower level constructs that constitute a higher level one). On
the other hand, if a researcher is interested in understanding the dimensionality of a construct, a
more micro approach, how specific items “behave” in a model and load onto a latent construct,
then parceling is, as they note, contraindicated as it would obscure these goals. To parcel or not,
in the end, according to Little and colleagues, needs to be carefully weighed by the researcher
and depends on philosophical, conceptual and empirical goals – it depends on the specific
questions being posed by the researcher. They conclude that parceling should never be dismissed
out of hand, nor should it be applied in an unconsidered manner.
We applied an item-to-construct balance method to develop parcels that were balanced in
terms of their difficulty and discrimination. Parcels were developed and computed based on
findings from EFAs. In order to develop the parcels, the items for each scale were rank-ordered
from highest to lowest loadings based on exploratory factor analyses and then alternatively
assigned to the first and second parcels for each main study construct. To remove potential
confounds by differences in samples and sample composition, all parcels were residualized by
age, sex, family structure, and SES.
Results
Initially, descriptive statistics were computed for demographic variables by samples.
Table 2 presents descriptive statistics, which include sample size, age, sex, family structure, and
17
SES by each sample. These variables were subsequently used as control variables in multi-group
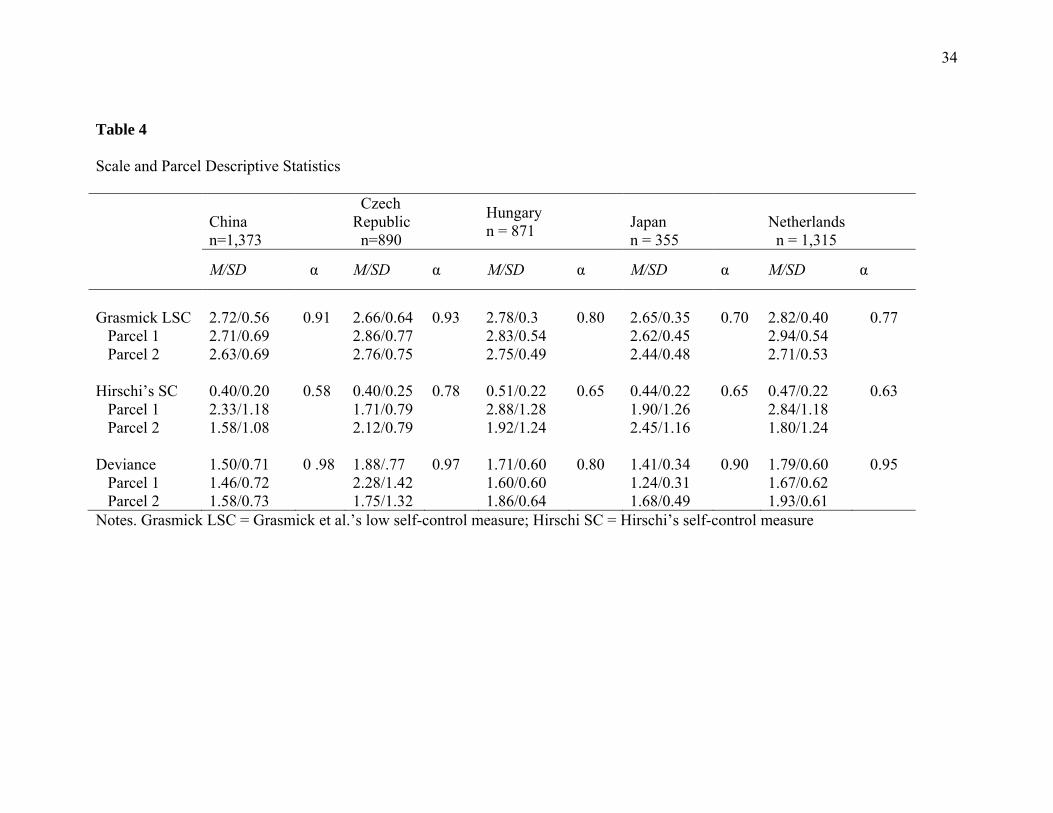
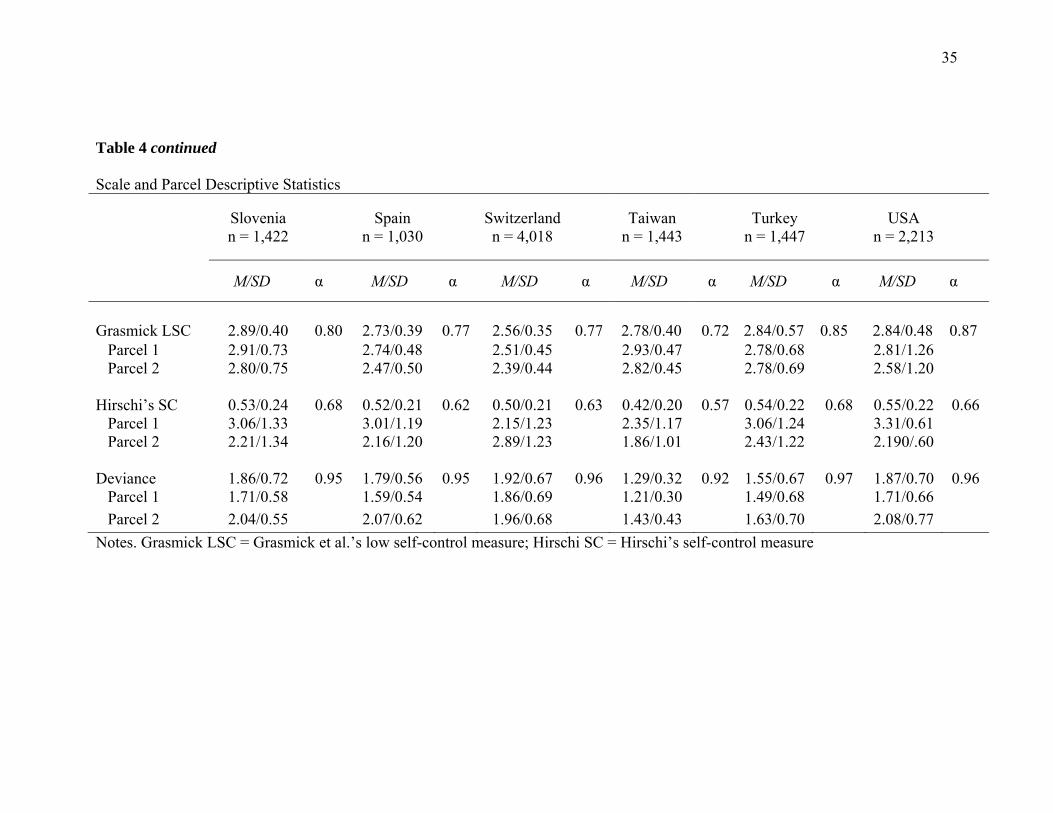
SEM and for computing the observed indicators in multi-group SEM. Table 4 includes the
means, standard deviations, and reliability estimates for the Grasmick low self-control scale, for
Hirschi’s self-control, and for deviance by country. It also includes descriptive statistics on the
two parcels that were developed for each of the measures to be used in latent construct SEM.
_____________________
Insert Table 4 About here _____________________
A series of structural equation models were tested for the each of the samples by using
AMOS. We used item parcels to specify observed variables, known to improve construct
reliability and model fit (Bentler & Chou, 1987). We also used the multi-group latent structural
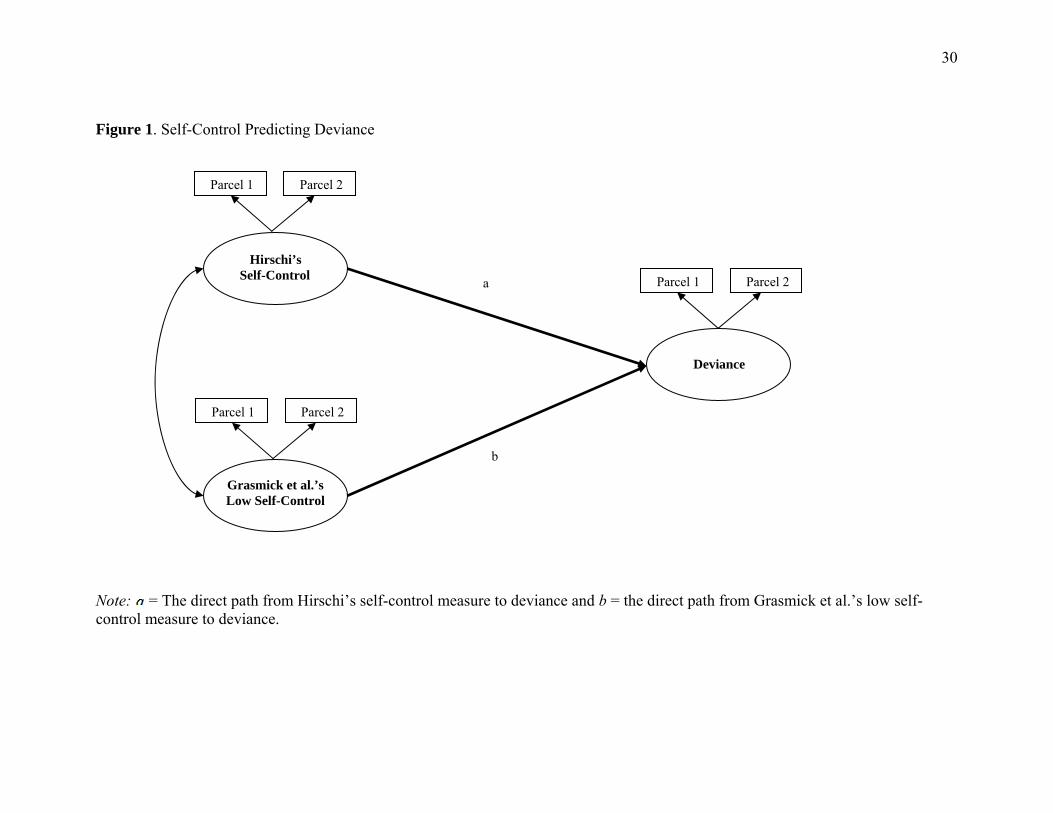
model tests to examine the hypothesized model shown in Figure 1. It simultaneously examined
the relationships among the Grasmick et al. low self-control measure, Hirschi’s redefined self-
control measure, and NDS deviance measure. For this purpose, a series of four models was tested
using multi-group invariance tests. This meant in Model 1(default), all parameters were free to
vary to establish a baseline model and model fit. Next, in model 2 (multi-group), structural paths
(ɑ and b) were constrained to equality, while in model 3 (multi-1), path ɑ constrained to equality,
whereas in model 4 (multi-2), path b was constrained to equality.
_____________________
Insert Figure 1 About here _____________________
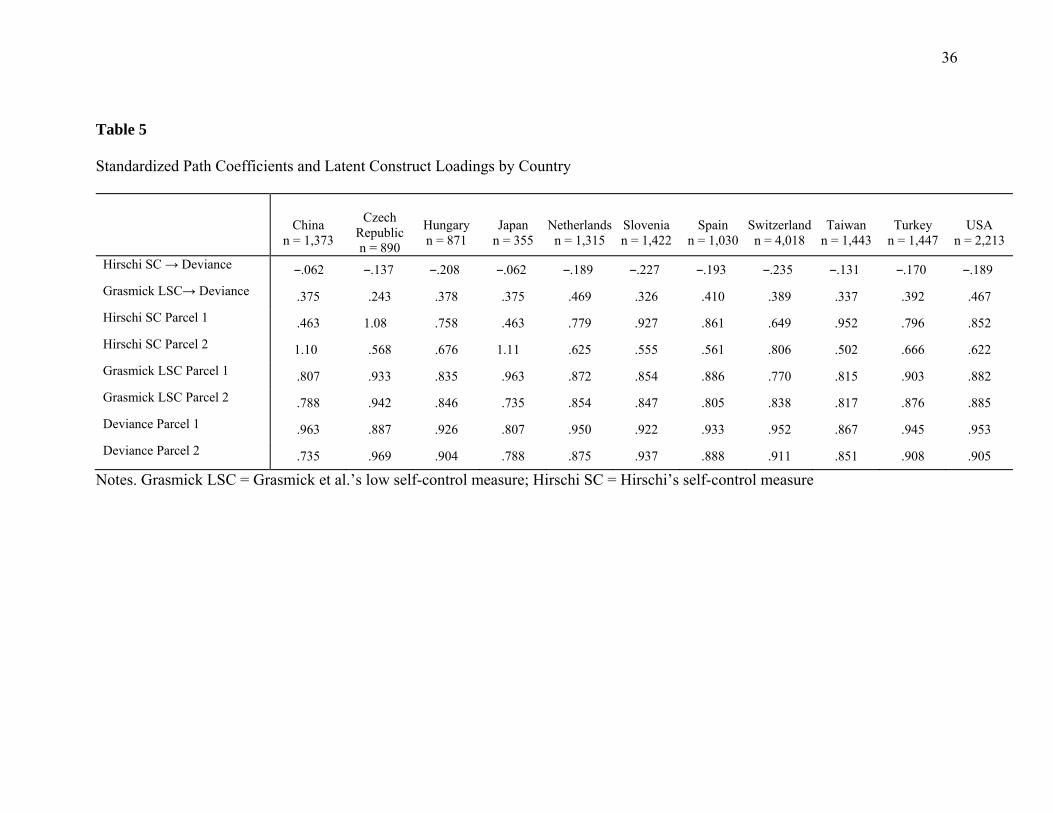
Findings from the multi-group SEM analysis are shown in Tables 5, 6, and 7. Table 5
includes standardized structural path coefficients from the default model (all paths free to vary).
Again, coefficients are reported for both the total sample and for individual country samples. The
18
regression coefficients demonstrated that the relationship between Grasmick self-control and
NDS were consistently larger and stronger (range: 0.24 – 0.47), which also indicated that the
links between Hirschi’s reconceptualized measure and deviance were consistently smaller
(range: -0.27 to -0.06).
_____________________
Insert Table 5 About here _____________________
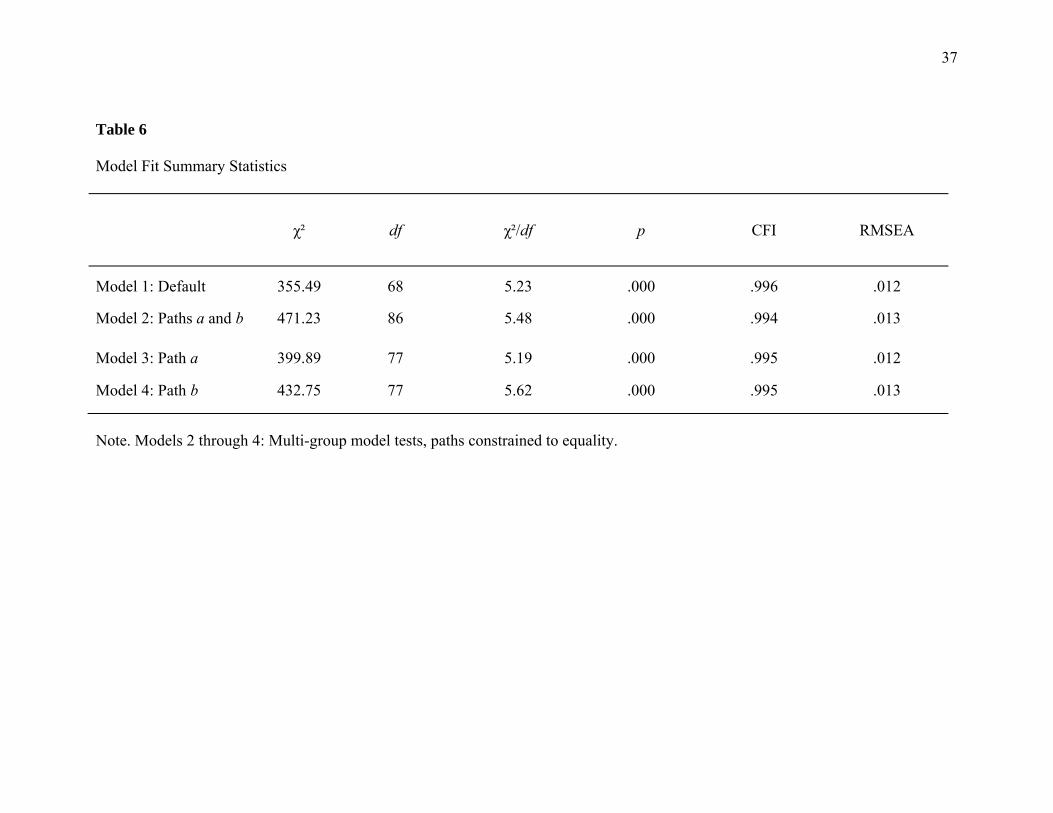
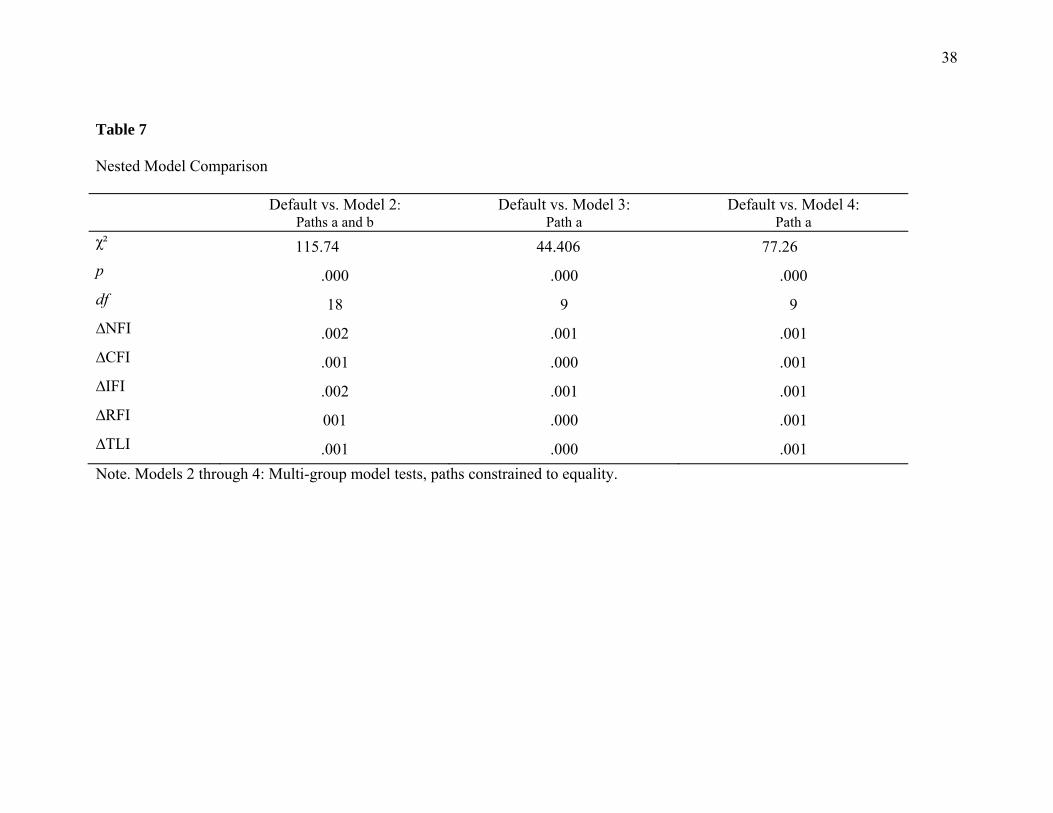
Tables 6 and 7 include model fit of the invariance tests of all four models described. Fit
indices indicated that all models fit the data very well across country samples (CFI range = .932 -
.975, RMSEA range = 0.018-0.026). Analyses of chi-square did indicate that each of the
subsequent models were significantly different from the default model, though the difference
tests of alternative fit indices that are less sensitive to sample size (CFI and RMSEA) provided
no evidence of differences in model fit across groups (∆ CFI range: .001-.043, ∆ RMSEA range;
.000-.010). These difference statistics all well below the threshold established by Cheung and
Rensvold (2002). The most conservative invariance test (model 2, both paths fixed across
samples) demonstrated excellent fit (χ² = 4654, 56, df = 103, χ² /df = 23.94, p = .000, CFI = .932,
RMSEA = 0.02), indicating that there existed effectively no differences in how these latent
constructs co-varied across the samples. Other models provided similar evidence and
demonstrated slightly improved fit simply because fewer parameters were constrained to
equality.
__________________________
Insert Tables 6 and 7 about here __________________________
19
Discussion
Hirschi (2004) distanced himself from the original conceptualization and subsequent
operationalization of self-control theory (Gottfredson & Hirschi, 1990) by noting that measures
of self-control in the literature combined both attitudinal and behavioral indicators. Although
Grasmick et al.’s (1993) scale is the most widely used, one of its criticisms is that it is not
consistent with the behavioral requirement Gottfredson and Hirschi have emphasized (Evans, et
al., 1997; Hirschi, 2004; Hirschi & Gottfredson, 1993, 1994, 1995, 2000; Junger, West, &
Timman, 2001; Marcus, 2003; 2004). Thus, Hirschi (2004) proposed a more “accurate” revised
measurement of self-control which includes elements a number of elements reminiscent of social
control theory. Given the modest number of studies that have tackled this issue and larger
question as well as the inconsistent evidence to date about the relative merit of Hirschi’s
reconceptualization, the current study juxtaposed the effects by Hirschi’s (2004) redefinition of
self-control and by Grasmick et al. (1993) self- control measure on adolescent deviance across
eleven different cultural contexts.
Key findings from the current study include that both scales were internally consistent
across the eleven samples from different cultural contexts, although there was some evidence
that Hirschi’s (2004) measure was less consistently reliable, particularly among Taiwanese
adolescents. Secondly, and consistent with previous research (e.g., Morris et al., 2011; Piquero &
Bouffard, 2007; Higgins, Wolfe, & Marcum, 2008; Ward, Gibson, Boman, & Leite, 2010), both
Hirschi’s self-control measure and Grasmick et al.’s instrument uniquely explained variance in
adolescent deviance across each of the eleven cultures. Next, when comparing whether these
measures were unique, redundant, or additive in their effects on deviance, the evidence supported
that they were both unique and additive in their effects. In fact, the Grasmick et al. (1993) scale
20
consistently explained more variance (range: 24.3% to 46.9%) in deviance in comparison to
Hirschi’s (2004) self-control measure (range: 6.2% - 19.3%). This is consistent with some
previous work, including the study by Piquero and Bouffard (2007), yet different from what
Morris et al., (2011) found, namely a similar effect size in explaining adult offending, something
also echoed by Tittle, Ward and Grasmick (2003). Ward, Gibson, Boman and Leite (2010)
compared Marcus’ (2003) Retrospective Behavioral Self-Control Scale (RBS) and the Grasmick
et al. (1993) self-control measure and found that the modified RBS and original RBS had greater
explanatory power than the Grasmick et al.(1993) scale.
Finally, and perhaps most importantly, beyond comparing variance estimates, rigorous
SEM multi-group tests of the two key links between self-control measures and deviance
provided no evidence of contextual or cultural differences in the extent to which the measures
were associated. This is perhaps the most profound piece of evidence because of its implications
for the generalizability of the relationships between self-control and deviance, of the findings,
but also because they are so consistent with one of the key tenets of self-control theory as
originally specified by Gottfredson and Hirschi (1990).
Although certainly beyond the scope of the current effort which largely focused on a core
theoretical and measurement issue proposed by Hirschi (2004) following a wealth of empirical
evidence supporting the original theoretical work by Gottfredson and Hirschi (1990), a few
concluding comments related to the current status of the theory seem warranted. As we argue and
illustrate in greater detail elsewhere (Vazsonyi, Roberts, & Huang, 2014), perhaps one of the
most salient issues, both theoretically and methodologically, are the extent to which biology was
both acknowledged originally and incorporated subsequently into scholarship testing self-control
theory. We find that Gottfredson and Hirschi in fact acknowledged the salience of individual
21
differences in self-control and its developmental course, but that they focused on socialization
effects, largely related to our ability to influence the same. Piquero, Jennings, and Farrington
(2009) have since provided ample evidence that in fact self-control is malleable, despite strong
evidence that self-control and its development are biologically informed (Beaver, Ratchford, &
Ferguson, 2009; Boisvert et al., 2013; Vazsonyi & Huang, 2010). Delisi (2013) has so aptly
argued that the importance of self-control is a today a transdisciplinary phenomenon. One might
disagree on the extent to which self-control theory has been instrumental in this development as
scholars tend to operate in an insular fashion, rarely acknowledging ideas, predictions or
evidence from outside their discipline or subdiscipline. We find it has been pivotal and in fact
shaped so much of what we know, discuss, and test today since its publication a quarter century
ago. This includes initial critics of the theory who today embrace self-control, embrace it in no
uncertain terms based on extensive empirical evidence spanning decades, including biological
informed evidence – “self-control will provide essential for humanity’s long-term health, wealth,
safety, and happiness” (Moffitt, Poulton & Caspi, 2013, p. 359). Of course the same can be said
for a number of competing theoretical frameworks in criminology that have emerged over the
past two decades, which have consistently sought to incorporate self-control, self-control theory
or the general approach of a General Theory, but also about work from other disciplines,
including education and psychology or developmental sciences. On this latter issue, the original
theoretical work on the development of self-control was in fact consistent with human
developmental theory, with developmental sciences. In a characteristically understated manner,
Gottfredson (2006) so aptly notes:
If theories may be judged by how much research they stimulate, control theory is doing exceptionally well. If theories may be judged by their consistency with the facts, control theory is doing exceptionally well. And if theories may be judged by the frequency with which other perspectives seek to incorporate them, control
22
theory is, perhaps, without peer (p. 96).
Limitations
Despite its many strengths, the current study also contains an inherent number of
limitations. First, Hirschi’s measure was a very close approximation to what he originally
proposed, but not identical, and thus, one threat to the current conclusions is that perhaps using
all the items verbatim as proposed by Hirschi might slightly alter or change the study findings.
Second, additional work should also include other operationalizations of self-control as well as
deviance when examining the core issue addressed in the current work, to provide more
extensive and comprehensive tests of the idea. Third, the samples were convenience samples of
adolescents in each of the respective cultures, and thus, they cannot be considered truly
representative of their culture as youth who do not attend school were omitted, for example.
Finally, related to the method of assessment, it relied exclusively on adolescent self-reports, and
although challenging to address, future work might also incorporate additional sources of data to
eliminate potential method variance. It is also important to note that previous work has shown
how different data sources impact the observed relationships between self-control and deviance,
for instance (e.g., Boman & Gibson, 2011; Meldrum et al., 2013).
23
References
Akers, R. L. (1991). Self-control as a general theory of crime. Journal of Quantitative
Criminology, 7, 201-211.
Beaver, K. M., Ratchford, M., & Ferguson, C. J. (2009). Evidence of genetic and
environmental effects on the development of low self-control. Criminal Justice and
Behavior, 36, 1158-1172.
Bentler, P. M. & Chou, C. (1987). Practical issues in structural modeling. Sociological Methods
and Research, 16, 78-117.
Bentler, P. M. (1992). EQS Structural equations program manual. Los Angeles, CA: BMDP
Statistical Software.
Boisvert, D., Wright, J.P., Knopik, V., & Vaske, J. (2012). Genetic and Environmental Overlap
between Low Self-Control and Delinquency. Journal of Quantitative Criminology, 28
(3), 477-507.
Boman, J.H., & Gibson, C.L. (2011). Does the measurement of peer deviance change the
relationship between self-control and deviant behavior? An analysis of friendship pairs.
Journal of Criminal Justice, 39 (6), 521-530.
Bouffard, J. A. & Rice, S. K. (2011). The influence of the social bond on self-
control at the moment of decision: Testing Hirschi’s redefinition of self-control.”
American Journal of Criminal Justice, 36, 138-157.
Cheung, G. W., & Rensvold, R. B. (2002). Evaluating goodness-of-fit indexes for testing
measurement invariance. Structural Equation Modeling, 9 (2) 233-255.
DeLisi, M. (2013) Pandora’s box: The consequences of low self-control into adulthood,
24
In Chris L. Gibson and Marvin D. Krohn (Eds.), Handbook of Life-course Criminology
(pp. 261-273). New York: Springer-Verlag.
DeLisi, M., Hochstetler, A., Murphy, D.S. (2003). Self-control behind bars: A validation study
of the grasmick et al. scale. Justice Quarterly, 20 (2), 241-263.
DeLisi M., & Piquero A. R.(2011). New frontiers in criminal careers research, 2000-2011: A
state-of-the-art review. Journal of Criminal Justice, 39, 289–301.
de Ridder D. T. D., Lensvelt-Mulders G., Finkenauer C., Stok F. M., & Baumeister R.F. (2012).
Taking stock of self-control: A meta-analysis of how trait self-control relates to a wide
range of behaviors. Personality and Social Psychology Review, 16, 76–99.
Evans, T. David, Cullen, F. T., Burton, V. S. Jr., Dunaway, R. G., & Michael L. Benson, M. L.
(1997). The social consequences of self-control: Testing the general theory of crime.
Criminology, 35, 475-501.
Gibson, C.L., Ward, J.T., Wright, J.P., Beaver, K.M., & DeLisi, M. (2010). Where does gender
fit in the measurement of self-control? Criminal Justice and Behavior, 37 (8), 883-903.
Gottfredson, M.R. (2006). The empirical status of control theory in criminology. In Francis
Cullen, John Wright, and Kristie Blevins (Eds.), Taking Stock: The Status of
Criminological Theory (pp. 77-100). New Brunswick, NJ: Transaction Publishers.
Gottfredson, M. R., & Hirschi, T. (1990). A General Theory of Crime. Stanford, CA: Stanford
University Press.
Grasmick, H. G., Tittle, Ch. R., Bursik R. J. Jr., & Arneklev, B. J. (1993). Testing the core
empirical implications of Gottfredson and Hirschi’s general theory of crime. Journal of
Research in Crime and Delinquency, 30, 5-29.
25
Gunter, W. D. & Bakken, N. W. (2012). The many measurements of self-control: How re-
operationalized self-control compares. European Journal of Criminology, 9, 309-322.
Higgins, G.E.(2007). Examining the original grasmick scale: A rasch model approach. Criminal
Justice and Behavior, 34 (2), 157-178.
Higgins, G. E., Wolfe, S. E., & Marcum, C. D. (2008). Digital piracy: An examination of three
measurements of self-control. Deviant Behavior, 29, 440–460.
Hirschi, T. (1969). Causes of Delinquency. Berkeley, CA: University of California Press.
Hirschi, T. & Gottfredson, M. R. (1993). Commentary: Testing the general theory of crime.”
Journal of Research in Crime and Delinquency, 30, 47-54.
Hirschi, T. & Gottfredson, M. R. (1994). The generality of deviance. In T. Hirschi and M. R.
Gottfredson (Eds.), The Generality of Deviance. New Brunswick, NJ: Transaction
Publishing.
Hirschi, T. & Gottfredson, M. R. (1995). Control theory and the life-course perspective. Studies
on Crime and Crime Prevention, 4, 131-142.
Hirschi, T. (2004). Self-control and crime. In R. F. Baumeister and K. D. Vohs (Eds.), Handbook of
Self-regulation: Research, Theory and Applications. New York: Guilford Press.
Junger, M., West, R., & Timman, R. (2001). Crime and risky behavior in traffic: An example of
cross-situational consistency. Journal of Research in Crime and Delinquency, 38, 439-
459.
Keane, C., Maxim, P. S., & Teevan, J. J. (1993). Drinking and driving, self-control,
and gender: Testing a general theory of crime. Journal of Research in Crime and
Delinquency, 30, 30-46.
26
Little, T. D., Cunningham, W. A., Shahar, G., & Widaman, K. F. (2002). To parcel or not to
parcel: Exploring the question, weighing the merits. Structural Equation Modeling, 9,
151-173.
Marcus, B. (2003). An empirical examination of the construct validity of two alternative self-
control measures. Educational and Psychological Measurement 63: 674-706.
Marcus, B. (2004). Self-control in the general theory of crime: Theoretical implications of a
measurement problem. Theoretical Criminology, 8, 33-55.
Meldrum, R.C., Young, J.T.N., Burt, C.H., & Piquero, A.R. (2013). Maternal versus adolescent
reports of self-control: Implications for testing the general theory of crime. Journal of
Criminal Justice, 41 (1), 24-32.
Moffitt, T.E., Poulton, R., & Caspi, A. (2013) Lifelong impact of early self-control: Childhood
self-discipline predicts adult quality of life. American Scientist, 101, 352-359.
Moffitt, T. E., Arseneault, L., Belsky, D., Dickson, N., Hancox, R. J., Harrington, H., ... Caspi,
A. (2011). A gradient of childhood self-control predicts health, wealth, and public safety.
Proceedings of the National Academy of Sciences of the United States of America,
108(7), 2693 - 2698.
Morris, R. G., Gerber, J., & Menard, S. (2011). Social bonds, self-control, and adult criminality:
A nationally representative assessment of Hirschi’s revised self-control theory. Criminal
Justice and Behavior, 38, 584-599.
Piquero, A. R., & Bouffard, J. A. (2007). Something old, something new: A preliminary
investigation of Hirschi’s redefined self-control. Justice Quarterly, 24, 1-27.
Piquero, A. R., Jennings, W.G., and Farrington, D. P. (2009) 'On the malleability of
self-control: Theoretical and policy implications regarding a General Theory of Crime',
27
Justice Quarterly, 27, 803-834.
Piquero, A.R., MacIntosh, R., Hickman, M. (2000). Does self-control affect survey response?
Applying exploratory, confirmatory, and item response theory analysis to Grasmick et
al.'s self-control scale. Criminology, 38 (3), 897-929.
Pratt, T. C., & Cullen, F.T. (2000). The empirical status of Gottfredson and Hirschi's general
theory of crime: A meta-analysis. Criminology, 38, 931–64.
Pratt, T. C., Turanovic, J. J., Fox, K. A. & Wright, K. A. (2014), Self-control, and victimization:
A meta-analysis. Criminology, 52, 87–116.
Rocque, M., Posick, C., & Zimmerman, G. M. (2013). Measuring up: Assessing the
measurement properties of two self-control scales. Deviant Behavior, 34, 534-556.
Tittle, C. R., Ward, D. A., & Grasmick, H. G. (2003). Self-control and crime/deviance: Cognitive
vs. behavioral measures. Journal of Quantitative Criminology, 19 (4) 333-365.
van de Vijver, F. J. R., & Leung, K. (1997). Methods and data analysis for cross-cultural
research. Thousand Oaks, CA: Sage Publications.
Vazsonyi, A. T., & Belliston, L. M. (2007). The family -> low self-control -> deviance: A cross-
cultural and cross-national test of self-control theory. Criminal Justice and Behavior, 34(4),
505-530.
Vazsonyi, A.T., & Huang, L. (2010). Where self-control comes from: On the development of
self-control and its relationship to deviance over time. Developmental Psychology,
46, 245-257.
Vazsonyi, A. T., Pickering, L. E., Junger, M., & Hessing, D. (2001). An empirical test of a
general theory of crime: A four-nation comparative study of self-control and the
prediction of deviance. Journal of Research in Crime and Delinquency, 38, 91-131.
28
Ward, J. T., Boman, J., & Jones, S. (2012). Hirschi’s redefined self-control:
Assessing the implications of the merger between social- and self-control theories.
Crime and Delinquency, 20, 1-28.
Ward, J., Gibson, C., Boman, J., & Leite, W. L. (2010). Assessing the validity of the
retrospective behavioral self-control scale: Is the general theory of crime stronger than
the evidence suggests? Criminal Justice and Behavior, 37, 336-3.
Williams, M.W.M., Fletcher, R.B., & Ronan, K.R. (2007). Investigating the theoretical construct
and invariance of the self-control scale using confirmatory factor analysis. Journal of
Criminal Justice, 35 (2), 205-218.
29
Notes:
1 A number of studies have examine the psychometric properties of the Grasmick et al. (1993)
measure as well as its usefulness and support for males and females (e.g., Gibson et al., 2010;
Higgins, 2007; Delisi et al., 2003; Piquero et al., 2000; Vazsonyi et al., 2001, 2004; Williams et
al., 2007;).
30
Figure 1. Self-Control Predicting Deviance
Note: = The direct path from Hirschi’s self-control measure to deviance and b = the direct path from Grasmick et al.’s low self- control measure to deviance.
Deviance
Hirschi’s Self-Control
Grasmick et al.’s Low Self-Control
a
b
Parcel 1 Parcel 2
Parcel 1 Parcel 2
Parcel 1 Parcel 2
31
Table 1 Studies testing Hirschi’s reconceptualized self-control
Study N Mage
Measurement Key Findings
Piquero and Bouffard (2007) N = 212
Mage = 20.6
1. Hirschi’s redefined self-control
(self-generated inhibitions) 2. Grasmick et al. (1993)
Only Hirschi’s measure remained significant for drunk driving (both sexes) and sexual coercion (males only).
Higgins et al. (2008) N = 358
Mage = 21
1. Self-generated inhibitions (Piquero and Bouffard measure) 2. Bonding self-control measure (Hirschi measure) 3. Grasmick et al. (1993)
All three measures showed modest predictability for digital piracy.
Morris et al. (2011) N = 1,139
Mage = 36-44
1. Hirschi’s redefined self-control 2. Grasmick et al. (1993) attitudinal
self-control measure
Similar effects of predicting adult offending was found from both measures.
Bouffard and Rice (2011) N = 311
Mage = 20.8
1. Hirschi’s redefined self-control (modified Piquero and Bouffard ) 2. Social bonding measure
Hirschi’s measure was a significant predictor of drunk driving. Social bonds were shown to operate through self-control alone.
Gunter and Bakken (2012) N = 1,458
Mage = 20.2
1. Hirschi’s redefined self-control (replication of Piquero and
Bouffard) 2. Grasmick et al. (1993)
Only the Grasmick et al. (1993) measure remained significant for drunk driving and cheating on an exam.
Ward et al. (2012) N = 2,243
Mage = 15.4 1. Hirschi’s redefined self-control 2. Social bonding measure
Hirschi’s redefined self-control was a significant predictor of marijuana use. Social bonds had a 45% effect on self-control at predicting marijuana use.
Rocque, Posick and
Zimmerman (2013)
N = 2,400
Mage = 12-14
1. Grasmick et al. (1993) attitudinal self-control measure
2. Hirschi (2004) self-control measure
Both self-control measures both have similar measurement properties (item fit statistics, unidimensinality, reliability). Both scales are significantly related to deviant behaviors (violence, property crime, and alcohol consumption).
32
Table 2 Descriptive of Age, Sex, Family Structure, and SES by Country
China n =1,373
Czech Republic n = 890
Hungary n = 871
Japan
n = 355
Netherlands
n = 1,315
Slovenia n = 1,422
Spain
n = 1,030
Switzerland n = 4,018
Taiwan
n = 1,443
Turkey
n = 1,447
USA
n = 2,213
Age (M) 13.25 17.97 16.56 20.10 16.12 16.75 18.30 18.23 16.48 16.53 16.36
Sex
Male 47.8 56.4 67.3 33.5 46.6 35.8 34.7 62.0 57.7 43.2 49.4
Female 52.2 43.6 31.1 66.5 53.1 62.9 64.8 37.0 42.3 56.1 49.3
Family Structure
Traditional 83.0 60.4 79.7 30.7 86.3 75.7 82.3 81.7 80.7 90.7 65.0
Non-traditional 17.0 39.6 19.9 61.4 12.5 24.2 17.6 17.8 19.1 8.7 33.3
SES
Laborer 14.1 0 10.1 37.4 0.7 1.4 4.9 1.6 2.9 8.4 14.0
Semi-skilled 47.3 9.0 19.1 20.6 2.5 14.1 17.5 3.4 25.7 9.4 15.3
Clerical 24.7 5.8 21.4 24.6 10.6 17.1 15.7 11.9 22.6 29.3 10.4
Semi-Prof. 9.1 26.0 13.4 10.6 24.6 28.8 8.1 31.9 7.9 23.3 10.6
Professional 4.7 38.5 25.6 3.7 32.8 29.5 32.9 35.1 16.1 21.1 29.4
Executive 0.2 18.2 10.3 3.1 16.0 9.0 21.0 16.1 24.8 8.5 20.2
33
Table 3 Hirschi (2004) Self-Control Conceptualization versus Current Study
Hirschi (2004)
Current Study
1. Do you like or dislike school. (Like it)
I like school. A = strongly disagree, B = disagree, C = agree, D = strongly agree Coding (0/1): A and B = 0; C and D = 1
2. How important is getting good grades to your personally? (very important)
Getting good grades is important to me. A = strongly disagree, B = disagree, C = agree, D = strongly agree Coding (0/1): A and B = 0; C and D = 1
3. Do you finish your homework? (Always)
I finish my homework. A = strongly disagree, B = disagree, C = agree, D = strongly agree Coding (0/1): A and B = 0; C and D = 1
4. Do you care what teachers think of you? (I care a lot).
N/A
5. It is none of the school’s business if a student wants to smoke outside of the classroom? (strongly disagree).
N/A
6. Does your mother know who you are with when you are away from home (usually)
In my free time away from home, my mother knows who I’m with and where I am. A = strongly disagree, B = disagree, C = neither disagree nor agree, D = agree, E = Strongly agree Coding (0/1): A, B, C = 0; D and E = 1
7. Does your mother know where you are when you are away from home (usually)
My mother wants me to tell her where I am if I don’t come home right after school. A = strongly disagree, B = disagree, C = neither disagree nor agree, D = agree, E = strongly agree Coding (0/1): A, B, C = 0; D and E = 1
8. Do you share your thoughts and feelings with your mothers (often)
How often do you talk to your mother about the boy/girl whom you like very much. How often do you talk to your mother about questions or problems about sex. How often do you talk to your mother about other things that are important to you How often do you talk to your mother about things you have done about which you feel guilty How often do you talk to your mother about major personal decision. A = never, B = occasionally, C = sometimes, D = often, E = very often Coding (0/1): A B, C = 0; D and E = 1
9. Would you like to be the kind of person your mother is (In every way, In most ways).
N/A
34
Table 4 Scale and Parcel Descriptive Statistics
China n=1,373
Czech Republic n=890
Hungary n = 871
Japan n = 355
Netherlands n = 1,315
M/SD α M/SD α M/SD α M/SD α M/SD α
Grasmick LSC
2.72/0.56
0.91 2.66/0.64 0.93
2.78/0.3
0.80
2.65/0.35
0.70
2.82/0.40 0.77
Parcel 1 2.71/0.69 2.86/0.77 2.83/0.54 2.62/0.45 2.94/0.54 Parcel 2 2.63/0.69 2.76/0.75 2.75/0.49 2.44/0.48 2.71/0.53
Hirschi’s SC
0.40/0.20
0.58 0.40/0.25 0.78
0.51/0.22
0.65
0.44/0.22
0.65
0.47/0.22 0.63
Parcel 1 2.33/1.18 1.71/0.79 2.88/1.28 1.90/1.26 2.84/1.18 Parcel 2 1.58/1.08 2.12/0.79 1.92/1.24 2.45/1.16 1.80/1.24
Deviance
1.50/0.71
0 .98 1.88/.77 0.97
1.71/0.60
0.80
1.41/0.34
0.90
1.79/0.60 0.95
Parcel 1 1.46/0.72 2.28/1.42 1.60/0.60 1.24/0.31 1.67/0.62 Parcel 2 1.58/0.73 1.75/1.32 1.86/0.64 1.68/0.49 1.93/0.61
Notes. Grasmick LSC = Grasmick et al.’s low self-control measure; Hirschi SC = Hirschi’s self-control measure
35
Table 4 continued Scale and Parcel Descriptive Statistics
Slovenia n = 1,422
Spain
n = 1,030
Switzerland n = 4,018
Taiwan n = 1,443
Turkey
n = 1,447
USA n = 2,213
M/SD α M/SD α M/SD α M/SD α M/SD α M/SD α
Grasmick LSC 2.89/0.40 0.80 2.73/0.39 0.77 2.56/0.35 0.77 2.78/0.40 0.72 2.84/0.57 0.85 2.84/0.48 0.87
Parcel 1 2.91/0.73 2.74/0.48 2.51/0.45 2.93/0.47 2.78/0.68 2.81/1.26 Parcel 2 2.80/0.75 2.47/0.50 2.39/0.44 2.82/0.45 2.78/0.69 2.58/1.20
Hirschi’s SC
0.53/0.24
0.68
0.52/0.21
0.62
0.50/0.21
0.63
0.42/0.20
0.57
0.54/0.22
0.68
0.55/0.22
0.66
Parcel 1 3.06/1.33 3.01/1.19 2.15/1.23 2.35/1.17 3.06/1.24 3.31/0.61 Parcel 2 2.21/1.34 2.16/1.20 2.89/1.23 1.86/1.01 2.43/1.22 2.190/.60
Deviance
1.86/0.72
0.95
1.79/0.56
0.95
1.92/0.67
0.96
1.29/0.32
0.92
1.55/0.67
0.97
1.87/0.70
0.96
Parcel 1 1.71/0.58 1.59/0.54 1.86/0.69 1.21/0.30 1.49/0.68 1.71/0.66
Parcel 2 2.04/0.55 2.07/0.62 1.96/0.68 1.43/0.43 1.63/0.70 2.08/0.77
Notes. Grasmick LSC = Grasmick et al.’s low self-control measure; Hirschi SC = Hirschi’s self-control measure
36
Table 5 Standardized Path Coefficients and Latent Construct Loadings by Country
China n = 1,373
Czech
Republic n = 890
Hungary n = 871
Japan
n = 355
Netherlands
n = 1,315
Slovenia n = 1,422
Spain
n = 1,030
Switzerlandn = 4,018
Taiwan
n = 1,443
Turkey
n = 1,447
USA
n = 2,213
Hirschi SC → Deviance ‒.062 ‒.137 ‒.208 ‒.062 ‒.189 ‒.227 ‒.193 ‒.235 ‒.131 ‒.170 ‒.189
Grasmick LSC→ Deviance .375 .243 .378 .375 .469 .326 .410 .389 .337 .392 .467
Hirschi SC Parcel 1 .463 1.08 .758 .463 .779 .927 .861 .649 .952 .796 .852
Hirschi SC Parcel 2 1.10 .568 .676 1.11 .625 .555 .561 .806 .502 .666 .622
Grasmick LSC Parcel 1 .807 .933 .835 .963 .872 .854 .886 .770 .815 .903 .882
Grasmick LSC Parcel 2 .788 .942 .846 .735 .854 .847 .805 .838 .817 .876 .885
Deviance Parcel 1 .963 .887 .926 .807 .950 .922 .933 .952 .867 .945 .953
Deviance Parcel 2 .735 .969 .904 .788 .875 .937 .888 .911 .851 .908 .905
Notes. Grasmick LSC = Grasmick et al.’s low self-control measure; Hirschi SC = Hirschi’s self-control measure
37
Table 6 Model Fit Summary Statistics
χ² df χ²/df p CFI RMSEA
Model 1: Default 355.49 68 5.23 .000 .996 .012
Model 2: Paths ɑ and b 471.23 86 5.48 .000 .994 .013 Model 3: Path ɑ
399.89
77
5.19
.000
.995
.012
Model 4: Path b 432.75 77 5.62 .000 .995 .013
Note. Models 2 through 4: Multi-group model tests, paths constrained to equality.
38
Table 7 Nested Model Comparison
Default vs. Model 2: Paths a and b
Default vs. Model 3: Path a
Default vs. Model 4: Path a
χ² 115.74 44.406 77.26
p .000 .000 .000
df 18 9 9
∆NFI .002 .001 .001
∆CFI .001 .000 .001
∆IFI .002 .001 .001
∆RFI 001 .000 .001
∆TLI .001 .000 .001
Note. Models 2 through 4: Multi-group model tests, paths constrained to equality.
39
APPENDIX The Normative Deviance Scale (NDS) Please answer the next few questions in the following way: A = no/never, B = once, C = 2-3 times, D = 4-5 times, E = Always. Vandalism: Have you ever…. Smashed bottles on the street, school grounds, or other areas? Intentionally damaged or destroyed property belonging to your parents or other family members (e.g., brothers or sisters)? Intentionally damaged or destroyed property belonging to a school, college, or university? Intentionally damaged or destroyed other property (e.g., signs, windows, mailboxes, parking meter, etc.) that did not belong to you? Intentionally damaged or destroyed property belonging to your employer or at your workplace? Slashed or in any way damaged seats on a bus, in a movie theater, or something at another public place? Written graffiti on a bus, on school walls, on rest room walls, or on anything else in a public place? Committed acts of vandalism when coming or going to a football game or other sports events? Alcohol use: Have you ever ….. Consumed hard liquor (e.g., tequila, whiskey, vodka, or gin) before you were 16? Consumed alcoholic beverages (e.g., beer, wine, or wine coolers) before you were 16? Got drunk (intentionally) just for the fun of it (at any age)? Got drunk just to fit in and be part of the crowd (at any age)? Lied about your age to buy alcohol before you turned 16? Had an older brother/sister or friend buy alcohol for you? Bought alcohol for a brother/sister or friend? Drug use: Have you ever…. Used tobacco products regularly (e.g., cigarettes, chew, snuff, etc.)? Used “soft” drugs such as marijuana (grass, pot)? Used “hard” drugs such as crack, cocaine, or heroin? Gone to school when you were drunk or high on drugs? Gone to work when you were drunk or high on drugs? Gone to a concert when you were drunk or high on drugs? Gone to a club/dance/party when you were drunk or high on drugs? Gone to a club/dance/party to get drunk or high on drugs? Sold any drugs such as marijuana (grass, pot), cocaine, or heroin? School misconduct: Have you ever…. Cheated on school tests (e.g., cheat sheet, copy from neighbor, etc.)? Been sent out of a classroom because of “bad behavior (e.g., inappropriate behaviors, cheating, etc.)? Been suspended or expelled from school? Stayed away from school/classes when your parent(s) thought you were there? Intentionally missed classes more than a number of days for “no reason”, just for fun (e.g., there was no family emergency)? Been in trouble at school so that your parents received a phone call about it? Skipped school/work (pretending you were ill)?
40
General deviance: Have you ever…. Intentionally disobeyed a stop sign or a red traffic light while driving a vehicle? Been on someone else’s property when you knew you were not supposed to be there? Failed to return extra change that you knew a cashier gave you by mistake? Tried to deceive a cashier to your advantage (e.g., flash a larger bill and give a smaller one)? Let the air out of the tires of a car or a bike? Lied about your age to get into a nightclub/bar? Made nuisance/obscene telephone calls? Avoided paying for something (e.g., movies, bus or subway rides, food, etc.)? Used fake money or other things in a candy, coke, or stamp machine? Shaken/hit a parked car just to turn on the car’s alarm? Stayed out all night without informing your parents about your whereabouts? Theft: Have you ever… Stolen, taken, or tried to take something worth 20 U.S dollar or less (e.g., newspaper, pack the gum, mail, money, etc.)? Stolen, taken, or tried to take something worth between 20-150 U.S dollar or less( e.g., shirt, watch, cologne, video game cartridge, shoes, money)? Stolen, taken, or tried to take something worth more than 150 U.S dollar (e.g., leather jacket, car stereo, bike, money, etc.)? Stolen, taken, or tried to take something that belonged to “the public” (e.g., street signs, construction signs, etc.)? Stolen or tried to steal a motor vehicle (e.g., car or motorcycle)? Bought, sold, or held stolen goods or tried to do any of these of things? Assault: Have you ever…. Hit or threatened to hit a person? Hit or threatened to hit your parent(s)? Hit or threatened to hit other students/peers or people? Used force or threatened to beat someone up if they didn’t give your money or something else you wanted? Been involved in gang fights or other gang activities? Beaten someone up so badly they required medical attention?
41
Grasmick et al. (1993) Low Self-Control Measure Please answer the next few questions in the following way: A = strongly disagree, B = disagree, C = neither disagree nor agree, D = agree, E = strongly agree. Impulsivity
1. I often act on the spur of the moment without stopping to think 9. I often do whatever brings me pleasure here and now, even at the cost of some distant goal 13. I’ m more concerned with what happens to me in the short run than in the long run
Simple Tasks
5. I frequently try to avoid projects that I know will be difficult 7. I dislike really hard tasks that stretch my abilities 15. When things get complicated, I tend to quit or withdraw 19. The things in life that are easiest to do bring me the most pleasure
Risk seeking
3. I like to test myself every now and then by doing something a little risky 4. Sometimes I will take a risk just for the fun of it 1. I sometimes find it exciting to do things for which I might get in trouble 11. Excitement and adventure are more important to me than security
Physical activities 8. If I had a choice, I would almost rather do something physical than something mental 10. I almost always feel better when I am on the move than when I am sitting and thinking 16. I like to get out and do things more than I like to read or contemplate ideas 18. I seem to have more energy and a greater need for activity than most other people my age
Self-Centeredness
12. I try to look out for myself first, even if it means making things difficult for other people 14. I will try to get the things I want even when I know it’s causing problems for other people 17. I’m not very sympathetic to other people when they are having problems
Temper
21. I lose my temper pretty easily 22. Often, when I’m angry at people I feel more like hurting them talking to them about why I am angry 23. When I’ m really angry, other people better stay away from me 24. When I have a serious disagreement with someone, its usually hard for me to talk calmly about it without getting upset.