


EARNINGS PRESENTATION Q1 FY2016
www.himadri.com
Himadri Chemicals & Industries Limited(NSE: HCIL, BSE: 500184)
Earnings Presentation
Q1 FY2016
August 12, 2015

EARNINGS PRESENTATION Q1 FY2016
Important Notice
This presentation contains statements that contain “forward looking statements” including, but without limitation, statements
relating to the implementation of strategic initiatives, and other statements relating to Himadri Chemical and Industries
Limited (“HCIL” or the Company) future business developments and economic performance.
While these forward looking statements indicate our assessment and future expectations concerning the development of our
business, a number of risks, uncertainties and other unknown factors could cause actual developments and results to differ
materially from our expectations.
These factors include, but are not limited to, general market, macro-economic, governmental and regulatory trends,
movements in currency exchange and interest rates, competitive pressures, technological developments, changes in the
financial conditions of third parties dealing with us, legislative developments, and other key factors that could affect our
business and financial performance.
HCIL undertakes no obligation to publicly revise any forward looking statements to reflect future / likely events orcircumstances
2
Conference Dial-In Numbers: August 17, 2015 (Monday) at 4.00 PM IST
Primary Number +91 22 3960 0734
Secondary Number +91 22 6746 8334
The numbers listed above are universally accessible from all networks and all countries
International
Toll Free Number
USA: 1 866 746 2133
UK: 0 808 101 1573
Singapore: 800 101 2045
Hong Kong: 800 964 448

EARNINGS PRESENTATION Q1 FY2016
“The headwinds of the sluggish aluminium and steel sectors coupled with unfavourable currency
fluctuations continued to impact our financial performance during this quarter with revenue declining
by 21.5% and operating profit by 63.5%.
The slowdown in the steel sector has been prolonged and harsh. It has been reeling under the
pressure of overcapacity, waning demand and declining prices. The major steel producing country,
China, has been exporting significant amount of steel at lower prices owing to its weakening
domestic demand and stagnant economy. Steel demand from India will likely increase in the near to
medium term however it is unlikely to be sufficient to offset the decline in China. The steel
consumption in India is expected to grow by 7% in FY2016. The aluminium industry is in a tight spot
due to surging cheap imports into India and declining LME prices. A proposal has been made to the
Government to increase the import duty to bring some respite in the near term.
The long term prospects of the steel, aluminium and auto sectors in India is promising as the Indian economy is back on the
growth track due to the increased demand from key sectors of economy such as infrastructure, logistics and real estate. The
revival in the economy is bound to increase the demand for all our primary products. Himadri is also expected to benefit from the
growth in the auto segment primarily the Commercial vehicle segment.
The Company has invested in state-of-the-art distillation plants and captive power units which will cement our position as the
industry front runner. Himadri is well positioned to overcome the obstacles and adequately capitalized to benefit from the rebound
in the overall economy. Risk mitigation, improving operational efficiencies and enhancing shareholder’s value continue to remain
our focus.”
Financial Highlights
Highlights – Q1 FY2016 vs Q1 FY2015
Total Revenue of Rs. 2,758 million
Adjusted EBITDA of Rs. 237 million; Margins of 8.6%
Net Debt of Rs. 10,671 million; Net Debt / Equity of 1.32x
Commenting on the results and performance, Mr. Anurag Chaudhary, CEO of HCIL said:
3

EARNINGS PRESENTATION Q1 FY2016
Economic Environment
• Index of Industrial Production (IIP) increased to four month high of 3.8% in June 2015 from 2.7% in May due to
growth in the manufacturing segment
• The Wholesale Price Index (WPI) declined for the eighth consecutive month in June at (2.4)% y-o-y. However,
Consumer Price Inflation (CPI) for June 2015 increased to 5.4% compared to the 5.0% in May 2015.
• Global steel production continued to remain weak and contracted by (2.4)% y-o-y to 410 million MT in Q1 FY2016.
However, steel production in India increased by 0.6% y-o-y to 22 million MT. In China, the crude-steel production
declined by (1.1)% y-o-y to 208 million MT. The quarter remained challenging due to an adverse demand scenario
and cheap imports hurting the revenues of Indian steel manufacturers. The revival for demand is anticipated as
significant investments are being made in the domestic Indian steel industry including modernization of the older
steel plants and upcoming new plants.
• Average LME prices for Aluminium for the quarter was $1,765/mt, a decrease of (2)% y-o-y. Prices remained under
pressure due to rising Chinese production and relaxed load-in-load-out rules leading to improved metal availability.
• The total domestic auto production grew by 1.6% in the quarter led by medium commercial vehicle and three
wheeler segments. The tyre industry continued to benefit from softening of natural rubber and crude oil prices.
Index of Industrial Production Automotive Production Growth Y-o-Y (%)
4
11.6%
15.6%14.9%
22.5%
(4.6)%
12.4%
6.3%2.0%0.7%2.3%2.5%
(1.4)%3.8%
(15.0)%
0.0%
15.0%
30.0%
Jun-1
4
Jul-1
4
Aug-1
4
Sep-1
4
Oct-
14
No
v-1
4
De
c-1
4
Jan-1
5
Fe
b-1
5
Ma
r-1
5
Apr-
15
Ma
y-1
5
Jun-1
5
5.6%4.3%
0.9%
0.5%
2.6%
(2.7%)
5.2%
3.6%2.8%
4.9%
2.5%
3.4%
2.7%
3.8%
(6)%
(3)%
0%
3%
6%
9%
Ma
y-1
4
Jun-1
4
Jul-1
4
Aug-1
4
Sep-1
4
Oct-
14
No
v-1
4
De
c-1
4
Jan-1
5
Feb
-15
Ma
r-1
5
Apr-
15
Ma
y-1
5
Jun-1
5
Gro
wth
Rate
(%
)

EARNINGS PRESENTATION Q1 FY2016
Industry Outlook
• As per the global rating agency Fitch, India’s GDP is expected to grow by 7.8% in FY2016. This growth would be
aided by uptick in private consumption demand, new investments, faster implementation of stalled infrastructure
projects and a rebound in mining activity.
• During CY2015, the global steel consumption is expected to remain relatively flat at 1,544 million MT. In the near
term, the Indian steel sector will continue to remain under pressure due to high import from China at lower prices.
However, the recent 2.5% hike in steel import duty is expected to provide some protection in the near term. In the
long term, the steel sector is poised for growth due to revival in demand from the construction, infrastructure,
engineering, fabrication and auto sectors. The consumption of steel in India is expected to grow by 7% in FY2016
as compared to 2% growth in consumption last year.
• The near term outlook for the aluminium industry remains challenging due to increasing imports from China and
Middle-East, continuously sliding prices, subdued demand and rising cost of production. A proposal has been made
to the Government to impose and import duty on aluminum which could help Indian players. LME prices have been
on a downward trend over the past few months and are expected to remain subdued in the near term. In June,
aluminum prices have fallen to $1,685/MT, which has significantly affected the global aluminum market.
• The recovery in the passenger vehicle segment (PV) is slow and manufacturers are trying to use the excess
capacity to boost exports and compensate for the subdued domestic demand. However, the long term potential of
the sector remains intact and India is expected to become the world’s third largest PV market by 2020. The
M&HCV (Truck) segment is expected to grow by 12-14% in FY 2016 driven by trend towards replacement of ageing
fleet and demand uptick from infrastructure, mining and industrial sectors. The LCV segment will grow at modest
rate of 4-6% in FY2016 as the segment’s prospects continue to be influenced by overcapacity issues and
constrained financing environment. The Indian CV industry is also witnessing sizeable investments by global OEMs
towards upgrading their product portfolio, introducing new models and expanding manufacturing capacities.
• The domestic tyre demand is expected to grow by 4- 8% over the next three years. Over the medium term, the
competitive intensity in the tyre industry will rise with expected commissioning of several Greenfield and Brownfield
capacities by domestic as well as international players.
5
Economic Environment

EARNINGS PRESENTATION Q1 FY2016
Performance Overview
Standalone Financial Highlights
Q1 Q1 y-o-y Q4 q-o-q
(Rs. Million) FY2016 FY2015 Growth (%) FY2015 Growth (%)
Net Sales 2,758 3,515 (21.5)% 3,412 (19.2)%
Adjusted EBITDA1 237 315 (24.7)% 406 (41.6)%
Adj EBITDA Margin (%) 8.6% 9.0% 11.9%
EBITDA 166 454 (63.5)% 57 188.6%
EBITDA Margin (%) 6.0% 12.9% 1.7%
Profit After Tax (PAT) (201) 144 nm (160) nm
Adjusted PAT2
(128) 35 nm (201) nm
Adj PAT Margin (%) nm 1.0% nm
Basic EPS (Rs.) (0.52) 0.37 (0.41)
Note:
1. Adjusted for write down in inventory valuation by Rs. 46.9 million in Q1 FY2016, (139.6) million in Q1 FY2015 and 340.9 million in Q4
FY2015, and on account of expenses related to previous year by 24.1 million in Q1 FY2016 and 7.5 million in Q4 FY2015
2. Adjusted for foreign currency gain / (loss) and other income of Rs. (72.6) million in Q1 FY2016, Rs. 41.3 million in Q4 FY2015 and Rs.
108.6 million in Q1 FY2015 6

EARNINGS PRESENTATION Q1 FY2016
Performance Overview
Highlights – Q1 FY2016 vs. Q1 FY2015 (Standalone)
• Net Sales: Net Sales were Rs.2,758 million, a decline of (21.5)% as compared to Q1 FY2015. This was primarily
driven by decline in sales price y-o-y
• EBITDA: EBITDA was Rs. 166 million for Q1 FY2016, a decrease of (63.5)% compared to the same period last
year. EBITDA margin was at 6.0% vs 12.9% in the same period last year primarily due to lower realisations
• The adjusted EBITDA was Rs. 237 million with margins of 8.6%. This was due to the write down in inventory
valuation by Rs. 46.9 million and Rs. 24.1 million on account of expenses related to previous year
• Profit After Tax (PAT): The Company had a net loss of Rs. (201) million as compared to a profit of Rs. 144 million
in Q1 FY2015. The depreciation increased from 138 million in Q1 FY2015 to 158 million in Q1 FY2016. PAT for the
quarter was impacted due to lower operating profit
• Q1 FY2016 PAT adjusted for foreign currency gain/(loss) and other income was Rs. (128) million
7

EARNINGS PRESENTATION Q1 FY2016
Performance Overview
Revenue (Rs. Million)
EBITDA (Rs. Million) and Margin (%) PAT (Rs. Million) and Margin (%)
Gross Profit (Rs. Million) and Margin(%)
8*Standalone financials
144
(33)
(95)
(160)
(201)
Q1 FY2015 Q2 FY2015 Q3 FY2015 Q4 FY2015 Q1 FY2016
3,515 3,5703,262 3,412
2,758
Q1 FY2015 Q2 FY2015 Q3 FY2015 Q4 FY2015 Q1 FY2016
454417
283
57
166
12.9%
11.7%
8.7%
1.7%
6.0%
Q1 FY2015 Q2 FY2015 Q3 FY2015 Q4 FY2015 Q1 FY2016
825 807715
500591
23.5% 22.6%21.9%
14.7%
21.4%
Q1 FY2015 Q2 FY2015 Q3 FY2015 Q4 FY2015 Q1 FY2016

EARNINGS PRESENTATION Q1 FY2016
Segment Analysis
Standalone Segment Analysis
Q1 y-o-y Q4 q-o-q
(Rs. Million) FY2016 FY2015 Growth (%) FY2015 Growth (%)
Sales
Carbon Materials and Chemicals 2,725 3,500 (22.2)% 3,398 (19.8)%
Power 66 47 41.0% 46 43.7%
Total 2,791 3,547 (21.3)% 3,444 (19.0)%
Less: Inter segment revenue 32 32 (1.5)% 25 25.1%
Total 2,759 3,515 3,419
Profit before Tax and Interest
Carbon Materials and Chemicals (44) 284 nm (95) nm
Power 53 34 56.5% 29 81.6%
Total 9 318 (65)
9
EARNINGS PRESENTATION Q1 FY2016
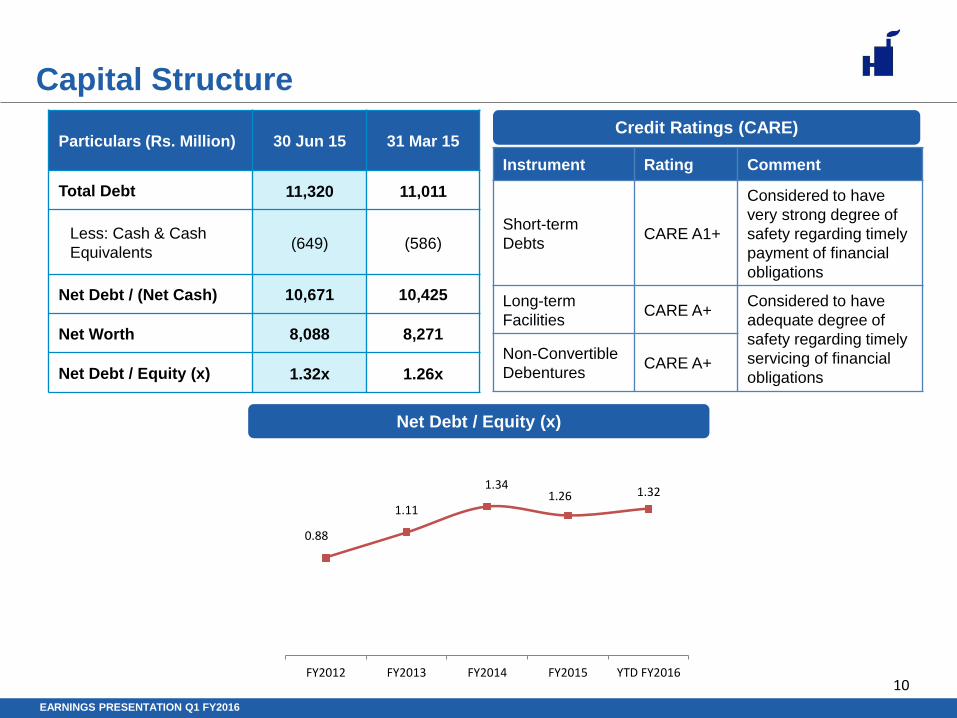
Capital Structure
Net Debt / Equity (x)
Particulars (Rs. Million) 30 Jun 15 31 Mar 15
Total Debt 11,320 11,011
Less: Cash & Cash
Equivalents(649) (586)
Net Debt / (Net Cash) 10,671 10,425
Net Worth 8,088 8,271
Net Debt / Equity (x) 1.32x 1.26x
Instrument Rating Comment
Short-term
DebtsCARE A1+
Considered to have
very strong degree of
safety regarding timely
payment of financial
obligations
Long-term
FacilitiesCARE A+
Considered to have
adequate degree of
safety regarding timely
servicing of financial
obligations
Non-Convertible
DebenturesCARE A+
Credit Ratings (CARE)
10
0.88
1.11
1.341.26 1.32
FY2012 FY2013 FY2014 FY2015 YTD FY2016
EARNINGS PRESENTATION Q1 FY2016
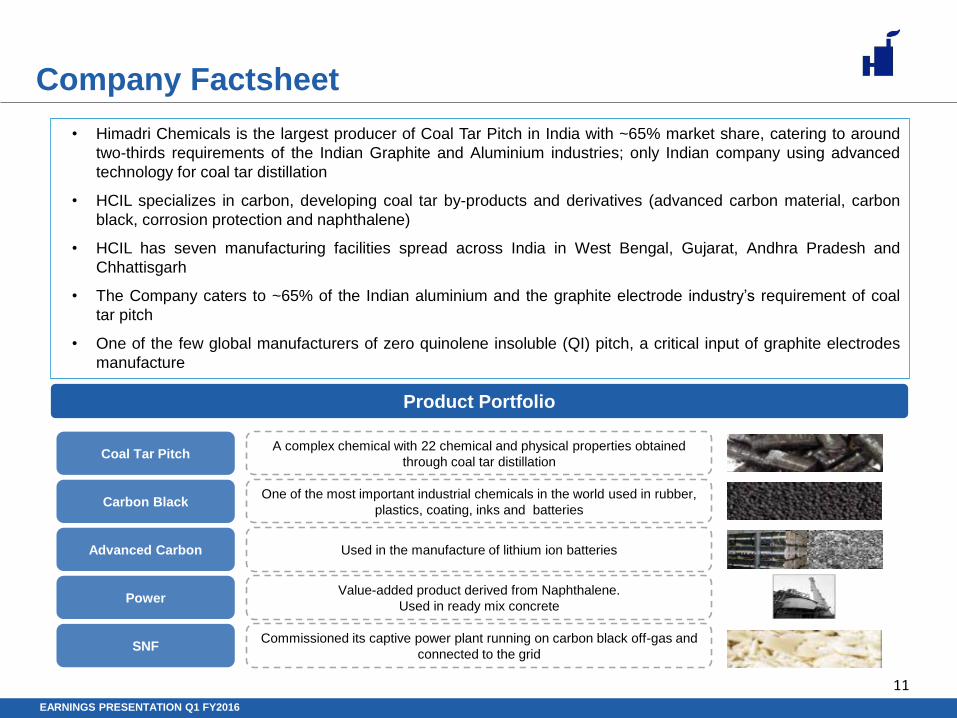
Company Factsheet
Coal Tar Pitch
Carbon Black
Advanced Carbon
Power
SNF
A complex chemical with 22 chemical and physical properties obtained
through coal tar distillation
One of the most important industrial chemicals in the world used in rubber,
plastics, coating, inks and batteries
Used in the manufacture of lithium ion batteries
Value-added product derived from Naphthalene.
Used in ready mix concrete
Commissioned its captive power plant running on carbon black off-gas and
connected to the grid
• Himadri Chemicals is the largest producer of Coal Tar Pitch in India with ~65% market share, catering to around
two-thirds requirements of the Indian Graphite and Aluminium industries; only Indian company using advanced
technology for coal tar distillation
• HCIL specializes in carbon, developing coal tar by-products and derivatives (advanced carbon material, carbon
black, corrosion protection and naphthalene)
• HCIL has seven manufacturing facilities spread across India in West Bengal, Gujarat, Andhra Pradesh and
Chhattisgarh
• The Company caters to ~65% of the Indian aluminium and the graphite electrode industry’s requirement of coal
tar pitch
• One of the few global manufacturers of zero quinolene insoluble (QI) pitch, a critical input of graphite electrodes
manufacture
Product Portfolio
11

EARNINGS PRESENTATION Q1 FY2016
Statutory Financials
Unaudited Results for the quarter ended 30th June 2015
12
PART I (Rs. in Crores)
Three months
ended
30.06.2015
Preceding
Three months
ended
31.03.2015
Corresponding
Three months
ended
30.06.2014 in
the previous
year
Year ended
31.03.2015
(Unaudited) (Audited) (Unaudited) (Audited)
1 Income from Operations
(a) Net Sales/Income from Operations (Net of excise duty) 275.81 341.15 351.47 1,375.82
(b) Other Operating Income 0.11 0.71 - 1.68
Total Income from Operations (net) 275.92 341.86 351.47 1,377.50
2 Expenses
(a) Cost of materials consumed 197.71 287.18 269.55 1,134.05
(b) Changes in inventories of finished goods and work-in-
progress
20.41 (14.01) (1.75) (62.49)
(c) Employee benefits expense 6.98 8.08 6.56 29.37
(d) Depreciation 15.80 13.00 13.84 55.36
(e) Other expenses 34.11 54.14 31.69 153.77
Total expenses 275.01 348.39 319.89 1,310.06
3 Profit from operations before other income, finance
costs and exceptional items (1-2)
0.91 (6.53) 31.58 67.44
4 Other Income:
Miscellaneous Income 1.52 1.62 10.45 14.96
Foreign exchange gain/(loss) (4.92) (2.77) 0.88 (7.25)
Total (3.40) (1.15) 11.33 7.71
5 Profit/(Loss) from ordinary activities before finance
costs and exceptional items(3+4)
(2.49) (7.68) 42.91 75.15
6 Finance costs 27.50 16.22 25.59 101.51
Statement of Standalone Unaudited Financial Results for the first quarter ended June 30, 2015
Particulars

EARNINGS PRESENTATION Q1 FY2016
Statutory Financials
Unaudited Results for the quarter ended 30th June 2015
(Rs. in Crores)
13
7 Profit/(Loss) from ordinary activities after finance
costs but before exceptional items (5-6)
(29.99) (23.90) 17.32 (26.36)
8 Exceptional items - - - -
9 Profit/(Loss) from ordinary activities before tax (7+8) (29.99) (23.90) 17.32 (26.36)
10 Tax expense (9.93) (7.95) 2.96 (11.96)
11 Net Profit/(Loss) from ordinary activities after tax (9-
10)
(20.06) (15.95) 14.36 (14.40)
12 Extraordinary items (net of tax expense Rs. Nil) - - - -
13 Net Profit/(Loss) for the period (11-12) (20.06) (15.95) 14.36 (14.40)
14 Paid-up equity share capital 38.57 38.57 38.57 38.57
(Face Value Re 1 per share)
15 Reserves excluding Revaluation Reserves as per Balance
Sheet as at March 31
- - - 788.57
16 Earnings per share (before and after extraordinary
items) (of Re 1 per share) (not annualised) :
a) Basic (0.52) (0.41) 0.37 (0.37)
b) Diluted (0.52) (0.41) 0.37 (0.37)

EARNINGS PRESENTATION Q1 FY2016
Statutory Financials
Unaudited Results for the quarter ended 30th June 2015
14
PART II
Particulars
Three months
ended
30.06.2015
Preceding
Three months
ended
31.03.2015
Corresponding
Three months
ended
30.06.2014 in
the previous
year
Year ended
31.03.2015
A PARTICULARS OF SHAREHOLDING
1 Public shareholding
- Number of shares 213,592,660 213,592,660 213,592,660 213,592,660
- Percentage of shareholding 55.37 55.37 55.37 55.37
2 Promoters and Promoter Group Shareholding
(a) Pledged/Encumbered
- Number of Shares Nil Nil Nil Nil
- Percentage of shares (as a % of the total Nil Nil Nil Nil
shareholding of promoter and promoter group)
- Percentage of shares (as a % of the total Nil Nil Nil Nil
share capital of the company)
(b) Non-encumbered
- Number of Shares 172,139,910 172,139,910 172,139,910 172,139,910
- Percentage of shares (as a % of the total 100 100 100 100
shareholding of promoter and promoter group)
- Percentage of shares (as a % of the total 44.63 44.63 44.63 44.63
share capital of the company)
Particulars
Three months
ended
30.06.2015
B INVESTOR COMPLAINTS
Pending at the beginning of the quarter Nil
Received during the quarter 5
Disposed of during the quarter 4
Remaining unresolved at the end of the quarter 1
Select Information for the first quarter ended June 30, 2015

EARNINGS PRESENTATION Q1 FY2016
Statutory Financials
Unaudited Results for the quarter ended 30th June 2015
15
Segment wise Revenue, Results and Capital Employed under Clause 41 of the Listing agreement
(Rs. in Crores)
Three months
ended
30.06.2015
Preceding
Three months
ended
31.03.2015
Corresponding
Three months
ended
30.06.2014 in
the previous
year
Year ended
31.03.2015
(Unaudited) (Audited) (Unaudited) (Audited)
1. Segment revenue
a. Carbon materials and chemicals 272.47 339.79 350.00 1,371.77
b. Power 6.64 4.62 4.71 15.43
Total 279.11 344.41 354.71 1,387.20
Less: Inter segment revenue 3.19 2.55 3.24 9.70
Total income from operations (net) 275.92 341.86 351.47 1,377.50
2. Segment results
a. Carbon materials and chemicals (4.41) (9.46) 28.37 57.84
b. Power 5.32 2.93 3.40 9.60
Total 0.91 (6.53) 31.77 67.44
Less : i) Interest expenses 27.50 16.22 25.59 101.51
ii) Unallocable expenditure (net of unallocable income) 3.40 1.15 (11.14) (7.71)
Profit before tax (29.99) (23.90) 17.32 (26.36)
3. Capital employed
(Segment assets- Segment liabilities)
a. Carbon materials and chemicals 1,830.16 1,834.40 1,953.04 1,834.40
b. Power 57.39 56.50 55.74 56.50
c. Unallocable (1,078.74) (1,063.76) (1,155.45) (1,063.76)
Total Capital employed 808.81 827.14 853.33 827.14
Particulars

EARNINGS PRESENTATION Q1 FY2016
Statutory Financials
Unaudited Results for the quarter ended 30th June 2015
16
On behalf of the Board of Directors
Bankey Lal Choudhary
Place: Kolkata Managing Director
Date: 12 August 2015 (DIN : 00173792)
5) The figures of the previous year/ period have been regrouped/ reclassified, wherever necessary to conform to the classification
for the quarter ended June 30, 2015.
NOTES :-
1) The above unaudited results have been reviewed by the Audit Committee and approved at the meeting of the Board of Directors
of the Company held on August 12, 2015.
2) The figures for the quarter ended March 31, 2015 are the balancing figures between audited figures in respect of the full financial
year and the published year to date figures upto the third quarter of the financial year ending on March 31, 2015.
3) Tax expense is net of MAT credit reversal and deferred tax credit.
4) The limited review of the unaudited results have been carried out by the Joint Statutory Auditors' of the Company who have
expressed an unqualified opinion.

EARNINGS PRESENTATION Q1 FY2016
Contact Details
Anurag Choudhary
Himadri Chemicals and Industries Ltd.
+91 33 2230 9953
Bijay Sharma / Ankit Aggarwal
Churchgate Partners
+91 22 6169 [email protected]
Contact Details:
Himadri Chemicals & Industries Limited
(CIN: L27106WB1987PLC042756)
Ruby House, 8, India Exchange Place
2nd Floor, Kolkata - 700 001, West Bengal
Ph: +91 33 2230 9953
Fax: +91 33 2230 9051
www.himadri.com


![Q1 FY2016 Earnings Presentation [Company Update]](https://static.cupdf.com/doc/110x72/577cb28a1a28aba7118c109f/q1-fy2016-earnings-presentation-company-update.jpg)

![Q1 FY2016 Consolidated Earnings Presentation [Company Update]](https://static.cupdf.com/doc/110x72/577cb29f1a28aba7118c1c53/q1-fy2016-consolidated-earnings-presentation-company-update.jpg)


![Q2 FY2016 Earnings Presentation [Company Update]](https://static.cupdf.com/doc/110x72/577ca7a31a28abea748c7d3f/q2-fy2016-earnings-presentation-company-update.jpg)

