


High Cycle Fatigue of Welded Bridge Details
FATIGUE BEHAVIOR OF
FULL-SCALE WELDED
BRIDGE ATTACHMENTS
by
Bernard Barthelemy
A Thesis
Presented to the Graduate Committee
of Lehigh University
in Candidacy for the Degree of
Master of Science
in
Civil Engineering
LEHIGH UNIVERSITY Bethlehem, Pennsylvania 18015
May 1979

ACKNOWLEDGMENTS
The experiments and analyti.cal studies reported herein were
conducted at Fritz Engineering Laboratory, Lehigh University,
Bethlehem, Pennsylvania. Dr. Lynn S. Beedle is the Director of
Fritz Laboratory and Dr. David A. VanHorn is the Chairman of the
department of Civil Engineering. The work was part of a fatigue
research program entitled "Fatigue Behavior of Full-Scale Welded
Bridge Attachments" sponsored by the National Research Council,
Transportation Research Board, under contract NCHRP 12-15(3), and
directed by John W. Fisher.
The interaction with Dr. John W. Fisher, the professor in
charge, was helpful in establishing: the limits of the research·
and relating the findings to his past experience. The author
is also. indebted to Mr.·Brian W. Price and Mr. Hajime Hosakawa
for their assistance and Dr. Celal N. Kostem for his advice in
computer activities.
Sincere thanks are due to various support personnel in Fritz
Laboratory. Ms. Shirley Matlock typed the manuscript. Mr. John
M~ Cera took charge of the drafting of the figures. Hr. Richard
N. Sopko provided the required photographs.
iii

TABLE OF CONTENTS
LIST OF TABLES
LIST OF FIGURES
ABSTRACT
1. INTRODUCTION
2. EXPERIMENTAL ANALYSIS
2.1 Description of Tests
2.2 Test Results
2.2.1 W27xl45, Detail 1 2.2.1.1 Low Stress Range 2.2.1.2 High Stress Range
2.2~2 W27xl45, Detail 2 2.2.2.1 Low Stress Range 2.2.2.2 High Stress Range
2.2.3 W27xl45, Detail 3 2.2.3.1 Low Stress Range 2.2.3.2 High Stress Range
2.2.4 Complementary Experiment
2.3 Swnmary of Test Results
3. THEORETICAL ANALYSIS
3.1 Problem Formulation
3.2 Field of Investigation
3.3 FEM Investigation Procedure
3.4 Results of Analysis
vi
vii
1
2
4
4
6
8 8 9
10 10 11
12 12 12
13
14
17
17
19
20
24
3.4.1 Stress Concentration Factor (SCF) Definition 24 3.4.1.1 Web Nominal Stress Range and SCF 24
at Critical Locations a and b 3.4.1.2 Gusset Nominal Stress Range and SCF 25
at Critical Location c
3.4.2 Results of Analytical Studies
3.5 Stress Intensity Factor
3.5.1 General Expression of ~K
3.5.2 Crack Shape Correction Factor
iv
26
27
27
28

4.
5.
6.
7.
8.
3.5.3 3.5.4 3.5.5 3.5.6
Front Free Surface Correction Back Free Surface Correction Plastic Zone Effect Stress Gradient Correction 3.5.6.1 Crack Path 3.5.6.2 Stress Gradient Correction
3.6. Predicted Fatigue Life
3. 6. L 3.6.2 3.6.3 3.6.4 3.6.5 3.6.6
Weld Defects Final Crack Size Weld Shape
JParis Law Coefficients Fatigue Lives Computations Results of Computations
3.7 Complementary Investigations
3.7.1 3.7.2 3.7.3 3.7.4
Effect of Web Thickness Influence of Flange Connections Effect of the Type of Connection Effect of Second Girder Stiffeners
3.8 Simplified Fatigue Life Computation
CONCLUSIONS AND RECOMMENDATIONS
4.1 Basic Web Details
4.2 Flange Gussets
4.3 Special Details
4.!+ Retrofitting Techniques
4.5 Recommendations
TABLES
FIGURES
REFERENCES
VITA
v
30 31 31 31 32 33
36
36 38 39 40 40 40
41
41 42 r
43 45
46
50
50
51
51
52
53
54
75
139
142

LIST OF TABLES
Table
11 AASHTO allowable stress ranges
21 Load and stress ranges
22 Test record of stresses
23 Out-of-plane movements
24 Experimental fatigue lives
31 Numbering pattern for Cubic and Skewed Elements
32 Stresses in the web around critical locations a and b
33 Comparison between as~umed and measured nominal stress ranges
34 Front free surface correction
35 Weld slope correction factor
36 Computed fatigue lives
37 Effect of web thickness on displacement at weld toe
38 Effect of gussets welded to the lower flange
39 Displacements and rotations at web-to-gusset weld toe
310 Out-of-plane bending stresses at web-to-gusset weld (special gusset plates)
311 Transverse-to-weld stresses at gusset-to-stiffener weld (special gusset plates)
41 Comparison between experimental and-computed fatigue lives
42 Retrofitting results
vi
318 Elliptical crack embedded in an infinite body subjected to uniform tensile stress
319 Stress distribution at crack vicinity
320 Crack path
321 Albrecht's crack loading
322 Stress block and crack propagation scheme through web or gusset plate thickness
323 Effect of web thickness on maximum SCF at critical locations a and b
324 Parameters of the gusset-to-bracing members connection
325 Discretization used in the study of the effect of the bracing-to-gusset connection length.
326 Out-of-plane bending stresses along web-to-gusset weld
327 Special gusset plates
328 Discretization used in the study of the effect of relative stiffness of the two parallel girders
329 Definition of the critical parameter ~
330 Effect of relative stiffness of the two parallel girders
331 Assumed through-thickness crack shape
viii

LIST OF FIGURES
Figures
11 Design stress range curves
12 Typical lateral attachments
21 Test specimens
22 Test setup
23 Gage loc{ltions
24 Supplementary details
25 to 28 Crack pictures
29 Experimental study of gap effect
210 Measured gaps
211 Experimental fatigue lives
31 Selected details and critical locations
32 Theoretical investigation procedure
33 Schematic illustration of the theoretical investigation procedure
34 Two dimensional analysis of the whole half beam (2Dl)
35 Two dimensional analysis of the girder central part (2D2)
36 Two dimensional analysis of selected critical locations (2D3)
37 Three dimensional analysis (3D)
38 Idealization and discretization of a weld toe
39 Numbering pattern of cubic and skewed elements
310 Example of selection of a section in a 3D discretization for further 2D analysis
311 Two dimensional analysis of critical locations a and b
312 to 317 Stress concentration contours
vii

ABSTRACT
The fatigue resistance of gussets welded to the tension web or
flange of steel bridge beams in order to provide attachments for the
lateral bracing was studied. Both theoretical and experimental
evaluations on 18 W27xl45, W27xll4 and W36xl60 full-size girders
was carried out, ·arid indicated that all web gusset details yielded
fatigue strengths that equaled or exceeded Category E. Only the
ends of the lateral attachments developed detectable fatigue crack
growth. None of the details exhibited fatigue cracking adjacent
to the transverse stiffeners. The web gusset welded to one web sur
face with no connection to the stiffener provided good behavior
with no adverse effect in web gap between stiffener and lower flange.
No adverse effect was found from the lateral bracing and its imposed
out-of-plane movement of the web gusset. The experimental observa
tions were in general agreement with the theoretical model for the
end of the detail. The model had a tendency to overestimate the
severity of the detail. Simplified fatigue life computations were
in general agreement with the experimental observations.
The theoretical calculations were carried out on a W27xl45
girder using the finite element method. This permitted the stress
concentration factors in high~stress locations to be evaluated.
The stress intensity factor was computed from the results using the
stress gradient effect. The Paris Power law was used to compute the
fatigue life.
1

The conclusions concerning the flange gussets indicated that
none of the flange details exhibited evidence of fatigue crack growth,
even at very high stress range levels. Tl ~ "zero•• radius details
had the weld end (and toe) ground smooth and this resulted in a
large increase in fatigue resistance. The experimental results
· suggested that the ground radius details were always below the crack
growth threshold as no crack growth was observed at any level of
stress range. Extensive failure from other details prevented
development of fatigue data for the flange gussets.
A retrofitting technique used in this experimental study was to
drill holes at the crack tips. This technique was reasonably suc
cessful. No general rule concerning its efficiency was deve~oped.
Often, the fatigue crack reinitiated at the drilled hole, depending
on the crack size and stress range that existed.
This study has indicated that the design criteria for lateral
connections should be maintained as currently practiced. These
details have exhibited a satisfactory fatigue resistance which is
in agreement with the specification provisions. Consideration
should be given to grinding groove welded gusset ends, since this
practice can lead to a substantial improvement in fatigue
behavior.
lA

1. INTRODUCTION
Fatigue resistance of steel highway bridges has become an
important problem and has been studied very intensively during
the past 10 years because a lot of welded details, which are quite
common in such bridges, have shown fatigue distress. Sometimes this
has led to spectacular failures, like those of the King's Bridge in
Australia and the Point Pleasant Bridge in West Virginia. It has been
demonstrated that welded details are much more sensitive to fatigue
cracking than bolted details, due·to the fact that a. w~ld has
inherent discontinuities and higher stress concentration conditions
which permit fatigue cracks to be easily initiated.
Extensive research in the early 70s(l, 2) has shown that the
fatigue life is mainly a function of the geometry of the welded
detail and the stress range, S • The AASHTO Specifications(a) r
were based on these studies. The stress range values (Table 11)
were derived from the 95% confidence limit of 95% survival given
by experimental S -N curves (Figure 11). Unfortunately, these r
curves cannot be used in all circumstances, because in many cases
the welded detail cannot be directly related to· the available
experimental data. Also, the stresses in the vicinity of complex
details are rarely known with. accuracy. Among the welded details
used in steel highway bridges for which the fatigue behavior is
not well known are gusset plates welded either on the lower flange
or to the web of the girders (see Figure 12). In fact, almost all
steel bridges require this kind of lateral attachment whi~h is
2
used primarily to support lateral bracing. The bracing is used to
resist forces due to wind or live loading and lateral movement.
Unfortunately, field experience has shown that some details have
poor fatigue resistance, mainly because of out-of-plan~ movements
of the gusset caused by relative bending of longitudinal members.
This phenomena has been discussed in detail by Fisher. {4)
It is the purpose of this study to provide more information on
the fatigue behavior of such details and to develop recommendations
for design. This study considers both experimental and theoretical
approaches which are described hereafter in parts 2 and 3 of this
report. Section 3 compares the results and develops conclusions of
this research.
3

2. EXPERIMENTAL ANALYSIS
2.1 Description of Tests
The experimental part of this research consisted in the fatigue
testing of eighteen full-size beams fabricated from A588 steel.
These beams are described on Figure 2la and b. Three different pro-
files were selected: W27xl45, W27xll4 and W36xl60 rolled beams.
Three primary details were either fillet-welded or groove-~relded on . ~
each beam. Two details were welded on the lower flange and one on
the web at mid-span. The flange details were grouped as follows
(see Figure 2la): Detail 1 with R = "0" (radius at end of connec-
tion) , detail 2 with R = 5 em, and detail 3 with R = 15 em. The
web details were also grouped into three types as illustrated in
Figure 2lb. Two beams were tested with each combination of the pri-
mary flange and web details, at two different load ranges. All welds
were 0.937 em fillet welds.
Figure 2lc is a photograph of a typical web detail with the
lateral bracing members bolted into place. Figure 2ld shows the
radiused ends of the primary groove welded flange details. Even the
R = "O" detail .had a small radius ground at the weld end. Since the
detail was groove welded to the flange tip, the weld run-out region
was ground out by the fabricator. The radius was observed to be
about 5 to 10 mm~
The loads were applied in two symmetrical locations 1.5 m apart
as shown schematically in Figure 22. Their magnitude and location,
4

as well as the location of the lateral gussets welded to the lower
flange were such that the same desired nominal stress range
~a = a -a . was achieved along the central web-to-gusset weld and max m1n
at the inner corner of the lateral gussets. The load and stress
ranges thus defined are given in Table 21. Since these loading ranges
were within the maximum dynamic capacity of the jacks, there was no
alternate loading, i.e. the stresses were only variable in magnitude
but did not change from compression to tension or tension to compres-
sion at a given location. The test setup is described in Figure 22.
The W27xl45 and W27xll4 girders were tested using an Amsler system
composed of t~o pulsators (variable stroke hydraulic pump) and two
jacks. The maximum stroke of the system with a single pulsator was
lower than the deflection of the beams under the maximum load, hence
it was necessary to use two pulsators to reach the maximum stress
range, each of them operating one jack. The W36xl60 girders were
tested using an MTS system consisting of two hydraulic jacks each
with a capacity of 889.60 kN. Each jack operated from a separate
control unit. This system offers the following capabilities that are
not available with the Amsler system:
- Increased load capacity per jack
- Variable operating frequency
- Increased stroke capacity
- Random:load programming
- Various wave forms.
5
The girders were fully instrumented in order to provide measure
ments of stresses at different locations. The tests were controlled
by strain measurements.
The strain gages were located as follows:
- Two gages under the lower flange at mid-span (the tests were
controlled using these two gages)
- Three gages under the lower flange 162.5 em from one support
- One gage on the web at mid-distance between stiffener and
lower flange
- One gage on the web 5 em above the web-to-gusset weld toe
-Four gages on the web gusset plate (see Figure 23).
2.2 Test Results
Since the theoretical computations were only available for the
W27xl45 girder, only the test results related to this shape are
reported here. The entire set of results may be found in a separate
report.
Two beams were tested for each detail: one was subjected to
the maximum load range permitted with the two coupled Amsler pul
sators, the second beam was tested at about half (details 2 and 3)
or 3/4 (detail 1) of this load range ..
6

To enlarge the scope of this research, some supplementary de
tails were welded on web and/or lower flange of some beams. They are
shown in Figures 24a and b.
Supplementary detail 1 consisted of two 40xl0x5 em plates
welded on both sides of web. The distances X andY (see Figure 24)
were varied in order to achieve a given stress range at point A.
Both groove and fillet welds were used to attach these plates to the
beam web.
Supplementary detail 2 consisted of two 60x20xl.25 em plates
welded on the .lower flange opposite the gusset plates \,'hich were
already welded to the flange (R = 0). Transverse fillet welds with
0.95 em legs were placed at each end of the plate and stopped 1.25 em
from the flange edge. There were no longitudinal welds.
Supplementary detail 3 consisted of two 60x7.5x0.95 em plates
welded together with incomplete penetration welds and th<~n fillet
welded to the web.
Supplementary detail 4 consisted of one 40x20x5 em insert through
the web at a location symmetrical of detail .1. this detail was
fillet-welded on both sides of the web. The results are not presented
in a chronological order.
7
2. 2.1 W27x1Lf5, l,Teb and Flange Detail 1
2.2.1.1 Low Stress Range
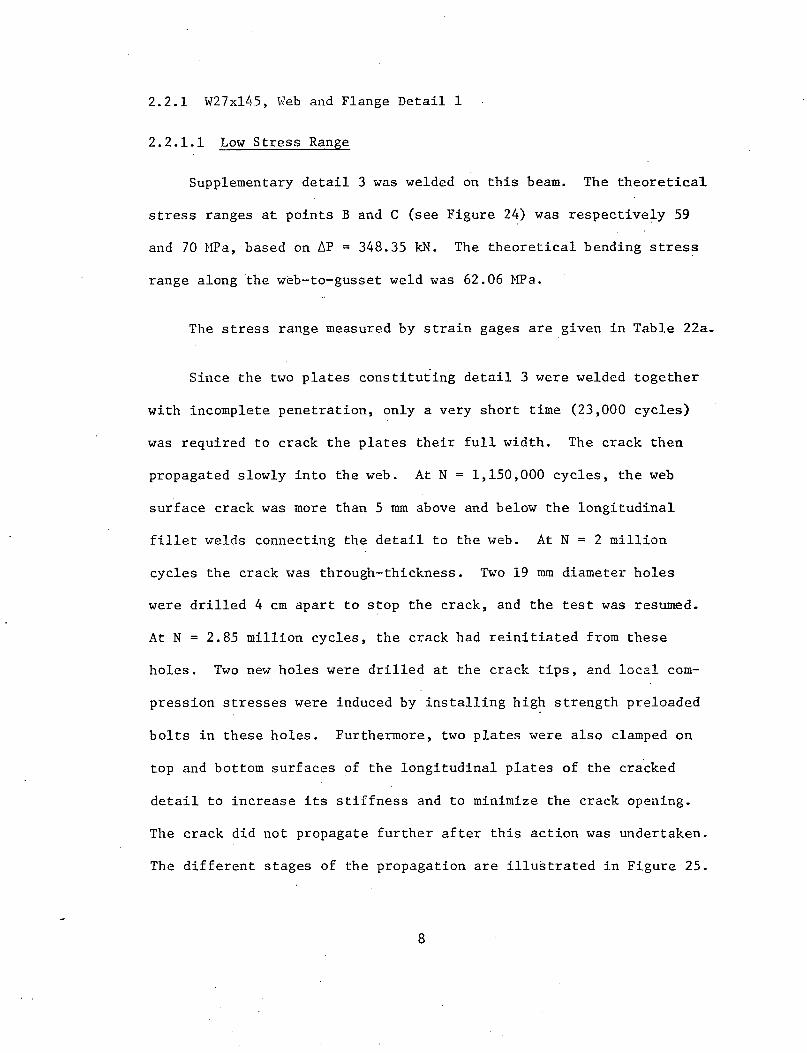
Supplementary detail 3 was welded on this beam. The theoretical
stress ranges at points B and C (see Figure 24) was respectively 59
and 70 ~~a, based on ~p = 348.35 kN. The theoretical bending stress
range along the web-to-gusset weld was 62.06 ~~a.
The stress range measured by strain gages are given in Table 22a.
Since the two plates constituting detail 3 were welded together
with incomplete penetration, only a very short time (23,000 cycles)
was required to crack the plates their full width. The crack then
propagated slowly into the web. At N = 1,150,000 cycles, the web
surface crack was more than 5 rom above and below the longitudinal
fillet welds connecting the detail to the web. At N = 2 million
cycles the crack was through-thickness. Two 19 rom diameter holes
were drilled 4 em apart to stop the crack, and the test was resumed.
At N 2.85 million cycles, the crack had reinitiated from these
holes. Two new holes were drilled at the crack tips, and local com
pression stresses were induced by installing high strength preloaded
bolts in these holes. Furthermore, two plates were also clamped on
top and bottom surfaces of the longitudinal plates of the cracked
detail to increase its stiffness and to minimize the crack opening.
The crack did not propagate further after this action was undertaken.
The different stages of the propagation are illustrated in Figure 25.
8

At N = 4.68 million cycles a through-thickness crack was de
tected at the inner supplementary detail weld toe. The crack was
about 50 mm long. Two 19 mm holes were drilled at the crack tips
and the test was resumed. At that time a small crack was also de-
tected at web-to-gusset weld toe. At N 5 million cycles it was
decided to stop that crack by drilling two holes at the crack tips,
25 mm apart. At N = 6.3 million cycles the crack at the supplemen
tary detail weld toe had extended from holes. The lower crack tip
was about 25 mm above the lower flange. A 25 mm hole was drilled and
a high strength bolt was installed and tightened before test was
resumed.
At N = 9.3 million cycles crack reinitiation was observed from
holes of the crack at the web-to-gusset weld toe.
No evidence of crack growth was observed at the flange gussets
and the tests were discontinued.
2.2.1.2 High Stress Range
Supplementary details 1 and 2 were fillet welded on this beam,
with X= 193 em andY= 12.7 em giving a theoretical stress range of
78.33 MPa at point A (see Figure 24).
The theoretical bending stress range along the web-to-gusset
weld was 82.74 MPa.
9

The measured stress range is given in Table 22a. The test was
stopped by excessive deflections at N = 782,000 cycles. A through
thickness crack had developed at the interior carrier of supplementary
detail 1. It ran from about 3 em above point A down to the lower
flange~ Holes were drilled in the web at the·crack ends in an attempt
to arrest crack growth. Unfortunately further propagation was experi
~nced ·and· at N = 970,000 cycles the test had to be. stopped and the
beam removed. The crack had propagated through the lower flange
thickness and was about 18 em long and 8 em above the upper hole.
Figure 26a shows the crack after it was initially stopped. Figure 26h
shows the crack at termination of the test.
2.2.2 W27xl45, Web and Flange Detail 2
2.2.2.1 Low Stress Range
Supplementary detail 1 was installed at with X = 193.04 em and
Y = 12.70 em, giving a theoretical stress range of 39.16 MPa at
point A (see Figure 24). The detail was fillet-welded to the web.
The theoretical bending stress range along the web-to-gu::;set
weld was 41.37 MPa. The actual stress ranges measured during the
test are given on Table 22b.
No cracking was observed until 4.3 million cycles. At that
time, very small cracks were detected by visual inspection at one
10

end of the supplementary detail on both sides of the web. These
cracks did not exhibit appreciable growth until 14.3 million
cycles. At 1?.7 million cycles a through-thickness crack developed
and testing was discontinued.
The crack at the lower inner corner of the supplementary detail
is shown in Figure 27. The delay between crack initiation and
through thickness propagation may be due to the fact the crack aad
to propagate through the weld on the opposite side of the beam web.
2.2.2.2 High Stress Range
Supplementary detail 1 was installed with X = 193 em and Y =
12.7 em giving a theoretical stress range of 78.33 MPa at point A
(see Fig. 24). The detail was fillet welded to the web.
The theoretical bending stress range along web-to-gusset weld
was 82.74 MPa (Fig. 23).
The measured stress range could not be obtained due to a
malfunction of the oscilloscope. The test was controlled by
deflection gages at mid span.
Cracks were observed at the supplementary detail weld toe after
N = 1.1 million cycles. Holes were drilled at the cr2ck ends after
N = 1.4 million cycles and preloaded high strength bolts were used
to induce compression stresses in the region at crack ends. After
1.8 million cycle~ 2 cracks were observed at the web-to-gusset weld
t')>::S. At N = 1. 9 million cycles, these two cracks had reached 2. 5
11

and 5 em length. At N = 2 million cycles, the two cracks had devel-·
oped through thickness. Holes were drilled at crack ends. After
2.3 million cycles the crack at supplementary detail reinitiated
from bolt holes and propagated very quickly down through the bottom
flange and up to the top flange.
Figure 28 shows the crack at its final stage.
2.2.3 W27xl45, Web and Flange Detail 3
2.2.3.1 Low Stress Range
No supplementary detail was welded on this girder. The theore
tical bending stress range along the web-to-gusset weld was 41.37 MPa.
The actual stress ranges measured by strain gages are shown in
Table 22c.
The test was discontinued after 9 million cycles without any
visible cracking.
2.2.3.2 High Stress Range
Supplementary details 1 and 4 were installed at X = 193 em and
Y = 12.7 em giving a theoretical stress range of 78.33 MPa at points A
(see Figure 24). Detail 1 was groove welded to the web. Detail 4
was fillet welded on both sides of the web.
After only 1 million cycles a through-thickness crack developed
at the inner weld toe of fillet-welded supplementary detail ·4. The
total length of the crack was about 10 em. To stop its propagation,
12

a 19 mm diameter hole was drilled at its upper end and a preloaded
high-strength bolt was used to induce compressive stresses at this
end. The crack having already reached the lower flange, it was
stopped by drilling two holes through the flange on both sides of
. the web, then clamping plates on top and bottom flange surfaces.
After 1.5 million cycles a through-thickness crack was observed at
the inner weld toe of the supplementary detail 1. Two 19 mm holes
were drilled 9 em apart to stop it. At 1.6 million cycles a
through-thickness crack was noticed at one of the web-to~gusset
weld toes. Two 19 mm holes were drilled 7 em apart to stop it.
The test was discontinued after 1.8 million cycles since the
crack at supplementary detail 1 reinitiated from noles and propa
gated down through the flange.
2.2.4 Complementary Experiment
One of the purposes of this experimental research was to
investigate the effect of the gap between web and bracing member end
on 'ihe fatigue behavior of that detail. One beam (W27xl45, detail 3)
was prepared so that two gaps (7.5 and 12.5 em) could be obtained on
the web gusset. Static tests were carried out and the deflections
were recorded at three different locations as illustrated in Figure
29. Dial gage 1 was under the lower flange at mid-span. Gages 2 and
3 were located under the bracing members.
For each position of the lateral bracing system, deflections
were recorde~ for several loads. The average of these readings is
13

summarized in Table 23. g1, g2 and g3 are defined in Fig. 210.
61, 62 and 63
are deflections recorded by dial gages 1, 2 and 3
respectively. The experiment confirmed that there was an out-
of-plane movement of the gusset plate, since the deflections recorded
under the bracing members were 89 to 96% of those recorded under
the lower flange. But more important is the fact that the relative
deflections, i.e. the out-of-plane movement of the gusset plate,
don't change substantially when the geometry of the connection was
modified. For example, the relative change of out-of-plane movement
when g1 = g2 = g3 = 75 mm and when g1 = g2 = g3 = 125 mm was:
(61163)125 - (61163)75 0.041 4.1% = =
(611 63)75
when considering gages 1 and 3
(6/ 63)125.- (62163)75 = 0.057 = 5.7%
(b2/ 63)75
when considering gages 2 and 3. One may conclude that there is a
very limited effect of the gaps on the out-of-plane movement of the
gusset plate because the relative out-of-plane movement is so small.
2.3 Summary of Test Results
The fatigue tests are summarized in Table 24. Figure 211
shmvs fatigue lives of details that have failed during the test.
The fatigue lives are based either on the number of cycles at crack
initiation, when available, or on the number of cycles at through-
thickness propagation.
14

At the web-to-gusset weld toe (critical location a), we expected
a Category E behavior, mainly because of the influence of secondary
bending. The test results plotted in Figure 211 indicated that under
the worst condition Category E satisfactorily defines the fatigue
resistance. The test data fall within the upper and lower confidence
limits of the cover-plated beams used to derive the design category.
The out-of-plane movement of the gusset plate was much smaller than
expected. Therefore, the secondary bending was never a critical
factor.
At the interior web-to-gusset weld toe (critical locaion b in
details 1 and .2. Figure 31), we expected a better behavior than at
critic3l location a, because of the more favorable stress field. The
behavior of this detail was very good, since no cracking was experi
enced (at least no crack detectable by dye-penetrant technique).
At the gusset-to.:...stiffener weld toe (critical location c in
detail 1 only, Figure 31), the only evidence was some reported re
sults from Canada on Conestoga River Bridge(2S) which used gusset
plates of the type depicted in Figure 327. This type of gusset plate
does not allow the longitudinal forces to be carried through the
plate and therefore creates high stresses.at location c. This par-
ticular problem has been investigated (see Chapter 3) and is discussed
in the general conclusion (see Chapter 4).
The flange gussets never cracked, even ,.,hen the radius was equal
to zero. This is due to the fact the longitudinal groove weld toe
had been ground, which is not the connnon practice (see Figure 21).
15
When fillet welded to the web, supplementary detail 1 behaves
as a category E detail. One test performed with a groove-welded
detail, provided a fatigue life at through-thickness propagation
comparable to the fatigue life of the fillet-welded detail. Further
studies are underway on this detail.
Supplementary detail 2 did not experience any fatigue crack
growth at category E stress range levels. That is in good agreement
with flange gusset behavior.
Supplementary detail 3 experienced very rapid fatigue crack
growth in the weld between the two plates. The total life for
through web thickness propagation was equivalent to category E (see
Figure 21) •
One beam was tested with supplementary detail 4. It provided
about the same behavior as supplementary detail 1.
Further experiments are underway and should provide additional
test data on these classes of details so that reasonable estimates of
their behavior can be made.
16

3. THEORETICAL ANALYSIS
3.1 Problelll: Formulation
· It has been recognized that the fatigue life can be analy-
tically predicted by an empirical relationship between the crack
growth per cycle da/dN and the fracture mechanics stress intensity
factor ~K. In tbis study the Paris Power Law(S), was used where:
where:
a = the crack length
N = the number of cycles
C,m = material constants
da m = C(~K) dN
~K = stress intensity factor range (K -K ) max min
The stress intensity factor range ~K may be estimated from
Irwin solution of the central through crack in an infinite plate
under uniaxial stress:
(31)
(32)
using four adJ·usting factors F F F and F ( 6) to account for the e' s' w g
conditions that exist at actual details. This resulted in
~K = F F F F ~cr /TI8 e s w g (33)
F adjusts for the shape of the crack front; F is the free surface e s
correction; F accounts for the finite plate width and F is related w 6
17

to the stress gradient effect. The first three factors can be
estimated from previous studies. (6 , 7) The last factor, F , is g
strongly dependent upon the geometry of the detail and the stress
field in its vicinity. In a recent study, Zettlemoyer(6 )
developed F expressions for several details encountered in steel g
bridges (i.e. coverplates and stiffeners). They may not be general-
ly applicable to different situations. It is the purpose of this
study to compute the correction factors to be used forthedetails
shown in Fig. 12.
F is a function of the detail geometry and the stress gradient~ g
Generally, it cannot be determined inra closed-form solution since
the stress field cannot be determined analytically. Numerical
techniques, such as the finite eiement method (FEM) must be used.
In this study, the SAP IV program(S) was used to determine the
stress concentration contours for each critical location.
The theoretical study may be summarized in four main steps:
- computation of KT by FEM
- computation of F as a function of KT g
- computation of ~K as a function of F and the three other g
correction factors.
computation of the fatigue life using the Paris power law.
This approach limits itself to the through-the-thickness crack
propagation, which may only be a part of the total fatigue life of
the structure.
18
3.2 Field of Investigation
Among the nine different details used for the experimental I
research, three were selected for the analytical examination:
Detail 1: gusset plate welded to the web of W27xl45 girder.
Stiffener welded to the gusset plate.
Detail 2: ~usset plate welded to one web surface with no
connection to the stiffener
Detail 3: idem, but stiffener welded on opposite side of the
web.
These three details are shown on Figure 31. Also shown in
this figure are the high stress locations where fatigue cracks are
likely to be initiated.
The computations were performed assuming a load range of 464.46
kN. This resulted in a stress range of 82.74 MPa along t~e weld
between web and gusset plate.
Young's modulus and Poisson's ratio were respectively 2xlcf
MPa and 0.30.
19

3.3 FEM Investigation Procedure
The finite element method and substructuring techniques were
used in the sequence shown in Figure 32 to estimate the critical
stress conditions. ·The procedure is schematically illustrated in
Figure 33 for the case of the critical location a in detail 1.
Three two-dimensional (2D) discretizations using the substruc
turing technique (each mesh considering only a small part of the
previous one) were necessary before a more accurate three-dimension
al (3D) analysis was carried out. It was not possible to perform a
single analysis of the whole half-beam (it is obvious that by
symmetry a discretization of the whole beam is not necessary) fine
enough to give stresses or displacements directly that could be
input in the 3D mesh of the selected detail. In fact, two unfruit
ful attempts were made using 598 and 262 nodal points: in each case
the computation time exceeded 400 SS! In order to avoid excessive
computation time, the first three steps of the analysis were as
follows:
(1) First a very crude analysis of the whole half-beam was
performed, as shown in Figure 34. Plate bending elements were used
in the web, the lower flange and the gusset plates. Plane stress
elements were used in the stiffener and the upper flange. The
lateral bracing members discretized by beam elements, were connected
to external corners of the gusset plates and fixed at the other end.
The effects of the type of connection between the gusset plate and
the lateral bracing, as well as those of an elastic support of the
20

other end, were studied separately.
(2) The; second 2D mesh only considered the part of the beam
between the cross section under the load and the mid-span. The
lateral bracing members connected to the central gusset were
suppressed and the displacements and rotations computed in the
first analysis were induced through boundary elements at external
corners of the gusset plate. The displacements and rotations were
applied to the nodal points of the cut-off sections. These meshes
are shown in Figure 35.
(3) The third step was a 2D analysis of the most critical
areas for each detail, based on experience. These locations are
shown in Figure 31. For detail 4 three critical locations were
selected at web-to-gusset and gusset-to-stiffener welds. In case of
detail 2, only the critical locations along the web-to-gusset remain,
since the stiffener is no longer welded to the gusset plate. For the
third detail, there is only one critical location, at the web-to-gusset
weld toe. However, the whole weld length was examined for out-of
plane movement in order to check other possible high stress loca
tions. These m~shes are shown in Figure 36.
The effect of. the weld size, which is one of the most important
factors influencing the stress concentration was not taken into
account by the earlier discretizations. It was obvious it has to be
included in the analysis by describing each critical location in a
21

3D analysis. This was done using 8-nodes bricks of SAP IV program. (8)
Figure 37 shows the discretized details.
The displacements along the cut-off lines, given by the pre
vious 2D analysis, were induced at mid-thickness of the web and the
gusset plate. Also the weld was idealized .as shown in Figure 38.
The use of very skewed elements can decrease the reliable of the FEM
analysis. Unfortunately there is no way to avoid these problems.
Another practical problem that had to be solved forthese 3D discre
tizations was the consistency between the numbering patterns of
cubic and ske~ed elements. After several tests on a small auxilliary
structure, a numbering pattern was developed that avoided the
negative diagonal warning. The results of this pilot study are
summarized in Figure 39 and Table 31. The numbering pattern of a
prism and a pyramid is illustrated and related to a cubic.
Once these 3D analysis had been performed, the next step (see
Figure 32) was to go back to a 2D analysis of each critical location
by discretizing a section of the previous 3D mesh. This procedure is
illustrated in Figure 310 for critical location a. The section
was selected between cubic elements in order to contain enough nodal
points for the displacements input. Only a small part of the section
near the critical location was discretized. For example, in case of
critical location a, half of the web thickness and 1.25 em length
were used. The longest and the smallest element sides were respec
tively 0.125 and 0.03125 em. These meshes are shown in Figure 311.
22

For the small part of the structure discretized, the out-of
plane movement was previously accounted for and hence plane stress
elements were used instead of plate bending in the previous 2D
discretizations.
The last 2D analysis was·performed discretizing a very small
area near the weld toe. For example, the last mesh in case of
critical location 11 ~ 1 considered only three elements adjacent to the
weld toe of the previous mesh. The smallest elements in this mesh
were 0.039 mm plane stress elements. At this stage,. tLe element
size was smaller than most initial discontinuities in Lhe structure
(see 361). Any finer analysis would have been unreliable.
23

3.4 Results of Analysis
3.4.1 Stress concentration factor (SCF) definition
3.4.1.1 Web nominal stress range and SCF at critical locations a and b
Most texts define the stress concentration factor as the
actual stress at a point in a given direction divided by the nominal
stress at the same point and in the same direction.
______ -~u_l?_~ng t_~e __ C:.~rnpu_t!l~i~n of the spe~~me_n l?_a_?_~r:_g_~~-~-~~~-!.~-~-a-~_been
assumed that the stress range along the web-to-gusset weld should
be 82.74, 62.06 or 41.37 MPa. The FEM analysis has been conducted
for the case ~cr = 82.74 MPa by applying a load range ~p = 464.46 kN.
The stresses calculated by the FEM analysis were some~vhat different
from the assumed values. Table 32-gives .the stresses in the
web around critical locations a and b. Elements 1 to 4 are 65 mm
square elements counted clockwise around the critical location,
number 1 being at the upper left corner. The average stresses range
between 52.52 and 62.61 MPa and never reach 82.74 MPa.
On the other hand, the measured stresses were in good agreement
with the assumed values, as shown in Table 32.
The discrepancy between FEM analysis and strength of material
bending formulas is likely due to the size of the elements around
the critical locations. Only average values in the element result
from such large elements.
24

Therefore, the computations were conducted with the assumed
value of the web nominal stress range, i.e. 82.74 MPa. The SCF
was defined as:
SCF 1 82 • 74 (actual stress at weld toe) (34)
3.4.1.2 Gusset nominal stress range and SCF at critical location c
The definition of the nominal stress range is difficult in case
of critical location c, since no e~sily usable strength of material's
formula can be applied. The FEM analysis showed that the stresses
varied from zero to about 40 MPa at distances ranging between zero
and 17 em from the gusset-to-stiffener weld toe, without any obvious
trend. The strain gage measurements also show this high variability
(see Table 22) with no obvious trends.
25

3.4.2 Results of analytical studies
The SCF1 contours are shown in Figures 312 to 317. An important
comment about these SCF contours concerns the physical meaning of
values higher than cr /cr , i.e. actual stresses larger than the yield y n
strength of the material. Such a situation could not be avoided
since SAP IV is ~ linear elastic program. The actual stress field
in the vicinity of the weld toe should exhibit a small plastic zone,
whose size effects the whole stress field. The SCF given by
the FEM analysis often exceeds 3.0 (i.e. a > a ) at distances y .
from the weld toe smaller than 0.25 mm. That distance is of the
same order of magnitude as the initial crack size and the accuracy
of the weld discretization. Furthermore, it is much smaller than
the final critical crack size, which appeared to be several milli-
meters. The effects of the plastic zone on the stress field at
the weld toe vicinity were neglected. It is demonstrated (see 355)
that the propagation of this plastic zone as the crack grows does
not affect the fatigue life computation. In case of critical
location c, the SCF contours were not defined, since no nominal
stress at that location could be obtained either from FEM analysis
or from strain measurements. Therefore Figure 314 only shows stress
contours without any reference to a nominal stress value.
26

3.5 Stress Intensity Factor
3.5.1 General expression of ~K
As stated in Art. 21, the stress intensity factor K1
can be
expressed using the well-known value of K1
for a ceutral through
crack in an infinite plate under uniaxial stress (K1
= ~)
adjusted by four correction factors F , F , F and F , which take - e s w g
into account the shape of the crack, the free surface and the finite
width effects, and the stress concentration at the crack vicinity.
The stress gradient factor, F , ma.y be computed from the previous g
finite element analysis. A brief literature survey provides
expressions for the three other correction factors.
27

3.5.2 Crack shape correction factor
The st~ess intensity factor at any point along the perimeter
of an elliptical crack embedded in an infinite body subjected to
uniform tensile stress (see Fig. 318) is given by; (9)
(35)
where Q = [E(k)]2
E(k) is the complete elliptical integral of the second kind:
TT /2
E(k) .= J (l-~sin2 e) 1 / 2 d9 0
with
K1
is _,:aximum at the. minor axis end of the ellipse
(36)
(13 = 90° ) • This is why the minor axis length a has been chosen as
the crack length in Eq. 35. The crack shape correction factor is
therefore:
F e
1 =--E(k)
for (37)
It varies between 1.0 and n/2 as the ratio a/b varies between zero
and 1. 0.
The actual crack shape is a semiellipse submitted to a complex
stress field due to the bending of the girder, the out-cf·-plane
movement of the gusset plate and the stress concentration caused
by the crack itself. Although several studies have been performed,
(lO) they cannot be directly used in this particular situation.
The crack shape correction factor does not vary substantially
28

for different loading configuration. Therefore we used -~e = __ -~~1
~ 1/E(k) in our fatigue computations.
Since the crack shape experiences a variation during the
growth, it is necessary to know the equation linking major and minor
axis lengths in order to compute F at each stage of crack e
propagation.
Several experimental reports(2,ll,l2 ) provide measurements on
the size and shape of cracks growing from coverplates and stiffener
fillet weld toes and from gusset plates groove welded to· flange tips.
There is only one investigation applicable to the type of details
studied here. Maddox(l2) investigated a gusset plate which was
fillet welded to a plate subjected to tension force. Cracks grew
from the toe of the short transverse fillet at either end of the
gusset. Maddox developed·the following equation from the experi-
mental data.
b = 3.355 + 1.29 a (38)
The validity of this equation has been discussed in details by
Zettlemoyer. (6 ) Although it may have some defi.ciencies, it is
rather well correlated to experiments. It was used to describe
the crack shapej.in this study.
According to this equation, the visible crack lengths when
the crack has propagated through the web or the gusset plate are
respectively 22.71 and 19.48 mm
29

3.5.3 Front free surface correction
A front free surface is of course only necessary for edge
cracks since the stress is zero on the free boundary. In actual
situations, such as the ones studied here, displacement is .. ·- - -~ ---- --- --·-----
generally restricted on the free surface. The magnitude of this
restriction is not known to any specific degree although it is
estimated to be quite modest. (6 ) Thus we can neglect it and
consider we have simple edge cracks.
Zettlemoyer(6) summarized the work of T~da and Irwin(l3 ) who
tabulated the variation of F with the distribution of stress s
applied to the crack for the extreme conditions of through (a/b = 0)
and circular (a/b = 1) crack fronts. Table 33 shows the variability
for the types of stress distributions common to bridge details. It
must be pointed out that some values have been extrapolated from
positions other than the free surface, since the existing solutions
are not accurate there.
According to Zettlemoyer, the following simplified formula
(39)
provides a reasonable estimate and was adopted for use in this study.
30
3.5.4 Back free surface correction
The correction factor, F , takes into account the front free s
surface effect, but assumes an infinite half space. Since the
sp:'ce is not infinite, another correction factor must be in.troduced.
Nevertheless, during a large part of the fatigue life, the crack
depth is small enough by comparison to the plate thickness so that
the back surface correction can often be neglected. F is w
approximately equal to 1.0 for a large range of a/t (a = crack . p
depth, t = thickness of plate) when the crack shape is near semip
circular. (l2 )
The finite width correction, or back free surface correction
was therefore assumed to equal 1.0 for this study.
3.5.5 Plastic zone effect
In fracture problems, the plastic zone at the crack tip has con-
siderable importance, because it modifies the stress distribution
in the vicinity of the crack (see Figure 319). (l4 ) In fatigue
problems, we generally disregard this effect since small stress
ranges and reverse yielding cause the plastic zone to be very small.
We have neglected it in the computations presented here.
3.5.6 Stress gradient correction
As previously stated, the stress gradient correction takes
into account the actual stress field in the vicinity of the
critical location. More precisely, it is computed from the stress
31

gradient along the potential crack path. The finite element
analysis provides SCF in any direction and at any distance from
the weld toe. To use these results we have to know the crack path
through the web or the gusset plate thickness.
3.5.6.1 Crack path
It is well known that a crack generally originates at the
maximum tensile stress location and propagates along the minLnum
principal stress trajectory through that origin. That trajectory
can be defined by using the results of the finite element
analysis. The minimum principal stress trajectory represents
the probable crack path only in cases where the propagation .
is of. the unstable·, catastrophic variety. (6) During
fatigue crack propagation, the stress field has time to redistribute
itself with each increment of crack growth and may result in a
directional change. Determining the actual crack path would
require a finite element analysis for each increment of crack
growth, which could not be economically done here. We can only say
that the minimum stress trajectory and a crack line constantly
perpendicular to the applied stress represent the physical limits
of the path. It has been shown by Zettlemoyer(6) that in most
cases the actual crack does not vary greatly from a straight line
through the point of maximum concentration and perpendicular to
the direction of applied stress. Further, the difference in per-
pendicular stress (Mode I) is not great. The crack path was assumed
to be the perpendicular on~ illustrated in Figure 320.
32
The computation of fatigue life was done using 'the values of
the SCF along that assumed crack path.
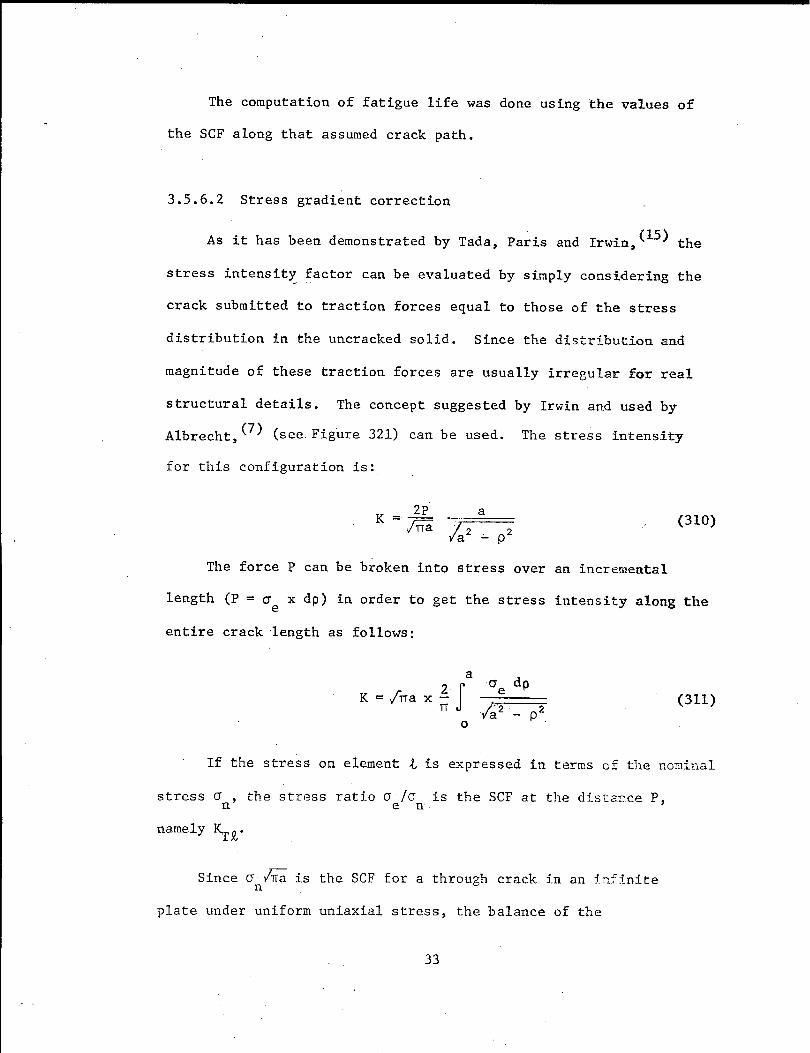
3.5.6.2 Stress gradient correction
As it has been demonstrated by Tada, Paris and Irwin, (lS} the
stress intensit~ factor can be evaluated by simply considering the
crack submitted to traction forces equal to those of the stress
distribution in the uncracked solid. Since the distribution and
magnitude of these traction forces are usually irregular for real
structural details. The concept suggested by Irwin and used by
Albrecht (7 ) (see Figure 321) can be used. The stress intensity '
for this configuration is:
K 2P a =;rra /2 2 va .:.. p
(310)
The force P can be broken into stress over an incremental
length (P = a x dp) in order to get the stress intensity along the e
entire crack length as follows:
a
K = /"rra x ~ J a dp e (311)
If the stress on element t is expressed in terms of the nominal
stress a , the stress ratio a·ja is the SCF at the distance P, n e rr
namely ~t·
Since a /ITa is the SCF for a through crack in an jn:i'inite n
plate under uniform uniaxial stress, the balance of the
33

expression forK is the correction factor F (a), as a function of g .
the crack size a:
F (a) g
a K.rp ---==== dp
la?-p2 (312)
Equation 312 can be solved either by assuming an analytical
- . (6) expression for SCF, or by using numerical values as suggested
by Albrecht:(])
m
F g (a) = ; L KTj [arcsin( j:l) arcsin(~)] (313)
j=l
where KTj == SCF in element j of the FE analysis or the average
between two adjacent elements, both of equal distance
along the decay line
pj,pj+l ==distances from crack origin to the near and far sides
of element j
m = number of elements to crack length a
Equation 313 is partly a numerical solution of Eq. 312 and partly
an exact one, because the integration is carried out over the
element width, and the summation over the number of elements from
the center of the crack to the crack tip.
F (a) g
(314)
If the stress distribution along the crack path is given in
function form, integration of Eq. 312 by parts yields:
34
r _TT2 J K == ;;:Tal 0' -_a 0
where Cia is the value of the applied stress at p = a4
35
(315)

3.6 Predicted Fatigue Life
The Paris power law was used to compute crack growth, knowing \
the stress field in each critical area and the various correction
factors taking into account the actual geometry of the detail.
The use of Paris' power law requires knowledge of the follow-
ing factors:
the initial crack size, which may be approximated by the
size of the largest possible defect in the high stress
location
the final crack size, which is a function of the fracture
toughness of the material
- the material coefficients C and m
3.6.1 Weld defects
Welds are never completely defect-free. On the contrary, they
generally contain discontinuities which may be classified as
follows: (l6 )
A. Geometrical
1. Undercut
2. Overlap
3. Poor fit-up, mismatch
4. Exessive reinforcement
5. Stress concentrations in general
6. Nature of weld dressing
36

B. Weld character
1. Lack of penetration
2. Lack of fusion
3. Slag inclusions
4. Oxide films
5. Delaminations
6. Tungsten inclusions in GTA welds
7. Gas porosity
8. Microsegregation during cellular or dendritic growth
9. Shape of weld puddle
10. Arc strikes
11. Entrapped weld spatter
C. Metallurgical
1. Stress relief cracking
2. HAZ hydrogen embrittlement (cold cracking)
3. Weld metal solidification cracking
4. HAZ liquidation cracking (low melting int segregates)
5. Delamination of plate
D. Residual stresses
i. Constraint
2. Repair welding
It is necessary to differentiate between internal discontinuities
inside the weld and smaller ones at the weld toe. In case of welded
bridge structures, we are primarily concerned by small, sharp
intrusions of slag emanating from the welding flux an.·.:l leading to
crack initiation and growth at the weld toe. (l7 ,l8 ) Illspection
37
of the origin regions of fatigue cracks has suggested that the
initial defect size may be in the range of 0.05 to 0.5 mm. (l9 )
.It is very difficult to establish a definite size of the
initial defect. A range of initial crack values from 0.05 to 0.5
mm was used in this study.
3.6.2 Final crack size
It is also difficult to determine the final crack size, since
this value is related to the fracture toughness of the steel and the
geometry of the detail. Furthermore, the FEM analysis only concerns
the SCF through the web or gusset plate thickness and therefore can
only be used for the propagation through that thickness (Phase A).
This phase of. propagation is only a part of the total fatigue life.
(see Figure 322). Phases B and C cannot be accounted for by using
the expression ofJ6K obtained in 35. As a first approximation, we
can assume the failure is complete when the crack has grown through
the plate thickness. It can be shown that the fatigue life is
almost exhausted at this stage. However, experimental data has
demonstrated that most of the fatigue resistance is exhausted once
the crack has propagated through the plate thickness
38
3.6.3 Weld Shape
(12) Based on Maddox's work a correction factor for 30° fillet
weld was introduced in order to study the effect of the weld slope.
This correction factor is defined as the ratio of the stress
intensity factors for 30° and 45° fillet welds, as a function of
the ratio of the.cr:ack length a to the plate thickness W (see
Table 35) .
..
39

3.6.4 Paris Power Law Coefficients
The coefficients C and m have been determined from experimental
results. These coefficients are primarily material constants. They
are affected by environment and loading conditions. Barsom(20) has
established an upper bound on the crack growth rate for ferrite-
pearlite steels as follows: ------------------------------------------~-----------------------------------------·
C = 2.18 X 10- 13 m = 3.0 (SI units)
Hirt and Fisher (22 ) used an average value of C equal to 1. 21 x 10- 13
with m = 3.0. That C value is within the range of variation given
by Maddox(23 , 24 ) i.e. 0.9 to 3 x l0- 13 •
-13 The average value of C = 1.21 x 10 and m = 3.0 was used
in this 'Study.
3.6.5 Fatigue lives computations
The computation of the fatigue life of each detail was made
with the previously selected values of initial and final crack
lengths and coefficients C and ci. The stress intensity factor
range 6K was computed for two assumed values of the nominal stress
range - 41.37 HPa and 82.74 MPa.
3.6.6 Results of computations
The results of these computations are presented in Table 36.
40

3.7 Complementary Investigations
The previously described gereral analysis does not include the
effect of several important parameters •. These include the size of
the girder, the type of connection between bracing and gusset plate.
the stiffness of an adjacent girder (in the general analysis the
bracing ends were assumed fixed) and gussets welded to.the
lower flange. In order to take these factors into account,
additional studies were performed. They are desc~ibed hereafter.
3.7.1 Effect of web thickness
The effect of the girder size is mainly due to the web thick-
ness. The thicker the web, the more rigid the girder when considering
out-of-plane movements induced by the lateral bracing system.
Instead of modifying all the geometrical properties of the girder.
only the web thickness was considered to vary between 2/3 and 4/3 of
the actual web thickness of the W27xl45 beam, i.e. 1 and 2 em. The
results of these computations were compared to those from the analysis
of the W27xl45 beam in terms of vertical displacements and rotations
around the longitudinal axis at the web-to:-gusset weld toe and at the
~gusset.' at· the Ihid~ppan cross-section.· These two locations correspond
to critical locations ·a, b and c.· The comparison·. indicated (see Table
!.37) that the displacements and rotations decreased when the web
thickness increases. The amount of the decrease was not the same
for displacements and rotations. Here the question arises of
which one is the best measure of the SCF variation. The rotation
41

around the longitudinal axis seems to be a more critical parameter
(as far as the fatigue behavior of the weld is concerned) than the
vertical displacement. In addition, the larger values are more
conservative than those considering the vertical displacement.
Hence the rotation around the longitudinal axis was used .to assess
the SCF variation. The SCF values from previous computations (t ~ w
1.5 em) were used to estimate the influence of web thickness. Figure
323 shows the resulting change in SCF assuming it is proportional to
the change in rotation.
3.7.2 Influence of flange connections
In order to check whether or not the gussets welded on the
lower flange have an effect on the behavior of the web gusset, the
first three FEM analysis were repeated without these gussets on the
girder. The results are compared with those obtained with the
flange gussets in place.in Table 38. It appears that the gusset
welded to the lower flange has an opposite effect on detail 1 than
on details 2 and 3 .. In the ·first case, the vertical displacements
increased where the gusset is suppressed. They slightly decrease in
the two other cases.· This study has indicated that the attachment
of gussets to the flange have a negligible influence on the be-
havior of the web gussets.
42

3.7.3 Effect of the type of connection
Since the out-of-plane movement of the gusset plate is induced
by the bending rigidity of the bracing members, the type of connec
tion between the bracing members and the gusset plate is of major
importance. The following factors appear to be the m~in parameters
influencing this connection:
- the length of the connection and the gap between the end of
the bracing member and the web plane
- the type and the size of the fasteners (bolts c:~. welds}
- the angle between the bracing members and the g~'trder axis.
These parameters are illustrated in Figure 324. ~'nfortunately,
the FEM does not allow the precise introduction of thc.se factors
without the use of a very complex 3D mesh. A 2D mesh ,.;as used to
examine the effect of the type of connection by chan::;iug the attach
ment points of the bracing members discretized by use of beam
elements. These attachments points are numbered 1 to 10 in figure
325 showing the gusset plate discretization. Two di:CL:rent condi
tions were considered as follows:
Type 1: gusset plate and stiffener are w~lded to;ether on the
sa~e side of the web.
Type 2: gusset plate and stiffener are each on tc::e side of
the web.
For each type, four different connection lengths were considered.
They were denoted cases 1 to 4, as follows:
43

Connecting Gap Case Points -(em)
1 1, 6 5.84
2 3, 8 10.92
3 4, 9 13.46
4 5, 10 21.08
In addition, the behavior of the type 1 connection was studied
with a zero gap. The largest displacements were always obtained at
the web-to-gusset weld toe. Table 39 gives the displacements and
rotations at that point. Examination of these results showed that
none of the c~ses examined were significantly different. This para-
meter is not sensitiv~ to the position of the stiffener or to the gap
between the web and the bracing member end.
A comparison was also made of the out-of-plane bending moments
along the web-to-gusset weld. These moments are shown in Figure 326.
Elements El to E6 are the six plate bending elements along the web-to-
gusset weld toe (see Figure 325). They indicate that the smaller gaps
result in smaller bending moment. The stresses induced by the out-of-
plane movement stay at a very low level in the gap. Thus there is no
major advantage of a reduction of the gap.
This is in agreement with the experiment described in section 224.
None of the beam. tests gave any indication of fatigue crack grm.;rth
along the web-to-gusset weld connection as a result of distortion.
In order to evaluate the behavior of more flexible (or weaker)
connections (see Figure 327), two complimentary FEM analyses were
44
conducted for the type 2 connection case, by removing part C alone and
parts A, B, C respectively (see Figure 325). The results of these
studies were compared to the previous ones in terms of out-of-plane
bending stresses and stresses in the direction transverse to the weld.
Both web-to-gusset and the stiffener-to-gusset welds were considered
(see Tables 310 and 311). When analyzing the web-to-gusset connection,
bending stresses and axial stresses perpendicular to the web are of
primary concern. When considering the behavior of the stiffener-to
gusset connection stresses perpend~cular to the stiffener are of
interest. The bending stresses along the web-to-gusset weld were not
drastically altered by the cut-outs (see Table 310). On the other
hand, the transverse stresses· along the stiffener-:-to-gusset.weld ·in
crease substantially when part C or parts A, B and C are cut out. One
may therefore expect location c (stiffener-to-gusset weld toe) to be
more critical in these special·gussets than in those previously studied.
3.7.4 Effect of adjacent girder stiffness
The last parameter examined was the stiffness of the adjoining
girder which was parallel to the main girder to which the ends of
lateral bracing members were attached. The study was conducted on a
very elementary discretization of the system using beam elements and
neglecting the gusset plates and stiffener. This simplification is
reasonable, since there is a linear relationship between the relative
vertical displacements of the two girders and the out-of-plane move
ment of the gusset plate. This is the critical factor in the fatigue
behavior of these details. The discretization is presented in
45
Figure 328. The parameter selected was a function of the rotation of
the bracing member 6-:-7 due tO the deflections and rot&t:iDilS of DOC!eS
6 and 7. The definition of that critical paramet.er, cd.1~d r.,?, is
illustrated in Figure 329.
Several investigations were conducted~ The end ~;t:iJ:' ,''r:ess 'Jas
varied from zero -(no adjoining girder) to infinity (fixed eu1s). The
results. are plotted on Figure 330. They are somewhat sn·~cising,
since the critical parameter <P was found to increase ',':U:h ,:,.:.~r:€.c:.sing
torsional stiffness J at constant bending inertia I. T.i; L:; S'•J:;ge.st:s
that the situation is getting worse (from the standpo~.::;t c,;: ;:he <Omrt-
of-plane movement of the gusset plate) when the adjoining ::;irder
tv.Tists more easily.
3.8 Estimate fatigue life
As discussed in Article 356 · an accurat·e computatj.on Gf the
stress intensity factor at the web-to-gusset weld toe re.r~<:!..res a
. knowledge of the stress field.: in· its vicinity.· Of ·.prij'1<.:,.c:;.' :i.nte:rest:
is the ~-ieb thickness variation when only considering th2
thickness crack propagation.
IIereafter is described a less accurate ·computatic:~ . .... · r.:n
d;.'··:-2:1 't require any computer vmrk and therefore may b,e ';'' ·.:]<-' ?'2~-
fn ;:'>;e.d in any circumstance.
Crack propagation must be split into three phase::.;
fj.~;,_•.·J:e 222. These phases must be analyzed separately, .· ...... :-:~ tL~
46
propagation mechanisms are substantially different and may not be
formulated in the same way. Only fatig'ue crack propagation will be
considered and initiation and the final fracture stage will be
ignored. This simplification can be justified by the fact that the
majority of steel components contain initial discontinuities or de-
fects (see 361) which have a negligible crack initiation phase.
Fracture is not a major concern since prior to reaching it, the use-
ful life of the structural component has been essentially exhausted
with through thickness propagation. Furthermore, the crack growth
rate is so high during that stage that any computation would be both
difficult and inaccurate.
Propagation type 1
For a part-through thumbnail crack, the stress intensity factor
is given by Eq. 35 (see 352). Its maximum value is reached at the
minor axis end (S = TI/2):
This expression has to be corrected by a front surfact correc-
tion factor F ~ 1.12 and a stress concentration factor F which is s g
about 2.5, according to Popov( 26 ) who gives a st.ress concentration
factor of approximately 2.4 for a flat plate in tension having a fil-
let with the ratio of curvature of fillet to plate thickness being zero.
zero.
Furthermore, assuming a/a y
value, we get Q =.1.7(23).
0. 9, which is a very conservative
47

Using Paris' Power law and integrating between ai and a final
crack size equal to the web thickness (af = 15 mm), we get:
af 3
J -3/2 da 1.2lxl0-13 1.12x2.5 ~ D.cr3 Nl a
a. 1
Thus Nl 3xl011
1 1 = (6cr) ~ ;;:;_ 115
Propagation types 2 and 3
The contribution to fatigue life corresponding to these stages
of propagation is much more difficult to estimate. The main diffi-
culties are:
- in stage 2, a through-thickness crack in a plate of variable
thickness
-in stage 2, we have no idea of the SCF at crack tip
- in stage 3, the crack is propagating in a variable stress
field due to the bending stress gradient and SCF
- the computation of the final crack size requires the knowledge
of KIC (or Kc if the plate is not thick enough to be in a plane
strain condition) and the stress at the crack tip, which is
unknown.
Nonetheless, a crude estimate of the contribution to the fatigue
life corresponding to these stages of crack growth can be made by as- ·
suming the crack at the end·of the first stage is a through thickness
crack with length 2a equal to the crack length at mid-thickness (see
Figure 331).
Since the actual crack shape is a semiellipse, i.e.
48

wHh b = 3.355 + 1.29 a
the length of the assume through thickness crack is:
a' = ~ b = ~ (3.355 + 1.29 t)
where t is the plate thickness, being 15 mm in the case here
investigated.
Therefore a' ~ 20 mm.
Assuming this through-thickness crack behaves as in an infinite
plate in tension, we have:
The number of cycles required to propagate to a given length af
is therefore:
Fatigue lives
3 x 10+12
(D.cr) 3
1 --- _1_
120 ;a;
Assuming an initial flaw of size ai = 0.1 mm and a crack length
at discovery af = 30 mm, the following fatigue lives (N = N1
+ N2 ,3
)
result (for Phases 1, 2 and 3)
N = 14.40 million cycles at D.cr = 41 MPa
N = 4.12 million cycles·at b.cr = 62 MPa
N 1.77 million cycles at D.cr 83 MPa
This is in good agreement with the experimental fatigue data for
critical location a which are 17.7, 4.2 and 1.3 million cycles respec-
tively at these three stress rangesL
49

4. CONCLUSIONS AND RECOMMENDATIONS
4.1 Basic web details
The experimental and analytical studies on the basic web details
indicated that the following conclusions could be made.
1. All web -gusset details yielded fatigue strengths that
equaled or exceeded category E.
2. Only the ends of the lateral attachments developed detect
able fatigue crack growth. None of the details exhibited
fatigue cracking adjacent to the transverse stiffeners.
3. The web gusset welded to one web surface with no connection
to the stiffener provided good behavior with no adverse
effect in web gap between stiffener and lower flange.
4. No adverse effect was found from the lateral bracing and its
imposed out-of-plane movement of. the web gusset.
5. The experimental observations were in general agreement with
the theoretical model for the end of the detail. The model
had a tendency to overestimate the severity of the detail.
6. Simplified fatigue life computations were in general agree
ment with the experimental observations.
50
4.2 Flange gussets
The conclusions concerning these details are as follows:
1. None of the flange details exhibited evidence of fatigue
crack growth, even at very high stress range levels.
2. The "zero" radius details had the weld end (and toe) ground
smooth. This resulted in a large increase in fatigue
resistance.
3. The experimental results suggest that the ground radius de
tails were always below the crack growth threshold as no
crack growth was observed at any level of stress range.
4. Extensive failure from other details prevented development
of fatigue data for the flange gussets.
4.3 Special details
Several special details were added to most of the test girders
in order to develop experimental data on their behavior and strength.
·e tests provided the follmving results:
1. Su.t _·1.e.mentary detail 1 simulated heavy. flanges either groove
or fillet -w..: 1 r1ed to the test girder web. All of these test
details provided fatig_· ~~sistance that was in agreement
with category E.
2. Supplementary detail 2 consisted of two plates weld~d on the
lower flange opposite the gusse~ plates which were already
'.i
welded to the flange. No cracking was observed at the stress
range level of 83 MPa. Further tests are underway on this
detail.
3. Supplementary detail. 3 consisted of two plates welded together
with incomplete penetration and then fillet welded to the web
as a longitudinal stiffener. The detail quickly cracked to
the web, but the growth through the web was not as quick as
anticipated. A subsequent test yielded much less fatigue
resistance.
4. Supp~ementary detail 4 consisted of an insert through the
web. The only test exhibited category E behavior. Addi-
tional experiments are being made on this detail and are
currently underway.
4.4 Retrofitting techniques
The only retrofitting technique used in this experimental study
was to drill holes at the crack tips. Generally, the cracks that
· developed at the special details could not be arrested by any other
method. This technique was reasonably successful (see Table 42). No
general rule concerning its. efficiency was developed. Often, the
fatigue crack reinitiated at the drilled hole, depeneding on the crack
size and stress range that existed. When the crack was longer than
20 mm, it was advisable to use tightened high strength bolts to induce
compression stresses at bolt holes.
52

This technique should be used with caution in actual structures.
It is primarily an interim procedure that only temporarily arrests the
growth of the original crack. Such repairs should be inspected fre
quently because the crack may reinitiate under the bolt and washer.
It is then difficult to detect crack initiation and growth from the
hole. This can result in very rapid propagation and lead to failure.
4.5 Recommendations
This study has indicated that ·the design criteria for lateral
connections should be maintained as currently practiced. These de
tails have exhibited a satisfactory fatigue resistance which is in
agreement with the specification provisions. Consideration should be
given to grinding groove welded gusset ends, since this practice can
lead to a substantial improvement in fatigue behavior.
53

5. TABLES
54

Table 11 AASHTO Allowable Stress Range, MPa
Cycles
Detail over Category 100,000 500,000 2,000,000 2,000,000
A 413.7 248.2 165.5 165.5
B 310.3 189.6 124.1 110.3
c 220.6 131.0 89.6 69.0, 82.7*
D 186.2 110.3 69.0 Lt8. 3
E 144.8 86.2 55.2 34.5
F 103.4 82.7 62.1 55.2
*For transverse stiffener welds on webs or flanges
55

Table 21 Load and Stress Ranges
Girder Load Ranges Stress Ranges (kN) (HPa)
464.46 82.74
W27xl45 348.35 62.06
232.23 41.37
343.83 82.74
W27xll4 257.88 62.06
171.92 41.37
462.59 82.74
W36xl60 346.95 62.06
231.30 41.37
56

Table 22a Stress Record during Test of W27xll4 Girder, Detail 1
Gage Location Average Stress LowS
r
Under lower flange at 162.5 em from 82.38 support
Under lower flange at mid span (pilot 105.26 gages)
On web below stiffener end 85.43
On web above web-to-gusset weld toe 61.00
On web above internal web-to-supple-44.24 mentary detail weld toe
11
12 Not On web gusset plate Available
14
16
57
Range (MPa) High S
r
122.75
143.00
120.00
80.00
49.00
114.50
77.50
13.00
75.00

Table 22b Stress Record during Test of S27xl45 Girder, Detail 2
Gage Location
Under lower flange at 162.5 em from support
Under lower flange at mid span (pilot gages)
On web below stiffener end
On web above web-to-gusset weld toe
On web above internal web-to-supplementary detail weld toe
21
22 On weQ gusset plate
23
24
58
Average Stress Range (MPa) Low S High S
r r
58.00
72.15
56.67 ~
31.67 I=Q
;:5 H
17.33 ~ < H 0
25.00 z
28.00
22.67
18.00

Table 22c Stress Record during Test of W27xl45 Girder, Detail 3
Gage Location Average Stress LowS
r
Under lower flange at 162.5 em from 55.00 support
Under lower flange at mid span (pilot 68.10 gages)
On web below ·stiffener end 60.00
On web above web-to-gusset weld toe 32.00*
On web above internal web-to-supple- Not mentary detail weld toe Available
31 20.00
32 14.00 On web gusset plate
33 26.50
34 7.00
59
I Range (MP.a·)
High S f
r !
104.00 I !
'
137.00 I
i 122.0()
Not: ! Available
i 43. OQl
27.50 I ! ' I
30.50 l
' 39.50
Not Availabl-e , .~ ..

Table 23 Out-of-Plane Movements
Gaps (mm) Relative Deflections %
gl g2 g3 ~11 ~3 ~2/~3
75 75 75 88.70 90.52
125 75 75 89.89 92.27
125 75 125 90.08 93.35
125 125 125 92.33 95.70
125 125 75 90.56 93.46
75 125 75 89.14 94.20
60

Table 24 Experimental Fatigue Lives
Critical Stress Number of Location Range Million Cycles at
or (MPa) Visible Through-Supplementary Nearest . Crack Thickness
Detail Detail Theory Gage Initiation Propagation
62 61 4.6 NA a 83 80 0.78 >
b 62 61 > 9.3 83 80 > 0.78
1 62 61 > 9.3 c 83 80 0.78 >
1 fillet welded 78 49 NA 0.78 2 78 49 > o. 78 3 70 NA 1.1 2.0
59 44 NA 4.6
41 32 >17. 7 a 83 NA 1.8 2.0
2 b 41 32 >17. 7 83 NA > 2.3
1 fillet >Jelded 39 17 4.3 17.7 78 NA 1.1 1.4
--·-· 41 32* > 9.0 a 83 NA NA 1.6 3 1 groove welded 78 43 NA 1.5
4 78 NA NA 1.0
*Strain gage not balanced
NA - Not Available
61

Element Number
1
2
3
4
5
6
7
8
9
Table 31 Numbering Pattern for Cubic and Skewed Elements
Connected Nodes
1 2 3 4 5 6 7
1;,_ 4 5 2 10 13 14
2 5 6 3 11 14 15
4 7 8 5 13 16 17
5 8 9 6 14 17 18
11 14 15 12 19 2'1 22
19 21 22 20 23 25 26
11 14 21 19 10 13 25
14 15 22 21 17 18 26
14 17 17 21 13 16· 16
62
8
11
12
14
15
20
24
23
25
25
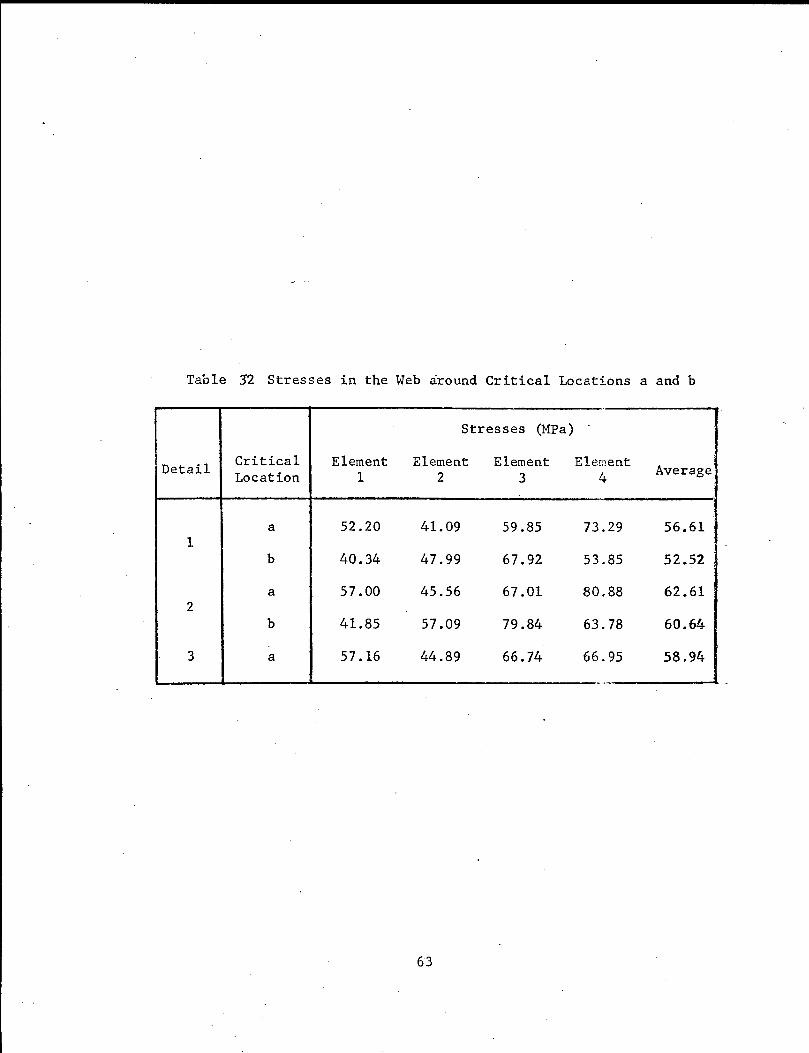
Table 3'2 Stresses in the Web around Critical Locations a and b
Stresses (MPa)
Detail Critical Element Element Element Element
Average Location 1 2 3 4
a 52.20 41.09 59.85 73.29 56.61 1
b 40.34 47.99 67.92 53.85 52.52
a 57.00 45.56 67.01 80.88 62.61 2
b 41.85 57.09 79.84 63.78 60.64
3 a 57.16 44.89 66.74 66.95 58.94
..
63
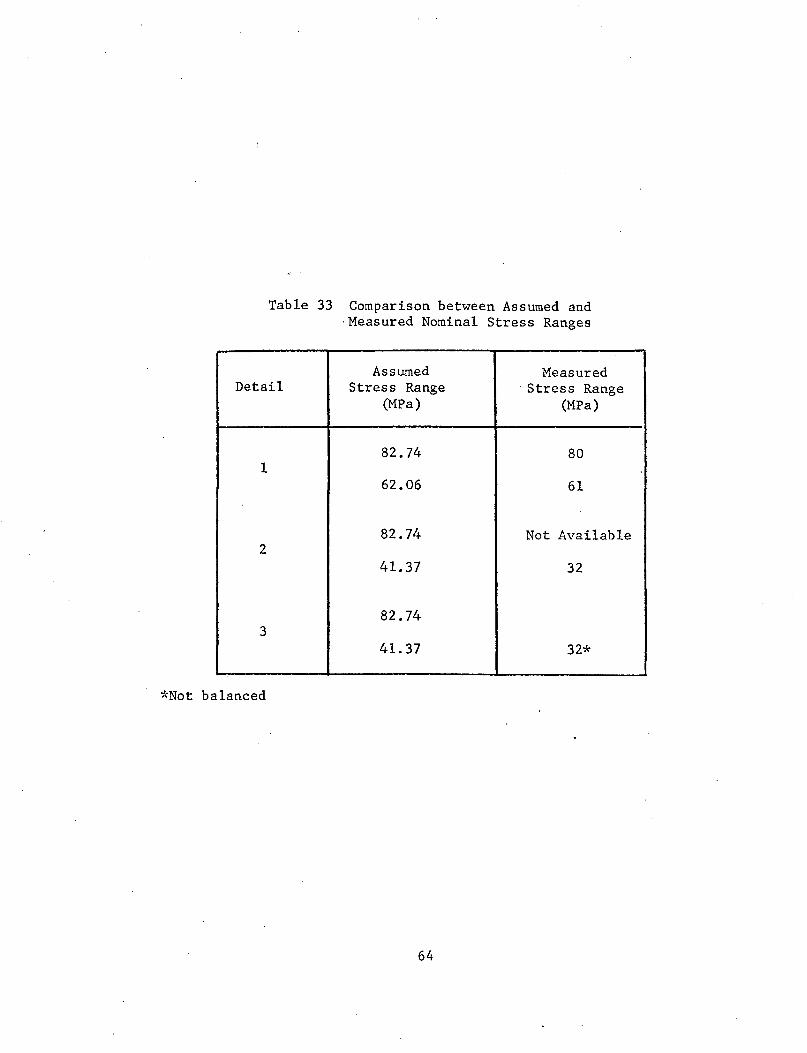
Table 33 Comparison between Assumed and ·Measured Nominal Stress Ranges
Assumed Measured Detail Stress Range · Stress Range
(MPa) (MPa)
82.74 80 1
62.06 61
82.74 Not Available 2
41.37 32
82.74 3
41.37 32*
*Not balanced
64

Table 34 Front Free Surface Correction
I Type of Stress Front Free Surface Crack Distribution Correction F
s
Through crack a F == 1.122 s
b F ::z 1.210 s
c F == 1.300 s
d 1.210 < F < 1.300 s
Half circular crack a F = 1.025 s
b F :::: 1.085 s
c F = 1.145 (estimated) s
d 1.085 < F < 1.145 s
Quarter circular crack a F = 1.380 (estimated) s
b F :::: 1.067 (estimated) s
c F = 0.754 (estimated) s
d 0.754 < F s < 1.067
--~-~~---- -----~-~----~--~---- --
a: uniform stress over the crack length
b: linear stress variation to zero at the crack tip
c: concentrated load at the crack origin
d: decreasing stress distribution more rapid than linear variation
to zero at the crack tip
65
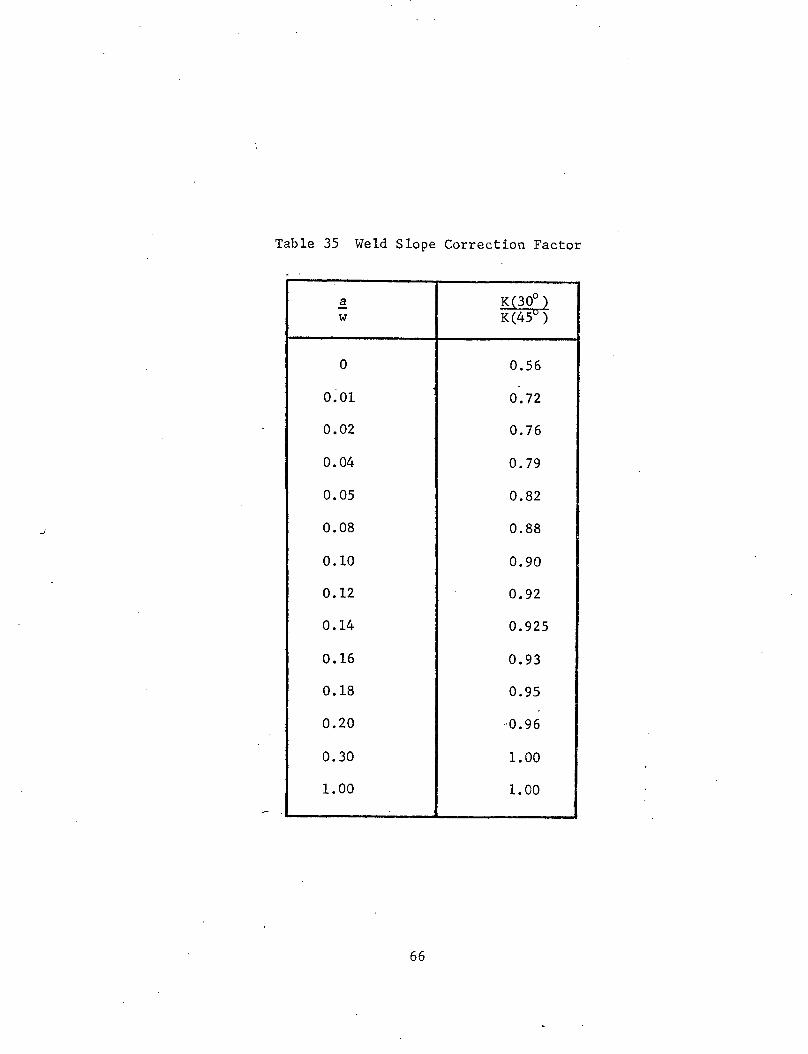
Table 35 Weld Slope Correction Factor
a K(30°) w K(45°)
0 0.56
0.01 o. 72
0.02 0.76
0.04 0.79
0.05 0.82
0.08 0.88
0.10 0.90
0.12 0.92
0.14 0.925
0.16 0.93
0.18 0.95
0.20 ·0. 96
0.30 1.00
1.00 1.00
66

Table 36 Computed Fatigue Lives
Initial Fatigue Stress Weld Crack Life
Critical Range Slope Size (million Detail Location (MPa) (0) (mm) cycles) I-- '
1 a 62 30 0.05 3.4 - 0.5 3.{) 45 0.05 2.5
0.5 2.6 83 30 0.05 1.4
0.5 1.3 45 0.05 l.l
0.5 1.1
b 62 30 0.05 3.6 0.5 3.2
45 0.05 2.7 0.5
I 2.7
83 30 0.05 1.5 0.5 1.3
45 0.05
J 1.1
0.5 1.1 - ..
J 2 a 41 30 0.05 19.1
0.5 15.9 ' 45 0.05 13.2
0.5 13.1 83 30 0.05 2.3
0.5 1.9 45 0.05 1.6
0.5 J_
1.6 i
b 83 30 0.05 t 11.9 0.5 6.6
45 0.05 I 6.0 0.5 4.7
3 a 41 30 0.05 l 10.8 0.5 I 9.5
' 45 0.05 ~ 8.0 83 30 0.05 I 1.3
0.5 I 1.2 45 0.05 1.0
0.5 J 1.0
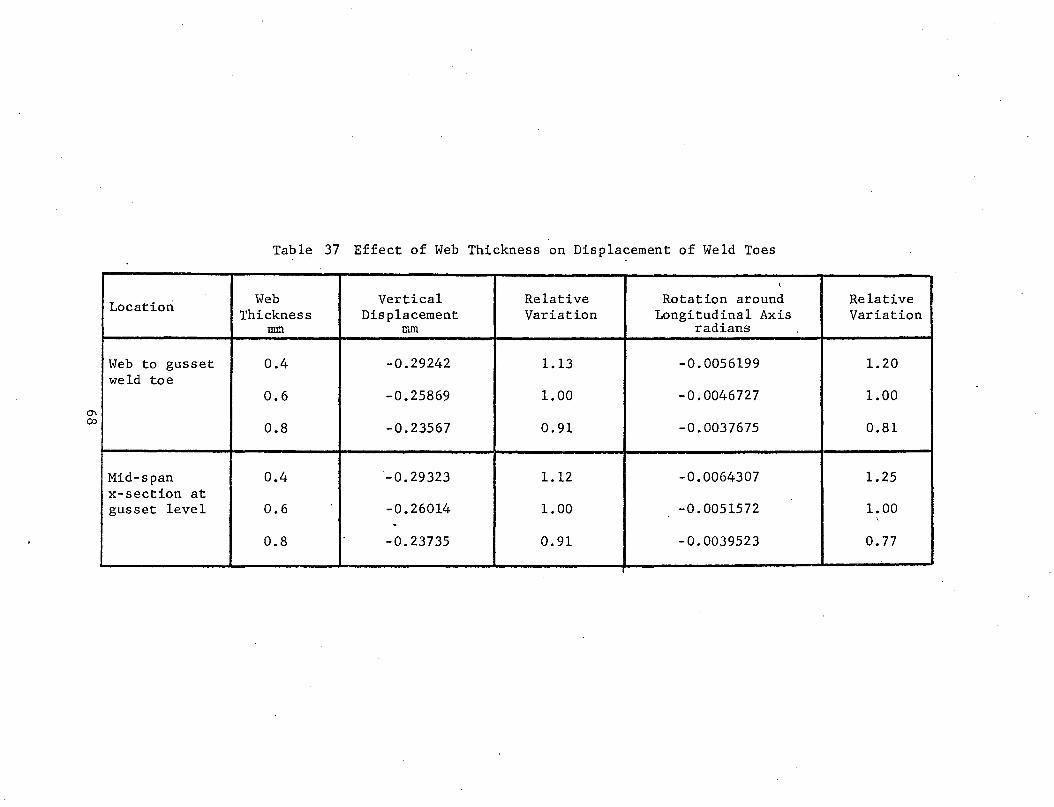
Table 37 Effect of Web Thickness on Displacement of Weld Toes
'·
Location Web Vertical Relative Rotation around Relative Thickness Displacement Variation Longitudinal Axis Variation
mm mm radians
Web to gusset 0.4 -0.29242 1.13 -0.0056199 1.20 weld toe
0.6 -0.25869 1.00 -0.0046727 1.00
0.8 -0.23567 0.91 -0.0037675 0.81
Mid-span 0.4 -0.29323 1.12 -0.0064307 1.25 x-section at gusset level 0.6 -0.26014 1.00 -0.0051572 1.00
\ . 0.8 -0.23735 0.91 -0.0039523 o. 77

Table 38 Effect 'of Gussets Welded to the Lower Flange
Location Detail· Gusset on Vertical . Relative Lower Flange Displacement Variation
nun
1 yes -0.25869 -1 no -0.28219 1.09
Web-to- 2 yes -0.28216 gusset 2 no -0.26026 0.92 weld toe
3 yes -r(). 28216 3 no -0.26489 0.94
1 yes -0.26014 1 no -0.28536 1.10
Hid-span x-section 2 yes -0.28418 at gusset 2 no -0.26243 0.92 level
3 yes not available 3 no
,_ ........ --
1 yes -0.13503 1 no -0.28038 1.44
External corners of 2 yes gusset 2 no -0.16089 plate
' 3 yes -0.19794 3 no -0.18575 0.94
-;r···~·W'
1 yes -'0.16832 1 no -0.28340 1.68
Mid-length external 2 yes side of 2 no -0.082326 gusset plate 3 yes -10.089008
3 no -0.068492 0. 77 '· ,... *~'~ ,_,~
69
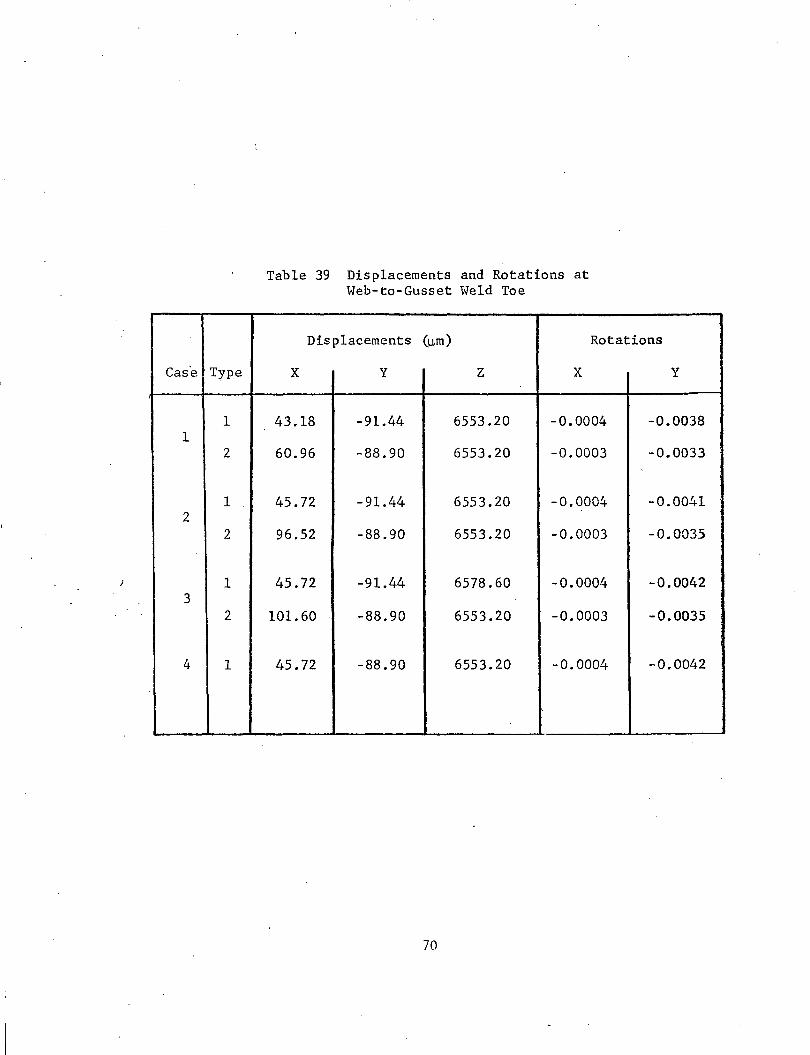
Cas'e Type
1 1
2
1 2
2
1 3
2
4 1
Table 39 Displacements and Rotations at Web-to-Gusset Weld Toe
Displacements (~-Lm) Rotations
X y z X y
43.18 -91.44 6553.20 -0.0004 -0.0038
60.96 -88.90 6553.20 -0.0003 -0.0033
45.72 -91.44 6553.20 -0.0004 -0.0041
96.52 -88.90 6553.20 -0.0003 -0.0035
45.72 -91.44 6578.60 -0.0004 -0.0042
101.60 -88.90 6553.20 -0.0003 -0.0035
45.72 -88.90 6553.20 -0.0004 -0.0042
70
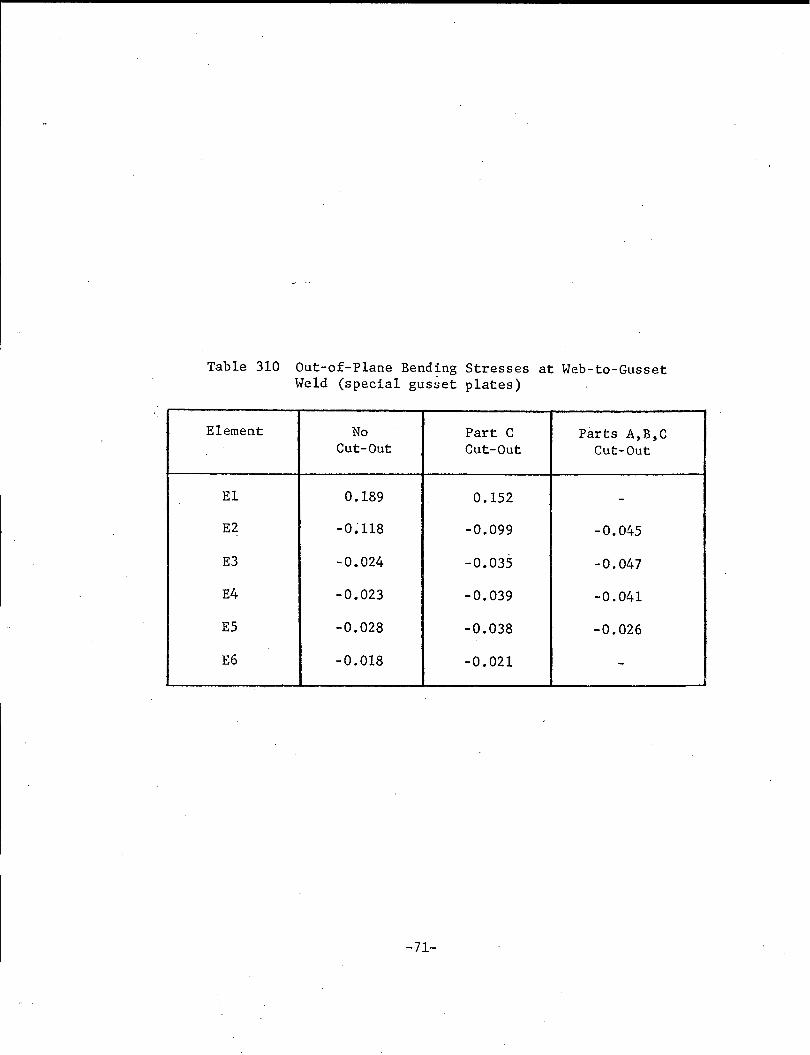
Table 310 Out-of-Plane Bending Stresses at Web-to-Gusset Weld (special gusset plates)
Element No Part C Parts A,B,C Cut-Out Cut-Out Cut-Out
El 0.189 0.152 -
E2 -0~ 118 -0.099 -0.045
E3 -0.024 -0.035 -0.047
E4 -0.023 -0.039 -0.041
E5 -0.028 -0.038 -0.026
E6 -0.018 -0.021 -
-71-
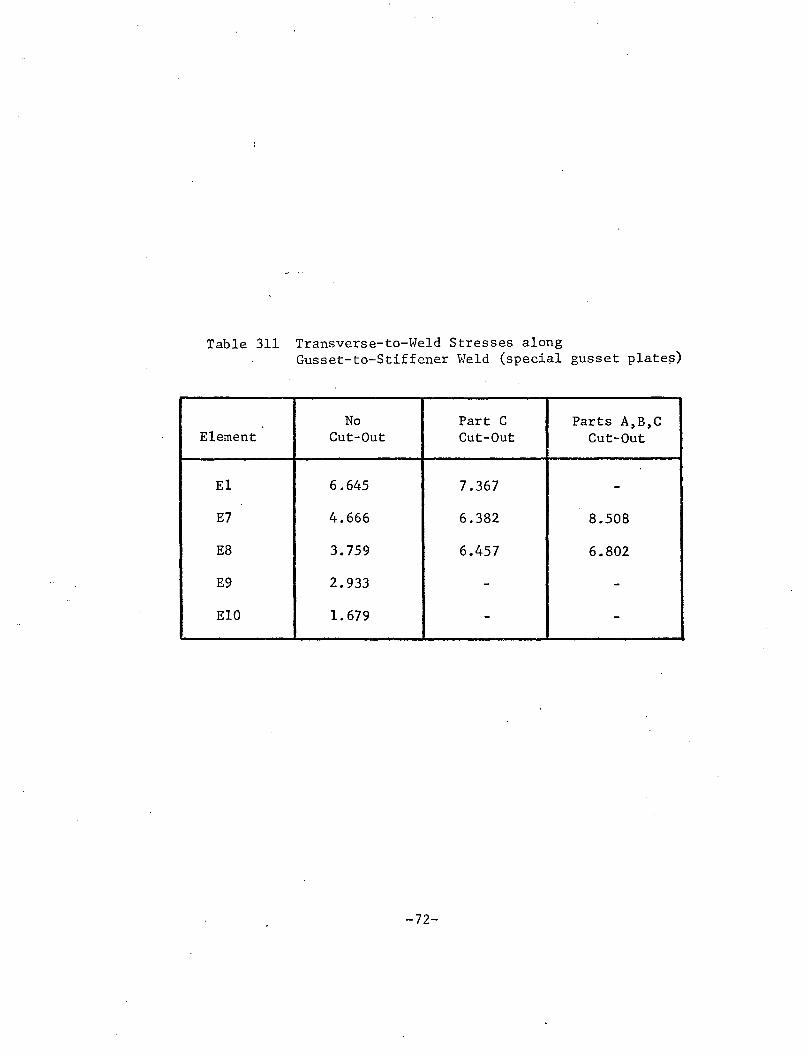
Table 311 Transverse-to-Weld Stresses along Gusset-to-Stiffener Weld (special gusset plate~)
No Part C Parts A,B,C Element Cut-Out Cut-Out Cut-Out
El 6.645 7.367 -E7 4.666 6.382 8.508
E8 3.759 6.457 6.802
E9 2.933 - -ElO 1. 679 - -
-72-

Detail
1
2
3
Table 41 Comparison between Experimental and Co~puted Fatigue Lives (at through-thickness propagation)
Fatigue Life (million cycles)
Stress '
Critical Range Location (MPa) Experimental Estimated
a 62 4.2** 2.9
83 > 0.8 1.2
b 62 > 9.3* 3.1
83 > 0.8* 1.3
c 62 > 9.3* N.A.
83 > 0.8* N.A.
a 41 17.7 15.4
. 83 1.8** 1.8
b 41 >17. 7* N.A.
83 > 2.3* 7.3
! ; a 41 > 9.0* 9.1 ..
83 1.3** 1.2
*Failure elsew·here prevented further testing
N.A.: not available
**Fatigue life at through-thickness propagation estimated from
crack length at time of observation
73

Table 42 Retrofitting Results
Stress Crack Holes Web Stress Crack Range Length Dia. Rein-
Detail Range Location (MPa) (mm) (mm) Bolts itiation
Central weld 1 Low of supp. 59 40 19 No Yes
detail 3
Inner weld 1 Low toe of supp. 70 50 19 No Yes
detail 3
1 Low Web gusset 62 25 19 No Yes
weld toe
Supp. 1 High detail 1 78 157 . 19 No Yes
weld toe
Web-to-59 19 No No 2 High gusset 83
weld toes 112 19 No No
Supp. 2 High detail 1 78 50 19 Yes Yes
,.,eld toe
Supp. 3 High detail 4 78 10 19 Yes No
weld toe
Supp. 3 High detail 1 78 90 19 No Yes
weld toe
-74-
6. FIGURES
75
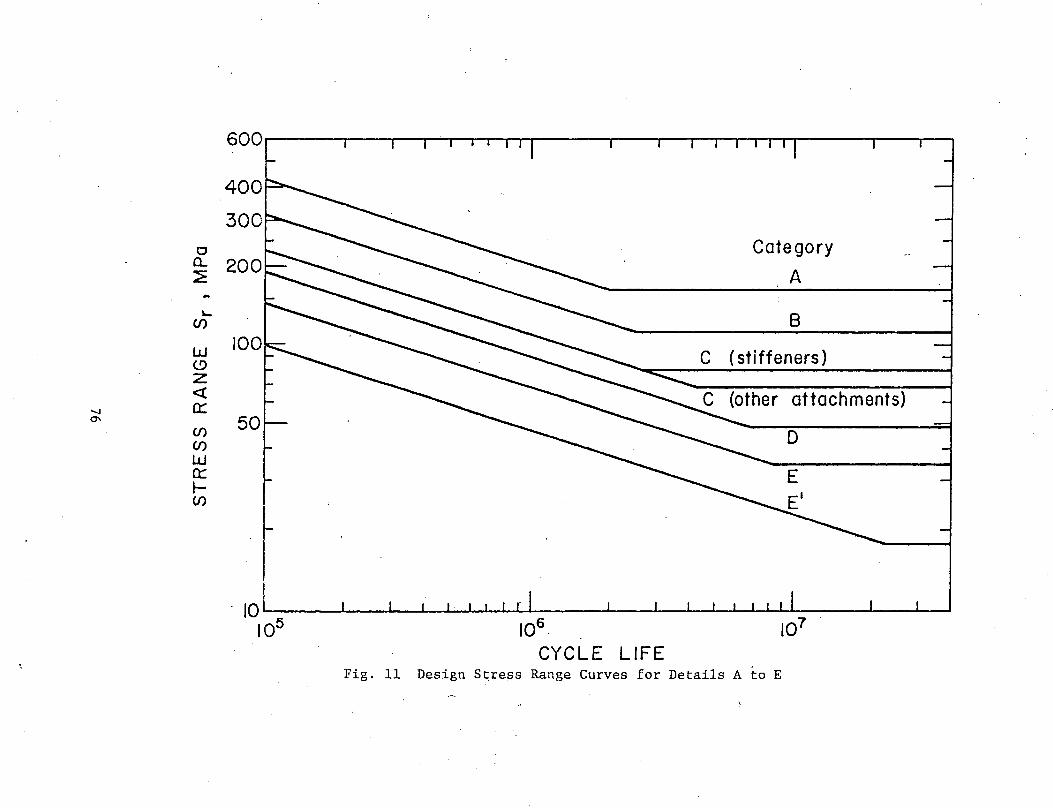
c a_
Category
::?; A
~
8 (/)
w c (stiffeners) (!)
z <( (other attachments)
....... (( 0'\
(/) D (/)
w a:: E t-(/)
10~----~--~~~~~~----~--~--~~~~~----~--~~
105 106 107
CYCLE LIFE Fig. 11 Design S~ress Range Curves for Details A to E
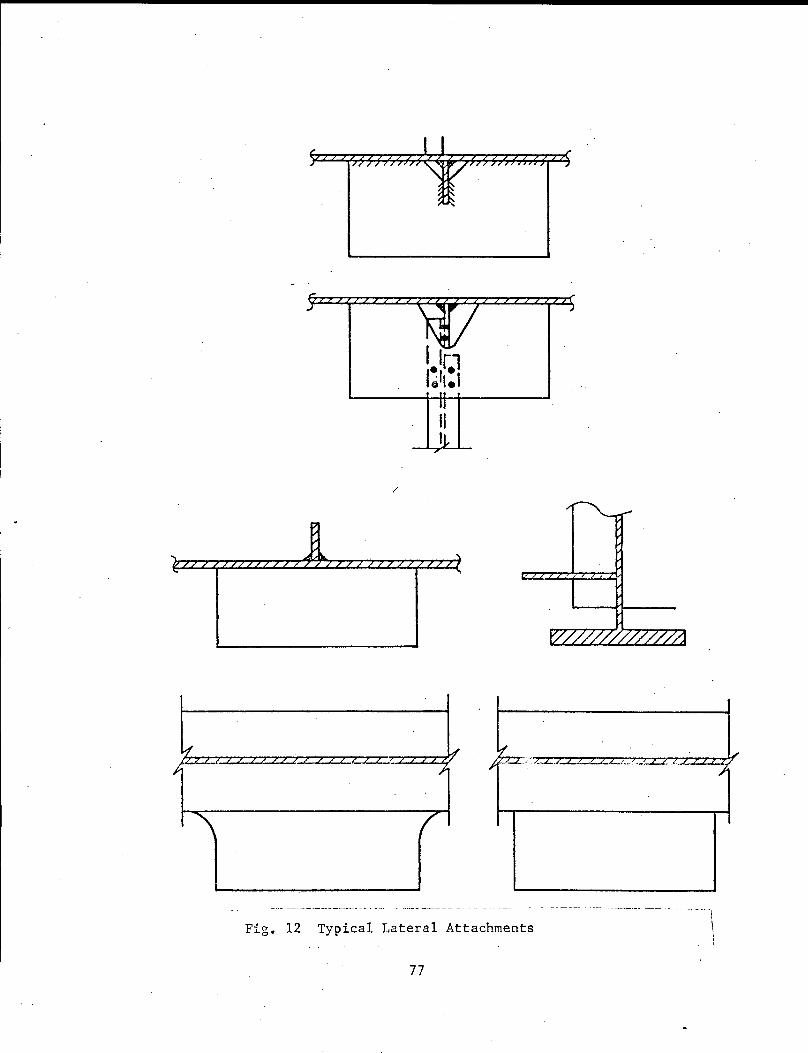
/
' '\
...
l{ ~ }
, __
1-
\ /
Fig. 12 Typical Lateral Attachments
77

i. I
I.
8
9 1-611
(W27 X 145, W27 X 114) 10 1-6 11 (W36 X 160)
~
)
'\ ~R=0,2, 6
I 24 r
46.57 (W27 X 114) 46.43 (W27 X 145) 62.54 {W36 X 160)
Note= Dimensions are in English units
-- --
Fig, 2l(a) Te~~_Spe~imens in_Shear Span
78
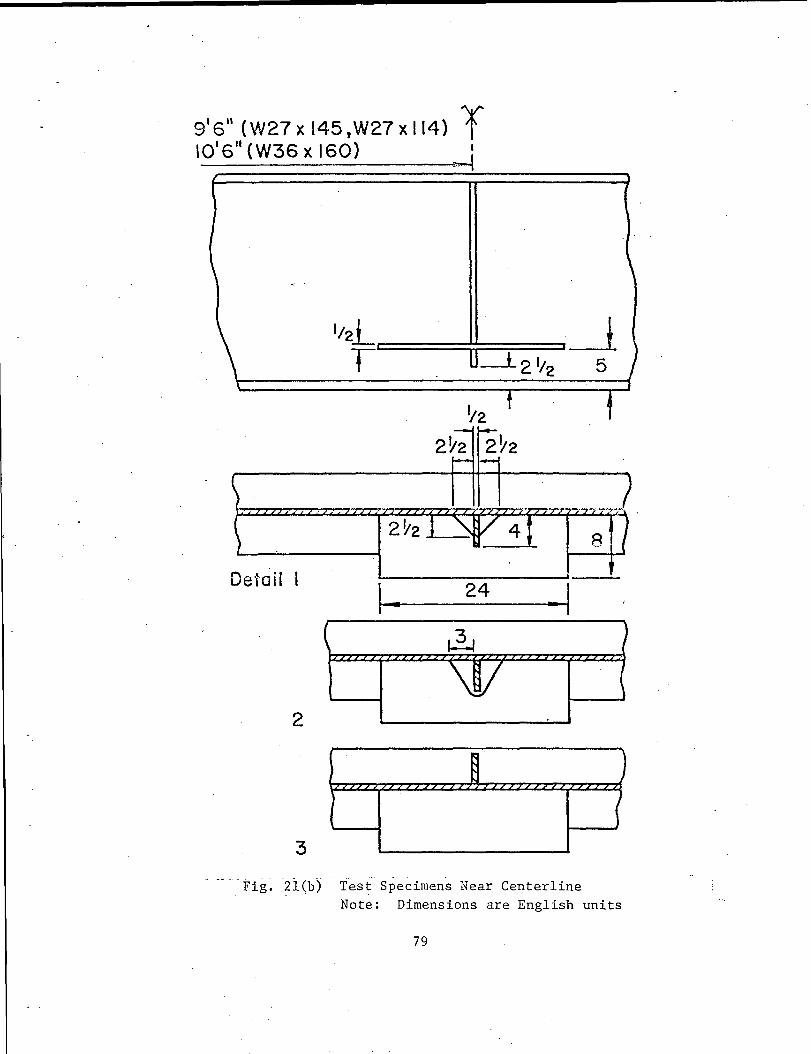
9 16 11 (W27 X 145,W27 X 114) r
10'6" (W36 X 160) ~
\
- --2Y2 2Y2 f-- -
~ ...... ";"}' ___ ,_./ .
I 2Y2 t ~4 } ) 'ill 8 (
~. . Deaatl I
J ..
24 -I ( ~
)
w 2
§ ) J (
3
Fig. 2l(b) --fest- Specimens Near Centerline
Note: Dimensions are English units
79
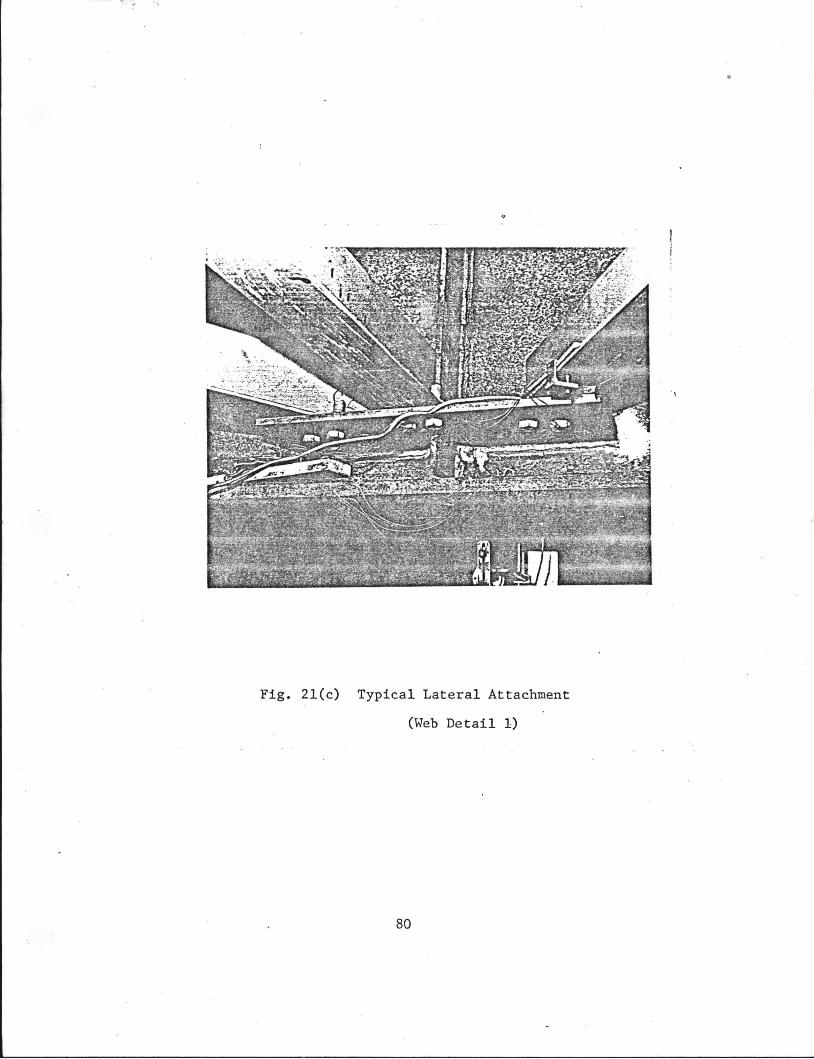
----------v.----------- - ------------------- ------------------------ - - ----------
Fig. 2l(c) Typical Lateral Attachment
(Web Detail 1)
80
•
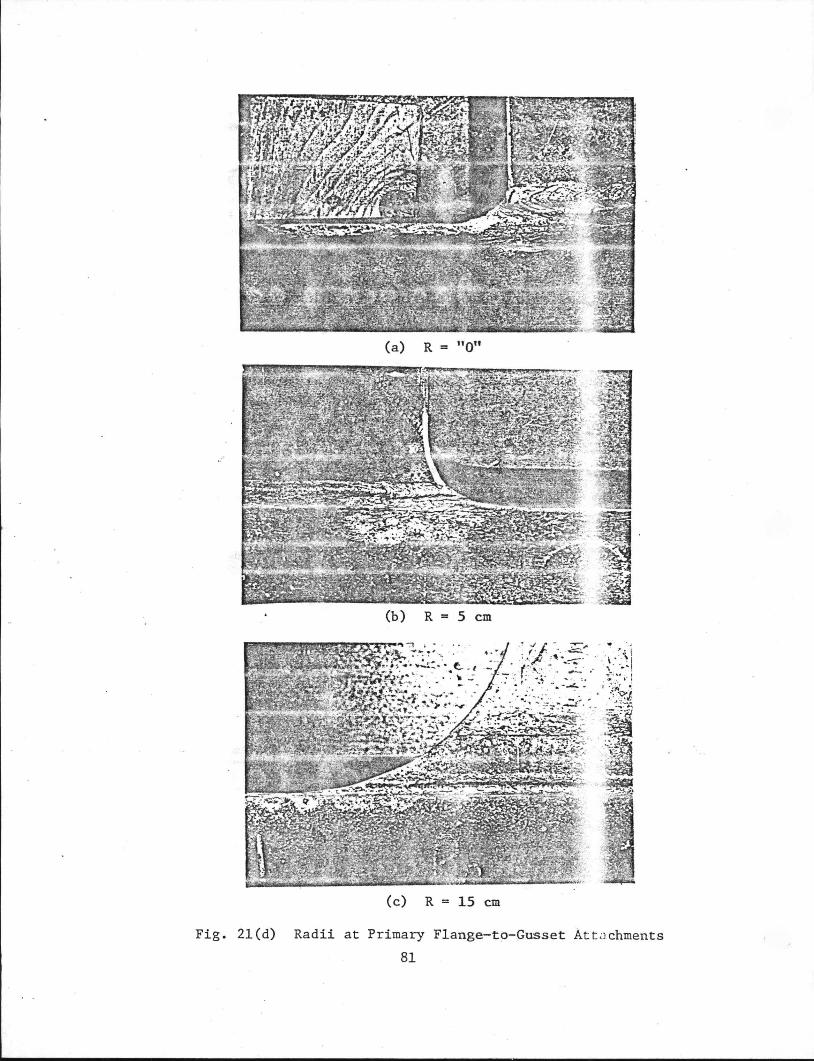
(a) R = "O"
(b) R = 5 em
(c) R = 15 em
Fig. 2l(d) Radii at Primary Flange-to-Gusset Att a chments
81
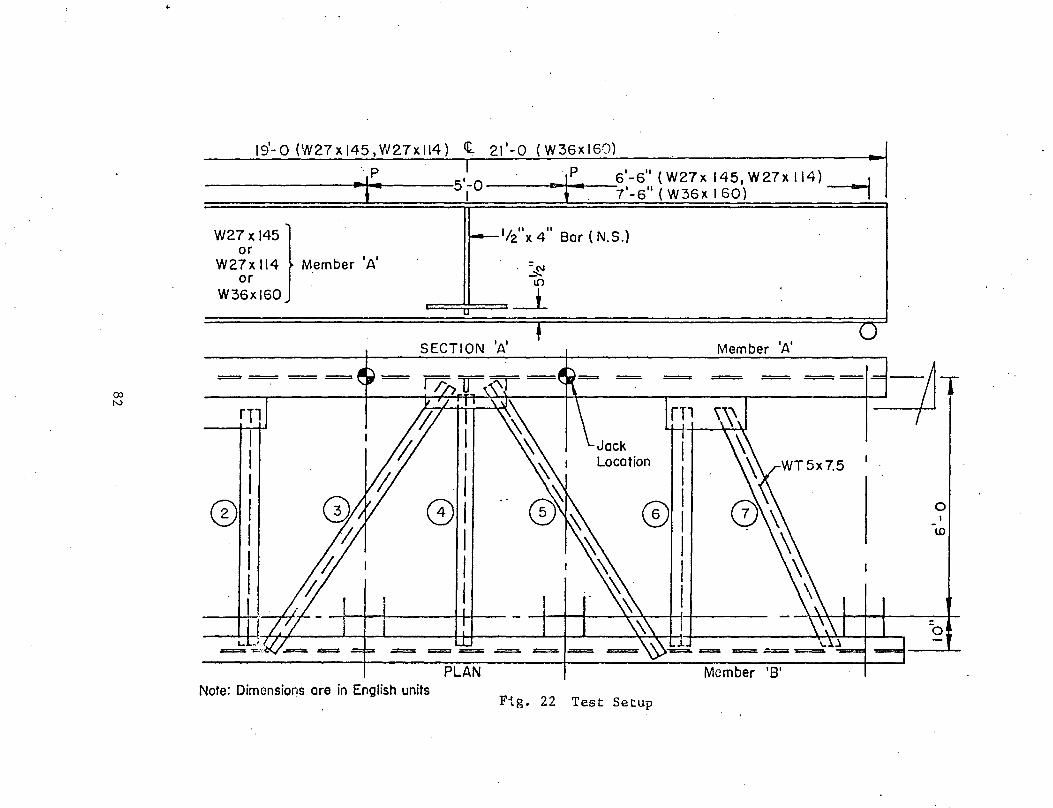
CX> N
..
19'-o (W27xi45,W27xll4) ct 21'-o (W36xl60)
~lp 5
,_0
lp 6'-6" { W27 X 145, W 27 X 114) ---1 ---------'+.---- I t . 7'-6" ( W36x I 60) - I
W27 X 145 I . or
W27x 114 Member 'A' or
W36xJ60
.==r= = ===
I I I
@I I I I I
SECTION 'A'
I I I
01 I I I
PLAN
f
= =
I I I
®, I I I
Note: Dimensions are in English units Ftg. 22 Test Setup
u Member 'A'
= =
Member '8'
0 I

------------------------~--------------------------------
Fig. 22 (continued) Test Setup
83

4 4
~ C\J 12
1u.
---'-~1------11----- 14
DETAIL I --.---f--------116
4 4
.§':! C\1 21
I DETAIL 2
22 23
C\lr 124
I 4 4
DETAIL 3
£t 31.· 133 32.-.
C\lr -34
·-· ------------'-----------------------.--··-·--------·--------------·---,
Fig. 23 G~ge Locations on the Central Gusset Plate · i Numbering pattern: 1st digit:. detail number (1,2,3) /
2nd digit: gage number ' odd: on upper face//. even: on lower face
I Note: dimensions are in English units (in) I
.. ___ _i
84

____ X
Supplementary Detail
Transverse Welds 24
~ ...
t I/ ~ 8 ~ ~
co . ~ -~
1 .. 24 .. 1
Supplementary Detail 2
I
) I I
Gage~ I s.Nf ('
I t"" I
'
24 24 18
Supplementary Detail 3
Fig. 24 (a) Supplementary Details
85
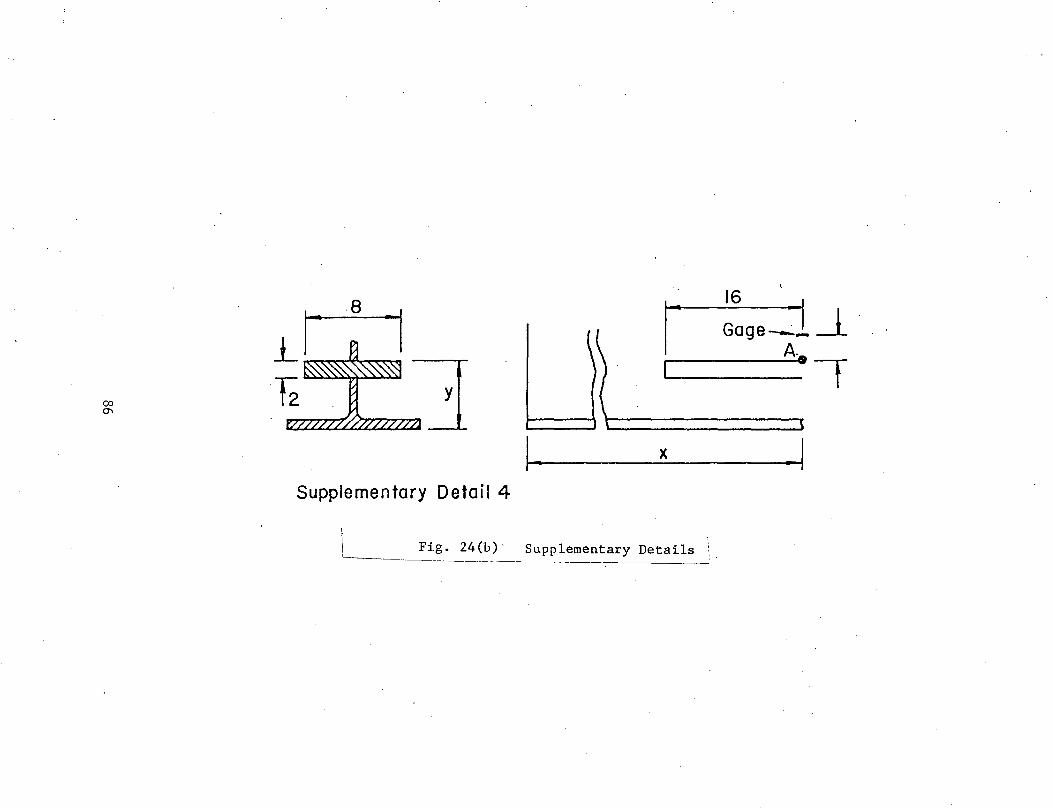
00 0'1
Supplementary Detail 4
Fig. 24(b) ·
1- X
Supplementary Details I I.
16 .•
Gage--=1 _I_ · A.
-I
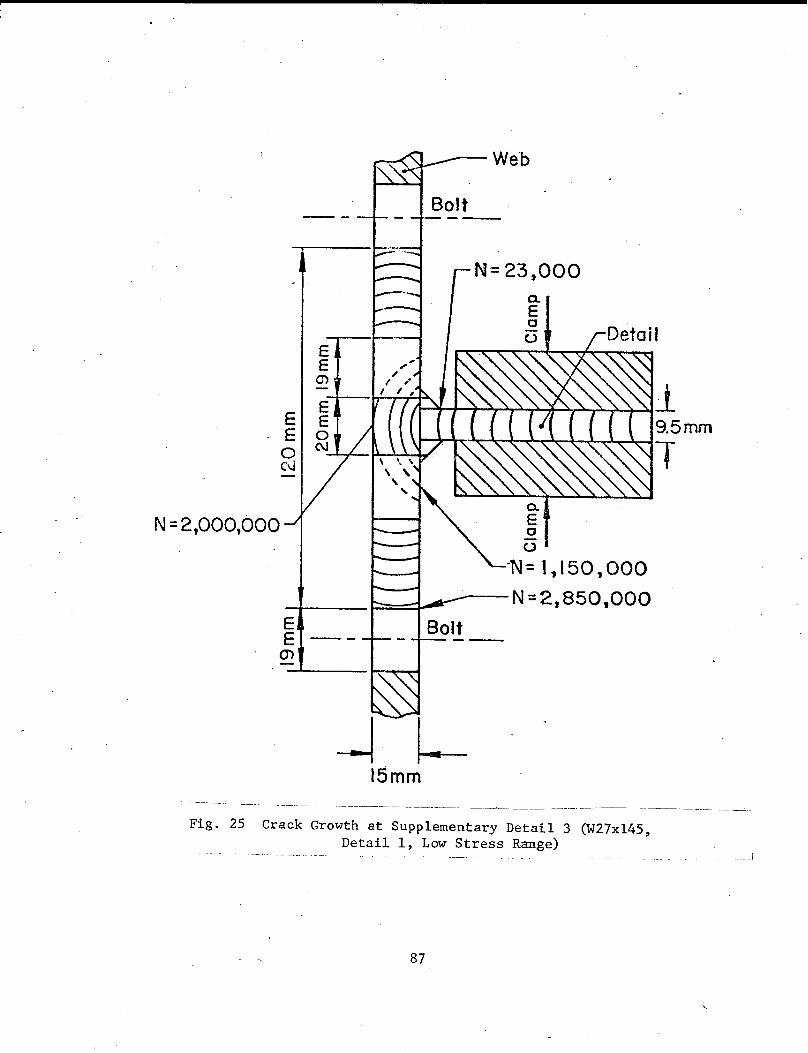
N = 2,000,000
E E 0 C\l
E E
(J')
N= 23,000
0. E 0 ()
·N = t , 15 0 , 00 0
--~---- t:::=~- ---N = 2, 850,000 E E -m
15mm -- ---- -- ------ - -~-----~- --- ---~------ ----- ------------------------------~----~.
Fig. 25 Crack Growth at Supplementary Detail 3 (W27xl45, Detail 1, Low Stress Range)
87

Fig. 26(a) First State of Crack Growth
I I I I
· I I I
at Supplementary Detail 1 Toe (W27xl45, detail 1, high stress range)
88
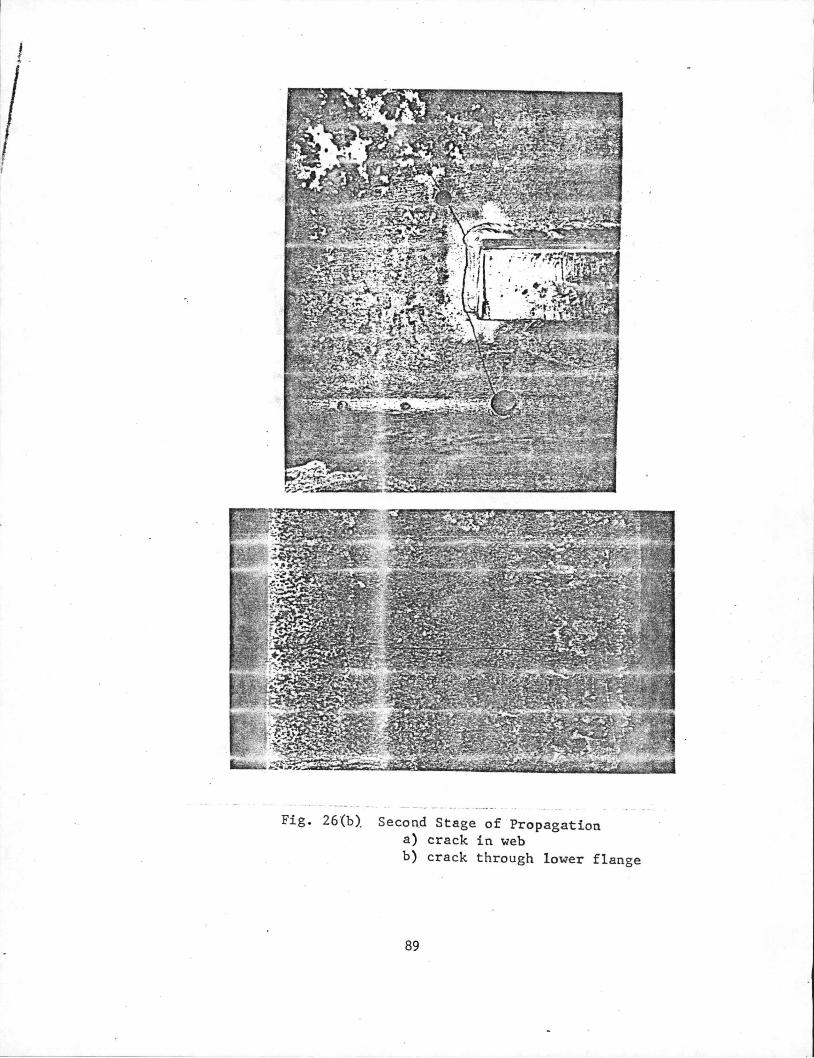
Fig. 26{b). Secon.d Stage of ·Propagation a) crack in web b) crack through lower flange
89

Fig. 27 Through-Thickness Prop~gation at Weld Toe of Supplementary Detail 1
(W27xl45, detail 2, low stress range)
90

;:: · . ."·.: : ... ~ r. : '
i . :: ; ~~- :~- ·-· -~ t"_i{ • .J •
Fig. 28 Cracks at Web-to-Supplementary Detail ·! Weld Toe (27xl45, detail 2, high stress range)
91

Dial Gage.3
. 125
L_____.__ ,
Dial Gage I 2
Bracing Members
I
I I I
. -----------·-- ·-·---·---·--··---·-··-·------··-·------·--·--1
__ Fi!: -~~-~~er~~e~t-~=-~~~d~-- of Ga~-~=~~c-~------·-·--·J
92

-------·--~ ------~-~· -·--·-·· -- --·-·--------··--···-·----------------·---··
Fig. 210 Measured Gaps ---·--------·· --·---- ~-------------------·--------- --
93
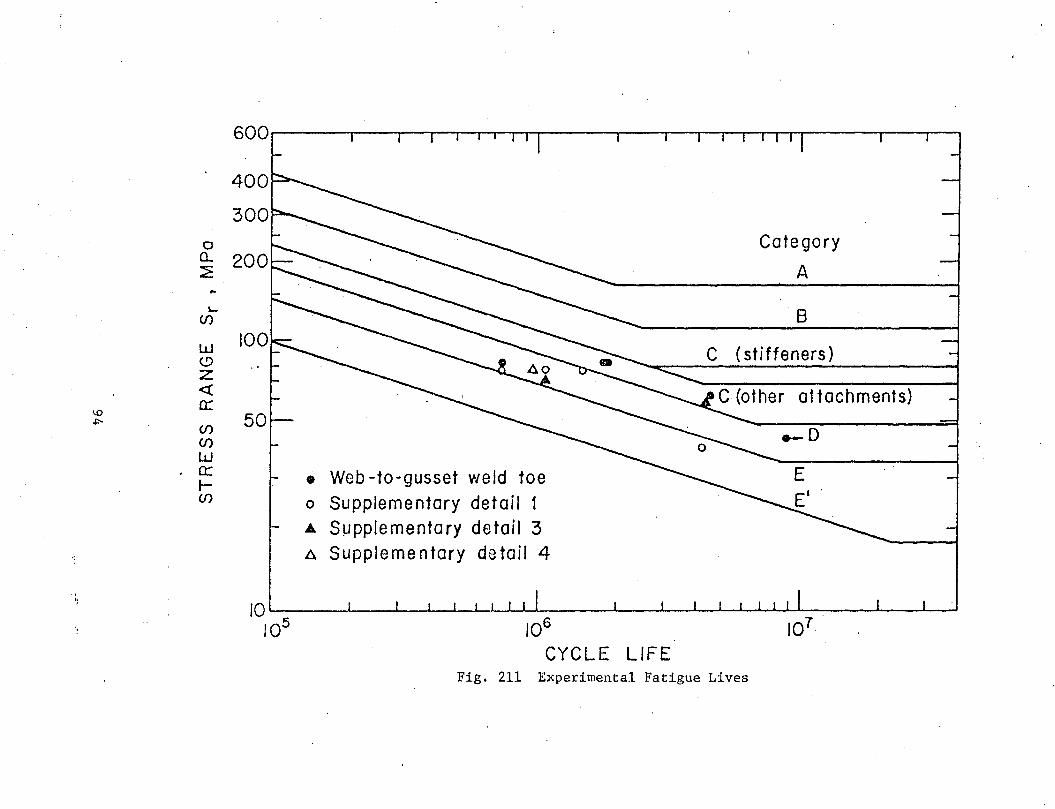
---------
0 a.. 2
'-(/)
w (.!)
z <(
\0 0:::
.&:--(f) (f)
w 0::: 1-(f)
., •;
50
• Web -to-gusset weld toe
o Supplementary detail 1 .A S!Jpplementary detail 3 A Supplementary de tail 4
Category
A
8
C (stiffeners)
C (other attachments)
._o
E
10~----~--~~~~~~~----~--~~~~~~------~--~
105 106 107 .
CYCLE LIFE Fig. 211 Experimental Fatigue Lives

1 External Loads
2D ff1 coarse mesh of full half-beam I Node Displacements
y
2D /!2 discretization of central
part of the beam
1 Node Displacements
2D /!3 fine mesh of
selected detail
1 Node Displacements
3D mesh of selected detail 1 Node Displacements
20 /!4 fine mesh in a
selected plane through previous 3D mesh
1 Node DisplacementS
20 //:5 ultra-fine mesh of the detail
! SCF
Fig. 32 Theoretical Investigation Procedure
96
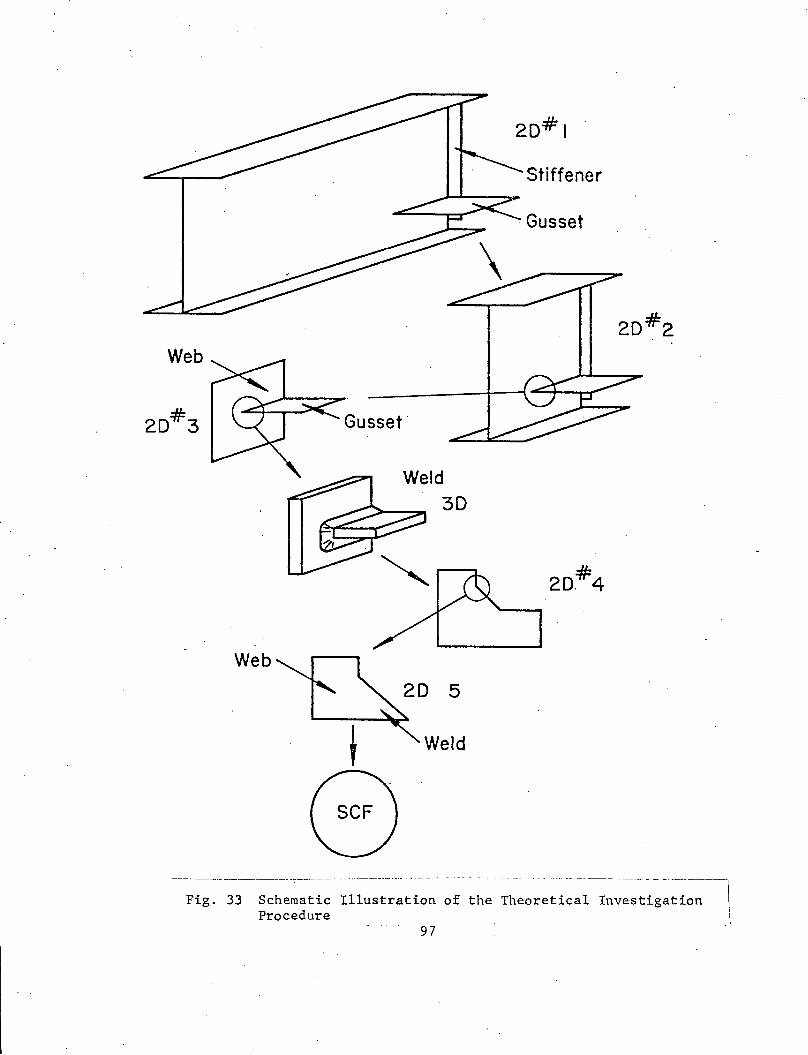
Web
Web
Gusset·
Weld 3D
5
Weld
Stiffener
·Gusset
20.#4
---;ig·~---3-3--~c~~~at~:--;~~~-~-r=t~::-~~- ~he ~~eo~eti~~l~nv~~-t~-~~~-~::---~ Procedure \
97

E E
r<> 0 C\J
E E ~ lO
1 T
a
c
Detail
a
Detail 2 J. '
Stiffener E E
Web C\J
a 0
Detail 3
~,~-________ 6_0_9_m_m __ ~-----
----------- -----1 Fig. 31 . Selected Details and Critical Locations 1
!
95

Fig. 35 (continued) Two~Dimensional Analysis of the Girder Central Part
' in Case of Detail 2
100
I .
'
-· .... .. ~ ...
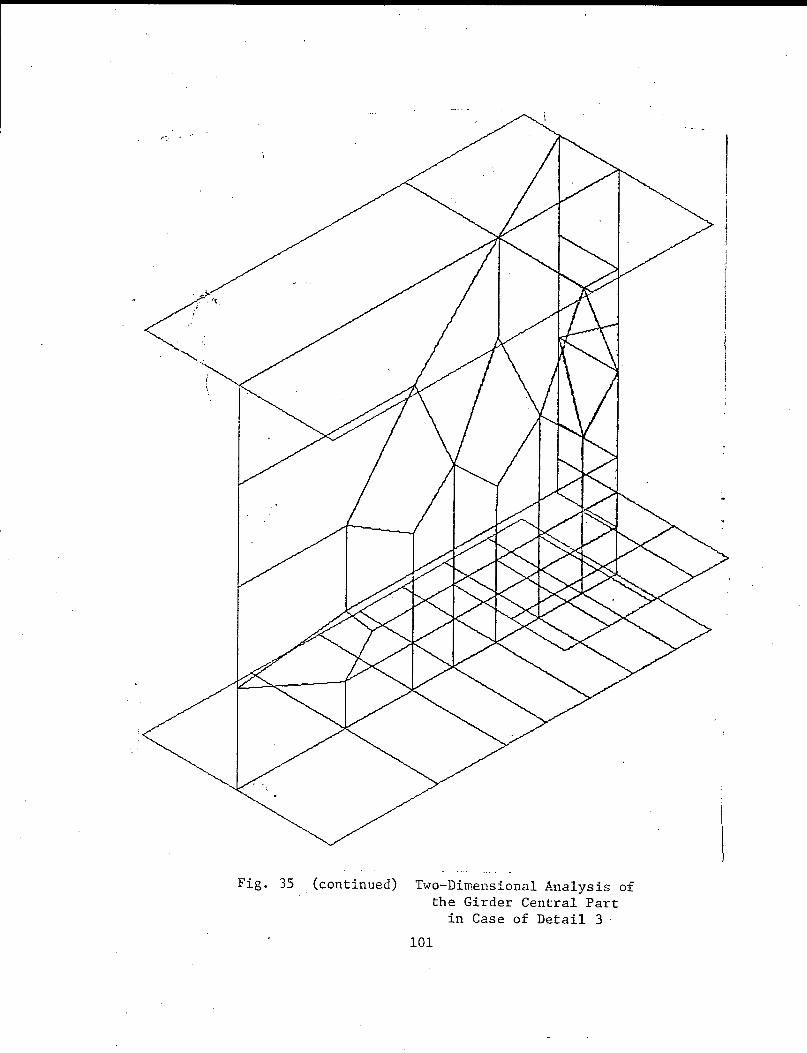
- /'• ~- ..
.............
Fig. 35 (continued) Two-Dimensional Analysis of the Girder Central Part
in Case of Detail 3 ·
101

- - -- - ----------
Fig. 36 Two-Dimensional Analysis of Critical Location a in Details 1 and 2

.-':
Fig. 36 (continued) Two-Dimensional Analysis of the Heb-to-Gusset Held (critical location a) in Detail 3
-- ------------
-------------------

Gusset Plate
(a)
( c ) 0
Gusset -·---------------------------·--··----------- ___ Plate·-.
Fig. 37 Three-Dimension Analysis (a) Critical Location a, details 1,2,3 (b) Critical Location b, details 1,2 (c) Critical Location c, details 3
106
2
Web
(b)
3mm
I. I

-- - ------ ------------,
Fig. 38 Idealization and Discretization of a Weld Toe
107

Fig. 39 Numbering Pattern for Cubic and Skewed Elements
108

/ /
-Weld
Plane of the 20 Analysis
Fig. 310 Example of Selection of a Section in a 3D Discretization for further 2D Analysis
109

v ' [7
I/ I/ '
I/ I/
I/ v v I/
' ;
-----··- ------ -------------. ------------ -~------- ----
Fig. 311 Two-Dimensional Analysis of Critical Locations a and b

~ ~
r~ <
~
1/ v v v .. ~.
Fig. 311 (continued) Two-Dimensional Analysis of Critical Location c
111

'
0.8
.
- r-- r- -r- t--t--t--- f- - ....._ r--~
~ ---r-t- -r-1'-/ I.._
v 1-r-~~ ...
v 1--- I-r-1"---r- i\2 / t-t' _..- r--.. 1.5 / v ['...
r- ""' I T --f-
-~ \ v -~ 2.0 -If v l v ' ~r-~ ~-)· f\r-., I
··-[] )
0 I 2 3mrn SeeEnloG Weld I I I I Fig. 312 SCF Contours for Critical Location a in Detail 1 (large scale)
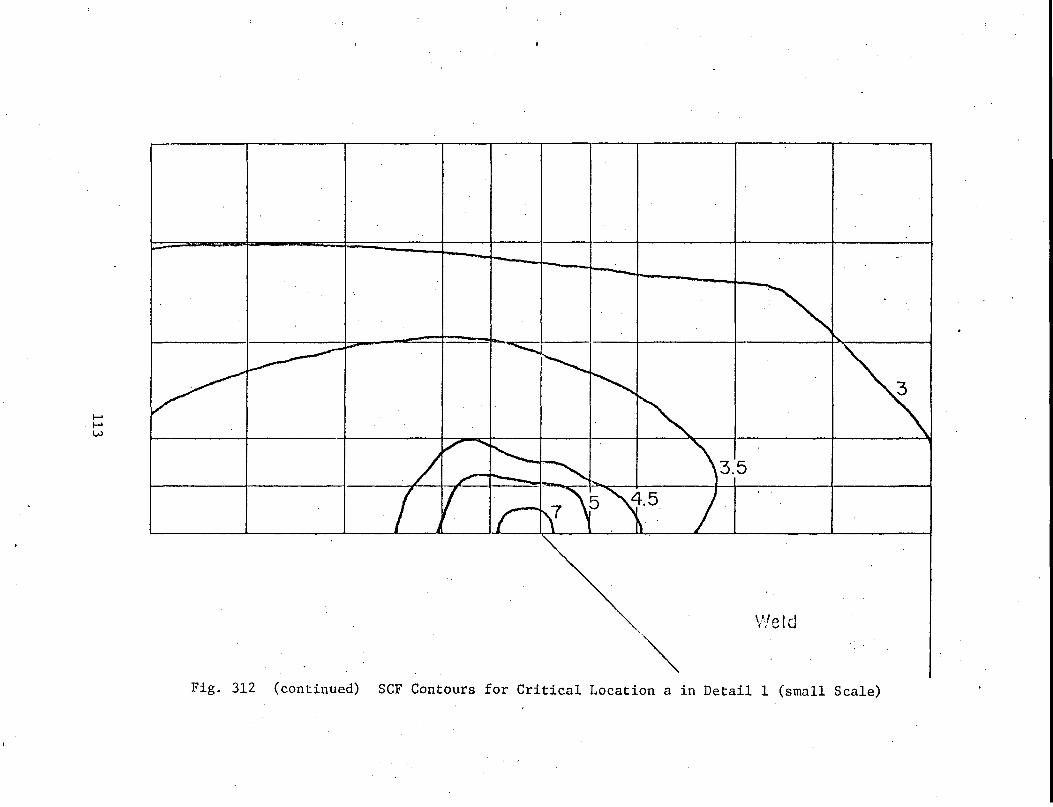
I-' I-' w
-~
~ 1--
l~ v "' "" / 7"" '-..... \\3.5
/ ~ ''-
1 v r\7\5 '1·5 J ' '
' I
\'Je I d
·~ Fig. 312 (continued) SCF Contours for Critical Location a in Detail 1 (small Scale)
--
3

-------
0.5 --I ..
'
1.0
---- ----v v "'. v /
--- ......-l..--"'
~~- ---...... ~-~ / _/
--- ~5 ~ / ---- ....... _...
I --- '\ \ / I I P: ----...._, \21 \ l I \ ~ I \ I
0 I I 3mm I I See Enlargement
Weld Fig. 313 SCF Conto rs for Critical Location b in Detail 1 (large scale)

I
I 2.7 !
/ .-"'
~ / v ~--
/t/ •. -" v v ~ ~0 ___...
~ - -... ,-
_, v
"\ - 1---l.--"
' ,r ~3.5 L ~ r-- -v
I v· / '"' 4.0 / r-.... -r--
/_ l .. "' ---- ,-
' I i -~·Cf _[ !"\ I_'-j I
Weld 0.1 mrn I
Fig. 313 (continued) in Detail 1 (small scale)

-137.90MPa
0
137.90MPci
See Enlargement
Upper Side
Lower Side
0 I
Gusset Plate ·
Direction of
the Stresses
2 I
3mm I
Fig. 314 Stress Contours in Critical Location c in Detail 1 (large scale)
116

-689.50MPa
-620.55MPa
0
0 0·
--~----------- --------- ~---------- ---- ~------
Upper Side
16.67
15.00
lmm
Fig. 314 (continued) Stress Contours in Critical Location c in Detail 1 (small scale)
117
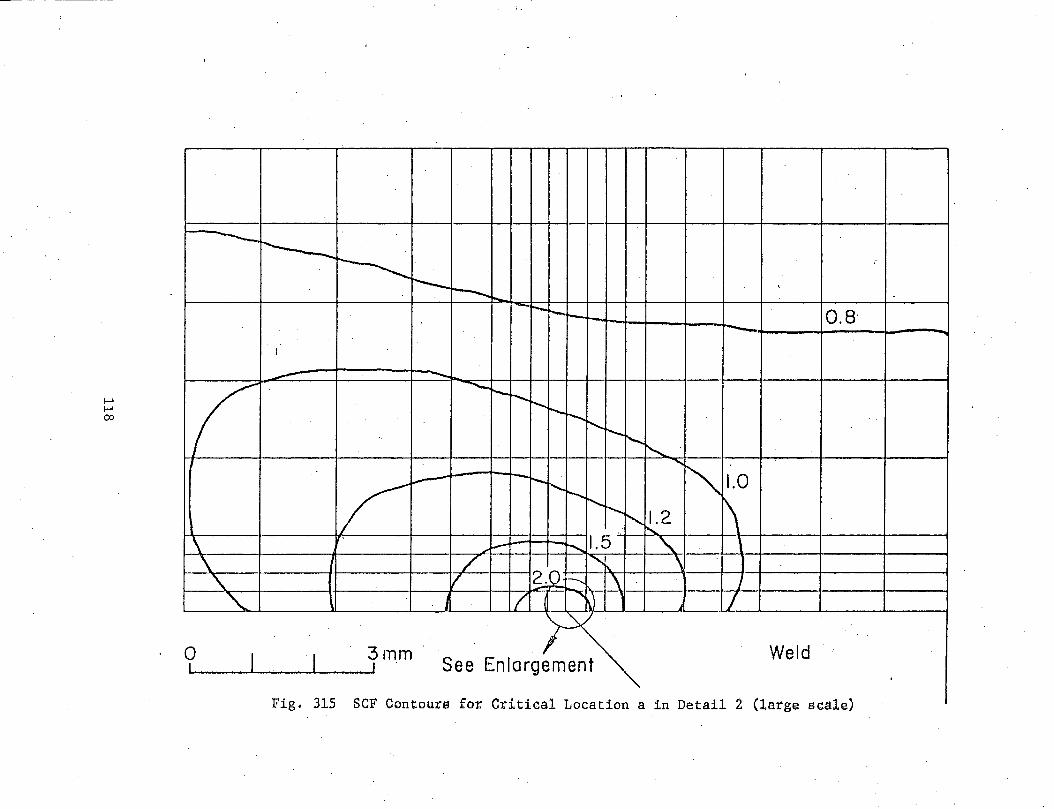
-----1------~
..
t---r--- .... '·
r- t- 1-- 0.8
. I
~ ---(
...._ ..._ -..... r-. r- -..... r--.... r- '-....
r---.... ""
"" l.---- -~ 1.0
/ "" r--. "~"---!'-. 1.2 ~ r--... \ ~ r........ 1.5 ' 1
\ / ,, \
~ 1/ 2_& r- \ J
" j I ~) 1 J I
0 I I 3mm See Enlarg~ Weld
I I
. . F1g. 315 SCF Contours for Cr1tical Locat1on a 1n Deta1l 2 (large scale)
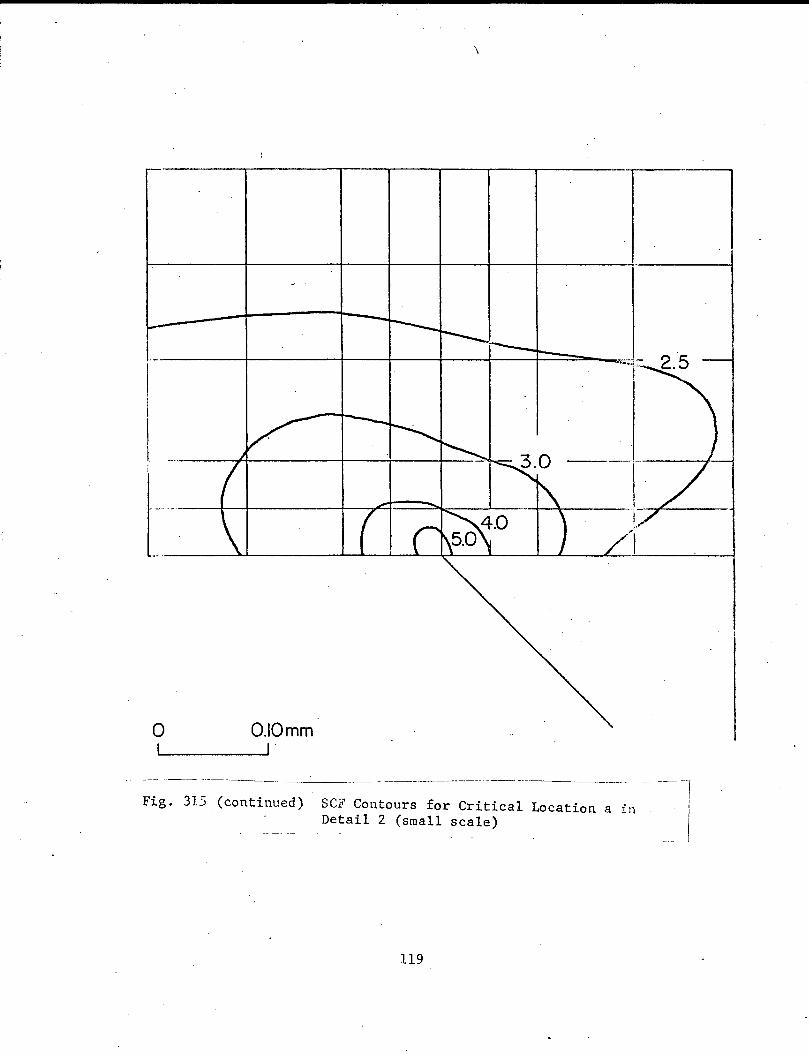
\
0 O.IOmm
---------··----·- -·---~---------------- ----
---, I ----,A~----1
'I
Fig. 315 (continued) SCF Contours for Critical Location a in Detail 2 (small scale)
119
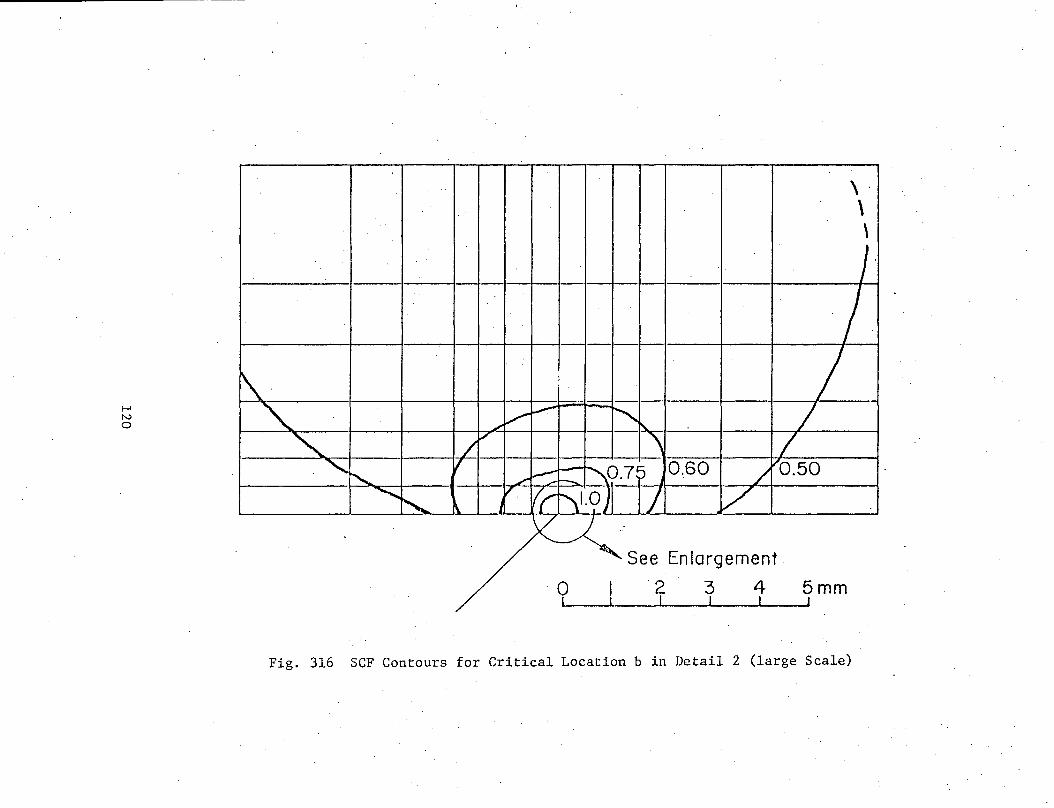
I-' N 0
\ .
\ \
I
/ ~·
: I " v ~ I'-. I .;' ~
~ / v
' I ' If 0.7? 0.60 v0.50
' _/ ~ f-- /
""" / l[ f'\1.0 J v ~ ~ I
..
See Enlargement
0 T ! 2 1 =t 1 ~mm
Fig. 316 SCF Contours for Critical Location b in Detail 2 (large Scale)
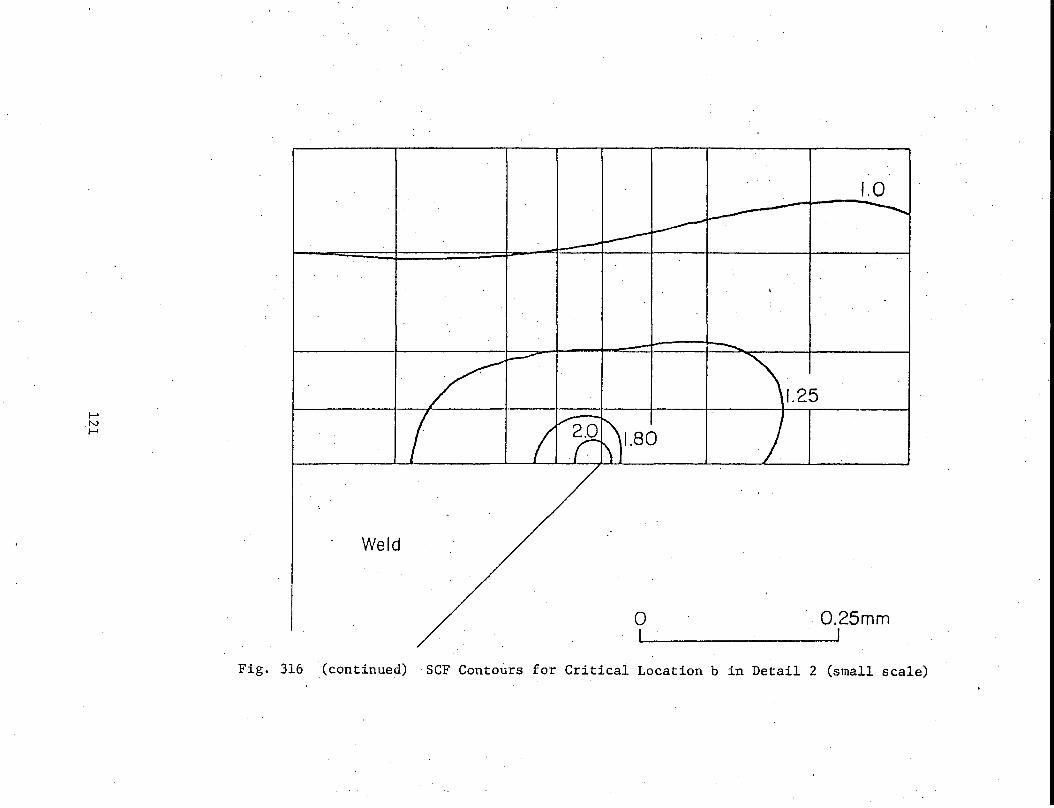
f-' .N f-'
1.0
1.25
1.80
Weld
0 . 0.25mm
Fig. 316 (continued) SCF Contours for Criticai Location b in Detail 2 (small scale)

I-' N N
I 7 I I
17
0 I
I
I
0.8
'·
-----1-----_._
1.0
v r--- r....... r--.. t-.... r-... 1'--~ ~ 1.2 .........
I 1.5 ~
~ v ~ I -..r--... r-...... 1\ / ·. 1.7 r--1--r..... ~ __., 1-=-t:: ......... -::-. ~
/ 7 2 ~ ~ \ f-
/ 1/ 7Vr2J-....... 1'---. ['\.
1/ J B ~ "\ 1\ J
7 l7 If 7 I J fi\ [\
I 3rnm I
Weld See Enlargement
Fig. 317 SCF Contours for Critical Location a in Detail 3 (large scale)

.f-' N w
-~-
--- ~0 -----
1- ~ v- ......
~ ~ / ~3.5 v ""-- . \
I ---.... ~ ~· / --.......
II 1/ /flJ7.~)5.0 D4.5 J
0 O.lmm L J.
Fig. 317 (continued) SCF Contours for Critical Location a in Detail 3 (small scale)

----- ----------- - ---. ----------- ------------- ------------------ ---------------, Fig. 318 Elliptical Crack Embedded in an Infinite Body Subjected
to Uniform Tensile Stress ---------~---- -- ------·------------· ___ __,__ _____ _
124

Crac~
Fig. 319
o-yield -
Original Elastic Stress Distribution
/
. Stress Field After ~ Small Amount of
, Yielding ~
::--... ~
~-. ~~
_____ __tno~inal X
Plastic Zone
b= d7T(~~J) Stress Distribution at Crack Vicinity
-------------~~------ -~--------, i
----· -------------------- - --- ---·--- --
125

Assumed Crack Path
Actual Crack
Minimum Principal Stress Trajectory
Applied Stress
<;:::=:::::===:1
--- --- -----~ -~------- ------------
. _c_~ig. __ :zo ___ ~~-~~~~a~-~-----· -. ___ -------=--=]
126
-fJ) Q)IJ) IJ)Q) IJ)C :::l ..X:
(!) .o .c.
51--.aQ) Q)-
3:~ a_

I I a
1 I I
p I p
I -I
p I p
\ ......
- -- -------------------- --------------- -------1 Fig. 321 Albrecht's Crack Loading i
----------~~-~----~------ -- ----~-------- --------- --------------~------------···----·
----- ---·-···
127
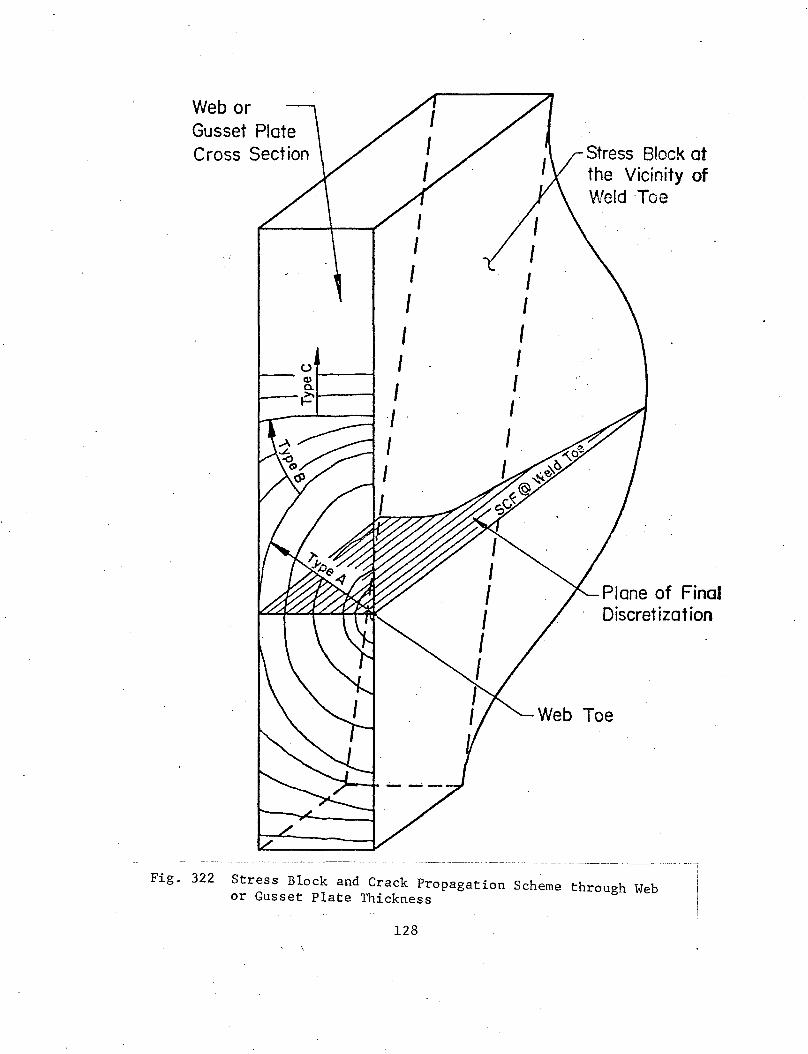
Web or Gusset Plate Cross Section Stress Block at
the Vicinity of Weld Toe
Plane of Final Discretization
Fig. 322 Stress Block and Crack Propagation Scheme through Web or Gusset Plate Thickness
128 ' \

-· ' ~a
"" 8
6 I~ """ r"-.
' SCF
4
-.. ... ~ ------ '---
2
0.5 1.0 1.5 2.0
WEB THICKNESS (em)
----~----~--~------- ---~----~------------------~-----~----------------
Fig. 323 Effect of Web Thickness on Maximum SCF at Critical Locations a and b
----------- ------------ -- ---··----- ------------------------------ ~- - --- - ---~----~-------
129

Gusset Plate
~-------------- ----------- -:--·------- ----------- ------------~----------------------~
Fig. 324 Parameters of the Gusset-to-Bracing:~embe_~~-Co~nection _I
130
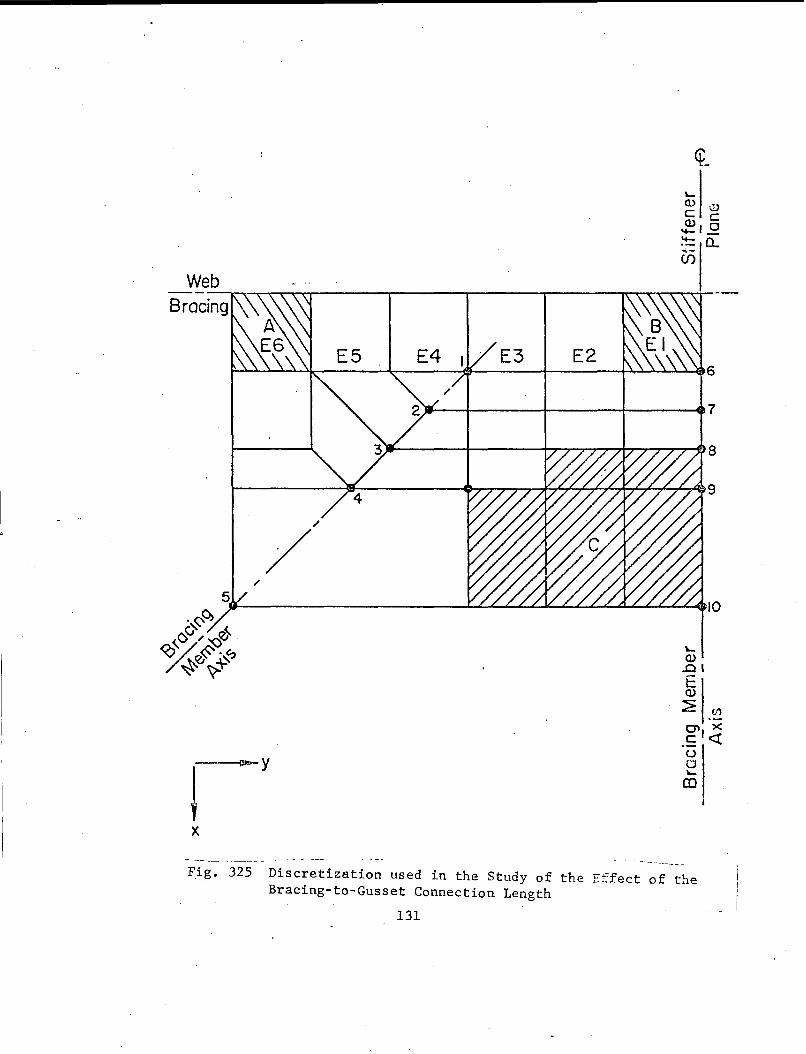
/
/ /
'-0) \!.)
c c a.>,o ---o..
..;.-
CJ)
'Q)
..0' E Q)
~ (/)
0'11 X .s <X: u 0 '-en
Fig. 325 Discretization used in the Study of the Effect of the Bracing-to-Gusset Connection Length
131
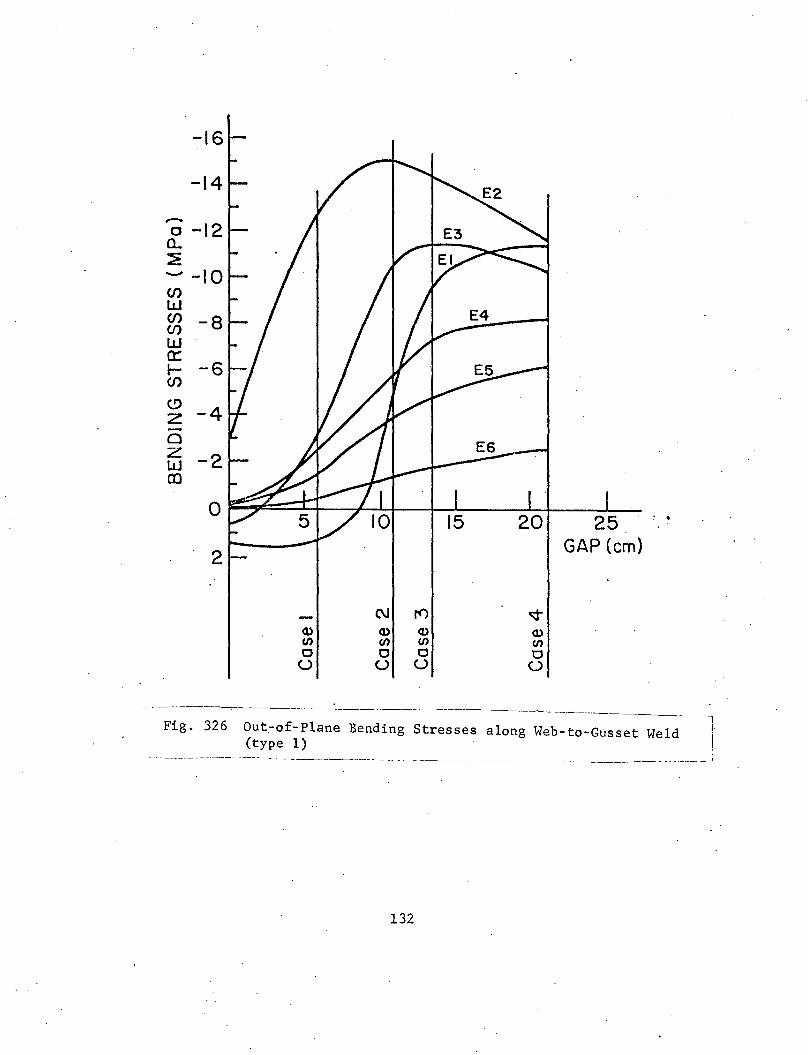
-16
-14
-c -12 a.. ~ --10 (/) w (/) (/)
w a::: rC/)
(!)
z 0 z w en
Q) (/J
c ()
(\J r<> Q) Q) (/J (/J
c c 0 0
20
~ Q) (/)
c ()
25 GAP (em)
- ---- --------:------------~---- ------------·--- ____ _,__
. .
Fig. 326 Out~of-Plane Bending Stresses along Web-to-Gusset Weld (type ·1)
-l I
--------- .. ---_I
132

-10
~ -8 Q_
:2 ........ -6 (J) w ~ -4 w o::· 1-- -2 (J)
(!)
z 0 z w en
5 15 20 GAP (mm}
C\1 t() <l) <l) C1) en en en 0 0 0
(.) (.) (.)
-----·--·-- ____ , ______ -------·-··-------·--··- ---- ----·---------, Fig. 326 (continued) Out-of-Plane Bending Stresses along Web-to-
.. Gusset Weld (type 2) i ---------- ~------· -· --------- ·---- ---- ------- ------------------ ___ I
133

Fig. 327 Special Gusset Plates \ ------------ ·--- ----------- --c------J
134

3
Me'mber B
Ill 10
270cm
9 8
' X
~
I I
I~
E u
lO 0
·C\1
'h-y
- -~-~--------------- ------------------- ------- -------- ------ ------- -i
Fig. 328 Discretization used in the Study of the Effect of Relative ; Stiffness of the Two Parallel Girders ·
l35

~z
---------=t~--- ---f.----~-- t
--I I
-- - -- -- ------I __ ..J_ __
__ J.. --L 1• + --- --\
cp, --'\ - --- ...... - ........ ..._
\ ---\ \ ----
- -~,~ --~ I \ ~--------~~~--~~-~--~---"-----------------~ \ ,.."' ......... ...-J .
/ ...__ ....:_ -- \ - ....l.._.,
~.,
.,""
Critical Parameter:
----- -- -- ------------------------ - -··------ ------ --- ------ ---·---
Fig. 329 Definition of Critical Parameter ~
136
Cl) c -o 0·
u-·-0. t~-<1>
....... (1J .
.... 0 ..
Cl)
c 0 -0 -0 0::
·c .Q -c;o,
::J E . -'uo <il;·
0
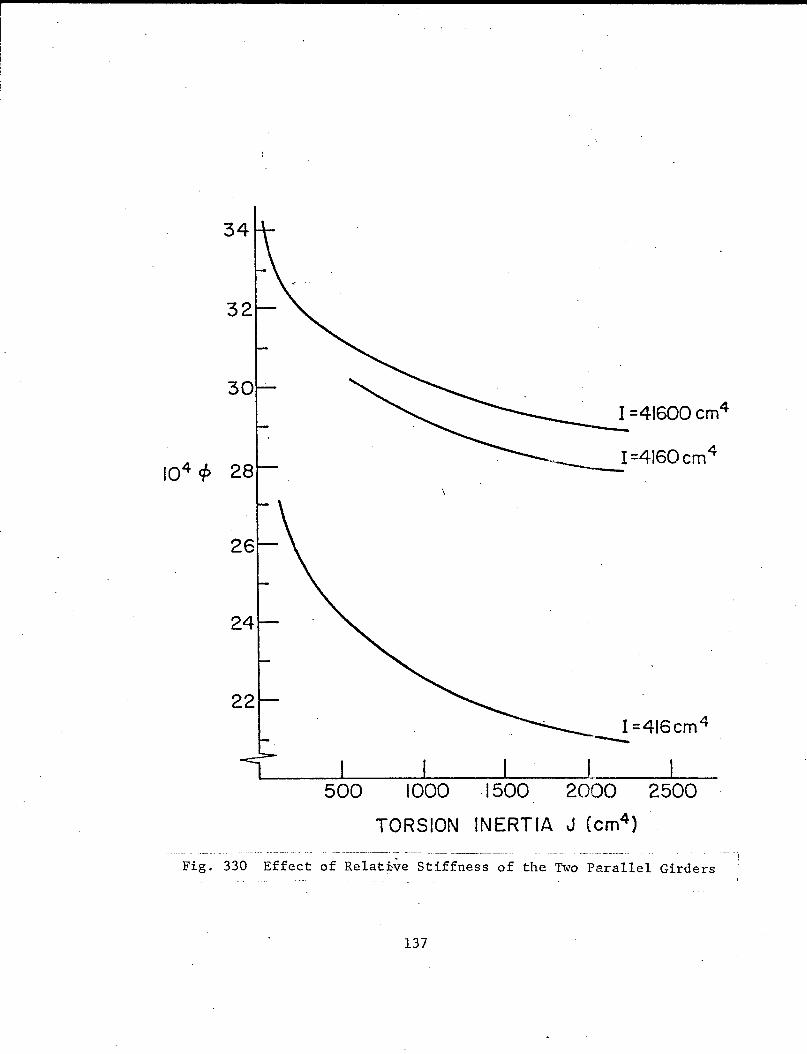
Fig. 330
I =41600cm4
.. ___ I =4160 em 4
'------'---L----5~0~0----10~0-0~-.~,5~0~0~-2~000 2500
TORSION INERTIA J (cm4 )
- --~
Effect of Relative Stiffness of the Two Parallel Girders '
137
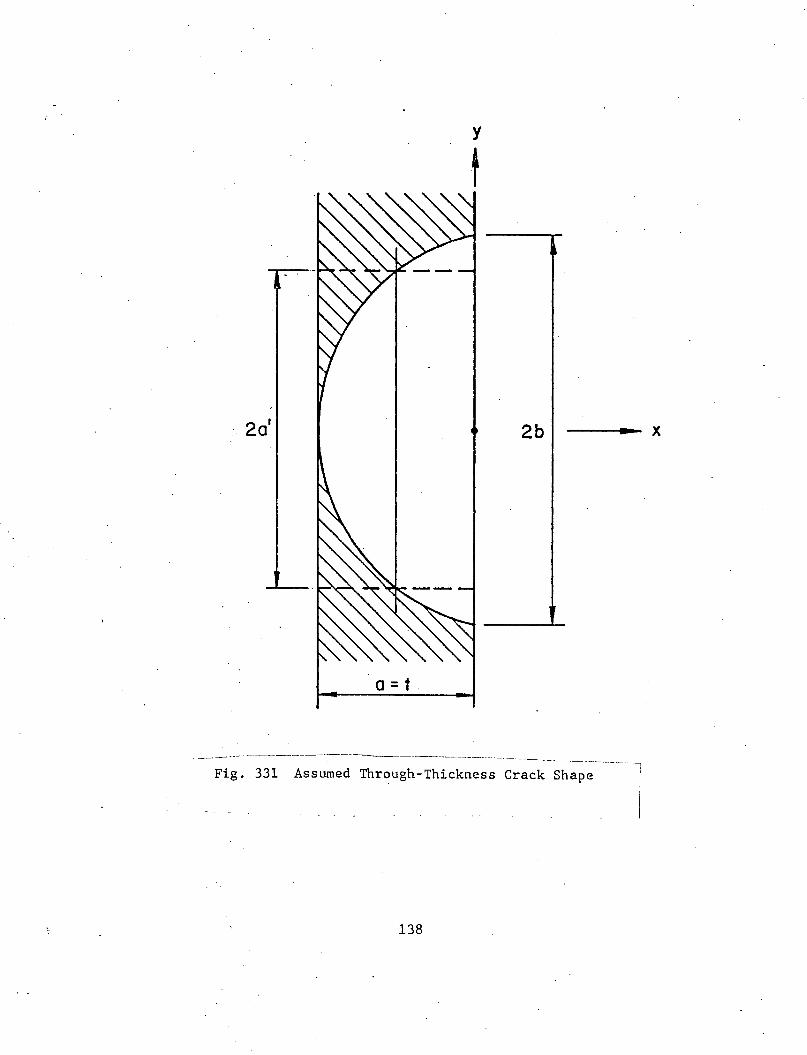
y
t
·2a' 2b
a= t
+ - ------------------------- ------- ·-·------ ----
Fig. 331 Assumed Through-Thickness Crack Shap~---~, i i I
138
X

6. REFERENCES
1. Fisher, J. W., Frank, K. H., Hirt, M. A. and McNamee, B. M. EFFECT OF WELD}fENTS ON THE FATIGUE STRENG:LH OF STEEL BEAMS, NCHRP Report No. 102, Highway Research Board, National Academy
·of Science, National Research Council, Washington, D. C., 1970 .
. 2. Fisher, J. W., Albrecht, P. A., Yen, B. T., Klingerman, D. J • .:md McN.::.r:1ee, B. M., FATIGUE STRENGTH OF STEEL BEAMS WITH w'ELDED STIFFENERS AND ATTACHMENTS, NCHRP Report No. 147, Transportation Research Board, National Research Council, Washington, D. C., 1974.
3. Standard Specifications for Highway Bridges AASHTO, Washington, D. C., 1978.
4. Fisher, J. W. BRIDGE FATIGUE GUIDE - DESIGN AND DETAILS, AISC, 1977.
5. Paris, P. D., Gomez, M. P. and Anderson, W. E. A RATIONAL ANALYTICAL THEORY OF FATIGUE, The Trend in Engint:coring, University of Washington, Vol. 13, No. 1, January 1961.
6. Zettlemoyer, N. STRESS CONCENTRATION AND FATIGUE OF WELDED DETAILS, Ph.D. Dissertation, F.E.L., Lehigh University, 1976.
7. Alhrecht, r. and Yamada, K. RAPID CALCULATION OF STRESS INTENSITY FACTORS, Paper submitted for publication in the Journal of the Structural Division, ASCE.
8. Bathe, K-J., Wilson, E. L. and Peterson, F. E. SAP IV - A STRUCTURAL ANALYSIS PROGRAM FOR STATIC AND DYNAMIC RESPONSE OF LINEAR SYSTEMS, Earthquake Engineering Research Center, Report No. EERC 73-11, June 1973; revised April 1974, College of Engineering, University of California, Berkeley.
9. Irwin, G •. R. THE CRACK EXTENSION FORCE FOR A PART THROUGH CRACK IN A PL ... I\TE, Transactions, ASME, Journal of Applied "Hechanics, Vol. 29, No.4 , 1962.
10. Shah, R. C., Kobayashi, A. s. ON THE SURFACE FLAW PROBLEM, Proceedings, Winter Annual Meeting of the American Society of Mechanical Engineers, New York, N.Y., November 1972.
139
11. Boyer, K. D., Fisher, J. W., Irwin, G. R., Roberts, R., Krishna, G. V., Morf, U. and Slockbower, R. E. FRACTIJRE ANALYSES OF FULL SIZE BEAMS WITH WELDED LATERAL
ATTACHMENTS, Federal·Highway Administration, FHWA-RD-77-170, December 1977 •.
12. Maddox, S. J, AN ANALYSIS OF FATIGUE CRACKS IN FILLET WELDED JOINTS, International Journal of Fracture Mechanics, Vol. 11, No. 2, April 1975, p. 221.
13. Tada, H. and Irwin, G. R. K-VALUE ANALYSIS FOR CRACKS IN BRIDGE STRUCTURES, Fritz Engineering Laboratory Report No. 399-1, Lehigh University, Bethlehem, Pa., June 1975.
14. Rolfe, S. T. and Barsom, J. M. FRACTURE AND FATIGUE CONTROL-IN STRUCTURES- APPLICATIONS OF FRACTURE MECHANICS, Prentice-Hall, Inc., Englewood Cliffs, New Jersey, 1977.
15. Tada, H., Paris, P. C. and Irwin, G. R. THE STRESS ANALYSIS OF CRACKS HANDBOOK, Del Research Corporation, Hellertown, Pa., 1973.
16. McEvily, A. J., Jr. ON THE ROLE OF DEFECTS IN CRACK INITIATION IN WELDED STRUCTURES, Proceedings, Japan-U.S. Seminar on Significance of Defects in Welded Structures, Tokyo, 1973.
17. Signes, E. G., Baker, R. G., Harrison, J. D. and Burdekin, F. M. FACTORS AFFECTING THE FATIGUE STRENGTH OF WELDED HIGH STRENGTH STEELS, British Welding Journal, Vol. 14, March 1967.
18. Watkinson, F., Bodger, P. H. and Harrison, J, D. THE FATIGUE STRENGTH OF STEEL JOINTS AND METHODS FOR ITS IMPROVEMENT, Proceeding~, Fatigue of Welded Structures Conference, The Welding Institute, England, July 1970.
19. Fisher, J. W. and Irwin, G. R. FRACTURE ANALYSIS OF FLAWS IN WELDED BRIDGE STRUCTURES, Proceedings, Japan-U.S. Seminar on Significance of Defects in Welded Structures, Tokyo, 1973.
20. Barsom, J. M. FA~IGUE CRACK PROPAGATION IN STEELS OF VARIOUS YIELD STRENGTHS, U. S. Steel Corporation, Applied Research Laboratory, Monroeville,.Pa., 1971.
140
21. Bardell, G. R. Kulak, G. L. FATIGUE BEHAVIOR OF STEEL BEAMS WirH WELDED DETAILS, Structural Engineering Report No. 72, Department of Civil Engineering,; the University of Alberta, Edmonton, Alberta, September 1978.
22. · Hirt, M. A. and Fisher, J. W. FATIGUE CRACK GROWTH IN WELDED BEAMS, Engineering Fracture Mechanics, Vol. 5, 1973, p. 415.
23. Maddox, s. J. FATIGUE CRACK PROPAGATION DATA OBTAINED FROM PARENT PLATE, WELD METAL AND HAZ IN STRUCTURAL STEELS, Welding Institute Report No. E/48/72, Cambridge, England, 1972.
24. Maddox, S. J. ASSESSING THE SIGNIFICANCE OF FLAWS IN WELDS SUBJECT TO FATIGUE, Welding Journal, Vol. 53, No. 9, September 1974.
25. Maddox, s. J. AN ANALYSIS OF FATIGUE CRACK IN FILLET WELDED JOINTS, International Journal of Fracture, Vol. 11, No. 2, April 1975.
26. Popov, E. P. MECHANICS OF MATERIALS, Prentice-Hall, Englewood Cliffs, New Jersey, 1952.
141
:f""


![FATIGUE CLASSIFICATION OF WELDED JOINTS IN ...loading given in the UK bridge design code, BS 5400 part 10 [British Standards Institution, 1980] with stresses and fatigue classification](https://static.cupdf.com/doc/110x72/5e66df2c423ec955dc042e62/fatigue-classification-of-welded-joints-in-loading-given-in-the-uk-bridge-design.jpg)


