Helium-Hyperoxia, Exercise and Respiratory Mechanics in Chronic Obstructive Pulmonary Disease
Neil D. Eves1, Stewart R. Petersen1, Mark J. Haykowsky2, Eric Y. Wong3 and Richard L. Jones3
1Faculty of Physical Education and Recreation, University of Alberta, Edmonton, Alberta, Canada T6G 2H9
2 Faculty of Rehabilitation Medicine, University of Alberta, Edmonton, Alberta, Canada T6G
2G4
3 Faculty of Medicine and Dentistry, University of Alberta, Edmonton, Alberta, Canada T6G 2B7
Requests for reprints: Neil D. Eves, Faculty of Kinesiology, University of Calgary, 2500 University Drive NW, Calgary, Alberta, Canada, T2N 1N4 Corresponding Author: Neil D. Eves, Email: [email protected] Fax: (403) 284 3553 Phone: (403) 220 2413 Running Head: Helium-Hyperoxia, Exercise and COPD Descriptor Number: 55 Word Count (Manuscript Body): 4394
This article has an online data supplement, which is accessible from the issue’s table of content online at www.atsjournals.org
AJRCCM Articles in Press. Published on July 13, 2006 as doi:10.1164/rccm.200509-1533OC
Copyright (C) 2006 by the American Thoracic Society.

1
ABSTRACT
Rationale: Hyperoxia and normoxic-helium independently reduce dynamic hyperinflation and
improve the exercise tolerance of patients with chronic obstructive pulmonary disease (COPD).
Combining these gases could have an additive effect on dynamic hyperinflation and a greater
impact on respiratory mechanics and exercise tolerance. Objective: To investigate whether
helium-hyperoxia improves the exercise tolerance and respiratory mechanics of COPD patients.
Methods: Ten males with COPD (FEV1 = 47 ± 17%pred [mean±SD]) performed randomized
constant-load cycling at 60% maximal work rate breathing air, hyperoxia (40%O2, 60%N2),
normoxic-helium (21%O2, 79%He) or helium-hyperoxia (40%O2, 60%He). Measurements:
Exercise time, inspiratory capacity (IC), work of breathing and exertional symptoms were
measured with each gas. Results: Compared to air (9.4 ± 5.2 min), exercise time was increased
with hyperoxia (17.8 ± 5.8 min) and normoxic-helium (16.7 ± 9.1 min) but the improvement with
helium-hyperoxia (26.3 ± 10.6 min) was greater than both these gases (p=0.019 and p=0.007,
respectively). At an isotime during exercise, all three gases reduced dyspnea and both helium
mixtures increased IC and tidal volume. Only helium-hyperoxia significantly reduced the
resistive work of breathing (15.8 ± 4.2 vs. 10.1 ± 4.1 L·cm H2O-1) and the work to overcome
intrinsic positive end-expiratory pressure (7.7 ± 1.9 vs. 3.6 ± 2.1 L·cm H2O-1). At symptom-
limitation, tidal volume remained augmented with both helium mixtures but IC and the work of
breathing were unchanged compared to air. Conclusion: Combining helium and hyperoxia delays
dynamic hyperinflation and improves respiratory mechanics, which translates into added
improvements in exercise tolerance for patients with COPD.
Key Words: Dynamic Hyperinflation, Dyspnea, Work of Breathing, Pulmonary Function,
Expiratory Flow Limitation. (Word count for abstract: 250)

2
INTRODUCTION
Patients with chronic obstructive pulmonary disease (COPD) exhibit a reduced exercise capacity
(1-5) and often curtail exercise due to severe dyspnea (2, 5). In recent years, a growing body of
evidence (2, 3, 6-8) has identified a strong relationship between the degree of dynamic
hyperinflation and the intensity of breathlessness experienced by these patients. Due to the
expiratory flow limitation that is characteristic of COPD, end expiratory lung volume (EELV)
rises during exercise and end inspiratory lung volume (EILV) encroaches on total lung capacity
(TLC) in an attempt to augment or maintain tidal volume. The resulting dynamic hyperinflation
reduces lung compliance and increases the elastic work of breathing, while placing the
respiratory muscles at a mechanical disadvantage to generate pressure (9, 10). Additionally, any
increase in EELV above relaxation volume results in an intrinsic positive end-expiratory pressure
(PEEPi), which must be overcome before inspiratory flow can start (11). Unfortunately, even
with an increase in inspiratory effort, ventilatory constraint often ensues and it is the resulting
mismatch between respiratory effort and ventilatory output that has been implicated as the
primary mechanism responsible for the dyspnea experienced during exercise in this population
(3, 12).
Previous investigations have demonstrated that hyperoxia (HOX) reduces ventilatory demand,
increases expiratory time (TE) and delays dynamic hyperinflation, which leads to a reduction in
dyspnea and improved exercise tolerance in patients with COPD (6, 13, 14). However, at
symptom-limitation in both incremental exercise tests and in constant load trials where there is an
upward drift in ventilation (VE) (13-15), lung volumes, VE and dyspnea are unchanged from
breathing air, indicating that the ventilatory constraints to exercise are delayed but not removed
with hyperoxia (13). In contrast, a normoxic-helium gas (HE-OX) decreases turbulence within
medium to large airways and increases expiratory flow rate, which reduces dynamic
3
hyperinflation and dyspnea and improves exercise tolerance (16). We hypothesized that
combining helium and 40% O2 would maximize the effect of oxygen for reducing VE and
increasing expiratory time, while still maintaining the improved laminar flow and reduced airway
resistance associated with breathing helium. We further hypothesized that the resultant effect
would be a greater reduction in dynamic hyperinflation, which would decrease the work of
breathing and result in reduced dyspnea and improved exercise tolerance. Some of the data from
this study have previously been reported in abstract form (17).
METHODS (Method word count = 1023 words)
Please see the online supplement for a more detailed version of these methods.
Patients
Ten clinically stable males with moderate to severe COPD (FEV1/FVC = 56 ± 10%pred, PaO2 =
68 ± 6 mm Hg) volunteered to participate in the study. Individuals dependent on supplemental
oxygen, with cardiovascular disease and/or musculoskeletal abnormalities were excluded. All
patients signed an informed consent that had received institutional ethics review board approval.
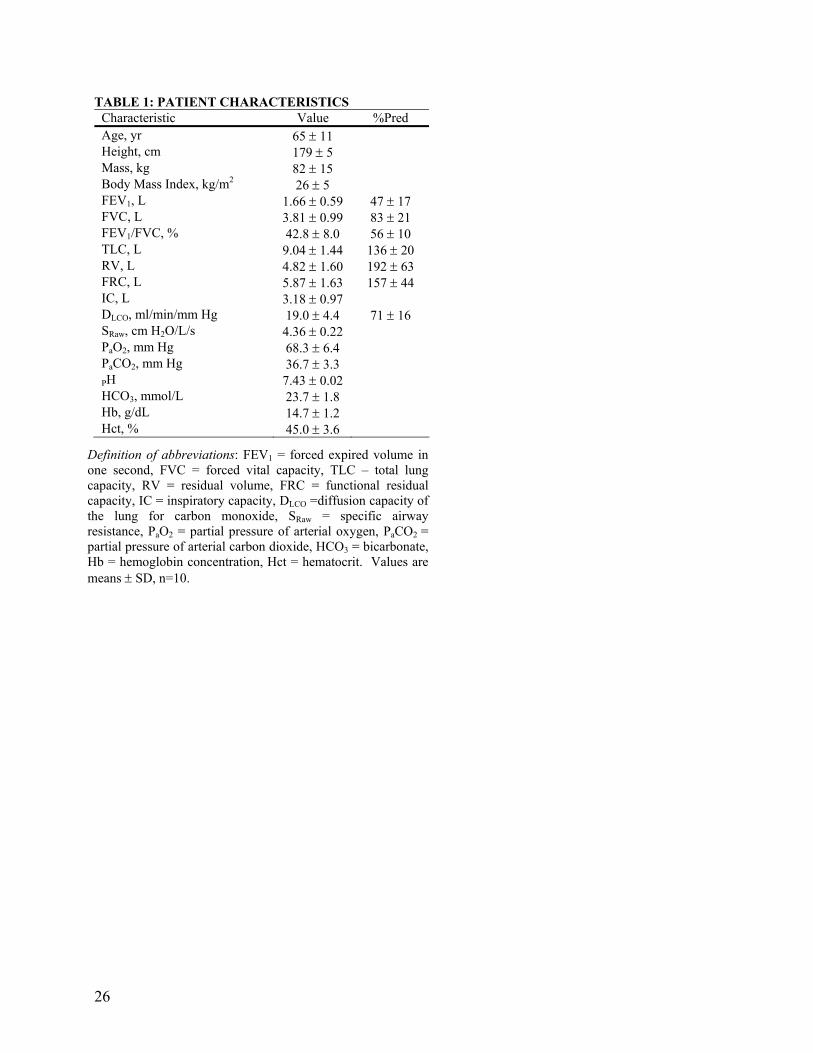
The patient characteristics are presented in Table 1.
Study Design
The study was a randomized crossover design, which required three separate visits to the
laboratory. The first visit consisted of a pulmonary function test to confirm the severity of COPD
and a symptom-limited incremental exercise test to ensure the absence of cardiovascular
contraindications to exercise. During the other two visits, four constant-load symptom-limited
4
exercise trials were performed in a random order (two per visit) to examine the effect of each gas
on exercise tolerance, work of breathing, lung volumes and exertional symptoms. The patients
were asked to refrain from exercise in the 24 hours before a test and to avoid smoking, alcohol
and caffeine on testing days.
The four gas mixtures studied were: air (21% O2, 79% N2); hyperoxia (40% O2, 60% N2);
normoxic-helium (21% O2, 79% He) and helium-hyperoxia (40% O2, 60% He). A 40% O2
mixture was utilized to maximize the benefits of O2 while still obtaining the benefits of helium
(18). Throughout exercise, humidified gases were passed into a reservoir bag and supplied
through a low-resistance two-way breathing valve (2700 series, Hans Rudolph, Kansas City,
MO). The patients were blinded to the gas mixture used and were asked not to talk during, or for
a short period after exercise due to the change in vocal tone with helium.
Pulmonary Function Testing
Spirometry, single-breath diffusion capacity for carbon monoxide (DLCO) and lung volumes
determined by body plethysmograph (6200 Autobox; SensorMedics, Yorba Linda CA) were
measured before entry into the study. Resting arterial blood gases and pH were measured from a
radial artery taken at rest while breathing room air.
Incremental Exercise Test
Prior to inclusion in the study, an incremental cycle-exercise stress test to symptom limitation
was performed with expired gas analysis (TrueOne 2400, Parvo Medics, Salt Lake City, UT).
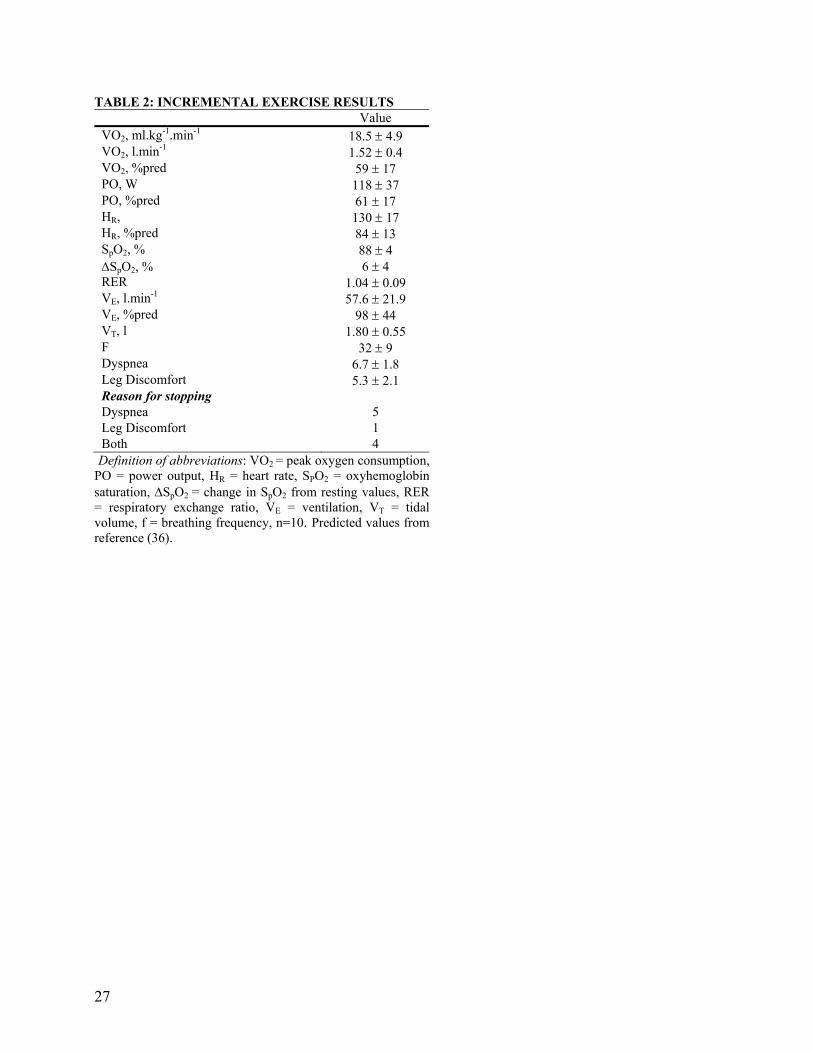
The results from this test are presented in Table 2.
5
Constant Load Exercise, Lung Volumes and Respiratory Mechanics
After adequate wash-in, spirometry was performed to obtain resting pulmonary function on each
gas mixture. Patients then exercised at 60% of their previously determined maximal work rate on
an electronically-braked cycle ergometer (Ergoline 800S, SensorMedics, Yorba Linda, CA) until
symptom limitation. Following exercise, subjects rested for 60-90 minutes before the second
exercise trial was performed with a different gas. Two research assistants, blinded to the gas
mixture used, consistently encouraged patients to exercise for as long as possible.
Ventilatory parameters were measured every two minutes by switching the patient from
the reservoir bag to a bag-in-box in series with a low resistance spirometer (Model 1022,
SensorMedics, Yorba Linda, CA). Calibration of the spirometer was confirmed with the
experimental gas mixture before each pulmonary function test and exercise trial. Esophageal
pressure was measured with a 10-cm latex balloon catheter (Ackrad Laboratories Inc., Cranford,
NJ) with a 1ml inflation volume, connected to a differential pressure transducer (MP45,
Validyne, Northridge, CA). Signals from the spirometer and pressure transducers were converted
to a digital signal using a data acquisition system (Powerlab ML785, ADI Instruments, Colorado
Springs, CO). The volume signal from the spirometer was differentiated to obtain flow. All data
were sampled at 100Hz and stored on a computer for analysis at a later date. A schematic of the
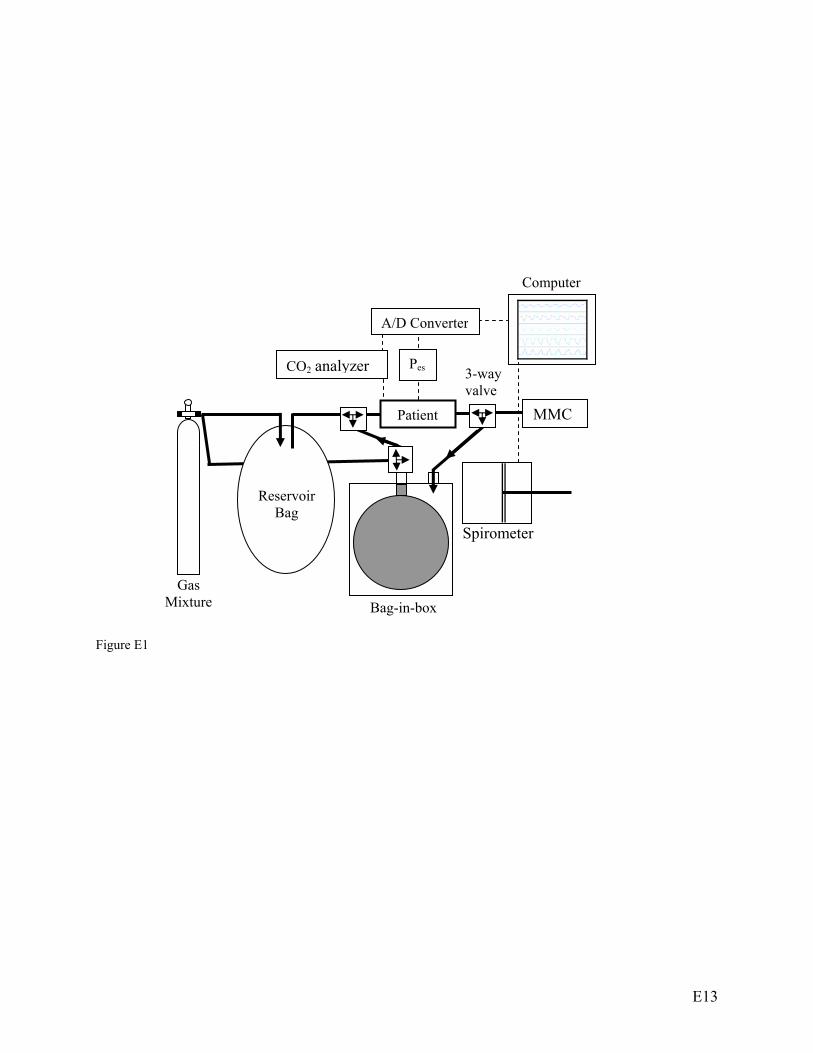
experimental setup is depicted in Figure E1 in the online data supplement.
Measurement of Lung Volumes: Assuming that TLC does not change with exercise (19, 20),
repetitive inspiratory capacity maneuvers (IC) were performed every two minutes to track
changes in EELV (TLC - IC). This technique has previously been shown to be reliable during
exercise in this population (20, 21).
Measurement of Respiratory Mechanics: The work of breathing was estimated using Campbell
diagrams and the technique of Yan et al., (22), which allows the inspiratory elastic work of
6
breathing to be separated into the work to overcome PEEPi (WIP) and the work required to
overcome the elastic recoil of the lung or the non-PEEPi inspiratory elastic load (WINP) (11, 22).
In brief, the chest-wall compliance curve was obtained from the literature (23) and was
positioned as previously described (11, 22). Esophageal pressure-volume loops during tidal
breathing were then superimposed on the static chest wall pressure-volume compliance line. The
points of zero flow at the start and end of inspiration were joined to identify dynamic lung
compliance. Inspiratory resistive work was then calculated as the area inside the pressure-volume
curve and to the left of the lung compliance line. The total elastic work performed on inspiration
was calculated as the area enclosed by the lung compliance line and the chest-wall compliance
curve. Additional work performed by the respiratory muscles during expiration was calculated as
the portion of the pressure-volume loop positioned to the right of the chest-wall compliance
curve. This process was performed on three esophageal pressure-volume loops at rest, symptom
limitation and the two isotimes.
Data Analysis
A one-way repeated measures analysis of variance (ANOVA) was performed at symptom
limitation, and at two isotimes during the exercise tolerance trials using commercially available
software (Statistica, Statsoft, Oklahoma city, OK). Isotime 1 and 2 were defined as symptom
limitation in the air and HOX trials, respectively. When a patient exercised longer on air than on
an experimental gas (n=1) or shorter on HE-HOX than HOX (n=2) the end exercise responses
were carried forward. When the ANOVA detected a significant effect, a Tukey post hoc multiple
comparisons test was performed.
To test for associations between the change in exercise time and changes in EELV, VE,
work of breathing, and/or dyspnea, simple regression analysis using Pearson correlations were
7
performed. In addition, the strongest significant contributors to the improvement in exercise time
were selected by multiple stepwise regression analysis. For all analyses and post hoc comparisons
the alpha level was set a priori at 0.05.
RESULTS
Symptom-Limited Exercise Tolerance
All results are reported as mean ± SD. The effect of each gas mixture on exercise tolerance is
depicted in Figure 1. An increase in exercise time was observed with all three gas mixtures
compared to breathing air. Exercise time to symptom limitation was 9.4 ± 5.2 min on air, 17.8 ±
5.8 min on HOX and 16.7 ± 9.1 min on HE-OX. The combination of helium and hyperoxia had a
significantly greater effect on exercise tolerance compared to all other gases (26.3 ± 10.6 min).
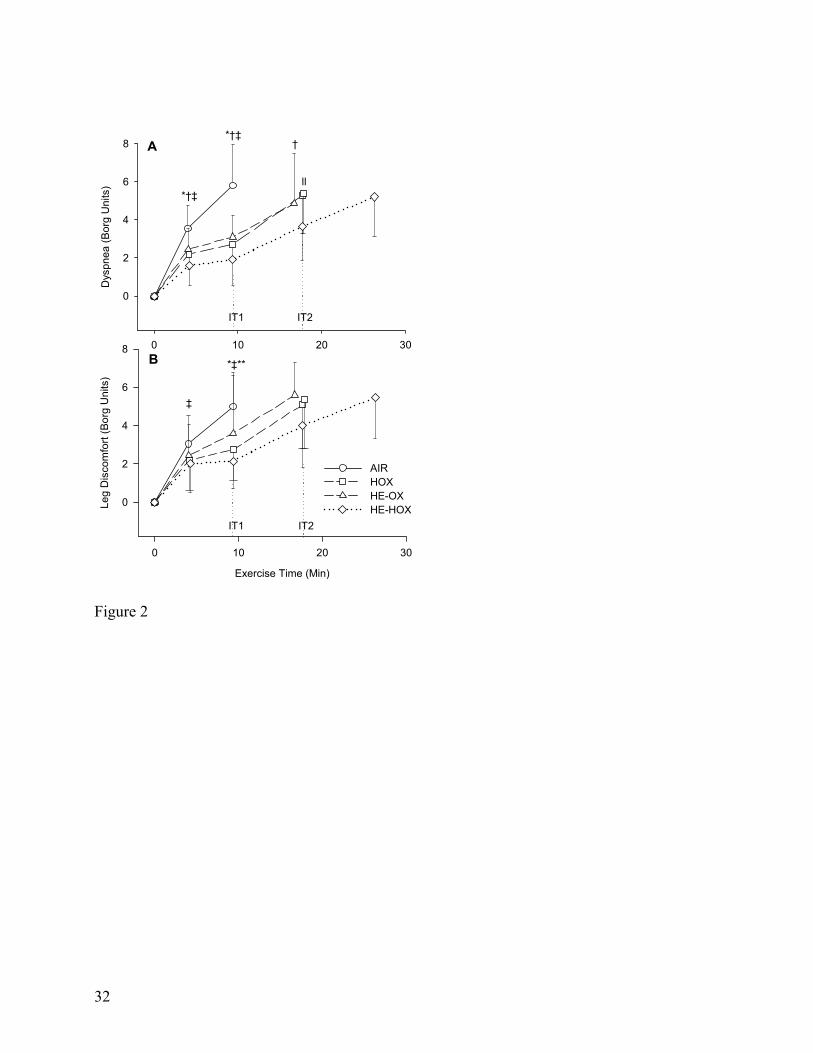
During exercise, dyspnea was decreased with all three experimental gases at isotime 1
(Figure 2A, Table 3). At this time point, the reduction in dyspnea was greatest with HE-HOX as
the Borg rating was reduced from 5.8 ± 2.2 in the air trial to 1.9 ± 1.4 with HE-HOX. HE-HOX
also reduced dyspnea at isotime 2 compared to HOX (5.3 ± 2.0 vs. 3.7 ± 1.8, p=0.029).
Concomitant to the reductions in dyspnea, both hyperoxic gases reduced the sensation of leg
discomfort at isotime 1 compared to air (Figure 2B) and HE-HOX also reduced leg discomfort
compared to HE-OX (2.2 ± 1.5 vs. 3.6 ± 2.2, p=0.049).
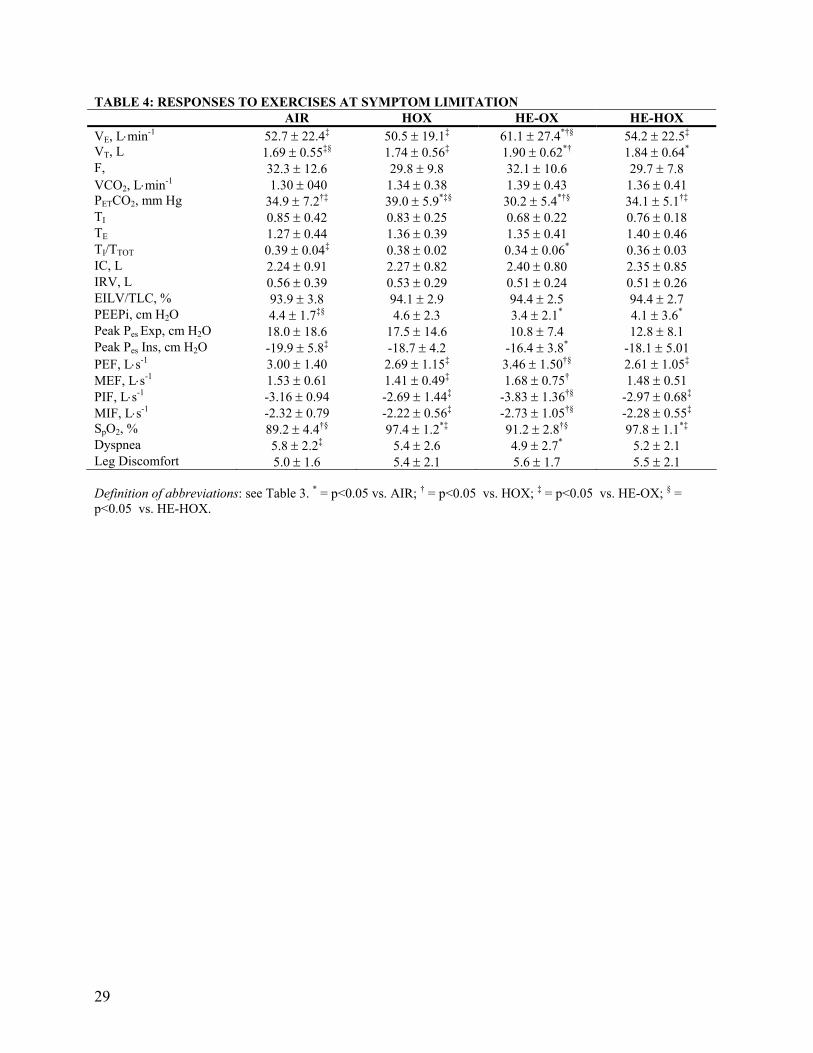
At end exercise, dyspnea was significantly lower with HE-OX but unchanged with the
two hyperoxic gases (Table 4). No difference in leg discomfort was observed at symptom
limitation with any gas. In the air trial, dyspnea was the primary symptom limiting exercise in
eight subjects, while two stopped due to leg discomfort. In contrast, leg discomfort was reported
as the principal reason for exercise termination with HOX (n=5), HE-OX (n=4) and HE-HOX
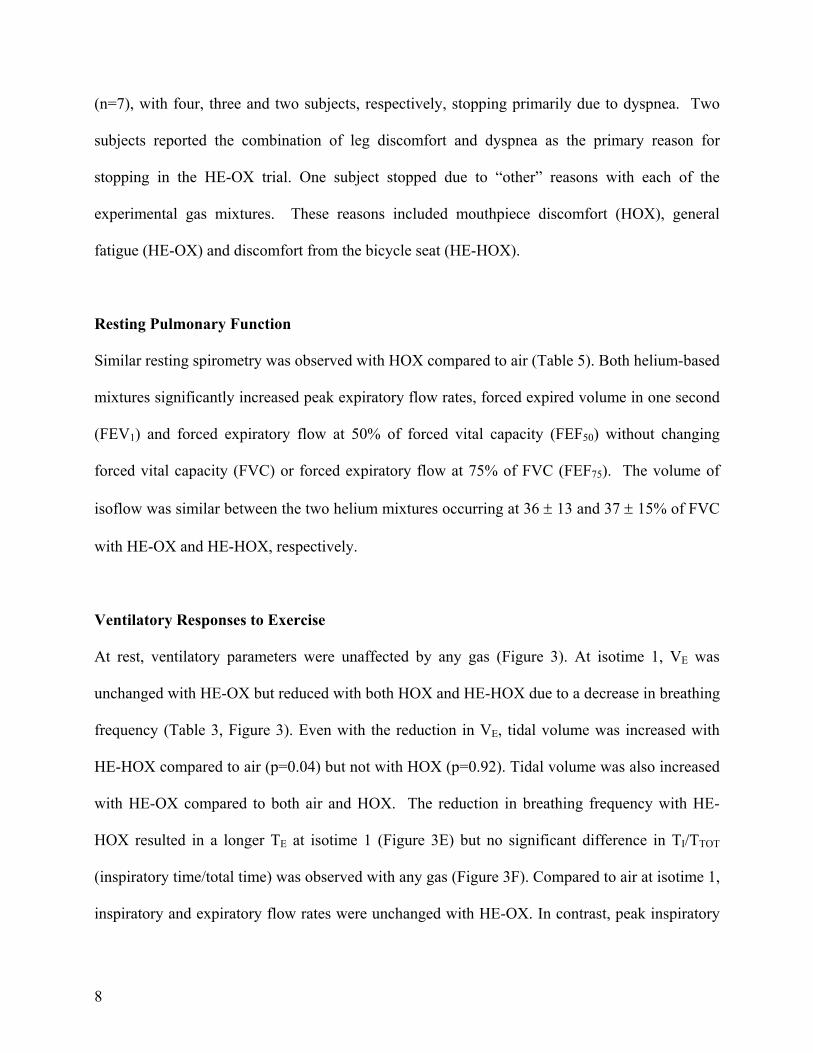
8
(n=7), with four, three and two subjects, respectively, stopping primarily due to dyspnea. Two
subjects reported the combination of leg discomfort and dyspnea as the primary reason for
stopping in the HE-OX trial. One subject stopped due to “other” reasons with each of the
experimental gas mixtures. These reasons included mouthpiece discomfort (HOX), general
fatigue (HE-OX) and discomfort from the bicycle seat (HE-HOX).
Resting Pulmonary Function
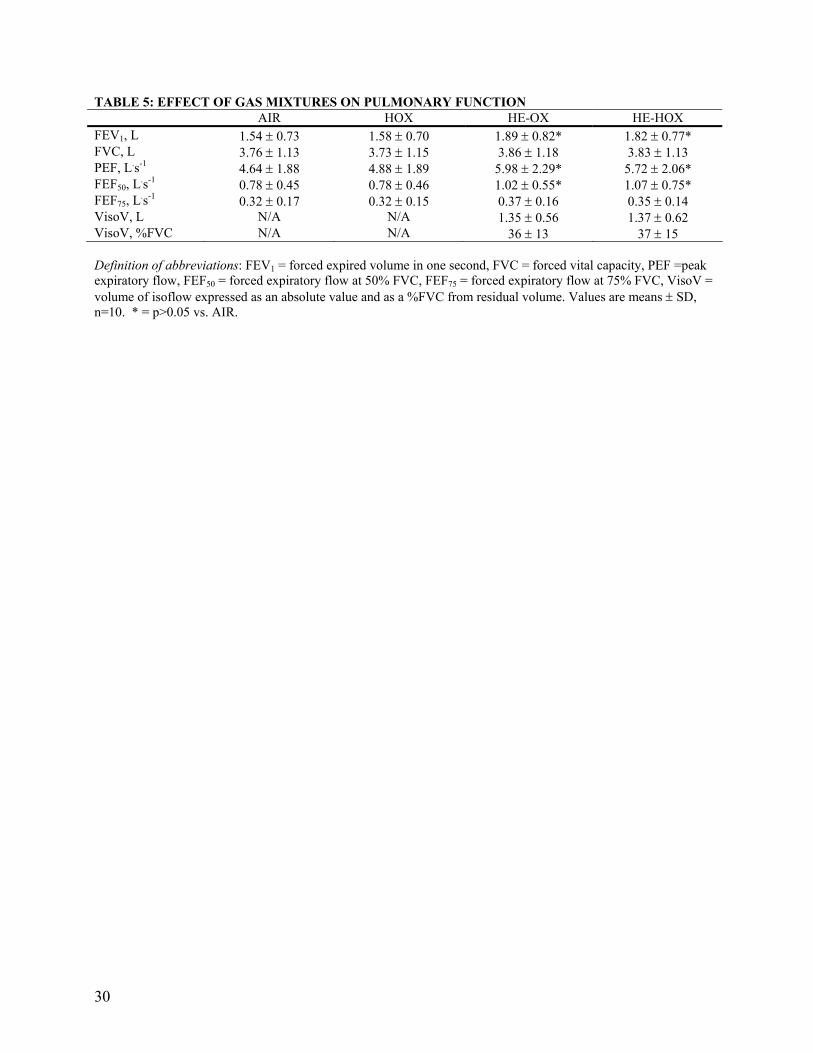
Similar resting spirometry was observed with HOX compared to air (Table 5). Both helium-based
mixtures significantly increased peak expiratory flow rates, forced expired volume in one second
(FEV1) and forced expiratory flow at 50% of forced vital capacity (FEF50) without changing
forced vital capacity (FVC) or forced expiratory flow at 75% of FVC (FEF75). The volume of
isoflow was similar between the two helium mixtures occurring at 36 ± 13 and 37 ± 15% of FVC
with HE-OX and HE-HOX, respectively.
Ventilatory Responses to Exercise
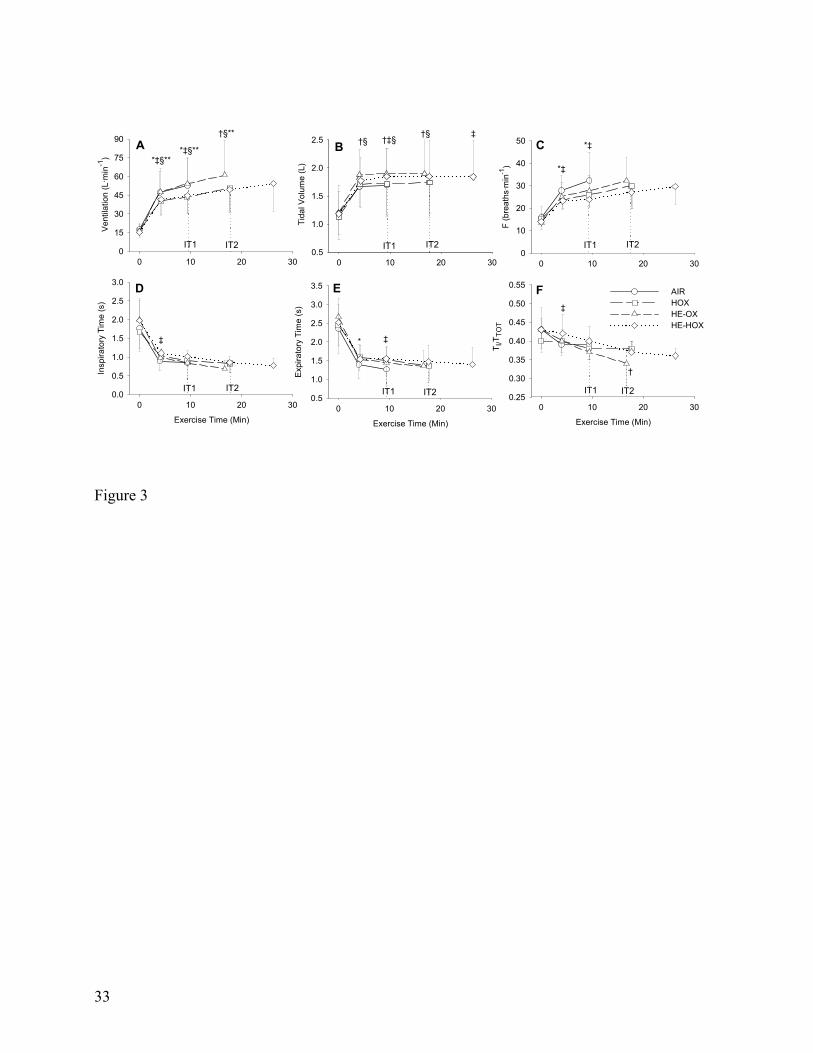
At rest, ventilatory parameters were unaffected by any gas (Figure 3). At isotime 1, VE was
unchanged with HE-OX but reduced with both HOX and HE-HOX due to a decrease in breathing
frequency (Table 3, Figure 3). Even with the reduction in VE, tidal volume was increased with
HE-HOX compared to air (p=0.04) but not with HOX (p=0.92). Tidal volume was also increased
with HE-OX compared to both air and HOX. The reduction in breathing frequency with HE-
HOX resulted in a longer TE at isotime 1 (Figure 3E) but no significant difference in TI/TTOT
(inspiratory time/total time) was observed with any gas (Figure 3F). Compared to air at isotime 1,
inspiratory and expiratory flow rates were unchanged with HE-OX. In contrast, peak inspiratory

9
and expiratory flow rates were decreased with both hyperoxic gases (Table 3) while only HOX
significantly reduced mean inspiratory and expiratory flow rates.
At symptom limitation, there was no difference in the ventilatory responses between air and
hyperoxia. In contrast, VE was increased with HE-OX compared to all other gas mixtures due to a
larger tidal volume (Table 4). There was considerable variation in the individual ventilatory
responses observed with HE-OX as VE ranged from a decrease of 1.8 L.min-1 to an increase of
25.8 L.min-1. This finding was strongly correlated with resting FEV1 (r = 0.78, p = 0.008) such
that those with the greatest FEV1 showed the largest increases in VE with HE-OX. At end
exercise, VE was similar to air with HE-HOX (p = 0.94) while tidal volume remained increased
by 0.15L (p = 0.04).
Lung Volume Responses to Exercise
Baseline IC, EILV and inspiratory reserve volume (IRV) were unchanged with any gas (Figure
4). From quiet breathing at rest to symptom limitation, all patients dynamically hyperinflated as
demonstrated by the significant reduction in IC. The rise in EELV during exercise resulted in a
mean PEEPi at the end of the air trial of 4.4 ± 1.7 cm H2O (range 2.6 – 7.7 cm H2O). At symptom
limitation with air, the degree of dynamic hyperinflation averaged 0.43 ± 0.18 L (range = 0.17 L
to 0.69 L) and EILV reached 94% of TLC. No difference in IC, EILV, IRV or PEEPi was
observed with any gas and the increased tidal volume with both helium gas mixtures was
primarily due to a trend toward a lower EELV.
At isotime 1, IC was significantly increased with both HE-OX and HE-HOX but not HOX
(Figure 4, Table 3). Concomitant to the reduction in dynamic hyperinflation with the helium
gases, PEEPi was also reduced from 4.4 ± 1.7 cm H2O in air to 2.4 ± 2.1 and 2.0 ± 1.9 cm H2O
10
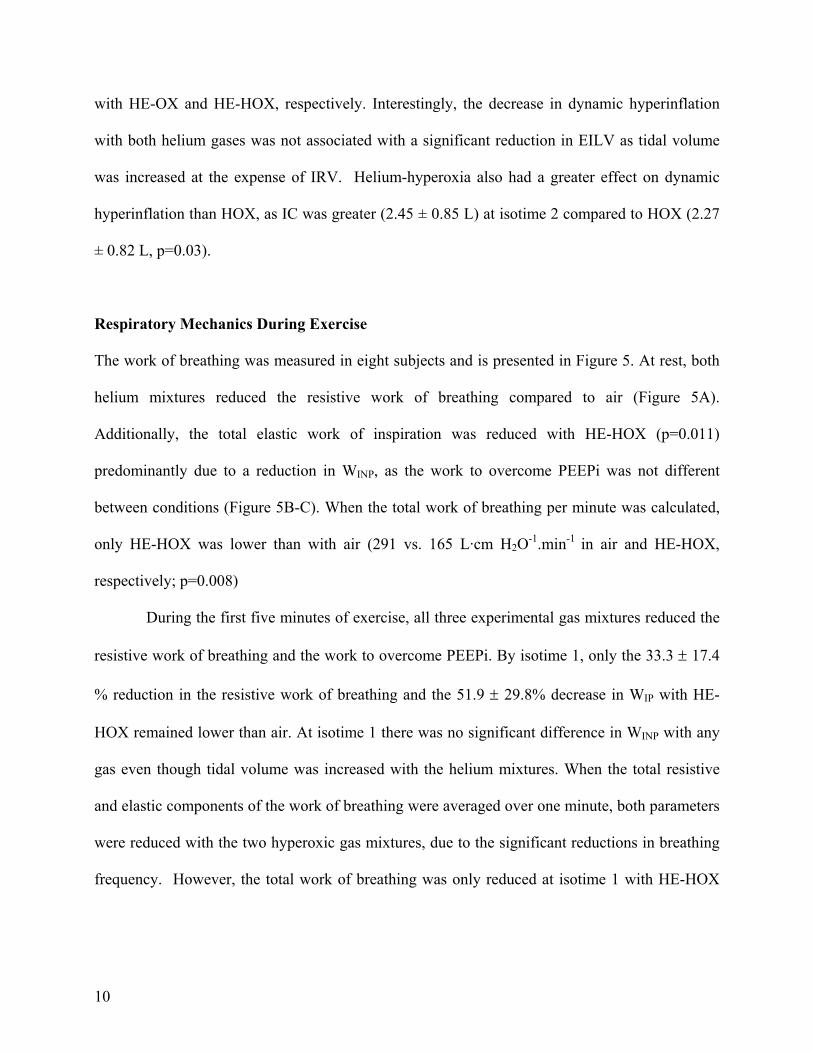
with HE-OX and HE-HOX, respectively. Interestingly, the decrease in dynamic hyperinflation
with both helium gases was not associated with a significant reduction in EILV as tidal volume
was increased at the expense of IRV. Helium-hyperoxia also had a greater effect on dynamic
hyperinflation than HOX, as IC was greater (2.45 ± 0.85 L) at isotime 2 compared to HOX (2.27
± 0.82 L, p=0.03).
Respiratory Mechanics During Exercise
The work of breathing was measured in eight subjects and is presented in Figure 5. At rest, both
helium mixtures reduced the resistive work of breathing compared to air (Figure 5A).
Additionally, the total elastic work of inspiration was reduced with HE-HOX (p=0.011)
predominantly due to a reduction in WINP, as the work to overcome PEEPi was not different
between conditions (Figure 5B-C). When the total work of breathing per minute was calculated,
only HE-HOX was lower than with air (291 vs. 165 L·cm H2O-1.min-1 in air and HE-HOX,
respectively; p=0.008)
During the first five minutes of exercise, all three experimental gas mixtures reduced the
resistive work of breathing and the work to overcome PEEPi. By isotime 1, only the 33.3 ± 17.4
% reduction in the resistive work of breathing and the 51.9 ± 29.8% decrease in WIP with HE-
HOX remained lower than air. At isotime 1 there was no significant difference in WINP with any
gas even though tidal volume was increased with the helium mixtures. When the total resistive
and elastic components of the work of breathing were averaged over one minute, both parameters
were reduced with the two hyperoxic gas mixtures, due to the significant reductions in breathing
frequency. However, the total work of breathing was only reduced at isotime 1 with HE-HOX

11
(940 ± 317 L·cm H2O-1·min-1) compared to air (1938 ± 1457 L·.cm H2O-1·min-1). At isotime 2 and
symptom limitation, there were no significant differences in the work of breathing with any gas.
Correlates of Improved Exercise Tolerance
The increase in exercise time to symptom limitation with HOX significantly correlated with the
decrease in VE (r = -0.82) and breathing frequency (r = -0.67) at isotime 1. The increase in
exercise time with HE-OX correlated best with the change in peak inspiratory flow (r = 0.93),
EELV expressed as a %TLC (r = -0.93), inspiratory capacity (r = 0.89), breathing frequency (r =
-0.88) and total work of breathing per minute (r = -0.85). Stepwise multiple regression analysis
demonstrated that the combination of improved peak inspiratory flow, EELV as a %TLC and the
reduction in the total work of breathing explained 99% of the variance associated with increased
endurance time with HE-OX (r2 = 0.99, p<0.0001).
The improved exercise time with HE-HOX was associated with a reduction in the work of
breathing and improved inspiratory flow rates. The strongest correlates of improved exercise time
with HE-HOX were the change in total elastic work of breathing per minute (r = -0.87), total
inspiratory resistive work of breathing per minute (r = -0.83), peak inspiratory (r = 0.82) and
expiratory flow rates (r = -0.81) and mean expiratory flow rate (r = -0.79). In addition,
significant correlations were also observed between the improvement in exercise time and the
decrease in VE (r = -0.71) and breathing frequency (r = 0.68) with HE-HOX. Stepwise multiple
regression analysis of these variables, demonstrated that the decrease in the total elastic work of
breathing with HE-HOX explained 75% of the variance in exercise time. The favorable decrease
in mean expiratory flow rate then added approximately 8% to the explained variance (r2 =0 .83, p
<0.01).
12
DISCUSSION
The principal finding of this study supported our hypotheses that helium-hyperoxia would
improve exercise tolerance to a greater degree than hyperoxia or normoxic-helium. As postulated,
these improvements in exercise tolerance were related to the greater effect of this gas for delaying
dynamic hyperinflation, alleviating dyspnea and reducing the work of breathing.
Symptom Limited Exercise Tolerance
Hyperoxia has consistently been reported to improve the exercise capacity of COPD patients with
(6, 14, 24) and without hypoxemia (13, 25). More recently, Palange et al., (16) reported that
normoxic-helium improved the exercise tolerance of COPD patients performing high intensity
cycle exercise by 114%. The improvements in exercise time with HOX (118 ± 74%) and HE-OX
(91 ± 103%) found in the present study are similar to those previously reported. However, the
primary finding of this investigation was that HE-HOX improved the exercise tolerance of COPD
patients by 245 ± 208% compared to air and by 54 ± 56 and 92 ± 116% compared to HOX and
HE-OX, respectively. These findings complement those of Laude et al., (26) who demonstrated
that a 28:72 O2-He mixture improved walking distance in a shuttle walk test by 64% in patients
with COPD. However, our results demonstrate how a combination of helium and hyperoxia has a
greater effect on reducing dynamic hyperinflation and work of breathing than either normoxic-
helium or hyperoxia alone, which explains the underlying physiological mechanisms responsible
for the improved exercise tolerance.
In the present study, the majority of subjects terminated exercise because of dyspnea
when breathing air. However, leg discomfort was the principal reason for stopping exercise with
HE-HOX. This change in the symptom responsible for limiting exercise suggests that HE-HOX
13
decreases the ventilatory constraints associated with COPD to an extent that skeletal muscle
function becomes more of a limiting factor.
Ventilation and Lung Volume Responses to Exercise
The significant reduction in VE observed with HOX is consistent with others (6, 13, 14, 24) and
has been attributed to reduced chemoreceptor drive (6, 24). As a result, inspiratory and
expiratory flow rates were decreased, EELV was maintained closer to resting lung volumes and
the progression of dynamic hyperinflation was delayed, which improved exercise tolerance,
independent of the level of hypoxemia (r = 0.28, p = 0.48). At symptom limitation, the magnitude
of dynamic hyperinflation, VE and tidal volume were all unchanged from air, which supports the
previous findings of O’Donnell et al., (13) and indicates that the ventilatory constraints to
exercise are delayed but not removed with hyperoxia.
A number of previous studies have reported that normoxic-helium increases VE during
exercise in patients with COPD (5, 16, 27). In the present study VE was increased 16 ± 21% with
HE-OX, which is comparable to that reported by others (28, 29). Improvements in IC with HE-
OX were primarily due to an increase in the maximal flow volume envelope as inspiratory and
expiratory flow rates were similar to that observed with air but EELV was reduced. A significant
correlation was observed between the change in EELV as a %TLC and the change in dyspnea
with HE-OX (r = 0.71, p = 0.02), which is not surprising as EELV was one of the primary
predictors of improved exercise performance with this gas. Interestingly, no relationship was
observed between the increase in maximal VE with HE-OX and exercise time (r = 0.10, p = 0.79),
which suggests that the ability of the HE-OX to reduce dynamic hyperinflation is more important
than its effect on VE for improving exercise tolerance.

14
The ventilatory response to exercise with HE-HOX was similar to HOX, with VE and
breathing frequency being reduced. Lower expiratory flow rates combined with a significantly
lengthened TE reduced EELV to a greater extent than HOX and increased tidal volume. At
symptom limitation, IC was not significantly increased with HE-HOX but tidal volume was still
augmented due again to the slight but non-significant increase in TE (r = 0.65, p = 0.04). These
positive effects of HE-HOX on lung volumes demonstrate the additive benefit of combining
helium and 40% O2, as the increase in FIO2 reduced expiratory flow rates and increased
expiratory time while helium increased the maximal flow-volume envelope allowing for a greater
reduction in dynamic hyperinflation.
Respiratory Mechanics During Exercise
The effect of each gas on the resistive work of breathing was evident early in the constant
load trials and was related to the physical properties of both helium and oxygen. The lower
density of helium reduces the pressure needed to overcome airway resistance at higher flow rates
by maintaining laminar flow, whereas, oxygen reduces ventilatory drive and expiratory flow rate
which decreases airway resistance. The further reduction in resistive work only with helium-
hyperoxia at isotime 1 demonstrates that there is a synergistic effect of combining these two
gases on airway resistance that is related to the reduced density of helium and the ability of
oxygen to decrease VE.
To interpret the different elastic work of breathing responses observed in this study it is
also important to consider the effects of helium and oxygen (both separately and in combination)
on lung volumes and VE during exercise. At isotime 1, HOX decreased the total inspiratory
elastic work per minute primarily due to a reduction in ventilatory drive as EELV and tidal
volume were unchanged compared to air. In contrast, EELV was decreased with HE-OX but the
15
total inspiratory elastic work was unaffected as tidal volume was increased at the expense of
maintaining the inspiratory work needed to overcome the elastic recoil of the lung. HE-HOX
combined these effects as the total elastic work of breathing was reduced even with an increase in
tidal volume. This finding can be attributed to both the greater reduction in dynamic
hyperinflation, which decreased the work to overcome PEEPi, and the hyperoxia induced
reduction in VE.
The significant relationship observed between the reduced work of breathing and the
improved exercise time with HE-HOX is likely due to alleviation of dyspnea, since a significant
relationship was observed between the change in the total work of breathing and dyspnea
reduction (r=0.63, p=0.048). However, another benefit of the reduced work of breathing may be
a better distribution of cardiac output to the exercising muscles. In healthy individuals the
respiratory muscles can demand 13-15% of total body oxygen consumption during heavy
exercise (30) and 14-16% of total cardiac output (31). Reducing the work of breathing decreases
respiratory muscle demand and has been shown to increase leg blood flow during exercise (32).
The increased work of breathing in patients with COPD is estimated to govern as much as 35-
40% of total body oxygen consumption (33), which would demand a much greater proportion of
cardiac output. Therefore, it is possible that unloading the respiratory system with HE-HOX
allowed a greater portion of total cardiac output to be distributed to the working muscles.
Improved leg blood flow combined with a higher oxyhemoglobin saturation would increase O2
supply and decrease metabolic acidosis (13), which would conceivably reduce leg fatigue and
improve exercise tolerance.
A potential limitation of the present methodology could be an inaccurate positioning of
the static chest wall compliance curve in our calculation of the elastic work of breathing. The
curve is positioned assuming that end-expiratory lung volume during quiet breathing is an

16
accurate representation of the relaxation volume and pressure of the respiratory system. However,
this may not be accurate as dynamic hyperinflation is often present in COPD patients at rest and
EELV may actually be above relaxation volume even during quiet breathing. Continued
expiratory muscle recruitment at end expiration can also artificially increase PEEPi above that
due to dynamic hyperinflation, which would increase end-expiratory pressure independent of the
chest wall elasticity. To correct for this, previous studies have subtracted the expiratory rise in
gastric pressures from the esophageal pressure at EELV (11, 22). This could not be done in this
study as gastric pressures were not measured. As a result the work needed to overcome PEEPi
may be slightly overestimated. However, only four subjects demonstrated evidence of PEEPi at
rest and no significant difference was observed in EELV or PEEPi with the four gas mixtures at
baseline. Therefore, any error in WIP would be consistent across the four conditions and
considering the magnitude of the reduction in WIP observed with HE-HOX (52 ± 30%), we
believe that a possible overestimation in WIP did not affect our conclusions.
In summary, combining 40% O2 with helium greatly increased exercise tolerance in
patients with moderate to severe COPD due to the additional benefits of this gas on lung
mechanics, dynamic hyperinflation and dyspnea alleviation. The ability of helium-hyperoxia to
acutely reduce dyspnea and improve exercise tolerance are important clinical findings and could
be useful within rehabilitation practice. It is now well recognized that exercise training as a part
of pulmonary rehabilitation can lead to important improvements in exercise capacity, dyspnea
reduction and health related quality of life (34, 35). However, patients who suffer from
debilitating dyspnea often cannot perform a sufficient volume of exercise to gain these benefits.
Breathing helium-hyperoxia during exercise should reduce dyspnea and increase the ability of

17
patients with COPD to exercise, which could translate into improved outcomes from a pulmonary
rehabilitation program.

18
Acknowledgements The authors would like to thank The Caritas Centre for Lung Health for their support with patient
recruitment and Chris Sellar and Tim Hartley for providing assistance with data collection
throughout this study.

19
References
1. Jones, N. L., G. Jones, and R. H. Edwards. 1971. Exercise tolerance in chronic airway
obstruction. Am Rev Respir Dis 103(4):477-91.
2. O'Donnell, D. E., S. M. Revill, and K. A. Webb. 2001. Dynamic hyperinflation and exercise
intolerance in chronic obstructive pulmonary disease. Am J Respir Crit Care Med 164(5):770-7.
3. O'Donnell, D. E., and K. A. Webb. 1993. Exertional breathlessness in patients with chronic
airflow limitation. The role of lung hyperinflation. Am Rev Respir Dis 148(5):1351-7.
4. Mitlehner, W., and W. Kerb. 1994. Exercise hypoxemia and the effects of increased
inspiratory oxygen concentration in severe chronic obstructive pulmonary disease. Respiration
61(5):255-62.
5. Oelberg, D. A., R. M. Kacmarek, P. P. Pappagianopoulos, L. C. Ginns, and D. M. Systrom.
1998. Ventilatory and cardiovascular responses to inspired He-O2 during exercise in chronic
obstructive pulmonary disease. Am J Respir Crit Care Med 158(6):1876-82.
6. O'Donnell, D. E., D. J. Bain, and K. A. Webb. 1997. Factors contributing to relief of
exertional breathlessness during hyperoxia in chronic airflow limitation. Am J Respir Crit Care
Med 155(2):530-5.
7. Diaz, O., C. Villafranca, H. Ghezzo, G. Borzone, A. Leiva, J. Milic-Emil, and C. Lisboa.
2000. Role of inspiratory capacity on exercise tolerance in COPD patients with and without tidal
expiratory flow limitation at rest. Eur Respir J 16(2):269-75.
8. Marin, J. M., S. J. Carrizo, M. Gascon, A. Sanchez, B. Gallego, and B. R. Celli. 2001.
Inspiratory capacity, dynamic hyperinflation, breathlessness, and exercise performance during the
6-minute-walk test in chronic obstructive pulmonary disease. Am J Respir Crit Care Med
163(6):1395-9.
20
9. Yan, S., and B. Kayser. 1997. Differential inspiratory muscle pressure contributions to
breathing during dynamic hyperinflation. Am J Respir Crit Care Med 156(2 Pt 1):497-503.
10. Sharp, J. T. 1983. The respiratory muscles in emphysema. Clin Chest Med 4(3):421-32.
11. Sliwinski, P., D. Kaminski, J. Zielinski, and S. Yan. 1998. Partitioning of the elastic work of
inspiration in patients with COPD during exercise. Eur Respir J 11(2):416-21.
12. Leblanc, P., E. Summers, M. D. Inman, N. L. Jones, E. J. Campbell, and K. J. Killian. 1988.
Inspiratory muscles during exercise: a problem of supply and demand. J Appl Physiol
64(6):2482-9.
13. O'Donnell, D. E., C. D'Arsigny, and K. A. Webb. 2001. Effects of hyperoxia on ventilatory
limitation during exercise in advanced chronic obstructive pulmonary disease. Am J Respir Crit
Care Med 163(4):892-8.
14. Somfay, A., J. Porszasz, S. M. Lee, and R. Casaburi. 2001. Dose-response effect of oxygen
on hyperinflation and exercise endurance in nonhypoxaemic COPD patients. Eur Respir J
18(1):77-84.
15. Emtner, M., J. Porszasz, M. Burns, A. Somfay, and R. Casaburi. 2003. Benefits of
Supplemental Oxygen in Exercise Training in Nonhypoxemic Chronic Obstructive Pulmonary
Disease Patients. Am. J. Respir. Crit. Care Med. 168(9):1034-1042.
16. Palange, P., G. Valli, P. Onorati, R. Antonucci, P. Paoletti, A. Rosato, F. Manfredi, and P.
Serra. 2004. Effect of heliox on lung dynamic hyperinflation, dyspnea, and exercise endurance
capacity in COPD patients. J Appl Physiol 97(5):1637-42.
17. Eves, N. D., Petersen SR, Haykowsky MJ, Wong EY, Jones RL. 2004. The effects of helium
and hyperoxia on exercise tolerance and ventilatory mechanics in chronic obstructive pulmonary
disease. Canadian Journal of Applied Physiology 29((Suppl)):S45.

21
18. Jaber, S., R. Fodil, A. Carlucci, M. Boussarsar, J. Pigeot, F. Lemaire, A. Harf, F. Lofaso, D.
Isabey, and L. Brochard. 2000. Noninvasive ventilation with helium-oxygen in acute
exacerbations of chronic obstructive pulmonary disease. Am J Respir Crit Care Med 161(4 Pt
1):1191-200.
19. Stubbing, D. G., L. D. Pengelly, J. L. Morse, and N. L. Jones. 1980. Pulmonary mechanics
during exercise in subjects with chronic airflow obstruction. J Appl Physiol 49(3):511-5.
20. Yan, S., D. Kaminski, and P. Sliwinski. 1997. Reliability of inspiratory capacity for
estimating end-expiratory lung volume changes during exercise in patients with chronic
obstructive pulmonary disease. Am J Respir Crit Care Med 156(1):55-9.
21. Dolmage, T. E., and R. S. Goldstein. 2002. Repeatability of inspiratory capacity during
incremental exercise in patients with severe COPD. Chest 121(3):708-14.
22. Yan, S., D. Kaminski, and P. Sliwinski. 1997. Inspiratory muscle mechanics of patients with
chronic obstructive pulmonary disease during incremental exercise. Am J Respir Crit Care Med
156(3 Pt 1):807-13.
23. Estenne, M., A. Heilporn, L. Delhez, J. C. Yernault, and A. De Troyer. 1983. Chest wall
stiffness in patients with chronic respiratory muscle weakness. Am Rev Respir Dis 128(6):1002-7.
24. Dean, N. C., J. K. Brown, R. B. Himelman, J. J. Doherty, W. M. Gold, and M. S. Stulbarg.
1992. Oxygen may improve dyspnea and endurance in patients with chronic obstructive
pulmonary disease and only mild hypoxemia. Am Rev Respir Dis 146(4):941-5.
25. Fujimoto, K., Y. Matsuzawa, S. Yamaguchi, T. Koizumi, and K. Kubo. 2002. Benefits of
oxygen on exercise performance and pulmonary hemodynamics in patients with COPD with mild
hypoxemia. Chest 122(2):457-63.
26. Laude, E. A., N. C. Duffy, C. Baveystock, B. Dougill, M. J. Campbell, R. Lawson, P. W.
Jones, and P. M. Calverley. 2006. The Effect of Helium and Oxygen on Exercise Performance in
22
Chronic Obstructive Pulmonary Disease: A Randomized Crossover Trial. Am. J. Respir. Crit.
Care Med. 173(8):865-870.
27. Richardson, R. S., J. Sheldon, D. C. Poole, S. R. Hopkins, A. L. Ries, and P. D. Wagner.
1999. Evidence of skeletal muscle metabolic reserve during whole body exercise in patients with
chronic obstructive pulmonary disease. Am J Respir Crit Care Med 159(3):881-5.
28. Babb, T. G. 1997. Ventilatory response to exercise in subjects breathing CO2 or HeO2. J
Appl Physiol 82(3):746-54.
29. Esposito, F., and G. Ferretti. 1997. The effects of breathing He-O2 mixtures on maximal
oxygen consumption in normoxic and hypoxic men. J Physiol 503 ( Pt 1):215-22.
30. Aaron, E. A., K. C. Seow, B. D. Johnson, and J. A. Dempsey. 1992. Oxygen cost of exercise
hyperpnea: implications for performance. J Appl Physiol 72(5):1818-25.
31. Harms, C. A., T. J. Wetter, S. R. McClaran, D. F. Pegelow, G. A. Nickele, W. B. Nelson, P.
Hanson, and J. A. Dempsey. 1998. Effects of respiratory muscle work on cardiac output and its
distribution during maximal exercise. J Appl Physiol 85(2):609-18.
32. Harms, C. A., M. A. Babcock, S. R. McClaran, D. F. Pegelow, G. A. Nickele, W. B. Nelson,
and J. A. Dempsey. 1997. Respiratory muscle work compromises leg blood flow during maximal
exercise. J Appl Physiol 82(5):1573-83.
33. Evison, H., and R. M. Cherniack. 1968. Ventilatory cost of exercise in chronic obstructive
pulmonary disease. J Appl Physiol 25(1):21-7.
34. Troosters, T., R. Casaburi, R. Gosselink, and M. Decramer. 2005. Pulmonary Rehabilitation
in Chronic Obstructive Pulmonary Disease. Am. J. Respir. Crit. Care Med. 172(1):19-38.
35. Wedzicha, J. A. 2006. Heliox in Chronic Obstructive Pulmonary Disease: Lightening the
Airflow. Am. J. Respir. Crit. Care Med. 173(8):825-826.

23
36. 2003. ATS/ACCP Statement on Cardiopulmonary Exercise Testing. Am. J. Respir. Crit. Care
Med. 167(2):211-277.
24
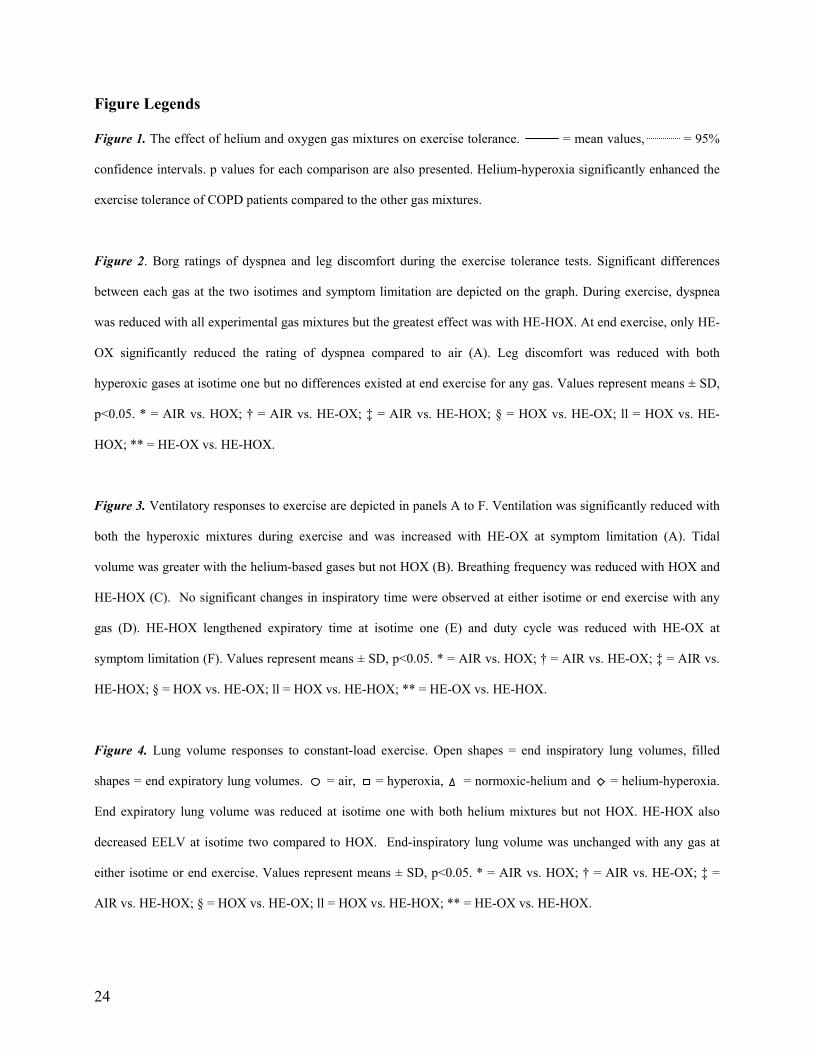
Figure Legends Figure 1. The effect of helium and oxygen gas mixtures on exercise tolerance. = mean values, = 95%
confidence intervals. p values for each comparison are also presented. Helium-hyperoxia significantly enhanced the
exercise tolerance of COPD patients compared to the other gas mixtures.
Figure 2. Borg ratings of dyspnea and leg discomfort during the exercise tolerance tests. Significant differences
between each gas at the two isotimes and symptom limitation are depicted on the graph. During exercise, dyspnea
was reduced with all experimental gas mixtures but the greatest effect was with HE-HOX. At end exercise, only HE-
OX significantly reduced the rating of dyspnea compared to air (A). Leg discomfort was reduced with both
hyperoxic gases at isotime one but no differences existed at end exercise for any gas. Values represent means ± SD,
p<0.05. * = AIR vs. HOX; † = AIR vs. HE-OX; ‡ = AIR vs. HE-HOX; § = HOX vs. HE-OX; ll = HOX vs. HE-
HOX; ** = HE-OX vs. HE-HOX.
Figure 3. Ventilatory responses to exercise are depicted in panels A to F. Ventilation was significantly reduced with
both the hyperoxic mixtures during exercise and was increased with HE-OX at symptom limitation (A). Tidal
volume was greater with the helium-based gases but not HOX (B). Breathing frequency was reduced with HOX and
HE-HOX (C). No significant changes in inspiratory time were observed at either isotime or end exercise with any
gas (D). HE-HOX lengthened expiratory time at isotime one (E) and duty cycle was reduced with HE-OX at
symptom limitation (F). Values represent means ± SD, p<0.05. * = AIR vs. HOX; † = AIR vs. HE-OX; ‡ = AIR vs.
HE-HOX; § = HOX vs. HE-OX; ll = HOX vs. HE-HOX; ** = HE-OX vs. HE-HOX.
Figure 4. Lung volume responses to constant-load exercise. Open shapes = end inspiratory lung volumes, filled
shapes = end expiratory lung volumes. = air, = hyperoxia, = normoxic-helium and = helium-hyperoxia.
End expiratory lung volume was reduced at isotime one with both helium mixtures but not HOX. HE-HOX also
decreased EELV at isotime two compared to HOX. End-inspiratory lung volume was unchanged with any gas at
either isotime or end exercise. Values represent means ± SD, p<0.05. * = AIR vs. HOX; † = AIR vs. HE-OX; ‡ =
AIR vs. HE-HOX; § = HOX vs. HE-OX; ll = HOX vs. HE-HOX; ** = HE-OX vs. HE-HOX.
25
Figure 5. Work of breathing responses to constant-load exercise. Inspiratory resistive work (WIR) was only reduced
with HE-HOX at isotime 1 (A). The work to overcome the elastic recoil of the lung (WINP) was not reduced with the
helium mixtures due to an enhanced tidal volume (B). The work to overcome PEEPi (WIP) was only significantly
reduced at isotime one with HE-HOX due to a greater reduction in dynamic hyperinflation (C). Additional expiratory
work (WE) performed by the respiratory muscles was not affected by any gas at either isotime or symptom limitation
(D). Significant reductions in the total inspiratory elastic work per minute (WIE) were observed at isotime one with
both hyperoxic gases (E). The total work of breathing was only reduced at isotime 1 with HE-HOX (F). Values
represent means ± SD, n=8, p<0.05. * = AIR vs. HOX; † = AIR vs. HE-OX; ‡ = AIR vs. HE-HOX; § = HOX vs.
HE-OX; ll = HOX vs. HE-HOX; ** = HE-OX vs. HE-HOX.
26
TABLE 1: PATIENT CHARACTERISTICS Characteristic Value %Pred Age, yr 65 ± 11 Height, cm 179 ± 5 Mass, kg 82 ± 15 Body Mass Index, kg/m2 26 ± 5 FEV1, L 1.66 ± 0.59 47 ± 17 FVC, L 3.81 ± 0.99 83 ± 21 FEV1/FVC, % 42.8 ± 8.0 56 ± 10 TLC, L 9.04 ± 1.44 136 ± 20 RV, L 4.82 ± 1.60 192 ± 63 FRC, L 5.87 ± 1.63 157 ± 44 IC, L 3.18 ± 0.97 DLCO, ml/min/mm Hg 19.0 ± 4.4 71 ± 16 SRaw, cm H2O/L/s 4.36 ± 0.22 PaO2, mm Hg 68.3 ± 6.4 PaCO2, mm Hg 36.7 ± 3.3 PH 7.43 ± 0.02 HCO3, mmol/L 23.7 ± 1.8 Hb, g/dL 14.7 ± 1.2 Hct, % 45.0 ± 3.6
Definition of abbreviations: FEV1 = forced expired volume in one second, FVC = forced vital capacity, TLC – total lung capacity, RV = residual volume, FRC = functional residual capacity, IC = inspiratory capacity, DLCO =diffusion capacity of the lung for carbon monoxide, SRaw = specific airway resistance, PaO2 = partial pressure of arterial oxygen, PaCO2 = partial pressure of arterial carbon dioxide, HCO3 = bicarbonate, Hb = hemoglobin concentration, Hct = hematocrit. Values are means ± SD, n=10.
27
TABLE 2: INCREMENTAL EXERCISE RESULTS Value VO2, ml.kg-1.min-1 18.5 ± 4.9 VO2, l.min-1 1.52 ± 0.4 VO2, %pred 59 ± 17 PO, W 118 ± 37 PO, %pred 61 ± 17 HR, 130 ± 17 HR, %pred 84 ± 13 SpO2, % 88 ± 4 ∆SpO2, % 6 ± 4 RER 1.04 ± 0.09 VE, l.min-1 57.6 ± 21.9 VE, %pred 98 ± 44 VT, l 1.80 ± 0.55 F 32 ± 9 Dyspnea 6.7 ± 1.8 Leg Discomfort 5.3 ± 2.1 Reason for stopping Dyspnea 5 Leg Discomfort 1 Both 4
Definition of abbreviations: VO2 = peak oxygen consumption, PO = power output, HR = heart rate, SPO2 = oxyhemoglobin saturation, ∆SpO2 = change in SpO2 from resting values, RER = respiratory exchange ratio, VE = ventilation, VT = tidal volume, f = breathing frequency, n=10. Predicted values from reference (36).

28
TABLE 3: ISOTIME RESPONSES TO EXERCISES AIR HOX HE-OX HE-HOX VE, L⋅min-1 52.7 ± 22.4†§ 43.5 ± 12.6*‡ 54.0 ± 20.7†§ 44.4 ± 13.7*‡ VT, L 1.69 ± 0.55‡§ 1.72 ± 0.55‡ 1.90 ± 0.44*† 1.85 ± 0.49* F, 32.3 ± 12.6†§ 25.9 ± 5.3* 27.8 ± 6.9 23.9 ± 3.8* VCO2, L⋅min-1 1.30 ± 0.40 1.22 ± 0.33 1.32 ± 0.40 1.24 ± 0.35 PETCO2, mm Hg 34.9 ± 7.2†‡ 38.9 ± 5.1*‡§ 31.2 ± 4.3*†§ 35.2 ± 3.7†‡ TI 0.85 ± 0.42 0.91 ± 0.16 0.84 ± 0.20 1.02 ± 0.15 TE 1.27 ± 0.44§ 1.51 ± 0.41 1.45 ± 0.43 1.55 ± 0.31* TI/TTOT 0.39 ± 0.04 0.38 ± 0.03 0.37 ± 0.02 0.40 ± 0.04 IC, L 2.24 ± 0.91‡§ 2.39 ± 0.85 2.51 ± 0.85* 2.53 ± 0.90* IRV, L 0.56 ± 0.39 0.67 ± 0.40 0.60 ± 0.48 0.68 ± 0.49 EILV/TLC, % 93.9 ± 3.8 92.7 ± 3.8 93.4 ± 4.7 92.5 ± 4.9 PEEPi, cm H2O 4.4 ± 1.7‡§ 3.5 ± 3.0 2.4 ± 2.1* 2.0 ± 1.9* Peak Pes Exp, cm H2O 18.0 ± 18.6 10.7 ± 7.0 7.7 ± 5.5 8.9 ± 4.1 Peak Pes Ins, cm H2O -19.9 ± 5.8†‡§ -16.0 ± 4.5* -15.8 ± 4.4* -14.7 ± 5.2* PEF, L⋅s-1 3.00 ± 1.40†§ 2.10 ± 0.63*‡ 3.00 ± 1.04†§ 2.28 ± 0.63*‡ MEF, L⋅s-1 1.53 ± 0.61† 1.22 ± 0.36*‡ 1.62 ± 0.59†§ 1.34 ± 0.41‡ PIF, L⋅s-1 -3.16 ± 0.94†§ -2.09 ± 1.10*‡ -3.17 ± 0.91†§ -2.65 ± 0.62*‡ MIF, L⋅s-1 -2.32 ± 0.79† -1.83 ± 0.37*‡ -2.05 ± 1.45† -2.00 ± 0.54 SpO2, % 89.3 ± 4.4†§ 97.7 ± 1.3*‡ 91.4 ± 2.2†§ 98.4 ± 1.1*‡ Dyspnea 5.8 ± 2.2†‡§ 2.7 ± 0.9* 3.1 ± 1.1* 1.9 ± 1.4* Leg Discomfort 5.0 ± 1.6†§ 2.8 ± 1.6* 3.6 ± 2.2§ 2.2 ± 1.5*‡ Definition of abbreviations: VE = Ventilation, VT = tidal volume, f = breathing frequency, VCO2 = carbon dioxide produced, PETCO2 = partial pressure of end tidal carbon dioxide, TI = inspiratory time, TE = expiratory time, TI/TTOT = ratio of inspiratory time to total time, IC = Inspiratory capacity, IRV = inspiratory reserve volume, EILV = end inspiratory lung volume as a percentage of total lung capacity, PEEPi = intrinsic positive end expiratory pressure, Peak Pes Exp = peak expiratory esophageal pressure during tidal breathing, Peak Pes Ins = Peak inspiratory esophageal pressure during tidal breathing, PEF = peak expiratory flow during tidal breathing, MEF = mean expiratory flow during tidal breathing, PIF = peak inspiratory flow during tidal breathing, MIF = mean inspiratory flow during tidal breathing, SpO2 = oxyhemoglobin saturation.. * = p<0.05 vs. AIR; † = p<0.05 vs. HOX; ‡ = p<0.05 vs. HE-OX; § = p<0.05 vs. HE-HOX.
29
TABLE 4: RESPONSES TO EXERCISES AT SYMPTOM LIMITATION AIR HOX HE-OX HE-HOX VE, L⋅min-1 52.7 ± 22.4‡ 50.5 ± 19.1‡ 61.1 ± 27.4*†§ 54.2 ± 22.5‡ VT, L 1.69 ± 0.55‡§ 1.74 ± 0.56‡ 1.90 ± 0.62*† 1.84 ± 0.64* F, 32.3 ± 12.6 29.8 ± 9.8 32.1 ± 10.6 29.7 ± 7.8 VCO2, L⋅min-1 1.30 ± 040 1.34 ± 0.38 1.39 ± 0.43 1.36 ± 0.41 PETCO2, mm Hg 34.9 ± 7.2†‡ 39.0 ± 5.9*‡§ 30.2 ± 5.4*†§ 34.1 ± 5.1†‡ TI 0.85 ± 0.42 0.83 ± 0.25 0.68 ± 0.22 0.76 ± 0.18 TE 1.27 ± 0.44 1.36 ± 0.39 1.35 ± 0.41 1.40 ± 0.46 TI/TTOT 0.39 ± 0.04‡ 0.38 ± 0.02 0.34 ± 0.06* 0.36 ± 0.03 IC, L 2.24 ± 0.91 2.27 ± 0.82 2.40 ± 0.80 2.35 ± 0.85 IRV, L 0.56 ± 0.39 0.53 ± 0.29 0.51 ± 0.24 0.51 ± 0.26 EILV/TLC, % 93.9 ± 3.8 94.1 ± 2.9 94.4 ± 2.5 94.4 ± 2.7 PEEPi, cm H2O 4.4 ± 1.7‡§ 4.6 ± 2.3 3.4 ± 2.1* 4.1 ± 3.6* Peak Pes Exp, cm H2O 18.0 ± 18.6 17.5 ± 14.6 10.8 ± 7.4 12.8 ± 8.1 Peak Pes Ins, cm H2O -19.9 ± 5.8‡ -18.7 ± 4.2 -16.4 ± 3.8* -18.1 ± 5.01 PEF, L⋅s-1 3.00 ± 1.40 2.69 ± 1.15‡ 3.46 ± 1.50†§ 2.61 ± 1.05‡ MEF, L⋅s-1 1.53 ± 0.61 1.41 ± 0.49‡ 1.68 ± 0.75† 1.48 ± 0.51 PIF, L⋅s-1 -3.16 ± 0.94 -2.69 ± 1.44‡ -3.83 ± 1.36†§ -2.97 ± 0.68‡ MIF, L⋅s-1 -2.32 ± 0.79 -2.22 ± 0.56‡ -2.73 ± 1.05†§ -2.28 ± 0.55‡ SpO2, % 89.2 ± 4.4†§ 97.4 ± 1.2*‡ 91.2 ± 2.8†§ 97.8 ± 1.1*‡ Dyspnea 5.8 ± 2.2‡ 5.4 ± 2.6 4.9 ± 2.7* 5.2 ± 2.1 Leg Discomfort 5.0 ± 1.6 5.4 ± 2.1 5.6 ± 1.7 5.5 ± 2.1
Definition of abbreviations: see Table 3. * = p<0.05 vs. AIR; † = p<0.05 vs. HOX; ‡ = p<0.05 vs. HE-OX; § = p<0.05 vs. HE-HOX.
30
TABLE 5: EFFECT OF GAS MIXTURES ON PULMONARY FUNCTION AIR HOX HE-OX HE-HOX FEV1, L 1.54 ± 0.73 1.58 ± 0.70 1.89 ± 0.82* 1.82 ± 0.77* FVC, L 3.76 ± 1.13 3.73 ± 1.15 3.86 ± 1.18 3.83 ± 1.13 PEF, L.s-1 4.64 ± 1.88 4.88 ± 1.89 5.98 ± 2.29* 5.72 ± 2.06* FEF50, L.s-1 0.78 ± 0.45 0.78 ± 0.46 1.02 ± 0.55* 1.07 ± 0.75* FEF75, L.s-1 0.32 ± 0.17 0.32 ± 0.15 0.37 ± 0.16 0.35 ± 0.14 VisoV, L N/A N/A 1.35 ± 0.56 1.37 ± 0.62 VisoV, %FVC N/A N/A 36 ± 13 37 ± 15 Definition of abbreviations: FEV1 = forced expired volume in one second, FVC = forced vital capacity, PEF =peak expiratory flow, FEF50 = forced expiratory flow at 50% FVC, FEF75 = forced expiratory flow at 75% FVC, VisoV = volume of isoflow expressed as an absolute value and as a %FVC from residual volume. Values are means ± SD, n=10. * = p>0.05 vs. AIR.

31
Gas Mixture
AIR HOX HE-OX HE-HOX
Exe
rcis
e Ti
me
(Min
)
0
10
20
30
40
50# 1# 2# 3# 4# 5# 6# 7# 8# 9# 10
p = 0.019
p = 0.976
p = 0.007p = 0.048
p = 0.019
p = 0.0002Patient
Figure 1
32
0 10 20 30
Dys
pnea
(Bor
g U
nits
)
0
2
4
6
8
IT1 IT2
*†‡
*†‡
Exercise Time (Min)
0 10 20 30
Leg
Dis
com
fort
(Bor
g U
nits
)
0
2
4
6
8
AIRHOXHE-OXHE-HOX
IT1 IT2
‡
†
ll
A
*‡**B
Figure 2
33
Exercise Time (Min)
0 10 20 30
T I/T
TOT
0.25
0.30
0.35
0.40
0.45
0.50
0.55AIRHOXHE-OXHE-HOX
Exercise Time (Min)
0 10 20 30
Exp
irato
ry T
ime
(s)
0.5
1.0
1.5
2.0
2.5
3.0
3.5
0 10 20 30
Tida
l Vol
ume
(L)
0.5
1.0
1.5
2.0
2.5
IT1 IT2
0 10 20 30
Ven
tilat
ion
(L. m
in-1
)
0
15
30
45
60
75
90
0 10 20 30
F (b
reat
hs. m
in- 1
)
0
10
20
30
40
50
IT1 IT2
Exercise Time (Min)
0 10 20 30
Insp
irato
ry T
ime
(s)
0.0
0.5
1.0
1.5
2.0
2.5
3.0
IT1 IT2
IT1 IT2IT1 IT2 IT1 IT2
*‡§***‡§**
†§**†§ †‡§
ࠤ
*‡
*‡
‡
†
‡
‡*
A B C
D E F
Figure 3

34
Exercise Time (Min)0 10 20 30
Lung
Vol
umes
(%TL
C)
60
70
80
90
100IRV
VT
TLC
EILV
EELV
‡
*†‡ †‡ ll
Figure 4

35
0 10 20 30
WIR
(L. c
m H
2O-1
)
0
5
10
15
20
25
0 10 20 30
WIN
P (L
. cm
H2O
-1)
0
10
20
30
40
50
AIRHOXHE-OXHE-HOX
0 10 20 30
WIP
(L. c
m H
2O-1
)
0
2
4
6
8
10
12
Exercise Time (Min)
0 10 20 30
Tota
l Wor
k (L
.. cm
H2O
-1. m
in-1
)
0
1000
2000
3000
4000
Exercise Time (Min)
0 10 20 30
WIE
(L.. c
m H
2O-1
. min
-1)
0
500
1000
1500
2000
IT1 IT2 IT1 IT2 IT1 IT2
IT1 IT2
Exercise Time (Min)0 10 20 30
WE
( L.c
. cm
H2O
-1)
0
5
10
15
20
IT1 IT2 IT1 IT2
†‡
*†‡‡
‡
*†‡
‡
†
†
‡
‡
*†‡
*†‡‡
*‡
A B C
D E F
Figure 5
E1
ONLINE DATA SUPPLEMENT
Helium-Hyperoxia, Exercise Tolerance and Respiratory Mechanics in Chronic Obstructive Pulmonary Disease
Neil D. Eves, Stewart R. Petersen, Mark J. Haykowsky, Eric Y. Wong and Richard L. Jones
E2
METHODS
Patients
Ten clinically stable males with moderate to severe COPD (FEV1/FVC= 56 ± 10% predicted)
volunteered to participate in the study after completing a pulmonary rehabilitation program.
Individuals dependent on supplemental oxygen, with cardiovascular disease and/or
musculoskeletal abnormalities were excluded. Nine of the ten had a smoking history (56 ± 36
mean pack years). All aspects of the research protocol were explained and patients signed an
informed consent that had received institutional ethics review board approval.
Study Design
The study was a randomized crossover design, which required three separate visits to the
laboratory at the University of Alberta. The first visit consisted of a pulmonary function test with
blood gas analysis to confirm the severity of COPD and a symptom-limited incremental exercise
test to ensure the absence of cardiovascular contraindications to exercise. In the other two visits,
four constant-load symptom-limited exercise studies were performed in a randomized order (two
per visit) to examine the effect of each gas on exercise tolerance, work of breathing, lung
volumes and exertional symptoms. The patients were asked to refrain from exercise in the 24
hours before a test and to avoid smoking, alcohol and caffeine on testing days. Patients were
allowed to continue their normal bronchodilator therapy throughout the study and tests were
performed at consistent time of day. Routine spirometry was also made each day on arrival at the
laboratory to ensure pulmonary function remained consistent across testing days.
The four gas mixtures were: air (21% O2, 79% N2); hyperoxia (40% O2, 60% N2);
normoxic-helium (21% O2, 79% He) and helium-hyperoxia (40% O2, 60% He). This design

E3
allowed us to investigate the individual and combined effects of helium and 40% O2.
Throughout exercise, humidified gases were passed into a reservoir bag and supplied through a
low-resistance two-way breathing valve (2700 series, Hans Rudolph, Kansas City, MO). The
patients were blinded to the gas mixture used and were asked not to talk during, or for a short
period after exercise due to the change in vocal tone with helium.
Pulmonary Function Testing
Routine pulmonary function variables and single-breath diffusion capacity for carbon monoxide
(DLCO) were measured in the sitting position according to American Thoracic Society guidelines
(E1). Lung volumes were determined using a constant-volume body plethysmograph (6200
Autobox; SensorMedics, Yorba Linda CA). Total lung capacity was then calculated as the sum
of functional residual capacity and inspiratory capacity. Spirometry values were compared to the
reported norms of Crapo et al., (E2), DLCO was compared to the norms of Miller et al., (E3), and
lung volume values was compared to Goldman and Becklake (E4). Additionally, resting arterial
blood gases (PaO2 and PaCO2), and pH were measured from a radial artery at rest while breathing
room air.
Incremental Exercise Test
Prior to inclusion in the study, a physician-supervised incremental exercise test to symptom
limitation was performed with 12-lead ECG monitoring to determine peak oxygen consumption
(VO2peak) and to confirm that participants were free from any cardiovascular contraindications to
exercise. Participants performed the test on an electrically braked cycle ergometer (Ergoline
800S, SensorMedics, Yorba Linda, CA) and expired gases were analyzed by a calibrated
E4
metabolic measurement system (TrueOne 2400, Parvo Medics, Salt Lake City, UT). After stable
resting metabolic values were achieved, subjects cycled at 10W and the load was increased by 5-
10 W.min-1 until symptom-limitation. This protocol has been demonstrated to be appropriate for
measuring VO2peak in this population (E5). During exercise, oxyhemoglobin saturation and heart
rate were monitored continuously, while blood pressure was measured every two minutes. At
the end of each workload, exertional dyspnea and leg discomfort were evaluated using the Borg
scale (E6). On termination of the exercise test, participants were asked what symptom was
responsible for stopping exercise.
Constant Load Exercise, Lung Volumes and Respiratory Mechanics
On arrival at the laboratory, a balloon tipped catheter (Ackrad Laboratories Inc., Cranford, NJ)
was inserted for the measurement of esophageal pressure. After applying a topical anaesthetic to
the patient’s nares and nasal conchae (Xilocaine, Lidocaine Hydrochloride), the catheter was
advanced into the stomach and then withdrawn approximately 10 cm and positioned in the lower
third of the esophagus. Subjects were asked to perform a brief Valsalva maneuver while the
catheter was open to the atmosphere to empty the balloon and then the balloon was inflated to
1.0 ml as per manufacturer’s recommendation. The validity of the balloon position was assessed
using the occlusion test of Baydur et al., (E7) and then secured in place.
Subjects were seated on the cycle ergometer and after breathing the test gas for an
adequate wash-in period spirometry was performed to obtain resting pulmonary function on each
gas mixture. Resting ventilatory parameters and inspiratory capacity were also measured to
obtain baseline values. Constant-load exercise was then performed at 60% maximal workload
until symptom limitation. The rationale behind using 60% of maximal workload was that we
E5
wanted patients to achieve a symptom limited maximum within approximately 4-10 minutes of
exercise with room air. Cycling cadence was self selected between 50 and 70 rpm and patients
were then asked to maintain a constant pedaling rate during each trial. Throughout exercise,
oxyhemoglobin saturation and heart rate were monitored continuously using pulse oximetry
(Biox 3700, Ohmeda Medical Boulder, CO) and a ECG (Model 43200A, Hewlett-Packard, Palo
Alto, CA), respectively. Every two minutes, blood pressure was measured by auscultatory
sphygmomanometry and exertional dyspnea and leg discomfort were evaluated using the Borg
Scale (E6). The Borg scale was explained by anchoring the ends of the scale to descriptors such
that “0” represented no dyspnea or leg discomfort at all while “10” was indicative of the
maximal dyspnea or leg fatigue that had ever been experienced by the patient.
Two research assistants, blinded to the gas mixture used, encouraged the patients to
exercise for as long as possible in a consistent fashion. Following exercise termination, subjects
rested for 60-90 minutes before the second exercise trial was performed with a different gas.
Previous work by O’Donnell et al., (E8, E9) have demonstrated this to be adequate rest to allow
for a repeatable effort in this population. The final two constant-load trials were then completed
at a similar time on a different day. Test days were separated by at least 48 hours and were
generally repeated within a one-week period.
Ventilatory parameters [VE, inspiratory and expiratory tidal volume, breathing frequency,
inspiratory time (TI) and TE] were measured every two minutes by switching the patient from the
reservoir bag to a bag-in-box in series with a low resistance spirometer (Model 1022,
SensorMedics, Yorba Linda, CA). To confirm the spirometer calibration before each pulmonary
function test and exercise trial, the bag-in-box system was evacuated using a vacuum pump and
then filled with the experimental gas mixture. The system was flushed with the test gas and the

E6
spirometer calibration was checked using a 3L syringe. The duration of data collection varied
during each test depending on the ventilation rate as there was only a limited volume of gas in
the bag-in-box system. At all but the highest ventilation rates we were able to collect 60s worth
of data at every time point. Patients were asked to indicate if they were within approximately 30s
of symptom limitation if they were between IC measurements. This allowed adequate time for
patients to be switched onto the bag-in-box system to collect IC data at symptom limitation.
Once the patient was switched back to the reservoir bag to breathe, expired gases were passed
through the metabolic measurement system (MMC). The gas analyzers of the MMC were
calibrated before each test and verified immediately after using primary standard gases
containing appropriate concentrations of O2 and CO2 in either N2 or He. The pneumotachometer
(Hans Rudolph, Kansas City, MO) was also calibrated with the appropriate inspired gas. The
coefficient of variation for VE measured with the bag-in-box compared to the MMC was <1% for
all gases. A schematic of the experimental setup is depicted in Figure E1.
For measurement of esophageal pressure the balloon catheter was connected to a
differential pressure transducer (MP45, Validyne, Northridge, CA) that was calibrated before
each test using a water filled manometer. Signals from the spirometer and pressure transducers
were converted to a digital signal using a data acquisition system (Powerlab ML785, ADI
Instruments, Colorado Springs, CO). The volume signal from the spirometer was differentiated
to obtain flow. All data was sampled at 100Hz and stored on a computer for analysis at a later
date.
Measurement of Lung Volumes: Assuming that total lung capacity (TLC) does not change
with exercise (E10, E11), repetitive inspiratory capacity maneuvers (IC) were performed to track
changes in EELV (TLC - IC). This technique has previously been shown to be reliable for
E7
measuring EELV during exercise in this population (E11, E12). Subjects performed a minimum
of three IC maneuvers at rest and every two minutes during each of the constant-load trials. To
ensure IC maneuvers were performed accurately during exercise tidal breathing was
continuously displayed on a computer monitor while the subject breathed from the bag-in-box.
At the end of a normal expiration the patient was asked to breathe-in without warning and to give
an additional effort on top of a maximal inspiration (E11). To practice this technique and to
make sure patients could reproduce satisfactory IC maneuvers, a practice session was included
before the first constant load trial. Additionally, to guarantee that the IC maneuvers were
performed to TLC during exercise, the esophageal pressure achieved at the peak inspired volume
plateau (zero flow) was compared during exercise to resting values (E11).
Measurement of Ventilatory Mechanics: The work of breathing was estimated using
Campbell diagrams and the technique of Yan et al., (E13), which allows the inspiratory elastic
work of breathing to be separated into the work to overcome PEEPi (WIP) and the work required
to overcome the elastic recoil of the lung or the non-PEEPi inspiratory elastic load (WINP) (E13,
E14). Assuming a normal chest wall compliance in COPD (E15, E16), the static chest-wall
compliance curve was obtained from the literature taking the age and sex of our subjects into
consideration (E17). Positioning of the curve was achieved using the esophageal pressure at end
expiration during quiet breathing (E13, E14). Esophageal pressure-volume loops during tidal
breathing were then superimposed onto the chest-wall compliance curve
The points of zero flow at the start and end of inspiration were joined to identify dynamic
lung compliance and inspiratory resistive work was calculated as the area inside the pressure-
volume curve and to the left of the lung compliance line. The total elastic work performed on
inspiration was then calculated as the area enclosed by the lung compliance line and the chest-
E8
wall compliance curve. In the presence of dynamic hyperinflation, PEEPi was calculated as
pressure difference between the initiation of inspiratory effort and the start of inspiratory flow.
Inspiratory elastic work was then separated into the two aforementioned components by drawing
a line parallel to the chest-wall compliance curve passing through the point on the dynamic
pressure-volume loop where inspiratory flow started (E14). As a result, the area left of this line
represents WINP and the remaining elastic work is considered WIP. Additional work performed
by the respiratory muscles during expiration was then calculated as the portion of the pressure-
volume loop positioned to the right of the chest-wall compliance curve. This process was
performed on three esophageal pressure-volume loops at rest, symptom limitation and two
isotimes. The plots were imported into a software package to accurately determine areas (Image-
Pro Plus, Media Cybernetics, Silver Spring, MD). These results were averaged and reported both
as the work performed per breath and as a minute average by taking breathing frequency into
consideration.
Data Analysis
A one-way repeated measures analysis of variance (ANOVA) was performed at symptom
limitation, and at two isotimes during the exercise tolerance trials using commercially available
software (Statistica, Statsoft, Oklahoma city, OK). Isotime 1 and 2 were defined as symptom
limitation in the air and HOX trials, respectively. When a patient went longer on air than on an
experimental gas (n=1) or shorter on HE-HOX than HOX (n=2) the end exercise responses were
carried forward. When the ANOVA detected a significant effect, a Tukey post hoc multiple
comparisons test was performed.

E9
To ascertain any association between the improvements in exercise duration and changes
in EELV, VE, work of breathing, and/or dyspnea, simple regression analysis using Pearson
correlations were performed. In addition, the strongest significant contributors to the
improvement in exercise time were selected by multiple stepwise regression analysis. For all
analyses and post hoc comparisons the alpha level was set a priori at 0.05.

E10
E1. 1995. Standardization of Spirometry, 1994 Update. American Thoracic Society. Am J
Respir Crit Care Med 152(3):1107-36.
E2. Crapo, R. O., A. H. Morris, and R. M. Gardner. 1981. Reference spirometric values using
techniques and equipment that meet ATS recommendations. Am Rev Respir Dis 123(6):659-64.
E3. Miller, A., J. C. Thornton, R. Warshaw, H. Anderson, A. S. Teirstein, and I. J. Selikoff.
1983. Single breath diffusing capacity in a representative sample of the population of Michigan,
a large industrial state. Predicted values, lower limits of normal, and frequencies of abnormality
by smoking history. Am Rev Respir Dis 127(3):270-7.
E4. Goldman, H. I., and M. R. Becklake. 1959. Respiratory function tests; normal values at
median altitudes and the prediction of normal results. Am Rev Tuberc 79(4):457-67.
E5. O'Donnell, D. E., S. M. Revill, and K. A. Webb. 2001. Dynamic hyperinflation and
exercise intolerance in chronic obstructive pulmonary disease. Am J Respir Crit Care Med
164(5):770-7.
E6. Borg, G. A. 1982. Psychophysical bases of perceived exertion. Med Sci Sports Exerc
14(5):377-81.
E7. Baydur, A., P. K. Behrakis, W. A. Zin, M. Jaeger, and J. Milic-Emili. 1982. A simple
method for assessing the validity of the esophageal balloon technique. Am Rev Respir Dis
126(5):788-91.
E8. O'Donnell, D. E., D. J. Bain, and K. A. Webb. 1997. Factors contributing to relief of
exertional breathlessness during hyperoxia in chronic airflow limitation. Am J Respir Crit Care
Med 155(2):530-5.
E11
E9. O'Donnell, D. E., C. D'Arsigny, and K. A. Webb. 2001. Effects of hyperoxia on ventilatory
limitation during exercise in advanced chronic obstructive pulmonary disease. Am J Respir Crit
Care Med 163(4):892-8.
E10. Stubbing, D. G., L. D. Pengelly, J. L. Morse, and N. L. Jones. 1980. Pulmonary mechanics
during exercise in subjects with chronic airflow obstruction. J Appl Physiol 49(3):511-5.
E11. Yan, S., D. Kaminski, and P. Sliwinski. 1997. Reliability of inspiratory capacity for
estimating end-expiratory lung volume changes during exercise in patients with chronic
obstructive pulmonary disease. Am J Respir Crit Care Med 156(1):55-9.
E12. Dolmage, T. E., and R. S. Goldstein. 2002. Repeatability of inspiratory capacity during
incremental exercise in patients with severe COPD. Chest 121(3):708-14.
E13. Yan, S., D. Kaminski, and P. Sliwinski. 1997. Inspiratory muscle mechanics of patients
with chronic obstructive pulmonary disease during incremental exercise. Am J Respir Crit Care
Med 156(3 Pt 1):807-13.
E14. Sliwinski, P., D. Kaminski, J. Zielinski, and S. Yan. 1998. Partitioning of the elastic work
of inspiration in patients with COPD during exercise. Eur Respir J 11(2):416-21.
E15. Sharp, J. T., P. van Lith, C. v. Nuchprayoon, R. Briney, and F. N. Johnson. 1968. The
thorax in chronic obstructive lung disease. The American Journal of Medicine 44(1):39-46.
E16. Fleury, B., D. Murciano, C. Talamo, M. Aubier, R. Pariente, and J. Milic-Emili. 1985.
Work of breathing in patients with chronic obstructive pulmonary disease in acute respiratory
failure. Am Rev Respir Dis 131(6):822-7.
E17. Estenne, M., A. Heilporn, L. Delhez, J. C. Yernault, and A. De Troyer. 1983. Chest wall
stiffness in patients with chronic respiratory muscle weakness. Am Rev Respir Dis 128(6):1002-
7.

E12
Figure E1: Breathing circuit schematic of the bag in box and gas delivery system used during the
constant load trials. Thick black arrows designate path of airflow. MMC = metabolic
measurement system. Thin dashed lines indicate outputs from pressure transducers, CO2 analyzer
and the spirometer.
E13
Figure E1
Spirometer
Patient
Reservoir Bag
Bag-in-box Gas
Mixture
Pes
A/D Converter
MMC
Computer
CO2 analyzer 3-way valve