i
Healthcare-Associated Infections in Utah, 2016
Utah Department of Health Division of Disease Control and Prevention
Published October 2017

ii
2016 Annual Report
Prepared by Lindsay Snodgrass, Randon Gruninger and Rebecca Ward Division of Disease Control and Prevention Bureau of Epidemiology Utah Department of Health
Special thanks to the following individuals for their subject matter expertise, data resources, editing and consultations.
Utah Department of Health Executive Director’s Office Mark Babitz, MD State Epidemiologist Allyn K. Nakashima, MD Healthcare-Associated Infections Prevention Program Lindsay Snodgrass, MPH, CIC Randon Gruninger, MPH Susan Mottice, PhD, CIC Karen Singson, RN, MSN, CIC Sherry Varley, RN, ADN, CIC
Utah Hospitals Chief Executive Officers Infection Preventionists Chief Medical Officers Chief Nursing Officers Quality Improvement Directors Suggested Citation: Utah Department of Health. Healthcare-Associated Infections in Utah, 2016 Annual Report. Salt Lake City, UT: Utah Department of Health; October 2016. http://health.utah.gov/epi/diseases/HAI/surveillance/2016_HAI_Report.pdf
Acknowledgements

iii
FOREWORD
Healthcare-associated infections (HAIs) continue to be a major, yet often
preventable, threat to patient safety. In recent years, many of the most difficult-
to-treat HAIs are caused by organisms which are resistant to antibiotics. The
Utah Department of Health (UDOH) HAI Prevention Program is committed to
helping Utah patients receive the best and safest care. Implementing statewide
HAI prevention efforts is an essential part of a comprehensive patient safety
program. Publicly releasing of HAI data is an important step in creating
transparency for healthcare safety and quality in Utah.
The 2016 Annual Healthcare Associated Infections Report has been developed
in collaboration with the Utah Healthcare Infection Prevention Governance
Committee, a multi-disciplinary panel of state leaders in patient safety,
infectious diseases, and infection control. It provides the most current data on
Utah’s progress toward the goal of reducing and, ultimately, eliminating HAIs.
We hope that providers and patients will find the information presented here to
be useful to their understanding of HAIs and identifying practice to prevent
these infections within facilities.
We are grateful to the infection prevention practitioners and others at facilities
throughout the state that do the work of collecting and reporting these data to
the National Healthcare Safety Network. The UDOH analyzes the data from this
system to compile this report. The UDOH also regularly conducts validations of a
sample of facilities and infection types to monitor data quality and
completeness.
Allyn K. Nakashima, MD
State Epidemiologist
Utah Department of Health

Healthcare-associated Infections in Utah 2016 Annual Report
iv
Table of Contents
Acknowledgements ......................................................................................................... ii
Foreword ........................................................................................................................ iii Executive Summary....................................................................................................... vii
Introduction ................................................................................................................... 1
Targeted Assessment for Prevention (TAP) Facility Assessment Tools ....................... 2
How are Utah HAI Data Collected? ................................................................................ 3 Interpreting HAI Data
Calculating standardized infection ratios ....................................................................... 4 What does the SIR mean ............................................................................................ 4 Calculating utilization ratios......................................................................................... 6 What does the SUR mean ........................................................................................... 6 Calculating rates ........................................................................................................ 7 What does it mean if a hospital reports zero infections? ................................................ 7
Central Line-associated Bloodstream Infections (CLABSIs) ....................................... 8 Catheter-associated Urinary Tract Infections (CAUTIs) .............................................. 13
Surgical Site Infections (SSIs) ..................................................................................... 18
Clostridium difficile Infections .................................................................................... 21
Methicillin-resistant Staphylococcus aureus (MRSA) Bacteremia .............................. 23
Dialysis Infection Events .............................................................................................. 25 Data Quality Validation
Background .............................................................................................................. 27
Procedure................................................................................................................. 27 Validation key findings ............................................................................................... 28 Sensitivity, specificity, positive predictive value ............................................................ 29

Healthcare-associated Infections in Utah 2016 Annual Report
v
Table of Contents (continued) Conclusions .............................................................................................................. 30
Appendices
Appendix A: Understanding CLABSI and CAUTI Standardized Infection Ratio Data in Acute Care Facilities with Intensive Care Units (ICUs) .................................................. 31 Appendix B: Understanding SSI Data in Acute Care Facilities ........................................ 43
Appendix C: Understanding Clostridium difficile and MRSA Bacteremia Data in Acute Care Facilities ........................................................................................................... 48
Appendix D: Understanding CAUTI and CLABSI Rates in Long-term Acute Care Facilities with Intensive Care Units and Wards or Inpatient Rehabilitation Facilities ...................... 54 Appendix E: Definitions ............................................................................................. 61
References ..................................................................................................................... 64 List of Figures
Figure 1. Central line-associated bloodstream infections in adult and pediatric intensive care units in acute care facilities, Utah, 2016 ................................................................ 9 Figure 2. Central line-associated bloodstream infections in newborn intensive care units in acute care facilities, Utah, 2016 ................................................................................ 10 Figure 3. Central line-associated bloodstream infections in long-term acute care facilities, Utah, 2016 .................................................................................................. 11 Figure 4. Central line-associated bloodstream infections in inpatient non-intensive care locations in acute care facilities, Utah, 2016 ................................................................ 12
Figure 5. Catheter-associated urinary tract infections in adult and pediatric intensive care units in acute care facilities, Utah, 2016 ............................................................... 14 Figure 6. Catheter-associated urinary tract infections in rehabilitation facilities, Utah, 2016 ........................................................................................................................ 15 Figure 7. Catheter-associated urinary tract infections in long-term acute care facilities, Utah, 2016 ............................................................................................................... 16 Figure 8. Catheter-associated urinary tract infections in inpatient non-intensive care locations in acute care facilities, Utah, 2016 ................................................................ 17 Figure 9. Surgical site infections associated with colon surgeries in acute care facilities, Utah, 2016 ............................................................................................................... 19

Healthcare-associated Infections in Utah 2016 Annual Report
vi
Table of Contents (continued)
Figure 10. Surgical site infections associated with abdominal hysterectomy surgeries in acute care facilities, Utah, 2016 ................................................................................. 20 Figure 11. C. difficile infections in acute care facilities, Utah, 2016................................. 22 Figure 12. Methicillin-resistant Staphylococcus aureus bacteremia in acute care facilities, Utah, 2016 .................................................................................................. 24 Figure 13. Bloodstream infections in dialysis facilities, Utah, 2016 ................................. 26
List of Tables
Table 1. Central line-associated bloodstream infections in adult and pediatric intensive care units in acute care facilities, Utah, 2016 ............................................................... 33 Table 2. Central line-associated bloodstream infections in inpatient non-intensive care locations in acute care facilities, Utah, 2016 ................................................................ 34 Table 3. Central line-associated bloodstream infections in newborn intensive care units in acute care facilities, Utah, 2016 .............................................................................. 36 Table 4. Catheter-associated urinary tract infections in adult and pediatric intensive care units in acute care facilities, Utah, 2016 ............................................................... 37 Table 5. Catheter-associated urinary tract infections in inpatient non-intensive care locations in acute care facilities, Utah, 2016 ................................................................ 38
Table 6. Surgical site infections associated with colon surgeries in acute care facilities, Utah, 2016 ............................................................................................................... 45 Table 7. Surgical site infections associated with abdominal hysterectomy surgeries in acute care facilities, Utah, 2016 ................................................................................. 46 Table 8. C. difficile infections in acute care facilities, Utah, 2016 ................................... 50 Table 9. Methicillin-resistant Staphylococcus aureus bacteremia in acute care facilities, Utah, 2016 ............................................................................................................... 52 Table 10. Central-line associated bloodstream infections in long-term acute care facilities with intensive care units and wards, Utah, 2016 ............................................. 56 Table 11. Catheter-associated urinary tract infections in long-term acute care facilities with intensive care units and wards, Utah, 2015 .......................................................... 57
Table 12. Catheter-associated urinary tract infections in inpatient rehabilitation facilities, Utah, 2016 ................................................................................................. 58
Table 13. Dialysis event bloodstream infections, Utah, 2016 ......................................... 59
vii
Healthcare-associated infections (HAIs) are infections that are acquired while patients are receiving
treatment for another condition in a healthcare setting. The Utah Department of Health (UDOH)
works with community partners to monitor and prevent these infections because they are an
important threat to patient safety. Because of the concerns with these deadly and costly HAIs, Utah
state regulation requires the UDOH to collect data on HAIs and report this data to the public on an
annual basis. Validation of these data by UDOH is limited. Data also does not reflect variabilities of
patient acuity experienced in different facility settings. This report contains the following data:
All infections for which Centers for Medicare and Medicaid Services (CMS) requires facilities
to report to the National Healthcare Safety Network (NHSN):
o Central line-associated bloodstream infections (CLABSIs)
o Catheter-associated urinary tract infections (CAUTIs)
o Surgical site infections (SSIs) – exclusive to colon surgeries and abdominal
hysterectomy surgeries
o Clostridium difficile (C. difficile) infections, methicillin resistant Staphylococcus
aureus (MRSA) bacteremia infections
o Dialysis infection events
Identified facilities, as required by the Utah Health Code, Title 26, Chapter 6, Section 31
A comparison of data in acute care facilities, long-term acute care facilities, and inpatient
rehabilitation facilities to national baseline data.
Numbers of HAIs reported by Utah facilities during 2016 showed some significant changes
compared to the previous year’s data. CAUTIs, colon SSIs, and C. difficile infections all showed
significant increases in the state of Utah. However, MRSA bacteremia infections decreased
significantly from 2015.
Compared to national baseline data, patients in Utah facilities that reported 2016 HAI data to NHSN
experienced:
18% fewer CLABSI
18% more CAUTI
28% more surgical site infections within 30 days of colon surgery
32% more surgical site infections within 30 days of abdominal hysterectomy
7% more C. difficile infections
38% fewer MRSA bacteremia infections.
Executive Summary

Healthcare-associated Infections in Utah 2016 Annual Report
1
Introduction
Healthcare-associated infections, or HAIs, are infections that people acquire while they are
receiving treatment for another condition in a healthcare setting. HAIs can be acquired
anywhere healthcare is delivered, including inpatient acute care hospitals, outpatient settings
such as ambulatory surgical centers and end-stage renal disease facilities, and long-term care
facilities such as nursing homes and rehabilitation centers. HAIs may be caused by any
infectious agent, including bacteria, fungi, and viruses, as well as other less common types of
pathogens.
HAIs are a significant cause of morbidity and mortality. On any given day, about 1 in every 25
hospital patients has at least one healthcare-associated infection. Based on the 2014 National
and State Healthcare-Associated Infections Progress Report, most infections have decreased
compared to the national baseline. Despite progress, more action is needed at every level of
public health and healthcare to eliminate infections that commonly threaten hospital patients.1
These infections cost the U.S. healthcare system billions of dollars each year and lead to the
loss of tens of thousands of lives. In addition, HAIs can have devastating emotional, financial,
and medical consequences.2
Infections may occur as a result of complications following a surgical procedure, known as a
surgical site infection (SSI), or when staff fail to closely follow infection control practices such as
hand washing. Patients receiving medical care and taking antibiotics for long periods of time
may be more susceptible to HAIs such as C. difficile infections. These infections now rival
Staphylococcus aureus (MRSA) as the most common organism to cause HAIs in the United
States.
HAIs may also be caused by the use of various types of invasive devices, such as a central line
or urinary catheter when patients are ill. The use of such devices can harm patients’ natural
defenses against germs and the longer these devices are in place, the greater the risk of
infection.3 Types of HAIs associated with devices include central line-associated bloodstream
infections (CLABSIs), catheter-associated urinary tract infections (CAUTIs), or infections
associated with the usage of ventilators. CLABSIs, CAUTIs, and ventilator-associated pneumonia
account for roughly two-thirds of all HAIs.4
Patients who undergo dialysis or ”hemodialysis” treatment (a treatment for patients with
inadequate kidney function) also have an increased risk for an HAI. They are at high risk
because this artificial process of getting rid of waste and unwanted water in the body requires
frequent use of catheters or insertion of needles to access the bloodstream. Hemodialysis
patients also have weakened immune systems, which increase their risk for infection. They also
require frequent hospitalizations and surgery where they might acquire an infection.5
Another common HAI is caused by the bacteria C. difficile. Most C. difficile infections are
connected with receiving medical care and taking antibiotics for long periods of time.6 Half of all
hospital patients with C. difficile infections have the infection when admitted and may spread it

Healthcare-associated Infections in Utah 2016 Annual Report
2
within the facility.7 The most dangerous source of spread to others is patients with diarrhea.
MRSA is a bacterium that is resistant to many antibiotics and common in healthcare facilities. In
the community, most MRSA infections are skin infections. In medical facilities, MRSA causes life-
threatening bloodstream (or bacteremia) infections, pneumonia, and surgical site infections.
MRSA bacteremia infections reported by Utah acute care facilities are included in this report.
Targeted Assessment for Prevention (TAP) Facility Assessment Tools
In 2016, the Centers for Disease Control and Prevention (CDC) developed TAP Facility
Assessment Tools for CAUTI, CLABSI, and C. difficile infections. These tools work as gap
analysis tools to identify gaps in infection prevention practice in healthcare facilities. Each tool
contains the most updated evidence-based practices to help prevent and control each
respective type of healthcare associated infection. The UDOH worked with 15 healthcare
facilities in 2017 to complete the CAUTI and C. difficile infection assessment tools. This effort
helped the UDOH to understand the strengths and challenges among Utah short-term and long-
term acute care hospitals in implementing best practices, and also helped the facilities to
recognize their gaps in prevention practices. These resources were shared with the hospital
infection preventionists in order to utilize them in collaboration with other healthcare leaders
within their own facility. Many of the facility leaders from participating facilities shared that they
found these tools very helpful for the future direction of their programs. The tools allowed
facilities to recognize their efforts in following best practices, but also helped them to identify
gaps needed to be addressed through additional efforts and resources.
The TAP Facility Assessment Tools address best practices in different topic areas for each type
of infection, including:
• General infrastructure, capacity, and processes, including healthcare personnel training,
competency assessments, audits, and feedback to staff
• Appropriate use of central venous catheters and indwelling urinary catheters
• Proper insertion and maintenance practices for central venous catheters and indwelling
urinary catheters
• Appropriate urine culturing practices
• Antibiotic stewardship for C. difficile infection prevention
• Early detection, isolation, and appropriate testing for C. difficile
• Contact precautions and hand hygiene
• Environmental cleaning.

Healthcare-associated Infections in Utah 2016 Annual Report
3
How are Utah HAI data collected?
Identifying HAIs requires an organized approach involving several different types of activity. It
is important to determine whether infections are healthcare-associated or already present upon
facility admission. Due to the concerns about deadly and costly HAIs, state regulation (Rule
386‐705, Epidemiology, Healthcare-Associated Infection) requires the UDOH to collect and
report data on HAIs.
Since 2008, acute care hospitals with intensive care units have submitted data directly to the
UDOH for the annual HAI report; however, reporting facilities were not identified by name. In
2011, the CMS required acute healthcare facilities to report specific HAI data to the NHSN for
payment reimbursement. In 2012, Utah Health Code Title 26, Chapter 6, Section 31, Public
Reporting of Healthcare Associated Infections, was passed requiring the UDOH to: a) access
and analyze facility-specific NHSN data required by CMS; b) publish an annual HAI report for
the public in which facilities are identified by name; and c) conduct validation activities.
Facilities in Utah submit data about specific healthcare-associated infections (HAIs) to the
NHSN, a secure, online tracking system used by hospitals and other healthcare facilities. The
Utah data are reported to NHSN by each facility that is required to report HAIs to CMS. More
than 17,000 hospitals and other healthcare facilities nationwide report data to NHSN. This
information is then used for summarizing HAI data at the national level and for care
improvement by facilities, states, regions, quality groups, and national public health agencies,
including CDC.
For an HAI to be publicly reported in Utah under Title 26, Chapter 6, Section 31, an HAI must
meet CMS’s specific reporting measures required for reporting to NHSN. The UDOH works with
NHSN and other partners to monitor and prevent these infections because they are a significant
threat to patient safety.

Healthcare-associated Infections in Utah 2016 Annual Report
4
Interpreting HAI Data
Calculating Standardized Infection Ratios (SIRs)
The standardized infection ratio (SIR) is a summary statistic developed by NHSN which is used
to track HAI prevention progress over time. Progress is measured at the national, state, local,
or facility level.
The SIR compares the total number of HAI events in a healthcare facility to the predicted
number of HAI events, based on “standard population” data. For purposes of this report, the
standard population data are HAI data reported nationally by thousands of facilities using
NHSN. Facilities with small numbers of patients may not have enough HAI events to reliably
compare to the standard population. SIRs for these facilities are not included.
SIRs included in this report were calculated by NHSN using a new baseline model. NHSN is now
using 2015 data to re-set baselines for future calculated SIRs. NHSN will use 2015 data to re-
set baselines for future calculated SIRs. This new 2015 baseline will serve as a reference point
to compare the progress healthcare facilities are making in preventing infections. When NHSN
calculates the SIR for each healthcare facility, a “predicted” number of infections is created
based on reported data from previous years (i.e., baseline). This prediction method allows for
risk adjustment of reported data for different healthcare facilities, making it possible to compare
performance among similar groups of facilities. Infection prevention progress can be measured
by comparing the infection data that facilities report to NHSN that is now adjusted according to
updated risk-adjustment models. The SIRs calculated by using the 2015 baselines became
available for use in January 2017. NHSN users have the ability to analyze all data beginning
January 1, 2015, using the new 2015 re-baseline model; however, 2016 is the final year of data
that can be used to calculate SIRs using the original baseline model.
What does the SIR mean?
SIR Value Interpretation
Less than 1 There were fewer infections reported in Utah in 2016 compared to the
national baseline data, indicating progress has been made in preventing
infections.
Equal to 1 There were about the same number of infections reported in Utah in 2016
compared to the national baseline data.
More than 1 There were more infections reported in Utah in 2016 compared to the national
baseline data, indicating there has been an increase in infections.
A confidence interval (CI) is provided if an SIR was estimated for a given healthcare facility. The CI
describes the uncertainty associated with the SIR estimate. Facilities with more device days or that
perform more procedures will have narrower CIs, which means there is less doubt associated with
the accuracy of their SIRs compared to facilities performing fewer procedures. This is because there
is more information about a facility's performance with additional procedures. A 95% CI means that
Healthcare-associated Infections in Utah 2016 Annual Report
5
95 times out of 100, the true value would be expected to fall within the range shown in the table.
When 1.0 is not included in the CI, this means that the SIR is "statistically significant.” That is,
there is sufficient information to conclusively state that the SIR is either more or less than the
national baseline.
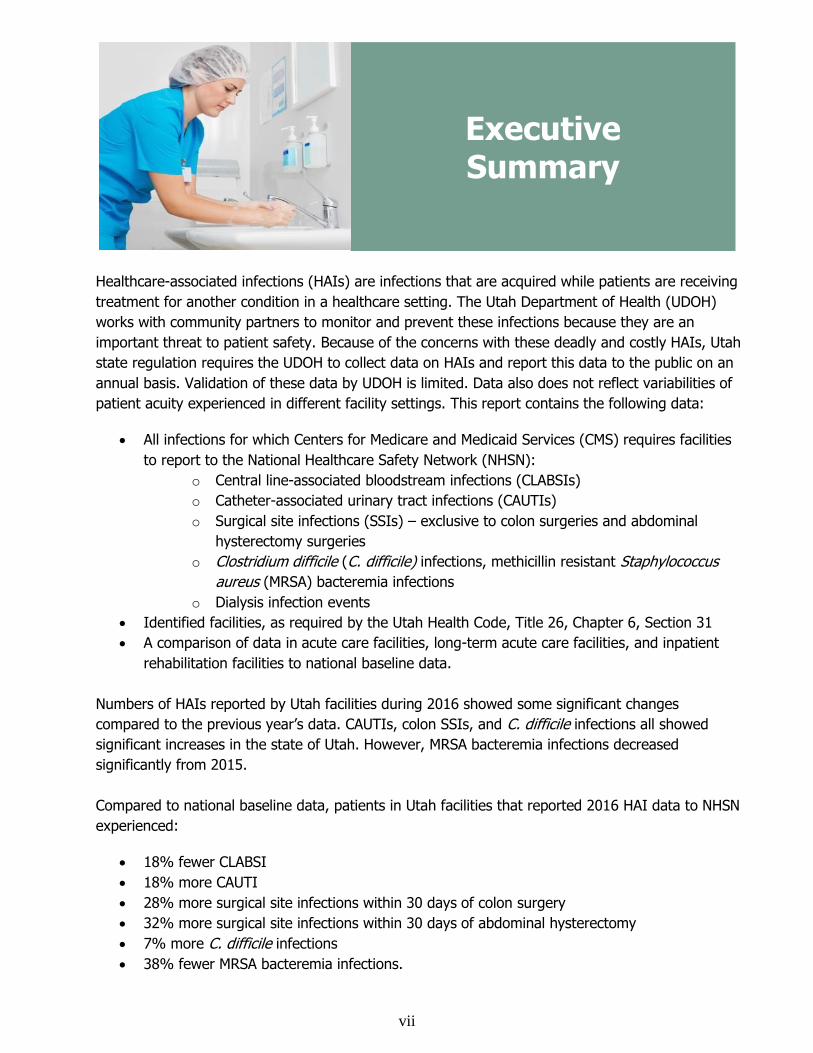
Actual values calculated for the SIR, along with confidence intervals, are found in Tables 1-12 in
the Appendix. Figures 1-13 summarize the SIR data, taking into account whether the SIR is
meaningful statistically, using the following icons.8 These symbols are used throughout this
report to show the comparison of HAIs reported in Utah to national baseline data:
Statistically FEWER infections than national baseline
Statistically MORE infections than national baseline
-- Predicted to have less than one infection for the year, but had one or more infections, as
defined by NHSN, in 2016
** Predicted to have less than one infection for the year, and did NOT have an infection, as
defined by NHSN, in 2016
FEWER infections than national baseline, but not statistically different
MORE infections than national baseline, but not statistically different
Below is an overall SIR summary of 2016 HAI data reported by Utah facilities compared to
national baseline data.
Catheter-associated Urinary Tract Infections (CAUTI)
CAUTI – intensive care settings in acute care facilities
CAUTI – non-intensive care settings in acute care facilities
CAUTI – inpatient rehabilitation settings in acute care facilities
CAUTI – long-term acute care facilities
Central Line-associated Blood Stream Infections (CLABSI)
CLABSI – intensive care settings in acute care facilities
CLABSI – non-intensive care settings in acute care facilities
CLABSI – newborn intensive care settings in acute care facilities
CLABSI – long-term acute care facilities
Surgical site infection associated with colon surgery
Surgical site infection associated with abdominal hysterectomy
Clostridium difficile (facility onset) in acute care facilities
Methicillin resistant Staphylococcus aureus (MRSA) bacteremia

Healthcare-associated Infections in Utah 2016 Annual Report
6
Calculating Standardized Utilization Ratios (SURs) The standardized utilization ratio (SUR) is a summary statistic developed by NHSN used to track
trends in device use over time. This includes use of urinary catheters, central lines, and
ventilators. Progress is measured at the national, state, local, or facility level.
The SUR compares the total number of device days in a healthcare facility to the predicted
number of device days, based on “standard utilization” data. For purposes of this report, the
standard utilization data are device days data reported nationally by thousands of facilities using
NHSN.
What does the SUR mean?
SUR Value Interpretation
Less than 1 There were fewer devices utilized in Utah in 2016 compared to the national
baseline data, indicating progress has been made in reducing device use.
Equal to 1 There were about the same number of devices utilized in Utah in 2016
compared to the national baseline data.
More than 1 There were more devices utilized in Utah in 2016 compared to the national
baseline data, indicating there has been an increase in infections device use.
Actual values calculated for the SUR, along with confidence intervals, are found in tables in
Appendices A and D. Figures 1-8 summarize the SUR data, taking into account whether the SUR
is meaningful statistically, using the following icons.8 These symbols are used throughout this
report to show the comparison of device utilization in Utah to national baseline data:
Statistically FEWER devices utilized than national baseline
Statistically MORE devices utilized than national baseline
FEWER devices utilized than national baseline, but not statistically different
MORE devices utilized than national baseline, but not statistically different

Healthcare-associated Infections in Utah 2016 Annual Report
7
Below is an overall SUR summary of 2016 HAI data reported by Utah facilities compared to
national baseline data.
Catheter-associated Urinary Tract Infections (CAUTI)
CAUTI – intensive care settings in acute care facilities
CAUTI – non-intensive care settings in acute care facilities
CAUTI – inpatient rehabilitation settings in acute care facilities
CAUTI – long-term acute care facilities
Central Line-associated Blood Stream Infections (CLABSI)
CLABSI – intensive care settings in acute care facilities
CLABSI – non-intensive care settings in acute care facilities
CLABSI – newborn intensive care settings in acute care facilities
CLABSI – long-term acute care facilities
Calculating Rates
When information for estimating a predicted number of events is not available, raw incidence
rates are provided. An incidence rate is a summary measure developed by NHSN to track HAIs
at the national, state, local, or facility level over time, and describes how frequently HAIs occur
within a specific period. This rate is calculated by taking the number of HAI events, dividing it
by the total number of device days, and multiplying that by the desired time frame. Because
healthcare facilities vary in size and patient mix, incidence rates should not be directly
compared to others. A larger facility that treats more severe illnesses will naturally have a
higher incidence rate, and consequently, is not indicative of the quality of care relative to other
facilities. Overall incidence rates for the state are not given in this report, as NHSN does not
provide these and the rates would not be comparable to other states.
What does it mean if a hospital reports zero infections?
The total number of infections listed in the data tables represents a count of the number of
infections reported by a hospital. If the number of infections is zero (0), this means the hospital
saw no infections of this type during the year. For hospitals that reported zero infections, the
size of the hospital and the total number of procedures performed versus the total number of
infections that were predicted should be considered.

Healthcare-associated Infections in Utah 2016 Annual Report
8

Healthcare-associated Infections in Utah 2016 Annual Report
9
Figure 1. Central line-associated bloodstream infections in adult and pediatric intensive care units in acute care facilities, Utah, 2016+
+Source: NHSN data
SIR
SUR
Hospital SIR SUR
State of Utah
Alta View Hospital **
American Fork Hospital **
Ashley Regional Medical Center **
Cache Valley Specialty Hospital **
Castleview Hospital **
Davis Hospital and Medical Center
Cedar City Hospital **
Dixie Regional Medical Center
Intermountain Medical Center
Jordan Valley Hospital --
Jordan Valley Hospital West Valley
Campus --
Lakeview Hospital **
LDS Hospital --
Logan Regional Hospital **
Hospital SIR SUR
State of Utah
McKay Dee Hospital
Mountain Point Medical Center **
Mountain View Hospital **
Mountain West Medical Center **
Ogden Regional Medical Center
Park City Medical Center **
Primary Children’s Hospital
Riverton Hospital **
Salt Lake Regional Medical Center
St. Mark’s Hospital
Timpanogos Regional Hospital --
Uintah Basin Medical Center **
University Hospital
Utah Valley Regional Medical
Center
Statistically FEWER infections than national baseline
Statistically MORE infections than national baseline
-- Predicted to have less than one infection for the year, but had one or more infections, as defined by NHSN, in 2016
** Predicted to have less than one infection for the year, and did NOT have an infection, as defined by NHSN, in 2016
FEWER infections than national baseline, but not statistically different
MORE infections than national baseline, but not statistically different
Statistically FEWER devices utilized than national baseline
Statistically MORE devices utilized than national baseline
FEWER devices utilized than national baseline, but not statistically different
MORE devices utilized than national baseline, but not statistically different

Healthcare-associated Infections in Utah 2016 Annual Report
10
Figure 2. Central line-associated bloodstream infections in newborn intensive care units in acute care facilities, Utah, 2016+
+Source: NHSN data *Data not available at this time for children’s hospitals
SIR
SUR
Hospital SIR SUR
State of Utah
Ashley Regional Medical Center **
Davis Hospital and Medical Center **
Dixie Regional Medical Center **
Intermountain Medical Center
Jordan Valley Hospital **
Logan Regional Hospital **
McKay-Dee Hospital
Ogden Regional Medical Center **
Primary Children’s Hospital N/A*
St. Mark’s Hospital --
Timpanogos Regional Hospital **
University Hospital
Utah Valley Regional Medical Center
Statistically FEWER infections than national baseline
Statistically MORE infections than national baseline
-- Predicted to have less than one infection for the year, but had one or more infections, as defined by NHSN, in 2016
** Predicted to have less than one infection for the year, and did NOT have an infection, as defined by NHSN, in 2016
FEWER infections than national baseline, but not statistically different
MORE infections than national baseline, but not statistically different
Statistically FEWER devices utilized than national baseline
Statistically MORE devices utilized than national baseline
FEWER devices utilized than national baseline, but not statistically different
MORE devices utilized than national baseline, but not statistically different

Healthcare-associated Infections in Utah 2016 Annual Report
11
Figure 3. Central line-associated bloodstream infections in long-term acute care
facilities, Utah, 2016+
Hospital SIR SUR
State of Utah
Landmark Hospital
Promise Hospital
Specialty Hospital of Utah
Utah Valley Specialty Hospital +Source: NHSN data
SIR
SUR
Statistically FEWER infections than national baseline
Statistically MORE infections than national baseline
-- Predicted to have less than one infection for the year, but had one or more infections, as defined by NHSN, in 2016
** Predicted to have less than one infection for the year, and did NOT have an infection, as defined by NHSN, in 2016
FEWER infections than national baseline, but not statistically different
MORE infections than national baseline, but not statistically different
Statistically FEWER devices utilized than national baseline
Statistically MORE devices utilized than national baseline
FEWER devices utilized than national baseline, but not statistically different
MORE devices utilized than national baseline, but not statistically different
Healthcare-associated Infections in Utah 2016 Annual Report
12
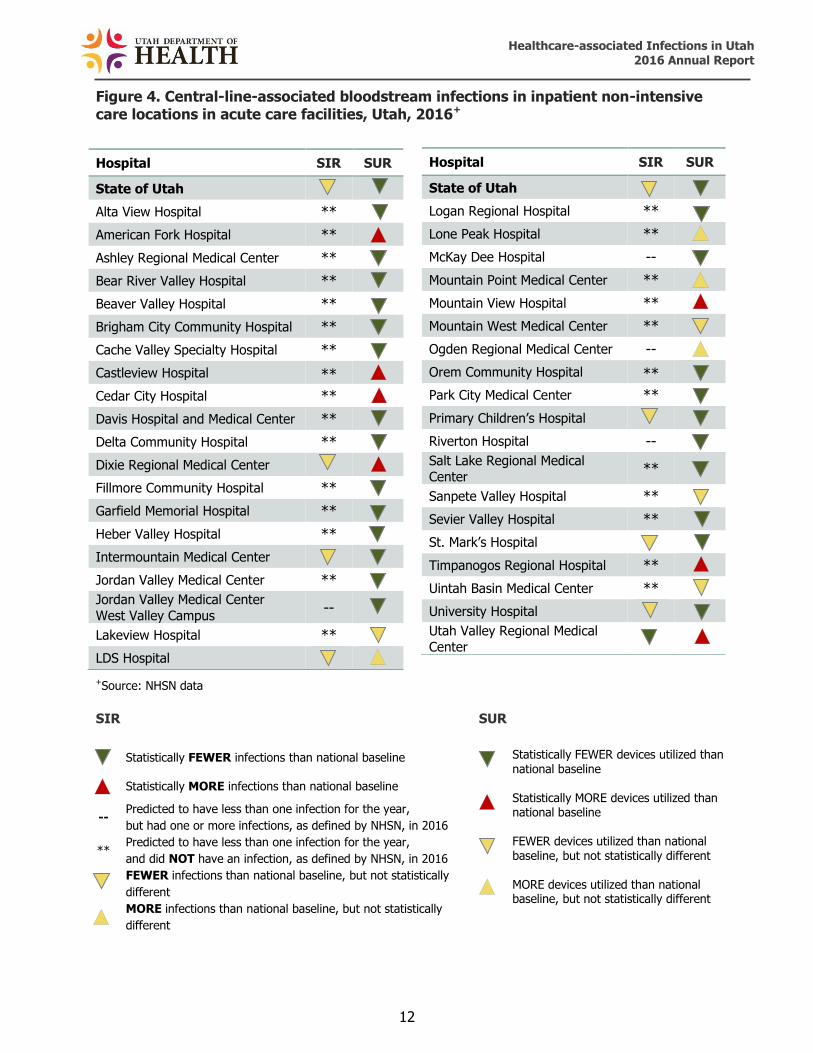
Figure 4. Central-line-associated bloodstream infections in inpatient non-intensive care locations in acute care facilities, Utah, 2016+
+Source: NHSN data SIR SUR
Statistically FEWER infections than national baseline
Statistically MORE infections than national baseline
-- Predicted to have less than one infection for the year,
but had one or more infections, as defined by NHSN, in 2016
** Predicted to have less than one infection for the year,
and did NOT have an infection, as defined by NHSN, in 2016
FEWER infections than national baseline, but not statistically
different
MORE infections than national baseline, but not statistically
different
Hospital SIR SUR
State of Utah
Logan Regional Hospital **
Lone Peak Hospital **
McKay Dee Hospital --
Mountain Point Medical Center **
Mountain View Hospital **
Mountain West Medical Center **
Ogden Regional Medical Center --
Orem Community Hospital **
Park City Medical Center **
Primary Children’s Hospital
Riverton Hospital --
Salt Lake Regional Medical
Center **
Sanpete Valley Hospital **
Sevier Valley Hospital **
St. Mark’s Hospital
Timpanogos Regional Hospital **
Uintah Basin Medical Center **
University Hospital
Utah Valley Regional Medical
Center
Hospital SIR SUR
State of Utah
Alta View Hospital **
American Fork Hospital **
Ashley Regional Medical Center **
Bear River Valley Hospital **
Beaver Valley Hospital **
Brigham City Community Hospital **
Cache Valley Specialty Hospital **
Castleview Hospital **
Cedar City Hospital **
Davis Hospital and Medical Center **
Delta Community Hospital **
Dixie Regional Medical Center
Fillmore Community Hospital **
Garfield Memorial Hospital **
Heber Valley Hospital **
Intermountain Medical Center
Jordan Valley Medical Center **
Jordan Valley Medical Center
West Valley Campus --
Lakeview Hospital **
LDS Hospital
Statistically FEWER devices utilized than national baseline
Statistically MORE devices utilized than national baseline FEWER devices utilized than national baseline, but not statistically different MORE devices utilized than national baseline, but not statistically different

Healthcare-associated Infections in Utah 2016 Annual Report
13

Healthcare-associated Infections in Utah 2016 Annual Report
14
Figure 5. Catheter-associated urinary tract infections in adult and pediatric intensive care units in acute care facilities, Utah, 2016+
+Source: NHSN data
SIR
Statistically FEWER infections than national baseline
Statistically MORE infections than national baseline
-- Predicted to have less than one infection for the year, but had one or more infections, as defined by NHSN, in 2016
** Predicted to have less than one infection for the year, and did NOT have an infection, as defined by NHSN, in 2016
FEWER infections than national baseline, but not statistically different
MORE infections than national baseline, but not statistically different
SUR
Hospital SIR SUR
State of Utah
McKay Dee Hospital
Mountain Point Medical Center **
Mountain View Hospital **
Mountain West Medical Center **
Ogden Regional Medical Center
Park City Medical Center **
Primary Children’s Hospital
Riverton Hospital **
Salt Lake Regional Medical Center
St. Mark’s Hospital
Timpanogos Regional Hospital
Uintah Basin Medical Center **
University Hospital
Utah Valley Regional Medical Center
Hospital SIR SUR
State of Utah
Alta View Hospital --
American Fork Hospital --
Ashley Regional Medical Center **
Cache Valley Hospital **
Castleview Hospital --
Cedar City Hospital **
Davis Hospital and Medical Center
Dixie Regional Medical Center
Intermountain Medical Center
Jordan Valley Hospital --
Jordan Valley Hospital West Valley
Campus --
Lakeview Hospital **
LDS Hospital
Logan Regional Hospital **
Statistically FEWER devices utilized than national baseline
Statistically MORE devices utilized than national baseline
FEWER devices utilized than national baseline, but not statistically different
MORE devices utilized than national baseline, but not statistically different

Healthcare-associated Infections in Utah 2016 Annual Report
15
Figure 6. Catheter-associated urinary tract infections in in-patient rehabilitation facilities, Utah, 2016+
Hospital SIR SUR
State of Utah
Davis Hospital and Medical Center **
Dixie Regional Medical Center --
Health South Rehabilitation Hospital of Utah **
Intermountain Medical Center --
Jordan Valley Hospital **
McKay Dee Hospital --
Northern Utah Rehabilitation Hospital --
Salt Lake Regional Medical Center **
St. Mark's Hospital **
University Hospital --
Utah Valley Hospital -- +Source: NHSN data
SIR
Statistically FEWER infections than national baseline
Statistically MORE infections than national baseline
-- Predicted to have less than one infection for the year, but had one or more infections, as defined by NHSN, in 2016
** Predicted to have less than one infection for the year, and did NOT have an infection, as defined by NHSN, in 2016
FEWER infections than national baseline, but not statistically different
MORE infections than national baseline, but not statistically different
SUR
Statistically FEWER devices utilized than national baseline
Statistically MORE devices utilized than national baseline
FEWER devices utilized than national baseline, but not statistically different
MORE devices utilized than national baseline, but not statistically different

Healthcare-associated Infections in Utah 2016 Annual Report
16
Figure 7. Catheter-associated urinary tract infections in long-term acute care
facilities, Utah, 2016+
Hospital SIR SUR
State of Utah
Landmark Hospital
Promise Hospital
Specialty Hospital of Utah
Utah Valley Specialty Hospital +Source: NHSN data
SIR
Statistically FEWER infections than national baseline
Statistically MORE infections than national baseline
-- Predicted to have less than one infection for the year, but had one or more infections, as defined by NHSN, in 2016
** Predicted to have less than one infection for the year, and did NOT have an infection, as defined by NHSN, in 2016
FEWER infections than national baseline, but not statistically different
MORE infections than national baseline, but not statistically different
SUR
Statistically FEWER devices utilized than national baseline
Statistically MORE devices utilized than national baseline
FEWER devices utilized than national baseline, but not statistically different
MORE devices utilized than national baseline, but not statistically different

Healthcare-associated Infections in Utah 2016 Annual Report
17
Figure 8. Catheter-associated urinary tract infections in inpatient non-intensive
care locations in acute care facilities, Utah, 2016+
+Source: NHSN data
SIR SUR
Statistically FEWER infections than national baseline
Statistically MORE infections than national baseline
-- Predicted to have less than one infection for the year,
but had one or more infections, as defined by NHSN, in 2016
** Predicted to have less than one infection for the year,
and did NOT have an infection, as defined by NHSN, in 2016
FEWER infections than national baseline, but not statistically
different
MORE infections than national baseline, but not statistically
different
Hospital SIR SUR
State of Utah
Logan Regional Hospital
Lone Peak Hospital **
McKay-Dee Hospital **
Mountain Point Medical Center **
Mountain View Hospital
Mountain West Medical Center **
Ogden Regional Medical Center
Orem Community Hospital **
Park City Medical Center **
Primary Children’s Hospital --
Riverton Hospital **
Salt Lake Regional Medical
Center **
Sanpete Valley Hospital **
Sevier Valley Hospital **
St. Mark’s Hospital
Timpanogos Regional Hospital **
Uintah Basin Medical Center **
University Hospital
Utah Valley Hospital
Hospital SIR SUR
State of Utah
Alta View Hospital **
American Fork Hospital **
Ashley Regional Medical Center --
Bear River Valley Hospital **
Beaver Valley Hospital **
Brigham City Community Hospital **
Cache Valley Specialty Hospital **
Castleview Hospital **
Cedar City Hospital **
Davis Hospital and Medical Center
Delta Community Hospital **
Dixie Regional Medical Center
Fillmore Community Hospital **
Garfield Memorial Hospital **
Heber Valley Hospital **
Intermountain Medical Center
Jordan Valley Medical Center
Jordan Valley Medical Center West Valley Campus
**
Lakeview Hospital **
LDS Hospital
Statistically FEWER devices utilized than national baseline Statistically MORE devices utilized than national baseline FEWER devices utilized than national baseline, but not statistically different MORE devices utilized than national baseline, but not statistically different

Healthcare-associated Infections in Utah 2016 Annual Report
18

Healthcare-associated Infections in Utah 2016 Annual Report
19
Figure 9. Surgical site infections associated with colon surgeries in acute care
facilities, Utah, 2016+
Hospital SIR
State of Utah
Alta View Hospital
American Fork Hospital
Ashley Regional Medical Center **
Bear River Valley Hospital **
Brigham City Community Hospital
Cache Valley Specialty Hospital **
Castleview Hospital --
Cedar City Hospital
Davis Hospital and Medical Center
Dixie Regional Medical Center
Intermountain Medical Center
Jordan Valley Hospital
Jordan Valley Hospital West Valley Campus
Lakeview Hospital --
LDS Hospital
Logan Regional Hospital --
Lone Peak Hospital **
McKay-Dee Hospital
Mountain Point Medical Center **
Mountain View Hospital --
Mountain West Medical Center **
Ogden Regional Medical Center
Park City Hospital --
Primary Children’s Hospital
Riverton Hospital
Salt Lake Regional Medical Center **
Sevier Valley Hospital **
St. Mark’s Hospital
Timpanogos Regional Hospital
Uintah Basin Medical Center --
University Hospital
Utah Valley Hospital +Source: NHSN data
Statistically FEWER infections than national baseline Statistically MORE infections than national baseline Predicted to have less than one infection for the year, but had one or more infections, as defined by NHSN, in 2016 Predicted to have less than one infection for the year, and did NOT have an infection, as defined by NHSN, in 2016 FEWER infections than national baseline, but not statistically different MORE infections than national baseline, but not statistically different
--
**

Healthcare-associated Infections in Utah 2016 Annual Report
20
Figure 10. Surgical site infections associated with abdominal hysterectomy surgeries in acute care facilities, Utah, 2016+
+Source: NHSN data
Hospital SIR
State of Utah
Alta View Hospital --
American Fork Hospital
Ashley Regional Medical Center --
Brigham City Community Hospital **
Castleview Hospital **
Cedar City Hospital --
Davis Hospital and Medical Center
Dixie Regional Medical Center **
Heber Valley Hospital **
Intermountain Medical Center
Jordan Valley Medical Center --
Jordan Valley Medical Center West Valley
Campus **
Lakeview Hospital **
LDS Hospital
Logan Regional Hospital --
Lone Peak Hospital **
McKay-Dee Hospital
Mountain Point Medical Center **
Mountain View Hospital **
Mountain West Medical Center **
Ogden Regional Medical Center
Orem Community Hospital **
Park City Medical Center **
Riverton Hospital
Salt Lake Regional Medical Center **
Sevier Valley Medical Center **
St. Mark’s Hospital
Timpanogos Regional Hospital
Uintah Basin Medical Center --
University Hospital
Utah Valley Hospital
Statistically FEWER infections than national baseline Statistically MORE infections than national baseline Predicted to have less than one infection for the year, but had one or more infections, as defined by NHSN, in 2016 Predicted to have less than one infection for the year, and did NOT have an infection, as defined by NHSN, in 2016
FEWER infections than national baseline, but not statistically different MORE infections than national baseline, but not statistically different
--
**

Healthcare-associated Infections in Utah 2016 Annual Report
21

Healthcare-associated Infections in Utah 2016 Annual Report
22
Figure 11. C. difficile infections in acute care facilities, Utah, 2016+
Hospital SIR
State of Utah
Alta View Hospital
American Fork Hospital
Ashley Regional Medical Center
Bear River Valley Hospital **
Beaver Valley Hospital **
Brigham City Community Hospital
Cache Valley Specialty Hospital **
Castleview Hospital
Cedar City Hospital
Davis Hospital and Medical Center
Dixie Regional Medical Center
Garfield Memorial Hospital ** HealthSouth Rehabilitation
Hospital of Utah
Heber Valley Hospital **
Intermountain Medical Center
Jordan Valley Medical Center
Jordan Valley Medical Center
West Valley Campus
Lakeview Hospital
Landmark Hospital
LDS Hospital
Logan Regional Hospital
Lone Peak Hospital
McKay Dee Hospital
+Source: NHSN data
Statistically FEWER infections than national baseline
Statistically MORE infections than national baseline
-- Predicted to have less than one infection for the year, but had one or more infections, as defined by NHSN, in 2016
** Predicted to have less than one infection for the year, and did NOT have an infection, as defined by NHSN, in 2016
FEWER infections than national baseline, but not statistically different
MORE infections than national baseline, but not statistically different
Hospital SIR
State of Utah
Mountain Point Medical Center
Mountain View Hospital
Mountain West Medical Center
Northern Utah Rehabilitation Hospital
Ogden Regional Medical Center
Orem Community Hospital **
Park City Medical Center
Primary Children’s Hospital
Promise Hospital of Salt Lake --
Riverton Hospital
Salt Lake Regional Medical
Center
Sanpete Valley Hospital --
Sevier Valley Hospital **
Shriners **
South Davis Community Hospital
St. Mark’s Hospital
The Orthopedic Specialty
Hospital **
Timpanogos Regional Hospital
Uintah Basin Medical Center
University Hospital
Utah Valley Hospital
Utah Valley Specialty Hospital

Healthcare-associated Infections in Utah 2016 Annual Report
23

Healthcare-associated Infections in Utah 2016 Annual Report
24
Figure 12. Methicillin-resistant Staphylococcus aureus bacteremia in acute care facilities, Utah, 2016+
Hospital SIR
State of Utah
Alta View Hospital **
American Fork Hospital **
Ashley Regional Medical Center **
Bear River Valley Hospital **
Beaver Valley Hospital **
Brigham City Community Hospital **
Cache Valley Specialty Hospital **
Castleview Hospital **
Cedar City Hospital **
Davis Hospital and Medical Center **
Dixie Regional Medical Center
Garfield Memorial Hospital ** HealthSouth Rehabilitation Hospital of Utah **
Heber Valley Hospital **
Intermountain Medical Center
Jordan Valley Medical Center
Jordan Valley Medical Center West Valley Campus
--
Lakeview Hospital --
Landmark Hospital **
LDS Hospital
Logan Regional Hospital **
Lone Peak Hospital **
+Source: NHSN data
Statistically FEWER infections than national baseline
Statistically MORE infections than national baseline
-- Predicted to have less than one infection for the year, but had one or more infections, as defined by NHSN, in 2016
** Predicted to have less than one infection for the year, and did NOT have an infection, as defined by NHSN, in 2016
FEWER infections than national baseline, but not statistically different
MORE infections than national baseline, but not statistically different
Hospital SIR
State of Utah
McKay Dee Hospital
Mountain Point Medical Center **
Mountain View Hospital **
Mountain West Medical Center **
Northern Utah Rehabilitation
Hospital **
Ogden Regional Medical Center
Orem Community Hospital **
Park City Medical Center **
Primary Children’s Hospital
Promise Hospital of Salt Lake
Riverton Hospital **
Salt Lake Regional Medical Center **
Sanpete Valley Hospital **
Sevier Valley Hospital **
South Davis Community Hospital
St. Mark’s Hospital
The Orthopedic Specialty Hospital **
Timpanogos Regional Hospital --
Uintah Basin Medical Center --
University Hospital
Utah Valley Hospital
Utah Valley Specialty Hospital

Healthcare-associated Infections in Utah 2016 Annual Report
25

Healthcare-associated Infections in Utah 2016 Annual Report
26
Figure 13. Dialysis event bloodstream infections, Utah, 2016+
+Source: NHSN
Facility SIR
State of Utah
Pleasant View Dialysis Center
Primary Children’s Dialysis Center
Provo Dialysis
Sevier Valley Dialysis
South Mountain Dialysis
South Valley Dialysis Center
Tooele Valley Dialysis
UBMC Dialysis Roosevelt
Uintah Basin Medical Center Dialysis
Vernal --
University of Utah Dialysis Program Dixie Dialysis
Utah Dialysis Center
Utah Valley Dialysis Center
Wasatch Artificial Kidney Center
Weber Valley Dialysis
West Bountiful Dialysis --
West Valley Dialysis Clinic
Woods Cross Dialysis
Facility SIR
State of Utah
American Fork Dialysis Center
Blue Mountain Hospital Dialysis
Center
Bonneville Dialysis Center
Castleview Dialysis Center
Farmington Bay Dialysis Center
Hurricane Dialysis **
Intermountain Medical Center
Dialysis Center
Iron Mission Dialysis Center
Kolff Dialysis Center
Lakeside Dialysis Center
Liberty Dialysis Layton
Liberty Dialysis St. George
Liberty Dialysis West Jordan
Logan Regional Dialysis Center
Lone Peak Dialysis
Mark Lindsay Dialysis Center
Oquirrh Artificial Kidney Center
Payson Regional Dialysis
Statistically FEWER infections than national baseline
Statistically MORE infections than national baseline
-- Predicted to have less than one infection for the year, but had one or more infections, as defined by NHSN, in 2016
** Predicted to have less than one infection for the year, and did NOT have an infection, as defined by NHSN, in 2016
FEWER infections than national baseline, but not statistically different
MORE infections than national baseline, but not statistically different

Healthcare-associated Infections in Utah 2016 Annual Report
27
Data Quality Validation
Background The UDOH is required under Utah Title 26-6-31, Public Reporting of Healthcare Associated
Infections, to validate data reported to NHSN. Guidance from the CDC helped to guide the
selection of infection types for validation of 2016 NHSN data. This guidance included the use of
results of TAP reports to prioritize activities, an increased focus on antimicrobial resistance and
activities directed towards C. difficile prevention, and a change in focus of prevention efforts to
target networks among healthcare facilities, not specific facility types. This information led
UDOH to perform validation of CAUTIs and C. difficile infection (CDI) LabID events.
The focus of these validation activities was to determine how NHSN CAUTI and CDI LabID
event surveillance definitions were interpreted and applied to data collection. The validations
were performed by the UDOH Healthcare-Associated Infections and Antimicrobial Resistance
Program at 15 healthcare facilities throughout the state. Facilities were chosen based on an
NHSN targeted selection process from the NHSN External Validation Guidance and Toolkit for
2016. The facility selection process was targeted to prioritize validation of facilities where HAIs
were most expected. This method compared facilities’ SIR and cumulative attributable
difference (CAD) scores to help identify those facilities with high risk of HAIs, but also those
facilities whose scores showed that they were performing well in their practices to prevent
infection.
Validation activities are intended to compare reported information in NHSN with UDOH audit
findings and outcomes to enhance accuracy and completeness of CAUTI and CDI LabID
reporting. A standardized validation method, as guided by NHSN, was chosen to serve as a test
of proficiency in surveillance methods and accuracy in case findings.
Procedure An on-site medical record audit was conducted at the chosen healthcare facilities. Each visit
started with an interview of at least one member of the infection prevention staff to learn about
surveillance methodology, data collection, and personal training and education on applying
NHSN criteria. CDC TAP Facility Assessment Tools for CAUTI and CDI were also utilized at each
facility to determine current prevention practices and make recommendations based upon the
responses. In each facility, up to 20 charts of patients who were determined to have a CAUTI in
2016 were reviewed to determine if they correctly met the CAUTI criteria, and up to 30 charts
of patients who had a positive urine culture (a urine culture with no more than two species of
organisms identified, at least one of which is a bacterium of >105 CFU/mL), but were not
classified as a CAUTI, were also reviewed to determine if any reportable infections were missed.
Additionally, up to 50 charts of patients with a positive laboratory test result for C. difficile toxin
A and/or B, or a toxin-producing C. difficile organism detected by culture or other laboratory
means, were reviewed to ensure all reportable CDI LabID were reported to NHSN in 2016.
Results of the validation findings were reviewed with the facility to provide immediate onsite
education to improve HAI surveillance and reporting. Facilities were expected to correct data in
NHSN based on validation findings.

Healthcare-associated Infections in Utah 2016 Annual Report
28
Validation Key Findings

Healthcare-associated Infections in Utah 2016 Annual Report
29

Healthcare-associated Infections in Utah 2016 Annual Report
30
Conclusions
Validation results indicate that the number of CAUTIs generally as accurate as reported
surveillance data prior to validation activities. However, the number of CDI LabID events is
much higher than initially indicated by reported surveillance data before validation activities
took place.
Most infection preventionists at the validated facilities were able to correctly determine which
patients met the CAUTI definition and apply the definition appropriately. When performing
CAUTI validation, the criteria used to meet the definition included: a urine culture with no more
than two species of organisms identified, at least one of which is a bacterium of >105 CFU/mL;
an indwelling urinary catheter that had been in place for greater than two days on the date of
event, and appropriate signs and symptoms that were present at the appropriate time during
the infection window period. If no signs or symptoms were present but all other criteria were
met, then a blood specimen with at least one matching bacterium to the bacterium in the urine
specimen could be used to meet criteria for a CAUTI.
When performing validation of CDI LabID events, a specific set of criteria must be followed that
are different than criteria followed for other healthcare-associated infection types. There was
some confusion among infection preventionists about reporting of CDI LabID events. Some
facilities mistakenly classified toxin-positive C. difficile tests collected within the first two days of
admission as present on admission (POA); however, the POA classification does not apply to
LabID events. These events within the first two days of admission would be categorized by
NHSN as community-onset (CO) events, and events reported to NHSN with this classification
will be included in the facility’s risk adjusted SIR. Excluding these events from NHSN reporting
can lead to a falsely increased SIR because the model to calculate the SIR has not been risk-
adjusted based on the number of CO events reported. Also, several facilities were not aware
that the NHSN LabID event criteria includes a 14-day rule to determine if a positive CDI test is a
duplicate test. A duplicate C. difficile-positive test is defined as any C. difficile-toxin positive lab
result from the same patient and locations, following a previous C. difficile toxin-positive lab
result within the past two weeks (14 days). Healthcare facilities do not need to report these
events to NHSN, as they will be excluded from calculations of CDI LabID rates and SIRs.

Healthcare-associated Infections in Utah 2016 Annual Report
31
Appendix A
Understanding CLABSI and CAUTI Standardized Infection Ratio Data in Acute Care Facilities with
Intensive Care Units
The device infection event tables depict specific device-associated infections (central line-associated bloodstream infections [CLABSI] or
catheter-associated urinary tract infections [CAUTI]) reported by acute care facilities within their intensive care units.
To understand the HAI report, it is important to know the meaning of each of the data elements in the table. Below is an example of a
fictitious hospital’s data. Each column is numbered and provides an explanation of each data element and its result.
Table A. Device infection events in acute care facilities with intensive care units, Utah, 2016
Number of
HAI device days
Number of
HAI device events
Predicted
number of HAI device events
Standardized
Infection Ratio
95%
Confidence Interval
Predicted number of
HAI device days
Standardized
Utilization Ratio
95%
Confidence Interval
State of Utah # # # # # # # #
Facility A 5,817 8 13 .62 0.26-1.21 6,000 0.97 0.94-0.99
1. Acute care facilities (hospitals) with intensive care units (ICU) are listed here by name (Facility A).
2. For each reporting facility listed, patients in ICUs with central line catheters/urinary catheters (devices) are identified every day. A device
count is performed at the same time each day. Each patient with one or more central line catheters at the time the count is performed is
counted as having one device day. Each patient with a urinary catheter at the time the count is performed is counted as having one
device day. For example, a patient with one or more central line catheters and one urinary catheter would be counted as having one
central line day and one urinary catheter day. The number of device days in this column (5,817) represents the total number of specific
device days for all patients who were in Facility A’s intensive care unit(s) during the year.
3. When a patient develops an HAI device-associated infection while having a device in place or within one day after removal of the device,
the infection is considered a device-associated HAI if it meets the criteria set forth by NHSN. The number of HAI events in this column
(8) represents the total number of specific HAIs identified in patients in Facility A’s intensive care units during the year.
1 2 3 4 5 6 7 8 9

Healthcare-associated Infections in Utah 2016 Annual Report
32
4. The predicted number of HAI device events is adjusted to allow facilities to be more fairly compared. Risk adjustments account for
differences in facility populations and other factors that may affect the risk of developing an HAI. A facility that uses many devices on
very sick patients would be predicted to have a higher device infection rate than a facility that uses fewer devices and has healthier
patients. The predicted number of HAI device events for Facility A, based on comparison to a national HAI benchmark of similar
hospitals, is calculated as 13.
5. The standardized infection ratio (SIR) is a summary measure developed by NHSN to track HAIs at the national, state, local, or facility
level over time. The SIR compares the total number of HAI device events for Facility A (8) to the predicted number of HAI device events
(13), based on “standard population” data. For purposes of this report, the standard population is HAI data reported nationally by
thousands of facilities using NHSN. The SIR for Facility A, based on comparison to a national HAI benchmark of facilities that are similar
to Facility A, is calculated as 0.62. Facilities with a predicted number of HAI events less than one do not have enough device day data to
reliably compare their data to the standard population. Consequently, SIRs are not provided for health care facilities with a predicted
number less than one.
6. A confidence interval (CI) will be provided if a SIR was estimated for a given healthcare facility. A CI describes the uncertainty
associated with the SIR estimate. Facilities with more device days will have a narrower CI, which means there is less doubt associated
with the accuracy of the SIR compared to facilities with fewer device days. This is because there is more information about a facility's
performance with additional device days. A 95% CI means that 95 times out of 100, the true value would be expected to fall within the
range shown.
7. The predicted number of HAI device days is adjusted to allow facilities to be more fairly compared. Risk adjustments account for
differences in facility populations and other factors that may affect the risk of developing an HAI. A facility that uses many devices on
very sick patients would be predicted to have higher device days than a facility that uses fewer devices and has healthier patients. The
predicted number of HAI device days for Facility A, based on comparison to a national HAI benchmark of similar hospitals, is calculated
as 6,000.
8. The Standardized Utilization Ratio (SUR) is comparable to Device Utilization Rates (DURs) because they both measure device utilization,
but they are slightly different in the way they are calculated. SURs are a scalable, risk-adjusted measure that can be compared across
locations and facilities because they are risk-adjusted-accordingly. Whereas, DURs can only be compared amongst the same location.
SURs can also indicate whether the observed number of device utilization days is better, worse, or the same than the predicted number
of device utilization days.
9. A confidence interval (CI) will be provided if a SUR was estimated for a given healthcare facility. A CI describes the uncertainty
associated with the SUR estimate. Facilities with more device days will have a narrower CI, which means there is less doubt associated
with the accuracy of the SUR compared to facilities with fewer device days. This is because there is more information about a facility's
performance with additional device days. A 95% CI means that 95 times out of 100, the true value would be expected to fall within the
range shown.

Healthcare-associated Infections in Utah 2016 Annual Report
33
Table 1. Central line-associated bloodstream infections in adult and pediatric intensive care units in acute care facilities, Utah, 2016+
Number of
central
line days1
Number
of
CLABSI events2
Predicted number
of
CLABSI events3
Standardized
Infection Ratio4
95%
Confidence Interval5
Predicted
number of
central line days6
Standardized
Utilization Ratio7
95%
Confidence Interval8
State of Utah 51,614 50 59.56 0.84 0.63 – 1.10 54,089 0.95 0.95 – 0.96
Alta View Hospital 125 0 0.08 ** ** 239 0.52 0.44 – 0.62
American Fork Hospital 609 0 0.41 ** ** 440 1.38 1.28 – 1.50
Ashley Regional Medical Center 90 0 0.06 ** ** 134 0.67 0.54 – 0.82
Cache Valley Hospital 5 0 0.00 ** ** 2.3 2.17 0.80 – 4.82
Castleview Hospital 33 0 0.02 ** ** 206 0.16 0.11 – 0.22
Cedar City Hospital 266 0 0.18 ** ** 161 1.65 1.46 – 1.86
Davis Hospital & Medical Center 1,112 3 1.12 2.68 0.68 – 7.29 1,360 0.82 0.77 – 0.87
Dixie Regional Medical Center 3,720 4 3.23 1.24 0.39 – 2.99 2,770 1.34 1.30 – 1.39
Intermountain Medical Center 8,574 17 9.67 1.76 1.06 – 2.76 10,941 0.78 0.77 – 0.80
Jordan Valley Hospital 767 2 0.58 -- -- 1,090 0.70 0.65 – 0.75
Jordan Valley Hospital West Valley
Campus 672 1 0.51 -- -- 841 0.80 0.74 – 0.86
Lakeview Hospital 600 0 0.45 ** ** 345 1.74 1.60 – 1.88
LDS Hospital 969 1 0.98 -- -- 1,022 0.95 0.89 – 1.01
Logan Regional Hospital 309 0 0.23 ** ** 723 0.43 0.38 – 0.48
McKay Dee Hospital 2,931 2 2.95 0.68 0.11 – 2.24 1,928 1.52 1.47 – 1.58
Mountain Point Medical Center 144 0 0.10 ** ** 362 0.40 0.34 – 0.47
Mountain View Hospital 678 0 0.51 ** ** 533 1.27 1.18 – 1.37
Mountain West Medical Center 124 0 0.08 ** ** 71 1.76 1.47 – 2.09
Ogden Regional Medical Center 1,842 1 1.39 0.72 0.04 – 3.55 1,328 1.39 1.33 – 1.45
Primary Children's Hospital 4,579 7 7.61 0.92 0.40 – 3.55 5,279 0.87 0.84 – 0.89
Riverton Hospital 60 0 0.04 ** ** 150 0.40 0.31 – 0.51
Salt Lake Regional Medical Center 1,649 1 1.44 0.69 0.03 – 3.42 2,137 0.77 0.74 – 0.81
St. Mark's Hospital 1,960 1 1.97 0.51 0.03 – 2.50 2,246 0.87 0.83 – 0.91
Timpanogos Regional Hospital 1,108 3 0.83 -- -- 1,041 1.06 1.00 – 1.13
Uintah Basin Medical Center 77 0 0.05 ** ** 261 0.29 0.23 – 0.37
University Hospital§ 11,914 7 18.33 0.38 0.17 – 0.76 13,283 0.90 0.88 – 0.91
Utah Valley Hospital 6,631 0 6.68 0.00 0.00 – 0.45 5,068 1.31 1.28 – 1.34 +Source: NHSN data.
See footnotes on page 40.

Healthcare-associated Infections in Utah 2016 Annual Report
34
Table 2. Central line-associated bloodstream infections in inpatient non-intensive care locations in acute care facilities, Utah, 2016+
Number
of central line days1
Number
of
CLABSI events2
Predicted number
of
CLABSI events3
Standardized
Infection Ratio4
95%
Confidence Interval5
Predicted
number of
central line days6
Standardized
Utilization Ratio7
95%
Confidence Interval8
State of Utah 50,892 33 43.51 0.76 0.53 – 1.05 56,421 0.90 0.89 – 0.92
Alta View Hospital 215 0 0.12 ** ** 512 0.42 0.37 – 0.48
American Fork Hospital 983 0 0.57 ** ** 648 1.52 1.43 – 1.61
Ashley Regional Medical Center 72 0 0.04 ** ** 150 0.48 0.38 – 0.60
Bear River Valley Hospital 18 0 0.01 ** ** 59 0.31 0.19 – 0.47
Beaver Valley Hospital 0 0 0.00 ** ** 55 0.00 0.00 – 0.05
Brigham City Community Hospital 52 0 0.03 ** ** 80 0.65 0.49 – 0.85
Cache Valley Hospital 87 0 0.05 ** ** 121 0.72 0.58 – 0.88
Castleview Hospital 196 0 0.11 ** ** 165 1.19 1.03 – 1.36
Cedar City Hospital 759 0 0.44 ** ** 282 2.69 2.51 – 2.89
Davis Hospital & Medical Center 457 0 0.40 ** ** 965 0.47 0.43 – 0.52
Delta Community Hospital 38 0 0.01 ** ** 62 0.61 0.44 – 0.83
Dixie Regional Medical Center 4,915 3 3.43 0.87 0.22 – 2.38 3,588 1.37 1.33 – 1.41
Fillmore Community Hospital 86 0 0.02 ** ** 257 0.34 0.27 – 0.41
Garfield Memorial Hospital 28 0 0.01 ** ** 83 0.34 0.23 – 0.48
Heber Valley Medical Center 5 0 0.00 ** ** 51 0.10 0.04 – 0.22
Intermountain Medical Center 10,167 7 9.57 0.73 0.32 – 1.45 14,347 0.71 0.69 – 0.72
Jordan Valley Hospital 959 0 0.53 ** ** 1,721 0.56 0.52 – 0.59
Jordan Valley Hospital West Valley
Campus 270 1 0.18 -- -- 566 0.48 0.42 – 0.54
Lakeview Hospital 344 0 0.22 ** ** 374 0.92 0.83 – 1.02
LDS Hospital 1,894 1 1.65 0.61 0.03 – 2.99 1,835 1.03 0.99 – 1.08
Logan Regional Hospital 535 0 0.35 ** ** 858 0.62 0.57 – 0.68
Lone Peak Hospital 156 0 0.09 ** ** 141 1.10 0.94 – 1.29
McKay Dee Hospital 941 1 0.70 -- -- 1,368 0.69 0.64 – 0.73
Mountain Point Medical Center 42 0 0.02 ** ** 37 1.15 0.84 – 1.54
Mountain View Hospital 453 0 0.29 ** ** 363 1.25 1.14 – 1.37
Mountain West Medical Center 142 0 0.08 ** ** 150 0.95 0.80 – 1.11
Ogden Regional Medical Center 1,501 2 0.98 -- -- 1,494 1.00 0.96 – 1.06
Orem Community Hospital 2 0 0.00 ** ** 11 0.18 0.03 – 0.58
Park City Hospital 107 0 0.06 ** ** 191 0.56 0.46 – 0.67

Healthcare-associated Infections in Utah 2016 Annual Report
35
Table 2 continued
Number
of central line days1
Number
of
CLABSI events2
Predicted number
of
CLABSI events3
Standardized
Infection Ratio4
95%
Confidence Interval5
Predicted
number of
central line days6
Standardized
Utilization Ratio7
95%
Confidence Interval8
Primary Children's Hospital 6,226 6 7.09 0.85 0.34 – 1.76 6,830 0.91 0.89 – 0.93
Riverton Hospital 232 1 0.15 -- -- 631 0.37 0.32 – 0.42
Salt Lake Regional Medical Center 388 0 0.18 ** ** 534 0.73 0.60 – 0.88
Sanpete Valley Hospital 100 0 0.03 ** ** 119 0.84 0.69 – 1.02
Sevier Valley Hospital 108 0 0.06 ** ** 147 0.73 0.60 – 0.88
St. Mark's Hospital 1,891 1 1.42 0.70 0.04 – 3.46 2,299 0.82 0.79 – 0.86
Timpanogos Regional Hospital 515 0 0.34 ** ** 337 1.53 1.40 – 1.66
Uintah Basin Medical Center 223 0 0.13 ** ** 242 0.92 0.81 – 1.05
University Hospital§ 10,714 10 10.07 0.99 0.50 – 1.77 11,168 0.96 0.94 – 0.98
Utah Valley Hospital 4,995 0 4.01 0.00 0.00 – 0.75 3,525 1.42 1.38 – 1.46 +Source: NHSN data.
See footnotes on page 40.

Healthcare-associated Infections in Utah 2016 Annual Report
36
Table 3. Central line-associated bloodstream infections in newborn intensive care units in acute care facilities, Utah, 2016+
Number
of central
line days1
Number of
CLABSI
events2
Predicted number of
CLABSI
events3
Standardized
Infection
Ratio4
95%
Confidence
Interval5
Predicted number of
central
line days6
Standardized
Utilization
Ratio7
95%
Confidence
Interval8
State of Utah 17,796* 12 22.34 0.54 0.29 – 0.91 13,775 * 0.79* 0.79* – 0.8
Ashley Regional Medical Center 6 0 0.00 ** ** 19 0.32 0.13 – 0.66
Davis Hospital & Medical Center 116 0 0.18 ** ** 325 0.36 0.30 – 0.43
Dixie Regional Medical Center 349 0 0.48 ** ** 532 0.66 0.59 – 0.73
Intermountain Medical Center 2,032 1 2.61 0.38 0.02 – 1.89 2,556 0.79 0.76 – 0.83
Jordan Valley Hospital 693 0 0.55 ** ** 418 1.66 1.54 – 1.78
Logan Regional Hospital 242 0 0.17 ** ** 212 1.14 1.01 – 1.30
McKay Dee Hospital 741 2 1.08 1.84 0.31 – 6.09 1,387 0.53 0.50 – 0.57
Ogden Regional Medical Center 231 0 0.35 ** ** 472 0.49 0.43 – 0.56
Primary Children's Hospital 6,713 4 7.84 0.51 0.16 – 1.23 N/A N/A N/A
St. Mark's Hospital 559 1 0.56 -- -- 876 0.64 0.59 – 0.69
Timpanogos Regional Hospital 527 0 0.50 ** ** 470 1.12 1.03 – 1.22
University Hospital§ 2,361 4 3.36 1.19 0.38 – 2.87 3,781 0.62 0.60 – 0.65
Utah Valley Hospital 3,226 0 4.66 0.00 0.00 – 0.64 2,726 1.18 1.14 – 1.22 +Source: NHSN data.
See footnotes on page 41.

Healthcare-associated Infections in Utah 2016 Annual Report
37
Table 4. Catheter-associated urinary tract infections in adult and pediatric intensive care units in acute care facilities, Utah,
2016+
Number
of catheter
days1
Number
of CAUTI
events2
Predicted
number of CAUTI
events3
Standardized Infection
Ratio4
95% Confidence
Interval5
Number of
predicted catheter
days6
Standardized Utilization
Ratio7
95% Confidence
Interval8
State of Utah 58,519 102 77.93 1.31 1.07 – 1.58 62,660 0.93 0.93 – 0.94
Alta View Hospital 235 1 0.13 -- -- 398 0.59 0.52 – 0.67
American Fork Hospital 643 1 0.47 -- -- 733 0.88 0.81 – 0.95
Ashley Regional Medical Center 200 0 0.11 ** ** 324 0.62 0.54 – 0.71
Cache Valley Hospital 5 0 0.00 ** ** 5.6 0.90 0.33 – 2.00
Castleview Hospital 87 1 0.05 -- -- 498 0.17 0.14 – 0.21
Cedar City Hospital 355 0 0.22 ** ** 389 0.91 0.82 – 1.01
Davis Hospital & Medical Center 1,639 1 1.67 0.60 0.03 – 2.95 1,929 0.85 0.81 – 0.89
Dixie Regional Medical Center 4,349 0 3.90 0.00 0.00 – 0.77 3,930 1.11 1.07 – 1.14
Intermountain Medical Center 10,512 34 17.24 1.97 1.39 – 2.72 11,867 0.89 0.87 – 0.90
Jordan Valley Hospital 1,151 3 0.84 -- -- 1,547 0.74 0.70 – 0.79
Jordan Valley Hospital West Valley Campus
1,240 1 0.91 -- -- 1,401 0.89 0.84 – 0.94
Lakeview Hospital 765 0 0.57 ** ** 574 1.33 1.24 – 1.43
LDS Hospital 1,094 0 1.12 0.00 0.00 – 2.68 1,450 0.75 0.71 – 0.80
Logan Regional Hospital 679 0 0.51 ** ** 1,204 0.56 0.52 – 0.61
McKay Dee Hospital 2,914 1 2.98 0.34 0.02 – 1.66 2,371 1.23 1.18 – 1.27
Mountain Point Medical Center 257 0 0.14 ** ** 873 0.29 0.26 – 0.33
Mountain View Hospital 971 0 0.71 ** ** 887 1.09 1.03 – 1.16
Mountain West Medical Center 174 0 0.10 ** ** 170 1.02 0.88 – 1.18
Ogden Regional Medical Center 2,328 4 1.70 2.35 0.75 – 5.67 1,884 1.24 1.19 – 1.29
Primary Children's Hospital 2,309 4 3.51 1.14 0.36 – 2.75 1,579 1.46 1.40 – 1.52
Riverton Hospital 135 0 0.10 ** ** 250 0.54 0.45 – 0.64
Salt Lake Regional Medical Center 1,721 0 1.43 0.00 0.00 – 2.09 3,032 0.57 0.54 – 0.59
St. Mark's Hospital 3,189 1 3.26 0.31 0.02 – 1.51 2,763 1.15 1.11 – 1.19
Timpanogos Regional Hospital 1,516 0 1.18 0.00 0.00 – 2.54 1,576 0.96 0.91 – 1.01
Uintah Basin Medical Center 229 0 0.13 ** ** 630 0.36 0.32 – 0.41
University Hospital§ 12,633 44 27.71 1.59 1.17 – 2.11 13,853 0.91 0.90 – 0.93
Utah Valley Hospital 7,061 6 7.21 0.83 0.34 – 1.73 6,234 1.13 1.11 – 1.16 +Source: NHSN data
See footnotes on page 41.

Healthcare-associated Infections in Utah 2016 Annual Report
38
Table 5. Catheter-associated urinary tract infections in inpatient non-intensive care locations in acute care facilities, Utah,
2016+
Number
of
catheter days1
Number
of
CAUTI events2
Predicted
number
of CAUTI events3
Standardized
Infection Ratio4
95%
Confidence Interval5
Predicted
number of
catheter days6
Standardized
Utilization Ratio7
95%
Confidence Interval8
State of Utah 62,275 69 53.9 1.28 1.00 – 1.61 55,455 1.12 1.11 – 1.13
Alta View Hospital 1,101 0 0.54 ** ** 811 1.36 1.28 – 1.44
American Fork Hospital 1,014 0 0.64 ** ** 978 1.04 0.97 – 1.10
Ashley Regional Medical Center 416 1 0.20 -- -- 373 1.12 1.01 – 1.23
Bear River Valley Hospital 140 0 0.07 ** ** 147 0.96 0.81 – 1.12
Beaver Valley Hospital 110 0 0.05 ** ** 136 0.81 0.67 – 0.97
Brigham City Community Hospital 599 0 0.28 ** ** 274 2.19 2.02 – 2.37
Cache Valley Hospital 289 0 0.14 ** ** 401 0.72 0.64 – 0.81
Castleview Hospital 1,148 0 0.56 ** ** 411 2.80 2.64 – 2.96
Cedar City Hospital 794 0 0.39 ** ** 702 1.13 1.05 – 1.21
Davis Hospital & Medical Center 1,382 0 1.32 0.00 0.00 – 2.26 1,348 1.03 0.97 – 1.08
Delta Community Hospital 103 0 0.07 ** ** 129 0.80 0.66 – 0.96
Dixie Regional Medical Center 5,443 2 4.58 0.44 0.07 – 1.44 3,805 1.43 1.39 – 1.47
Fillmore Community Hospital 330 0 0.22 ** ** 529 0.62 0.56 – 0.69
Garfield Memorial Hospital 72 0 0.05 ** ** 172 0.42 0.33 – 0.52
Heber Valley Medical Center 322 0 0.21 ** ** 229 1.40 1.26 – 1.56
Intermountain Medical Center 10,856 36 12.93 2.78 1.98 – 3.81 12,054 0.90 0.88 – 0.92
Jordan Valley Hospital 2,270 2 1.48 1.35 0.23 – 4.46 2,160 1.05 1.01 – 1.09
Jordan Valley Hospital West Valley
Campus 1,244 0 0.82 ** ** 891 1.40 1.32 – 1.48
Lakeview Hospital 1,283 0 0.77 ** ** 1,009 1.27 1.20 – 1.34
LDS Hospital 1,750 2 1.66 1.21 0.20 – 3.98 2,446 0.72 0.68 – 0.75
Logan Regional Hospital 1,465 0 1.00 0.00 0.00 – 2.99 1,425 1.03 0.98 – 1.08
Lone Peak Hospital 486 0 0.21 ** ** 537 0.90 0.83 – 0.99
McKay Dee Hospital 566 0 0.57 ** ** 1,025 0.55 0.51 – 0.60
Mountain Point Medical Center 218 0 0.11 ** ** 91 2.40 2.09 – 2.73
Mountain View Hospital 1,985 0 1.09 0.00 0.00 – 2.75 951 2.09 2.00 – 2.18
Mountain West Medical Center 492 0 0.23 ** ** 464 1.06 0.97 – 1.16
Ogden Regional Medical Center 3,871 2 2.49 0.80 0.13 – 2.65 2,720 1.42 1.38 – 1.47
Orem Community Hospital 22 0 0.01 ** ** 28 0.78 0.50 – 1.16
Park City Hospital 305 0 0.15 ** ** 476 0.64 0.57 – 0.72

Healthcare-associated Infections in Utah 2016 Annual Report
39
Table 5. continued
Number of
catheter days1
Number of
CAUTI events2
Predicted number
of CAUTI events3
Standardized
Infection Ratio4
95%
Confidence Interval
Predicted
number of
catheter days
Standardized
Utilization Ratio
95%
Confidence Interval
Primary Children's Hospital 1,011 2 0.90 -- -- 943 1.07 1.01 – 1.14
Riverton Hospital 832 0 0.54 ** ** 932 0.89 0.83 – 0.95
Salt Lake Regional Medical Center 337 0 0.25 ** ** 498 0.68 0.61 – 0.75
Sanpete Valley Hospital 83 0 0.05 ** ** 245 0.34 0.27 – 0.42
Sevier Valley Hospital 434 0 0.21 ** ** 367 1.18 1.08 – 1.30
St. Mark's Hospital 5,102 1 4.05 0.25 0.01 – 1.22 3,012 1.69 1.65 – 1.74
Timpanogos Regional Hospital 1,213 0 0.75 ** ** 905 1.34 1.27 – 1.42
Uintah Basin Medical Center 815 0 0.40 ** ** 602 1.35 1.26 – 1.45
University Hospital§ 8,416 18 10.27 1.75 1.07 – 2.72 8,263 1.02 1.00 – 1.04
Utah Valley Hospital 3,627 2 3.47 0.58 0.10 – 1.90 2,783 1.30 1.26 – 1.35 +Source: NHSN data.
See footnotes on page 42.
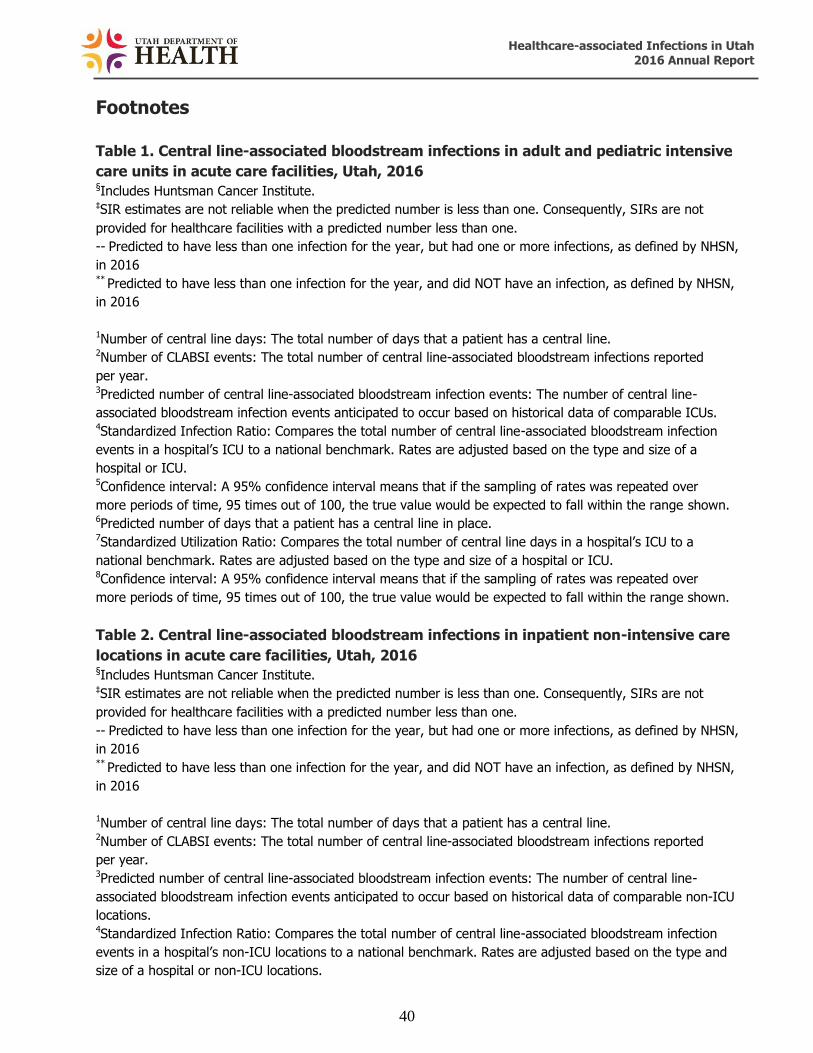
Healthcare-associated Infections in Utah 2016 Annual Report
40
Footnotes
Table 1. Central line-associated bloodstream infections in adult and pediatric intensive
care units in acute care facilities, Utah, 2016 §Includes Huntsman Cancer Institute. ISIR estimates are not reliable when the predicted number is less than one. Consequently, SIRs are not
provided for healthcare facilities with a predicted number less than one.
-- Predicted to have less than one infection for the year, but had one or more infections, as defined by NHSN,
in 2016 ** Predicted to have less than one infection for the year, and did NOT have an infection, as defined by NHSN,
in 2016
1Number of central line days: The total number of days that a patient has a central line. 2Number of CLABSI events: The total number of central line-associated bloodstream infections reported
per year. 3Predicted number of central line-associated bloodstream infection events: The number of central line-
associated bloodstream infection events anticipated to occur based on historical data of comparable ICUs. 4Standardized Infection Ratio: Compares the total number of central line-associated bloodstream infection
events in a hospital’s ICU to a national benchmark. Rates are adjusted based on the type and size of a
hospital or ICU. 5Confidence interval: A 95% confidence interval means that if the sampling of rates was repeated over
more periods of time, 95 times out of 100, the true value would be expected to fall within the range shown. 6Predicted number of days that a patient has a central line in place. 7Standardized Utilization Ratio: Compares the total number of central line days in a hospital’s ICU to a
national benchmark. Rates are adjusted based on the type and size of a hospital or ICU. 8Confidence interval: A 95% confidence interval means that if the sampling of rates was repeated over
more periods of time, 95 times out of 100, the true value would be expected to fall within the range shown.
Table 2. Central line-associated bloodstream infections in inpatient non-intensive care
locations in acute care facilities, Utah, 2016 §Includes Huntsman Cancer Institute. ISIR estimates are not reliable when the predicted number is less than one. Consequently, SIRs are not
provided for healthcare facilities with a predicted number less than one.
-- Predicted to have less than one infection for the year, but had one or more infections, as defined by NHSN,
in 2016 ** Predicted to have less than one infection for the year, and did NOT have an infection, as defined by NHSN,
in 2016
1Number of central line days: The total number of days that a patient has a central line. 2Number of CLABSI events: The total number of central line-associated bloodstream infections reported
per year. 3Predicted number of central line-associated bloodstream infection events: The number of central line-
associated bloodstream infection events anticipated to occur based on historical data of comparable non-ICU
locations. 4Standardized Infection Ratio: Compares the total number of central line-associated bloodstream infection
events in a hospital’s non-ICU locations to a national benchmark. Rates are adjusted based on the type and
size of a hospital or non-ICU locations.

Healthcare-associated Infections in Utah 2016 Annual Report
41
5Confidence interval: A 95% confidence interval means that if the sampling of rates was repeated over more
periods of time, 95 times out of 100, the true value would be expected to fall within the range shown. 6Predicted number of days that a patient has a central line in place. 7Standardized Utilization Ratio: Compares the total number of central line days in a hospital’s non-ICU
locations to a national benchmark. Rates are adjusted based on the type and size of a hospital or non-ICU
locations. 8Confidence interval: A 95% confidence interval means that if the sampling of rates was repeated over more
periods of time, 95 times out of 100, the true value would be expected to fall within the range shown.
Table 3. Central line-associated bloodstream infections in newborn intensive care units
in acute care facilities, Utah, 2016 §Includes Huntsman Cancer Institute ISIR estimates are not reliable when the predicted number is less than one. Consequently, SIRs are not
provided for healthcare facilities with a predicted number less than one.
-- Predicted to have less than one infection for the year, but had one or more infections, as defined by NHSN,
in 2016 ** Predicted to have less than one infection for the year, and did NOT have an infection, as defined by NHSN,
in 2016
1Number of central line days: The total number of days that a patient has a central line. 2Number of central line-associated bloodstream infection events: The total number of central line-associated
bloodstream infections reported per year. 3Predicted number of central line-associated bloodstream infection events: The number of central line-
associated bloodstream infection events anticipated to occur based on historical data of comparable newborn
ICUs. 4Standardized Infection Ratio: Compares the total number of central line-associated bloodstream infection
events in a hospital’s newborn ICU to a national benchmark. Rates are adjusted based on the type and size of
a hospital or newborn ICU. 5Confidence interval: A 95% confidence interval means that if the sampling of rates was repeated over
more periods of time, 95 times out of 100, the true value would be expected to fall within the range shown. 6Predicted number of days that a patient has a central line in place. 7Standardized Utilization Ratio: Compares the total number of central line days in a hospital’s ICU to a
national benchmark. Rates are adjusted based on the type and size of a hospital or ICU. 8Confidence interval: A 95% confidence interval means that if the sampling of rates was repeated over
more periods of time, 95 times out of 100, the true value would be expected to fall within the range shown.
Table 4. Catheter-associated urinary tract infections in adult and pediatric intensive
care units in acute care facilities, Utah, 2016 §Includes Huntsman Cancer Institute. ISIR estimates are not reliable when the predicted number is less than one. Consequently, SIRs are not
provided for healthcare facilities with a predicted number less than one.
-- Predicted to have less than one infection for the year, but had one or more infections, as defined by NHSN,
in 2016 ** Predicted to have less than one infection for the year, and did NOT have an infection, as defined by NHSN,
in 2016
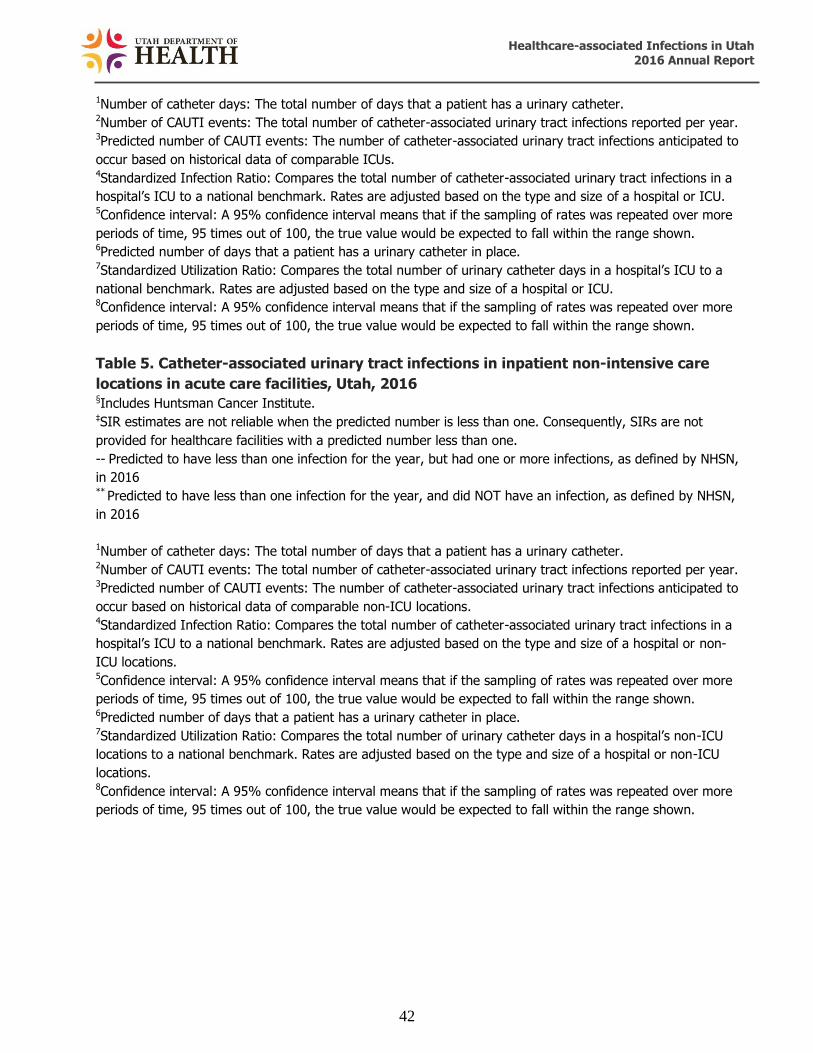
Healthcare-associated Infections in Utah 2016 Annual Report
42
1Number of catheter days: The total number of days that a patient has a urinary catheter. 2Number of CAUTI events: The total number of catheter-associated urinary tract infections reported per year. 3Predicted number of CAUTI events: The number of catheter-associated urinary tract infections anticipated to
occur based on historical data of comparable ICUs. 4Standardized Infection Ratio: Compares the total number of catheter-associated urinary tract infections in a
hospital’s ICU to a national benchmark. Rates are adjusted based on the type and size of a hospital or ICU. 5Confidence interval: A 95% confidence interval means that if the sampling of rates was repeated over more
periods of time, 95 times out of 100, the true value would be expected to fall within the range shown. 6Predicted number of days that a patient has a urinary catheter in place. 7Standardized Utilization Ratio: Compares the total number of urinary catheter days in a hospital’s ICU to a
national benchmark. Rates are adjusted based on the type and size of a hospital or ICU. 8Confidence interval: A 95% confidence interval means that if the sampling of rates was repeated over more
periods of time, 95 times out of 100, the true value would be expected to fall within the range shown.
Table 5. Catheter-associated urinary tract infections in inpatient non-intensive care
locations in acute care facilities, Utah, 2016 §Includes Huntsman Cancer Institute. ISIR estimates are not reliable when the predicted number is less than one. Consequently, SIRs are not
provided for healthcare facilities with a predicted number less than one.
-- Predicted to have less than one infection for the year, but had one or more infections, as defined by NHSN,
in 2016 ** Predicted to have less than one infection for the year, and did NOT have an infection, as defined by NHSN,
in 2016
1Number of catheter days: The total number of days that a patient has a urinary catheter. 2Number of CAUTI events: The total number of catheter-associated urinary tract infections reported per year. 3Predicted number of CAUTI events: The number of catheter-associated urinary tract infections anticipated to
occur based on historical data of comparable non-ICU locations. 4Standardized Infection Ratio: Compares the total number of catheter-associated urinary tract infections in a
hospital’s ICU to a national benchmark. Rates are adjusted based on the type and size of a hospital or non-
ICU locations. 5Confidence interval: A 95% confidence interval means that if the sampling of rates was repeated over more
periods of time, 95 times out of 100, the true value would be expected to fall within the range shown. 6Predicted number of days that a patient has a urinary catheter in place. 7Standardized Utilization Ratio: Compares the total number of urinary catheter days in a hospital’s non-ICU
locations to a national benchmark. Rates are adjusted based on the type and size of a hospital or non-ICU
locations. 8Confidence interval: A 95% confidence interval means that if the sampling of rates was repeated over more
periods of time, 95 times out of 100, the true value would be expected to fall within the range shown.

Healthcare-associated Infections in Utah 2016 Annual Report
43
Appendix B
Understanding Surgical Site Infection (SSI) Data in Acute Care
Facilities
SSI events depict infections associated with specific surgical procedures, colon, and abdominal
hysterectomy surgeries, reported by acute care facilities.
In order to understand the HAI report, it is important to know what each of the table’s data
elements mean. Below is an example of a fictitious hospital’s data. Each column is numbered
and provides an explanation of each data element and its result.
Table B. Surgical site infection events in acute care facilities, Utah, 2016 Number
of surgical
procedures
Number of
SSI events
Predicted number
of SSI events
Standardized
Infection Ratio
95% Confidence
Interval
State of Utah # # # # #
Facility B 5,817 8 13 .62 0.26-1.21
1. Only acute care facilities (hospitals) performing colon and abdominal hysterectomy surgical
procedures are listed here by name (Facility B).
2. For each reporting facility listed, the number listed (5,817) is the total number of
colon/abdominal hysterectomy surgical procedures performed.
3. The number of SSI events in this column (8) represents the total number of
colon/abdominal hysterectomy surgical site infections (SSIs) identified in patients who met
the criteria set by NHSN who were in Facility B during the reporting period.
4. The predicted number of SSI events is adjusted to allow facilities to be more fairly compared.
Risk adjustments account for differences in patient populations in terms of severity of illness
and other factors that may affect the risk of developing an HAI. A facility that performs many
procedures on very sick patients would be predicted to have a higher SSI rate than a hospital
that performs fewer procedures and has healthier patients. The predicted number of SSI events
for Facility B, based on comparison to a national HAI benchmark of similar facilities, is
calculated as 13.
5. The standardized infection ratio (SIR) is a summary measure developed by NHSN to track
HAIs at the national, state, local, or facility level over time. The SIR compares the total
number of SSI events for Facility B (8) to the predicted number of SSI events (13) based on
“standard population” data. For purposes of this report, the standard population is HAI data
reported nationally by thousands of facilities using NHSN. The SIR for Facility B, based on
comparison to a national HAI benchmark of facilities that are similar to Facility B, is
calculated as 0.62. Facilities with a predicted number of HAI events less than one do not
1 2 3 4 5 6

Healthcare-associated Infections in Utah 2016 Annual Report
44
have enough data to reliably compare their data to the standard population. Consequently,
SIRs are not provided for healthcare facilities with a predicted number less than one.
6. A confidence interval (CI) will be provided if a SIR was estimated for a given facility. A CI
describes the uncertainty associated with the SIR estimate. Facilities performing more
procedures will have a narrower CI, which means there is less doubt associated with the
accuracy of the SIR compared to facilities performing fewer procedures. This is because
there is more information about a facility's performance with additional procedures. A 95%
CI means that 95 times out of 100, the true value would be expected to fall within the
range shown.

Healthcare-associated Infections in Utah 2016 Annual Report
45
Table 6. Surgical site infections associated with colon surgeries in acute care facilities, Utah, 2016+
+Source: NHSN data.
See footnotes on page 47.
Number
of colon surgeries1
Number
of colon events2
Predicted number of
colon events3
Standardized
Infection Ratio4
95%
Confidence Interval5
State of Utah 2,230 138 107.73 1.28 1.08 – 1.51
Alta View Hospital 36 0 1.62 0.00 0.00 – 1.85
American Fork Hospital 39 3 1.28 2.35 0.60 – 6.38
Ashley Regional Medical Center 14 0 0.78 ** **
Bear River Valley Hospital 3 0 0.12 ** **
Brigham City Community Hospital 22 1 1.09 0.91 0.05 – 4.5
Cache Valley Hospital 3 0 0.15 ** **
Castleview Hospital 15 3 0.63 -- --
Cedar City Hospital 37 3 1.59 1.89 0.48 – 5.15
Davis Hospital and Medical Center 57 2 2.35 0.85 0.14 – 2.82
Dixie Regional Medical Center 187 9 7.56 1.19 0.58 – 2.19
Intermountain Medical Center 234 19 14.19 1.34 0.83 – 2.05
Jordan Valley Hospital 33 4 1.35 2.95 0.94 – 7.13
Jordan Valley Hospital West Valley Campus
34 4 1.52 2.63 0.83 – 6.34
Lakeview Hospital 28 2 0.92 -- --
LDS Hospital 191 9 8.99 1.00 0.49 – 1.84
Logan Regional Medical Center 24 2 0.88 -- --
Lone Peak Hospital 12 0 0.57 ** **
McKay Dee Hospital 208 14 8.11 1.73 0.98 – 2.83
Mountain Point Medical Center 9 0 0.46 ** **
Mountain View Hospital 20 2 0.84 -- --
Mountain West Medical Center 5 0 0.18 ** **
Ogden Regional Medical Center 65 5 2.95 1.69 0.62 – 3.76
Park City Medical Center 10 1 0.40 -- --
Primary Children's Hospital 99 6 4.62 1.3 0.53 – 2.70
Riverton Hospital 29 1 1.30 0.77 0.04 – 3.79
Salt Lake Regional Medical Center 12 0 0.42 ** **
Sevier Valley Hospital 6 0 0.24 ** **
St. Mark's Hospital 184 1 7.11 0.14 0.01 – 0.69
Timpanogos Regional Hospital 25 0 1.12 0.00 0.00 – 2.68
Uintah Basin Medical Center 4 2 0.22 -- --
University Hospital§ 419 44 26.58 1.66 1.22 – 2.20
Utah Valley Hospital 166 1 7.59 0.13 0.01 – 0.65

Healthcare-associated Infections in Utah 2016 Annual Report
46
Table 7. Surgical site infections associated with abdominal hysterectomy surgeries in acute care facilities, Utah, 2016+
Number of abdominal
hyst1
Number of
abdominal hyst
events2
Predicted
number of
abdominal hyst
events3
Standardized Infection
Ratio4
95% Confidence
Interval5
State of Utah 3,054 51 38.66 1.32 0.99 – 1.72
Alta View Hospital 42 2 0.60 -- --
American Fork Hospital 109 1 1.01 0.99 0.05 – 4.87
Ashley Regional Medical Center 37 2 0.33 -- --
Brigham City Community Hospital 10 0 0.32 ** **
Castleview Hospital 9 0 0.20 ** **
Cedar City Hospital 29 1 0.38 -- --
Davis Hospital & Medical Center 219 1 2.69 0.37 0.02 – 1.83
Dixie Regional Medical Center 41 0 0.50 ** **
Heber Valley Medical Center 5 0 0.04 ** **
Intermountain Medical Center 210 1 3.12 0.32 0.02 – 1.58
Jordan Valley Hospital 36 1 0.66 -- --
Jordan Valley Hospital West Valley
Campus 3 0 0.04 ** **
Lakeview Hospital 10 0 0.10 ** **
LDS Hospital 229 7 2.63 2.66 1.16 – 5.27
Logan Regional Hospital 60 1 0.60 -- --
Lone Peak Hospital 20 0 0.25 ** **
McKay Dee Hospital 171 0 1.84 0.00 0.00 – 1.63
Mountain Point Medical Center 2 0 0.02 ** **
Mountain View Hospital 36 0 0.52 ** **
Mountain West Medical Center 5 0 0.08 ** **
Ogden Regional Medical Center 170 1 2.41 0.41 0.02 – 2.05
Orem Community Hospital 15 0 0.24 ** **
Park City Medical Center 30 0 0.25 ** **
Riverton Hospital 180 2 2.21 0.90 0.15 – 2.99
Salt Lake Regional Medical Center 41 0 0.42 ** **
Sevier Valley Hospital 3 0 0.03 ** **
St. Mark's Hospital 427 3 4.47 0.67 0.17 – 1.83
Timpanogos Regional Medical Center
136 1 1.42 0.70 0.04 – 3.47
Uintah Basin Medical Center 26 1 0.56 -- --
University Health care Hospitals and Clinics§
378 18 6.55 2.75 1.68 – 4.26
Utah Valley Regional Medical Center 365 8 4.17 1.92 0.89 – 3.64 +Source: NHSN data.
See footnotes on page 47.

Healthcare-associated Infections in Utah 2016 Annual Report
47
Footnotes Table 6. Surgical site infections associated with colon surgeries in acute care facilities, Utah, 2016 §Includes Huntsman Cancer Institute. ISIR estimates are not reliable when the expected number is less than one. Consequently, SIRs are not
provided for healthcare facilities with a predicted number less than one.
*Not required to report to CMS.
-- Predicted to have less than one infection for the year, but had one or more infections, as defined by NHSN,
in 2016 ** Predicted to have less than one infection for the year, and did NOT have an infection, as defined by NHSN,
in 2016
1Number of colon surgeries: The total number of colon surgeries reported per year. 2Number of colon events: The total number of SSI infections associated with colon surgeries reported per
year. 3Predicted number of colon events: The number of SSI infections associated with colon surgeries anticipated
to occur based on historical data of comparable acute care facilities. 4Standardized Infection Ratio: Compares the total number of colon surgeries in a hospital’s ICU to a national
benchmark. Rates are adjusted based on the type and size of a hospital or ICU. 5Confidence interval: A 95% confidence interval means that if the sampling of rates was repeated over more
periods of time, 95 times out of 100, the true value would be expected to fall within the range shown.
Table 7. Surgical site infections associated with abdominal hysterectomy surgeries in
acute care facilities, Utah, 2016 §Includes Huntsman Cancer Institute. ISIR estimates are not reliable when the predicted number is less than one. Consequently, SIRs are not
provided for healthcare facilities with a predicted number less than one.
*Not required to report to CMS.
-- Predicted to have less than one infection for the year, but had one or more infections, as defined by NHSN,
in 2016 ** Predicted to have less than one infection for the year, and did NOT have an infection, as defined by NHSN,
in 2016
1Number of abdominal hysterectomies: The total number of abdominal hysterectomies reported per year. 2Number of abdominal hyst events: The total number of SSI infections associated with abdominal
hysterectomies reported per year. 3Predicted number of abdominal hyst events: The number of abdominal hysterectomies anticipated to occur
based on historical data of comparable acute care facilities. 4Standardized Infection Ratio: Compares the total number of abdominal hysterectomies in a hospital’s ICU to
a national benchmark. Rates are adjusted based on the type and size of a hospital or ICU. 5Confidence interval: A 95% confidence interval means that if the sampling of rates was repeated over more
periods of time, 95 times out of 100, the true value would be expected to fall within the range shown.

Healthcare-associated Infections in Utah 2016 Annual Report
48
Appendix C
Understanding C. difficile and MRSA Bacteremia Data in Acute
Care Facilities
The tables depict Clostridium difficile infections (CDI) and Methicillin-resistant Staphylococcus
aureus (MRSA) bacteremia infections reported by acute care facilities.
In order to understand the HAI report, it is important to know what each of the table’s data
elements mean. Below is an example of a fictitious hospital’s data. Each column is numbered
and provides an explanation of each data element and its result.
Table C. Bacterial infection events in acute care facilities, Utah, 2016
Number of patient days
Number of infections
Predicted number of infections
Standardized Infection Ratio
95%
Confidence Interval
State of Utah # # # # #
Facility C 5,817 8 13 .62 0.26-1.21
1. Acute care facilities are listed here by name (Facility C).
2. For each reporting facility listed, the number listed (5,817) is the total number of days patients
have stayed at that facility.
3. When a patient develops a CDI or MRSA bacteremia infection, the infection is considered an
HAI if it meets the criteria set forth by NHSN. The number of HAI events in this column (8)
represents
the total number of specific HAIs identified in patients in Facility C during the year.
4. The predicted number of infections is adjusted to allow facilities to be more fairly compared.
Risk adjustments account for differences in patient populations in terms of severity of illness
and other factors that may affect the risk of developing an HAI. A facility that generally has
more severely ill patients would be predicted to have a higher rate than a facility that has
healthier patients. The predicted number of infections for Facility C, based on comparison to
a national HAI benchmark of similar facilities, is calculated as 13.
5. The standardized infection ratio (SIR) is a summary measure developed by NHSN to track
HAIs at the national, state, local, or facility level over time. The SIR compares the total
number of infections for Facility C (8) to the predicted number of infections (13), based on
“standard population” data.
For purposes of this report, the standard population is HAI data reported nationally by
thousands of facilities using NHSN. The SIR for Facility C, based on comparison to a national
HAI benchmark of facilities that are similar to Facility C, is calculated as 0.62. Facilities with
a predicted number of HAI events less than one do not have enough data to reliably
1 2 3 4 5 6

Healthcare-associated Infections in Utah 2016 Annual Report
49
compare their data to the standard population. Consequently, SIRs are not provided for
healthcare facilities with a predicted number less than one.
6. A confidence interval (CI) will be provided if a SIR was estimated for a given facility. A CI
describes the uncertainty associated with the SIR estimate. Facilities performing with more
patient days will have a narrower CI, which means there is less doubt associated with the
accuracy of the SIR compared to facilities performing fewer procedures. This is because
there is more information about a facility's performance with additional patient days. A 95%
CI means that 95 times out of 100, the true value would be expected to fall within the
range shown.

Healthcare-associated Infections in Utah 2016 Annual Report
50
Table 8. C. difficile infections in acute care facilities, Utah, 2016+
Number of patient
days1
Number
of hospital
onset C. difficile events2
Predicted
number of hospital
onset C. difficile
events3
Standardized Infection
Ratio4
95% Confidence
Interval5
State of Utah 822,213 603 563.6 1.07 0.99 – 1.16
Alta View Hospital 8,876 1 2.54 0.39 0.02 – 1.94
American Fork Hospital 14,851 6 7.34 0.82 0.33 – 1.70
Ashley Regional Medical Center 3,919 1 1.96 0.51 0.03 – 2.52
Bear River Valley Hospital 917 0 0.22 ** **
Beaver Valley Hospital 907 0 0.21 ** **
Brigham City Community Hospital 2,769 1 1.03 0.97 0.05 – 4.79
Cache Valley Hospital 2,290 0 0.52 ** **
Castleview Hospital 3,485 1 1.89 0.53 0.03 – 2.60
Cedar City Hospital 7,339 6 3.67 1.63 0.66 – 3.40
Davis Hospital & Medical Center 18,475 5 11.61 0.43 0.16 – 0.95
Dixie Regional Medical Center 54,799 30 37.07 0.81 0.56 – 1.14
Garfield Memorial Hospital 1,235 0 0.56 ** **
HealthSouth Rehabilitation Hospital
of Utah 11,415 3 3.15 0.95 0.24 – 2.59
Heber Valley Medical Center 1,611 0 0.36 ** **
Intermountain Medical Center 106,832 84 79.01 1.06 0.85 – 1.31
Jordan Valley Hospital 17,341 22 13.53 1.63 1.05 – 2.42
Jordan Valley Hospital West Valley
Campus 10,204 14 8.54 1.64 0.93 – 2.69
Lakeview Hospital 11,456 10 6.06 1.65 0.84 – 2.94
Landmark Hospital 7,747 9 5.69 1.58 0.77 – 2.91
LDS Hospital 32,361 37 20.68 1.80 1.28 – 2.44
Logan Regional Hospital 17,677 7 11.31 0.62 0.27 – 1.22
Lone Peak Hospital 4,161 2 1.29 1.55 0.26 – 5.13
McKay Dee Hospital 46,310 32 33.97 0.94 0.66 – 1.31
Mountain Point Medical Center 3,790 0 1.55 0.00 0.00 – 1.93
Mountain View Hospital 9,474 3 4.12 0.73 0.19 – 1.98
Mountain West Medical Center 3,863 3 1.80 1.66 0.42 – 4.53
Northern Utah Rehabilitation Hospital 6,565 1 2.65 0.38 0.02 – 1.86
Ogden Regional Medical Center 25,666 24 19.23 1.25 0.82 – 1.83
Orem Community Hospital 2,877 0 0.99 ** **
Park City Hospital 4,780 0 1.46 0.00 0.00 – 2.05
Primary Children's Hospital 54,538 45 29.99 1.50 1.11 – 1.99
Promise Hospital of Salt Lake 12,528 3 11.8 0.25 0.06 – 0.69
Riverton Hospital 14,450 4 4.10 0.97 0.31 – 2.35
Salt Lake Regional Medical Center 10,843 7 6.70 1.04 0.46 – 2.07
Sanpete Valley Hospital 1,800 1 0.40 -- --
Sevier Valley Hospital 2,371 0 0.60 ** **
Shriners Hospital for Children 1,044 0 0.16 ** **
South Davis Community Hospital 4,651 3 5.36 0.56 0.14 – 1.52
St. Mark's Hospital 47,835 42 41.10 1.02 0.75 – 1.37
The Orthopedic Specialty Hospital 4,896 0 0.74 ** **
Timpanogos Regional Medical Center 7,679 4 5.28 0.76 0.24 – 1.83

Healthcare-associated Infections in Utah 2016 Annual Report
51
Table 8 continued
Number of patient
days1
Number of
hospital
onset C. difficile events2
Predicted number of
hospital
onset C. difficile
events3
Standardized Infection
Ratio4
95% Confidence
Interval5
Uintah Basin Medical Center 7,634 0 2.22 0.00 0.00 – 1.35
University Hospital§ 131,033 133 117.48 1.13 0.95 – 1.34
Utah Valley Hospital 67,168 44 46.65 0.94 0.69 – 1.25
Utah Valley Specialty Hospital 9,751 15 6.98 2.15 1.25 – 3.47 +Source: NHSN data
§Includes Huntsman Cancer Institute. ISIR estimates are not reliable when the predicted number is less than one. Consequently, SIRs are not provided for
healthcare facilities with a predicted number less than one.
-- Predicted to have less than one infection for the year, but had one or more infections, as defined by NHSN, in 2016 ** Predicted to have less than one infection for the year, and did NOT have an infection, as defined by NHSN, in 2016
1Number of patient days: The total number of days that patients stay at a facility per year. Patient days data for C.
difficile infections excludes newborn nursery patient days data. 2Number of C. difficile events: The total number of C difficile infections reported per year. 3Predicted number of C. difficile events: The number of C. difficile infections anticipated to occur based on historical
data of comparable ICUs. 4Standardized Infection Ratio: Compares the total number of C. difficile infections in a facility to a national benchmark.
Rates are adjusted based on the type and size of the facility. 5Confidence interval: A 95% confidence interval means that if the sampling of rates was repeated over more periods of
time, 95 times out of 100, the true value would be expected to fall within the range shown.

Healthcare-associated Infections in Utah 2016 Annual Report
52
Table 9. Methicillin-resistant Staphylococcus aureus bacteremia in acute care facilities, Utah, 2016+
Number
of patient days1
Number of MRSA
bacteremia events2
Predicted
number of MRSA
bacteremia events3
Standardized
Infection Ratio4
95%
Confidence Interval5
State of Utah 1,010,877 34 55.24 0.62 0.43 – 0.85
Alta View Hospital 11,480 0 0.31 ** **
American Fork Hospital 22,279 0 0.96 ** **
Ashley Regional Medical Center 4,677 0 0.10 ** **
Bear River Valley Hospital 1,108 0 0.02 ** **
Beaver Valley Hospital 997 0 0.02 ** **
Brigham City Community Hospital 2,769 0 0.06 ** **
Cache Valley Hospital 2,360 0 0.05 ** **
Castleview Hospital 4,567 0 0.10 ** **
Cedar City Hospital 8,747 0 0.16 ** **
Davis Hospital & Medical Center 22,850 0 0.74 ** **
Dixie Regional Medical Center 61,843 3 2.28 1.31 0.33 – 3.58
Garfield Memorial Hospital 1,300 0 0.03 ** **
HealthSouth Rehabilitation
Hospital of Utah 11,415 0 0.22 ** **
Heber Valley Medical Center 1,842 0 0.04 ** **
Intermountain Medical Center 130,270 6 7.84 0.77 0.31 – 1.59
Jordan Valley Hospital 26,252 2 1.01 1.99 0.33 – 6.57
Jordan Valley Hospital West Valley Campus
11,481 1 0.51 -- --
Lakeview Hospital 12,754 1 0.51 -- --
Landmark Hospital 7,747 0 0.86 ** **
LDS Hospital 38,208 1 2.08 0.48 0.02 – 2.37
Logan Regional Hospital 24,213 0 0.95 ** **
Lone Peak Hospital 4,365 0 0.08 ** **
McKay Dee Hospital 62,243 1 3.09 0.32 0.02 – 1.60
Mountain Point Medical Center 5,082 0 0.14 ** **
Mountain View Hospital 10,717 0 0.33 ** **
Mountain West Medical Center 3,863 0 0.08 ** **
Northern Utah Rehabilitation Hospital
6,565 0 0.12 ** **
Ogden Regional Medical Center 33,073 0 1.72 0.00 0.00 – 1.74
Orem Community Hospital 5,227 0 0.10 ** **
Park City Hospital 5,438 0 0.11 ** **
Primary Children's Hospital 71,452 3 2.17 1.38 0.35 – 3.76
Promise Hospital of Salt Lake 12,528 0 1.59 0.00 0.00 – 1.88
Riverton Hospital 19,447 0 0.38 ** **
Salt Lake Regional Medical Center 11,865 0 0.37 ** **
Sanpete Valley Hospital 1,932 0 0.04 ** **
Sevier Valley Hospital 2,689 0 0.05 ** **
South Davis Community Hospital 4,651 0 1.15 0.00 0.00 – 2.60
St. Mark's Hospital 58,402 3 3.40 0.88 0.22 – 2.40

Healthcare-associated Infections in Utah 2016 Annual Report
53
Table 9 continued
Number
of patient days1
Number of
MRSA
bacteremia events2
Predicted number of
MRSA
bacteremia events3
Standardized
Infection Ratio4
95%
Confidence Interval5
The Orthopedic Specialty Hospital 4,896 0 0.06 ** **
Timpanogos Regional Medical
Center 14,367 1 0.50 -- --
Uintah Basin Medical Center 7,634 1 0.19 -- --
University Hospital§ 155,536 9 14.96 0.60 0.29 – 1.10
Utah Valley Hospital 89,995 2 4.69 0.43 0.07 – 1.41
Utah Valley Specialty Hospital 9,751 0 1.08 0.00 0.00 – 2.78 +Source: NHSN data
§Includes Huntsman Cancer Institute. ISIR estimates are not reliable when the predicted number is less than one. Consequently, SIRs are not provided for
healthcare facilities with a predicted number less than one.
-- Predicted to have less than one infection for the year, but had one or more infections, as defined by NHSN, in 2016 ** Predicted to have less than one infection for the year, and did NOT have an infection, as defined by NHSN, in 2016
1Number of patient days: The total number of days that patients stay at a facility per year. 2Number of MRSA events: The total number of MRSA bacteremia infections reported per year. 3Predicted number of MRSA events: The amount of MRSA bacteremia infections anticipated to occur based on historical
data of comparable facilities. 4Standardized Infection Ratio: Compares the total number of MRSA bacteremia in a facility to a national benchmark.
Rates are adjusted based on the type and size of the facility. 5Confidence interval: A 95% confidence interval means that if the sampling of rates was repeated over more periods of
time, 95 times out of 100, the true value would be expected to fall within the range shown.

Healthcare-associated Infections in Utah 2016 Annual Report
54
Appendix D
Understanding CLABSI and CAUTI Rates in Long-term Acute Care Facilities with Intensive Care
Units and Wards or Inpatient Rehabilitation Facilities
The device infection event tables depict specific device-associated infections (central line-associated bloodstream infections [CLABSI],
catheter-associated urinary tract infections [CAUTI]), reported by long-term acute care facilities (LTAC) with intensive care units (ICU) and
inpatient rehabilitation facilities (IRF).
To understand the HAI report, it is important to know what each of the data elements in the table mean. Below is an example of fictitious
data from an LTAC or IRF. Each column is numbered and provides an explanation of each data element and its result.
Table D. Device infection events in long-term acute care facilities with intensive care units and wards or inpatient rehabilitation facilities, Utah, 2016
Number of
HAI device days
Number of
HAI device events
Predicted number of
HAI device events
Standardized Infection Ratio
95%
Confidence Interval
Predicted
number of HAI
device days
Standardized
Utilization Ratio
95%
Confidence Interval
State of Utah # # # # # # # #
Facility D 5,817 8 1.36 0.64-2.56
1. Long-term acute care facilities or inpatient rehabilitation facilities are listed here by name (Facility D).
2. For each reporting facility listed, patients with central line catheters/urinary catheters (devices) are identified every day. A device count is
performed at the same time each day. Each patient with one or more central line catheters at the time the count is performed is counted
as having one device day. Each patient with a urinary catheter at the time the count is performed is counted as having one device day.
For example, a patient with one or more central line catheters and one urinary catheter would be counted as having one central line day
and one urinary catheter day. The number of device days in this column (5,817) represents the total number of specific device days for
all patients who were in Facility D during the year.
3. When a patient develops an HAI device-associated infection while having a device in place or within one day after removal of the device,
1 2 3 4 5 6 7 8 9
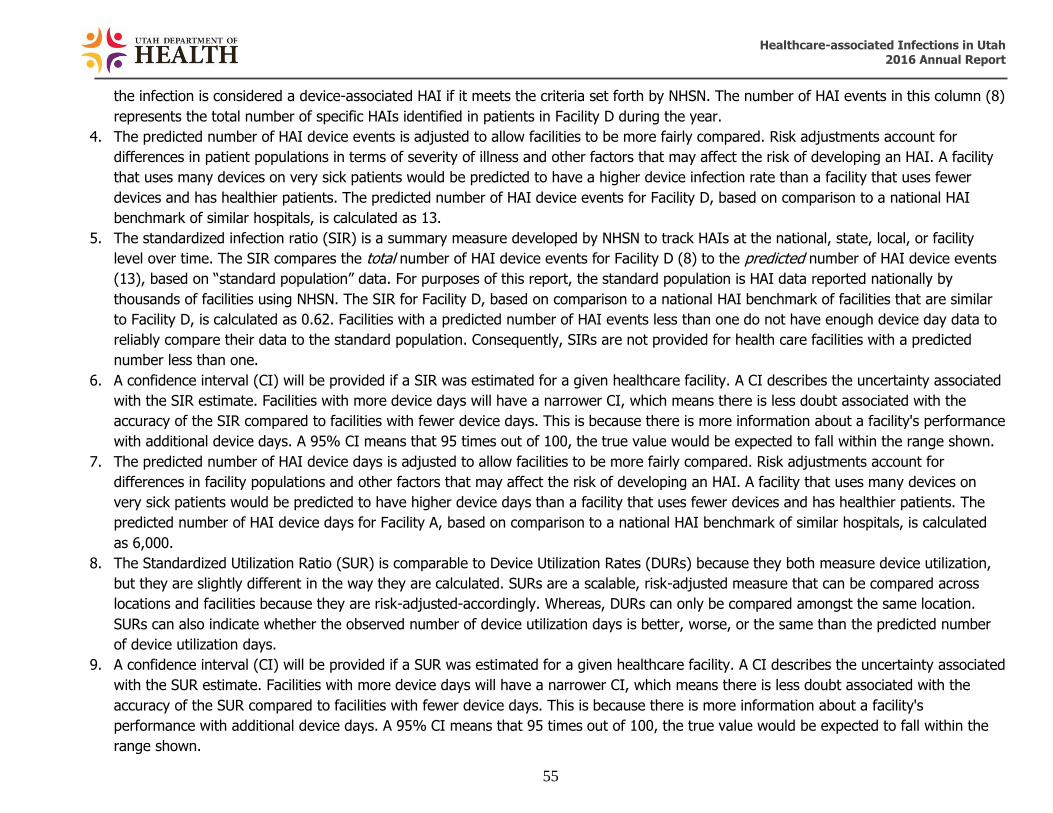
Healthcare-associated Infections in Utah 2016 Annual Report
55
the infection is considered a device-associated HAI if it meets the criteria set forth by NHSN. The number of HAI events in this column (8)
represents the total number of specific HAIs identified in patients in Facility D during the year.
4. The predicted number of HAI device events is adjusted to allow facilities to be more fairly compared. Risk adjustments account for
differences in patient populations in terms of severity of illness and other factors that may affect the risk of developing an HAI. A facility
that uses many devices on very sick patients would be predicted to have a higher device infection rate than a facility that uses fewer
devices and has healthier patients. The predicted number of HAI device events for Facility D, based on comparison to a national HAI
benchmark of similar hospitals, is calculated as 13.
5. The standardized infection ratio (SIR) is a summary measure developed by NHSN to track HAIs at the national, state, local, or facility
level over time. The SIR compares the total number of HAI device events for Facility D (8) to the predicted number of HAI device events
(13), based on “standard population” data. For purposes of this report, the standard population is HAI data reported nationally by
thousands of facilities using NHSN. The SIR for Facility D, based on comparison to a national HAI benchmark of facilities that are similar
to Facility D, is calculated as 0.62. Facilities with a predicted number of HAI events less than one do not have enough device day data to
reliably compare their data to the standard population. Consequently, SIRs are not provided for health care facilities with a predicted
number less than one.
6. A confidence interval (CI) will be provided if a SIR was estimated for a given healthcare facility. A CI describes the uncertainty associated
with the SIR estimate. Facilities with more device days will have a narrower CI, which means there is less doubt associated with the
accuracy of the SIR compared to facilities with fewer device days. This is because there is more information about a facility's performance
with additional device days. A 95% CI means that 95 times out of 100, the true value would be expected to fall within the range shown.
7. The predicted number of HAI device days is adjusted to allow facilities to be more fairly compared. Risk adjustments account for
differences in facility populations and other factors that may affect the risk of developing an HAI. A facility that uses many devices on
very sick patients would be predicted to have higher device days than a facility that uses fewer devices and has healthier patients. The
predicted number of HAI device days for Facility A, based on comparison to a national HAI benchmark of similar hospitals, is calculated
as 6,000.
8. The Standardized Utilization Ratio (SUR) is comparable to Device Utilization Rates (DURs) because they both measure device utilization,
but they are slightly different in the way they are calculated. SURs are a scalable, risk-adjusted measure that can be compared across
locations and facilities because they are risk-adjusted-accordingly. Whereas, DURs can only be compared amongst the same location.
SURs can also indicate whether the observed number of device utilization days is better, worse, or the same than the predicted number
of device utilization days.
9. A confidence interval (CI) will be provided if a SUR was estimated for a given healthcare facility. A CI describes the uncertainty associated
with the SUR estimate. Facilities with more device days will have a narrower CI, which means there is less doubt associated with the
accuracy of the SUR compared to facilities with fewer device days. This is because there is more information about a facility's
performance with additional device days. A 95% CI means that 95 times out of 100, the true value would be expected to fall within the
range shown.

Healthcare-associated Infections in Utah 2016 Annual Report
56
Table 10. Central-line associated bloodstream infections in long-term acute care facilities with intensive care units and wards, Utah, 2016+
Number
of central
line
days1
Number
of CLABSI
events2
Predicted number of
CLABSI
events3
Standardized
Infection
Ratio4
95%
Confidence
Interval5
Predicted number of
central
line days6
Standardized
Utilization
Ratio7
95%
Confidence
Interval8
State of Utah 21,645 16 21.95 0.73 0.43 – 1.16 19,066 1.14 1.12 – 1.15
Landmark Hospital 4,927 12 5.00 2.40 1.30 – 4.08 4,023 1.22 1.19 – 1.26
Promise Hospital 8,740 1 10.87 0.09 0.01 – 0.45 8,389 1.04 1.02 – 1.06
South Davis Community Hospital 1,748 2 1.98 1.01 0.17 – 3.34 1,591 1.10 1.05 – 1.15
Utah Valley Specialty Hospital 6,230 1 4.11 0.24 0.01 – 1.20 5,063 1.23 1.20 – 1.26 +Source: NHSN data. 1Number of central line days: The total number of days that a patient has a central line. 2Number of CLABSI events: The total number of central line-associated bloodstream infections reported per year. 3Predicted number of CLABSI events: The number of central line-associated bloodstream infection events anticipated to occur based on historical data of comparable long-term acute care facilities. 4Standardized Infection Ratio: Compares the total number of CLABSI events in long-term acute care facilities to a national benchmark. 5Confidence interval: A 95% confidence interval means that if the sampling of rates was repeated over more periods of time, 95 times out of 100, the true value would be expected to fall within the range shown. 6Predicted number of days that a patient has a central line in place. 7Standardized Utilization Ratio: Compares the total number of central line days in a hospital’s ICU to a national benchmark. Rates are adjusted based on the type and size
of a hospital or ICU. 8Confidence interval: A 95% confidence interval means that if the sampling of rates was repeated over more periods of time, 95 times out of 100, the true value would be
expected to fall within the range shown.

Healthcare-associated Infections in Utah 2016 Annual Report
57
Table 11. Catheter-associated urinary tract infections in long-term acute care facilities with intensive care units and wards,
Utah, 2016+
Number of
catheter
days1
Number
of CAUTI
events2
Predicted number of
CAUTI
events3
Standardized
Infection
Ratio4
95%
Confidence
Interval5
Predicted number of
catheter
days6
Standardized
Utilization
Days7
95%
Confidence
Interval8
State of Utah 16,180 16 24.7 0.65 0.38 – 1.03 15,307 1.06 1.04 – 1.07
Landmark Hospital 4,698 6 7.65 0.78 0.32 – 1.63 3,386 1.39 1.35 – 1.43
Promise Hospital 6,362 2 9.97 0.20 0.03 – 0.66 6,454 0.99 0.96 – 1.01
South Davis Community Hospital 873 2 1.84 1.09 0.18 – 3.58 1,474 0.59 0.55 – 0.63
Utah Valley Specialty Hospital 4,247 6 5.24 1.15 0.46 – 2.38 3,992 1.06 1.03 – 1.10 +Source: NHSN data. 1Number of catheter days: The total number of days that a patient has a urinary catheter. 2Number of CAUTI events: The total number of catheter-associated urinary tract infections reported per year. 3Predicted number of CAUTI events: The number of catheter-associated urinary tract infections anticipated to occur based on historical data of comparable long-term acute care facilities. 4Standardized Infection Ratio: Compares the total number of catheter-associated urinary tract infections in long-term acute care facilities to a national benchmark. 5Confidence interval: A 95% confidence interval means that if the sampling of rates was repeated over more periods of time, 95 times out of 100, the true value would be expected to fall within the range shown. 6Predicted number of days that a patient has a urinary catheter in place. 7Standardized Utilization Ratio: Compares the total number of urinary catheter days in a hospital’s ICU to a national benchmark. Rates are adjusted based on the type and
size of a hospital or ICU. 8Confidence interval: A 95% confidence interval means that if the sampling of rates was repeated over more periods of time, 95 times out of 100, the true value would be
expected to fall within the range shown.

Healthcare-associated Infections in Utah 2016 Annual Report
58
Table 12. Catheter-associated urinary tract infections in inpatient rehabilitation facilities, Utah, 2016+
Number
of catheter
days1
Number of CAUTI
events2
Predicted
number of CAUTI
events3
Standardized Infection
Ratio4
95% Confidence
Interval5
Predicted
number of catheter
days6
Standardized Utilization
Ratio7
95% Confidence
Interval8
State of Utah 3,477 11 4.56 2.41 1.27 – 4.19 4,517 0.77 0.74 – 0.8
Davis Hospital and Medical Center 72 0 0.10 ** ** 45 1.58 1.25 – 1.98
Dixie Regional Medical Center 371 2 0.54 -- -- 321 1.15 1.04 – 1.28
Health South Rehabilitation Hospital
of Utah 868 0 0.94 ** ** 886 0.98 0.92 – 1.05
Intermountain Medical Center 210 2 0.30 -- -- 533 0.39 0.34 – 0.45
Jordan Valley Hospital 195 0 0.28 ** ** 181 1.08 0.93 – 1.24
McKay Dee Hospital 126 1 0.18 -- -- 333 0.38 0.32 – 0.45
Northern Utah Rehabilitation Hospital 394 1 0.43 -- -- 510 0.77 0.70 – 0.85
Salt Lake Regional Medical Center 76 0 0.11 ** ** 149 0.51 0.41 – 0.64
St. Mark's Hospital 315 0 0.45 ** ** 281 1.12 1.00 – 1.25
University Hospital§ 425 2 0.61 -- -- 943 0.45 0.41 – 0.50
Utah Valley Hospital 425 3 0.61 -- -- 334 1.27 1.15 – 1.40 +Source: NHSN data.
§Includes Huntsman Cancer Institute
ISIR estimates are not reliable when the predicted number is less than one. Consequently, SIRs are not provided for healthcare facilities with a predicted number less than one.
-- Predicted to have less than one infection for the year, but had one or more infections, as defined by NHSN, in 2016 ** Predicted to have less than one infection for the year, and did NOT have an infection, as defined by NHSN, in 2016
1Number of catheter days: The total number of days that a patient has a urinary catheter. 2Number of CAUTI events: The total number of catheter-associated urinary tract infections reported per year. 3Predicted number of CAUTI events: The number of catheter-associated urinary tract infections anticipated to occur based on historical data of comparable inpatient rehabilitation facilities. 4Standardized Infection Ratio: Compares the total number of catheter-associated urinary tract infections in inpatient rehabilitation facilities to a national benchmark. 5Confidence interval: A 95% confidence interval means that if the sampling of rates was repeated over more periods of time, 95 times out of 100, the true value would be expected to fall within the range shown. 6Predicted number of days that a patient has a urinary catheter in place. 7Standardized Utilization Ratio: Compares the total number of urinary catheter days in an inpatient rehabilitation facility to a national benchmark. Rates are adjusted based on
the type and size of an inpatient rehabilitation facility. 8Confidence interval: A 95% confidence interval means that if the sampling of rates was repeated over more periods of time, 95 times out of 100, the true value would be
expected to fall within the range shown.

Healthcare-associated Infections in Utah 2016 Annual Report
59
Table 13. Dialysis event bloodstream infections, Utah, 2016+
Number
of patient
months1
Number of
Dialysis
Event BSI2
Predicted number of
Dialysis
Event BSI3
Standardized
Infection
Ratio4
95%
Confidence
Interval5
State of Utah 19,359 116 116.72 0.99 0.82 – 1.19
American Fork Dialysis Center 194 0 1.20 0.00 0.00 – 2.50
Blue Mountain Hospital Dialysis
Center 341 3 1.75 1.72 0.44 – 4.68
Bonneville Dialysis Center 636 6 3.98 1.51 0.61 – 3.14
Castleview Dialysis Center 371 0 2.37 0.00 0.00 – 1.26
Farmington Bay Dialysis Center 323 0 1.85 0.00 0.00 – 1.62
Hurricane Dialysis 138 0 0.85 ** **
Intermountain Medical Center
Dialysis Center 1,156 5 6.17 0.81 0.30 – 1.80
Iron Mission Dialysis Center 299 3 2.35 1.28 0.32 – 3.48
Kolff Dialysis Center 551 6 3.83 1.57 0.63 – 3.26
Lakeside Dialysis Center 386 4 2.35 1.70 0.54 – 4.11
Liberty Dialysis Layton 477 0 3.38 0.00 0.00 – 0.89
Liberty Dialysis St. George 723 6 5.20 1.15 0.47 – 2.40
Liberty Dialysis West Jordan 721 2 3.85 0.52 0.09 – 1.83
Logan Regional Dialysis Center 610 0 2.97 0.00 0.00 – 1.01
Lone Peak Dialysis 738 6 4.89 1.23 0.50 – 2.55
Mark Lindsay Dialysis Center 324 3 1.89 1.59 0.40 – 4.33
Oquirrh Artificial Kidney Center 1,107 5 6.12 0.82 0.30 – 1.81
Payson Regional Dialysis 396 4 2.80 1.43 0.45 – 3.45
Pleasant View Dialysis Center 681 5 4.30 1.16 0.43 – 2.57
Provo Dialysis 420 1 3.40 0.29 0.01 – 1.45
Primary Children’s Dialysis Center 134 6 1.43 4.19 1.70 – 8.72
Sevier Valley Dialysis 225 1 1.06 0.95 0.05 – 4.67
South Mountain Dialysis 537 2 3.62 0.55 0.09 – 1.83
South Valley Dialysis Center 458 2 2.35 0.85 0.14 – 2.81
Tooele Valley Dialysis 322 0 1.29 0.00 0.00 – 2.32
UBMC Dialysis Roosevelt 507 1 3.10 0.32 0.02 – 1.59
Uintah Basin Medical Center
Dialysis Vernal 245 1 0.77 -- --
University of Utah Dialysis Program Dixie Dialysis
743 12 4.99 2.40 1.30 – 4.09
Utah Dialysis Center 766 1 3.96 0.25 0.01 – 1.24
Utah Valley Dialysis Center 1,247 16 6.91 2.31 1.37 – 3.68
Wasatch Artificial Kidney Center 1,039 1 7.09 0.14 0.01 – 0.70
Weber Valley Dialysis 224 2 1.20 1.67 0.28 – 5.51
West Bountiful Dialysis 142 2 0.60 -- --
West Valley Dialysis Clinic 1,165 1 5.42 0.18 0.01 – 0.91
Woods Cross Dialysis 352 4 2.42 1.65 0.52 – 3.98 +Source: NHSN data. See footnotes on page 60.
Healthcare-associated Infections in Utah 2016 Annual Report
60
ISIR estimates are not reliable when the predicted number is less than one. Consequently, SIRs are not provided for
healthcare facilities with a predicted number less than one.
-- Predicted to have less than one infection for the year, but had one or more infections, as defined by NHSN,
in 2016 ** Predicted to have less than one infection for the year, and did NOT have an infection, as defined by NHSN,
in 2016
1Number of patient months: The number of patient-months are equal to the summed number of patient-month denominators reported by the facility during the year. To calculate patient-months, facilities report the number of hemodialysis outpatients who were dialyzed in the facility on the first two working days of the month, using the Denominators for Dialysis Event Surveillance form. This count is used to estimate the number of patient-months that there is risk of a healthcare-associated infection. 2Number of dialysis event BSI: The total number of bloodstream infections that were reported per year. 3Predicted number of dialysis event BSI: The number of bloodstream infections anticipated to occur based on historical data of comparable dialysis facilities. 4Standardized Infection Ratio: Compares the total number of bloodstream infections in dialysis facilities to a national
benchmark. 5Confidence interval: A 95% confidence interval means that if the sampling of rates was repeated over more periods of time, 95 times out of 100, the true value would be expected to fall within the range shown

Healthcare-associated Infections in Utah 2016 Annual Report
61
Appendix E
Definitions 1. Abdominal hysterectomy - An abdominal hysterectomy is a surgical procedure in which
the uterus is removed through an incision in the lower abdomen.
2. Acute care facility - A hospital that provides inpatient medical care and other related
services for surgery, acute medical conditions, or injuries (usually for a short-term illness or
condition).
3. Catheter-associated urinary tract infection (CAUTI) - Infection involving any part of
the urinary system, including urethra, bladder, ureters, and kidney that are caused by the
insertion of a urinary catheter.
4. Central line - A catheter (tube) placed in a large vein in the neck, chest, or groin that ends
at, or close to, the heart to give medication or fluids, collect blood for medical tests, or
monitor blood flow.
5. Central line days (CLDs) - Refers to the number of patients with a central line in place.
Central line days are calculated by recording the number of patients who have a central line
for each day of the month at the same time each day for a specific care location. At the end
of the month, the sum of all days is recorded. For purposes of this report, the total is
recorded as the sum of all days in a year. Patients having more than one central line in place
at a given time are counted as having only one central line day.
6. Central line-associated bloodstream infection (CLABSI) - A serious infection that
occurs when germs (usually bacteria) that are not related to another infection enter the
bloodstream through the central line catheter.
7. Centers for Medicare and Medicaid Services (CMS) - A federal agency within
the United States Department of Health and Human Services that administers Medicare,
Medicaid, the State Children's Health Insurance Program, and sets health insurance
portability standards.
8. Clostridium difficile - Clostridium difficile is a germ that causes diarrhea. It is spread from
person-to-person on contaminated equipment and on the hands of health care personnel and
visitors. Most cases occur in patients taking antibiotics for long periods of time and in the
elderly with certain medical problems.
9. Colon surgery - Colon surgery is an operation performed on the large intestine, rectum,
anus, and/or the perianal area.

Healthcare-associated Infections in Utah 2016 Annual Report
62
10. Confidence interval (CI) - A statistical measure of the precision of a rate estimate. It is a
plus-or-minus range around the infection rate reported. A 95% confidence interval means
that if the sampling of rates was repeated over more periods of time, 95 times out of 100,
the true value would be expected to fall within the range shown.
11. Dialysis - Kidney dialysis is a life-support treatment that uses a special machine to filter
harmful wastes, salt, and excess fluid from the blood. This restores the blood to a normal,
healthy balance. Dialysis replaces many of the kidney's important functions. Hemodialysis is
when the blood is filtered using a dialyzer and dialysis machine.
12. Dialysis facility - An outpatient facility where a medical procedure (dialysis) is administered
to people with end-stage kidney disease.
13. Healthcare-associated infection (HAI) - An infection that develops in a person who is
cared for in any setting where healthcare is delivered (i.e., acute care hospital, skilled
nursing facility, dialysis center, etc.) that was not developing or present at the time of
admission to that healthcare setting.
14. Inpatient rehabilitation facilities (IRFs) - IRFs are freestanding rehabilitation hospitals
and rehabilitation units in acute care hospitals. They provide an intensive rehabilitation
program and patients who are admitted must be able to tolerate three hours of intense
rehabilitation services per day.
15. Intensive Care Unit (ICU) - An area in the hospital where severely ill patients are closely
monitored and receive advanced life support.
16. Long-term acute care facility (LTAC) - A facility that provides a range of institutional
healthcare programs and services, such as comprehensive rehabilitation, respiratory therapy,
head trauma treatment, and pain management, outside the acute care hospital.
17. MRSA bacteremia - An infection in the blood that is caused by the bacteria Staphylococcus
aureus and is resistant to methicillin antibiotics.
18. National rate - The national rate is determined by the NHSN as similar facilities and specific
infection events are compared nationwide.
19. National Healthcare Safety Network (NHSN) - The nation’s most widely used
healthcare-associated infection (HAI) tracking system. NHSN provides facilities, states,
regions, and the nation with data needed to identify problem areas, measure progress of
prevention efforts, and ultimately eliminate HAIs. The system is supported by the U.S.
Centers for Disease Control and Prevention.
20. Standardized infection ratio (SIR) - A statistic used to calculate, track, and interpret the
number of new HAIs. The SIR is determined by comparing the actual number of HAIs to the

Healthcare-associated Infections in Utah 2016 Annual Report
63
predicted number of HAIs for a specific group of patients admitted to a specific patient care
unit.
21. Standard population - The population against which each of its essential classes or groups
can be compared. For purposes of this report, the standard population is the national HAI
data reported by the thousands of United States facilities that use the NHSN system.
22. Standardized utilization ratios (SUR) – A statistic used to track trends in device use over
time. This includes use of urinary catheters, central lines, and ventilators. Progress is
measured at the national, state, local, or facility level.
23. Surgical site infection (SSI) - A surgical site infection is an infection that occurs after
surgery in the part of the body where the surgery took place. Many SSIs involve the skin
only. Other SSIs are more serious and involve deep tissue or organs and usually result in
prolonged or re-hospitalization.
24. Utah Healthcare Infection Prevention Governance Committee (UHIP GC) -
A multi-disciplinary panel of state leaders in patient safety, infectious diseases, and infection
control. Membership is comprised of a broad base of care delivery groups across the state
and organized under and staffed by the Utah Department of Health.
25. Urinary catheter - A flexible tube that is inserted through the urethra and into the bladder
to drain urine from the bladder into a bag or container.

Healthcare-associated Infections in Utah 2016 Annual Report
64
References
1. National and State Healthcare-Associated Infection Progress Report. CDC. 2014.
http://www.cdc.gov/HAI/pdfs/progress-report/hai-progress-report.pdf. Accessed August
2016.
2. National Action Plan to Prevent Healthcare-Associated Infections: Road Map to
Elimination. http://www.health.gov/hai/prevent_hai.asp#hai. Accessed July 2016.
3. How-to Guide: Prevent Central Line-Associated Bloodstream Infections. Cambridge, MA:
Institute for Healthcare Improvement; 2012.
4. CDC. Healthcare-associated Infections. http://www.cdc.gov/HAI/infectionTypes.html.
Accessed June 2016.
5. CDC. Dialysis. http://www.cdc.gov/dialysis. Accessed July 2016.
6. Strategies to Prevent Clostridium difficile Infections in Acute Care Hospitals: 2015
Update. http://www.jstor.org/stable/10.1086/676023. Accessed July 2016.
7. CDC. Vital Signs. Stopping C. difficile Infections. March 2012.
http://www.cdc.gov/vitalsigns/pdf/2012-03-vitalsigns.pdf Accessed July 2016.
8. CDC. National Healthcare Safety Network (NHSN). http://www.cdc.gov/nhsn/. Accessed
July 2016.
9. Strategies to Prevent Central Line–Associated Bloodstream Infections in Acute
Care Hospitals: 2015 Update. http://www.jstor.org/stable/10.1086/676533. Accessed
July 2016.
10. Strategies to Prevent Surgical Site Infections in Acute Care Hospitals: 2015
Update. http://www.jstor.org/stable/10.1086/676022. Accessed July 2016.
11. Strategies to Prevent Methicillin-Resistant Staphylococcus aureus Transmission
and Infection in Acute Care Hospitals: 2015 Update.
http://www.jstor.org/stable/10.1086/676534#full_text_tab_contents.
Accessed July 2016.
Utah Department of Health
Healthcare-Associated Infections
Prevention Program
P.O. Box 142104
Salt Lake City, UT 84114
http://health.utah.gov/epi/diseases/HAI/index.html
PH 801-538-6191 • FAX 801-538-9923