HEALTH REFORM MONITORING SURVEY
hrms.urban.org

Trends in Uninsurance for Adults
Q1 2013 Q2 2013 Q3 2013 Q4 2013 Q1 2014 Q2 20140%
5%
10%
15%
20%
25%
17.5%18.5%
17.9%17.4%
15.2% **
13.9% **14.8%
16.5% 16.2%
15.1%
12.3% **
10.1% **
20.8% 21.1%20.0%
20.3%
18.7% * 18.3%**
In Medicaid nonexpansion states
All adults
In Medicaid expansion states

Percentage-Point Increase in Insurance Coverage for Adults
At o
r below
138
% o
f FPL
139–
399%
of F
PL
400%
or m
ore
of F
PL
18–3
0
31–4
9
50–6
4
Whi
te, n
on-H
ispan
ic
Nonwhi
te, n
on-H
ispan
ic
Hispan
ic
Fem
ale
Male
4.0 **
7.3 **
5.3 **
0.33415240293528
4.3 **
3.6 **4.0 **
2.6 **
6.9 **
5.3 **
3.5 **
4.3 **
All Adul
tsFamily income Age Race and ethnicity Gender

6.1 **
13.7 **
6.3 **
0.90236760176779
8.8 **
5.4 **4.5 ** 4.2 **
9.8 **
8.1 **
5.4 **6.5 **
1.7 * 1.17721726974852
4.2 **
-0.53549832325441-1.00864064342807
1.927321892020173.4 **
0.68366478108527
3.72734976698698
2.206457469662571.643909574497851.5262815218965
In Medicaid expansion states In Medicaid nonexpansion states
All Adult
sFamily income Age Race and eth-
nicityGen-der
Percentage-Point Increase in Insurance Coverage for Adults by State Decision to Expand Medicaid

Distribution of Uninsured Adults Ages 18–64 by State Medicaid Expansion Status
50.3%49.7%
September 2013
39.4%
60.6%
June 2014
States expanding Medicaid
States not expanding Medicaid

Awareness of Uninsured Adults Ages 18–64 of Key ACA Coverage Provisions, by Insurance Status
58.5%
38.2%
56.4%
67.9%***
49.4%***
69.2%***
All remaining uninsured All insured adults

Reasons Uninsured Adults Ages 18–64 Give for Why They Do Not Have Insurance Coverage
Financial reasons: costs are too high/cannot afford coverage
Time or information barriers: don't have time to get insurance or don't know where to find information on
options
Some other reason or still weighing options
Transitioning: in process of enrolling or transitioning between coverage options
Do not want health insurance or would rather pay the fine
59.5%
9.7%
14.9%
13.5%
20.2%
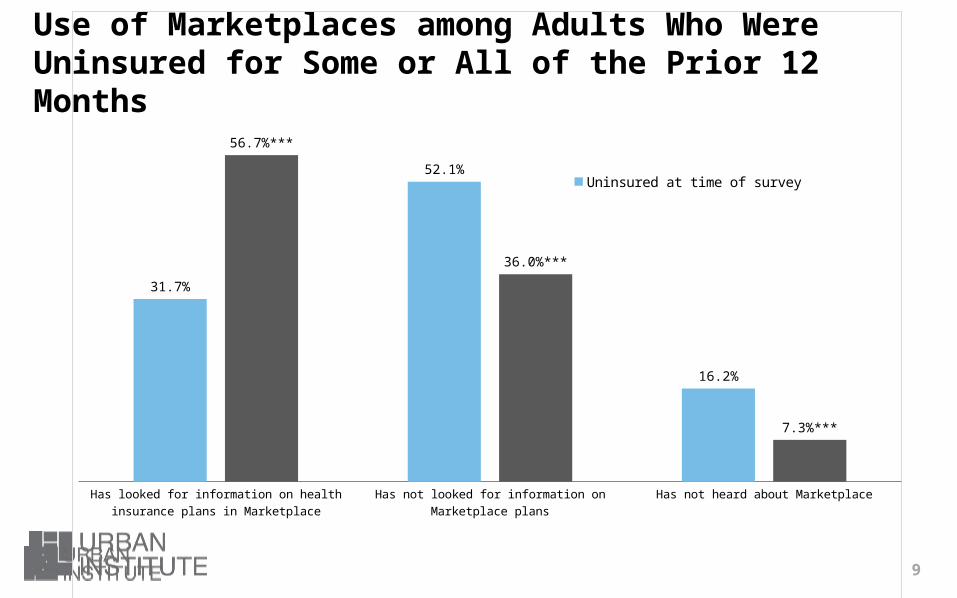
Use of Marketplaces among Adults Who Were Uninsured for Some or All of the Prior 12 Months
31.7%
52.1%
16.2%
56.7%***
36.0%***
7.3%***
Uninsured at time of survey
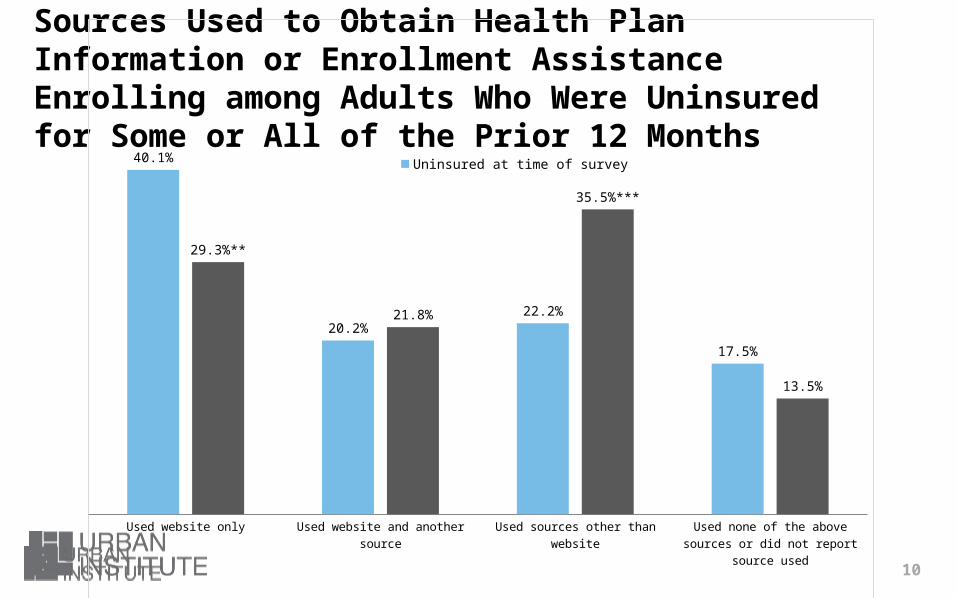
Sources Used to Obtain Health Plan Information or Enrollment Assistance Enrolling among Adults Who Were Uninsured for Some or All of the Prior 12 Months
Used website only Used website and another source
Used sources other than website
Used none of the above sources or did not report
source used
40.1%
20.2%22.2%
17.5%
29.3%**
21.8%
35.5%***
13.5%
Uninsured at time of survey Insured at time of survey