This product is suitable for investors who are seeking*:
• To generate long-term Capital appreciation/income
• Investment predominantly in equity and equity
related instruments. The scheme will also invest in
debt and money market instruments.
* Investors should consult their financial advisers if in
doubt about whether the product is suitable for them.
Riskometer
The growth of equity with the foundation of debt.
HDFC Hybrid Equity Fund
(An open ended hybrid scheme investing predominantly in
equity and equity related instruments)

Why Invest in Equity/Equity oriented mutual funds?
• Long term Wealth creation – Equities help beat inflation over a long term.
• Enables participation in the growth of the company.
• Liquidity – Equities/Equity mutual funds are more liquid compared to other
traditional asset classes.
• Transaction cost in Equities – Lower than traditional asset classes -physical
Gold or Real Estate.
• Diversification in Equity Mutual Funds - Reduces issuer specific risk even
with smaller investment.
2
Equity – Patience is the key
3
YEAR END (1) S&P SENSEX (2)ROLLING 1 YR GROWTH (3)
ROLLING 3 YR GROWTH (4)
ROLLING 5 YR GROWTH (5)
ROLLING 10 YR GROWTH (6)
ROLLING 15 YR GROWTH (7)
ROLLING 20 YR GROWTH (8)
Mar-79 100
Mar-80 129 29%
Mar-81 173 35%
Mar-82 218 26% 30%
Mar-83 212 -3% 18%
Mar-84 245 16% 12% 20%
Mar-85 354 44% 18% 22%
Mar-86 574 62% 39% 27%
Mar-87 510 -11% 28% 19%
Mar-88 398 -22% 4% 13%
Mar-89 714 79% 8% 24% 22%
Mar-90 781 9% 15% 17% 20%
Mar-91 1168 50% 43% 15% 21%
Mar-92 4285 267% 82% 53% 35%
Mar-93 2281 -47% 43% 42% 27%
Mar-94 3779 66% 48% 40% 31% 27%
Mar-95 3261 -14% -9% 33% 25% 24%
Mar-96 3367 3% 14% 24% 19% 22%
Mar-97 3361 0% -4% -5% 21% 20%
Mar-98 3893 16% 6% 11% 26% 21%
Mar-99 3740 -4% 4% 0% 18% 20% 20%
Mar-00 5001 34% 14% 9% 20% 19% 20%
Mar-01 3604 -28% -3% 1% 12% 13% 16%
Mar-02 3469 -4% -2% 1% -2% 14% 15%
Mar-03 3049 -12% -15% -5% 3% 15% 14%
Mar-04 5591 83% 16% 8% 4% 15% 17%
Mar-05 6493 16% 23% 5% 7% 15% 16%
Mar-06 11280 74% 55% 26% 13% 16% 16%
Mar-07 13072 16% 33% 30% 15% 8% 18%
Mar-08 15644 20% 34% 39% 15% 14% 20%
Mar-09 9709 -38% -5% 12% 10% 6% 14%
Mar-10 17528 81% 10% 22% 13% 12% 17%
Mar-11 19445 11% 8% 12% 18% 12% 15%
Mar-12 17404 -10% 21% 6% 18% 12% 7%
Mar-13 18836 8% 2% 4% 20% 11% 11%
Mar-14 22386 19% 5% 18% 15% 13% 9%
Mar-15 27957 25% 17% 10% 16% 12% 11%
Mar-16 25342 -9% 10% 5% 8% 14% 11%
Mar-17 29621 17% 10% 11% 9% 15% 11%
Mar-18 32969 11% 6% 12% 8% 17% 11%
Probability Of Gain 26/39 31/37 32/35 29/30 25/25 20/20An illustration on value of Rs.100 invested in S&P BSE SENSEX on 31st March, 1979Source: BSE Ltd, Sensex returns are computed for 1,3,5,10,15 & 20 years from the date of investment. Returns for 1 year are absolute and above 1 year CAGR.CAGR: The rate at which an investment grows annually over a specified period of time. Values are as on 31st March every year.Column 2: shows the value of BSE index at the end of the respective period. Probability of gains is the number of times the investor would have made positive returns.Column 3 to 8: Represents the return earned on the investment for the referred period. For e.g. If you invested in Mar-79 when SENSEX Index was 100, then 1 year returns (in Mar-80) would have been 29%, 3 years returns (in Mar-82)would have been 30%, 5 years returns (in Mar-84) would have been 20%, 10 year returns (in Mar-89) would have been 22%, 15 year returns (in Mar-94) would have been 27%, and 20 year returns (in Mar-99) would have been 20%. HDFC AMC/ HDFC Mutual Fund is not guaranteeing/promising any returns. Past Performance may or may not be sustained in future.
1. Short term returns
in equities are
volatile. Hence,
equity investments
should be made with
a long term horizon.
2. Risk in equities
reduces as holding
period increases
3. Benefits of
compounding are
bigger over longer
periods

Equity – A long term wealth creator
4
Returns from March 31,1979 to February 28, 2019
Source: Bloomberg, RBI Handbook of statistics on Indian Economy, MFI ,World Gold Council
#Average inflation is shown for comparison with returns from various asset classes.
As TRI data is not available since Mar 31, 1979 the performance is calculated using composite CAGR of S&P BSE Sensex PRI Values from Mar 31, 1979 to Aug 18, 1996 and TRI values since Aug 19, 1996.
Above asset classes are not strictly comparable. Equity as an asset class is riskier as compared to Gold and Bank FD. Above chart is for illustrative purpose only.
Past performance may or may not be sustained in the future.
Note: HDFC AMC/HDFC Mutual Fund is not guaranteeing/assuring any returns. Historical indicators are not indicative of future events / performance
• Equity grows in line with underlying businesses.
• The nominal growth of the economy (real growth +
inflation) is a proxy for average growth in the
businesses.
• The Indian economy has grown at a nominal rate
of ~14% p.a. The SENSEX CAGR of ~16% is in line
with the economy.
Equity in the long run has proved better than
other asset classes.
5.6 5.6 7.5 6.9
8.6 9.1 6.4
6.6
-
2.0
4.0
6.0
8.0
10.0
12.0
14.0
16.0
CY: 1981-1990 CY: 1991-2000 CY: 2001-2010 CY: 2011-2018
Decadal Real GDP Growth Inflation
Source: World Bank, Bloomberg
7.01%
8.27%
10.17%
15.87%
0% 5% 10% 15% 20%
AvgInflation
Bank FD
Gold
Equity

Equity and Debt Cycles
5
The above asset classes are not strictly comparable as different asset classes have different risk profile.
It is difficult to predict market cycles –hybrid funds provide a solution
“There are two kinds of forecasters: those who don’t know, and those who don’t know they don’t
know” --- Economist John Kenneth Galbraith
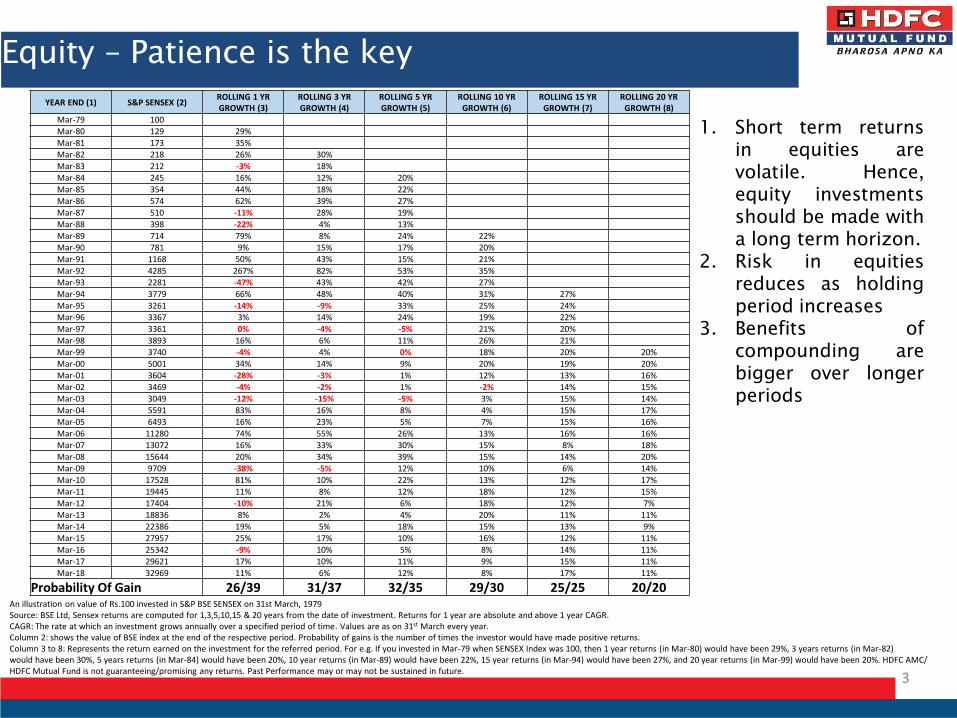
Hybrid Funds – A Mix of Equity & Debt
6
Ret
urn
s
In view of the individual circumstances and risk profile, each investor is advised to consult his / her professional advisor before making a decision to invest.
Risk
Hybrid funds target returns greater than debt schemes with lower volatility than equity
schemes
Hybrid Equity Funds have equity exposure ranging between 65% and 80% and the rest in
debt.
Debt Funds
Hybrid Debt Funds
Equity Savings Funds
Hybrid Equity Funds
Equity Funds
In view of the individual circumstances and risk profile, each investor is advised to consult his/her professional advisor before taking investment decisions.
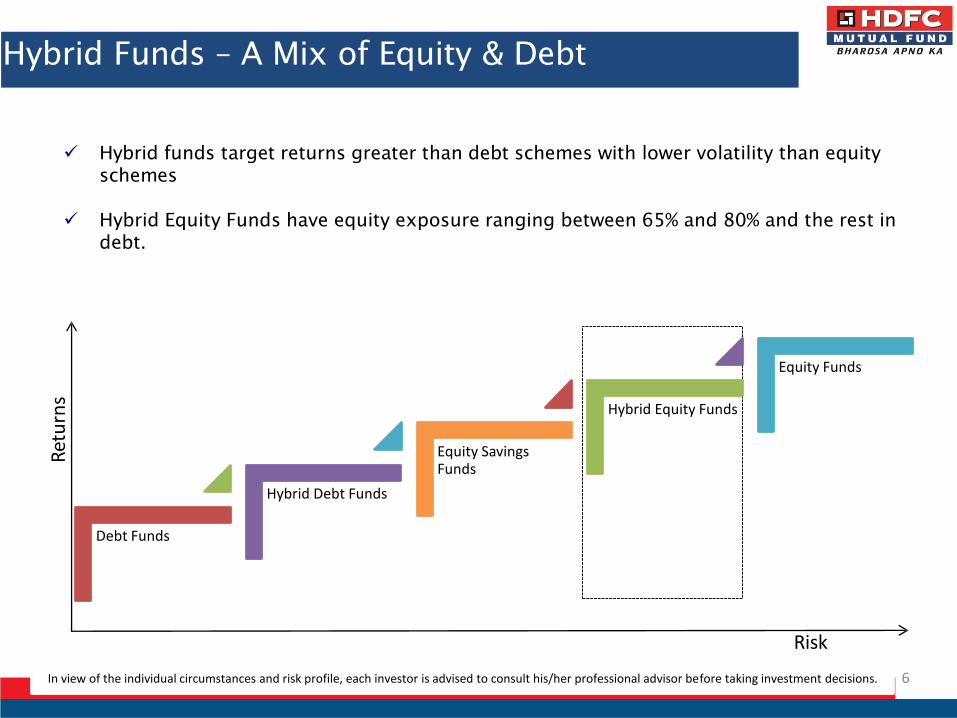
Growth of Equity with Stability of Debt
7
HDFC Hybrid
Equity Fund
Equity: 67.8%
Large Cap:
48.2%
Mid Cap:
11.6%
Small Cap:
8.0%
Debt: 32.2%
G-Sec: 8.2%
Credit: 21.2%
AAA: 17.5%
AA+: 2.9%
Below AA+:
0.9%Cash: 2.8%
In Equity, the fund has highest exposure to Large Caps and in Debt, AAAs have highest exposure
Particulars Equity Debt/Cash Weighted Average Market Cap (Rs cr)
Fund 67.8% 32.2% 1,36,837
Benchmark 65% 35% 3,16,346
Portfolio DetailsNumber of stocks: 62
Top 5 stocks: 23.7%
Top 10 stocks: 35.8%
Portfolio Turnover Ratio (Last 1 year): 8.8%
As on 28th
February, 2019. Market cap classification is as per the SEBI Categorization circular dated October 6, 2017. The above
allocation is based on current investment strategy, which is subject to change. Refer SID for complete Investment strategy.
For complete portfolio details refer www.hdfcfund.com.
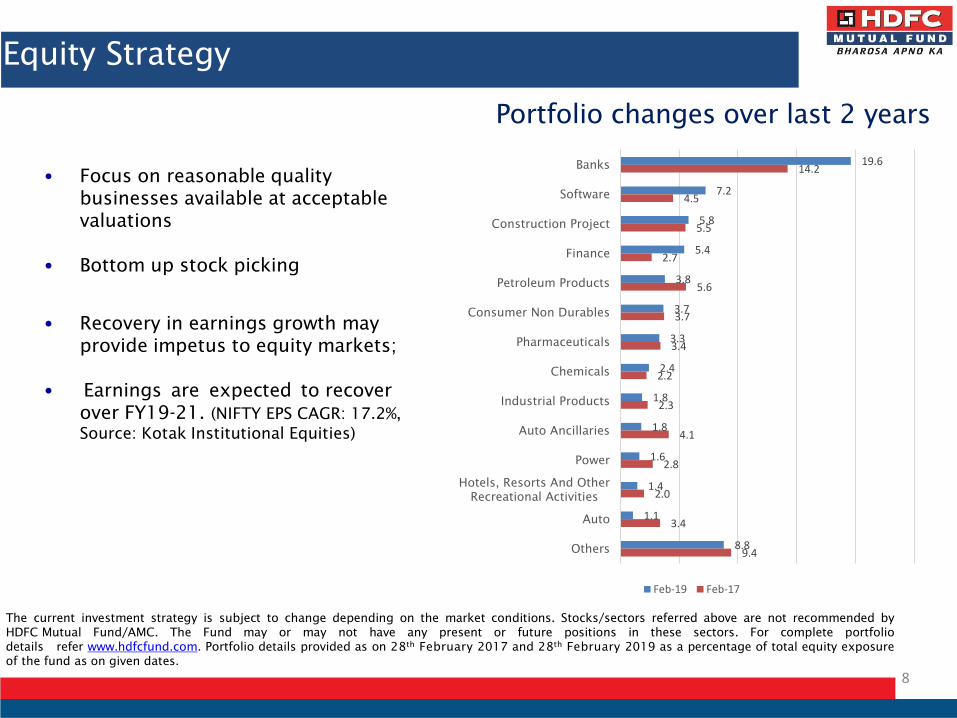
Equity Strategy
8
• Focus on reasonable quality
businesses available at acceptable
valuations
• Bottom up stock picking
• Recovery in earnings growth may
provide impetus to equity markets;
• Earnings are expected to recover
over FY19-21. (NIFTY EPS CAGR: 17.2%,
Source: Kotak Institutional Equities)
The current investment strategy is subject to change depending on the market conditions. Stocks/sectors referred above are not recommended by
HDFC Mutual Fund/AMC. The Fund may or may not have any present or future positions in these sectors. For complete portfolio
details refer www.hdfcfund.com. Portfolio details provided as on 28th
February 2017 and 28th
February 2019 as a percentage of total equity exposure
of the fund as on given dates.
Portfolio changes over last 2 years
19.6
7.2
5.8
5.4
3.8
3.7
3.3
2.4
1.8
1.8
1.6
1.4
1.1
8.8
14.2
4.5
5.5
2.7
5.6
3.7
3.4
2.2
2.3
4.1
2.8
2.0
3.4
9.4
Banks
Software
Construction Project
Finance
Petroleum Products
Consumer Non Durables
Pharmaceuticals
Chemicals
Industrial Products
Auto Ancillaries
Power
Hotels, Resorts And Other
Recreational Activities
Auto
Others
Feb-19 Feb-17
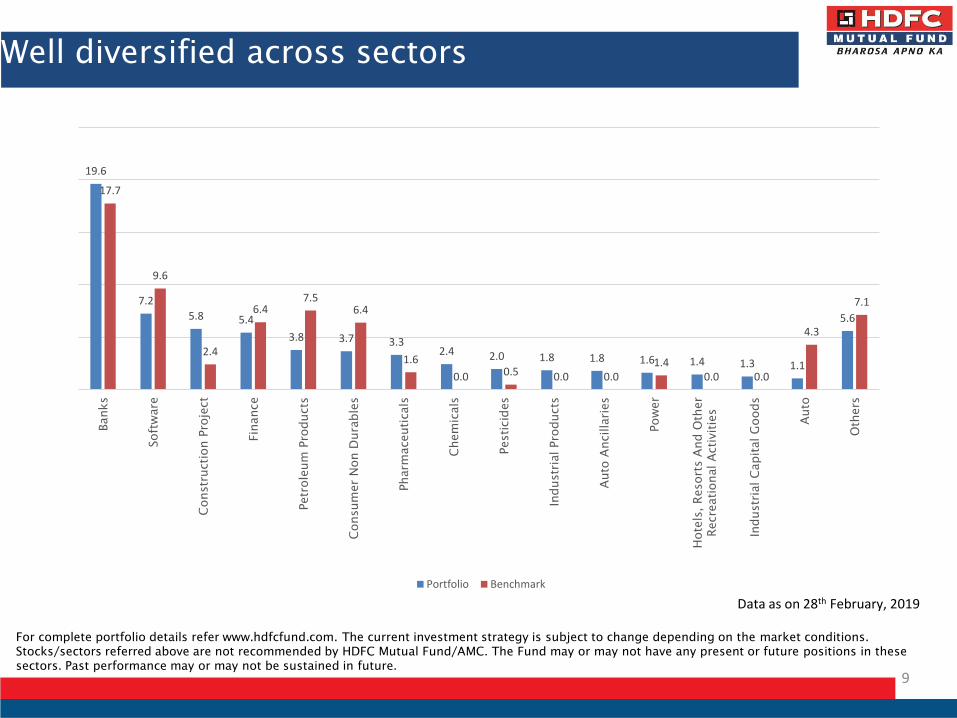
For complete portfolio details refer www.hdfcfund.com. The current investment strategy is subject to change depending on the market conditions.
Stocks/sectors referred above are not recommended by HDFC Mutual Fund/AMC. The Fund may or may not have any present or future positions in these
sectors. Past performance may or may not be sustained in future.
Well diversified across sectors
9
Data as on 28th February, 2019
19.6
7.2
5.8 5.4
3.8 3.7 3.32.4 2.0 1.8 1.8 1.6 1.4 1.3 1.1
5.6
17.7
9.6
2.4
6.47.5
6.4
1.6
0.0 0.5 0.0 0.01.4
0.0 0.0
4.3
7.1
Banks
Softw
are
Constructio
n Project
Finance
Petroleum
Products
Consum
er N
on D
urables
Pharm
aceuticals
Chem
icals
Pestic
ides
Industrial Products
Auto A
ncillaries
Pow
er
Hotels, R
esorts A
nd O
ther
Recreatio
nal A
ctivities
Industrial C
apital G
oods
Auto
Others
Portfolio Benchmark

Equity Market Outlook
10
India’s market cap to GDP on FY20E is at ~61%, which is attractive.
Source: World Bank, Bloomberg, Kotak Institutional Equities
In P/E terms, markets are trading near 16.8x FY20(e) and 14.4x FY21(e) (Nifty Consensus PE, Source : Kotak
Institutional Equities) which are reasonable, especially given the low interest rates. In fact, as earnings
growth improves, the P/E's should look more reasonable and move lower.
India market cap to GDP ratio, calendar year-ends, 2000-20E (%) Mcap as of February 28, 2019
35 26
30
48 55
69
88
149
56
99 98
61
72 65
81 75
71
92
78
69 61
0
5
10
15
20
25
0
20
40
60
80
100
120
140
160
2000
2001
2002
2003
2004
2005
2006
2007
2008
2009
2010
2011
2012
2013
2014
2015
2016
2017
2018
2019E
2020E
Mcap/GDP (%)
P/E (X)

Debt Strategy- HDFC Hybrid Equity Fund
11
• The Fund has reduced the G – Sec exposure over time and increased the exposure to accrual
based debt instruments.
• The Fund has reduced its average maturity
The current investment strategy is subject to change depending on the market conditions. For complete portfolio details
refer www.hdfcfund.com. Portfolio holdings are as a percentage of total portfolio holdings. HDFC Mutual Fund/AMC is not
guaranteeing/offering/communicating any indicative yields or guaranteed returns on investments made in the scheme(s)
Particulars Feb-16 Feb-17 Feb-18 Feb-19
Average Maturity (In Yrs.)
13.04 8.41 5.38 3.05
ModifiedDuration (In Yrs.)
6.52 4.71 3.43 2.38
Yield To Maturity 7.99% 6.99% 7.76% 8.10%
10 year G - Sec Yield
7.63% 6.87% 7.73% 7.41%
8.2
21.2
2.8
18.1
6.1
10.0
G-Sec
Credit Exposure
Cash,Cash Equivalents and Net
Current Assets
Feb-19 Feb-17
Portfolio changes over last 2 years
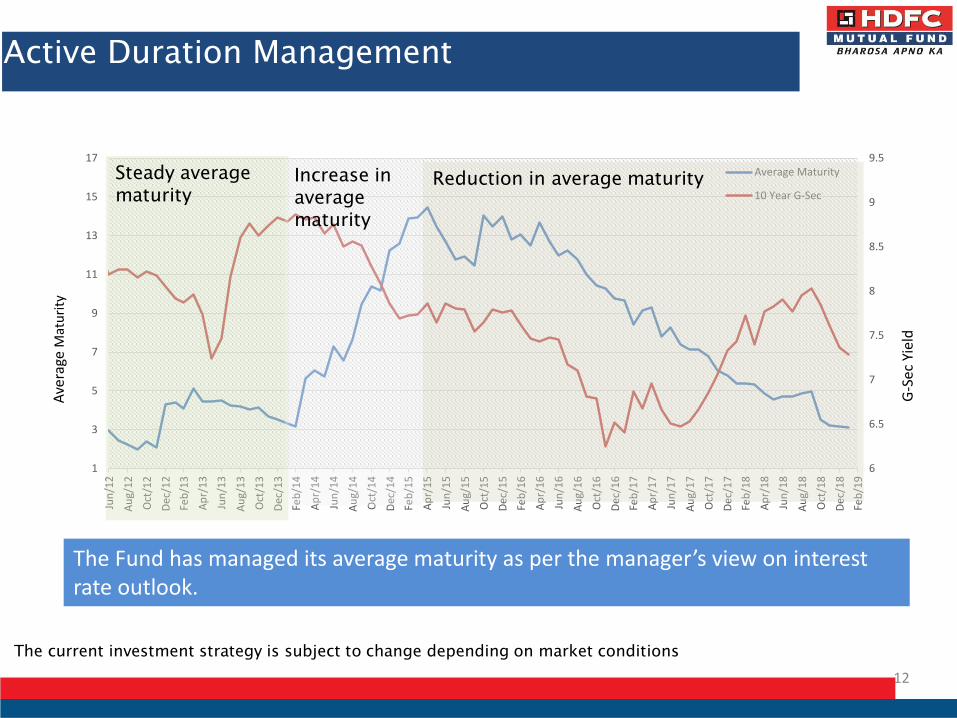
Active Duration Management
12
The Fund has managed its average maturity as per the manager’s view on interest rate outlook.
Ave
rage
Mat
uri
ty
G-S
ec Y
ield
The current investment strategy is subject to change depending on market conditions
6
6.5
7
7.5
8
8.5
9
9.5
1
3
5
7
9
11
13
15
17
Jun
/12
Au
g/1
2
Oct
/12
Dec
/12
Feb
/13
Ap
r/1
3
Jun
/13
Au
g/1
3
Oct
/13
Dec
/13
Feb
/14
Ap
r/1
4
Jun
/14
Au
g/1
4
Oct
/14
Dec
/14
Feb
/15
Ap
r/1
5
Jun
/15
Au
g/1
5
Oct
/15
Dec
/15
Feb
/16
Ap
r/1
6
Jun
/16
Au
g/1
6
Oct
/16
Dec
/16
Feb
/17
Ap
r/1
7
Jun
/17
Au
g/1
7
Oct
/17
Dec
/17
Feb
/18
Ap
r/1
8
Jun
/18
Au
g/1
8
Oct
/18
Dec
/18
Feb
/19
Average Maturity
10 Year G-Sec
Steady average
maturity
Increase in
average
maturity
Reduction in average maturity

Economic Outlook
13
Improving macros FY14 FY15 FY16 FY17 FY18 FY19E FY20EReal GDP at market price (% YoY) 6.4 7.4 8.0 8.2 7.2 6.9 7.1
Centre's fiscal deficit (% GDP) 4.5 4.1 3.9 3.5 3.5 3.4 3.4
Current Account Deficit (CAD) (% GDP) 1.7 1.3 1.1 0.7 1.8 2.6 2.4*
Balance of Payment (% of GDP) 0.8 3.0 0.9 0.9 1.6 -0.7 -0.1
Net FDI (% of GDP) 1.2 1.5 1.7 1.6 1.1 1.2 1.1
Consumer Price Inflation (Average) 9.4 6.0 4.9 4.5 3.6 3.4 3.7
Foreign Exchange Reserves (USD bn) 303.7 341.4 359.8 370 424.4 401.8^ na
The table below summarizes various macro indicators for the last five years and estimates for the next 2 years.
Source: CEIC, Kotak Institutional Equities; CSO, Economic Survey, Union budget 2018-19, E-Estimates, ^ as of 1st
Mar’19. na – not available; * average
crude price assumed at USD 70 per barrel.
• Growth is expected to stabilize in FY19 and FY20 supported by revival in capex expenditure. Capex has been growing at
higher pace than consumption since FY18 and likely to accelerate over FY19 and FY20
• Signs of private capex reviving visible with increase in capacity utilization and major announcements by Steel and cement
majors. Outlook of inflation remains benign led by food inflation and lower crude prices.
70
72
74
76
78
80
Jun
/11
Sep
/11
Dec
/11
Mar
/12
Jun
/12
Sep
/12
Dec
/12
Mar
/13
Jun
/13
Sep
/13
Dec
/13
Mar
/14
Jun
/14
Sep
/14
Dec
/14
Mar
/15
Jun
/15
Sep
/15
Dec
/15
Mar
/16
Jun
/16
Sep
/16
Dec
/16
Mar
/17
Jun
/17
Sep
/17
Dec
/17
Mar
/18
Jun
/18
Sep
/18
%Rising capacity utilisation driving capex recovery
Capacity Utilisation
Capacity Utilisation (SA)
Long term Average
-10.0%
-5.0%
0.0%
5.0%
10.0%
15.0%
20.0%
25.0%
FY11 FY12 FY13 FY14 FY15 FY16 FY17 FY18 FY19E
Signs of capex reviving, consumption stable
Real GDP Growth
Consumption
Gross Capital Formation
Source: CSO, CMIESource: RBI
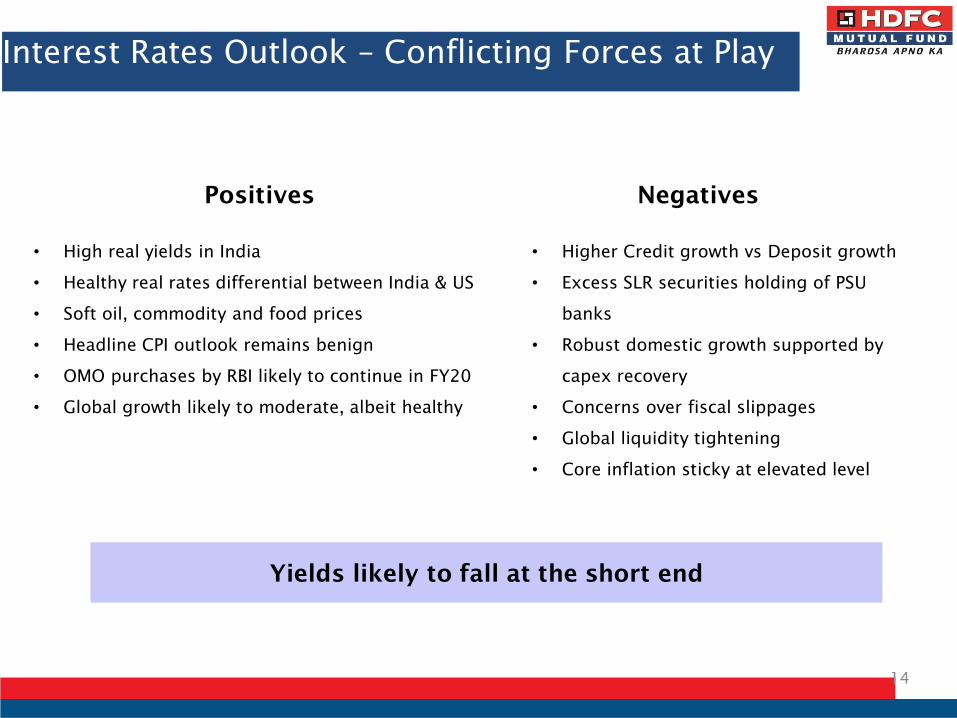
Interest Rates Outlook – Conflicting Forces at Play
14
Positives Negatives
• Higher Credit growth vs Deposit growth
• Excess SLR securities holding of PSU
banks
• Robust domestic growth supported by
capex recovery
• Concerns over fiscal slippages
• Global liquidity tightening
• Core inflation sticky at elevated level
Yields likely to fall at the short end
• High real yields in India
• Healthy real rates differential between India & US
• Soft oil, commodity and food prices
• Headline CPI outlook remains benign
• OMO purchases by RBI likely to continue in FY20
• Global growth likely to moderate, albeit healthy
A Look At Our Long Term Track Record
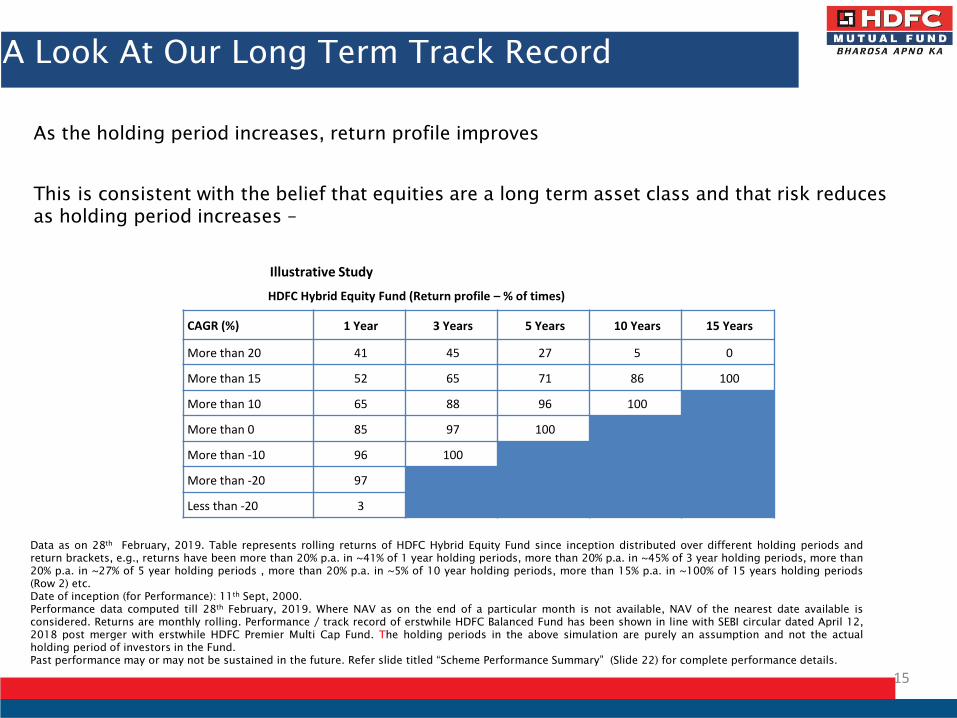
As the holding period increases, return profile improves
This is consistent with the belief that equities are a long term asset class and that risk reduces
as holding period increases –
CAGR (%) 1 Year 3 Years 5 Years 10 Years 15 Years
More than 20 41 45 27 5 0
More than 15 52 65 71 86 100
More than 10 65 88 96 100
More than 0 85 97 100
More than -10 96 100
More than -20 97
Less than -20 3
HDFC Hybrid Equity Fund (Return profile – % of times)
Data as on 28th
February, 2019. Table represents rolling returns of HDFC Hybrid Equity Fund since inception distributed over different holding periods and
return brackets, e.g., returns have been more than 20% p.a. in ~41% of 1 year holding periods, more than 20% p.a. in ~45% of 3 year holding periods, more than
20% p.a. in ~27% of 5 year holding periods , more than 20% p.a. in ~5% of 10 year holding periods, more than 15% p.a. in ~100% of 15 years holding periods
(Row 2) etc.
Date of inception (for Performance): 11th
Sept, 2000.
Performance data computed till 28th
February, 2019. Where NAV as on the end of a particular month is not available, NAV of the nearest date available is
considered. Returns are monthly rolling. Performance / track record of erstwhile HDFC Balanced Fund has been shown in line with SEBI circular dated April 12,
2018 post merger with erstwhile HDFC Premier Multi Cap Fund. The holding periods in the above simulation are purely an assumption and not the actual
holding period of investors in the Fund.
Past performance may or may not be sustained in the future. Refer slide titled “Scheme Performance Summary” (Slide 22) for complete performance details.
Illustrative Study
15
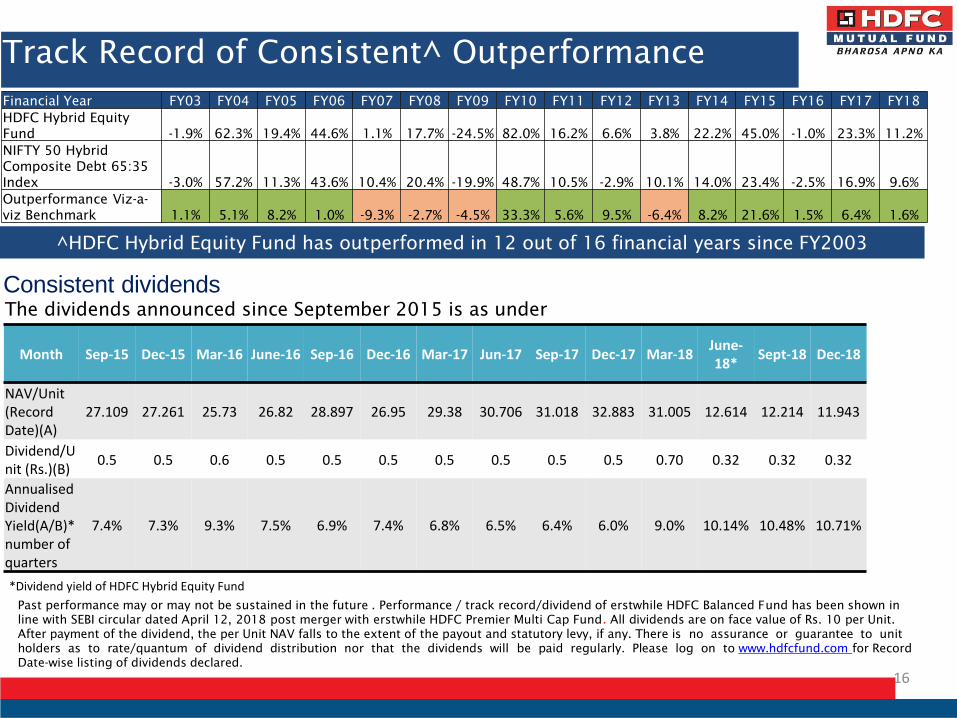
Track Record of Consistent^ Outperformance
16
^HDFC Hybrid Equity Fund has outperformed in 12 out of 16 financial years since FY2003
Past performance may or may not be sustained in the future . Performance / track record/dividend of erstwhile HDFC Balanced Fund has been shown in
line with SEBI circular dated April 12, 2018 post merger with erstwhile HDFC Premier Multi Cap Fund. All dividends are on face value of Rs. 10 per Unit.
After payment of the dividend, the per Unit NAV falls to the extent of the payout and statutory levy, if any. There is no assurance or guarantee to unit
holders as to rate/quantum of dividend distribution nor that the dividends will be paid regularly. Please log on to www.hdfcfund.com for Record
Date-wise listing of dividends declared.
Consistent dividendsThe dividends announced since September 2015 is as under
Month Sep-15 Dec-15 Mar-16 June-16 Sep-16 Dec-16 Mar-17 Jun-17 Sep-17 Dec-17 Mar-18June-18*
Sept-18 Dec-18
NAV/Unit (Record Date)(A)
27.109 27.261 25.73 26.82 28.897 26.95 29.38 30.706 31.018 32.883 31.005 12.614 12.214 11.943
Dividend/Unit (Rs.)(B)
0.5 0.5 0.6 0.5 0.5 0.5 0.5 0.5 0.5 0.5 0.70 0.32 0.32 0.32
Annualised Dividend Yield(A/B)*number ofquarters
7.4% 7.3% 9.3% 7.5% 6.9% 7.4% 6.8% 6.5% 6.4% 6.0% 9.0% 10.14% 10.48% 10.71%
*Dividend yield of HDFC Hybrid Equity Fund
Financial Year FY03 FY04 FY05 FY06 FY07 FY08 FY09 FY10 FY11 FY12 FY13 FY14 FY15 FY16 FY17 FY18
HDFC Hybrid Equity
Fund -1.9% 62.3% 19.4% 44.6% 1.1% 17.7% -24.5% 82.0% 16.2% 6.6% 3.8% 22.2% 45.0% -1.0% 23.3% 11.2%
NIFTY 50 Hybrid
Composite Debt 65:35
Index -3.0% 57.2% 11.3% 43.6% 10.4% 20.4% -19.9% 48.7% 10.5% -2.9% 10.1% 14.0% 23.4% -2.5% 16.9% 9.6%
Outperformance Viz-a-
viz Benchmark 1.1% 5.1% 8.2% 1.0% -9.3% -2.7% -4.5% 33.3% 5.6% 9.5% -6.4% 8.2% 21.6% 1.5% 6.4% 1.6%

Wealth Creation Journey
Growth of Rs.10,000 invested in Sept, 2001
17
The Fund inception date is 11th September, 2000. As the benchmark inception date is 3rd September, 2001, scheme returns since 3rd September, 2001 is considered in above.
0
20,000
40,000
60,000
80,000
100,000
120,000
140,000
160,000
180,000
200,000
Sep
-01
Au
g-0
2
Jul-
03
Jun
-04
May
-05
Ap
r-0
6
Mar
-07
Feb
-08
Jan
-09
Dec
-09
No
v-1
0
Oct
-11
Sep
-12
Au
g-1
3
Jul-
14
Jun
-15
May
-16
Ap
r-1
7
Mar
-18
Feb
-19
NIFTY 50 Hybrid Composite Debt 65:35 Index HDFC Hybrid Equity Fund
1,60,486
93,606
Past performance may or may not be sustained in the future . Performance / track record/dividend of erstwhile HDFC Balanced Fund has
been shown in line with SEBI circular dated April 12, 2018 post merger with erstwhile HDFC Premier Multi Cap Fund.

SIP Performance – Power of Compounding
18
Assuming Rs 10,000 invested systematically on the first Business Day of every month over a period of time. CAGR returns are
computed after accounting for the cash flow by using XIRR method (investment internal rate of return) for Regular Plan - Growth
Option. The above investment simulation is for illustrative purposes only and should not be construed as a promise on minimum
returns and safeguard of capital. For complete performance summary refer slide 24. Past performance may or may not be
sustained in the future . Performance / track record/dividend of erstwhile HDFC Balanced Fund has been shown in line with SEBI
circular dated April 12, 2018 post merger with erstwhile HDFC Premier Multi Cap Fund.
As on 28th February , 2019
Rs in ‘000s
360 600 1,200 1,800 2,220 33 148 1,258
4,121
9,495
-
2,000
4,000
6,000
8,000
10,000
12,000
14,000
3 year SIP 5 year SIP 10 year SIP 15 year SIP Since Inception
Total Amount Invested (Rs.) Appreciation
Fund Suitability
• Provides tax efficient asset allocation. The scheme will remain invested in equity
in the range of 65% – 80% of its corpus. (Therefore qualifying for equity taxation*)
• Debt reduces volatility of Equity.
• Provides diversification across asset classes
• Suitable for investors with moderately high risk appetite.
HDFC Mutual Fund/AMC is not guaranteeing returns on investments made in this scheme. For complete asset allocation pattern table
refer slide 21. In view of the individual circumstances and risk profile, each investor is advised to consult his / her professional advisor
before making a decision to invest in the Scheme. Refer Slide 22 & 23 for detailed performance
* as per prevailing tax laws which are subject to change.
19
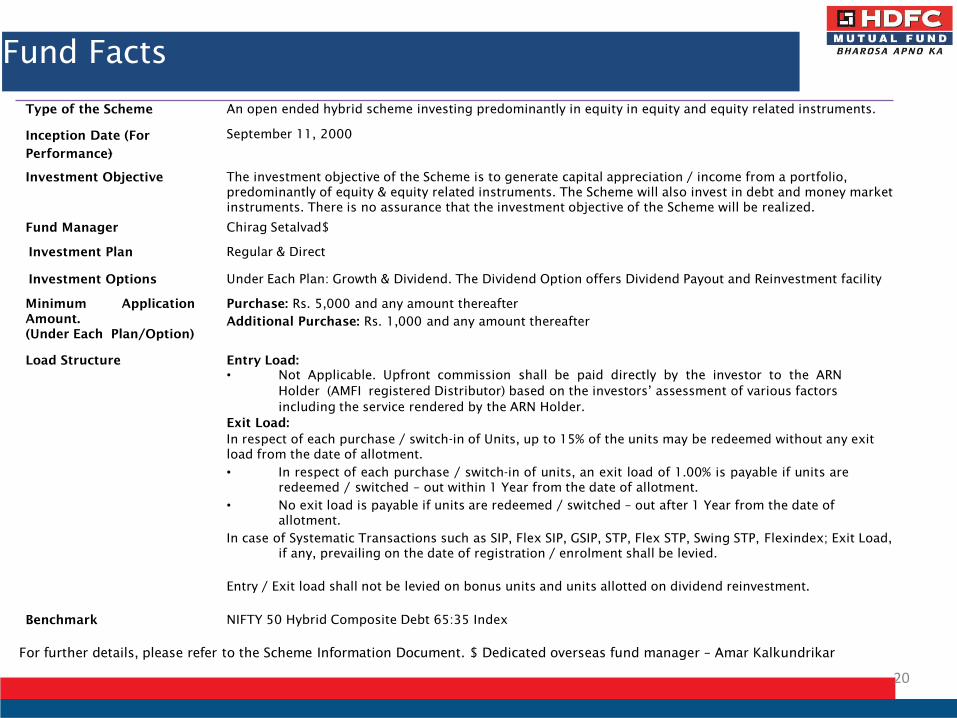
For further details, please refer to the Scheme Information Document. $ Dedicated overseas fund manager – Amar Kalkundrikar
Type of the Scheme An open ended hybrid scheme investing predominantly in equity in equity and equity related instruments.
Inception Date (For
Performance)
September 11, 2000
Investment Objective The investment objective of the Scheme is to generate capital appreciation / income from a portfolio,
predominantly of equity & equity related instruments. The Scheme will also invest in debt and money market
instruments. There is no assurance that the investment objective of the Scheme will be realized.
Fund Manager Chirag Setalvad$
Investment Plan Regular & Direct
Investment Options Under Each Plan: Growth & Dividend. The Dividend Option offers Dividend Payout and Reinvestment facility
Minimum Application
Amount.
(Under Each Plan/Option)
Purchase: Rs. 5,000 and any amount thereafter
Additional Purchase: Rs. 1,000 and any amount thereafter
Load Structure Entry Load:
• Not Applicable. Upfront commission shall be paid directly by the investor to the ARN
Holder (AMFI registered Distributor) based on the investors’ assessment of various factors
including the service rendered by the ARN Holder.
Exit Load:
In respect of each purchase / switch-in of Units, up to 15% of the units may be redeemed without any exit
load from the date of allotment.
• In respect of each purchase / switch-in of units, an exit load of 1.00% is payable if units are
redeemed / switched – out within 1 Year from the date of allotment.
• No exit load is payable if units are redeemed / switched – out after 1 Year from the date of
allotment.
In case of Systematic Transactions such as SIP, Flex SIP, GSIP, STP, Flex STP, Swing STP, Flexindex; Exit Load,
if any, prevailing on the date of registration / enrolment shall be levied.
Entry / Exit load shall not be levied on bonus units and units allotted on dividend reinvestment.
Benchmark NIFTY 50 Hybrid Composite Debt 65:35 Index
Fund Facts
20
Asset Allocation
The Scheme may invest in the schemes of Mutual Funds in accordance with the applicable extant SEBI
(Mutual Funds) Regulations as amended from time to time.
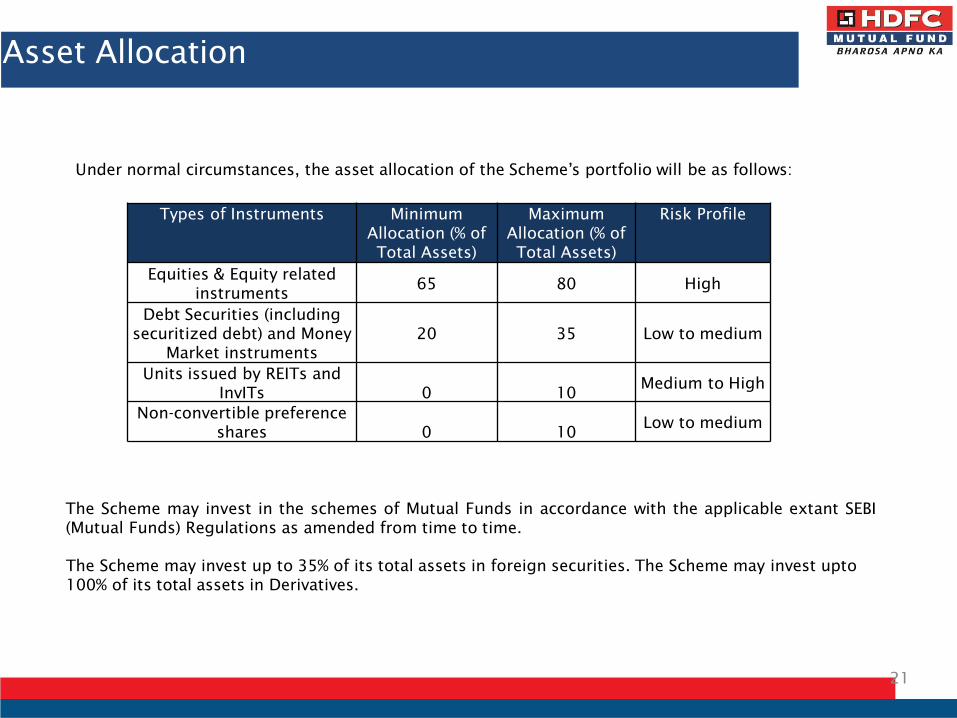
Under normal circumstances, the asset allocation of the Scheme’s portfolio will be as follows:
21
Types of Instruments Minimum
Allocation (% of
Total Assets)
Maximum
Allocation (% of
Total Assets)
Risk Profile
Equities & Equity related
instruments65 80 High
Debt Securities (including
securitized debt) and Money
Market instruments
20 35 Low to medium
Units issued by REITs and
InvITs 0 10Medium to High
Non-convertible preference
shares 0 10Low to medium
The Scheme may invest up to 35% of its total assets in foreign securities. The Scheme may invest upto
100% of its total assets in Derivatives.
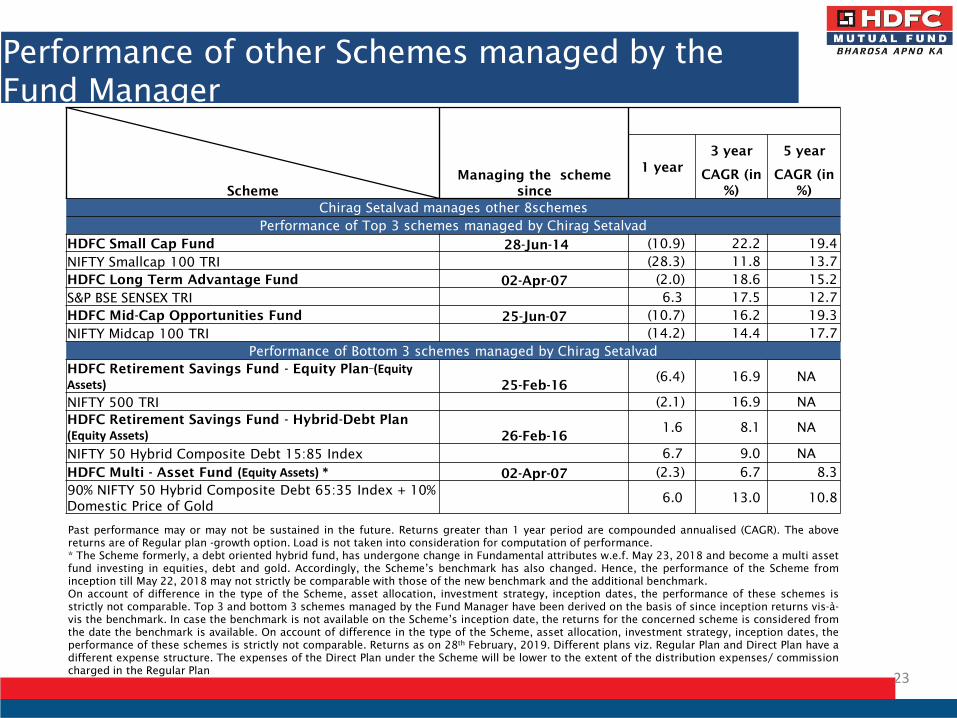
Performance of other Schemes managed by the
Fund Manager
Past performance may or may not be sustained in the future. Returns greater than 1 year period are compounded annualised (CAGR). The above
returns are of Regular plan -growth option. Load is not taken into consideration for computation of performance.
* The Scheme formerly, a debt oriented hybrid fund, has undergone change in Fundamental attributes w.e.f. May 23, 2018 and become a multi asset
fund investing in equities, debt and gold. Accordingly, the Scheme’s benchmark has also changed. Hence, the performance of the Scheme from
inception till May 22, 2018 may not strictly be comparable with those of the new benchmark and the additional benchmark.
On account of difference in the type of the Scheme, asset allocation, investment strategy, inception dates, the performance of these schemes is
strictly not comparable. Top 3 and bottom 3 schemes managed by the Fund Manager have been derived on the basis of since inception returns vis-à-
vis the benchmark. In case the benchmark is not available on the Scheme’s inception date, the returns for the concerned scheme is considered from
the date the benchmark is available. On account of difference in the type of the Scheme, asset allocation, investment strategy, inception dates, the
performance of these schemes is strictly not comparable. Returns as on 28th
February, 2019. Different plans viz. Regular Plan and Direct Plan have a
different expense structure. The expenses of the Direct Plan under the Scheme will be lower to the extent of the distribution expenses/ commission
charged in the Regular Plan
23
Scheme
Managing the scheme
since
1 year
3 year 5 year
CAGR (in
%)
CAGR (in
%)
Chirag Setalvad manages other 8schemes
Performance of Top 3 schemes managed by Chirag Setalvad
HDFC Small Cap Fund 28-Jun-14 (10.9) 22.2 19.4
NIFTY Smallcap 100 TRI (28.3) 11.8 13.7
HDFC Long Term Advantage Fund 02-Apr-07 (2.0) 18.6 15.2
S&P BSE SENSEX TRI 6.3 17.5 12.7
HDFC Mid-Cap Opportunities Fund 25-Jun-07 (10.7) 16.2 19.3
NIFTY Midcap 100 TRI (14.2) 14.4 17.7
Performance of Bottom 3 schemes managed by Chirag Setalvad
HDFC Retirement Savings Fund - Equity Plan (Equity Assets) 25-Feb-16
(6.4) 16.9 NA
NIFTY 500 TRI (2.1) 16.9 NA
HDFC Retirement Savings Fund - Hybrid-Debt Plan
(Equity Assets) 26-Feb-161.6 8.1 NA
NIFTY 50 Hybrid Composite Debt 15:85 Index 6.7 9.0 NA
HDFC Multi - Asset Fund (Equity Assets) * 02-Apr-07 (2.3) 6.7 8.3
90% NIFTY 50 Hybrid Composite Debt 65:35 Index + 10%
Domestic Price of Gold6.0 13.0 10.8

Past performance may or may not be sustained in the future. # NIFTY 50 Hybrid Composite Debt 15:85 Index ## NIFTY 50 (Total
Returns Index N.A. Not Available. Assuming Rs.10,000 invested systematically on the first Business Day of every month over a period of
time since inception (11th
Sept, 2000). CAGR returns are computed after accounting for the cash flow by using XIRR method (investment
internal rate of return) for Regular Plan - Growth Option. Load is not taken into consideration for computation of performance. The above
investment simulation is for illustrative purposes only and should not be construed as a promise on minimum returns and safeguard of
capital. The AMC / Mutual Fund is not guaranteeing or promising or forecasting any returns. As the portfolio characteristics and the
broad investment strategy of HDFC Hybrid Equity Fund is similar to that of erstwhile HDFC Balanced Fund, the track record (i.e. since
inception date, dividend history, etc.) / past performance of erstwhile HDFC Balanced Fund have been considered, in line with SEBI circular
on Performance disclosure post consolidation/ merger of scheme dated April 12, 2018. Accordingly, adjusted NAVs of erstwhile HDFC
Balanced Fund (since inception till date of merger) are used for the purpose of showing past performance of HDFC Hybrid Equity Fund.
SIP Returns
24
SIP InvestmentsSince
Inception15 year SIP 10 year SIP 5 year SIP 3 year SIP 1 year SIP
Total Amount Invested (Rs.) 2,220,000 1,800,000 1,200,000 600,000 360,000 120,000
Market Value as on February 28,
2019 (Rs.)11,714,677 5,921,462 2,457,694 748,136 392,794 118,389
Returns (%) 15.89% 14.54% 13.74% 8.78% 5.76% -2.50%
Market Value of SIP in Benchmark#
(Rs).N.A. 4,342,937.79 2,027,585.72 750,287.90 409,690.70 122,330.72
Benchmark Returns(%)# N.A. 10.93% 10.13% 8.89% 8.61% 3.65%
Market Value of SIP in Additional
Benchmark# # (Rs).9,815,276 4,808,697 2,132,329 763,357 417,483 120,719
Additional Benchmark Returns (%)#
#14.31% 12.12% 11.08% 9.58% 9.89% 1.12%
Disclaimer & Risk Factors
This presentation dated 15th
March, 2019 has been prepared by HDFC Asset Management Company Limited (HDFC
AMC) based on internal data, publicly available information and other sources believed to be reliable. Any calculations
made are approximations, meant as guidelines only, which you must confirm before relying on them. The
information contained in this document is for general purposes only. The document is given in summary form
and does not purport to be complete. The document does not have regard to specific investment objectives, financial
situation and the particular needs of any specific person who may receive this document. The information/ data
herein alone are not sufficient and should not be used for the development or implementation of an
investment strategy. The statements contained herein are based on our current views and involve known and unknown
risks and uncertainties that could cause actual results, performance or events to differ materially from those
expressed or implied in such statements. Stocks/Sectors referred above are illustrative and not recommended by
HDFC Mutual Fund / AMC. The Fund may or may not have any present or future positions in these sectors. The above
has been prepared on the basis of information which is already available in publicly accessible media. The above should
not be construed as an investment advice or a research report or a recommendation by HDFC Mutual Fund/HDFC AMC
to buy or sell the stock or any other security covered under the respective sector/s. Past performance may or may not
be sustained in future. Neither HDFC AMC and HDFC Mutual Fund nor any person connected with them, accepts any
liability arising from the use of this document. The recipient(s) before acting on any information herein should make
his/her/their own investigation and seek appropriate professional advice and shall alone be fully responsible
/ liable for any decision taken on the basis of information contained herein. For complete portfolio/details refer to our
website www.hdfcfund.com
Mutual fund investments are subject to market risks, read all scheme
related documents carefully.
25

Thank You
26