Guide
to Monitoring and Evaluation of Advocacy, Communication,
and Social Mobilization to Support
Tuberculosis Prevention and Care
March 2013

This document was produced for review by the United States Agency for International Development (USAID). It was prepared by PATH for USAID Tuberculosis Task Order 1, Contract No. GHN-I-00-09-00006-01, with funding from USAID.
iii
ACKNOWLEDGMENTS
Many individuals provided assistance and input in the development of these guidelines for
monitoring and evaluation (M&E) of advocacy, communication, and social mobilization (ACSM)
activities around tuberculosis (TB) prevention and care. Their unique and valuable contributions
are appreciated and reflected as accurately as possible.
Charlotte Colvin, TB/HIV Technical Officer at PATH, and Susan Kingston, PATH consultant, are
the principal authors of the guide. An advisory group formed by the members of the Core ACSM
sub-group and other ACSM and M&E specialists provided significant input and multiple reviews
of the guidelines at various stages of development. This group includes:
• Young-Ae Chu, Guiliano Gargioni, and Elisabetta Minelli, Stop TB Partnership
• Ellen Mitchell, Netty Kamp, Friederike Römer, and Dolar Vasani, Royal Netherlands
Tuberculosis Foundation
• Wanda Walton, United States Centers for Disease Control and Prevention, Division of TB
Elimination
• Ogechi Onuoha, Journalists Against AIDS Nigeria
• Alka Dev, Consultant
• Mao Tan Eang, Ministry of Health, Cambodia
• Elena McEwan, Catholic Relief Services
• Hara Mihalea and Svitlana Okromeshko, PATH
For more information
Please contact Svitlana Okromeshko
PATH
iv
TABLE OF CONTENTS
ACKNOWLEDGMENTS ............................................................................................................. iii
ACRONYMS AND ABBREVIATIONS ......................................................................................... v
INTRODUCTION ....................................................................................................................... 1
Objectives .............................................................................................................................. 1
Intended Audience ................................................................................................................. 2
Content and Organization ...................................................................................................... 2
PART I: Overview of Monitoring and Evaluation of Advocacy, Communication, and Social Mobilization ................................................................................................................................ 4
Role of ACSM ........................................................................................................................ 4
The Three Elements of ACSM ............................................................................................... 5
Monitoring and Evaluation for ACSM ..................................................................................... 9
Using an M&E Plan to Tell a Story of Success ......................................................................10
ACSM Goals, Objectives, and Activities ................................................................................11
Other Key M&E Terms ..........................................................................................................13
PART 2: Routine Monitoring of Advocacy, Communication, and Social Mobilization .................16
M&E Frameworks..................................................................................................................16
Indicators ..............................................................................................................................17
Selecting Indicators ...............................................................................................................21
Indicator Descriptions ............................................................................................................22
Data Collection ......................................................................................................................24
Data Quality ..........................................................................................................................25
Data Use and Reporting ........................................................................................................28
PART 3: Evaluation of Advocacy, Communication, and Social Mobilization ..............................31
Categories of Evaluation .......................................................................................................31
When Should ACSM Activities Be Evaluated? ......................................................................35
Introduction to Evaluation Methods .......................................................................................36
Quantitative Evaluation Methods ...........................................................................................37
Qualitative Evaluation Methods .............................................................................................44
Selecting the Right Evaluation Method ..................................................................................47
Choosing Evaluation Methods ...............................................................................................48
Putting Monitoring and Evaluation Together ..........................................................................51
PART 4: Practical Considerations in Monitoring and Evaluation ................................................53
M&E Budgets ........................................................................................................................53
Real-World Challenges of M&E .............................................................................................54
Taking M&E to the Next Level ...............................................................................................55
CONCLUSION ..........................................................................................................................59
APPENDIX 1: Monitoring and Evaluation Plan Outline ..............................................................62
APPENDIX 2: Guide to Effective Focus Group Discussions ......................................................65
APPENDIX 3: Additional Resources .........................................................................................69
v
ACRONYMS AND ABBREVIATIONS
ACSM advocacy, communication, and social mobilization
AIDS Acquired Immunodeficiency Syndrome
CBO community-based organization
CHW community health worker
DOTS global strategy for tuberculosis control
Global Fund Global Fund to Fight AIDS, Tuberculosis and Malaria
HIV human immunodeficiency virus
IEC information, education, and communication
IPCC interpersonal communication and counseling
KAP knowledge, attitudes, and practices
M&E monitoring and evaluation
MDR-TB multidrug-resistant tuberculosis
MOH Ministry of Health
NGO nongovernmental organization
NTP National Tuberculosis Program
PATH Program for Appropriate Technology in Health
PLWHA people living with HIV/AIDS
SMART Specific, Measureable, Attainable, Relevant, Time-bound
TB tuberculosis
TB/HIV tuberculosis and HIV co-infection
USAID United States Agency for International Development
WHO World Health Organization
1
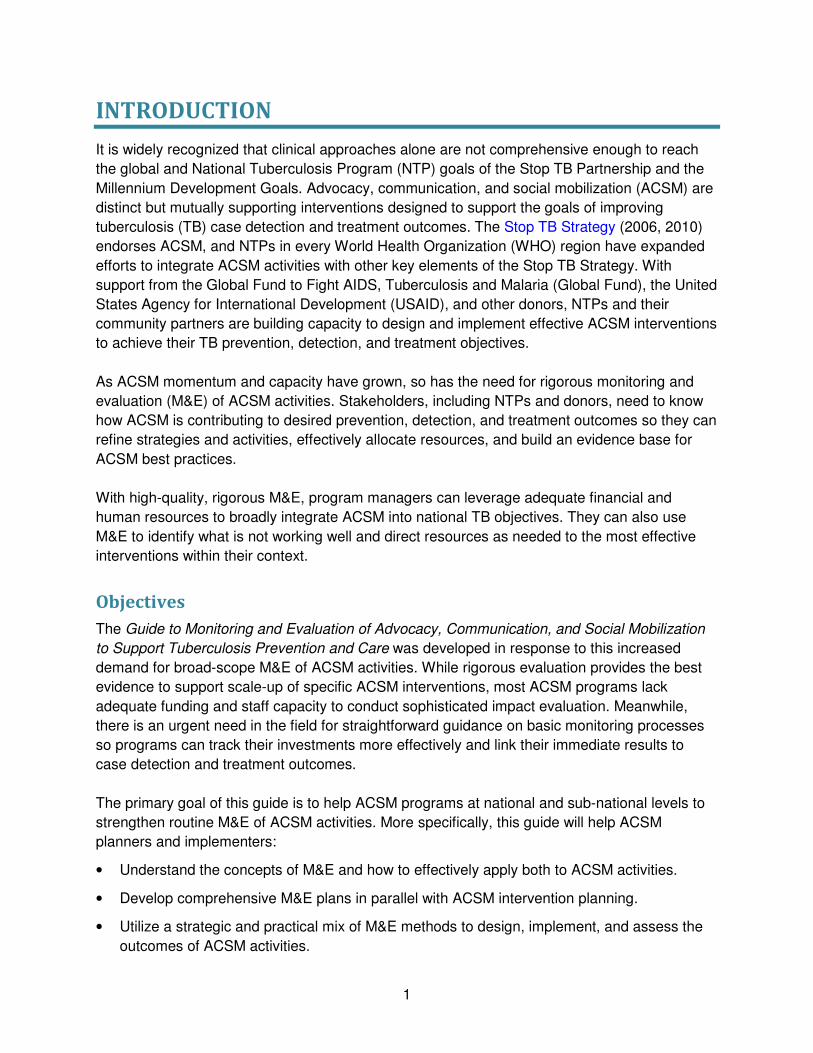
INTRODUCTION
It is widely recognized that clinical approaches alone are not comprehensive enough to reach
the global and National Tuberculosis Program (NTP) goals of the Stop TB Partnership and the
Millennium Development Goals. Advocacy, communication, and social mobilization (ACSM) are
distinct but mutually supporting interventions designed to support the goals of improving
tuberculosis (TB) case detection and treatment outcomes. The Stop TB Strategy (2006, 2010)
endorses ACSM, and NTPs in every World Health Organization (WHO) region have expanded
efforts to integrate ACSM activities with other key elements of the Stop TB Strategy. With
support from the Global Fund to Fight AIDS, Tuberculosis and Malaria (Global Fund), the United
States Agency for International Development (USAID), and other donors, NTPs and their
community partners are building capacity to design and implement effective ACSM interventions
to achieve their TB prevention, detection, and treatment objectives.
As ACSM momentum and capacity have grown, so has the need for rigorous monitoring and
evaluation (M&E) of ACSM activities. Stakeholders, including NTPs and donors, need to know
how ACSM is contributing to desired prevention, detection, and treatment outcomes so they can
refine strategies and activities, effectively allocate resources, and build an evidence base for
ACSM best practices.
With high-quality, rigorous M&E, program managers can leverage adequate financial and
human resources to broadly integrate ACSM into national TB objectives. They can also use
M&E to identify what is not working well and direct resources as needed to the most effective
interventions within their context.
Objectives
The Guide to Monitoring and Evaluation of Advocacy, Communication, and Social Mobilization
to Support Tuberculosis Prevention and Care was developed in response to this increased
demand for broad-scope M&E of ACSM activities. While rigorous evaluation provides the best
evidence to support scale-up of specific ACSM interventions, most ACSM programs lack
adequate funding and staff capacity to conduct sophisticated impact evaluation. Meanwhile,
there is an urgent need in the field for straightforward guidance on basic monitoring processes
so programs can track their investments more effectively and link their immediate results to
case detection and treatment outcomes.
The primary goal of this guide is to help ACSM programs at national and sub-national levels to
strengthen routine M&E of ACSM activities. More specifically, this guide will help ACSM
planners and implementers:
• Understand the concepts of M&E and how to effectively apply both to ACSM activities.
• Develop comprehensive M&E plans in parallel with ACSM intervention planning.
• Utilize a strategic and practical mix of M&E methods to design, implement, and assess the
outcomes of ACSM activities.
2
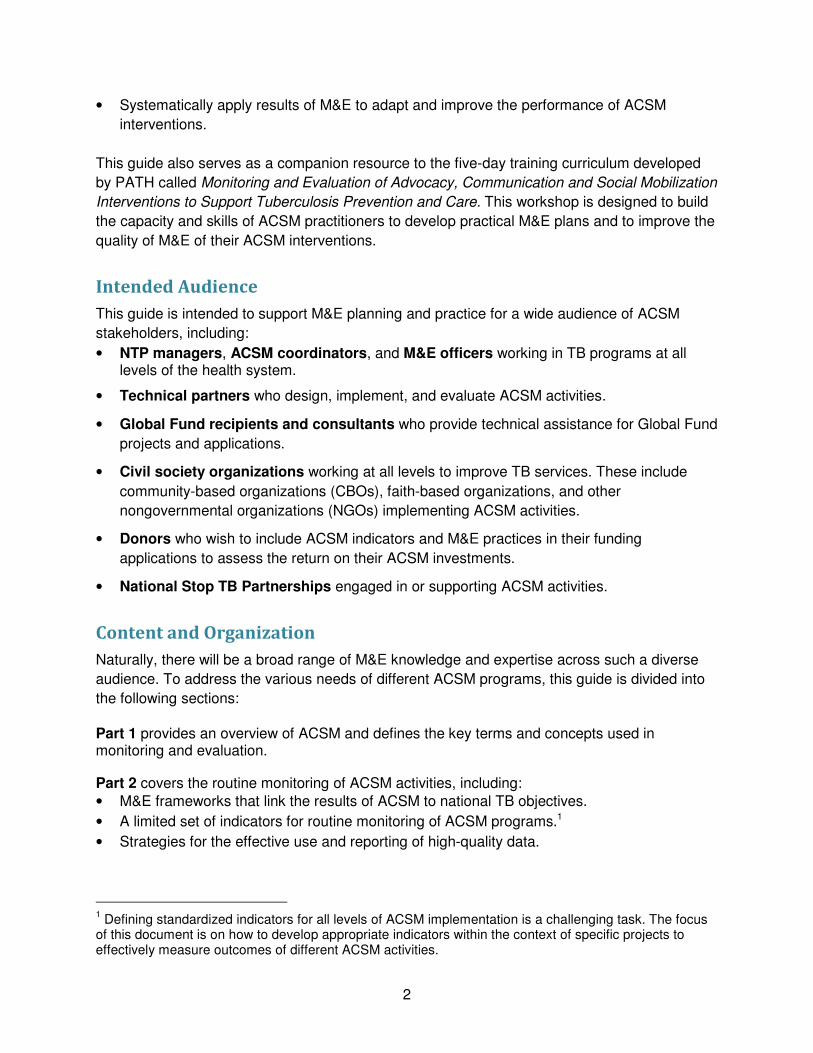
• Systematically apply results of M&E to adapt and improve the performance of ACSM
interventions.
This guide also serves as a companion resource to the five-day training curriculum developed
by PATH called Monitoring and Evaluation of Advocacy, Communication and Social Mobilization
Interventions to Support Tuberculosis Prevention and Care. This workshop is designed to build
the capacity and skills of ACSM practitioners to develop practical M&E plans and to improve the
quality of M&E of their ACSM interventions.
Intended Audience
This guide is intended to support M&E planning and practice for a wide audience of ACSM
stakeholders, including:
• NTP managers, ACSM coordinators, and M&E officers working in TB programs at all levels of the health system.
• Technical partners who design, implement, and evaluate ACSM activities.
• Global Fund recipients and consultants who provide technical assistance for Global Fund
projects and applications.
• Civil society organizations working at all levels to improve TB services. These include
community-based organizations (CBOs), faith-based organizations, and other
nongovernmental organizations (NGOs) implementing ACSM activities.
• Donors who wish to include ACSM indicators and M&E practices in their funding
applications to assess the return on their ACSM investments.
• National Stop TB Partnerships engaged in or supporting ACSM activities.
Content and Organization
Naturally, there will be a broad range of M&E knowledge and expertise across such a diverse
audience. To address the various needs of different ACSM programs, this guide is divided into
the following sections:
Part 1 provides an overview of ACSM and defines the key terms and concepts used in monitoring and evaluation.
Part 2 covers the routine monitoring of ACSM activities, including:
• M&E frameworks that link the results of ACSM to national TB objectives.
• A limited set of indicators for routine monitoring of ACSM programs.1
• Strategies for the effective use and reporting of high-quality data.
1 Defining standardized indicators for all levels of ACSM implementation is a challenging task. The focus
of this document is on how to develop appropriate indicators within the context of specific projects to effectively measure outcomes of different ACSM activities.
3
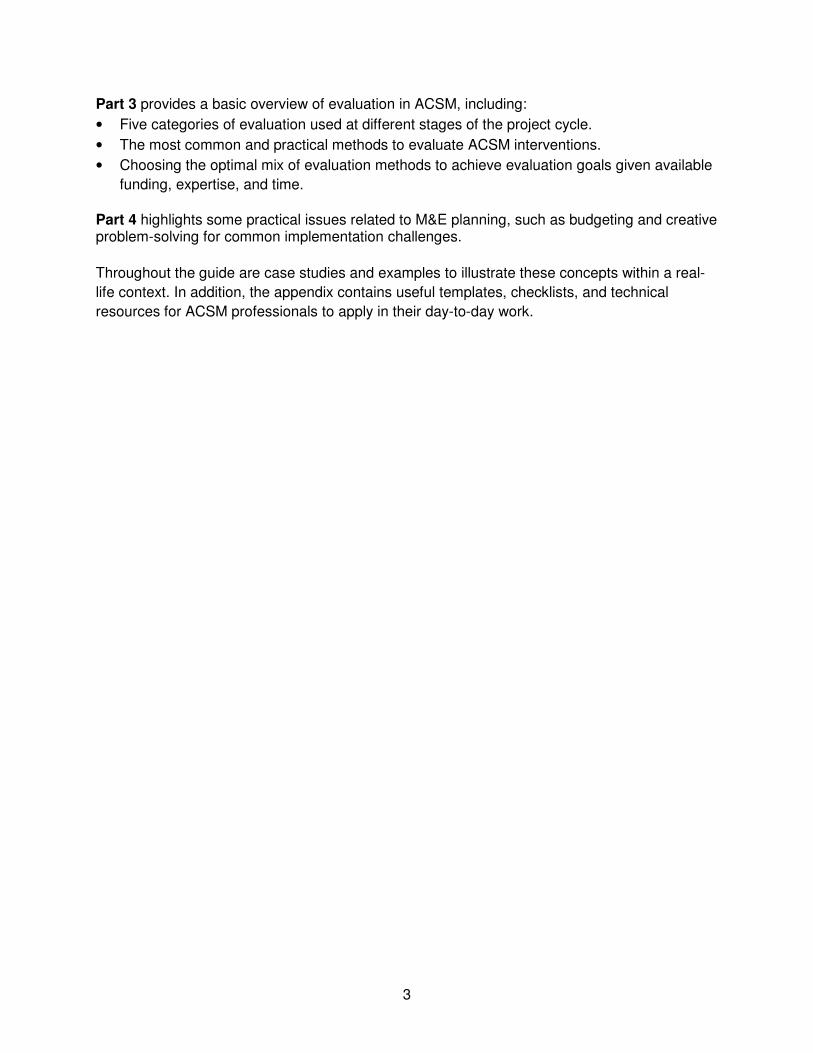
Part 3 provides a basic overview of evaluation in ACSM, including:
• Five categories of evaluation used at different stages of the project cycle.
• The most common and practical methods to evaluate ACSM interventions.
• Choosing the optimal mix of evaluation methods to achieve evaluation goals given available
funding, expertise, and time.
Part 4 highlights some practical issues related to M&E planning, such as budgeting and creative problem-solving for common implementation challenges.
Throughout the guide are case studies and examples to illustrate these concepts within a real-
life context. In addition, the appendix contains useful templates, checklists, and technical
resources for ACSM professionals to apply in their day-to-day work.
4
PART I: Overview of Monitoring and Evaluation of
Advocacy, Communication, and Social Mobilization
Role of ACSM
NTPs and donors across the globe have acknowledged the essential role that advocacy, communication, and social mobilization play in TB prevention, case detection, and treatment. ACSM promotes an inclusive approach to TB response based on partnerships and patient-centered, DOTS-based diagnosis and treatment services rather than a single clinical, facility-based approach implemented only by a government TB program.
ACSM adds synergy to traditional technical and clinical TB services by addressing the many
social, economic, legal, and political barriers that challenge desired TB outcomes. Often these
barriers include poor levels of knowledge, accurate information, funding, staff, and technical
equipment. They can also include restrictive policies, stigmatizing attitudes, and limited
involvement of private health care providers and community members in TB. By utilizing ACSM
effectively, NTPs and their partners can leverage sufficient resources, educate individuals and
communities, promote innovative health care options, and
engage affected communities to battle stigma and correct
misconceptions about TB.
To help increase case detection, ACSM methods can be used to:
• Increase public knowledge of TB symptoms.
• Increase awareness of TB services and how to access
them.
• Leverage funds for new laboratory equipment and
additional staff.
• Recruit private providers to refer patients for DOTS
screening.
• Combat stigma.
• Involve community volunteers to refer people with TB symptoms for diagnosis, deliver
sputum specimens to health care facilities, and collect results.
To ensure successful treatment outcomes, ACSM interventions can:
• Improve patient knowledge of adherence.
• Recruit community volunteers to be treatment supporters.
• Improve the quality of client-provider communication.
• Promote a new policy to restrict the sales of TB drugs in pharmacies.
• Secure funds for patient support incentives.
ACSM is a crosscutting
approach to supporting
the six elements of the
Stop TB Strategy. It
adds synergy to
traditional technical and
clinical TB control
efforts by addressing
the many social,
economic, legal, and
political barriers that
challenge TB
outcomes.
5
The Three Elements of ACSM
ADVOCACY is a broad set of coordinated efforts designed to (1) place TB higher on the political agenda; (2) strengthen government commitment to implement or improve TB-related policies; and (3) increase and sustain financial and other resources for TB.
In general, advocacy targets decision-makers and people with influence, such as national and
local politicians, government ministers, and department managers. Three types of advocacy are
often used to bolster political commitment, leverage resources, and positively change policies or
administrative guidelines:
• Policy advocacy lobbies national or local political leaders to increase funding for TB
programs and institute policy changes to support the implementation environment.
• Program advocacy reaches out to decision-makers and community partners to boost their
participation in local actions and program decisions to support TB services.
• Media advocacy puts TB issues on the public agenda. It prompts the media to cover TB-
related topics regularly and responsibly to raise awareness of TB problems and solutions.
The techniques of advocacy include lobbying, partnership meetings, parliamentary debates,
political events, petitions, and letter/email campaigns.
COMMUNICATION aims to improve knowledge about TB and TB services and change
attitudes and practices to encourage people to seek care and complete TB treatment.
Communication generally falls into three categories:
• Mass media such as radio or television advertising campaigns, Internet websites, and
special events that reach a general audience or a large target group. Behavior change
communication campaigns often fall into this category but can target smaller audiences as
well.
• Small media, which uses more targeted channels, like brochures, posters, mobile phones,
photography, video, interactive theater, and testimonials to reach specific groups. These are
often referred to as information, education, and communication (IEC) approaches.
• Interpersonal communication, which includes counseling, one-on-one education sessions,
skills trainings, and presentations often targeted toward health workers and direct
supporters of TB patients and families.
SOCIAL MOBILIZATION is the process of building alliances and engaging participation of
stakeholders to increase visibility and urgency of an issue. These stakeholders can be
from all levels of society, such as policy- and decision-makers, professional and religious
groups, the media, the private sector, TB patients and their families, and community members.
Involving the community in planning, implementing, and evaluating services can improve the
quality and effectiveness of TB programs. Social mobilization is ultimately successful when
more people and organizations have interest in TB or become involved in TB activities.
6
Social mobilization:
•••• Aims to increase awareness about TB disease and demand for diagnosis and treatment
services.
•••• Expands service delivery through community-based approaches.
•••• Enhances sustainability, accountability, and community ownership of TB services.
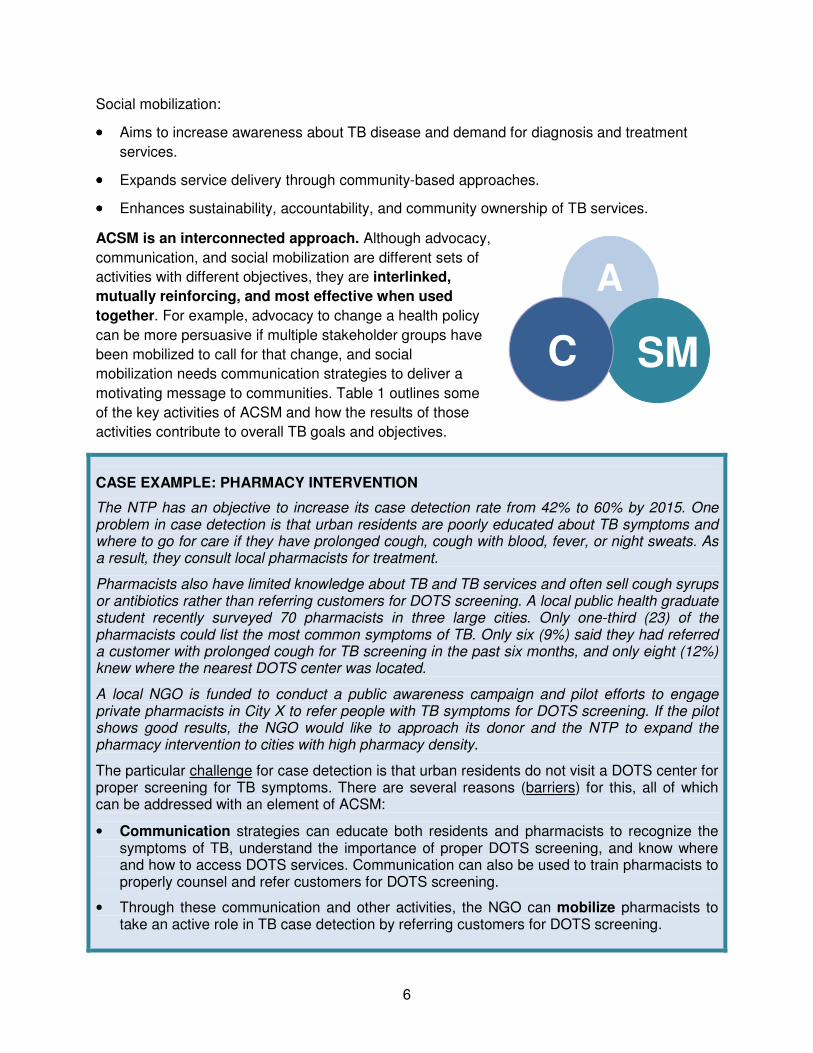
ACSM is an interconnected approach. Although advocacy,
communication, and social mobilization are different sets of
activities with different objectives, they are interlinked,
mutually reinforcing, and most effective when used
together. For example, advocacy to change a health policy
can be more persuasive if multiple stakeholder groups have
been mobilized to call for that change, and social
mobilization needs communication strategies to deliver a
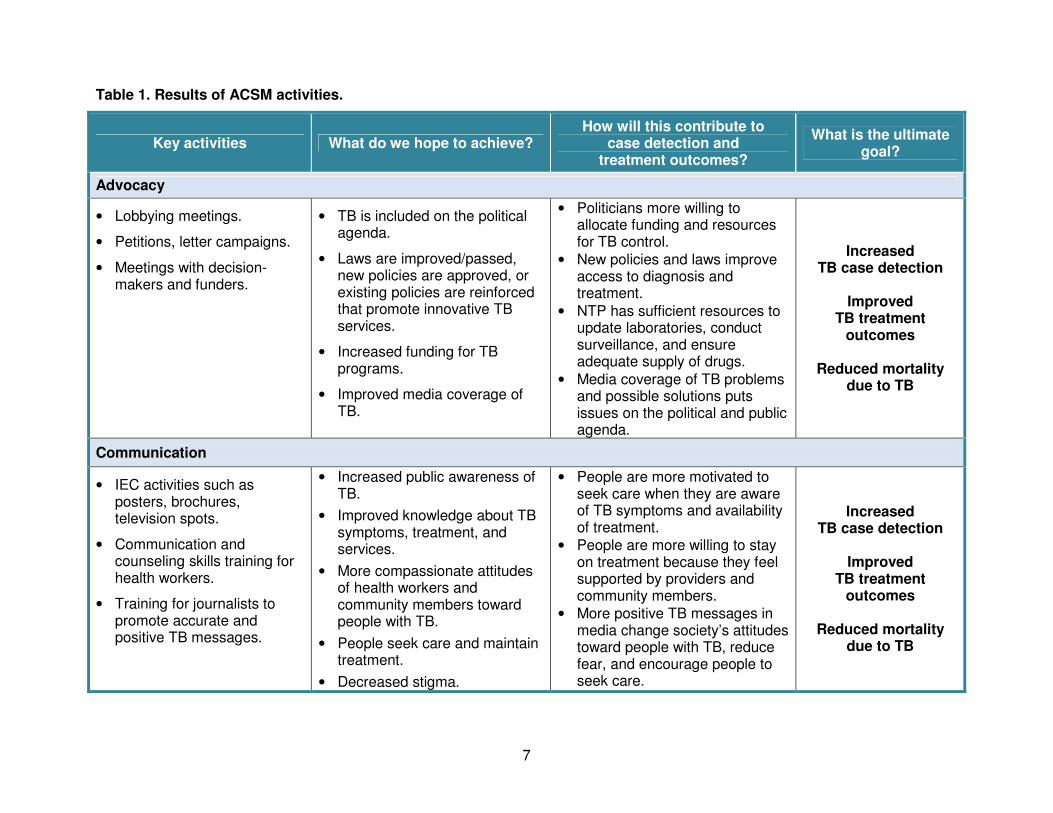
motivating message to communities. Table 1 outlines some
of the key activities of ACSM and how the results of those
activities contribute to overall TB goals and objectives.
CASE EXAMPLE: PHARMACY INTERVENTION
The NTP has an objective to increase its case detection rate from 42% to 60% by 2015. One problem in case detection is that urban residents are poorly educated about TB symptoms and where to go for care if they have prolonged cough, cough with blood, fever, or night sweats. As a result, they consult local pharmacists for treatment.
Pharmacists also have limited knowledge about TB and TB services and often sell cough syrups or antibiotics rather than referring customers for DOTS screening. A local public health graduate student recently surveyed 70 pharmacists in three large cities. Only one-third (23) of the pharmacists could list the most common symptoms of TB. Only six (9%) said they had referred a customer with prolonged cough for TB screening in the past six months, and only eight (12%) knew where the nearest DOTS center was located.
A local NGO is funded to conduct a public awareness campaign and pilot efforts to engage private pharmacists in City X to refer people with TB symptoms for DOTS screening. If the pilot shows good results, the NGO would like to approach its donor and the NTP to expand the pharmacy intervention to cities with high pharmacy density.
The particular challenge for case detection is that urban residents do not visit a DOTS center for proper screening for TB symptoms. There are several reasons (barriers) for this, all of which can be addressed with an element of ACSM:
• Communication strategies can educate both residents and pharmacists to recognize the symptoms of TB, understand the importance of proper DOTS screening, and know where and how to access DOTS services. Communication can also be used to train pharmacists to properly counsel and refer customers for DOTS screening.
• Through these communication and other activities, the NGO can mobilize pharmacists to take an active role in TB case detection by referring customers for DOTS screening.
A
SMC
7
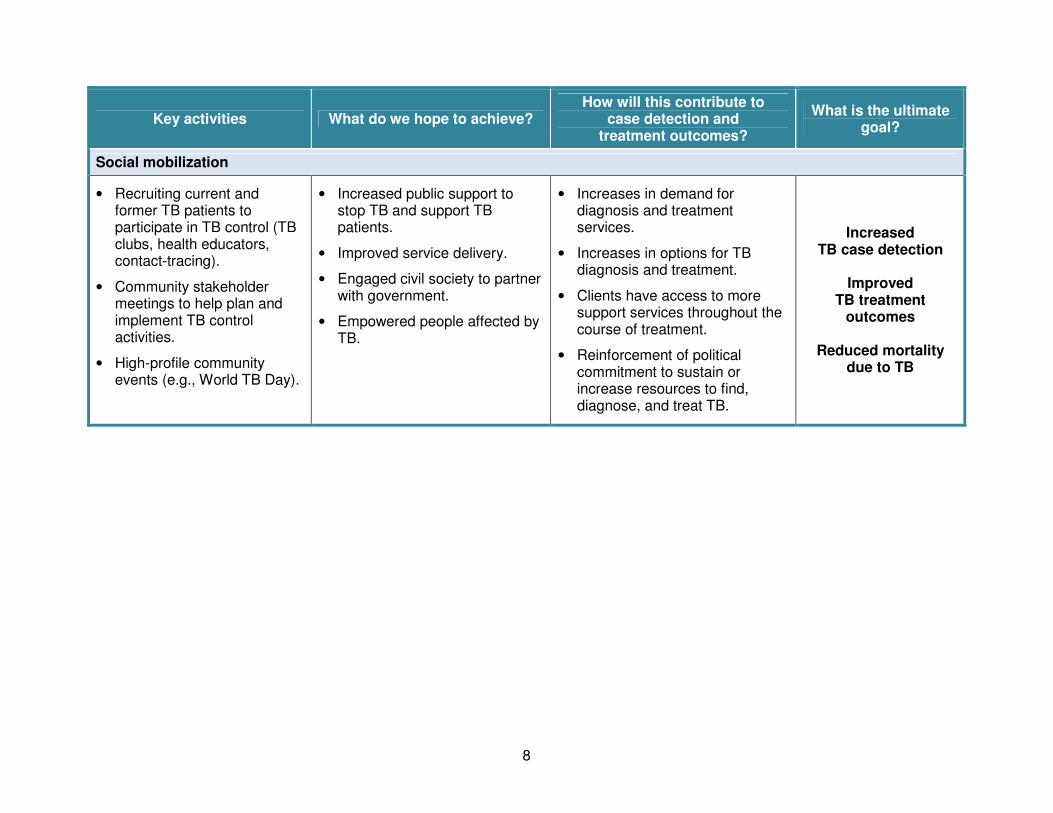
Table 1. Results of ACSM activities.
Key activities What do we hope to achieve? How will this contribute to
case detection and treatment outcomes?
What is the ultimate goal?
Advocacy
• Lobbying meetings.
• Petitions, letter campaigns.
• Meetings with decision-makers and funders.
• TB is included on the political agenda.
• Laws are improved/passed, new policies are approved, or existing policies are reinforced that promote innovative TB services.
• Increased funding for TB programs.
• Improved media coverage of TB.
• Politicians more willing to allocate funding and resources for TB control.
• New policies and laws improve access to diagnosis and treatment.
• NTP has sufficient resources to update laboratories, conduct surveillance, and ensure adequate supply of drugs.
• Media coverage of TB problems and possible solutions puts issues on the political and public agenda.
Increased TB case detection
Improved
TB treatment outcomes
Reduced mortality
due to TB
Communication
• IEC activities such as posters, brochures, television spots.
• Communication and counseling skills training for health workers.
• Training for journalists to promote accurate and positive TB messages.
• Increased public awareness of TB.
• Improved knowledge about TB symptoms, treatment, and services.
• More compassionate attitudes of health workers and community members toward people with TB.
• People seek care and maintain treatment.
• Decreased stigma.
• People are more motivated to seek care when they are aware of TB symptoms and availability of treatment.
• People are more willing to stay on treatment because they feel supported by providers and community members.
• More positive TB messages in media change society’s attitudes toward people with TB, reduce fear, and encourage people to seek care.
Increased TB case detection
Improved
TB treatment outcomes
Reduced mortality
due to TB
8
Key activities What do we hope to achieve? How will this contribute to
case detection and treatment outcomes?
What is the ultimate goal?
Social mobilization
• Recruiting current and former TB patients to participate in TB control (TB clubs, health educators, contact-tracing).
• Community stakeholder meetings to help plan and implement TB control activities.
• High-profile community events (e.g., World TB Day).
• Increased public support to stop TB and support TB patients.
• Improved service delivery.
• Engaged civil society to partner with government.
• Empowered people affected by TB.
• Increases in demand for diagnosis and treatment services.
• Increases in options for TB diagnosis and treatment.
• Clients have access to more support services throughout the course of treatment.
• Reinforcement of political commitment to sustain or increase resources to find, diagnose, and treat TB.
Increased TB case detection
Improved
TB treatment outcomes
Reduced mortality
due to TB
9
Monitoring and Evaluation for ACSM
Monitoring and evaluation are used to design interventions, measure progress toward short-
and long-term targets, and assess overall performance. The goal of M&E is to generate the data
and lessons learned that program managers need to conduct strategic planning; promptly
identify problems; appropriately allocate resources; and improve program quality, efficiency, and
effectiveness.
Key stakeholders such as NTPs, donors, and service providers often require different types of
data and evidence of how ACSM activities contribute to particular TB program objectives.
Programs ideally coordinate and streamline their internal M&E efforts to meet these competing
demands without duplicating data collection or conducting wasteful or repetitive analysis.
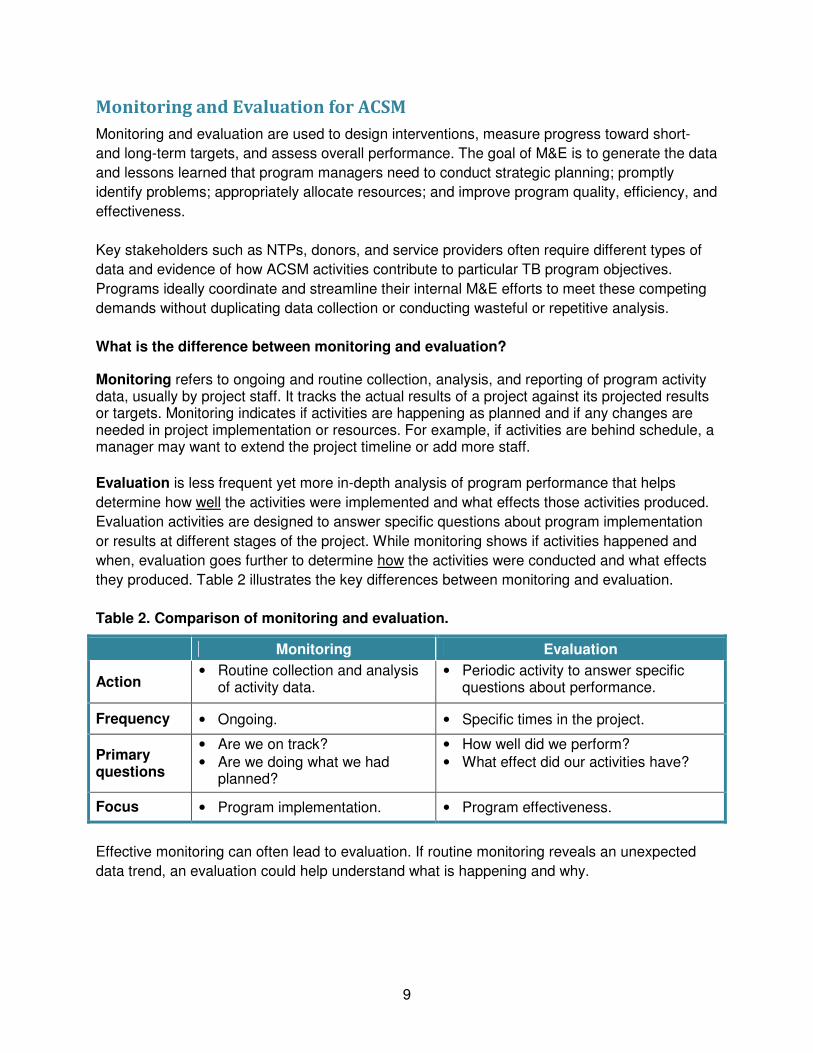
What is the difference between monitoring and evaluation?
Monitoring refers to ongoing and routine collection, analysis, and reporting of program activity data, usually by project staff. It tracks the actual results of a project against its projected results or targets. Monitoring indicates if activities are happening as planned and if any changes are needed in project implementation or resources. For example, if activities are behind schedule, a manager may want to extend the project timeline or add more staff.
Evaluation is less frequent yet more in-depth analysis of program performance that helps
determine how well the activities were implemented and what effects those activities produced.
Evaluation activities are designed to answer specific questions about program implementation
or results at different stages of the project. While monitoring shows if activities happened and
when, evaluation goes further to determine how the activities were conducted and what effects
they produced. Table 2 illustrates the key differences between monitoring and evaluation.
Table 2. Comparison of monitoring and evaluation.
Monitoring Evaluation
Action • Routine collection and analysis
of activity data. • Periodic activity to answer specific
questions about performance.
Frequency • Ongoing. • Specific times in the project.
Primary questions
• Are we on track?
• Are we doing what we had planned?
• How well did we perform?
• What effect did our activities have?
Focus • Program implementation. • Program effectiveness.
Effective monitoring can often lead to evaluation. If routine monitoring reveals an unexpected
data trend, an evaluation could help understand what is happening and why.

10
Using an M&E Plan to Tell a Story of Success
All programs have a “story” they want to tell others about their accomplishments and the
importance of their work. Monitoring and evaluation help collect the important details of that
story and document the evidence of program successes. Creating and using an M&E plan
helps ACSM programs identify the story they want to tell and what information they need to tell
that story.
An M&E plan is a “master strategy” for how programs plan to monitor and evaluate their
activities. A comprehensive M&E plan includes an M&E framework, indicators, guidance on how
to collect and analyze the indicators, a data quality assurance plan, a data use and reporting
summary, an evaluation summary, and a budget (Figure 1).
Figure 1. M&E plan components.
Each of these components contributes a different piece of a program’s ACSM story:
• Framework: illustration of the story.
• Indicators: the best evidence for the story.
• Data collection: ways the evidence will be gathered.
• Data quality: accuracy and credibility of the story.
• Data use and reporting: who should hear the story and when.
• Evaluation strategy: in-depth description of what worked well
and why.
• Budget: cost to develop and tell the story.
M&E Plan
Framework
Indicators
Data Collection
Data Quality Data Use
and Reporting
Evaluation Strategy
Budget
Do not wait until your
activities are planned
and underway to
decide on an M&E
strategy!
11
Although an M&E plan is often included as an appendix to an ACSM work plan, both plans
should be developed at the same time so the plans relate to each other throughout the course
of the project. Identifying M&E needs from the beginning helps program managers anticipate
what resources will be needed to support M&E. There is no standard template for a typical M&E
plan, but a sample M&E plan outline is provided in Appendix 1.
The remainder of this guide describes the process of developing a complete M&E plan:
1. Develop clear, SMART (Specific, Measurable, Attainable, Relevant, Time-bound) program
objectives.
2. Create an M&E framework.
3. Define and select relevant indicators.
4. Identify sources and methods of data collection with a data quality strategy.
5. Select evaluation methods.
6. Develop a detailed budget.
7. Plan how data will be used and disseminated.
ACSM Goals, Objectives, and Activities
NTPs regularly develop strategic plans that prioritize and outline their most important objectives
and targets in TB prevention, detection, and treatment for a given period of time. ACSM
interventions should always directly link to these broader NTP objectives in order to synergize
TB efforts and optimally channel resources. Linking ACSM interventions to key NTP outcomes
also ensures that managers recognize the contribution of ACSM to key achievements. The
terms “goal,” “objective,” and “activity” are closely related in the planning, monitoring, and
evaluation of ACSM interventions.
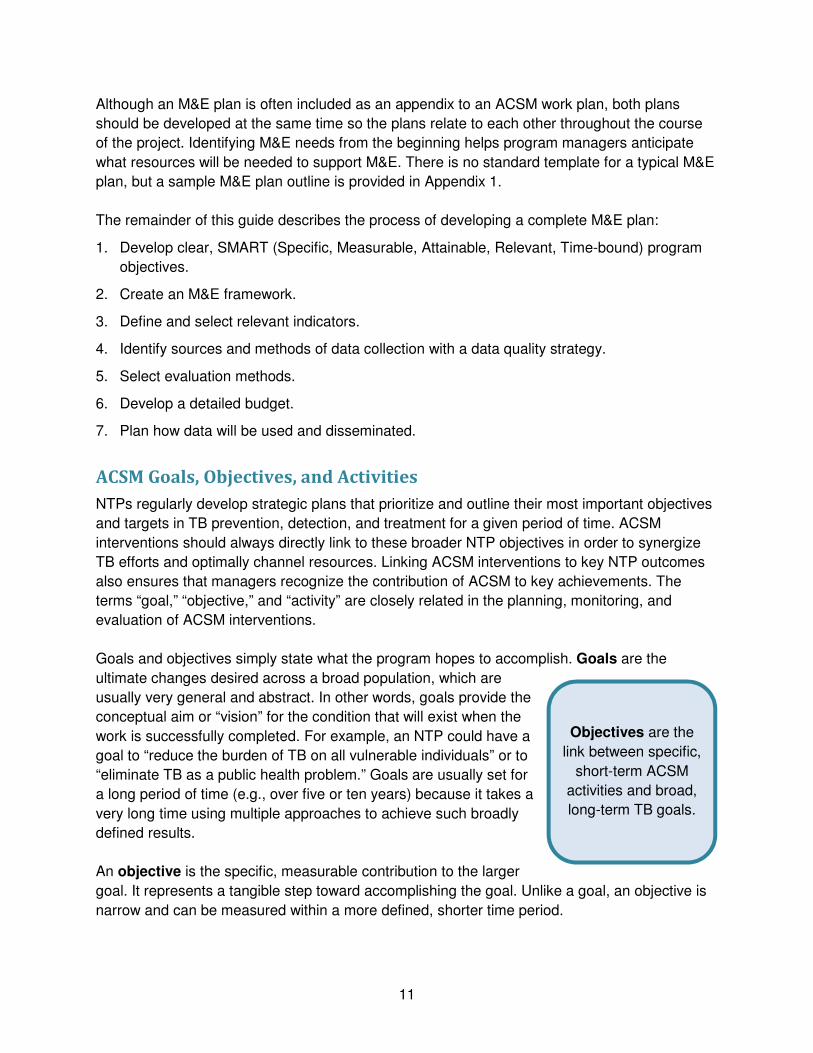
Goals and objectives simply state what the program hopes to accomplish. Goals are the
ultimate changes desired across a broad population, which are
usually very general and abstract. In other words, goals provide the
conceptual aim or “vision” for the condition that will exist when the
work is successfully completed. For example, an NTP could have a
goal to “reduce the burden of TB on all vulnerable individuals” or to
“eliminate TB as a public health problem.” Goals are usually set for
a long period of time (e.g., over five or ten years) because it takes a
very long time using multiple approaches to achieve such broadly
defined results.
An objective is the specific, measurable contribution to the larger
goal. It represents a tangible step toward accomplishing the goal. Unlike a goal, an objective is
narrow and can be measured within a more defined, shorter time period.
Objectives are the
link between specific,
short-term ACSM
activities and broad,
long-term TB goals.
12
Activities (often called processes) are the actual advocacy, communication, or social
mobilization tasks needed to complete the ACSM objective. These are the day-to-day work of
the program or organization. Examples of ACSM activities include trainings, partnership
meetings, home visits, outreach, drafting of petitions, and brochure development.
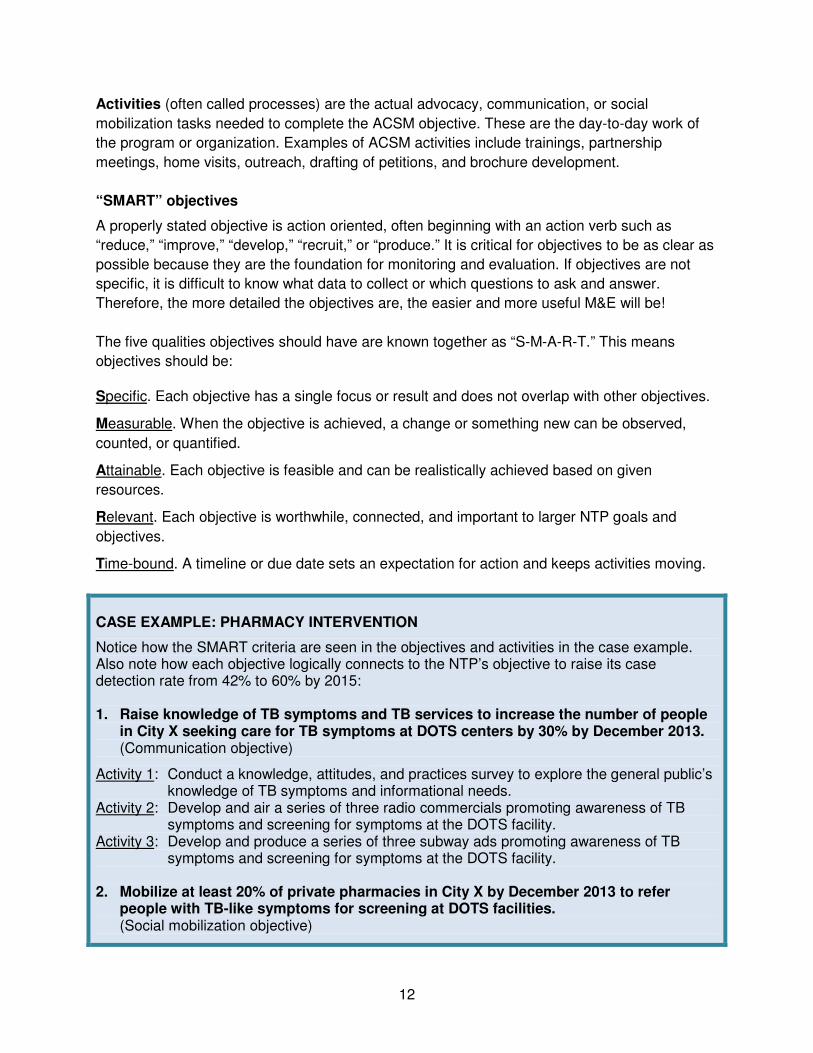
“SMART” objectives
A properly stated objective is action oriented, often beginning with an action verb such as
“reduce,” “improve,” “develop,” “recruit,” or “produce.” It is critical for objectives to be as clear as
possible because they are the foundation for monitoring and evaluation. If objectives are not
specific, it is difficult to know what data to collect or which questions to ask and answer.
Therefore, the more detailed the objectives are, the easier and more useful M&E will be!
The five qualities objectives should have are known together as “S-M-A-R-T.” This means
objectives should be:
Specific. Each objective has a single focus or result and does not overlap with other objectives.
Measurable. When the objective is achieved, a change or something new can be observed,
counted, or quantified.
Attainable. Each objective is feasible and can be realistically achieved based on given
resources.
Relevant. Each objective is worthwhile, connected, and important to larger NTP goals and
objectives.
Time-bound. A timeline or due date sets an expectation for action and keeps activities moving.
CASE EXAMPLE: PHARMACY INTERVENTION
Notice how the SMART criteria are seen in the objectives and activities in the case example. Also note how each objective logically connects to the NTP’s objective to raise its case detection rate from 42% to 60% by 2015: 1. Raise knowledge of TB symptoms and TB services to increase the number of people
in City X seeking care for TB symptoms at DOTS centers by 30% by December 2013. (Communication objective)
Activity 1: Conduct a knowledge, attitudes, and practices survey to explore the general public’s knowledge of TB symptoms and informational needs.
Activity 2: Develop and air a series of three radio commercials promoting awareness of TB symptoms and screening for symptoms at the DOTS facility.
Activity 3: Develop and produce a series of three subway ads promoting awareness of TB symptoms and screening for symptoms at the DOTS facility.
2. Mobilize at least 20% of private pharmacies in City X by December 2013 to refer
people with TB-like symptoms for screening at DOTS facilities. (Social mobilization objective)
13
Activity 1: Train 50 pharmacists to recognize common TB symptoms and counsel customers with TB symptoms to be screened at the local DOTS facility.
Activity 2: Conduct monthly visits to participating pharmacies to track referrals and provide technical support.
Activity 3: Conduct monthly visits to participating DOTS facilities to track people presumed to have TB who came with pharmacy referrals and to track TB case detection.
3. By June 2014, acquire funding to expand pharmacy intervention to ten cities.
(Advocacy objective)
Activity 1: Develop a brief proposal describing the results of the pharmacy pilot project, expansion targets, and expected budget. Distribute to donor and leaders at the NTP and Ministry of Health.
Activity 2: Conduct meetings with the NTP, Ministry of Health, and donor to review the report and approve funding for the pharmacy intervention.
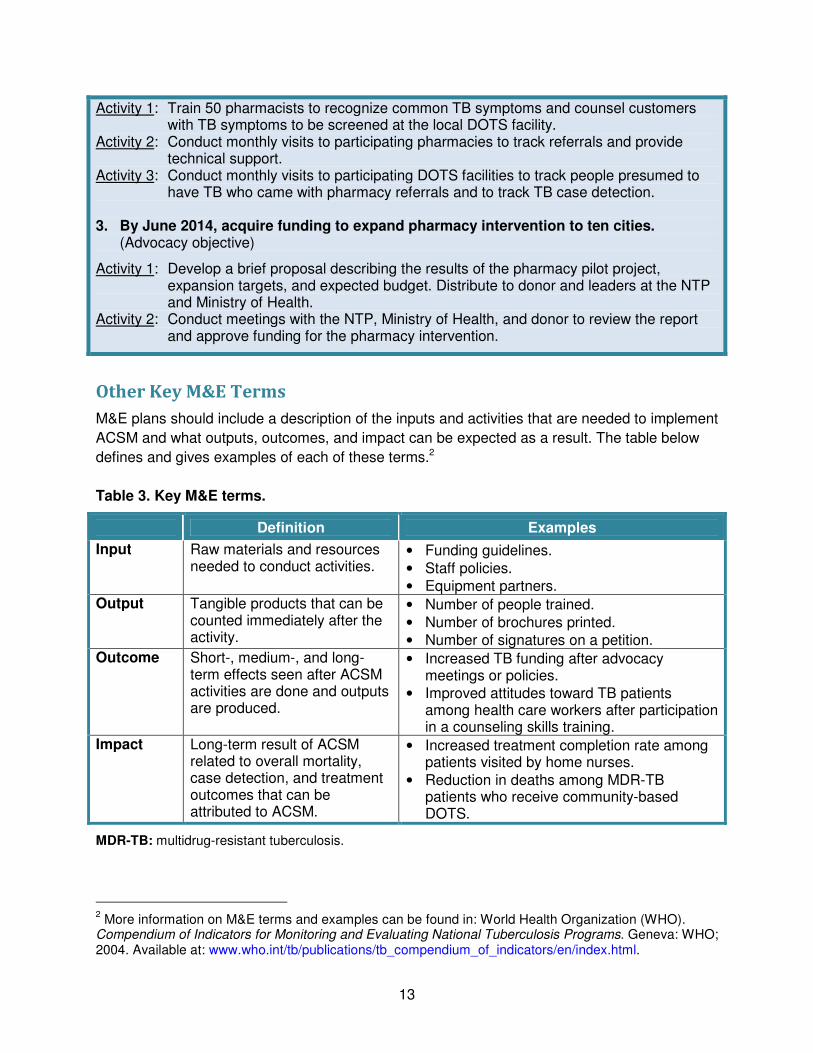
Other Key M&E Terms
M&E plans should include a description of the inputs and activities that are needed to implement
ACSM and what outputs, outcomes, and impact can be expected as a result. The table below
defines and gives examples of each of these terms.2
Table 3. Key M&E terms.
Definition Examples
Input Raw materials and resources needed to conduct activities.
• Funding guidelines.
• Staff policies.
• Equipment partners. Output Tangible products that can be
counted immediately after the activity.
• Number of people trained.
• Number of brochures printed.
• Number of signatures on a petition. Outcome Short-, medium-, and long-
term effects seen after ACSM activities are done and outputs are produced.
• Increased TB funding after advocacy meetings or policies.
• Improved attitudes toward TB patients among health care workers after participation in a counseling skills training.
Impact Long-term result of ACSM related to overall mortality, case detection, and treatment outcomes that can be attributed to ACSM.
• Increased treatment completion rate among patients visited by home nurses.
• Reduction in deaths among MDR-TB patients who receive community-based DOTS.
MDR-TB: multidrug-resistant tuberculosis.
2 More information on M&E terms and examples can be found in: World Health Organization (WHO).
Compendium of Indicators for Monitoring and Evaluating National Tuberculosis Programs. Geneva: WHO; 2004. Available at: www.who.int/tb/publications/tb_compendium_of_indicators/en/index.html.
14
Inputs are the resources needed to implement ACSM, and they can
vary based on the scale of the project and prior experience with
ACSM. For example, if ACSM is new to an NTP, the inputs may
simply be money and external technical expertise, which are then
used to create a strategy, training curricula, and other resources. If
the ACSM program is relatively mature, managers may already have
funding and staff, so the inputs would be the strategy, curricula, and
other existing resources.
Outputs are the tangible, immediate products of the planned work,
which are usually expressed as a number or amount. Measuring and
reporting outputs helps managers prove that the activities took place. For example, the output of
training is the number of people trained.
Outputs then lead to outcomes, which are the ripple effects of the activities and outputs. These
include changes in knowledge, attitudes, and behavior among the target population,
improvements in treatment success rate, or increased funding for TB. Measuring and reporting
outcomes helps managers know if the activities achieved their intended effects. The outcomes
used to indicate whether or not a particular advocacy, communication, or social mobilization
effort is successful can be quantitative or qualitative in nature (Figure 2).
Finally, these positive outcomes should lead to changes in the longer-term impact of programs,
usually related to larger goals such as reduced incidence of TB. Impact is measured on a
broader scale and requires sophisticated methods to determine how much change can be
attributed to ACSM. In most cases, ACSM projects are implemented concurrently with many
other interventions, each aiming to improve the same case detection and treatment outcomes.
Therefore, the impact of only ACSM can be difficult to isolate from the impact of other
interventions, such as improved clinical care or investments in laboratory capacity.
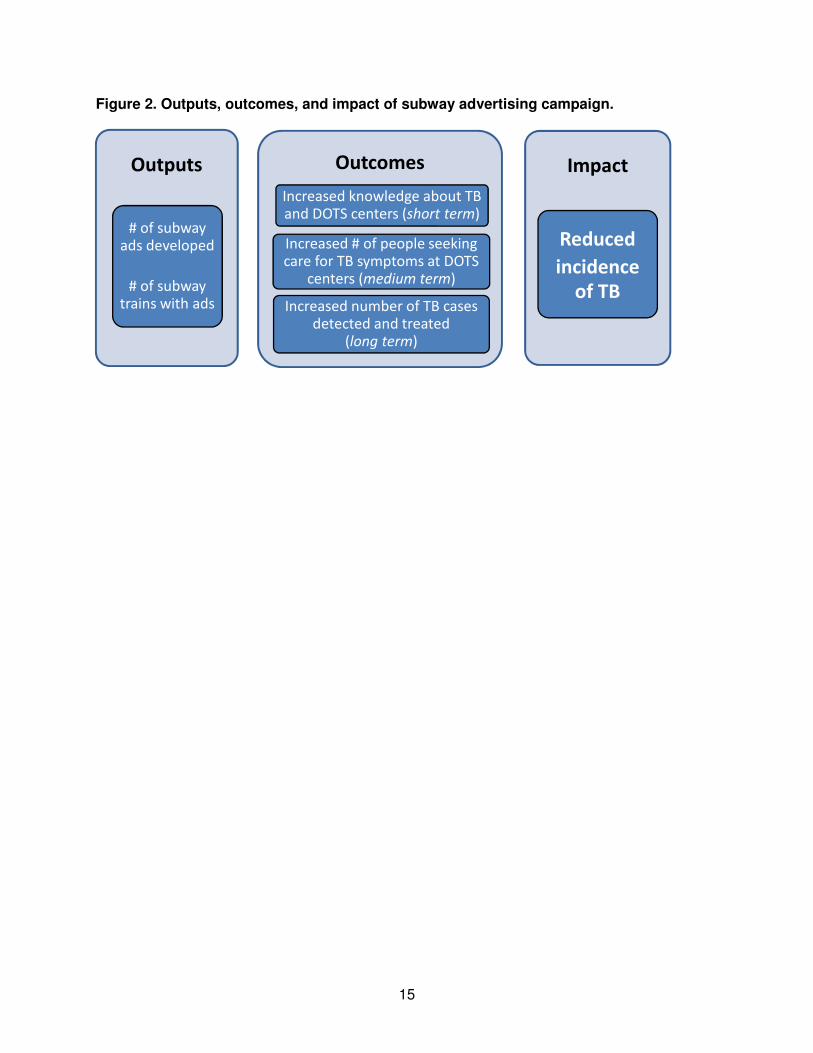
Figure 2 highlights the differences between outputs, outcomes, and impact for the pharmacy
intervention case example. The short- and medium-term outcomes can be directly linked to the
outputs. The long-term outcomes and impact may also be related to the activities, but they are
also influenced by factors such as the availability of TB diagnosis and treatment services,
among others.
Use monitoring to
measure inputs and
outputs.
Use evaluation to
measure outcomes
and impact.
15
Figure 2. Outputs, outcomes, and impact of subway advertising campaign.
Outputs
# of subway
ads developed
# of subway
trains with ads
Outcomes
Increased knowledge about TB
and DOTS centers (short term)
Increased # of people seeking
care for TB symptoms at DOTS
centers (medium term)
Increased number of TB cases
detected and treated
(long term)
Impact
Reduced
incidence
of TB
16
PART 2: Routine Monitoring of Advocacy,
Communication, and Social Mobilization
Most programs direct the bulk of their M&E resources toward collecting, analyzing, and reporting routine data on outputs and outcomes to monitor their performance. Building on the key terms and “basics” of M&E discussed in the previous section, Part 2 now focuses on conducting these monitoring tasks.
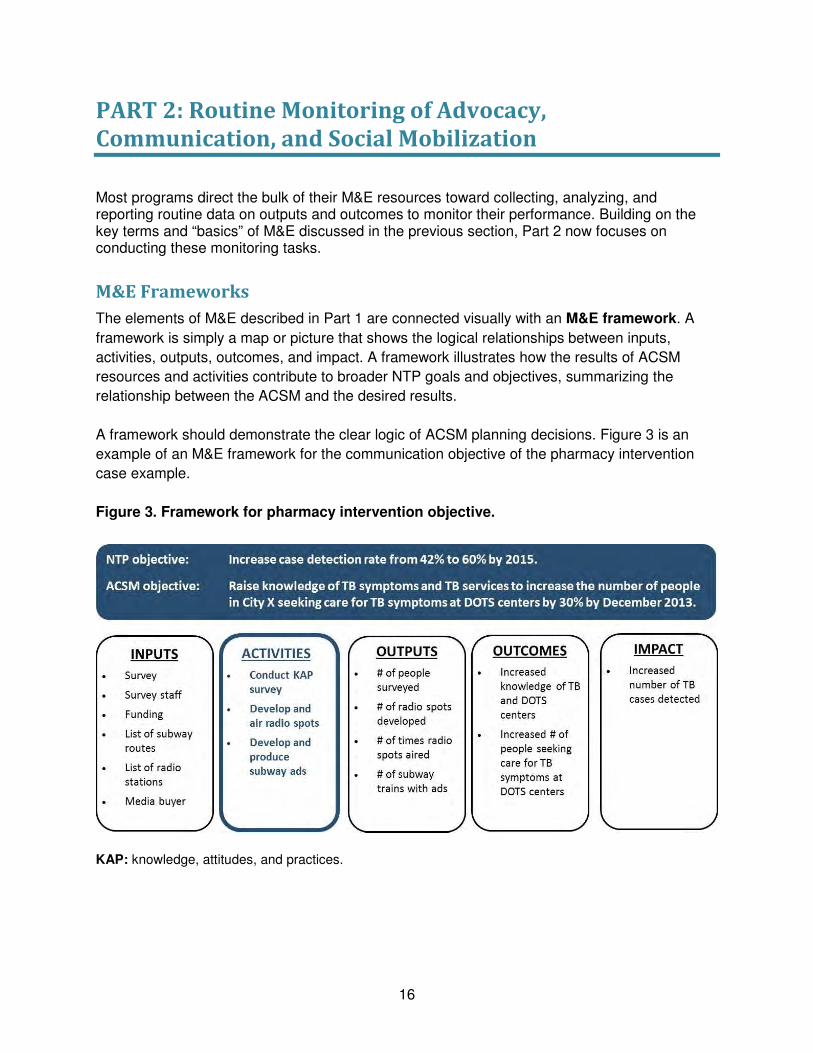
M&E Frameworks
The elements of M&E described in Part 1 are connected visually with an M&E framework. A
framework is simply a map or picture that shows the logical relationships between inputs,
activities, outputs, outcomes, and impact. A framework illustrates how the results of ACSM
resources and activities contribute to broader NTP goals and objectives, summarizing the
relationship between the ACSM and the desired results.
A framework should demonstrate the clear logic of ACSM planning decisions. Figure 3 is an
example of an M&E framework for the communication objective of the pharmacy intervention
case example.
Figure 3. Framework for pharmacy intervention objective.
KAP: knowledge, attitudes, and practices.
17
Indicators
After developing an M&E framework, the next step in M&E planning is to select indicators to
measure the inputs, activities, outputs, outcomes, and impact of the ACSM interventions.
Indicators are the signs or markers that “indicate” a particular result occurred. By using
indicators as a consistent unit of measurement, data become more uniform and easier to
compare over time. Thus, it is possible to identify trends.
For example, if “increased political commitment” were a desired outcome, what signs or
changes could be observed or measured that would reflect political commitment? Is political
commitment demonstrated by a government’s willingness to fund a program, by policies to
support activities, or by supportive statements from government officials? The political context at
the country or local level is important to determine the best indicator, and more than one
indicator may be necessary.
An output and its own indicator are often the same. For example, the output of a training activity
would be the number of individuals trained. The indicator to measure this output would also be
the number of individuals trained. To avoid this repetition, a program could define its training
output as “improved capacity to provide X service” and then the corresponding indicator as the
“number of individuals trained to provide X service.”
Although global, standardized indicators to measure ACSM results are not yet available, there is
general consensus on what ACSM is meant to achieve. Table 4 provides examples of basic
indicators that can be used to measure the overall results of different ACSM activities.
Table 4. Common outcome indicators in ACSM.
Expected result Possible indicator
Advocacy
TB included on the political agenda. Parliament declares TB a public health emergency.
Increased funding for TB program. Percentage increase in funding for TB.
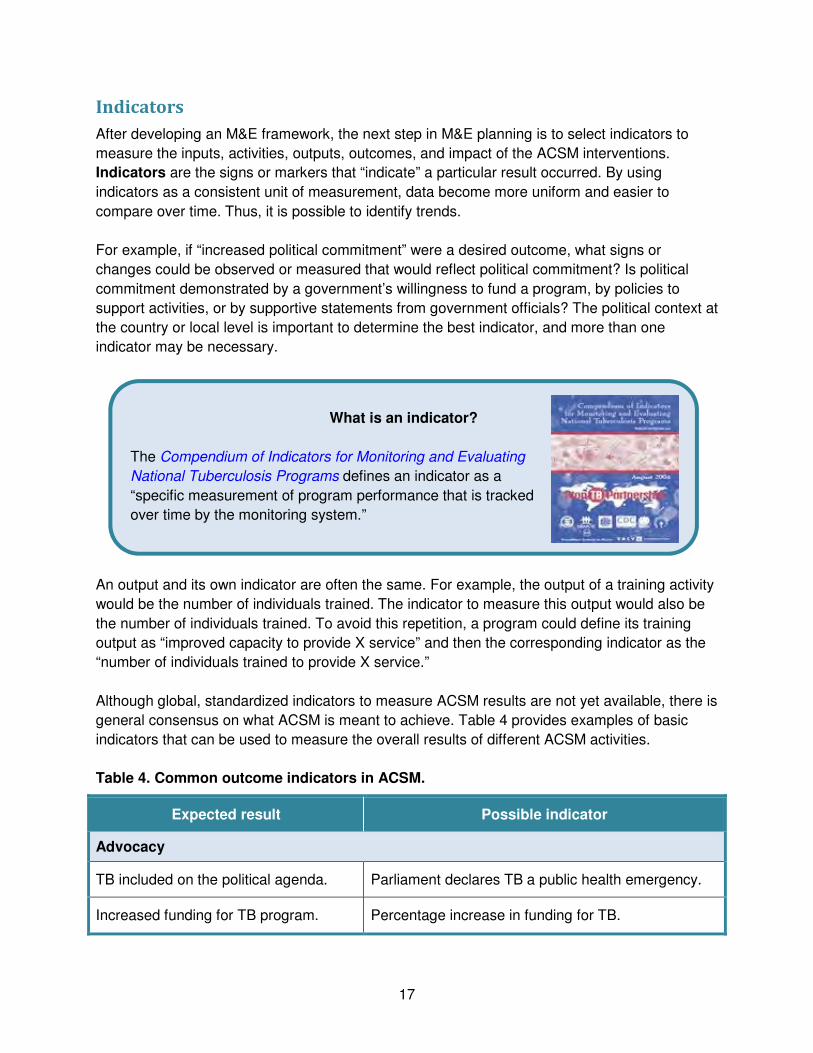
What is an indicator?
The Compendium of Indicators for Monitoring and Evaluating
National Tuberculosis Programs defines an indicator as a
“specific measurement of program performance that is tracked
over time by the monitoring system.”
18
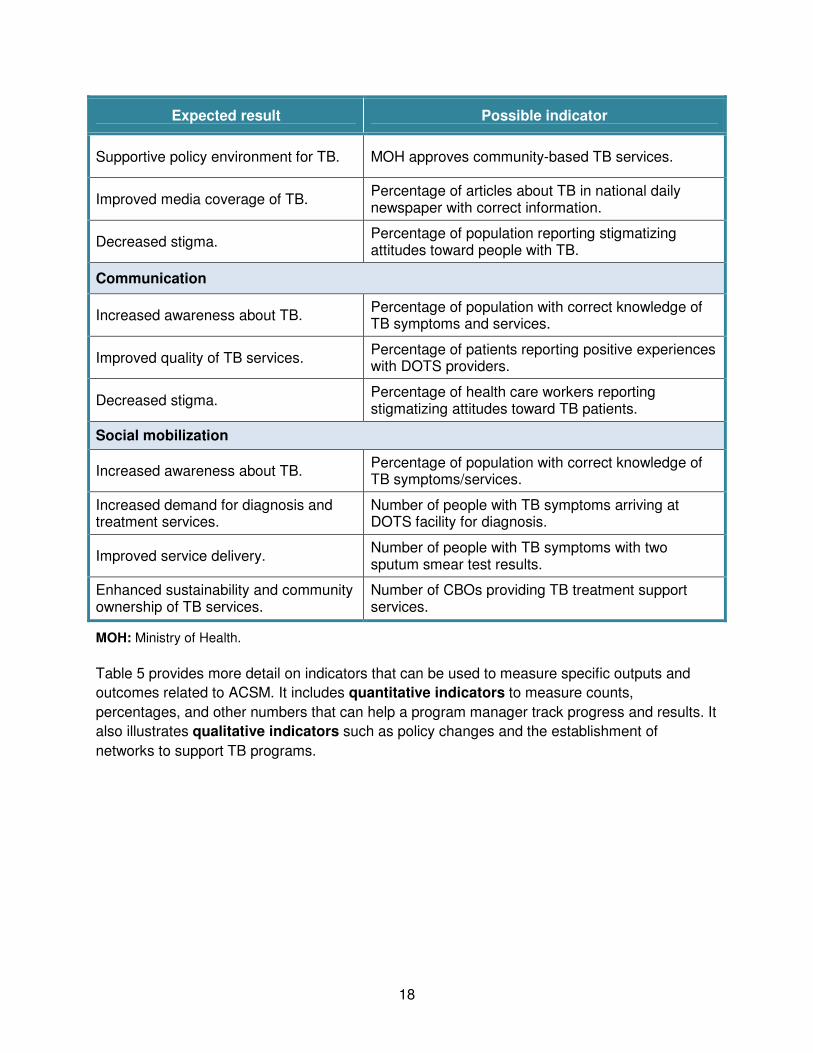
Expected result Possible indicator
Supportive policy environment for TB. MOH approves community-based TB services.
Improved media coverage of TB. Percentage of articles about TB in national daily newspaper with correct information.
Decreased stigma. Percentage of population reporting stigmatizing attitudes toward people with TB.
Communication
Increased awareness about TB. Percentage of population with correct knowledge of TB symptoms and services.
Improved quality of TB services. Percentage of patients reporting positive experiences with DOTS providers.
Decreased stigma. Percentage of health care workers reporting stigmatizing attitudes toward TB patients.
Social mobilization
Increased awareness about TB. Percentage of population with correct knowledge of TB symptoms/services.
Increased demand for diagnosis and treatment services.
Number of people with TB symptoms arriving at DOTS facility for diagnosis.
Improved service delivery. Number of people with TB symptoms with two sputum smear test results.
Enhanced sustainability and community ownership of TB services.
Number of CBOs providing TB treatment support services.
MOH: Ministry of Health.
Table 5 provides more detail on indicators that can be used to measure specific outputs and
outcomes related to ACSM. It includes quantitative indicators to measure counts,
percentages, and other numbers that can help a program manager track progress and results. It
also illustrates qualitative indicators such as policy changes and the establishment of
networks to support TB programs.
19
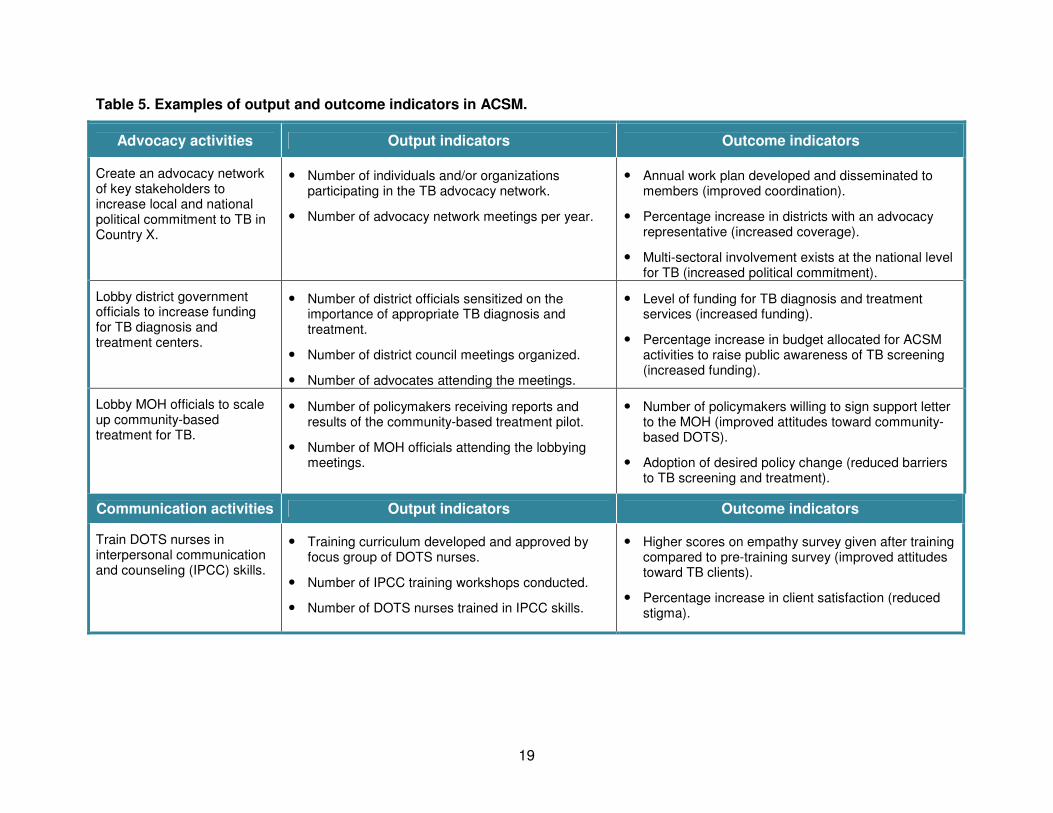
Table 5. Examples of output and outcome indicators in ACSM.
Advocacy activities Output indicators Outcome indicators
Create an advocacy network of key stakeholders to increase local and national political commitment to TB in Country X.
• Number of individuals and/or organizations participating in the TB advocacy network.
• Number of advocacy network meetings per year.
• Annual work plan developed and disseminated to members (improved coordination).
• Percentage increase in districts with an advocacy representative (increased coverage).
• Multi-sectoral involvement exists at the national level for TB (increased political commitment).
Lobby district government officials to increase funding for TB diagnosis and treatment centers.
• Number of district officials sensitized on the importance of appropriate TB diagnosis and treatment.
• Number of district council meetings organized.
• Number of advocates attending the meetings.
• Level of funding for TB diagnosis and treatment services (increased funding).
• Percentage increase in budget allocated for ACSM activities to raise public awareness of TB screening (increased funding).
Lobby MOH officials to scale up community-based treatment for TB.
• Number of policymakers receiving reports and results of the community-based treatment pilot.
• Number of MOH officials attending the lobbying meetings.
• Number of policymakers willing to sign support letter to the MOH (improved attitudes toward community-based DOTS).
• Adoption of desired policy change (reduced barriers to TB screening and treatment).
Communication activities Output indicators Outcome indicators
Train DOTS nurses in interpersonal communication and counseling (IPCC) skills.
• Training curriculum developed and approved by focus group of DOTS nurses.
• Number of IPCC training workshops conducted.
• Number of DOTS nurses trained in IPCC skills.
• Higher scores on empathy survey given after training compared to pre-training survey (improved attitudes toward TB clients).
• Percentage increase in client satisfaction (reduced stigma).
20
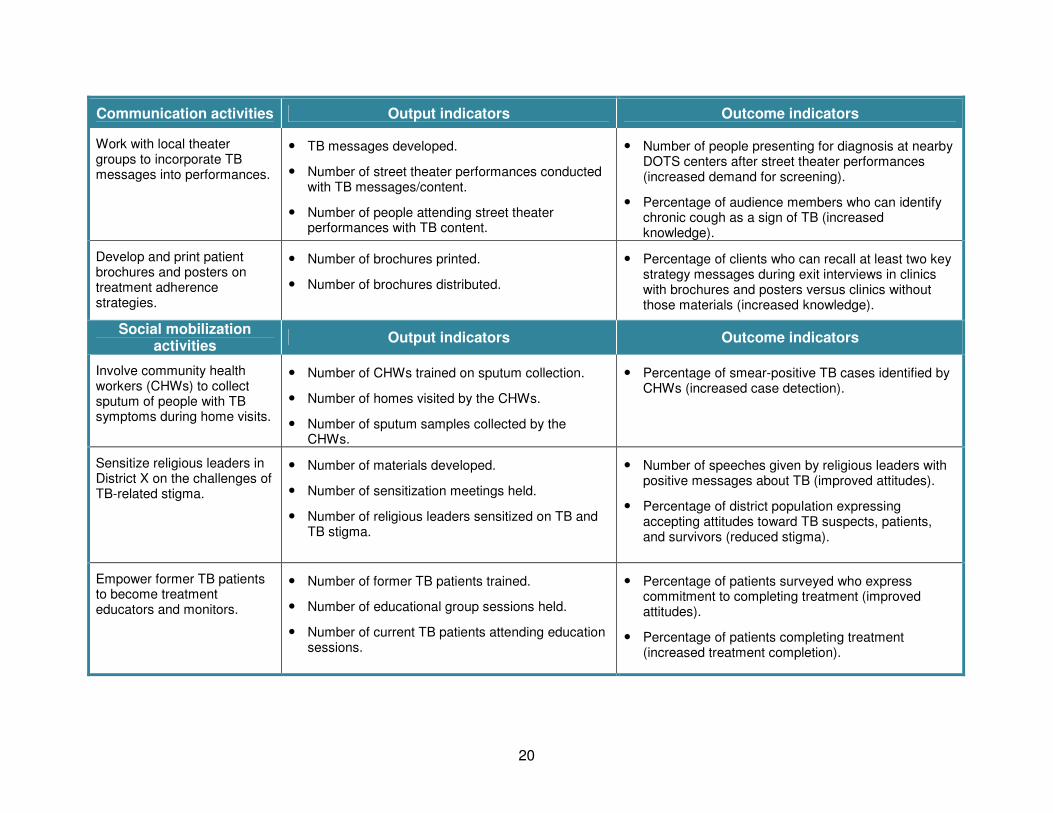
Communication activities Output indicators Outcome indicators
Work with local theater groups to incorporate TB messages into performances.
• TB messages developed.
• Number of street theater performances conducted with TB messages/content.
• Number of people attending street theater performances with TB content.
• Number of people presenting for diagnosis at nearby DOTS centers after street theater performances (increased demand for screening).
• Percentage of audience members who can identify chronic cough as a sign of TB (increased knowledge).
Develop and print patient brochures and posters on treatment adherence strategies.
• Number of brochures printed.
• Number of brochures distributed.
• Percentage of clients who can recall at least two key strategy messages during exit interviews in clinics with brochures and posters versus clinics without those materials (increased knowledge).
Social mobilization activities
Output indicators Outcome indicators
Involve community health workers (CHWs) to collect sputum of people with TB symptoms during home visits.
• Number of CHWs trained on sputum collection.
• Number of homes visited by the CHWs.
• Number of sputum samples collected by the CHWs.
• Percentage of smear-positive TB cases identified by CHWs (increased case detection).
Sensitize religious leaders in District X on the challenges of TB-related stigma.
• Number of materials developed.
• Number of sensitization meetings held.
• Number of religious leaders sensitized on TB and TB stigma.
• Number of speeches given by religious leaders with positive messages about TB (improved attitudes).
• Percentage of district population expressing accepting attitudes toward TB suspects, patients, and survivors (reduced stigma).
Empower former TB patients to become treatment educators and monitors.
• Number of former TB patients trained.
• Number of educational group sessions held.
• Number of current TB patients attending education sessions.
• Percentage of patients surveyed who express commitment to completing treatment (improved attitudes).
• Percentage of patients completing treatment (increased treatment completion).
21
Selecting Indicators
Indicators should measure a range of important inputs, outputs, outcomes, and impacts. Most
programs use a mix of indicators that are quantitative (numerical) and qualitative (descriptive),
as seen above. Indicator selection should flow directly from the ACSM planning process and the
M&E framework.
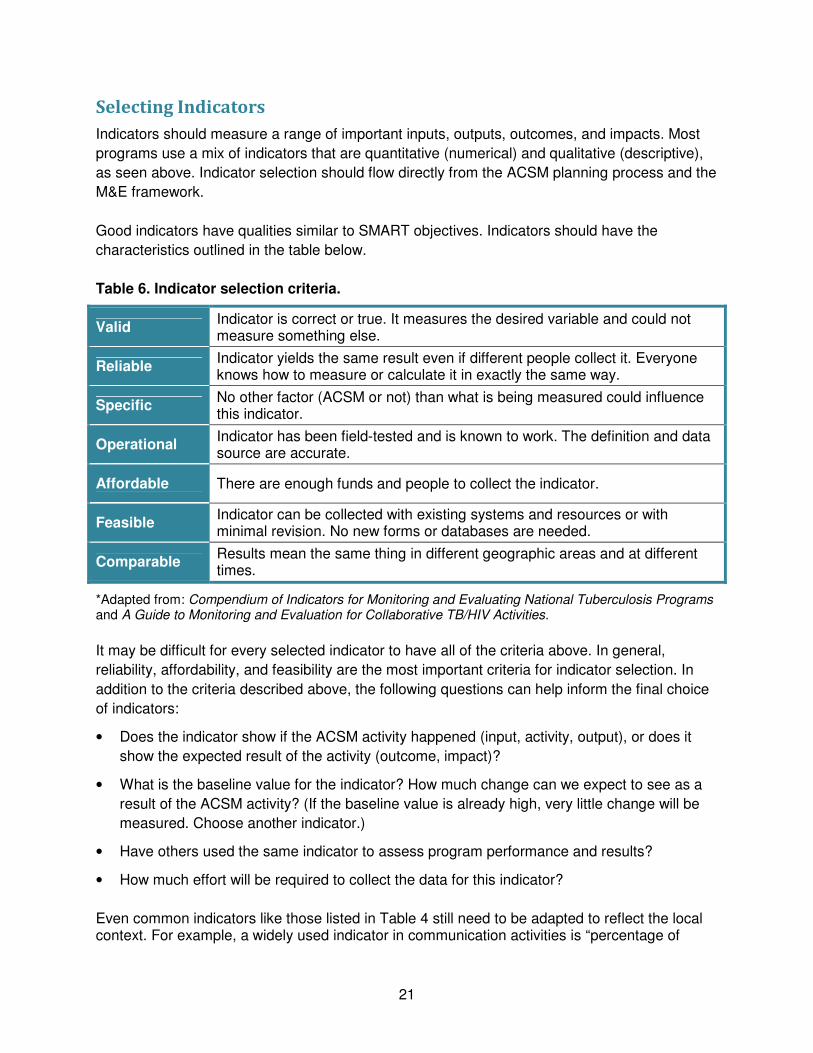
Good indicators have qualities similar to SMART objectives. Indicators should have the
characteristics outlined in the table below.
Table 6. Indicator selection criteria.
Valid Indicator is correct or true. It measures the desired variable and could not measure something else.
Reliable Indicator yields the same result even if different people collect it. Everyone knows how to measure or calculate it in exactly the same way.
Specific No other factor (ACSM or not) than what is being measured could influence this indicator.
Operational Indicator has been field-tested and is known to work. The definition and data source are accurate.
Affordable There are enough funds and people to collect the indicator.
Feasible Indicator can be collected with existing systems and resources or with minimal revision. No new forms or databases are needed.
Comparable Results mean the same thing in different geographic areas and at different times.
*Adapted from: Compendium of Indicators for Monitoring and Evaluating National Tuberculosis Programs and A Guide to Monitoring and Evaluation for Collaborative TB/HIV Activities.
It may be difficult for every selected indicator to have all of the criteria above. In general,
reliability, affordability, and feasibility are the most important criteria for indicator selection. In
addition to the criteria described above, the following questions can help inform the final choice
of indicators:
• Does the indicator show if the ACSM activity happened (input, activity, output), or does it
show the expected result of the activity (outcome, impact)?
• What is the baseline value for the indicator? How much change can we expect to see as a
result of the ACSM activity? (If the baseline value is already high, very little change will be
measured. Choose another indicator.)
• Have others used the same indicator to assess program performance and results?
• How much effort will be required to collect the data for this indicator?
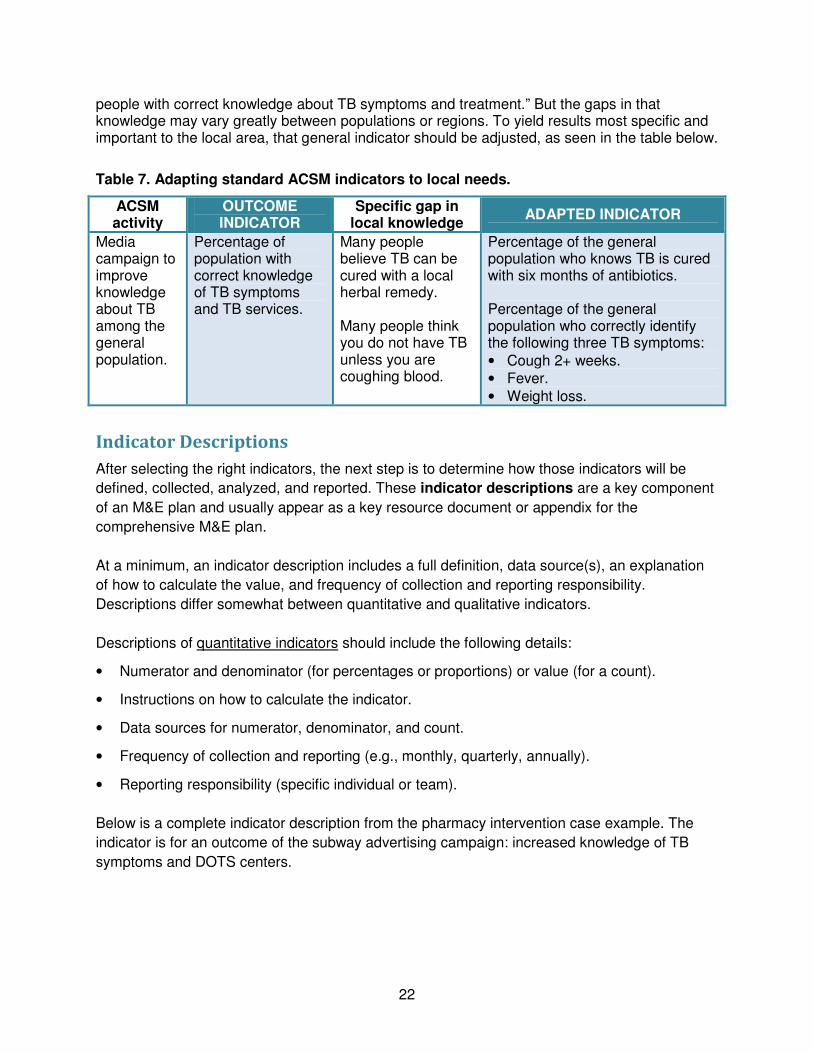
Even common indicators like those listed in Table 4 still need to be adapted to reflect the local context. For example, a widely used indicator in communication activities is “percentage of
22
people with correct knowledge about TB symptoms and treatment.” But the gaps in that knowledge may vary greatly between populations or regions. To yield results most specific and important to the local area, that general indicator should be adjusted, as seen in the table below.
Table 7. Adapting standard ACSM indicators to local needs.
ACSM activity
OUTCOME INDICATOR
Specific gap in local knowledge
ADAPTED INDICATOR
Media campaign to improve knowledge about TB among the general population.
Percentage of population with correct knowledge of TB symptoms and TB services.
Many people believe TB can be cured with a local herbal remedy. Many people think you do not have TB unless you are coughing blood.
Percentage of the general population who knows TB is cured with six months of antibiotics. Percentage of the general population who correctly identify the following three TB symptoms:
• Cough 2+ weeks.
• Fever.
• Weight loss.
Indicator Descriptions
After selecting the right indicators, the next step is to determine how those indicators will be
defined, collected, analyzed, and reported. These indicator descriptions are a key component
of an M&E plan and usually appear as a key resource document or appendix for the
comprehensive M&E plan.
At a minimum, an indicator description includes a full definition, data source(s), an explanation
of how to calculate the value, and frequency of collection and reporting responsibility.
Descriptions differ somewhat between quantitative and qualitative indicators.
Descriptions of quantitative indicators should include the following details:
• Numerator and denominator (for percentages or proportions) or value (for a count).
• Instructions on how to calculate the indicator.
• Data sources for numerator, denominator, and count.
• Frequency of collection and reporting (e.g., monthly, quarterly, annually).
• Reporting responsibility (specific individual or team).
Below is a complete indicator description from the pharmacy intervention case example. The
indicator is for an outcome of the subway advertising campaign: increased knowledge of TB
symptoms and DOTS centers.

23
CASE EXAMPLE: PHARMACY INTERVENTION
Indicator: Percentage of people who know two TB symptoms and what the DOTS center is.
Complete definition
Percentage of subway riders who can accurately name two TB symptoms and can recall that the DOTS center is a place to get screened for TB.
Numerator Total number of people who can identify two symptoms and DOTS center correctly.
Denominator Total number of people who complete a survey.
Calculation (Numerator/Denominator)*100. For example, if 32 of 50 people surveyed answered correctly, the calculation would be (32/50)*100 = 64%.
Data source Exit interviews at designated subway stations.
Frequency Eight weeks before campaign, four weeks after campaign launch, eight weeks after campaign launch.
Reporting responsibility Collected and reported by Dr. T, District ACSM Coordinator.
Descriptions for qualitative indicators are often more challenging because the criteria for
determining performance are subjective. For example, a qualitative indicator to measure
national political commitment to fight TB and HIV co-infection may be defined as “TB/HIV co-
infection is acknowledged as a public health emergency.” While the answer may seem to be a
simple yes or no, there may be different opinions about what “acknowledgment” means. Is a
declaration from the Ministry of Health (MOH) enough, or must it come from the president, prime
minister, or parliament? Does the acknowledgment need to be a verbal statement in public or
written in an official document? How often should TB and TB/HIV co-infection be acknowledged
as an urgent public health issue in order to stay visible on the political agenda?
Another problematic example is using MOH budget line items or funding approval as an
indicator of effective advocacy efforts. While this may seem like an obvious indicator, several
government entities may contribute to overall spending on TB, such as the Ministries of Justice
and Corrections, Education, and Interior. Is it the overall NTP
budget that matters most? What if that budget increase is coming
from an international donor? Does it matter that the budget is
increasing or that the total internal government contribution as a
percentage of the whole budget is increasing?
Because qualitative definitions can be interpreted differently, it
is important for all stakeholders to agree on the specific
definition before the intervention. Clear indicator descriptions are
essential to data quality and consistency because everyone must understand the activities and
results to mean the same thing. Investing time to build consensus around indicator definitions
Always build
consensus on
indicator definitions
before starting an
intervention.
24
also helps ensure that indicators meet the criteria described in Table 6. Once descriptions have
been developed, it becomes easier to train M&E officers and other staff who may be collecting
these indicators in the field.
Many donors now require that indicator descriptions include a “means of verification” to show
how the values can be confirmed during an audit or data quality check. Usually, the primary or
“raw” data source is used to verify data. For example, the number of health care providers
trained on ACSM (output indicator) could be verified by checking the primary source of data
(e.g., the attendance form signed each day by participants).
When drafting indicator descriptions, always anticipate which data sources can be used for
verification. Also ensure that all M&E officers and those with reporting responsibilities maintain
the original data documents in the event of an audit.
Data Collection
Indicators are essential to know which data must be collected. An M&E plan should also outline
how data will be collected, who will collect the data, and how often. ACSM programs can use a
variety of tools or forms to monitor activity data, such as:
•••• outreach contact forms;
•••• training attendance sheets;
•••• meeting minutes;
•••• patient registration forms;
•••• inventories of communication materials;
•••• website activity reports; and
•••• phone logs.
It is most practical (and cost-effective) to use existing data sources or program records
whenever possible. In some cases, however, staff may need to create new tools or analyze
data sources outside their own organizations, such as laboratory registers or media reports.
Ideally, an organization should avoid collecting duplicate data on different forms. Each
donor and stakeholder may require different data to be collected and reported and in different
formats, although many make efforts to avoid parallel data collection systems.
Since most programs have multiple donors and also report to the NTP or other national,
regional, and/or district supervisors, it is wise to conduct an inventory of all data
requirements to determine how data collection and analysis can be streamlined. It may be
possible to revise or create a single form to collect a wider range of data and then tailor
separate analysis for each particular donor’s needs.
It is also critical to have an internal reporting system with up-to-date activity data (e.g.,
monthly or quarterly reports) to support routine monitoring. This can include district or national
reports from the routine health management information system. Specific data collected in
registers but not summarized or reported in quarterly, semiannual, or annual reports to the NTP
25
can also be useful in monitoring outputs or outcomes of ACSM efforts. Simple paper-based
systems or electronic databases may be used to analyze and store monitoring data.
Data Quality
An M&E plan should describe what measures will be taken to ensure that collected data are
accurate, complete, and unbiased. Project managers must be confident that the results they
report represent the true achievements of the project. In some cases, donors actually require an
independent audit of routine data to ensure quality and consistency of reporting.
High-quality results begin with selecting and clearly defining indicators. Data will be more
consistent when all program staff and partners agree on common definitions and reporting
procedures from the beginning. Complete indicator descriptions also help promote quality and
consistency when there are changes in staffing or reporting responsibilities.
There are five basic elements of data quality, which are similar to the characteristics of strong
indicators. Data should fulfill the following criteria:
• Valid: The data represent what actually happened.
• Reliable: Everyone collects and interprets the indicators in the same way, using the same
data sources and methods of calculation.
• Precise: Data and indicator descriptions have sufficient detail and the units of measurement
are very clear.
• Complete: Primary data sources include all of the values needed to calculate indicators, and
no values are missing.
• Timely: Data are consistently collected and reported according to internal and external
deadlines. Data are analyzed frequently enough to be useful in management decisions.
Another issue related to data quality is integrity. Programs of all sizes often feel under pressure
to “look good” for certain audiences and show success. Staff salaries, job security, and future
funding may depend on how much programs achieve, so data bias and falsification are
unfortunately real concerns. Integrity means that data are true, safe from deliberate bias,
and have not been changed for political or personal reasons.
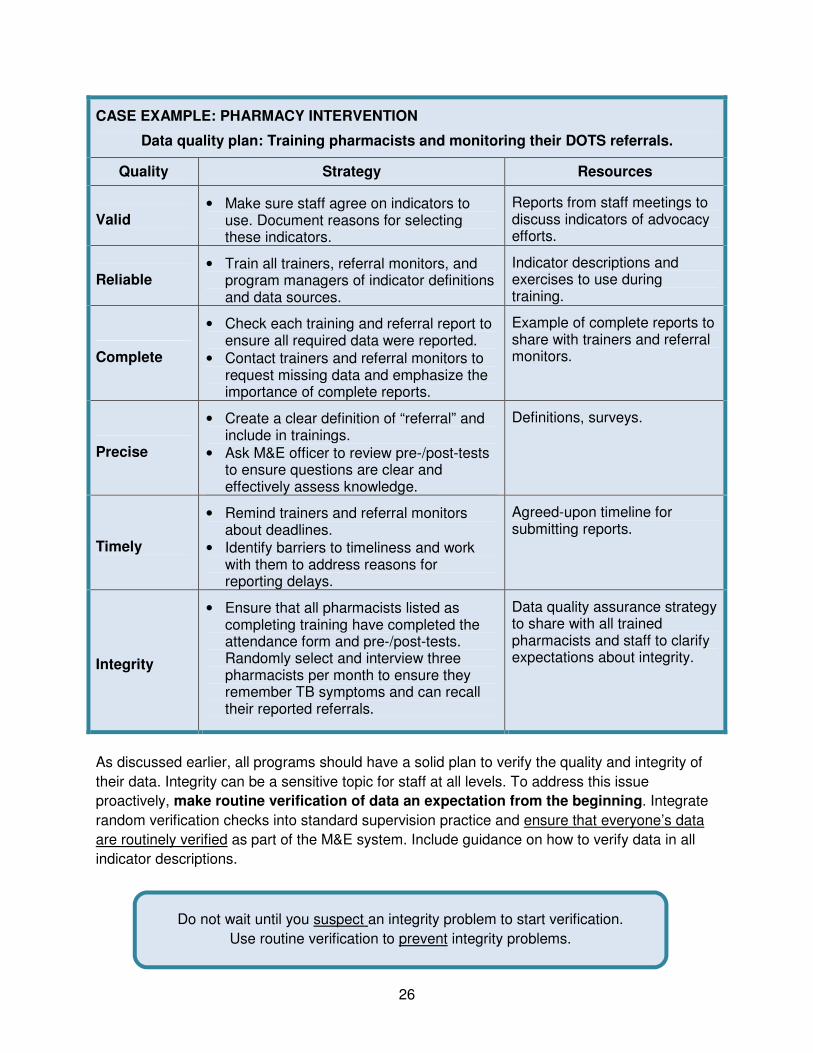
One simple template that is useful in data quality planning is shown below. This data quality
plan is from the case example in which pharmacists are trained and given follow-up support to
refer appropriate customers for DOTS screenings. It lists the strategies the NGO will use to
ensure the quality of the criteria of both the training and the follow-up referral support, along with
the resources needed to implement each strategy.
26
CASE EXAMPLE: PHARMACY INTERVENTION
Data quality plan: Training pharmacists and monitoring their DOTS referrals.
Quality Strategy Resources
Valid • Make sure staff agree on indicators to
use. Document reasons for selecting these indicators.
Reports from staff meetings to discuss indicators of advocacy efforts.
Reliable • Train all trainers, referral monitors, and
program managers of indicator definitions and data sources.
Indicator descriptions and exercises to use during training.
Complete
• Check each training and referral report to ensure all required data were reported.
• Contact trainers and referral monitors to request missing data and emphasize the importance of complete reports.
Example of complete reports to share with trainers and referral monitors.
Precise
• Create a clear definition of “referral” and include in trainings.
• Ask M&E officer to review pre-/post-tests to ensure questions are clear and effectively assess knowledge.
Definitions, surveys.
Timely
• Remind trainers and referral monitors about deadlines.
• Identify barriers to timeliness and work with them to address reasons for reporting delays.
Agreed-upon timeline for submitting reports.
Integrity
• Ensure that all pharmacists listed as completing training have completed the attendance form and pre-/post-tests. Randomly select and interview three pharmacists per month to ensure they remember TB symptoms and can recall their reported referrals.
Data quality assurance strategy to share with all trained pharmacists and staff to clarify expectations about integrity.
As discussed earlier, all programs should have a solid plan to verify the quality and integrity of
their data. Integrity can be a sensitive topic for staff at all levels. To address this issue
proactively, make routine verification of data an expectation from the beginning. Integrate
random verification checks into standard supervision practice and ensure that everyone’s data
are routinely verified as part of the M&E system. Include guidance on how to verify data in all
indicator descriptions.
Do not wait until you suspect an integrity problem to start verification.
Use routine verification to prevent integrity problems.
27
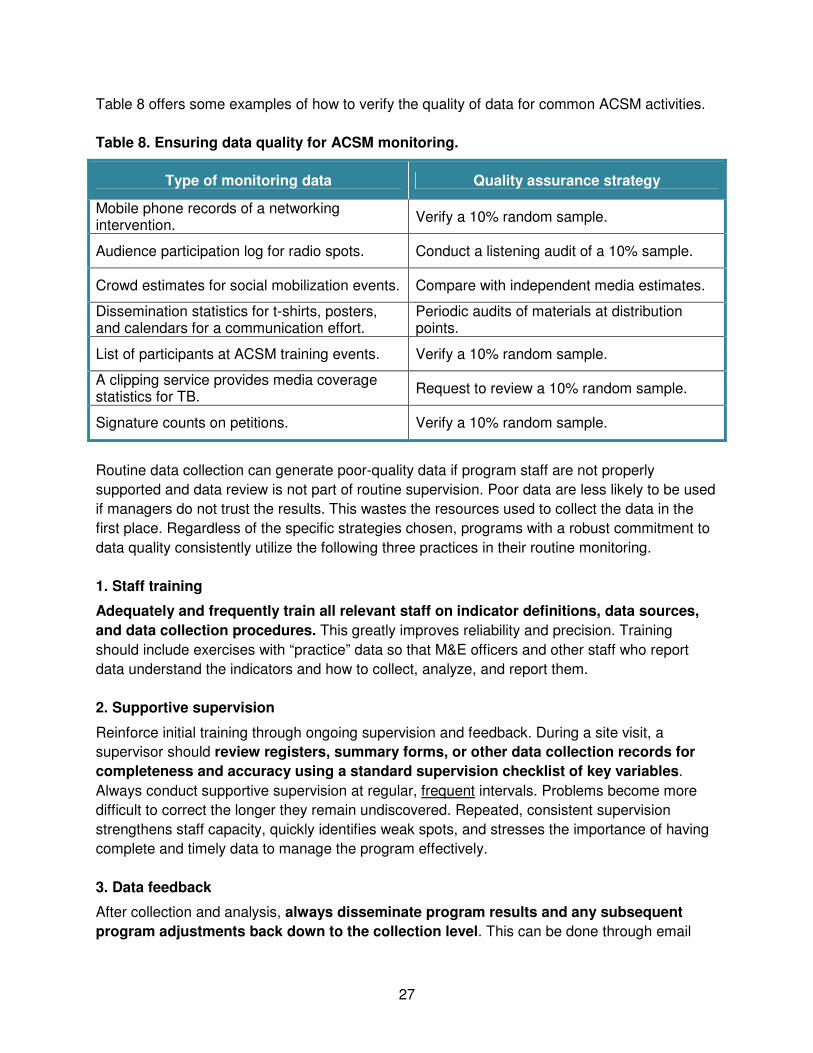
Table 8 offers some examples of how to verify the quality of data for common ACSM activities.
Table 8. Ensuring data quality for ACSM monitoring.
Type of monitoring data Quality assurance strategy
Mobile phone records of a networking intervention.
Verify a 10% random sample.
Audience participation log for radio spots. Conduct a listening audit of a 10% sample.
Crowd estimates for social mobilization events. Compare with independent media estimates.
Dissemination statistics for t-shirts, posters, and calendars for a communication effort.
Periodic audits of materials at distribution points.
List of participants at ACSM training events. Verify a 10% random sample.
A clipping service provides media coverage statistics for TB.
Request to review a 10% random sample.
Signature counts on petitions. Verify a 10% random sample.
Routine data collection can generate poor-quality data if program staff are not properly
supported and data review is not part of routine supervision. Poor data are less likely to be used
if managers do not trust the results. This wastes the resources used to collect the data in the
first place. Regardless of the specific strategies chosen, programs with a robust commitment to
data quality consistently utilize the following three practices in their routine monitoring.
1. Staff training
Adequately and frequently train all relevant staff on indicator definitions, data sources,
and data collection procedures. This greatly improves reliability and precision. Training
should include exercises with “practice” data so that M&E officers and other staff who report
data understand the indicators and how to collect, analyze, and report them.
2. Supportive supervision
Reinforce initial training through ongoing supervision and feedback. During a site visit, a
supervisor should review registers, summary forms, or other data collection records for
completeness and accuracy using a standard supervision checklist of key variables.
Always conduct supportive supervision at regular, frequent intervals. Problems become more
difficult to correct the longer they remain undiscovered. Repeated, consistent supervision
strengthens staff capacity, quickly identifies weak spots, and stresses the importance of having
complete and timely data to manage the program effectively.
3. Data feedback
After collection and analysis, always disseminate program results and any subsequent
program adjustments back down to the collection level. This can be done through email
28
updates, staff or partner meetings, or individual supervision sessions. When program staff see
that data collection has an important purpose and is useful to their own performance, they are
more motivated to ensure the quality of that data.
Data Use and Reporting
Data use and reporting are additional components of a typical M&E plan. Routine monitoring
data must be reviewed and used to make appropriate adjustments and improve performance.
Programs rely on high-quality data to:
• Know if they are meeting targets.
• Make decisions about programs and policies.
• Prioritize activities.
• Identify support and training needs.
• Report back to donors.
A data use strategy should specify how data will be analyzed, which routine reports will be
produced, and which indicators will be included in the reports. A data use strategy should
answer the following questions:
• What data or findings are most important to the program?
• How can the data be used to improve the program?
• How often does data need to be reviewed for optimal performance management? By
whom?
• How will data be analyzed (e.g., by hand or electronic database)?
• Who else might want to know about or use these data?
• What is the best way to distribute results to each interested stakeholder?
Many stakeholders outside the program may share an interest in program data but for different
reasons. These people and organizations might include:
• NTP staff.
• Other NTPs.
• Community-based organizations.
• Faith-based organizations.
• International/National NGOs.
• Health profession groups.
• Medical centers, clinic administrators.
• Law-/Policymakers.
• Television, radio, print media.
• Evaluators, researchers.
• Donors.
• Partner organizations.
• TB clients.
• The public.
MEASURE Evaluation offers detailed guidance on data use,
data use strategies, frameworks, and training resources.
www.cpc.unc.edu/measure/our-work/data-demand-and-use
29
Each stakeholder might be interested in different data, as illustrated below for the pharmacy
intervention case example.
• The NTP will want to know how this approach contributed to case detection and treatment outcomes.
• The donor will want to know if the activity was effective and target objectives were met so they can consider possible expansion to other cities.
• The pharmacists themselves might want to know how many other pharmacists participated and how this activity impacted their business.
• Politicians might be willing to allocate more money for scale-up if they see that this approach was a cheaper alternative to other case detection efforts.
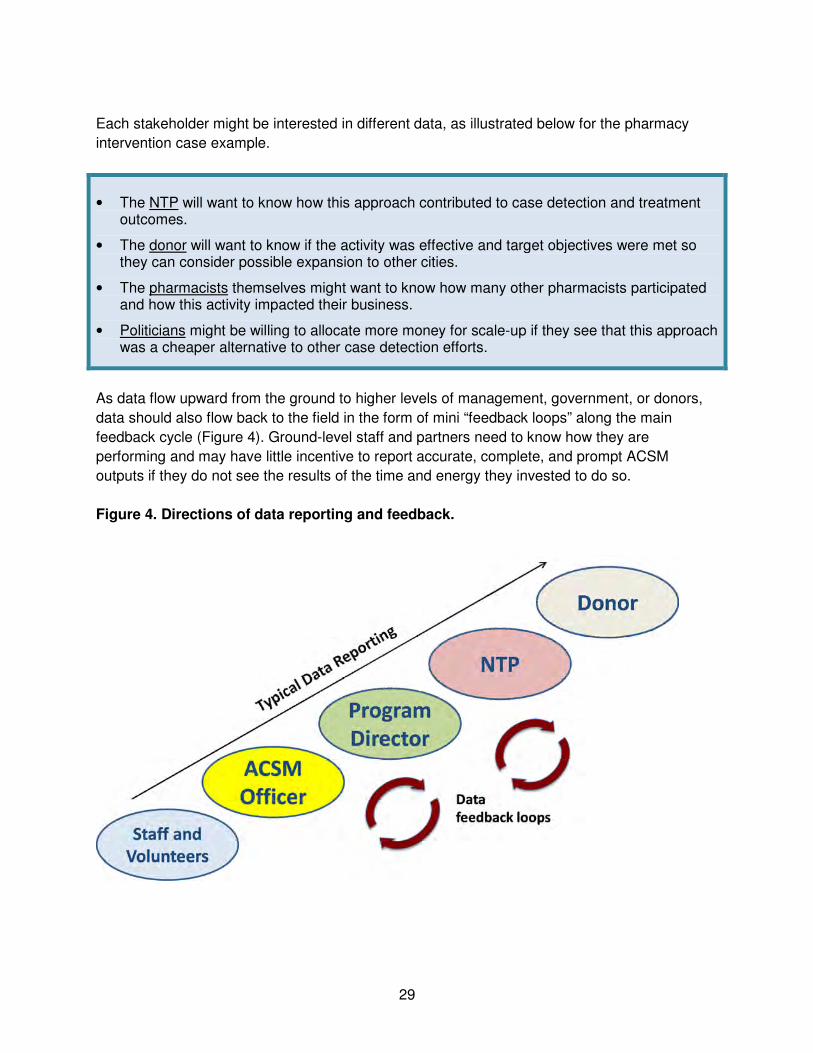
As data flow upward from the ground to higher levels of management, government, or donors,
data should also flow back to the field in the form of mini “feedback loops” along the main
feedback cycle (Figure 4). Ground-level staff and partners need to know how they are
performing and may have little incentive to report accurate, complete, and prompt ACSM
outputs if they do not see the results of the time and energy they invested to do so.
Figure 4. Directions of data reporting and feedback.
30
ACSM programs can use a variety of feedback mechanisms, such as program and
epidemiological updates, reflection meetings, supportive supervision visits, and quarterly data
review meetings, to share ACSM outcomes, identify common challenges, and brainstorm
solutions. These meetings are great opportunities to encourage
staff to use data to identify their own successes, challenges, and
solutions rather than forcing “top-down” solutions from
management without staff input.
Broad dissemination of M&E results fosters a culture of
transparency and accountability. It also promotes a program and
organizational culture of learning and best practices, especially if
staff are inexperienced with a new strategy.
TIPS FOR ENGAGING DATA-SHARING
1. Explain or “interpret” data that may not seem obvious to stakeholders outside the organization who may be less familiar with the program, its activities, and the environment in which it operates. Provide context to help the audience understand what the data mean.
2. Provide a story that makes the data come to life. Numbers are really about people, so tell a brief story about a client, staff person, or community member to illustrate the impact those numbers have in real life.
3. Focus more on trends than on separate pieces of data. Busy managers do not have time to read through pages and pages of tables, especially if the data do not provide any insight on performance. More data are not always better.
4. Go beyond words and written reports. Try more interactive formats to communicate your results, such as press conferences, staff retreats, Facebook/Twitter posts, or radio interviews. Make your reports more visually interesting with tables, charts, and graphs. Tailor the language and style to fit the particular audience.
Accurate, frequent
reporting is an essential
opportunity for ACSM
programs to “tell the
story” of their successes.
31
PART 3: Evaluation of Advocacy, Communication, and
Social Mobilization
As staff review their program performance and results, they will naturally ask a variety of
questions about their ACSM interventions, such as:
• What are the starting values of our indicators before we begin our intervention?
• What is the most compelling message for our media campaign?
• Would our target audience prefer to hear these messages via television or the Internet?
• Why are our outreach workers struggling to reach their monthly contact targets?
• Did our advocacy campaign raise resources for rural TB clinics as we had hoped?
• How did that increase in resources ultimately affect case detection and treatment
outcomes in rural areas?
Routine monitoring cannot provide the information needed to answer these questions.
Therefore, programs must rely on evaluation methods to generate this type of information.
Evaluation is a periodic, in-depth effort to answer questions about program design and
effectiveness. Evaluation is a sizable part of a standard M&E plan. Program staff can
conduct their own evaluation or call on external stakeholders or partners with specialized
expertise to provide technical assistance and to reduce bias in the evaluation and design.
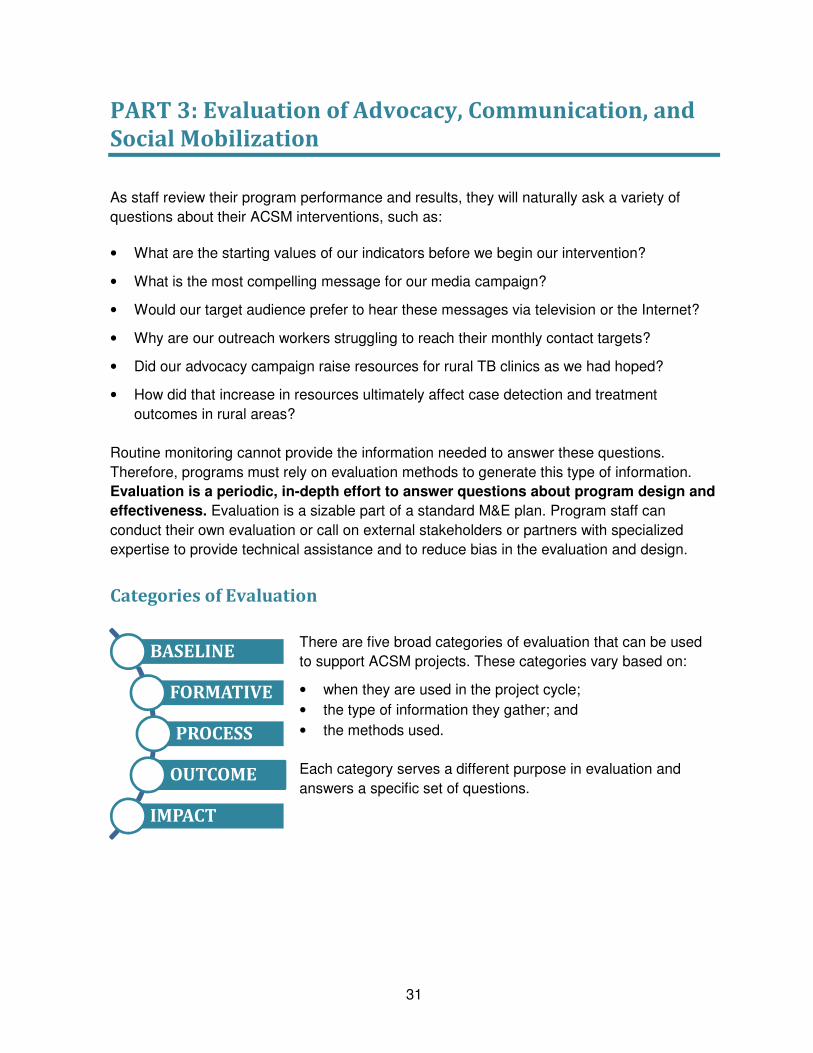
Categories of Evaluation
There are five broad categories of evaluation that can be used
to support ACSM projects. These categories vary based on:
• when they are used in the project cycle;
• the type of information they gather; and
• the methods used.
Each category serves a different purpose in evaluation and
answers a specific set of questions.
BASELINE
FORMATIVE
PROCESS
OUTCOME
IMPACT
32
1. Baseline evaluation
Program staff will not be able to design an intervention until an actual problem or barrier has
been defined. A baseline evaluation identifies where problems exist and the possible
solutions. Baseline evaluation is often called a “needs assessment.” It helps program
managers understand where to begin, which is especially important with very new activities or
target groups. Baseline evaluation can answer the following types of questions:
• What is the main problem or barrier that can be addressed with ACSM?
• Who do we need to reach and how?
• What activities are most important or most needed?
• What is the starting value for key indicators?
Assume, for example, that the NTP has discovered that rates of treatment completion are
decreasing in two districts. A baseline evaluation would determine if the rates are particularly
poor in certain clinics (where is the problem?), the kinds of patients who are not completing
treatment (who is the target audience?), and the average number of weeks these patients
complete (starting value for an outcome indicator). With this information, the NTP could
design an ACSM intervention to improve treatment completion rates in these districts. The
baseline evaluation may reveal that several interventions are necessary. For example, the
clinics with the lowest rates of treatment completion may have chronic drug stockouts. In this
case, ACSM may be part of a larger set of interventions needed to resolve this issue.
2. Formative evaluation
Baseline evaluation confirms the need for an intervention and defines the scope of the
problem. Formative evaluation takes the next step to help ACSM planners design or “form”
the right activities to address that problem, especially communication activities. It ensures the
intervention design is workable and acceptable to the target audience, which improves its
likelihood of success.
Formative evaluation can answer questions such as:
• What should the intervention look like? What messages will best address the barrier or
problem?
• What ideas or insights does the target audience have?
• What is the right way to reach people?
• Does the target audience understand this campaign message?
Baseline evaluation: What is the starting point?
Formative evaluation: What should the intervention look like?
33
Formative evaluation is often used to test communication messages or materials with the
target audience. “Pre-testing” strengthens communication interventions by refining the most
salient and convincing message for the right people. Programs that do not conduct solid
formative evaluation and pre-test their ideas often develop communication messages that
backfire.
FORMATIVE EVALUATION: THE VALUE OF PRE-TESTING ACSM INTERVENTIONS
In one country, the NTP produced a poster showing a thin, elderly man spitting into a cup as part of a media campaign to increase awareness about TB diagnosis. The M&E officer and the communications officer held a series of focus group discussions with the target audiences (refugees, injection drug users, and persons with diabetes) to assess the effectiveness of the poster before it was produced. The results showed that many people could not relate to or identify with the image on the poster. Moreover, many were unclear about what the man was doing with the cup. Some participants thought he was chewing tobacco. The NTP then decided to produce slightly different posters for each vulnerable group, showing a nurse giving sputum sample coaching. (Communication experts call this “audience segmentation.”) A second round of pre-testing showed that this strategy increased the effectiveness of the campaign with the target groups.
3. Process evaluation
Process evaluation can occur any time after activities are launched. The purpose of process
evaluation is to formally assess the “process” of how the activities are being implemented and
what, if any, mid-course corrections are needed. Process evaluation answers questions such
as:
• Which activities are going well? Which activities need improvement and why?
• How can we make this intervention more cost-effective?
• What challenges or surprises do we need to address?
• What lessons have we learned while conducting these activities? What best practices can we share?
Process evaluation often overlaps with routine monitoring, but it goes a bit further. Monitoring
looks mostly at the outputs of activities to simply show what happened. Process evaluation
looks at the “process” of implementing those activities to identify not only what happened but
also why or how it happened. It seeks to identify why some activities are working well or
perhaps not working well.
Process evaluation could include analysis of program data, review of key reports, and
interviews with program staff, donors, clients, or other beneficiaries. Using multiple
approaches will provide the most complete picture of implementation.
Process evaluation: What is working well (or not) and why?
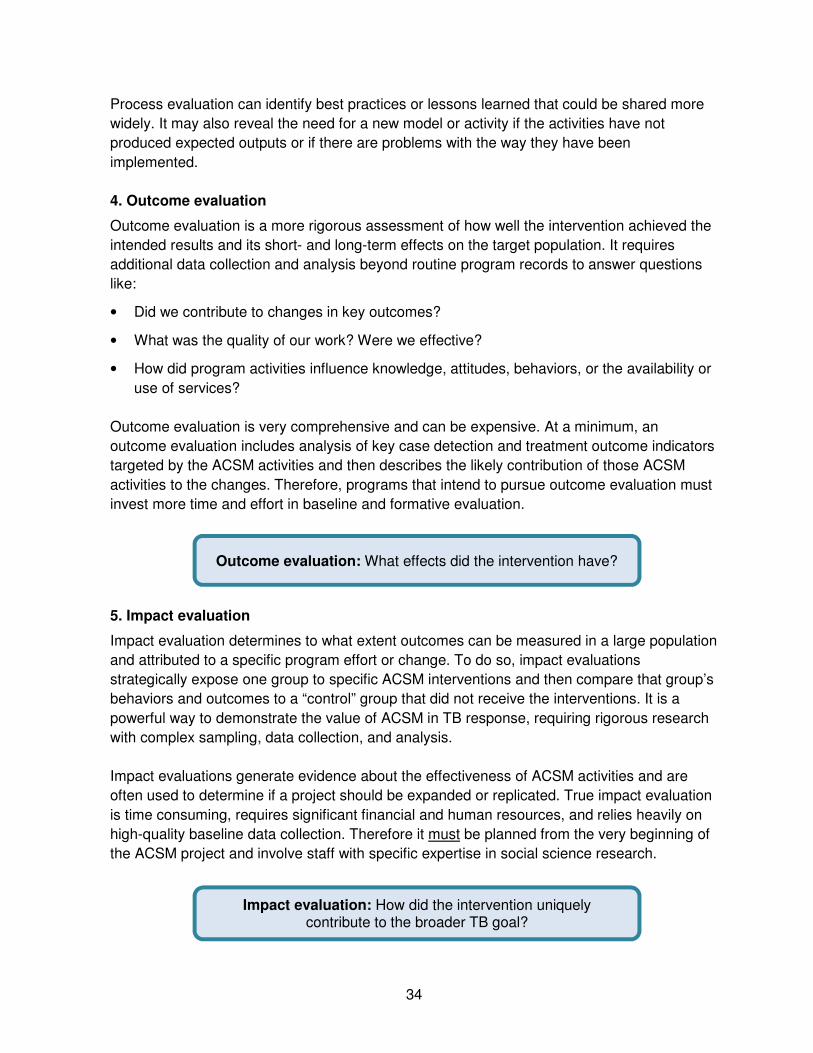
34
Process evaluation can identify best practices or lessons learned that could be shared more
widely. It may also reveal the need for a new model or activity if the activities have not
produced expected outputs or if there are problems with the way they have been
implemented.
4. Outcome evaluation
Outcome evaluation is a more rigorous assessment of how well the intervention achieved the
intended results and its short- and long-term effects on the target population. It requires
additional data collection and analysis beyond routine program records to answer questions
like:
• Did we contribute to changes in key outcomes?
• What was the quality of our work? Were we effective?
• How did program activities influence knowledge, attitudes, behaviors, or the availability or
use of services?
Outcome evaluation is very comprehensive and can be expensive. At a minimum, an
outcome evaluation includes analysis of key case detection and treatment outcome indicators
targeted by the ACSM activities and then describes the likely contribution of those ACSM
activities to the changes. Therefore, programs that intend to pursue outcome evaluation must
invest more time and effort in baseline and formative evaluation.
5. Impact evaluation
Impact evaluation determines to what extent outcomes can be measured in a large population
and attributed to a specific program effort or change. To do so, impact evaluations
strategically expose one group to specific ACSM interventions and then compare that group’s
behaviors and outcomes to a “control” group that did not receive the interventions. It is a
powerful way to demonstrate the value of ACSM in TB response, requiring rigorous research
with complex sampling, data collection, and analysis.
Impact evaluations generate evidence about the effectiveness of ACSM activities and are
often used to determine if a project should be expanded or replicated. True impact evaluation
is time consuming, requires significant financial and human resources, and relies heavily on
high-quality baseline data collection. Therefore it must be planned from the very beginning of
the ACSM project and involve staff with specific expertise in social science research.
Outcome evaluation: What effects did the intervention have?
Impact evaluation: How did the intervention uniquely contribute to the broader TB goal?
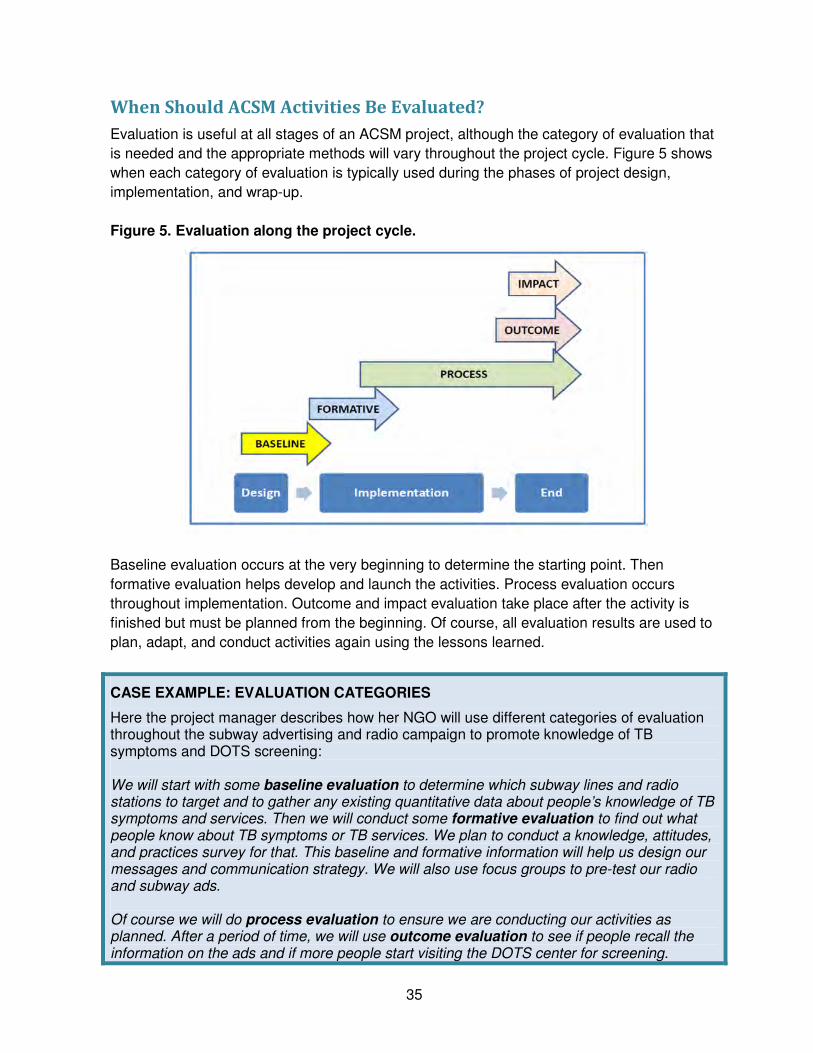
35
When Should ACSM Activities Be Evaluated?
Evaluation is useful at all stages of an ACSM project, although the category of evaluation that
is needed and the appropriate methods will vary throughout the project cycle. Figure 5 shows
when each category of evaluation is typically used during the phases of project design,
implementation, and wrap-up.
Figure 5. Evaluation along the project cycle.
Baseline evaluation occurs at the very beginning to determine the starting point. Then
formative evaluation helps develop and launch the activities. Process evaluation occurs
throughout implementation. Outcome and impact evaluation take place after the activity is
finished but must be planned from the beginning. Of course, all evaluation results are used to
plan, adapt, and conduct activities again using the lessons learned.
CASE EXAMPLE: EVALUATION CATEGORIES
Here the project manager describes how her NGO will use different categories of evaluation throughout the subway advertising and radio campaign to promote knowledge of TB symptoms and DOTS screening: We will start with some baseline evaluation to determine which subway lines and radio stations to target and to gather any existing quantitative data about people’s knowledge of TB symptoms and services. Then we will conduct some formative evaluation to find out what people know about TB symptoms or TB services. We plan to conduct a knowledge, attitudes, and practices survey for that. This baseline and formative information will help us design our messages and communication strategy. We will also use focus groups to pre-test our radio and subway ads. Of course we will do process evaluation to ensure we are conducting our activities as planned. After a period of time, we will use outcome evaluation to see if people recall the information on the ads and if more people start visiting the DOTS center for screening.
36
Finally, impact evaluation will tell us over time if there is any long-term change in case detection in this city specifically because of this effort. We can compare case detection trends in areas with the ads to other neighborhoods without the ads. This will be very challenging because there are other interventions going on to improve case detection. And we know that our population is very mobile and may ride the subway throughout the city, not only in their neighborhoods. So we will need specialized expertise in research to conduct a good impact evaluation.
Introduction to Evaluation Methods
Each evaluation category serves a different evaluation purpose or objective. Within each
category are specific evaluation methods, which are the actual techniques that are used to
collect the information for that purpose. A variety of quantitative and qualitative methods can
be used within each category of evaluation. In fact, some evaluations use more than one
method to gain a deeper understanding of why an intervention does or does not have the
intended result.
Quantitative methods involve analysis of numerical data collected with standardized
instruments, often using sophisticated sampling methods to ensure unbiased results.
Quantitative methods provide numerical data to estimate indicators for an entire population.
For example, the 2010/2011 TB prevalence survey in Nigeria included 49,000 people
selected from 700 clusters representing six zones to determine what percentage of the
population had smear-positive TB at that point in time.
Quantitative methods are the best choice when a program needs raw numbers to answer
questions like how many people were reached by an activity, what percentage of the
population can correctly identify TB symptoms, how often they listen to the radio, etc. They
are also effective to measure performance against a benchmark or target.
Qualitative methods provide in-depth, detailed information on perceptions, opinions, or
behavior and involve analysis of text, pictures, or interview transcripts rather than numerical
data. While quantitative methods produce “hard numbers,” qualitative methods capture more
descriptive data. Rather than counting numbers of people who think or behave in certain
ways, qualitative methods use open-ended data collection tools to explain why people think
and behave in certain ways. These methods reveal the nuances and context behind the
numbers. Because qualitative methods usually involve smaller numbers of respondents, the
findings are not generalized to a larger population.
Figure 6 shows the different quantitative and qualitative data that could be collected in a
baseline evaluation for a new treatment support intervention. For example, an analysis of TB
patient data could reveal, on average, how many patients left treatment early or even if there
were a correlation between how long they stayed in treatment and the number of contacts
they had with a volunteer treatment supporter. A qualitative method would help understand
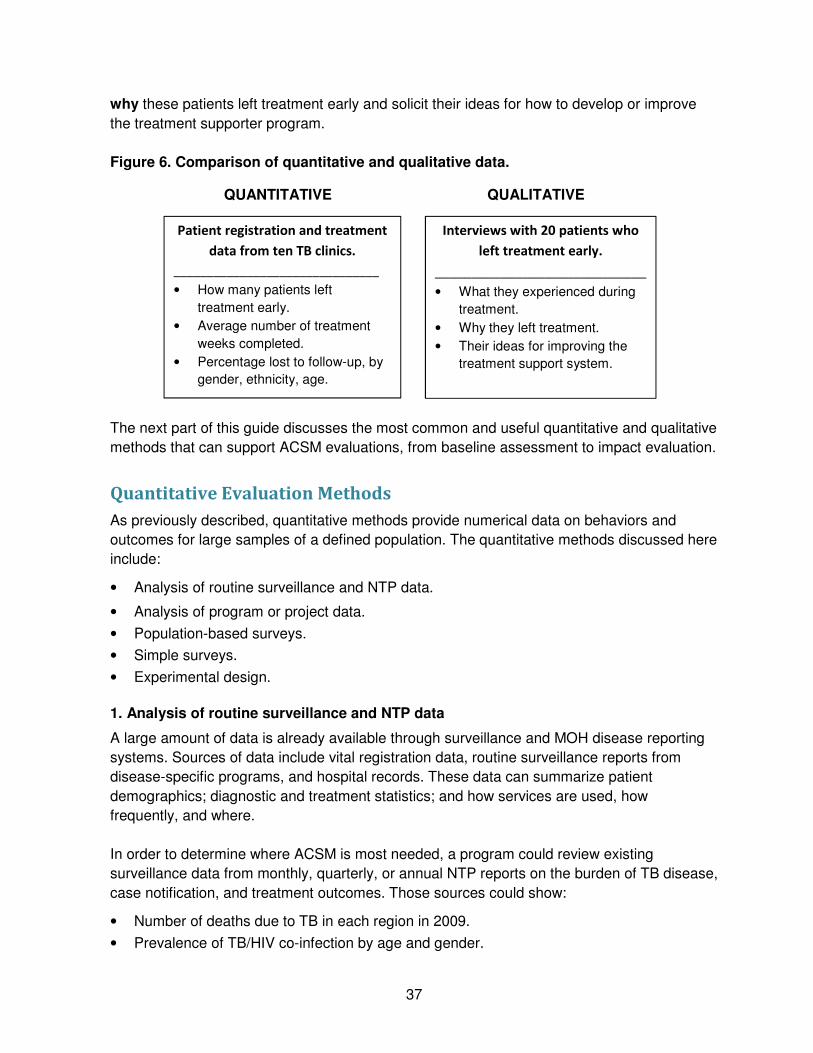
37
why these patients left treatment early and solicit their ideas for how to develop or improve
the treatment supporter program.
Figure 6. Comparison of quantitative and qualitative data.
QUANTITATIVE QUALITATIVE
The next part of this guide discusses the most common and useful quantitative and qualitative
methods that can support ACSM evaluations, from baseline assessment to impact evaluation.
Quantitative Evaluation Methods
As previously described, quantitative methods provide numerical data on behaviors and
outcomes for large samples of a defined population. The quantitative methods discussed here
include:
• Analysis of routine surveillance and NTP data.
• Analysis of program or project data.
• Population-based surveys.
• Simple surveys.
• Experimental design.
1. Analysis of routine surveillance and NTP data
A large amount of data is already available through surveillance and MOH disease reporting
systems. Sources of data include vital registration data, routine surveillance reports from
disease-specific programs, and hospital records. These data can summarize patient
demographics; diagnostic and treatment statistics; and how services are used, how
frequently, and where.
In order to determine where ACSM is most needed, a program could review existing
surveillance data from monthly, quarterly, or annual NTP reports on the burden of TB disease,
case notification, and treatment outcomes. Those sources could show:
• Number of deaths due to TB in each region in 2009.
• Prevalence of TB/HIV co-infection by age and gender.
Patient registration and treatment
data from ten TB clinics.
_______________________________
• How many patients left
treatment early.
• Average number of treatment
weeks completed.
• Percentage lost to follow-up, by
gender, ethnicity, age.
Interviews with 20 patients who
left treatment early.
_____________________________
• What they experienced during
treatment.
• Why they left treatment.
• Their ideas for improving the
treatment support system.
38
• Number of TB cases reported in 2012.
• Percentage of multidrug-resistant tuberculosis (MDR-TB) cases among new reported
cases in 2012.
Drug resistance surveillance data can also highlight the need for improved patient support
services to address the challenge of TB drug resistance related to non-adherence or other
barriers to treatment completion.
The advantage of this method is that the data are usually available and no additional data
collection effort is required. However, data quality can be a concern. At the broad regional
and national levels, data come from many sources over continuous periods of time, so data
may be incomplete, delayed, or inaccurately reported. Furthermore, in settings where the
routine surveillance system is weak or a large number of TB cases are diagnosed and treated
outside of the NTP system, this type of data analysis only provides part of the overall
epidemiological and programmatic picture. Always scrutinize surveillance data very carefully.
REAL-LIFE EXAMPLE
A district ACSM officer wants to assess trends in TB case notification over the last four quarters. She collects data from online NTP surveillance reports to determine:
• Which districts are reporting increases in sputum smear-positive case notification.
• Which district has the highest number of retreatment cases.
• Where TB/HIV co-infection is the highest. The ACSM officer soon notices that one district is steadily reporting more MDR-TB cases each quarter. In response, she recommends that district NGOs collaborate with the NTP to prioritize social mobilization to support patients through treatment in that district.
This is an example of a baseline evaluation to identify gaps or problems that could be
addressed with ACSM. The NGO/NTP partners could then use this same indicator data from
NTP surveillance reports to conduct outcome evaluation to determine the contribution of
those activities to treatment and drug resistance rates.
2. Analysis of ACSM program data
ACSM programs should collect their own output and outcome indicators on a regular basis to
determine if they are implementing the project as planned and achieving anticipated results.
At a basic technical level, this would be considered monitoring and may be the only realistic
source of quantitative data available to some local ACSM programs.
Interpreting the data and trends of a project within the context of what is happening in the
community and broader TB indicators gives program data more meaning and importance.
Linking program data with NTP data helps show how ACSM contributes to broader NTP
objectives.
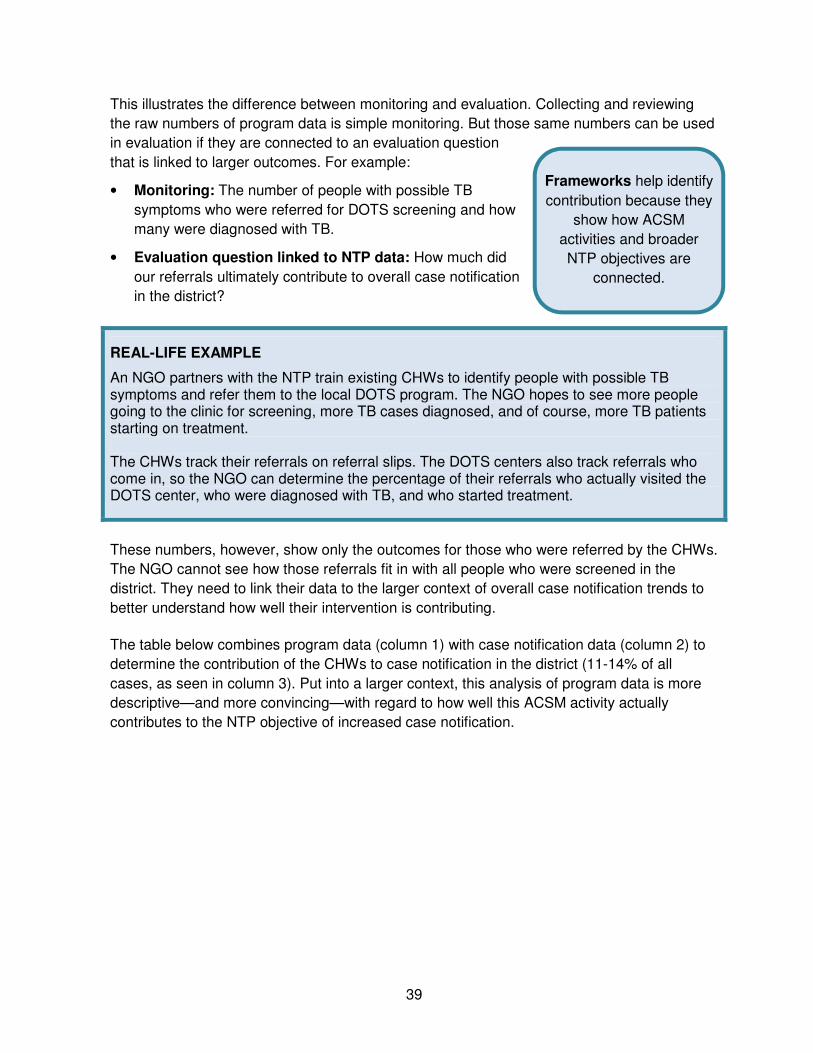
39
This illustrates the difference between monitoring and evaluation. Collecting and reviewing
the raw numbers of program data is simple monitoring. But those same numbers can be used
in evaluation if they are connected to an evaluation question
that is linked to larger outcomes. For example:
• Monitoring: The number of people with possible TB
symptoms who were referred for DOTS screening and how
many were diagnosed with TB.
• Evaluation question linked to NTP data: How much did
our referrals ultimately contribute to overall case notification
in the district?
REAL-LIFE EXAMPLE
An NGO partners with the NTP train existing CHWs to identify people with possible TB symptoms and refer them to the local DOTS program. The NGO hopes to see more people going to the clinic for screening, more TB cases diagnosed, and of course, more TB patients starting on treatment. The CHWs track their referrals on referral slips. The DOTS centers also track referrals who come in, so the NGO can determine the percentage of their referrals who actually visited the DOTS center, who were diagnosed with TB, and who started treatment.
These numbers, however, show only the outcomes for those who were referred by the CHWs.
The NGO cannot see how those referrals fit in with all people who were screened in the
district. They need to link their data to the larger context of overall case notification trends to
better understand how well their intervention is contributing.
The table below combines program data (column 1) with case notification data (column 2) to
determine the contribution of the CHWs to case notification in the district (11-14% of all
cases, as seen in column 3). Put into a larger context, this analysis of program data is more
descriptive—and more convincing—with regard to how well this ACSM activity actually
contributes to the NTP objective of increased case notification.
Frameworks help identify
contribution because they
show how ACSM
activities and broader
NTP objectives are
connected.
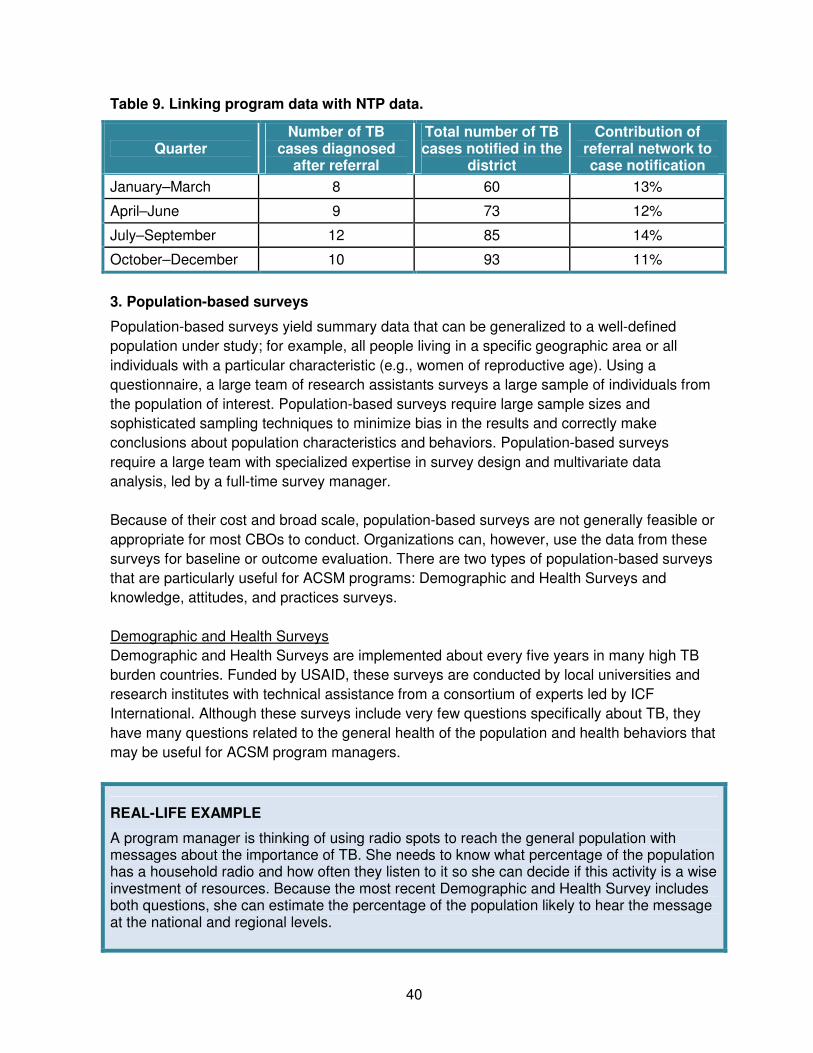
40
Table 9. Linking program data with NTP data.
Quarter Number of TB
cases diagnosed after referral
Total number of TB cases notified in the
district
Contribution of referral network to case notification
January–March 8 60 13%
April–June 9 73 12%
July–September 12 85 14%
October–December 10 93 11%
3. Population-based surveys
Population-based surveys yield summary data that can be generalized to a well-defined
population under study; for example, all people living in a specific geographic area or all
individuals with a particular characteristic (e.g., women of reproductive age). Using a
questionnaire, a large team of research assistants surveys a large sample of individuals from
the population of interest. Population-based surveys require large sample sizes and
sophisticated sampling techniques to minimize bias in the results and correctly make
conclusions about population characteristics and behaviors. Population-based surveys
require a large team with specialized expertise in survey design and multivariate data
analysis, led by a full-time survey manager.
Because of their cost and broad scale, population-based surveys are not generally feasible or
appropriate for most CBOs to conduct. Organizations can, however, use the data from these
surveys for baseline or outcome evaluation. There are two types of population-based surveys
that are particularly useful for ACSM programs: Demographic and Health Surveys and
knowledge, attitudes, and practices surveys.
Demographic and Health Surveys
Demographic and Health Surveys are implemented about every five years in many high TB
burden countries. Funded by USAID, these surveys are conducted by local universities and
research institutes with technical assistance from a consortium of experts led by ICF
International. Although these surveys include very few questions specifically about TB, they
have many questions related to the general health of the population and health behaviors that
may be useful for ACSM program managers.
REAL-LIFE EXAMPLE
A program manager is thinking of using radio spots to reach the general population with messages about the importance of TB. She needs to know what percentage of the population has a household radio and how often they listen to it so she can decide if this activity is a wise investment of resources. Because the most recent Demographic and Health Survey includes both questions, she can estimate the percentage of the population likely to hear the message at the national and regional levels.
41
ICF International and its partners create comprehensive reports with summary data for each
question, as well as datasets for further analysis. Country reports can be found on the
MEASURE DHS website.
Knowledge, attitudes, and practices surveys
A knowledge, attitudes, and practices (KAP) survey is a type of population-based survey that
captures information specifically about the beliefs and behaviors of different populations. A
KAP survey can answer many questions about a population’s knowledge about TB and TB
services, beliefs about TB, attitudes toward people who have TB, and health care practices.
These questions could include3:
• What does the population know about TB?
• What myths or misinformation are common about TB?
• What stigmas exist about TB?
• Where do people seek health care?
• What media channels does this population use?
A KAP survey involves interviews with a sample of the target population using a standard
instrument. With an appropriate sampling strategy, the results can be generalized to a larger
population. As an evaluation strategy, pre- and post-tests can be used to assess changes in
knowledge, attitudes, and practices after implementation of interventions aimed at the target
population. The findings of the KAP survey are then usually expressed quantitatively (e.g., in
numbers, totals, averages, percentages, and ranges). In general, a KAP survey has the
following characteristics:
• The survey is conducted early enough to influence the design of ACSM interventions.
Otherwise, the survey could waste resources because the results are not available in time
to support the design phase.
• The population is not already well understood or studied through other survey efforts.
Thus, there is a clear need for the survey that justifies the investment.
• The population is critical to TB control or is a particularly vulnerable group whose needs
should be considered in project design.
• There is an explicit behavioral model or a conceptual or theoretical framework that shapes
the design of the intervention (e.g., Precede/Proceed Model, Cough to Cure Pathway,
Stages of Change, Diffusion of Innovation, Communication for Behavioral Impact) and will
utilize the insights from a KAP survey.4
• The sampling strategy yields data that are generalizable to a specific population.
3 Recent Demographic and Health Surveys may also include some of these questions, so this
information may already exist. 4 For example, see: Luis SF, Kamp N, Mitchell EMH, Henriksen K, van Leth F. Health-seeking norms
for tuberculosis symptoms in southern Angola: implications for behaviour change communications. International Journal of Tuberculosis and Lung Disease. 2011;15(7):943–948. Available at: http://www.ingentaconnect.com/content/iuatld/ijtld/2011/00000015/00000007/art00015.
42
• The study takes into account the multiple influences on attitudes and behaviors. Known
confounders are treated in a statistically meaningful way (e.g., through multivariate
analysis).
• The survey instrument uses validated measures and was pre-tested and adapted before
use.
• The instrument includes items to identify respondents’ media habits, exposures, and
preferences.
KAP surveys are often used to inform the design of ACSM interventions, and many Global
Fund projects depend on KAP surveys to determine the effectiveness of ACSM. Likewise,
many NTPs have developed ACSM objectives around improving knowledge, attitudes, and
practices among symptomatic individuals and/or the general population. Thus, KAP surveys
can be a useful tool to evaluate ACSM and many countries have undertaken KAP surveys in
support of ACSM.
Despite this emphasis on KAP surveys, most CBOs (and many NTPs) do not have the
internal capacity, human resources, and financial support to properly design and implement a
KAP survey. These surveys are very expensive and require
expertise in questionnaire design, scale development, sampling,
survey implementation, interviewing techniques, and other tasks in
order to ensure unbiased, useful data.
Furthermore, changing knowledge and attitudes does not
guarantee a desired, sustainable change in practice. This is
particularly true if system or social barriers still remain. For
example, improving knowledge about the need to seek care for
chronic cough may not increase the number of people who receive
proper diagnosis and treatment (thus improving case detection and
treatment outcomes) if there is no DOTS center nearby or the
quality of clinical services is low.
The Stop TB Partnership has published A Guide to Developing Knowledge, Attitude and
Practice Surveys, comprehensive guidelines on how to conduct KAP surveys to support
ACSM projects. Any NTP or partner planning a KAP survey should review these guidelines.
4. Simple surveys
While programs may not have the resources to conduct a population-based survey, they may
be able to conduct a simple survey with a much smaller, more targeted group of people on
specific issues. This method includes the use of less sophisticated data collection tools with a
limited number of questions. Examples of simple surveys include an in-person oral survey of
tribal elders, an electronic questionnaire sent to ACSM coordinators across the country, or an
informal poll taken among random participants attending a World TB Day event.
43
These types of opinion or community surveys are a good choice to generate numbers related
to a specific sub-group of people. They are quick and less expensive to conduct than a full
KAP survey; however, because the sample size is small and the sampling methods are not
scientifically rigorous, the results cannot be reliably applied to a broader population. The
results can only be a “best guess” as to how a larger, more diverse group might respond.
REAL-LIFE EXAMPLE
PATH, an international NGO that provides technical assistance to NTPs, often provides training for ACSM managers to build capacity for planning, implementing, monitoring, and evaluating ACSM activities. To prepare for each training, the facilitation team sends a short survey to all participants to gather information on their current level of knowledge about ACSM, their job responsibilities related to ACSM, and their prior experience with the topic. The results are used to determine the needs of participants and adapt the standard curriculum accordingly. While these surveys provide very useful information on training participants and help PATH staff to tailor the training to their needs, they are not representative of all ACSM practitioners globally.
5. Experimental design
Experimental design is the most rigorous quantitative method used to evaluate program
interventions such as ACSM. The randomized controlled trial is the “gold standard” for this
method. In experimental design, individuals are randomly selected to receive an intervention
(in this case, an ACSM intervention) and their outcomes are compared to randomly selected
individuals who did not receive the intervention (the “control” group). This can measure the
impact of ACSM while controlling for other factors that could affect the outcomes of interest.
This is a very expensive method that requires specialized expertise because it is challenging
to design the methodology, particularly the sampling methods, and to control for the many
other factors that affect outcomes. This is particularly true when the intervention is nationwide
and/or targeting multiple groups of people. The World Bank has published a resource to
support impact evaluations within the context of limited funding and capacity, called
Conducting Quality Impact Evaluations Under Budget, Time and Data Constraints.
A SPECIAL NOTE ABOUT SAMPLING
Regardless of the quantitative method used for evaluation, proper sampling is critical to ensure unbiased data that are representative of the population of interest. The first step in designing a sampling strategy is to clearly define the population of interest and the most important data that will be needed from them. Do you need information on the general population, on symptomatic individuals seeking care at private facilities, or on women of reproductive age? What exactly do you want to know about them? The answers to these questions will help the evaluation team determine what sampling methodology is needed. A full discussion of sampling methodologies is beyond the scope of this guide, but online resources include:
44
• Research Methods Knowledge Base: Sampling
• MEASURE Evaluation: The PLACE Method for M&E of HIV Prevention Programs
• Cornell University: Respondent Driven Sampling
Qualitative Evaluation Methods
When designing and evaluating ACSM activities, programs often need insights on issues that
cannot be described with numbers: information such as a policymaker’s motivation to support
TB services, a primary care provider’s understanding of her role in TB diagnosis and
treatment, a patient’s opinions on quality of care, and the extent to which media advocacy
efforts can affect coverage of TB issues. These issues are not easily measured with a simple
survey. Qualitative methods such as the ones below are particularly useful to gather this type
of information for ACSM activities:
• Focus group discussions.
• In-depth interviews.
• Client exit interviews.
• Media scans.
1. Focus group discussions
A focus group discussion is a semi-structured conversation with a small group of people who
share something in common (usually members or a sub-group of a target population).
Following a question guide, a moderator asks the participants to share their opinions, insights,
thoughts, and feelings about a topic. The discussion is recorded and transcribed and then
formally analyzed with software to identify common themes, salient quotes, and consensus of
opinion.
Focus groups are particularly useful to gather formative information to help design a project,
especially when many diverse opinions are needed or time is short. They are an efficient way
to pre-test communication messages and materials. Focus groups are very adaptable to
almost any setting and topic, and they are not too expensive.
However, focus groups are not perfect evaluation methods. Although they yield very in-depth
information, the views of a handful of people may not represent the entire population of that
target group. Focus groups are also very vulnerable to bias. A few dominant participants may
talk more than others, the facilitator must make quick and independent judgments about how
to guide the conversation, and responses can be easy to misinterpret.
Appendix 2 provides more detailed guidance on how to conduct effective focus group
discussions.
45
REAL-LIFE EXAMPLE
The latest country data in Ukraine showed that 10-15% of HIV-infected individuals may have TB, while more than half of all people with AIDS die of TB. An international NGO was implementing a project to roll out DOTS to regions with the highest TB and HIV burden. To better understand attitudes toward TB services among people living with HIV/AIDS (PLWHA) and reasons for delaying TB diagnosis, project staff conducted focus group discussions with PLWHA. Focus group results demonstrated that stereotypes and misconceptions about TB prevent many PLWHA from suspecting they may have TB and from seeking effective diagnosis and care. Some of their beliefs included:
• TB treatment is expensive.
• Fever, persistent cough, and fatigue are not unusual for PLWHA, so it is not worth going to the doctor every time.
• Antiretroviral therapy activates TB bacteria.
• X-rays can seriously damage a person’s health.
• TB doctors do not know enough about HIV to treat co-infected people correctly. The data also suggested that most HIV-positive people tend to avoid going to medical institutions for as long as possible. They frequently practice self-treatment, use folk medicine, or are unable to see the type of specialist that they want. Many turn to the recommendations of friends who also have HIV. Collected data were used to develop a TB educational campaign for PLWHA, as well as a training program on TB counseling for medical providers in general health and TB facilities.
2. In-depth interviews
In-depth interviews (also called key informant interviews) are personal interviews with
individuals who have an important or unique perspective on a particular issue. The interviews
can be face to face, over the phone, or via the Internet. This method is helpful to gather
detailed information from policymakers, association leaders, opinion leaders, and those who
represent key stakeholders who may not have time to participate in a larger group or would
prefer to remain anonymous. In-depth interviews are particularly effective to collect sensitive,
personal, or confidential information, particularly from marginalized or vulnerable individuals
who may be resistant to group discussions due to confidentiality concerns.
In order to fully comprehend all sides of an issue, be sure to collect and compare a range of
opinions and perspectives from diverse stakeholders. Always ensure the confidentiality of
participants when reporting data.
46
REAL-LIFE EXAMPLE
An NGO received funding to strengthen its country’s capacity to expand the WHO-recommended TB response strategy. Essential to this effort was advocacy for political support for the WHO strategy at all levels of government and developing an appropriate legislative base to adopt global TB best practices. Project staff conducted in-depth interviews with TB policy- and decision-makers such as politicians and heads of provincial health departments, and the chief doctors of TB hospitals and primary health care facilities. In these interviews, project staff learned which TB policies should be improved, how existing laws were insufficient to integrate TB and HIV services, and what these leaders personally thought about the WHO-recommended strategy for TB. Collected information was used to design and implement an advocacy campaign among decision-makers in the government and the medical community to adopt the WHO-recommended strategy for TB at the national level.
3. Exit interviews
Exit interviews are used to measure the quality of service delivery before and after
interventions to improve clinical practices, such as an interpersonal communication and
counseling skills training. Exit interviews are borrowed from the private sector. With this
method, a trained interviewer uses a standard instrument to interview patients or clients as
they leave a facility to capture what they just experienced.
Often this includes questions to measure patient satisfaction and assess if providers are
utilizing particular skills or following protocols. This method can also be a quantitative method
if the results are expressed as counts or percentages. ACSM projects that invest significant
resources in changing provider behavior may want to consider a large-scale exit interview to
assess changes in practice.
REAL-LIFE EXAMPLE
An HIV prevention organization had an objective to improve how HIV testing was offered and conducted for TB patients. They trained 12 nurses at the local DOTS center to use more patient-centered approaches during HIV counseling and testing. One week and one month after the training, organization staff interviewed patients leaving the local DOTS center to see whether or not the nurses had adopted and used those approaches. Patients were asked:
1. What HIV prevention messages did you hear from the nurses?
2. Did you feel welcomed?
3. How were HIV testing procedures explained to you? The responses were used to assess patient satisfaction and the effectiveness of the training. The results of the interviews were summarized in a report that was shared with the nurses at a staff meeting to reinforce main themes from the training. The trainers also used the interview results to revise the content and design of the training.
47
4. Media scans
Media scans involve searching media channels for material related to a specific topic (e.g.,
TB) over a specific time period to determine how the topic is covered. A media scan can
answer questions such as:
• What are the most common messages in the media about TB?
• How often is TB discussed in the media? Is it a “hot” topic?
• Is the information about TB accurate?
• Are the messages stigmatizing?
Any media channel can be scanned, including print media (newspapers, magazines) as well
as radio and television. Within some contexts, it is increasingly
important to look at the Internet and social media if these are key
sources of information about the topic. Media scans range from
very formal, systematic efforts to less formal spot-checking of TB
content. On the formal side, the ACSM project may hire a clipping
service to identify and collect copies of all media products with TB
content and develop a scoring system to rate each product
against standard criteria for correct and non-stigmatizing
information. (When a media scan is formally conducted with a
scoring system, it can be quantitative because a very large
sample of media content is analyzed over time and evaluated
using consistent criteria.) On the less formal side, an ACSM
project manager may casually monitor coverage of TB on targeted
media channels and then provide feedback as needed to writers and producers on their
content.
Media scans are essential when working to improve media communication about TB. As a
baseline evaluation method, media scans can describe the themes and messages transmitted
by media so that incorrect or stigmatizing content can be addressed with training or other
interventions. As a process or outcome evaluation, this method can measure the effects of
outreach to the media and training of journalists to determine whether or not coverage has
improved.
Family Health International (now FHI 360) developed Qualitative Research Methods: A Data
Collector’s Field Guide to provide a comprehensive overview of a variety of qualitative
methods. It includes modules for focus group discussions and in-depth interviews.
Selecting the Right Evaluation Method
In general, there are several reasons to evaluate a project or activity. Baseline or formative
evaluation gives useful information to develop appropriate programs and tailor them
effectively to the target population. Outcome, process, or impact evaluation can determine if
ACSM activities had the expected results and contributed to key TB outcomes. If so, this

48
helps develop a set of best practices for ACSM and build evidence for the value of
ACSM. Evaluation results also help to improve programs when those results are fed back
into the project cycle. These lessons learned make programs and activities more effective or
efficient.
Choosing activities to evaluate
Rarely do programs have enough funding and staffing to conduct complete evaluations of
every ACSM activity. Since M&E resources are limited, program managers must make very
careful choices about which activities to evaluate and how. The following questions can help
programs determine which activities are priorities for evaluation:
• Is this a new activity? If the ACSM activity is completely new and/or there is little evidence
of its effectiveness, it is a good candidate for evaluation. It is important to determine if this
new activity has produced the expected results and contributed to improved case
detection and treatment outcomes.
• Is this a pilot activity that may be expanded? Before launching an activity on a regional or
national scale, programs often pilot activities as a first step to fine-tune the approach or
identify the best implementation model. The pilot approach needs good evidence of
effectiveness before it can be scaled up beyond the initial pilot site. These pilot activities
are often prioritized for evaluation.
• Have we invested significantly in this activity? ACSM activities that require a significant
investment of financial and human resources should have measurable results and clear
contributions to improved case detection and treatment outcomes to justify the
investment. The activities with the largest budget line items should be prioritized over
those that require fewer resources.
• Is something unexpected happening? Sometimes monitoring data reveal an unexpected
outcome and there is a need to explain this unanticipated result. This is true for both
positive and negative results. If the project is achieving much better results than originally
anticipated, an evaluation will help identify what specific intervention, activity, or approach
produced the result so it can be further used to benefit the project. For an unexpected
negative effect, an evaluation can help identify the problem so it can be corrected.
• Does the funder want an evaluation? Sometimes the decision to conduct an evaluation is
made by a donor as part of the overall implementation of the project. In this case, partners
should work with donors to establish a realistic evaluation strategy and agree on the key
questions to be answered by the evaluation.
Choosing Evaluation Methods
Once programs have prioritized which ACSM activities to evaluate, they must decide which
evaluation method will best generate the type of information needed. One way to do this is to
consider if the data should be quantitative or qualitative. This depends on the specific
evaluation questions that are also tied to a specific ACSM objective. Evaluation data should
always link back to the objective and attempt to provide information relevant to this objective.
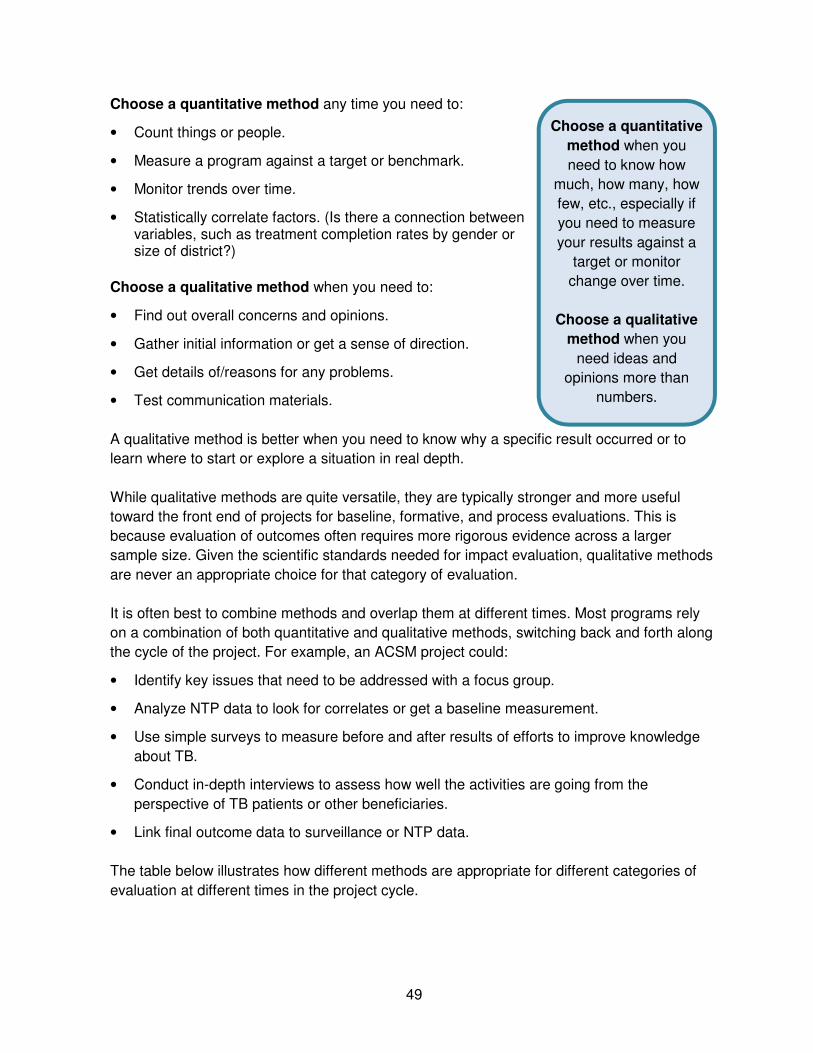
49
Choose a quantitative method any time you need to:
• Count things or people.
• Measure a program against a target or benchmark.
• Monitor trends over time.
• Statistically correlate factors. (Is there a connection between variables, such as treatment completion rates by gender or size of district?)
Choose a qualitative method when you need to:
• Find out overall concerns and opinions.
• Gather initial information or get a sense of direction.
• Get details of/reasons for any problems.
• Test communication materials.
A qualitative method is better when you need to know why a specific result occurred or to
learn where to start or explore a situation in real depth.
While qualitative methods are quite versatile, they are typically stronger and more useful
toward the front end of projects for baseline, formative, and process evaluations. This is
because evaluation of outcomes often requires more rigorous evidence across a larger
sample size. Given the scientific standards needed for impact evaluation, qualitative methods
are never an appropriate choice for that category of evaluation.
It is often best to combine methods and overlap them at different times. Most programs rely
on a combination of both quantitative and qualitative methods, switching back and forth along
the cycle of the project. For example, an ACSM project could:
• Identify key issues that need to be addressed with a focus group.
• Analyze NTP data to look for correlates or get a baseline measurement.
• Use simple surveys to measure before and after results of efforts to improve knowledge
about TB.
• Conduct in-depth interviews to assess how well the activities are going from the
perspective of TB patients or other beneficiaries.
• Link final outcome data to surveillance or NTP data.
The table below illustrates how different methods are appropriate for different categories of
evaluation at different times in the project cycle.
Choose a quantitative
method when you
need to know how
much, how many, how
few, etc., especially if
you need to measure
your results against a
target or monitor
change over time.
Choose a qualitative
method when you
need ideas and
opinions more than
numbers.
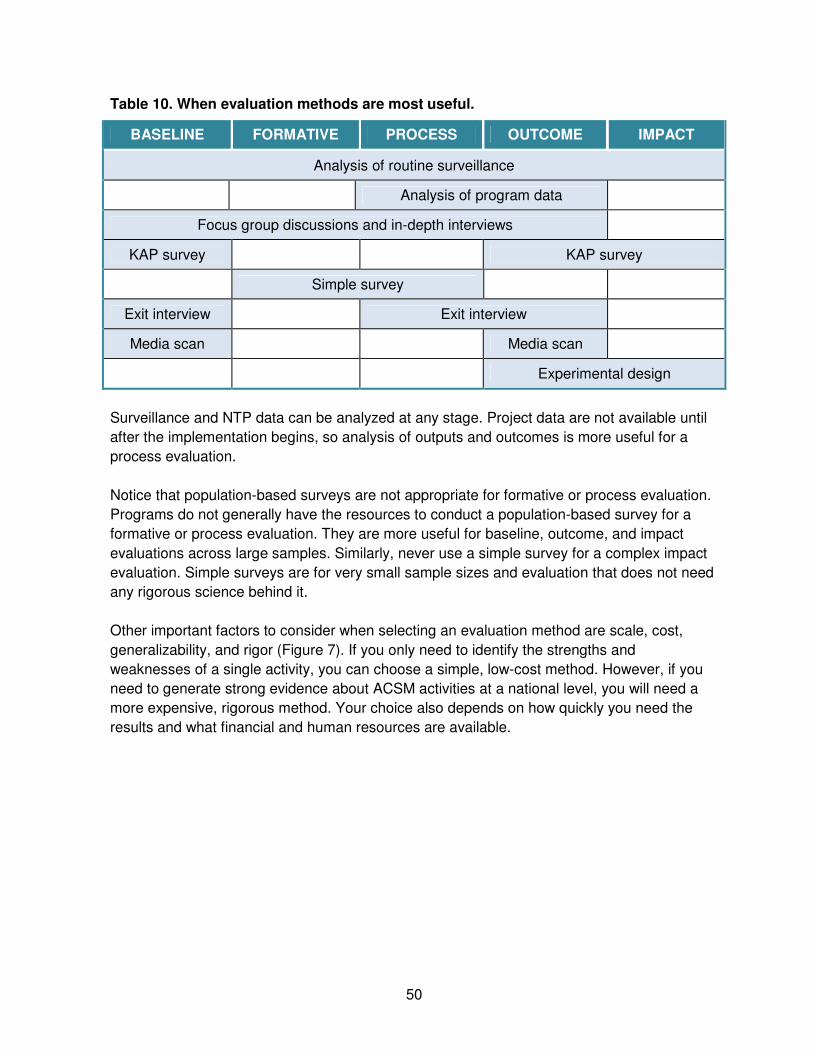
50
Table 10. When evaluation methods are most useful.
BASELINE FORMATIVE PROCESS OUTCOME IMPACT
Analysis of routine surveillance
Analysis of program data
Focus group discussions and in-depth interviews
KAP survey KAP survey
Simple survey
Exit interview Exit interview
Media scan Media scan
Experimental design
Surveillance and NTP data can be analyzed at any stage. Project data are not available until
after the implementation begins, so analysis of outputs and outcomes is more useful for a
process evaluation.
Notice that population-based surveys are not appropriate for formative or process evaluation.
Programs do not generally have the resources to conduct a population-based survey for a
formative or process evaluation. They are more useful for baseline, outcome, and impact
evaluations across large samples. Similarly, never use a simple survey for a complex impact
evaluation. Simple surveys are for very small sample sizes and evaluation that does not need
any rigorous science behind it.
Other important factors to consider when selecting an evaluation method are scale, cost,
generalizability, and rigor (Figure 7). If you only need to identify the strengths and
weaknesses of a single activity, you can choose a simple, low-cost method. However, if you
need to generate strong evidence about ACSM activities at a national level, you will need a
more expensive, rigorous method. Your choice also depends on how quickly you need the
results and what financial and human resources are available.
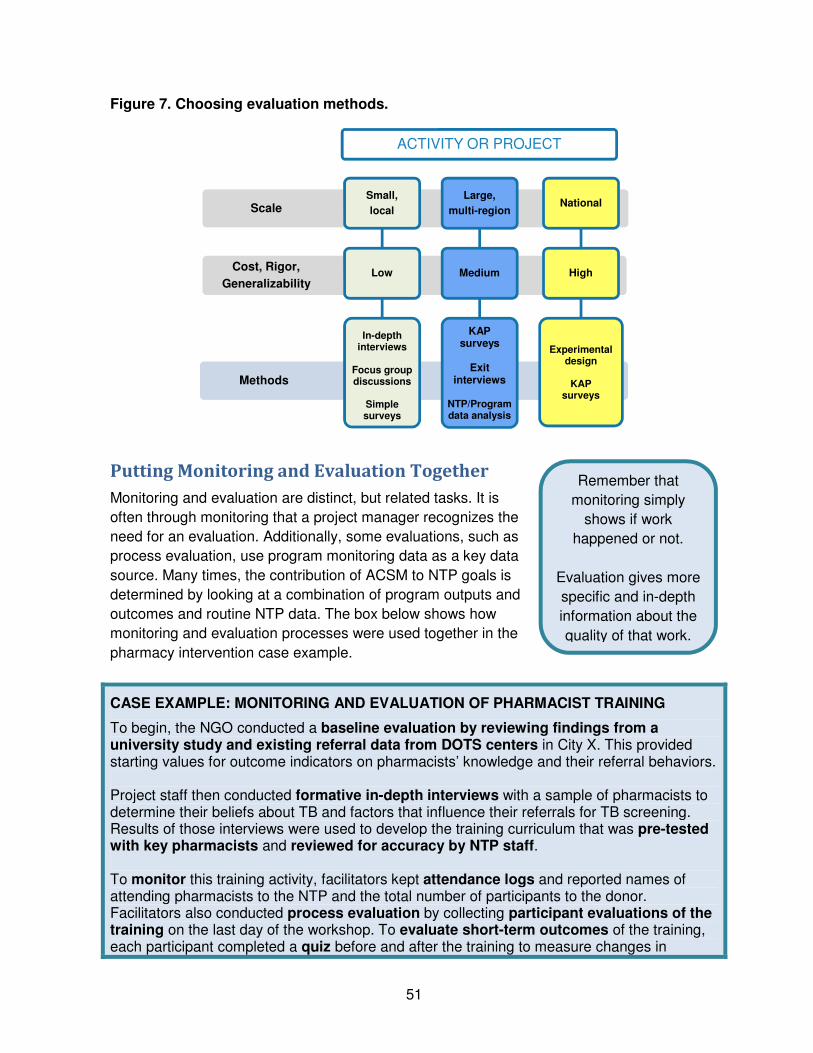
51
Figure 7. Choosing evaluation methods.
Putting Monitoring and Evaluation Together
Monitoring and evaluation are distinct, but related tasks. It is
often through monitoring that a project manager recognizes the
need for an evaluation. Additionally, some evaluations, such as
process evaluation, use program monitoring data as a key data
source. Many times, the contribution of ACSM to NTP goals is
determined by looking at a combination of program outputs and
outcomes and routine NTP data. The box below shows how
monitoring and evaluation processes were used together in the
pharmacy intervention case example.
CASE EXAMPLE: MONITORING AND EVALUATION OF PHARMACIST TRAINING
To begin, the NGO conducted a baseline evaluation by reviewing findings from a university study and existing referral data from DOTS centers in City X. This provided starting values for outcome indicators on pharmacists’ knowledge and their referral behaviors. Project staff then conducted formative in-depth interviews with a sample of pharmacists to determine their beliefs about TB and factors that influence their referrals for TB screening. Results of those interviews were used to develop the training curriculum that was pre-tested with key pharmacists and reviewed for accuracy by NTP staff. To monitor this training activity, facilitators kept attendance logs and reported names of attending pharmacists to the NTP and the total number of participants to the donor. Facilitators also conducted process evaluation by collecting participant evaluations of the training on the last day of the workshop. To evaluate short-term outcomes of the training, each participant completed a quiz before and after the training to measure changes in
Methods
Cost, Rigor,
Generalizability
Scale
fdfd ACTIVITY OR PROJECT
Small,
local
Low
In-depthinterviews
Focus group discussions
Simplesurveys
Large,
multi-region
Medium
KAP surveys
Exit interviews
NTP/Program data analysis
National
High
Experimental design
KAPsurveys
Remember that
monitoring simply
shows if work
happened or not.
Evaluation gives more
specific and in-depth
information about the
quality of that work.
52
pharmacists’ knowledge about TB and attitudes about referring customers for DOTS screening. After the training, project staff monitored referral activity by collecting and reviewing referral records each month from trained pharmacists. They compared these records with referral data collected monthly from the DOTS centers to evaluate if the training resulted in a medium-term increase in DOTS referrals. To evaluate the process of pharmacist referrals, the project manager conducted a telephone survey with 20% of the trained pharmacists (randomly selected) three months after the training to assess their opinions about how the referral scheme was working. The project manager recorded results of each survey in a database to monitor the progress of the surveys and later analyzed the results for a written report to the NTP and donor. Six months after the trainings, staff analyzed NTP records from the City X DOTS center to determine if these referrals contributed to any longer-term increase in case detection.

53
PART 4: Practical Considerations in Monitoring and
Evaluation
M&E Budgets
The M&E plan should always include a detailed budget for costs
associated with routine monitoring activities and periodic
evaluation efforts. The size of the budget depends on the scope of
the project and the number of monitoring and evaluation activities
planned.
Always consider the items in the following table when creating a
budget for monitoring.
Table 11. Common monitoring costs.
Salaries Full- or part-time M&E officer, ACSM officer, or other project staff responsible for M&E or quality assurance.
Training Expenses of training events to orient all relevant staff to data collection tools, project database, and reporting requirements (on-the-job training activity, multi-day training, etc.).
Routine data collection
Travel, per diem, and staff time for routine site visits to collect data (try to cost-share with supervision visits).
Data management and analysis
Creating or modifying the paper-based system or electronic database; new computer software and training; salary support for data entry and analysis.
Report preparation and dissemination
Staff time needed to write results and recommendations based on routine M&E reporting intervals set by donor; printing and postage to mail reports; travel and per diem for dissemination meetings and events.
Materials Designing and printing data collection tools and other materials.
Although evaluation costs will vary greatly by project, consider the following items for any
evaluation regardless of its scope:
• Salary support for an M&E or research officer, ACSM officer, or program manager who
will oversee evaluation, plus any field supervisors, research assistants, and/or
interviewers.
• Salary for database design, data entry, and data analysis.
• Special computers, software packages, tape recorders, or other technology.
Many donors,
including the Global
Fund, recommend
dedicating at least
10% of a project’s
budget to M&E
activities.
54
• Training and other capacity-building activities (e.g., supportive supervision). This might
include tuition for courses in operations research, social sciences, or other relevant
research skills through local universities or regional academic centers.
• Subcontracts to local research institutions or technical agencies. If the project or NTP
does not yet have internal expertise in sampling, questionnaire design, data management,
or data analysis, it can be helpful to collaborate with local partners to cover these key
tasks.
• Incentives for evaluation participants, if appropriate or necessary.
• Miscellaneous supplies needed for evaluation activities such as mobile phones,
notebooks, and backpacks.
• Travel costs such as transport to sites, per diem, lodging, and fuel (especially important
when conducting population-based surveys).
• Production of print materials such as questionnaires, field manuals, and brochures.
• Production and dissemination of final evaluation reports (via hard copy or Internet, and/or
submissions to conferences or technical meetings). Always plan to broadly disseminate
impact evaluation results so the global ACSM community can learn from the findings.
The scale of interventions is a key factor in determining the level of resources devoted to
M&E. For local ACSM interventions with very few resources, simple monitoring procedures
and supportive supervision may be the most appropriate mix of M&E activities. Conversely, a
high-budget activity of regional or national scale should include more robust M&E activities. A
rigorous impact evaluation to generate evidence of ACSM’s effectiveness and contribution to
NTP objectives would clearly justify a significant investment of resources, especially if the
ACSM intervention is new.
Real-World Challenges of M&E
Despite all of the M&E trainings, best practice guidelines, and technical resources that are
available, program managers still face numerous practical M&E challenges. Within the real-
life context of implementing M&E, there simply may not be enough funding, staff, time, or
political will to support all of the M&E activities a program wants to implement. Program
managers must often make difficult choices about how to invest their scarce resources—and
think creatively to find solutions.
Below is a list of challenges frequently faced by ACSM implementers, along with some
practical, field-tested ideas to overcome them.
Challenge: No baseline data for an evaluation
• Infer baseline status from a secondary source (e.g., Demographic and Health Survey with
TB content or annual NTP report).
• Identify a comparison group and use differences between the two to estimate the effectiveness of the ACSM intervention.
55
Challenge: Not enough money for a comprehensive evaluation
• Simplify the design. For example, if the original design were an expensive randomized
controlled trial, use a post-test−only design with a comparison group.
• Use existing data (e.g., program reviews) or a historical comparison group instead of
collecting new data.
• Reduce the sample size and accept a greater degree of uncertainty in the findings.
• Reduce the costs of data collection and analysis. Limit the analysis to simple quantitative
measures and validated scales. Avoid testing new scales for which reliability is unknown.
Challenge: Little time to complete a comprehensive evaluation
• Consider rapid data collection methods (e.g., focus group discussions).
• Hire more staff on a temporary basis.
• Use an existing data source, such as a routine report.
• Reduce the sample size and accept a greater degree of uncertainty in the findings.
Challenge: Weak political will to support comprehensive evaluation
• Engage stakeholders in the process to lower resistance (e.g., use stakeholder analysis
and/or participatory evaluation methods).
• Secure access to data before starting the evaluation (during the planning process).
• Establish a dissemination plan in advance to address concerns about transparency in
sharing the findings.
Taking M&E to the Next Level
All ACSM programs should aim to improve the quality and rigor of their M&E efforts, even
where resources are limited to support M&E. In fact, this is a perfect example of how
programs may need to conduct advocacy work to leverage more money, staff, and technical
expertise to conduct stronger M&E so they can obtain better data to advocate more
persuasively for even more ACSM and TB funding.
Every TB program, from small, community-based treatment support projects to national-level
TB education campaigns, can improve M&E efforts for ACSM. Linking activities to outputs
and even further to outcomes can often be done without extra data collection efforts and by
making better use of routine program and project data. Interventions can be strengthened at
the design phase with simple formative evaluation. Process evaluations can use a mix of data
collection methods to assess effectiveness that will yield valuable lessons for other ACSM
projects.
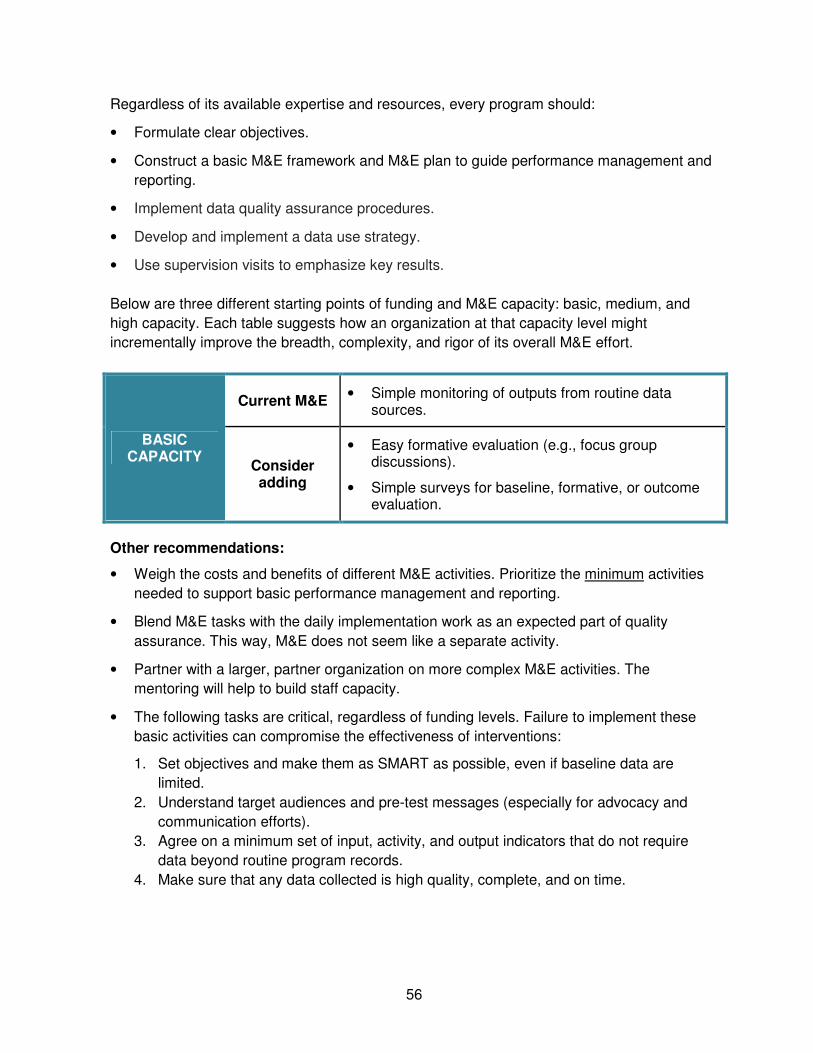
56
Regardless of its available expertise and resources, every program should:
• Formulate clear objectives.
• Construct a basic M&E framework and M&E plan to guide performance management and
reporting.
• Implement data quality assurance procedures.
• Develop and implement a data use strategy.
• Use supervision visits to emphasize key results.
Below are three different starting points of funding and M&E capacity: basic, medium, and
high capacity. Each table suggests how an organization at that capacity level might
incrementally improve the breadth, complexity, and rigor of its overall M&E effort.
BASIC CAPACITY
Current M&E • Simple monitoring of outputs from routine data
sources.
Consider adding
• Easy formative evaluation (e.g., focus group discussions).
• Simple surveys for baseline, formative, or outcome evaluation.
Other recommendations:
• Weigh the costs and benefits of different M&E activities. Prioritize the minimum activities
needed to support basic performance management and reporting.
• Blend M&E tasks with the daily implementation work as an expected part of quality
assurance. This way, M&E does not seem like a separate activity.
• Partner with a larger, partner organization on more complex M&E activities. The
mentoring will help to build staff capacity.
• The following tasks are critical, regardless of funding levels. Failure to implement these
basic activities can compromise the effectiveness of interventions:
1. Set objectives and make them as SMART as possible, even if baseline data are
limited.
2. Understand target audiences and pre-test messages (especially for advocacy and
communication efforts).
3. Agree on a minimum set of input, activity, and output indicators that do not require
data beyond routine program records.
4. Make sure that any data collected is high quality, complete, and on time.
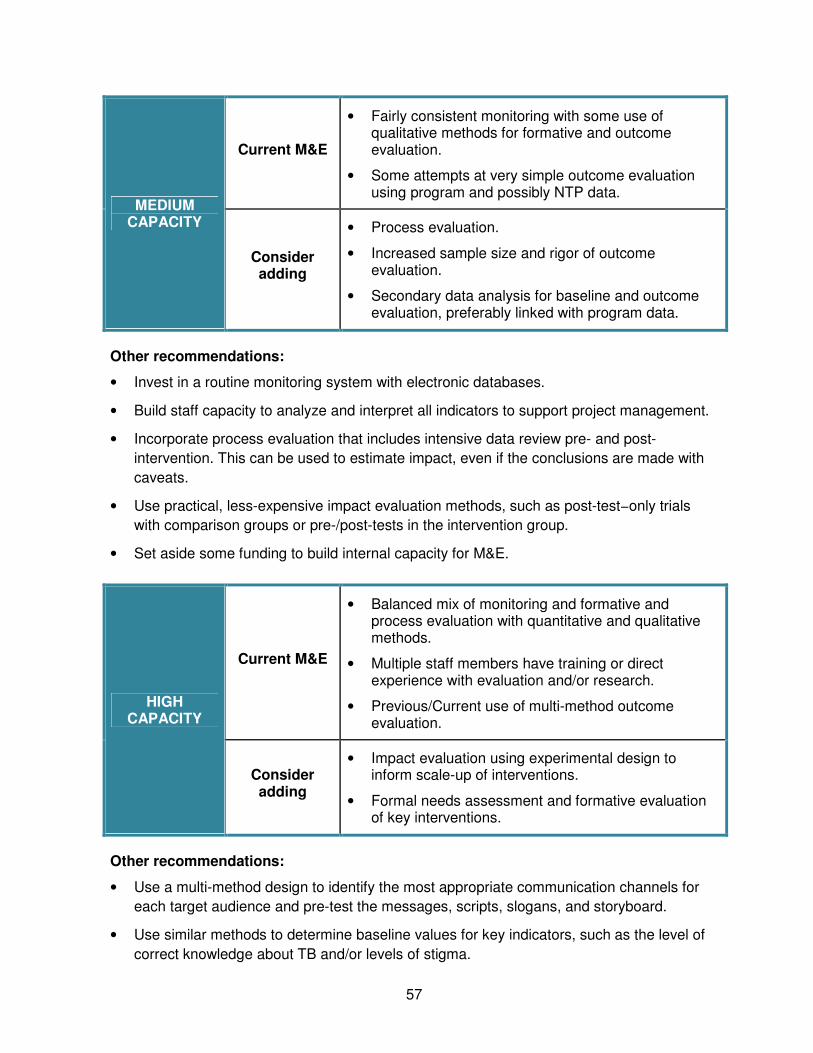
57
MEDIUM CAPACITY
Current M&E
• Fairly consistent monitoring with some use of qualitative methods for formative and outcome evaluation.
• Some attempts at very simple outcome evaluation using program and possibly NTP data.
Consider adding
• Process evaluation.
• Increased sample size and rigor of outcome evaluation.
• Secondary data analysis for baseline and outcome evaluation, preferably linked with program data.
Other recommendations:
• Invest in a routine monitoring system with electronic databases.
• Build staff capacity to analyze and interpret all indicators to support project management.
• Incorporate process evaluation that includes intensive data review pre- and post-
intervention. This can be used to estimate impact, even if the conclusions are made with
caveats.
• Use practical, less-expensive impact evaluation methods, such as post-test−only trials
with comparison groups or pre-/post-tests in the intervention group.
• Set aside some funding to build internal capacity for M&E.
HIGH CAPACITY
Current M&E
• Balanced mix of monitoring and formative and process evaluation with quantitative and qualitative methods.
• Multiple staff members have training or direct experience with evaluation and/or research.
• Previous/Current use of multi-method outcome evaluation.
Consider adding
• Impact evaluation using experimental design to inform scale-up of interventions.
• Formal needs assessment and formative evaluation of key interventions.
Other recommendations:
• Use a multi-method design to identify the most appropriate communication channels for
each target audience and pre-test the messages, scripts, slogans, and storyboard.
• Use similar methods to determine baseline values for key indicators, such as the level of
correct knowledge about TB and/or levels of stigma.
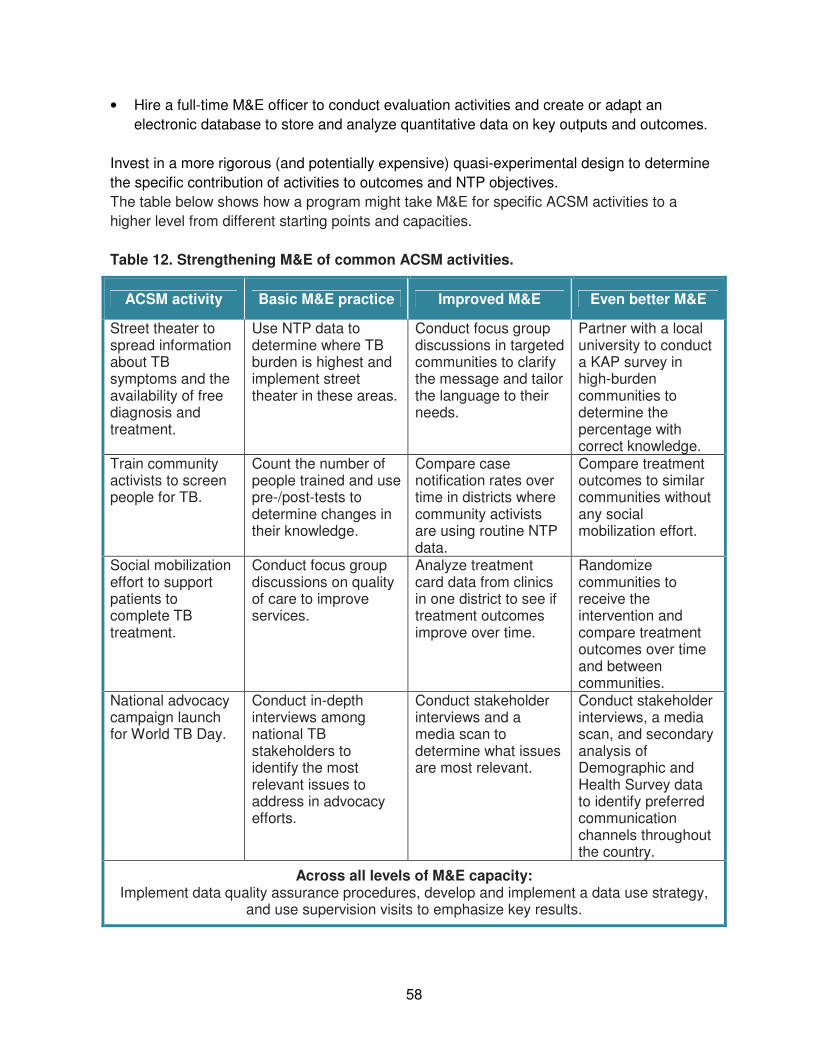
58
• Hire a full-time M&E officer to conduct evaluation activities and create or adapt an
electronic database to store and analyze quantitative data on key outputs and outcomes.
Invest in a more rigorous (and potentially expensive) quasi-experimental design to determine
the specific contribution of activities to outcomes and NTP objectives.
The table below shows how a program might take M&E for specific ACSM activities to a
higher level from different starting points and capacities.
Table 12. Strengthening M&E of common ACSM activities.
ACSM activity Basic M&E practice Improved M&E Even better M&E
Street theater to spread information about TB symptoms and the availability of free diagnosis and treatment.
Use NTP data to determine where TB burden is highest and implement street theater in these areas.
Conduct focus group discussions in targeted communities to clarify the message and tailor the language to their needs.
Partner with a local university to conduct a KAP survey in high-burden communities to determine the percentage with correct knowledge.
Train community activists to screen people for TB.
Count the number of people trained and use pre-/post-tests to determine changes in their knowledge.
Compare case notification rates over time in districts where community activists are using routine NTP data.
Compare treatment outcomes to similar communities without any social mobilization effort.
Social mobilization effort to support patients to complete TB treatment.
Conduct focus group discussions on quality of care to improve services.
Analyze treatment card data from clinics in one district to see if treatment outcomes improve over time.
Randomize communities to receive the intervention and compare treatment outcomes over time and between communities.
National advocacy campaign launch for World TB Day.
Conduct in-depth interviews among national TB stakeholders to identify the most relevant issues to address in advocacy efforts.
Conduct stakeholder interviews and a media scan to determine what issues are most relevant.
Conduct stakeholder interviews, a media scan, and secondary analysis of Demographic and Health Survey data to identify preferred communication channels throughout the country.
Across all levels of M&E capacity: Implement data quality assurance procedures, develop and implement a data use strategy,
and use supervision visits to emphasize key results.
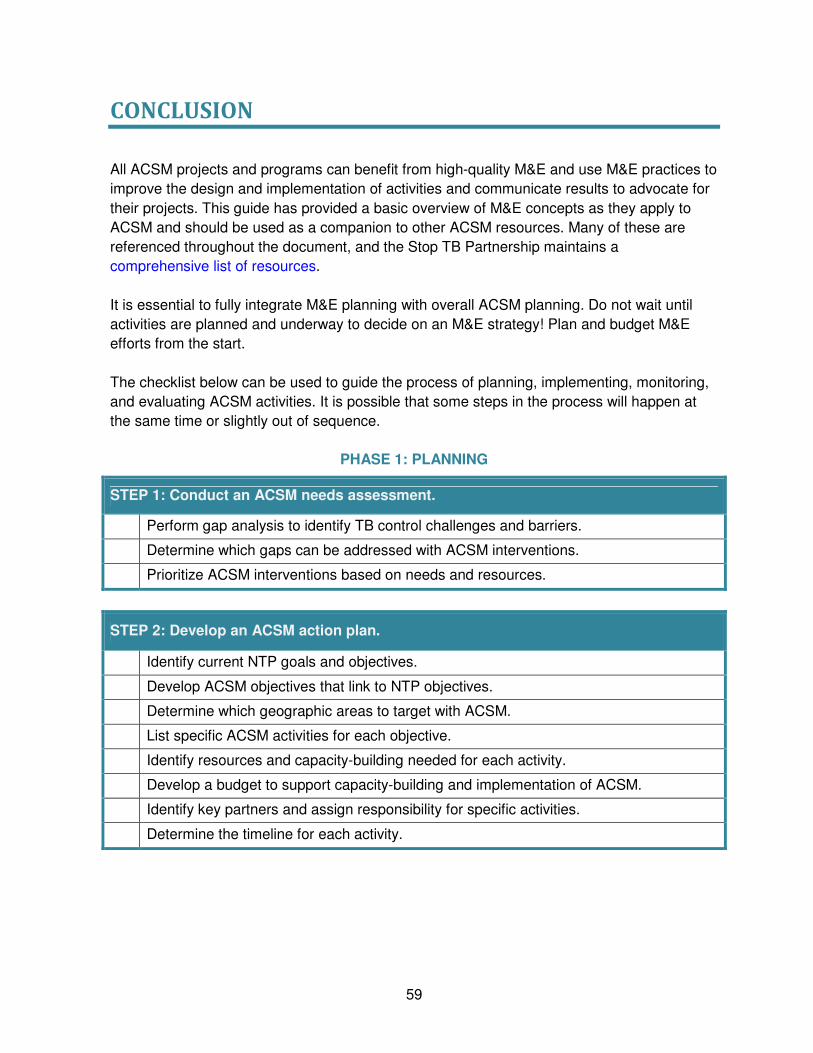
59
CONCLUSION
All ACSM projects and programs can benefit from high-quality M&E and use M&E practices to
improve the design and implementation of activities and communicate results to advocate for
their projects. This guide has provided a basic overview of M&E concepts as they apply to
ACSM and should be used as a companion to other ACSM resources. Many of these are
referenced throughout the document, and the Stop TB Partnership maintains a
comprehensive list of resources.
It is essential to fully integrate M&E planning with overall ACSM planning. Do not wait until
activities are planned and underway to decide on an M&E strategy! Plan and budget M&E
efforts from the start.
The checklist below can be used to guide the process of planning, implementing, monitoring,
and evaluating ACSM activities. It is possible that some steps in the process will happen at
the same time or slightly out of sequence.
PHASE 1: PLANNING
STEP 1: Conduct an ACSM needs assessment.
Perform gap analysis to identify TB control challenges and barriers.
Determine which gaps can be addressed with ACSM interventions.
Prioritize ACSM interventions based on needs and resources.
STEP 2: Develop an ACSM action plan.
Identify current NTP goals and objectives.
Develop ACSM objectives that link to NTP objectives.
Determine which geographic areas to target with ACSM.
List specific ACSM activities for each objective.
Identify resources and capacity-building needed for each activity.
Develop a budget to support capacity-building and implementation of ACSM.
Identify key partners and assign responsibility for specific activities.
Determine the timeline for each activity.
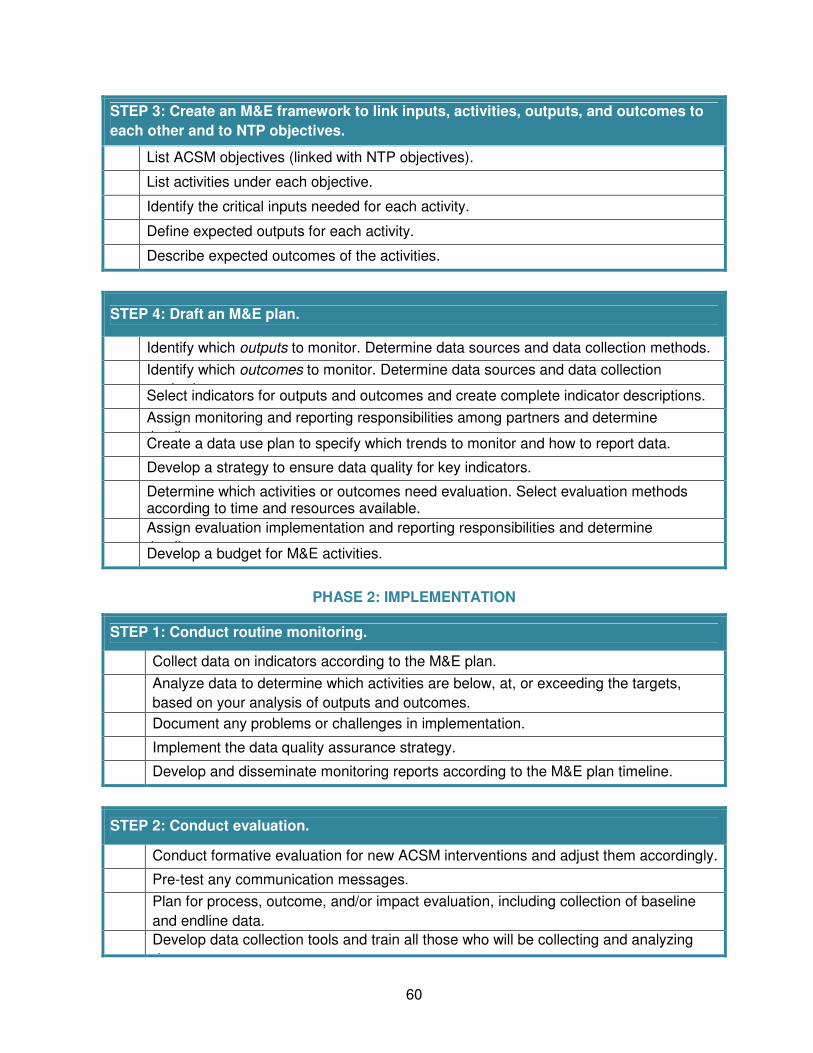
60
STEP 3: Create an M&E framework to link inputs, activities, outputs, and outcomes to
each other and to NTP objectives.
List ACSM objectives (linked with NTP objectives).
List activities under each objective.
Identify the critical inputs needed for each activity.
Define expected outputs for each activity.
Describe expected outcomes of the activities.
STEP 4: Draft an M&E plan.
Identify which outputs to monitor. Determine data sources and data collection methods.
Identify which outcomes to monitor. Determine data sources and data collection
methods. Select indicators for outputs and outcomes and create complete indicator descriptions.
Assign monitoring and reporting responsibilities among partners and determine
timelines. Create a data use plan to specify which trends to monitor and how to report data.
Develop a strategy to ensure data quality for key indicators.
Determine which activities or outcomes need evaluation. Select evaluation methods according to time and resources available.
Assign evaluation implementation and reporting responsibilities and determine
timelines. Develop a budget for M&E activities.
PHASE 2: IMPLEMENTATION
STEP 1: Conduct routine monitoring.
Collect data on indicators according to the M&E plan.
Analyze data to determine which activities are below, at, or exceeding the targets,
based on your analysis of outputs and outcomes.
Document any problems or challenges in implementation.
Implement the data quality assurance strategy.
Develop and disseminate monitoring reports according to the M&E plan timeline.
STEP 2: Conduct evaluation.
Conduct formative evaluation for new ACSM interventions and adjust them accordingly.
Pre-test any communication messages.
Plan for process, outcome, and/or impact evaluation, including collection of baseline
and endline data.
Develop data collection tools and train all those who will be collecting and analyzing
data.
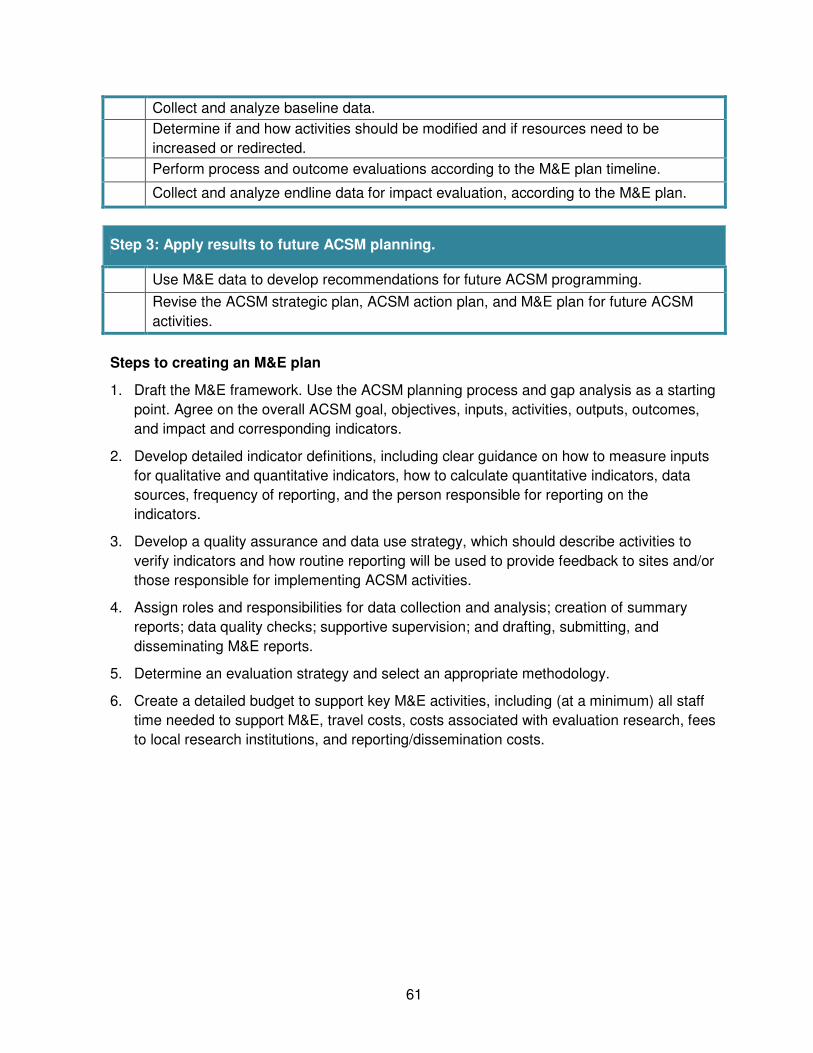
61
Collect and analyze baseline data.
Determine if and how activities should be modified and if resources need to be
increased or redirected.
Perform process and outcome evaluations according to the M&E plan timeline.
Collect and analyze endline data for impact evaluation, according to the M&E plan.
Step 3: Apply results to future ACSM planning.
Use M&E data to develop recommendations for future ACSM programming.
Revise the ACSM strategic plan, ACSM action plan, and M&E plan for future ACSM
activities.
Steps to creating an M&E plan
1. Draft the M&E framework. Use the ACSM planning process and gap analysis as a starting
point. Agree on the overall ACSM goal, objectives, inputs, activities, outputs, outcomes,
and impact and corresponding indicators.
2. Develop detailed indicator definitions, including clear guidance on how to measure inputs
for qualitative and quantitative indicators, how to calculate quantitative indicators, data
sources, frequency of reporting, and the person responsible for reporting on the
indicators.
3. Develop a quality assurance and data use strategy, which should describe activities to
verify indicators and how routine reporting will be used to provide feedback to sites and/or
those responsible for implementing ACSM activities.
4. Assign roles and responsibilities for data collection and analysis; creation of summary
reports; data quality checks; supportive supervision; and drafting, submitting, and
disseminating M&E reports.
5. Determine an evaluation strategy and select an appropriate methodology.
6. Create a detailed budget to support key M&E activities, including (at a minimum) all staff
time needed to support M&E, travel costs, costs associated with evaluation research, fees
to local research institutions, and reporting/dissemination costs.
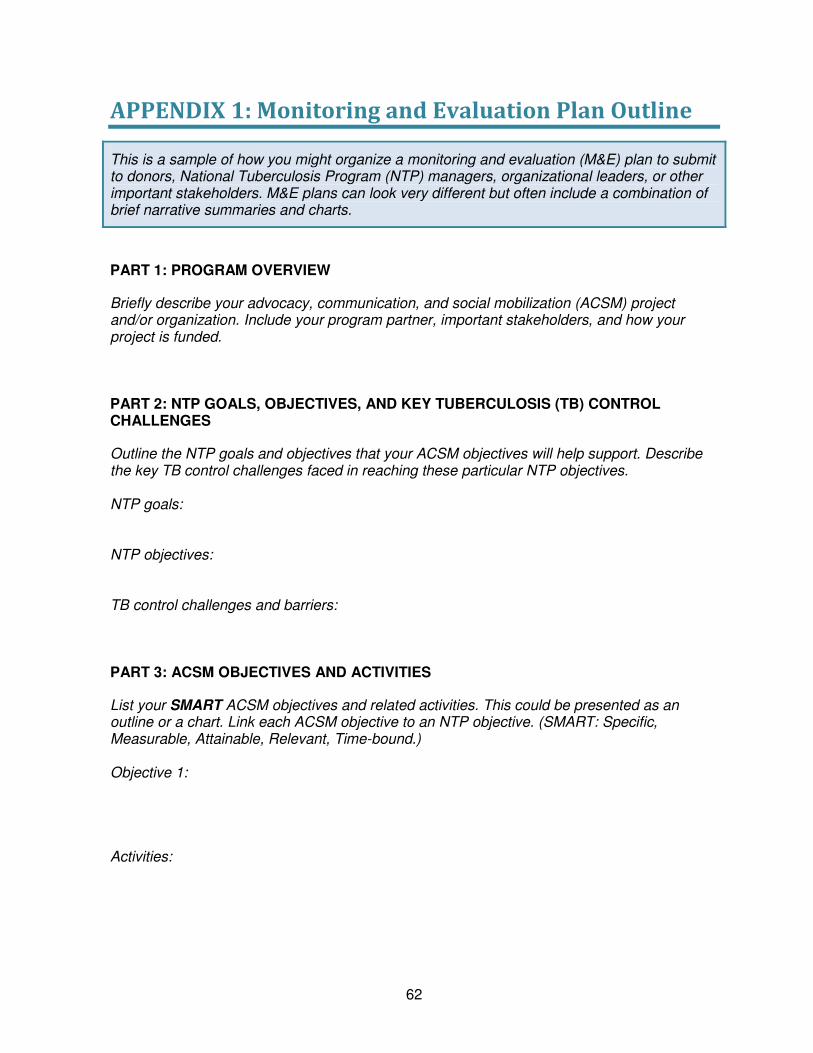
62
APPENDIX 1: Monitoring and Evaluation Plan Outline
This is a sample of how you might organize a monitoring and evaluation (M&E) plan to submit to donors, National Tuberculosis Program (NTP) managers, organizational leaders, or other important stakeholders. M&E plans can look very different but often include a combination of brief narrative summaries and charts.
PART 1: PROGRAM OVERVIEW
Briefly describe your advocacy, communication, and social mobilization (ACSM) project and/or organization. Include your program partner, important stakeholders, and how your project is funded. PART 2: NTP GOALS, OBJECTIVES, AND KEY TUBERCULOSIS (TB) CONTROL CHALLENGES
Outline the NTP goals and objectives that your ACSM objectives will help support. Describe the key TB control challenges faced in reaching these particular NTP objectives. NTP goals: NTP objectives: TB control challenges and barriers: PART 3: ACSM OBJECTIVES AND ACTIVITIES
List your SMART ACSM objectives and related activities. This could be presented as an outline or a chart. Link each ACSM objective to an NTP objective. (SMART: Specific, Measurable, Attainable, Relevant, Time-bound.) Objective 1: Activities:

63
PART 4: MONITORING AND EVALUATION MATRIX Provide a chart that shows your plan and schedule to collect and report monitoring data and how you will evaluate your objectives (and at what stage of the project).
NTP GOAL
NTP Objective
ACSM Objective
Expected Outcomes
• Indicators
ACSM Activity Outputs/Indicators Data Source Frequency Reporting
Responsibility
Evaluation Summary
Evaluation Type: Purpose: Method: When:

64
PART 5: DATA USE AND DATA QUALITY
Summarize how different data will be shared and how the data will be used by your organization. How will your organization review and ultimately use these data? How will you ensure the quality of your data? Include the organizations with which you will share results, when, and in what formats or methods.

65
APPENDIX 2: Guide to Effective Focus Group Discussions
Steps to develop a focus group discussion guide
1. Assemble the project team, the moderator, and key research or program management
personnel.
2. Discuss what kinds of decisions/actions will be taken based on the focus group findings.
3. Agree on the specific objectives and information needs of the research.
4. The team leader should brief the other researchers about prior research findings, important
issues, hypotheses, and opinions that exist.
5. Determine what background information is needed from respondents in order to evaluate
their comments during the group.
6. Prepare a list of topic areas which move from general, unthreatening issues to specific
topics of interest.
7. Prepare a list of questions for each major topic area.
8. Prepare probing questions to use if the important information does not emerge
spontaneously.
9. Prepare transition approaches to help move to a new topic or introduce stimulus materials.
10. Prepare a different discussion guide on the same topic for each different target population
being studied.
11. Review the guide and eliminate any non-essential topic areas, “dead-end” questions, or
quantitative-type questions. Estimate how much time each topic will need based on its
priority and complexity.
12. Sleep on it and review the guide again with “fresh eyes” before a final agreement.
Principles of question design
How you state questions can make a big difference in the responses you receive. When
developing your discussion guide, check the questions against the following principles of
question design. You can also use this list to evaluate the flow of the discussion:
• Use open-ended questions to solicit longer, more thoughtful responses.
Example: “What have you heard about tuberculosis?”
• After a participant response, ask a probing question to help you understand the
answer or to get more information.
Example: “You said X. Tell me, what makes you feel that way?”
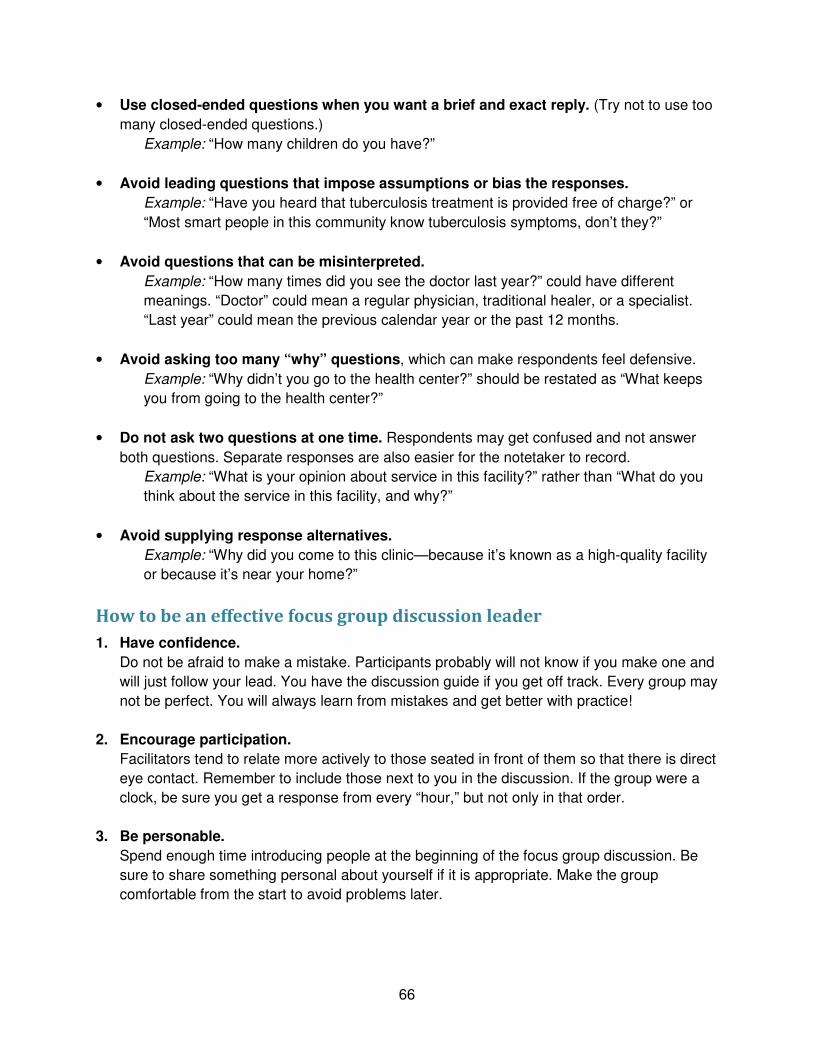
66
• Use closed-ended questions when you want a brief and exact reply. (Try not to use too
many closed-ended questions.)
Example: “How many children do you have?”
• Avoid leading questions that impose assumptions or bias the responses.
Example: “Have you heard that tuberculosis treatment is provided free of charge?” or
“Most smart people in this community know tuberculosis symptoms, don’t they?”
• Avoid questions that can be misinterpreted.
Example: “How many times did you see the doctor last year?” could have different
meanings. “Doctor” could mean a regular physician, traditional healer, or a specialist.
“Last year” could mean the previous calendar year or the past 12 months.
• Avoid asking too many “why” questions, which can make respondents feel defensive.
Example: “Why didn’t you go to the health center?” should be restated as “What keeps
you from going to the health center?”
• Do not ask two questions at one time. Respondents may get confused and not answer
both questions. Separate responses are also easier for the notetaker to record.
Example: “What is your opinion about service in this facility?” rather than “What do you
think about the service in this facility, and why?”
• Avoid supplying response alternatives.
Example: “Why did you come to this clinic—because it’s known as a high-quality facility
or because it’s near your home?”
How to be an effective focus group discussion leader
1. Have confidence.
Do not be afraid to make a mistake. Participants probably will not know if you make one and
will just follow your lead. You have the discussion guide if you get off track. Every group may
not be perfect. You will always learn from mistakes and get better with practice!
2. Encourage participation.
Facilitators tend to relate more actively to those seated in front of them so that there is direct
eye contact. Remember to include those next to you in the discussion. If the group were a
clock, be sure you get a response from every “hour,” but not only in that order.
3. Be personable.
Spend enough time introducing people at the beginning of the focus group discussion. Be
sure to share something personal about yourself if it is appropriate. Make the group
comfortable from the start to avoid problems later.
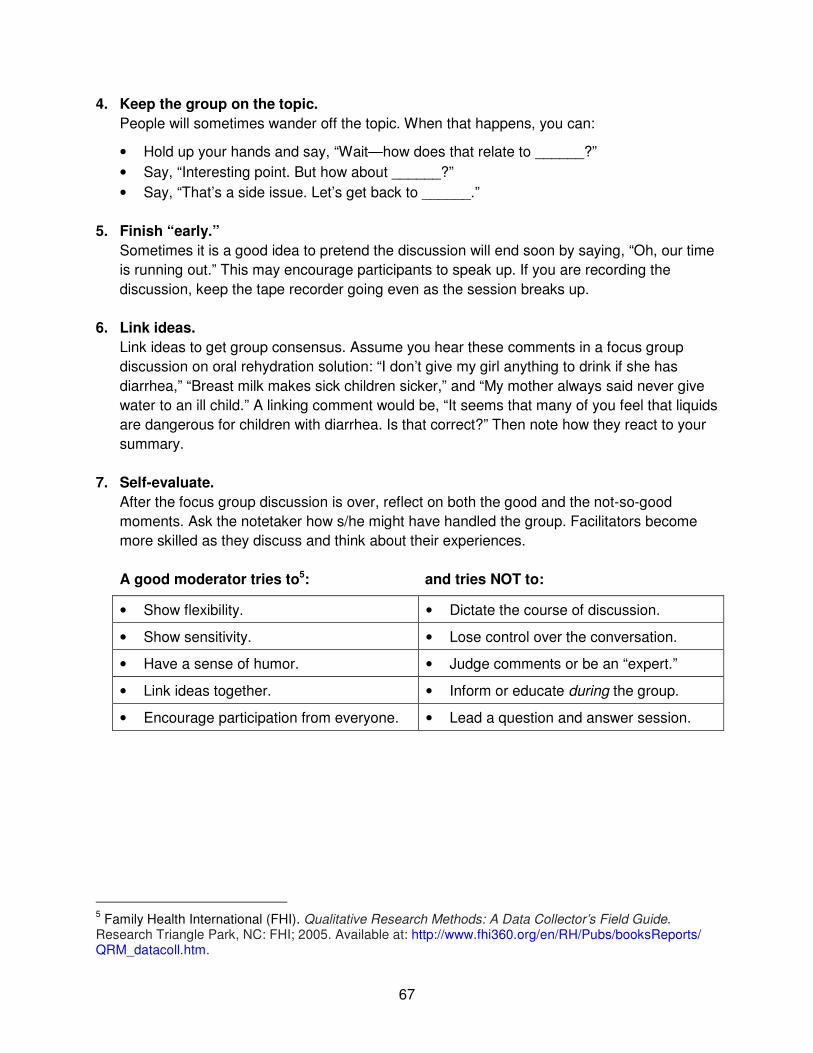
67
4. Keep the group on the topic.
People will sometimes wander off the topic. When that happens, you can:
• Hold up your hands and say, “Wait—how does that relate to ______?”
• Say, “Interesting point. But how about ______?”
• Say, “That’s a side issue. Let’s get back to ______.”
5. Finish “early.”
Sometimes it is a good idea to pretend the discussion will end soon by saying, “Oh, our time
is running out.” This may encourage participants to speak up. If you are recording the
discussion, keep the tape recorder going even as the session breaks up.
6. Link ideas.
Link ideas to get group consensus. Assume you hear these comments in a focus group
discussion on oral rehydration solution: “I don’t give my girl anything to drink if she has
diarrhea,” “Breast milk makes sick children sicker,” and “My mother always said never give
water to an ill child.” A linking comment would be, “It seems that many of you feel that liquids
are dangerous for children with diarrhea. Is that correct?” Then note how they react to your
summary.
7. Self-evaluate.
After the focus group discussion is over, reflect on both the good and the not-so-good
moments. Ask the notetaker how s/he might have handled the group. Facilitators become
more skilled as they discuss and think about their experiences.
A good moderator tries to5: and tries NOT to:
• Show flexibility. • Dictate the course of discussion.
• Show sensitivity. • Lose control over the conversation.
• Have a sense of humor. • Judge comments or be an “expert.”
• Link ideas together. • Inform or educate during the group.
• Encourage participation from everyone. • Lead a question and answer session.
5 Family Health International (FHI). Qualitative Research Methods: A Data Collector’s Field Guide.
Research Triangle Park, NC: FHI; 2005. Available at: http://www.fhi360.org/en/RH/Pubs/booksReports/ QRM_datacoll.htm.
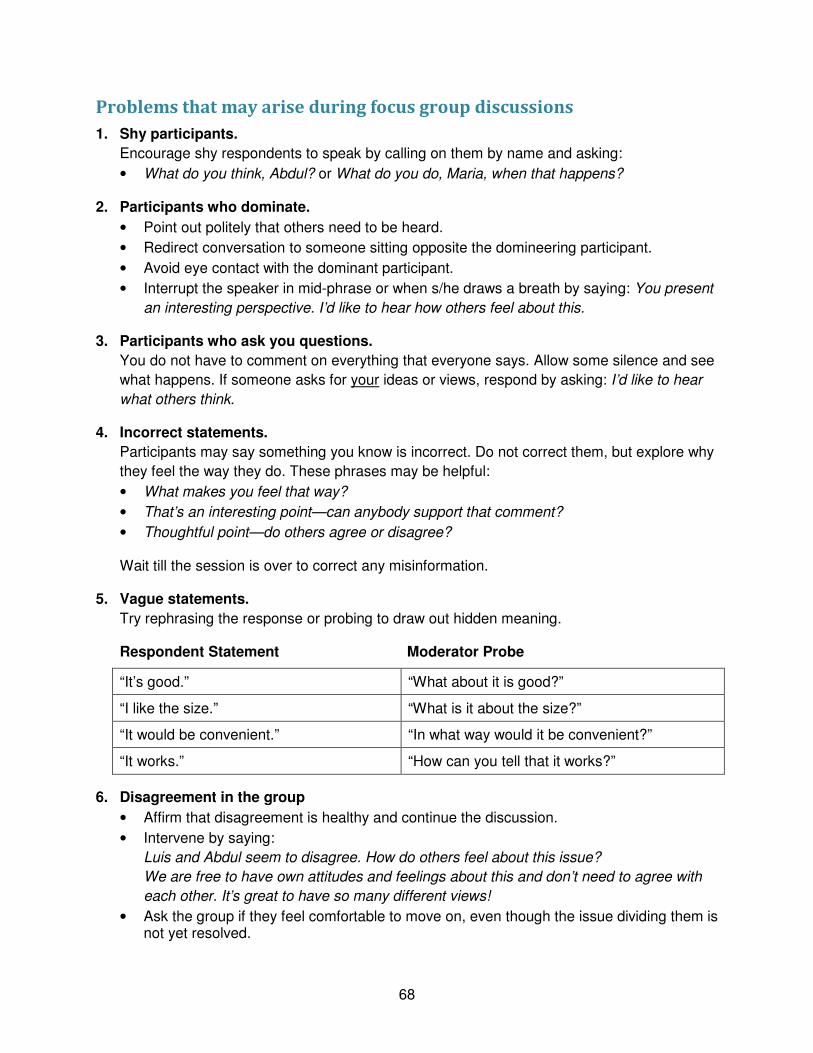
68
Problems that may arise during focus group discussions
1. Shy participants.
Encourage shy respondents to speak by calling on them by name and asking:
• What do you think, Abdul? or What do you do, Maria, when that happens?
2. Participants who dominate.
• Point out politely that others need to be heard.
• Redirect conversation to someone sitting opposite the domineering participant.
• Avoid eye contact with the dominant participant.
• Interrupt the speaker in mid-phrase or when s/he draws a breath by saying: You present
an interesting perspective. I’d like to hear how others feel about this.
3. Participants who ask you questions.
You do not have to comment on everything that everyone says. Allow some silence and see
what happens. If someone asks for your ideas or views, respond by asking: I’d like to hear
what others think.
4. Incorrect statements.
Participants may say something you know is incorrect. Do not correct them, but explore why
they feel the way they do. These phrases may be helpful:
• What makes you feel that way?
• That’s an interesting point—can anybody support that comment?
• Thoughtful point—do others agree or disagree?
Wait till the session is over to correct any misinformation.
5. Vague statements.
Try rephrasing the response or probing to draw out hidden meaning.
Respondent Statement Moderator Probe
“It’s good.” “What about it is good?”
“I like the size.” “What is it about the size?”
“It would be convenient.” “In what way would it be convenient?”
“It works.” “How can you tell that it works?”
6. Disagreement in the group
• Affirm that disagreement is healthy and continue the discussion.
• Intervene by saying:
Luis and Abdul seem to disagree. How do others feel about this issue?
We are free to have own attitudes and feelings about this and don’t need to agree with
each other. It’s great to have so many different views!
• Ask the group if they feel comfortable to move on, even though the issue dividing them is not yet resolved.
69
APPENDIX 3: Additional Resources
ACSM planning
PATH. Overcoming Barriers to TB Control: The Role of Advocacy, Communication, and Social
Mobilization (ACSM). Washington, DC: PATH; 2011. Available at:
http://www.path.org/publications/files/TB_acsm_curric.pdf.
United Nations Children’s Fund. ACADA Communication Planning Process. Available at:
http://www.unicef.org/cbsc/files/UNICEF_ACADA.pdf
Synergy Project APDIME toolkit page. Synergy Project website. Available at:
http://www.toolkitsportdevelopment.org/html/topic_E0B0281D-0D2B-4F7C-B96C-
B05439BDC642_617143AF-FC60-46D8-8A69-BA64EFD3D1CF_6.htm.
World Health Organization (WHO). Communication for Behavioural Impact. Geneva: WHO;
2012. Available at: http://www.who.int/ihr/publications/combi_toolkit_outbreaks/en/index.html.
United States National Cancer Institute (NCI). Making Health Communication Programs Work.
Bethesda, MD: NCI; 2008. Available at:
http://www.cancer.gov/cancertopics/cancerlibrary/pinkbook.
Health Communication Partnership. The New P-Process: Steps in Strategic Communication.
Baltimore, MD: Johns Hopkins Bloomberg School of Public Health/Center for Communication
Programs/Health Communication Partnership; 2003. Available at:
www.hcpartnership.org/Publications/P-Process.pdf.
The World Bank. Strategic Communication for Development Projects: A Toolkit for Task Team
Leaders. Washington, DC: The World Bank. Available at:
http://siteresources.worldbank.org/EXTDEVCOMMENG/Resources/toolkitwebjan2004.pdf.
Academy for Educational Development GreenCOM Project. SCALE Process. Available at:
http://www.globalfishalliance.org/pdfs/2011/Going-to-SCALE.pdf
Monitoring and evaluation
World Health Organization (WHO). A Guide to Monitoring and Evaluation for Collaborative
TB/HIV Activities. Geneva: WHO; 2009. Available at:
http://www.who.int/hiv/pub/tb/hiv_tb_monitoring_guide.pdf.
World Health Organization (WHO). Compendium of Indicators for Monitoring and Evaluating
National Tuberculosis Programs. Geneva: WHO; 2004. Available at:
www.who.int/tb/publications/tb_compendium_of_indicators/en/index.html.
The World Bank. Conducting Quality Impact Evaluations Under Budget, Time and Resource
Constraints. Washington, DC: The World Bank; 2006. Available at:
http://siteresources.worldbank.org/EXTEVACAPDEV/Resources/4585672-
1251461875432/conduct_qual_impact.pdf.
70
Global Fund to Fight AIDS, Tuberculosis and Malaria (Global Fund), Special Program for
Research and Training in Tropical Diseases. Framework for Operations and Implementation
Research in Health and Disease Control Programs. Geneva: Global Fund; 2008. Available at:
http://www.who.int/tdr/publications/training-guideline-publications/framework-operation-
research/en/index.html.
Global Fund to Fight AIDS, Tuberculosis and Malaria (Global Fund). Monitoring and Evaluation
Toolkit: HIV, Tuberculosis, Malaria, and Health and Community Systems Strengthening. Third
Edition. Geneva: Global Fund; 2009. Available at:
http://www.rbm.who.int/toolbox/tool_MEtoolkit.html.
Sullivan TM, Strachan M, Timmons BK. Guide to Monitoring and Evaluating Health Information
Products and Services. Baltimore, MD: Johns Hopkins Bloomberg School of Public
Health/Center for Communication Programs; Washington, DC: Constella Futures; Cambridge,
MA: Management Sciences for Health; 2007. Available at:
http://www.k4health.org/sites/default/files/guide-to-monitoring-and-evaluating-health-
information.pdf.
International Initiative for Impact Evaluation. Impact Evaluation Glossary, Version No. 7. July
2012. Available at:
http://www.3ieimpact.org/media/filer/2012/07/11/impact_evaluation_glossary_-_july_2012_3.pdf.