Modeling Fanconi Anemia pathogenesis and therapeutics using integration-free patient-derived iPSCs
Guang-Hui Liu#1,2,3, Keiichiro Suzuki#2, Mo Li#2, Jing Qu#1,2,4, Nuria Montserrat5, Carolina Tarantino5, Ying Gu2, Fei Yi2, Xiuling Xu1, Weiqi Zhang1, Sergio Ruiz2, Nongluk Plongthongkum6, Kun Zhang6, Shigeo Masuda2, Emmanuel Nivet2, Yuji Tsunekawa2, Rupa Devi Soligalla2, April Goebl2, Emi Aizawa2, Na Young Kim2, Jessica Kim2, Ilir Dubova2, Ying Li1, Ruotong Ren1, Chris Benner7, Antonio del Sol8, Juan Bueren9,10,11, Juan Pablo Trujillo12, Jordi Surralles12, Enrico Cappelli13, Carlo Dufour13, Concepcion Rodriguez Esteban2, and Juan Carlos Izpisua Belmonte2
1National Laboratory of Biomacromolecules, Institute of Biophysics, Chinese Academy of Sciences, Beijing 100101, China
2Gene Expression Laboratory, Salk Institute for Biological Studies, 10010 North Torrey Pines Road, La Jolla, California 92037, USA
3Beijing Institute for Brain Disorders, Beijing 100069, China
4Key Laboratory of Non-coding RNA, Institute of Biophysics, Chinese Academy of Sciences, Beijing 100101, China
5Center for Regenerative Medicine in Barcelona, Dr. Aiguader 88, 08003 Barcelona, Spain
6Department of Bioengineering, University of California at San Diego, La Jolla, California 92093, USA
7Integrative Genomics and Bioinformatics Core, Salk Institute for Biological Studies, 10010 North Torrey Pines Road, La Jolla, California 92037, USA
8Luxembourg Centre for Systems Biomedicine (LCSB), University of Luxembourg, L-1511, Luxembourg, Luxembourg
Correspondence: [email protected], (JCIB) or [email protected] (GHL).
Author contributionsG.H.L. performed experiments related to iPSC derivation, gene correction of FA iPSC, charaterization and differentiation and charaterization of MSCs and NSCs. K.S. performed experiments related to genome editing of FA iPSCs, derivation of FA deficient ESCs and characterization of FA phenotypes in MSCs and NSCs. M.L. performed experiments related to hematopoietic differentiation, characterization of FA phenotypes in HPCs, small molecule drug studies and phenotypic analysis of FA patient samples. J.Q. performed experiments related to iPSC derivation, gene correction of FA iPSC, charaterization and differentiation and charaterization of HPCs, MSCs and NSCs. G.H.L., K.S., M.L. and J.Q. performed the majority of experiments in this work. N.M., Y.G., F.Y., C.T, C.B., N.P. and K.Z. carried out the genomic and epigenomic analyses. X. X., W. Z., S. R., I. D., Y. L. and R. R. generated iPSC and their characterization. R.D.S., A.G., E.A., N.Y.K., J.K., S.M., Y.T. and E.N. performed cell culture and differentiation. A.D. S., J.B., J.P.T., J.S., E.C., C.D. and C.R.E. performed sample collection and data analyses. G.H.L., K.S., M.L., J.Q., and J.C.I.B. conceived this study and wrote the manuscript.
Competing financial interestThe authors declare no competing financial interests.
Accession codesThe RNA-seq/ChIP-seq and Methylation sequencing data sets have been deposited in NCBI Gene Expression Omnibus (GEO) under accession code GSE57828 and GSE57685, respectively. All microarray data have been deposited in NCBI-GEO repository with the accession number GSE40865.
NIH Public AccessAuthor ManuscriptNat Commun. Author manuscript; available in PMC 2015 January 12.
Published in final edited form as:Nat Commun. ; 5: 4330. doi:10.1038/ncomms5330.
NIH
-PA
Author M
anuscriptN
IH-P
A A
uthor Manuscript
NIH
-PA
Author M
anuscript

9Hematopoiesis and Gene Therapy Division. Centro de Investigaciones Energéticas, Medioambientales y Tecnológicas (CIEMAT)/Centro de Investigación Biomédica en Red de Enfermedades Raras (CIBER-ER), Madrid 28040, Spain
10Centro de Investigación Biomédica en Red de Enfermedades Raras (CIBER-ER), Madrid 28040, Spain
11Instituto de Investigación Sanitaria Fundación Jiménez Díaz (IIS-FJD, UAM), Madrid 28040, Spain
12Department of Genetics and Microbiology and Center for Biomedical Network Research on Rare Diseases (CIBERER), Universitat Autonoma de Barcelona, Campus de Bellaterra s/n 08193 Bellaterra, Spain
13G. Gaslini Children’s Hospital, Largo G. Gaslini 5, 16147 Genova Quarto, Italy
# These authors contributed equally to this work.
Abstract
Fanconi Anemia (FA) is a recessive disorder characterized by genomic instability, congenital
abnormalities, cancer predisposition and bone marrow failure. However, the pathogenesis of FA is
not fully understood partly due to the limitations of current disease models. Here, we derive
integration-free induced pluripotent stem cells (iPSCs) from an FA patient without genetic
complementation and report in situ gene correction in FA-iPSCs as well as the generation of
isogenic FANCA deficient human embryonic stem cell (ESC) lines. FA cellular phenotypes are
recapitulated in iPSCs/ESCs and their adult stem/progenitor cell derivatives. By using isogenic
pathogenic mutation-free controls as well as cellular and genomic tools, our model serves to
facilitate the discovery of novel disease features. We validate our model as a drug-screening
platform by identifying several compounds that improve hematopoietic differentiation of FA-
iPSCs. These compounds are also able to rescue the hematopoietic phenotype of FA-patient bone
marrow cells.
Introduction
Fanconi Anemia (FA) is a recessive disorder characterized by congenital abnormalities,
cancer predisposition and progressive bone marrow failure (BMF) 1, 2. The underlying
genetic defect of FA can reside in any of the sixteen FANC genes 3, 4, which function in a
common DNA damage repair pathway. Eight FA proteins, including FANCA, form a core
complex with ubiquitin–E3 ligase activity. During the S phase of the cell cycle or upon
DNA damage, the FA core complex mono-ubiquitinates the FANCD2/FANCI heterodimer,
which subsequently translocates to specific nuclear foci and functions in DNA repair.
Defective DNA repair in FA cells leads to G2 phase cell cycle arrest and increased cell
death in response to DNA crosslinking reagents, which may contribute to the manifestation
of FA disease phenotypes 1. Patients with biallelic mutations in any of the FANC genes
frequently succumb to BMF, which is the major cause of death. The mechanistic link
between FA pathway deficiency and BMF remains elusive. Recent evidence in humans and
mice shows that FA deficiencies lead to progressive loss of hematopoietic stem/progenitor
Liu et al. Page 2
Nat Commun. Author manuscript; available in PMC 2015 January 12.
NIH
-PA
Author M
anuscriptN
IH-P
A A
uthor Manuscript
NIH
-PA
Author M
anuscript

cells (HSPCs) and functional impairment of the repopulating ability of these cells in NOD-
SCID IL2gnull mice 2, 5, 6, 7. It has been suggested that a heightened p53/p21 DNA damage
response induced by accumulating unrepaired DNA lesions underlies these defects, although
direct evidence from patient HSPCs is still lacking 5. Other than DNA repair, FA proteins
also regulate proinflammatory and proapoptotic cytokine signaling. FA patient bone marrow
(BM) has been shown to overproduce tumor necrosis factor-α (TNFα) and interferon-γ
(INFγ), which may suppress hematopoiesis 8.
Studying FA in primary patient cells is often impractical due to the rarity of FA, the low
cellularity of patient BM and inaccessibility to certain tissues. Transformed FA cell lines
have been practical surrogates, but they may not faithfully recapitulate FA disease
phenotypes due to transformation related artifacts. Although primary patient fibroblasts are
useful in studying DNA damage repair in FA 9, 10, and while multiple mouse genetic models
of FA have been developed (these models do not develop anemia with the exception of
hypomorphic Fancd1 mutation and Btbd12 deficient mouse model 11, 12), understanding of
stem cell defects in FA is scarce. Induced pluripotent stem cell (iPSC) technology provides
the opportunity to produce various disease-relevant cell types and therefore constitutes an
attractive new way to model FA 13. However, reprogramming FA cells into iPSCs has
proven to be highly inefficient 14, 15. We have previously shown that successful generation
of FA patient-specific iPSCs (FA-iPSCs) under normoxia could be achieved if the FANCA
deficiency is complemented by a lentiviral vector expressing the FANCA gene 15. Muller et
al. have since shown that reprogramming activates the FA pathway and that hypoxic
conditions can facilitate lentivirus-mediated reprogramming of FA fibroblasts without
genetic complementation, albeit with low efficiency 14. More recently, Yung et al. derived
FANCC deficient iPSCs under normoxia and showed increased apoptosis and reduced
clonogenic potential of FANCC deficient hematopoietic progenitor cells (HPCs) derived
from FA-iPSCs 16. While these studies have improved our understanding of the role of the
FA pathway in reprogramming, they also highlight challenges in establishing an iPSC-based
FA model: 1) the derivation of FA-iPSCs remains highly inefficient – less than two iPSC
clones established per patient fibroblast line; 2) It is still unclear whether karyotypically
normal FA deficient iPSCs can be derived without genetic complementation. Indeed, Yung
et al. 16 reported a high degree of chromosomal abnormalities in FA-iPSCs (only FA
complemented iPSCs have been analyzed by Muller et al. 14); 3) The established FA-iPSCs
often fail to be maintained in culture 16; 4) To date, lentiviral gene complementation remains
the only method of correcting FA deficiency. Because of the fact that defects in the FA
pathway are associated with low efficiency in homologous recombination (HR)-dependent
gene editing 17, 18, it is unknown whether HR-dependent gene correction approaches can be
applied to FA cells. Furthermore, genetic complementation and reprogramming by viral
vectors may lead to random mutagenesis and tumorigenicity 19, which undermine the
therapeutic value of the corrected cells.
To avoid the issues associated with viral vectors and with the aim of improving the
therapeutic potential of the FA-iPSC model, we explored the possibility of generating FA-
iPSCs with episomal vectors, which are non-viral and non-integrative. To aid in studying FA
pathogenesis mechanisms and developing future therapeutics, herein we report for the first
Liu et al. Page 3
Nat Commun. Author manuscript; available in PMC 2015 January 12.
NIH
-PA
Author M
anuscriptN
IH-P
A A
uthor Manuscript
NIH
-PA
Author M
anuscript

time the generation of isogenic iPSC lines free of pathogenic FANCA mutation as well as
FANCA−/− ESC lines by homologous recombination. Our model recapitulates key cellular
phenotypes of FA and leads to the observation of previously unknown defects, which are
rescued by targeted gene correction. Furthermore, we validate our system as a platform for
drug screening, as it not only recapitulates the effects of compounds known to improve FA
phenotypes, but also identifies a novel candidate that enhances hematopoietic phenotypes of
FA-iPSCs/ESCs and FA BM cells. Altogether, our integration-free FA-iPSC and isogenic
FA-ESC models represent a multifaceted platform to understand FA pathogenesis, discover
novel therapeutic drugs and develop cell replacement therapies of FA.
Results
Generation of integration-free FA-specific iPSCs
To obtain integration-free FA-specific iPSCs, we reprogrammed fibroblasts from an FA
patient, who bears a biallelic truncating mutation (C295T) in the FANCA gene (Fig. 1A) 20,
by transiently expressing five reprogramming factors (OCT4, SOX2, KLF4, LIN28, L-
MYC) and p53-shRNA encoded in episomal vectors 21, 22. Histone deacetylase inhibitor
sodium butyrate was included in the reprogramming medium to facilitate epigenetic
remodelling 23. We successfully derived FA patient-specific iPSCs under normoxia without
FANCA complementation (Fig.1B-C). FA fibroblasts were reprogrammed with lower
efficiency (0.024% vs. 0.2%) and slower kinetics (NANOG-positive colonies appeared after
an average of 40 days for FA cells vs. 22 days for controls) than the control fibroblasts
without FANCA mutation. Despite repeated trials, we did not obtain any iPSC colony when
p53 shRNA was omitted from the reprogramming cocktail even with hypoxia conditions,
which are known to enhance reprogramming efficiency 24 (Fig. 1C). This is likely due to
reprogramming barriers caused by an exacerbated p53 stress response in FA cells 14. All
FA-iPSC lines (data shown from representative clones) displayed surface makers of iPSCs
(Fig. 1D). Importantly, we did not detect any ectopic reprogramming factor transgene or
residual episomal vector sequence in five randomly selected iPSC lines (FA-iPSC#1,2,4,5
and 8, Fig. 1E). The established FA-iPSC lines displayed hallmarks of pluripotency (Fig.
2A-C), carried the FANCA mutation (Fig. 1A), were devoid of the FANCA protein (Fig. 2D)
and demonstrated a normal karyotype at passage 13 (Fig. 2E). Since these fully
characterized clones behaved similarly in culture, we used them interchangeably in
subsequent analyses.
Characterization of FA-iPSCs
FA cells are characterized by excessive G2/M arrest in the cell cycle 25. We observed an
increased G2/M cell cycle arrest in FA-iPSCs when compared with their wild-type
counterparts (Fig. 3A). Even though FA-iPSC lines could be serially subcultured (up to
passage 60 at the time of manuscript submission), they showed a decrease in clonogenicity
when compared with control iPSCs (Fig. 3B). FA-iPSCs also displayed sensitivity to DNA
crosslinking reagents and chromosome fragility (Fig. 3C-D) 26. Monoubiquitination of
FANCD2, which is indicative of a functional FA core complex that includes FANCA, was
reduced in FA-iPSCs (Fig. 3E). In addition, FA-iPSCs failed to form FANCD2 nuclear foci
Liu et al. Page 4
Nat Commun. Author manuscript; available in PMC 2015 January 12.
NIH
-PA
Author M
anuscriptN
IH-P
A A
uthor Manuscript
NIH
-PA
Author M
anuscript

upon treatment with a DNA crosslinking reagent – mitomycin C (MMC) (Fig. 3F).
Altogether, these observations demonstrated a defective DNA-repair pathway in FA-iPSCs.
Targeted correction of the FANCA mutation in FA-iPSCs
A major challenge in developing HR-dependent gene correction approaches in FA cells is
that defects in the FA pathway are associated with inefficient HR-dependent gene
editing 17, 18. Helper-dependent adenoviral vectors (HDAdVs) have been shown to mediate
efficient gene targeting/correction via HR at various genomic loci with minimal impact on
genomic integrity 21, 27, 28. This non-integrative vector is devoid of the virus genome, thus
minimizing cytotoxicity 29, 30. We performed targeted correction of the FANCA mutation in
FA-iPSCs by using an HDAdV-based gene correction vector – FANCA-c-HDAdV, covering
the genomic region from the promoter to intron 7 of the FANCA gene (Fig. 4A). Targeted
gene correction was confirmed by PCR, Southern blot, and sequencing analyses (Figs. 1A
and 4B-C). Further sequencing analysis confirmed that the correction was due to HR
between the FANCA locus and the FANCA-c-HDAdV (Supplementary Fig. 1A). We next
excised the integrated neomycin-resistant gene cassette using the FLP/FRT system
(Supplementary Fig. 1B). As a complementary approach, we also generated a corrected FA-
iPSC line by gene complementation using a lentiviral FANCA expression vector, similar to
the one that will be used in an upcoming clinical trial 31. These genetically corrected cells
retained pluripotency and a normal karyotype (Figs. 1D and 2A, B and E).
Since heterozygous carriers of FA mutations are not symptomatic 20, we reasoned that the
corrected FA-iPSCs bearing one wild-type allele might hold therapeutic potential. As
expected, gene correction restored the FANCA protein expression (see C-FA-iPSC#1 in Fig.
2D). Consistently, the cell cycle and clonogenicity defects in FA-iPSCs were also rescued
by FANCA correction (Fig. 3A and B). FANCD2 monoubiquitination was restored by either
targeted gene correction of FANCA or lentiviral delivery of the FANCA transgene (C-FA-
iPSC#2) in diseased iPSCs (Fig. 3E). At the cellular level, gene-corrected FA-iPSCs
regained the capability to form FANCD2 nuclear foci after MMC treatment (Fig. 3F).
Consequently, MMC sensitivity and chromosomal fragility in FA-iPSCs were rescued by
gene-correction via HR or genetic complementation (Fig. 3C and D). Therefore, the FA-
specific cellular defects observed in pluripotent stem cells appeared to be effectively
reversed by targeted correction of the FANCA mutation.
Differentiation of FA-iPSCs into HPCs
A defective hematopoietic system is one of the main clinical manifestations of FA 5, 32.
However, the pathogenesis of FA hematopoietic defects is incompletely understood. Since
hematopoietic differentiation of human iPSCs is thought to mirror the developmental pattern
of embryonic hematopoiesis, we reasoned that FA-iPSCs could provide a unique model for
investigating FA pathogenesis during early hematopoietic commitment and specification in
humans 33. Upon directed differentiation towards the hematopoietic lineage, FA-iPSCs and
in situ gene-corrected FA-iPSCs shared a common temporal pattern of HPC gene induction,
suggesting that they underwent similar hematopoietic commitment and specification (Fig.
5A). However, when compared with control-iPSCs, FA-iPSCs yielded a significantly lower
percentage of HPCs (Fig. 5B-C), especially in the CD34hi/CD43lo population that has been
Liu et al. Page 5
Nat Commun. Author manuscript; available in PMC 2015 January 12.
NIH
-PA
Author M
anuscriptN
IH-P
A A
uthor Manuscript
NIH
-PA
Author M
anuscript
shown to contain multipotent progenitors 34. The FACS data coincided with the lower levels
of gene induction shown by qPCR (Fig. 5A-C). Importantly, the deficit in generating HPCs
was markedly rescued by FANCA correction (Fig. 5B-C). Furthermore, FA-HPCs were
restricted to colony forming unit-granulocyte-macrophage (CFU-GM) and not able to
generate colonies containing erythroblasts and/or megakaryocytes, whereas HPCs derived
from C-FA-iPSCs gave rise to all typical hematopoietic colonies (Fig. 5D-E). Purified FA-
HPCs displayed increased sensitivity to MMC when compared with control HPCs. Genetic
correction of the FANCA mutation completely rescued this phenotype (Fig. 5F).
Differentiation of FA-iPSCs into mesenchymal stem cells
Mesodermal tissue defects have been reported in FA patients and mice models 35, 36. Given
the roles of MSC in maintaining multiple mesodermal lineages and providing a niche for
normal bone marrow hematopoietic stem cell (HSC) function 37, we explored the possibility
that human FA pathogenesis could be associated with cellular defects in mesenchymal stem
cells (MSCs). Accordingly, we differentiated control-iPSCs and FA-iPSCs to MSCs (Fig.
6A and Supplementary Fig. 2). Whereas the control MSCs proliferated normally upon serial
passaging, FA-iPSC derived MSCs (FA-MSCs) failed to proliferate beyond the first three
passages (Fig. 6B). The loss of proliferative ability was accompanied by cell senescence
characteristics including enlarged and flattened cell morphology and positive staining for
SA-β-galactosidase activity (Fig. 6C). To further support these findings, qPCR analysis was
performed. When compared with control MSCs, FA-MSCs showed a robust upregulation of
the cell proliferation suppressor p21, the cell senescence marker p16 and the stress sensor
HO-1 as early as the first passage (Fig. 6D). Unlike control-iPSC derived MSCs, which
could differentiate into adipogenic, chondrogenic and osteogenic lineages in vitro, FA-
MSCs failed to differentiate due to severe senescence (Fig. 6E). The FA-MSC-specific
defects were reversed by targeted gene correction (Figs. 2D and 6B-E). Together, these
results suggest that MSC dysfunction characterized by premature senescence could be a part
of the FA pathology and correction of the FANCA mutation is sufficient to normalize MSC
function 35.
Differentiation of FA-iPSCs into neural stem cells
The spectrum of anomalies in FA extends to the nervous system; conditions such as
microcephaly and mental retardation are common among FA patients 38, 39, 40. FA genes
including FANCA are highly expressed in the brain of zebrafish 41. The FA pathway has
been shown to play a critical role in neural stem cell (NSC) maintenance in mice 42.
However, the etiology of neurological manifestation of FA in humans remains elusive,
partly due to a lack of appropriate experimental models. Since iPSC technology has recently
been successfully used to reveal unknown neural disease phenotypes and mechanisms 43, 44,
we next sought to study the consequence of FANCA-deficiency in human neural cells.
Following in vitro differentiation into NSCs (Fig. 7A and Supplementary Fig. 3A), we first
confirmed that FANCA expression was completely abrogated in FA-iPSCs derived NSCs
(FA-NSCs, Fig. 7B). Upon treatment with MMC, control iPSC-derived NSCs (Ctrl-NSCs)
exhibited formation of FANCD2 nuclear foci, which were completely abrogated in FA-
NSCs (Fig. 7C). Furthermore, FA-NSCs showed an increased susceptibility to MMC-
induced cell death, compared to control NSCs (Fig. 7D). While Ctrl-NSCs could be readily
Liu et al. Page 6
Nat Commun. Author manuscript; available in PMC 2015 January 12.
NIH
-PA
Author M
anuscriptN
IH-P
A A
uthor Manuscript
NIH
-PA
Author M
anuscript

differentiated into Tuj1-positive neurons, FA-NSCs showed impaired neuronal
differentiation (Fig. 7E and Supplementary Fig. 3B). All these defects in FA-NSCs were
rescued by targeted gene correction of FANCA (Fig. 7B-E and Supplementary Fig. 3B).
To elucidate the transcriptional and epigenetic alterations underlying the neurogenic defects
of FA-NSCs, we conducted gene expression microarray analysis and global DNA
methylation profiling. The gene expression pattern of gene-corrected NSCs (C-FA-NSCs)
resembled that of control-NSCs but clustered distantly from FA-NSCs (Fig. 7F and
Supplementary Data 1). Hierarchical clustering based on DNA methylation levels in the
promoter region (+/−1.5kb from TSS) of genes whose expression levels were rescued in C-
FA-NSCs, placed C-FA-NSCs closer to control-NSCs and away from FA-NSCs (Fig. 7G),
although this pattern was not seen at the whole genome level (Supplementary Fig. 3C). This
suggests that FANCA gene correction leads to specific methylation changes in a subset of
promoters. Interestingly, both microarray and RT-qPCR analyses revealed that FA-NSCs are
associated with induction of tumor-related genes, down-regulation of tumor suppressor
genes, as well as down-regulation of neural identity genes (Fig. 7H).
(Epi-)genetic characterization of FA and gene-corrected cells
Next, we examined whether reprogramming, gene correction, and differentiation could
introduce genetic instability in the FANCA mutant genetic background. Array comparative
genomic hybridization (array CGH) showed that C-FA-iPSCs and their derivatives did not
bear additional DNA rearrangement when compared with the original FA-fibroblasts, while
non-corrected FA-iPSCs showed DNA rearrangements after being cultured for 40 passages
(Supplementary Fig. 4 and Supplementary Data 2).
We next compared the transcriptional and epigenetic status of the mutant and disease-free
iPSCs at the whole genome level. RNA-seq showed that the transcriptomes of the HDAdV-
corrected (C-FA-iPSC#1) and the lentiviral vector-corrected FA-iPSCs (C-FA-iPSC#2)
were similar to each other and clustered away from the two uncorrected FA-iPSC clones
(FA-iPSC#5 and FA-iPSC#8, Supplementary Fig. 5A). Similarly, whole epigenome
profiling based on trimethylated H3K4 (H3K4me3) showed concordant epigenetic
remodeling in the two corrected clones (Supplementary Fig. 5B). Together, these results
reinforce the notion that the methodologies used here preserve genome stability and may
provide the grounds for developing FA therapeutics.
Evaluation of compounds able to reverse FA cellular defects
To evaluate the utility of the FA-iPSC model in drug discovery, we screened a panel of
small molecules, including a Sirt1 activator, a p38 kinase inhibitor, a synthetic androgen and
an anti-inflammatory compound, for their effects on the differentiation of FA-HPCs.
Resveratrol, which has been shown to partially correct hematopoietic defects in Fancd2−/−
mice 6, did not discernibly affect HPC differentiation (Fig. 8A and B). However, we could
not exclude the effects of resveratrol on other aspects of FA hematopoiesis. Danazol, a
synthetic androgen used to treat FA, other BMF disorders and aplastic anemia 45, enhanced
the differentiation of FA-iPSCs, C-FA-iPSCs and control iPSCs, indicating that its effects
are not specific to FA. We also observed that doramapimod, a highly selective p38 MAPK
Liu et al. Page 7
Nat Commun. Author manuscript; available in PMC 2015 January 12.
NIH
-PA
Author M
anuscriptN
IH-P
A A
uthor Manuscript
NIH
-PA
Author M
anuscript

inhibitor, specifically and significantly improved the derivation of CD34+/CD43+
progenitors from FA-iPSCs (Fig. 8A and B). The effect of doramapimod was even more
pronounced in the CD34hi/CD43lo population. In addition, treating purified CD34+ FA-
HPCs with doramapimod enhanced CFU-GM formation, suggesting a partial rescue of the
FA phenotype (Supplementary Fig. 6A). Our results are consistent with previous reports on
the beneficial effects of p38 inhibition on FA cells 46, 47. Interestingly, our screen showed
that tremulacin, a natural anti-inflammatory compound 48, produced a specific and
significant improvement on FA-HPC differentiation (Fig. 8A and B). We further asked if
these compounds might exert their effects by suppressing pro-inflammatory and/or pro-
apoptotic cytokine signaling in FA cells. Doramapimod and dasatinib, which have both been
shown to suppress inflammatory responses 46, 47, significantly downregulated the expression
of INFγ, TNF and IL6 in FA-iPSC derived hematopoietic cells, while danazol did not (Fig.
8C). Our data showed that tremulacin also potently suppressed INFγ, TNF and IL6 at the
transcription level (Fig. 8C). Interestingly, doramapimod also specifically rescued the
proliferation defect of FA-MSCs but exerted no effect on the growth of gene corrected
MSCs (Supplementary Fig. 6B).
To test if doramapimod and tremulacin could dampen the TNFα overproduction observed in
FA patient cells, we utilized an FA-patient derived B-cell line that has been shown to
produce TNFα constitutively 49. Consistent with previous data, doramapimod treatment
significantly reduced secreted TNFα from patient cells (p=0.00004, Student’s t-test, Supplementary Fig. 6C) 46, while treatment with tremulacin lead to a small yet consistent
reduction of secreted TNFα when compared with treatment with the vehicle (DMSO,
p=0.00117, Student’s t-test, Supplementary Fig. 6C). Tremulacin treatment also
significantly reduced TNF mRNA (p=0.0123, Student’s t-test), while the effect of
doramapimod did not reach statistical significance (Supplementary Fig. 6D). This is
consistent with the fact that doramapimod acts post-transcriptionally to suppress TNFα
secreation 49. These data suggest that tremulacin may function by suppressing the
inflammatory response in FA cells. It is unlikely that suppression of TNFα is the sole
mechanism of action of tremulacin. Future study is necessary to elucidate the pathways
through which tremulacin affects hematopoietic differentiation of FA-iPSCs.
The observation that FA deficient cells overproduce proinflammatory cytokines to which
they are hypersensitive suggests that aberrant cytokine signaling may underlie BM
dysfunction in FA. It also underpins the hypothesis that inhibiting the action of these
proinflammatory cytokines (e.g. TNFα) could improve FA BM function. However, this has
not been shown experimentally. Because our data show that doramapimod and tremulacin
suppressed TNFα and rescued hematopoietic phenotypes of FA-HPCs, we investigated if
these compounds could rescue the hematopoietic defects of FA patient BM. FA BM treated
with doramapimod or tremulacin produced CFU-GMs that contained more cells than those
obtained from vehicle treated samples (Fig. 8D). In Patient #1, erythroid colonies (burst-
forming unit-erythroid, or BFU-E) from tremulacin treated samples contained mostly dark
red cells, indicating high levels of hemoglobin expression, while those from vehicle-treated
BM consisted of cells that were pale red or colorless (Fig. 8D). No difference in the
apperence of BFU-Es was noted in FA patient #2. Quantitation showed that doramapimod
Liu et al. Page 8
Nat Commun. Author manuscript; available in PMC 2015 January 12.
NIH
-PA
Author M
anuscriptN
IH-P
A A
uthor Manuscript
NIH
-PA
Author M
anuscript

significantly increased the frequency of CFU-GM in BM of two FA patients. Tremulacin
increased the mean frequency of BFU-E in both patients, although only the case in FA
patient #1 was statistically significant (Fig. 8E). Neither doramapimod nor tremulacin had
any significant effect on BM of a healthy donor (Fig. 8E).
Generation of isogenic human ESC model of FA
To independently validate the findings in our FA iPSC model, we generated three
FANCA−/− H9 ESC lines (ESC-FA−/−) by performing two rounds of transcription activator-
like effector nuclease (TALEN)-mediated gene targeting (Fig. 9A and B). As expected,
ESC-FA−/− did not express FANCA and recapitulated the cell cycle and MMC sensitivity
phenotypes seen in FA-iPSCs (Fig. 9C-E). Following the same protocols described in the
FA-iPSC model, we confirmed that ESC-FA−/− derived HPCs, MSCs and NSCs displayed
similar cellular defects as seen in the FA-iPSC model (Fig. 9F-I and Supplementary Fig.
7A). We further showed that the HPC-FA−/− were not prone to apoptosis but did exhibit G2-
M cell cycle arrest, which could contribute to the lower number and reduced CFU capacity
of HPC-FA−/− (Supplementary Fig. 7B and C). Importantly, this model allowed us to
independently verify the specificity of doramapimod and tremulacin in rescuing FA cellular
defects (Fig. 9J and Supplementary Fig. 7D).
Discussion
Considering that FA pathophysiology cannot be fully recapitulated in mouse models 50,
there is a great need for human FA disease models. Here, we generated human FA-specific
iPSCs without genomic integration of transgene. Additionally, we generated isogenic
control iPSC lines using HDAdV-mediated targeted correction of the FANCA mutation. To
the best of our knowledge, this is the first example of targeted correction of FA iPSCs.
Furthermore, we verified that genome stability was preserved in C-FA-iPSCs and their
differentiated progeny. We also generated isogenic FANCA−/− ESC lines by TALEN-
mediated gene targeting. These isogenic ESC lines allowed us to independently validate our
findings in the FA iPSC model.
Our current study is limited to FA subgroup A, in which over 1500 pathogenic mutations in
the FANCA gene have been reported (http://www.rockefeller.edu/fanconi/genes/jumpa). The
FANCA-c-HDAdV vector covers 161 (or 10%) of these mutations in FANCA. From a
therapeutic point of view, more vectors are needed to correct other mutations of FANCA.
Engineered nucleases, including TALEN and clustered, regularly interspaced, short
palindromic repeat (CRISPR)/CAS9 nuclease and zinc finger nuclease (ZFN), could
potentially be useful tools in the gene correction of FA. However, the extent of off-target
mutagenesis by these methods remains controversial. Further studies are necessary to clarify
whether these nuclease-based methods can be safely applied to FA. The strategy presented
here can also be applied to model other subgroups of FA. Given the complexity of the FA
group, these additional FA-iPSC models are necessary to cover the full spectrum of FA
pathology.
Many aspects of FA pathogenesis are insufficiently understood because of the scarcity of
patient samples. For example, dysfunctions in MSCs and NSCs have been suggested but
Liu et al. Page 9
Nat Commun. Author manuscript; available in PMC 2015 January 12.
NIH
-PA
Author M
anuscriptN
IH-P
A A
uthor Manuscript
NIH
-PA
Author M
anuscript

poorly investigated 35, 36, 51. FA-iPSCs could offer unlimited research materials for
unraveling yet unidentified FA phenotypes. We illustrate this point by differentiating iPSCs
into three types of progenitor/stem cells, and reveal that FA pathology may entail
dysfunctions in multiple progenitor/stem cell populations. FA-HPCs and FA-MSCs, show
similar deficiencies in maintenance and proliferation. A recent study reported that Fancg-
deficient mice exhibit impaired MSC proliferation accompanied by a decreased ability to
support the adhesion and engraftment of HPCs 36. The novel MSC proliferation defect could
also be associated with bone malformations in FA, as osteocytes derived from these cells are
compromised in FA. We cannot exclude the possibility that the profound proliferation
defects of FA-iPSC derived MSCs may be exacerbated by extensive in vitro culture and
mutations potentially accumulated during reprogramming. Nonetheless, ESC-FA−/− derived
MSCs show a consistent proliferation defect, which suggests that the MSC phenotype is
mainly attributable to the FANCA deficiency.
As for the neural manifestations of FA, microcephaly is a very common characteristic
(>90%) especially in FANCD2 patients 38. VACTERL (Vertebral anomalies, Anal atresia,
Cardiac defects, Tracheoesophageal fistula and/or Esophageal atresia, Renal & Radial
anomalies and Limb defects) with hydrocephalus syndrome is also widespread in FANCB
patients. The observed neuronal differentiation defects of FA-NSCs could contribute to
these neurogenesis defects. This also supports a notion that adult neurogenesis in FA
individuals may be prematurely impaired 51. In addition, reduced survival of FA-NSCs in
the presence of DNA damage reagents suggests a mechanism for aging-dependent
exhaustion of the NSC pool 42. Furthermore, our gene expression profiling shows that FA-
NSCs are associated with an induction of tumor-related genes and downregulation of tumor-
suppressor genes. This may be relevant to a previous report showing that FA patients
carrying the FANCD1 mutation exhibit a predisposition to develop medulloblastoma 52.
These new findings suggest an increased risk of malignant transformation in FANCA-
mutated neural progenitors and allow for the identification of molecular markers of FA-
associated tumor risk factors for clinical diagnosis. It should be noted that data regarding
FA-NSC phenotypes are subjected to the limitations of the in vitro neuronal differentiation
model. In the future, it would be of interest to study the behavior of FA-NSCs in a
transplantable in vivo model.
There is an unmet need for a reliable platform allowing for the screening and evaluation of
novel drug candidates for the treatment of FA. Other than its value in elucidating FA
pathogenesis, the FA-iPSC/ESC model could be a useful tool for pharmacologic studies.
iPSCs/ESCs can be differentiated into multiple types of hematopoietic cells in unlimited
amounts. The isogenic diseased and corrected FA-iPSC and isogenic ESC lines reported
here provide the most stringent and scalable screening conditions against the confounding
effects that may arise due to genetic background variations. We demonstrate the usefulness
of our system in drug evaluation by reproducing the beneficial effects of several compounds
known to correct FA phenotypes in other FA models. Moreover, our system allowed for the
discovery of a novel candidate drug for the alleviation of FA phenotypes. Although further
study is needed to understand its mechanisms of action, tremulacin appears to suppress
inflammatory cytokines at the transcription level. Furthermore, we show that doramapimod
Liu et al. Page 10
Nat Commun. Author manuscript; available in PMC 2015 January 12.
NIH
-PA
Author M
anuscriptN
IH-P
A A
uthor Manuscript
NIH
-PA
Author M
anuscript

and tremulacin could rescue the hematopoietic defects of FA patient BM. Previous studies
have raised the idea that inhibiting the action of proinflammatory cytokines could improve
FA BM function 46, 53. Our data provide the first experimental evidence supporting this
hypothesis. These results validate our iPSC-based FA model as a platform for discovering
novel drugs and for studying drug mechanisms of action.
Lastly, we showed that our FA-iPSC/ESC model complemented by a stringent isogenic
disease-free control is amenable to genome-wide interrogations of novel networks of
pathogenesis pathways. In summary, the FA disease model established here represents a
multifaceted practical platform for studying FA pathogenesis, for discovering novel
therapeutic drugs and for the development of FA cell replacement therapies.
Methods
Antibodies and plasmids
Antibodies were purchased from the following companies (catalogue number and dilution
for immunofluorescence or FACS). BD Biosciences: anti-human CD43-APC (560198,
1:50), anti-human CD43-FITC (555475, 1:50), anti-CD34-PE (555822, 1:50), anti-CD90-
FITC (555595, 1:100), anti-CD73-PE (550257, 1:50), isotype control APC (555751, 1:50),
isotype control PE (555749, 1:50), isotype control FITC (555742, 1:50); Miltenyi Biotec:
anti-human CD34-APC (130-090-954, 1:50), anti-human CD34-PerCP Vio700
(130-097-915, 1:50); eBioscience: anti-CD105-APC (17-1057-42, 1:100); Biolegend: Alexa
Fluor® 647 anti-human Ki-67 (350509, 1:20), Alexa Fluor® 647 Mouse IgG1, κ Isotype
control (400130, 1:20); R&D Systems: anti-human Tra-1-85 APC (FAB3195A, 1:50); Santa
Cruz Biotechnology: anti-OCT-3/4 (sc-5279, 1:100), anti-SOX2 (sc-17320, 1:100), anti-
Lamin B1 (sc-6217, 1:80), anti-FANCD2 (sc-20022, 1:50), and anti-WRN (sc-5629, 1:100),
recombinant human Annexin V fluorescein reagent (NX50); Abcam: anti-NANOG
(ab21624, 1:100), anti-Ki67 (ab16667, 1:1000), anti-FANCD2 (ab2187, 1:120); Millipore:
anti-NESTIN (MAB5326, 1:500), Tra-1-60 (MAB4360, 1:100); Sigma: anti-β-Tubulin III/
TujI (T2200, 1:500); Covance: anti-PAX6 (PRB-278P, 1:500). pCXLE-hOCT3/4, pCXLE-
hOCT3/4-shp53-F, pCXLE-hSK, and pCXLE-hUL were purchased from Addgene (27076,
27077, 27078, and 27080, respectively) 22. Lentiviral FANCA expression vector (pCCL-
PGK-FANCAWp) was generated in previous study 54. For generating FANCA knockout
ESCs, two TALEN expression plasmids (TAL2416 and TAL2417) were purchased from
Addgene (36817 and 36818, respectively) 55.
Cells
Human Fanconi Anemia fibroblasts (FA123) (homozygous for FANCA C295T, male, 19
year old) were previously described 20. The control fibroblasts (FA52) were isolated from a
FA patient initially bearing compound heterogeneous FANCA mutations (Mutation 1: C
3558insG (R1187E fsX28); Mutation 2: C710-5T>C (Splicing mutation, skipping of exon
8)) 56, which upon growth obtain spontaneous reversion of the pathological FANCA alleles
in the patient. This line was used as a control for FA123 in order to exclude the non-specific
effect of FA-associated profound epigenetic and genetic changes. These dermal fibroblasts
were obtained after signed informed consent of the donors, the approval of the Ethics
Liu et al. Page 11
Nat Commun. Author manuscript; available in PMC 2015 January 12.
NIH
-PA
Author M
anuscriptN
IH-P
A A
uthor Manuscript
NIH
-PA
Author M
anuscript

Committee and the approval of the “Comisión de Seguimiento y Control de la Donación de
Células y Tejidos Humanos del Instituto de Salud Carlos III” (project number: 110-90-1).
H9 human ESCs were purchased from WiCell Research. Human ESCs and generated iPSC
lines were cultured on Matrigel or mitotically inactivated MEF cells. A FANCC patient-
derived lymphoblast cell line HSC536N is purchased from the Coriell Institute and cultured
as recommended by the vendor. Human bone marrow CD34+ cells from a healthy individual
were purchased from Allcells (Alameda, CA). FA patient BM cells were isolated from two
FA patients bearing FANCA mutations (Patient 1: c. 710-5T>C and c. 790C>T; Patient 2:
biallelic deletions at exon 15-20). These FA patient BM samples were obtained from
patients that gave informed consent. Approvals were obtained from the Ethics Committee at
the G.Gaslini Hospital, Genova, Italy (protocol n° J5002; date: 24/9/2010).
iPSC generation
One million human fibroblasts were electroporated with pCXLE-hOCT3/4-shp53-F (or
pCXLE-hOCT3/4), pCXLE-hSK, and pCXLE-hUL using a Nucleofector (Lonza) 21. Four
days later, cells were re-plated onto mitotically inactivated MEF feeders in human ESC
medium supplemented with 0.5 mM sodium butyrate (Sigma). After an additional 10 days,
the cells were switched to human ESC medium without sodium butyrate and cultured until
the colonies could be mechanically picked onto new MEF feeders. For reprogramming in
hypoxia, electroporated fibroblasts were cultured in a 5% O2 condition for 40 days. The
generated FA-iPSC lines were maintained by manual picking, since enzyme-mediated
passaging caused compromised cell survival.
Lentiviral infection of FA-iPSCs
Lentiviruses were expressed and purified according to a recently published protocol 57. FA-
iPSCs cultured on MEF feeders were incubated with 10 μM Y-27632 for 3 h and then
individualized with Accumax (Innovative Cell Technologies). Cells were transduced in
suspension with lentiviral FANCA expression vector in the presence of Y-27632 and 4
μg/ml polybrene for 1 h. After brief centrifugation to remove the residual lentivirus, the cells
were seeded back on fresh MEF feeders in human ESC media containing Y-27632. After
being cultured for 1 week, small iPSC colonies were manually passaged onto fresh MEF
feeders and expanded as new iPSC lines. Ectopic expression of FANCA protein in different
FA-iPSC lines were verified by Western blotting.
Bisulfite sequencing
Genomic DNA from the iPSC lines was extracted with Qiagen Blood and Tissue kit.
Bisulfite conversion of DNA was carried out using the Zymo EZ DNA Methylation-direct
Kit (Zymo Research) following the manufacturer’s recommendations. A genomic fragment
of the Oct4 promoter was amplified with previously published primers using the 2× Zymo
Taq Premix per manufacturer instructions 21, 27. PCR products were purified by gel
extraction using QIAquick columns, and subsequently cloned into the pCR2.1-TOPO vector
(Invitrogen). Ten clones from each sample were sequenced with the M13 universal primer.
Liu et al. Page 12
Nat Commun. Author manuscript; available in PMC 2015 January 12.
NIH
-PA
Author M
anuscriptN
IH-P
A A
uthor Manuscript
NIH
-PA
Author M
anuscript
Teratoma analysis
Following injection of iPSC lines into NOD-SCID IL2Rgammanull mice (Jackson
Laboratories) teratoma formation was analyzed to confirm pluripotency in vivo. Briefly,
mice were anaesthetized and iPSCs were injected into testis. Teratoma formation was
monitored. About 10-15 weeks after injection, animals were sacrificed. Teratomas were
assessed by immunostaining. The Salk Institute Institutional Animal Care and Use
Committee (IACUC) and Chinese Academy of Science Institutional Animal Care and Use
Committee approved all murine experiments.
Protein and nucleic acid analysis
Protein quantification was performed with BCA approach (Thermo Fisher Scientific).
Protein lysate was subjected to NuPAGE® Novex Tris-Acetate Gel or Bis-Tris Gel
(Invitrogen) and electrotransfered to a PVDF membrane (Millipore). Mono-ubiquitination of
FANCD2 in pluripotent stem cells were determined by Western blotting with anti-FANCD2
antibody 32. Total RNA extraction and cDNA synthesis were performed with TRIzol
(Invitrogen) and High capability RNA-to-cDNA Mater Mix (Invitrogen). Quantitative RT–
PCR was carried out with SYBR Green PCR Master Mix (Applied Biosystems). To
determine copy numbers of transgenes and endogenous genes, genomic DNA was extracted
with the DNeasy Blood & Tissue Kit (QIAGEN) and used as template in absolute
quantification qPCR assays using the standard curve method 21, 22. Primer sequences are
given in Supplementary Table 1.
Immunofluorescence microscopy
Cells were fixed with 4% formaldehyde in PBS for 20min at room temperature, and then
permeabilized with 0.4% Triton X-100. After a blocking step with 10% FBS in PBS, cells
were incubated with the primary antibody at 4 °C overnight, followed by incubation at room
temperature with the corresponding secondary antibody for 1 h. Nuclei were counterstained
with Hoechst 33342 (Invitrogen).
Flow cytometry analysis
For cell-cycle analysis of pluripotent stem cells expressing the marker Tra-1-60 or Tra-1-81,
cultures of iPSCs growing on MEFs were collected using TrypLE Express (Invitrogen).
Cells were incubated with a Tra-1-60 or Tra-1-81 antibody in 1% PBS-BSA for 30 minutes
followed by incubation with a secondary Alexa-Fluor 488 anti-mouse antibody (Invitrogen)
for another 30 minutes. After this incubation, cells were fixed in aldehyde-based fixative
overnight. A Click-iT EdU flow cytometry analysis kit (Invitrogen) was used to analyze the
proliferation of the Tra-1-60 or Tra-1-81 positive population of cells following
manufacturer’s recommendations. For cell-cycle analysis of HPCs, differentiated cells were
stained with anti-human CD34-PE and anti-human CD43-FITC, fixed and permeabilized
using the BD Cytofix/Cytoperm™ kit, stained with Alexa Fluor® 647 anti-human Ki-67 and
DAPI, and then analyzed on a BD LSRFortessa cytometer. For apoptosis analysis of HPCs,
differentiated cells were stained with anti-human CD34-PE, anti-human CD43-APC and
Annexin V FITC, and analyzed on a BD LSRFortessa cytometer.
Liu et al. Page 13
Nat Commun. Author manuscript; available in PMC 2015 January 12.
NIH
-PA
Author M
anuscriptN
IH-P
A A
uthor Manuscript
NIH
-PA
Author M
anuscript
Construction and preparation of HDAdVs
FANCA-c-HDAdV for gene correction was generated using a BAC clone containing the
human FANCA locus (CTD-2327D14, Invitrogen), that was modified using BAC
Recombineering 58. In brief, an FRT-PGK-EM7-neo-bpA-FRT fragment was recombined
into intron 4 of FANCA in the BAC clone. A total of 18.3 kb of FANCA homology,
including the marker cassette, was subcloned into the HDAdV plasmid pCIHDAdGT8-4
(kindly provided by Dr. Kohnosuke Mitani). The generated FANCA-c-HDAdV plasmid was
linearized by PI-SceI (NEB) and then transfected into 116 cells (kindly provided by Dr.
Philip Ng) in the presence of helper virus AdHPBGF35 (kindly provided by Dr. André M.
Lieber) 59. Crude virus extracts were serially amplified in 116 cells and then purified
according to a previously described method 28, 60. βgal-transducing units (btu) were
determined in 293 cells to define infectious vector titers.
Isolation of gene-corrected human iPSCs
For generation of gene-corrected iPSCs, eleven separate experiments were performed and a
total of 1.97 × 10⁷ FANCA patient iPSCs were infected with FANCA-c-HDAdV at
multiplicity of infection (MOI) of 3-30 btu/cell. Two to four days after infection, G418
(25-450 μg/ml; Invitrogen) was added to the medium to start positive selection. After 10-13
days, 4 μM Ganciclovir (GANC; Invitrogen) in addition to G418 was added to the medium
to start negative selection. After an additional 5-7 days, G418/GANC double-resistant clones
were transferred to 96-well plates and expanded for further characterization. Gene-targeted
clones were determined by PCR of genomic DNA from drug-resistant clones with the
following primers (P1, 5′- GGAACCCACTGGTCATGTTTGCTTTTGCCCAT -3′; P2, 5′-
CCCCAAAGGCCTACCCGCTTCCATTGCTCA-3′; P3, 5′-
CTACCTGCCCATTCGACCACCAAGCGAAACATC-3′; P4, 5′-
TACCAGGTTATAGTAGCTCAGGAATGCTAAGTCGCTCA-3′; see Fig. 3A) using LA
Taq DNA Polymerase and GC Buffer (TAKARA). Long PCR cycling included a 1 min
initial denaturation at 94°C, 14 cycles of 10 sec denaturation at 98°C and a 10 min annealing
and extension at 68°C, 21 cycles of 10 sec denaturation at 98°C and a 10 min plus 5 sec/
cycle annealing and extension at 68°C plus a final extension at 68°C for 10 min. To
determine gene-corrected clones, exon 4 of FANCA was PCR-amplified with the following
primers: 5′-TTGCCCACCGTTTCTCACTTTATTGAATGCAGACC-3′ and 5′-
AGGCAACCATCCCGGCTGAGAGAATACCCA -3′ with Phusion High-Fidelity DNA
Polymerase (NEB). Amplicons were sequenced using an ABI 3730 sequencer (Applied
Biosystems). Finally, one gene-corrected clone was generated.
Excision of the neomycin-resistance cassette
To efficiently remove the neomycin-resistance cassette, we generated a pCAG-Flpo-2A-
puro vector, which, under control of a CAG promoter, expresses the genes for Flpo
recombinase 61, and puromycin N-acetyltransferase (puro). FANCA gene-corrected iPSCs
cultured on Matrigel were transfected with pCAG-Flpo-2A-puro vector using FuGENE HD
(Promega). Two days after transfection, puromycin (1 μg/ml; Invitrogen) was added to the
medium to enrich Flpo recombinase expressing cells. Two days later, puromycin was
withdrawn, and after about 10 days, cells were individualized and plated onto MEF feeder
Liu et al. Page 14
Nat Commun. Author manuscript; available in PMC 2015 January 12.
NIH
-PA
Author M
anuscriptN
IH-P
A A
uthor Manuscript
NIH
-PA
Author M
anuscript

cells at a density of 300-3000 cells / 75 cm2 in the presence of 10 μM Y-27632 (Biomol
Inc.). After 2 weeks, the emerging colonies were picked and expanded. Removal of the
neomycin-resistance cassette was verified by PCR using LA Taq Hot Start Version
(TAKARA) and DNA sequencing with the following primers: with the following primers:
5′- GCCCACCGTTTCTCACTTTATTGAATGCAGACCA-3′ and 5′-
TGCCTCCATCCAGATCAACAGAACATTGCC-3′.
Generation of FANCA gene-knockout human ESCs
For generation of biallelic FANCA gene-knockout human ESCs, we performed two rounds
of transcription activator-like effector nuclease (TALEN)-mediated gene targeting. In brief,
the donor plasmids were constructed by the combination of 1.3-1.5 kb homology arms and
drug resistance cassettes (neo or puro). For the 1st round of gene knockout, 1.5 × 10⁷
feeder-free cultured wild-type H9 human ESCs (ESC-FA+/+) were dissociated by TrypLE,
and resuspended in 1 ml of MEF-conditioned medium containing 10 μM ROCK inhibitor
Y-27632. Cells were electroporated with 10 μg of TALEN expression plasmids each
(TAL2416 and TAL2417) and 30 μg of donor vectors and were plated onto 100 mm dishes
precoated with 1 × 10⁶ irradiated multiple drug resistant DR4 MEFs (ATCC). Four days
after electroporation, G418 (50 μg/ml) was added to the medium. After 5 days, G418
concentration was increased to 100 μg/ml. After 14 days, G418-resistant clones were
transferred to 96-well plates and expanded for genotyping. The determined heterozygous
knockout clones (ESC-FA+/−) were used in another round of gene knockout. For this, we
repeated the same steps with a puromycin resistant donor and puromycin selection (1 μg/ml)
instead of a neomycin resistant donor and G418 selection.
To determine biallelic knockout clones, exon 1-2 of FANCA was PCR-amplified with the
following primers (P1, 5′- TCGGCTTGGTTGGCCAGGTGGTCTCT-3′ and P2, 5′-
CGCCTCGGGTGTTTTCTTAGGAAAGCTGT-3′, see Fig. 8A) with PrimeSTAR GXL
DNA Polymerase (TAKARA). Finally, three biallelic FANCA knockout clones (ESC-FA−/
−) were generated.
Southern blotting
Ten μg of genomic DNA for each sample was digested with NcoI (NEB) and subjected to 4
h at 50 V on a 0.65% agarose gel. The gel was subsequently incubated in depurination
buffer (0.25 M HCl) for 15 min followed by 30 min incubation in denaturation buffer (1.5 M
NaCl, 0.5M NaOH). The DNA was then blotted overnight onto a Hybond XL (GE
Healthcare) by capillary transfer in denaturation buffer. The membrane was incubated in
neutralization buffer (0.5 M Tris-HCl [pH 7.4], 1.5 M NaCl) for 20 min followed by UV
crosslinking. The 5′ and 3′ probes were amplified from BAC DNA (CTD-2327D14) with
the following primers (5′ probe, 5′- TCCCAGAGCAGAGACAGAGGAAGCCC-3′ and 5′-
CACGCCCAGCCAGGACCCAT -3′; 3′ probe, 5′-
GCAGGTATCACACAAATTACAGAAGATTACCA-3′ and 5′-
AGGAACATACCAGCACCTCACGAT-3′) using LA Taq Hot Start Version, following the
manufacturer’s protocol. The probes were labeled with dCTP [−32P] (Perkin Elmer), and
Southern hybridization was performed following the standard protocol.
Liu et al. Page 15
Nat Commun. Author manuscript; available in PMC 2015 January 12.
NIH
-PA
Author M
anuscriptN
IH-P
A A
uthor Manuscript
NIH
-PA
Author M
anuscript

Hematopoietic differentiation
Hematopoietic differentiation efficiency and hematopoietic colony formation activity were
assayed as previously described 62 with some modifications. iPSCs (passage 11) and ESCs
cultured on MEF feeders in human ESC medium were manually dissociated and plated on 8
days old overgrown OP9 feeders to start differentiation. Cells were co-cultured with the OP9
feeders for 12-14 days in OP9 differentiation medium (Alpha MEM containing 10% FBS,
100 μM monothioglycerol and 50 μg/ml ascorbic acid) as described 62. Differentiated cells
were dissociated with collagenase and Accutase (Innovative Cell Technologies) and
subjected to flow cytometry analyses, cell sorting, qPCR analyses and clonogenic progenitor
cell assays. Primer sequences for qPCR are given in Supplementary Table 1.
Clonogenic progenitor cell assay
Hematopoietic clonogenic assays were performed in 35-mm low adherent plastic dishes
(Stem Cell Technologies) in triplicate using 1.1 ml/dish of MethoCult GF + H4435
semisolid medium (Stem Cell Technologies) or StemMACS human HSC-CFU complete
medium with Epo (Miltenyi Biotec, 130-091-280). Colony-forming cells (CFCs) were
scored after 15 days of incubation. Cytospins were stained with Wright stain (Millipore)
according to manufacturer’s instructions.
Generation and characterization of MSCs
In order to guide differentiation to mesenchymal stem cells (MSCs) from iPSC (passage 11)
or ESC lines, groups of 10-14 EBs were plated on matrigel coated 6 well plates in αMEM
(Invitrogen) medium with 10% fetal bovine serum (FBS, Gibco), 1% penicillin/streptomycin
(Gibco), 10 ng/ml bFGF (JPC), and 5 ng/ml TGFb (humanzyme). Cells were left to
differentiate for 2 weeks, until confluent fibroblast-like populations appeared. After one
passage the differentiated MSC-like cells were analyzed by FACS using different antibodies
related to the MSC signature. Cells were stained with antibodies against CD73, CD90, and
CD105. Further differentiation towards bone, cartilage and adipose cells was performed in
order to demonstrate MSC functionality. In order to evaluate the differentiation capacity to
osteogenic fate, MSC lines were seeded in osteogenic media [αMEM (Invitrogen) with 10%
FBS, 1% penicillin/streptomycin, 10 μM β-glicerolphosphate (Sigma), 0.2 mM ascorbate-2-
phosphate (Sigma), and 0.01 mM dexamethasone (Sigma)]. In the same manner, in order to
evaluate chondrogenic differentiation, pellets of 200,000 MSCs, were suspended in
chondrogenic media [DMEM-high glucose (Invitrogen) with 1% penicillin/streptomycin, 10
ng/ml TGF-β3 (R&D Systems), 50 mg/ml ITS+Premix (BD), 50 g/ml proline (Sigma), 50
μg/ml ascorbate-2-P (Sigma), and 0.1 μM dexamethasone (Sigma)]. For adipogenic
differentiation, once MSCs reached 95–100% confluency, expansion media was replaced
with adipogenic media [αMEM with 10% FBS, 1% penicillin/streptomycin, 50 μM
indomethacin (Sigma), 0.5 mM IBMX (Sigma), and 1 μM dexamethasone (Sigma)]. All
differentiation protocols were maintained for approximately 21 days. Analysis of cell
differentiation was performed by histochemical staining with Oil red O (adipogenic), von
Kossa (osteogenic), and Alcian blue (chondrogenic) kits (IHC world).
Liu et al. Page 16
Nat Commun. Author manuscript; available in PMC 2015 January 12.
NIH
-PA
Author M
anuscriptN
IH-P
A A
uthor Manuscript
NIH
-PA
Author M
anuscript
NSC generation from iPSCs and ESCs
Neural induction was performed as previously described with some modifications 63.
Induction was initiated by passaging iPSCs (passage 11) or ESCs onto MEF feeder cells at
roughly 20% confluency using dispase. Neural Induction Medium 1 (NIM-1: 50%
Advanced DMEM/F12 (invitrogen), 50% Neurobasal (invitrogen), 1× N2 (invitrogen), 1×
B27 (invitrogen), 2 mM GlutaMAX (Invitrogen) and 10 ng/mL hLIF (Millipore), 4 μM
CHIR99021 (Cellagentech), 3 μM SB431542 (Cellagentech), 2 μM Dorsomorphin (Sigma),
and 0.1 μM Compound E (EMD Chemicals Inc.) was used for the first 2 days. Culture
medium was then switched to Neural Induction Medium 2 (NIM-2: 50% Advanced DMEM/
F12, 50% Neurobasal, 1× N2, 1× B27, 2 mM GlutaMAX, 10 ng/mL hLIF, 4 μM
CHIR99021, 3 μM SB431542 and 0.1 μM Compound E) and maintained for 5 days.
Accumax (Innovative Cell Technologies) was used to passage cells onto Matrigel-coated
plates. Cultures were subsequently maintained in Neural Stem cell Maintenance Medium
(NSMM) containing 50% Advanced DMEM/F12, 50% Neurobasal, 1× N2, 1× B27, 2 mM
GlutaMAX, 10 ng/mL hLIF, 3 μM CHIR99021, and 2 μM SB431542.
Neuronal differentiation assay
10,000 NSCs were seeded on Matrigel-coated 35 mm wells and maintained in NSMM for
3-5 days. For spontaneous neuronal differentiation, cultures were switched to differentiation
medium containing DMEM/F12, 1× N2, 1× B27, 400 μM dbcAMP (Sigma), 200 μM
Ascorbic acid (Sigma), 10 ng/ml BDNF (Peprotech), and 10 ng/ml GDNF (Peprotech). After
two days, laminin (Sigma) was added to cells to encourage differentiation. Cultures were
maintained in differentiation medium for a total of 14 days, followed by immunostaining
with neuronal marker Tuj1.
Small molecule pharmacologic study
Resveratrol (Sigma, R5010-100MG), Danazol (Sigma, D8399-100MG), Doramapimod
(BIRB 796, LC Laboratories, D-2444), Dasatinib (LC Laboratories, D-3307) and
Tremulacin (Santa Cruz Biotech, sc-237233) were dissolved in DMSO and used at
concentrations as indicated. At least three concentrations were tested for each drug in a pilot
screen, and an optimal concentration was picked in a later confirmative study. Because early
hematopoietic specification of FA-iPSCs is normal, we treated the differentiating FA-iPSC
for one week starting on day 6 of differentiation, when the expression of HPC marker genes
were at the highest levels. Drugs were added at day 6 of the iPSC hematopoietic
differentiation protocol, as described above, and renewed every 2 days. At the end of the
differentiation, differentiated cells were harvested and used for RNA extraction for RT-
qPCR analysis of gene expression, or stained with anti-human CD34-PE, anti-human CD43-
FITC and anti-human Tra-1-85-APC, and subjected to flow cytometric analyses as
described. For colony forming unit assay, FA-iPSCs were differentiated as described.
CD34+ cells were sorted from the differentiated cells by a BD FACSAria II cytometer.
Equal number of CD34+ cells was plated in Methocult (Stem Cell Technologies, H4435) in
the presence of doramapimod (5 μM) and DMSO, respectively. To examine the drug effects
on MSCs, iPSC and ESC derived MSCs were cultured in the presence of doramapimod (5
μM), tremulacin (5 nM), or DMSO in passage 0-3 for iPSC-derived or in passage 0-5 for
Liu et al. Page 17
Nat Commun. Author manuscript; available in PMC 2015 January 12.
NIH
-PA
Author M
anuscriptN
IH-P
A A
uthor Manuscript
NIH
-PA
Author M
anuscript

ESC-derived MSCs. The drug effects were calculated as the number of drug treated cells
normalized to the number of DMSO treated cells. For studying the drug effects on Fanconi
patient BM cells, CFU assay was performed as described above in StemMACS human HSC-
CFU complete medium with Epo in triplicate in the presence of indicated compounds.
Colonies were enumerated after 2 weeks.
TNFα ELISA and qRT-PCR
TNFα assays were performed as described previously 46. Briefly, 100,000 HSC536N cells
were seeded per well in a 96-well plate. Cells were treated with vehicle (DMSO),
doramapimod (500 nM) or tremulacin (5 nM) for 6 hours. After 6 hours incubation, cell
culture supernatants were collected and assayed for human TNFα using the human TNFα
Quantikine ELISA kit (R&D Systems). The cell pellets were used for RNA extraction using
the Qiagen RNeasy kit and qRT-PCR analysis of TNF mRNA. Primer sequences are given
in Supplementary Table 1.
Cell viability analysis
To measure MMC sensitivity, 2-6 × 10⁴ iPSCs, 5-7 × 10⁴ ESCs or 1 × 10⁵ NSCs were
plated on matrigel coated 96 well plates (CytoOne). The following day, cells were treated
with 0-40 ng/ml (iPSC), 0-30 ng/ml (ESC) or 0-2 μg/ml (NSCs) MMC (BIOMOL) for 24
hours. Two days after damage, survival was assessed using CellTiter 96 AQueous One
Solution Cell Proliferation Assay (Promega). To measure MMC sensitivity of HPCs,
CD34+/CD43+ HPCs were FACS sorted from differentiated FA-iPSCs, C-FA-iPSCs and
ctrl-iPSCs and cultured in a medium (Stemspan, 10 ng/ml IGF2, 10 ng/ml FGFa, 50 ng/ml
TPO, 50 ng/ml Flt3L and 50 ng/ml SCF) containing various concentrations of MMC for 24
hour before being used in CFU assays as described above.
Chromosome fragility test
To measure a chromosomal instability with a DNA crosslink reagent, feeder-free cultured
human ESCs/iPSCs were treated with 0-0.1 μg/ml diepoxybutane (DEB; Sigma) for 48
hours. The cells were further treated with KaryoMAX Colcemid solution (Invitrogen) at a
final concentration of 20 ng/ml for 45 min. Staining and chromosomal fragility evaluation
were described in previous study 26.
RNA-seq
Reads were aligned to the reference genome (hg19, GRCh37) by using the program tophat2
(v2.0.8b) 64 considering the read strand and the annotation data (Ensembl version 70 from
iGenomes website [http://cufflinks.cbcb.umd.edu/igenomes.html]). Alignments were then
fed to the program cuffdiff 65 to estimate the differential expression between the samples
choosing the ‘blind’ dispersion method. The results were then analyzed by using the
program cummerbund 64 to make dendrograms.
ChIP-seq
Reads were aligned to the reference genome (hg19, GRCh37) by using the program bowtie2
(version 2.1.0) 66 with default parameters. Mapped reads were then investigated for the
Liu et al. Page 18
Nat Commun. Author manuscript; available in PMC 2015 January 12.
NIH
-PA
Author M
anuscriptN
IH-P
A A
uthor Manuscript
NIH
-PA
Author M
anuscript

presence of enrichment against the input by using the program MACS (version 1.4.2) 67.
Peaks with FDR lower or equal to 0.05 FDR were kept for the further analysis. BEDtools
package 68 was used for detecting the Ensembl genes (version 70) overlapping with the
detected peaks. A matrix of genes containing or not peaks for every sample was created and
used to calculate the dendrogram by using R (www.r-project.org/). Detection of
differentially enriched peaks between samples was realized by using MAnorm tool 69.
Genome-wide DNA methylation analysis
Methylation sequencing with bisulfite padlock probes was performed as previously
described 70. Briefly, genomic DNA was extracted from Ctrl-NSC, FA-NSC, and C-FA-
NSC using QIAamp DNA Micro Kit (QIAGEN). Approximately 1,000 ng of genomic DNA
was bisulfite converted with EZ-96 DNA Methylation-Lightning MagPrep kit (Zymo
Research). Normalized amount of the genome-wide scale padlock probe set was annealed to
250 ng of bisulfite converted genomic DNA, circularized, amplified and barcoded by PCR
using the library-free BSPP protocol 70. The resulting bisulfite sequencing libraries were
pooled in the same molar ratio, purified with 6% TBE PAGE gel (Invitrogen), and
sequenced by Illumina HiSeq2000 sequencer (110 bp, paired-end reads). The bisulfite reads
were mapped to the in silico bisulfite-converted human genome sequences (hg19) by
bisREADMapper 70. DNA methylation frequency at each CpG site with minimum 10×
depth coverage was calculated. Hierarchical clustering on genome-wide DNA methylation
was performed on all CpG sites shared in all three samples. Heatmap with dendrogram was
generated based on the variable CpG sites in the promoter regions (1.5 kb +/− from TSS) of
the genes rescued by C-FA-NSC.
DNA microarray and bioinformatics analysis
Ctrl-, FA- and C-FA-NSC samples were prepared in biological triplicates. Total RNA of all
samples was extracted using Trizol Reagent (Invitrogen) and purified by RNeasy Mini Kit
(QIAGEN). Affymetrix GeneChip PrimeView Human Gene Expression Arrays were
performed by the Functional Genomics Core Facility at the Salk Institute for Biological
Studies according to the manufacturer’s protocol (Affymetrix, Santa Clara, CA). Expression
signals were scanned on Affymetrix GeneChip Scanner 3000 7G. Statistical analysis of the
data was performed on the GenePattern platform from the Broad Institute (http://
www.broadinstitute.org/cancer/software/genepattern/). Briefly, raw CEL files were imported
into GenePattern software and normalized using RMA algorithm. Gene expression probes
with a minimal 3-fold difference in both scientific comparisons (Ctrl-NSC vs. FA-NSC; FA-
NSC vs. C-FA-NSC) were selected for further analysis. The Hierarchical Clustering analysis
was performed using the HierarchicalClustering module of the GenePattern software. The
dendrograms and the heat map of the clustered gene expression data were visualized by the
HierarchicalClusteringViewer module.
Array-based genomic hybridization (aCGH)
aCGH was performed to identify copy number alterations in the samples of interest (FA-
Fibroblasts, FA-iPSCs, C-FA-iPSCs and C-FA-MSCs). We used an in-house designed
microarray, based in the 8×60K Agilent slide platform, composed of ~60.000
oligonucleotide probes scattered throughout the Human genome, with an average coverage
Liu et al. Page 19
Nat Commun. Author manuscript; available in PMC 2015 January 12.
NIH
-PA
Author M
anuscriptN
IH-P
A A
uthor Manuscript
NIH
-PA
Author M
anuscript

of 1 probe / 30Kb in subtelomeric and pericentromeric regions, and 1/100Kb in the
remaining euchromatic portion of the genome. The design also included the recommended
set of 2.118 control probes from Agilent’s catalog. Before hybridization, DNA quality was
assessed by continuous reading of optical density using a Nanodrop 2000c machine (Thermo
Scientific), and DNA integrity was checked by electrophoresis and Sybr® Green II
(LifeTechnologies) staining. For each sample, 500 ng of Cy5-labeled DNA was hybridized
against 500 ng of a sex-matched reference DNA Cy3-labeled. For the present study control
DNA used in the hybridization was obtained from peripheral blood lymphocytes of an
anonymous donor male who consented the use of this material for research purposes. The
list of copy number variations (CNVs) alterations present in the control sample are indicated
in Supplementary Data 2. Labeling, hybridization, slide washing and scanning was
performed following Agilent’s recommended protocols (Agilent Oligonucleotide Array-
Based CGH for Genomic DNA Analysis - Enzymatic Labeling for Blood Cells or Tissues,
v6.0, Nov. 2008) with minor modifications, in an ozone-free environment to prevent dye
degradation. Raw data from images was extracted using Feature Extraction (Agilent, Palo
Alto, CA) and detection of copy number alterations was performed using ADM-2 algorithm.
Statistical analysis
Results are shown as mean±s.d. Comparisons were performed with student’s t-test.
Supplementary Material
Refer to Web version on PubMed Central for supplementary material.
Acknowledgements
We would like to thank K. Mitani, P. Ng and A. Lieber for HDAdV production; I. Sancho-Martinez for helpful discussions; P. Wang, R. Bai, J. Wu, and Roser Pujol for technical assistance, L. Mack, E. O’Connor and K. Marquez for help with flow cytometry; and M. Schwarz, P. Schwarz, and Y. Li for administrative help. This work was supported by the Strategic Priority Research Program of the Chinese Academy of Sciences (XDA01020312), National Basic Research Program of China (973 Program,2014CB964600;2014CB910500), NSFC (81271266, 31222039, 81330008, 31201111, 81371342, 81300261, 81300677), Key Research Program of the Chinese Academy of Sciences (KJZD-EW-TZ-L05), Beijing Natural Science Foundation (7141005; 5142016), the Thousand Young Talents program of China, National Laboratory of Biomacromolecules (012kf02, 2013kf05;2013kf11;2014kf02), and State Key Laboratory of Drug Research (SIMM1302KF-17). M.L. and K.S. are supported by CIRM fellowship. N.M was partially supported by La Fundació Privada La Marató de TV3, 121430/31/32 and Spanish Ministry of Economy and Competitiveness (Ref PLE 2009-0164). Y.T. was partially supported by an Uehara Memorial Foundation research fellowship. E.N. was partially supported by an F.M. Kirby Foundation postdoctoral fellowship. J.S. was supported by MINECO (SAF2012-31881) and Fundació Marató TV3 (464/C/2012). J.A.B. was supported by grants from Spanish Ministry of Economy and Competitiveness (International Cooperation on Stem Cell Research Plan E; Ref PLE 2009/0100 and SAF2012-39834) and La Fundació Privada La Marató de TV3, 121430/31/32. J.C.I.B. was supported by grants from the G. Harold and Leila Y. Mathers Charitable Foundation, The California Institute of Regenerative Medicine, Ellison Medical Foundation, and The Leona M. and Harry B. Helmsley Charitable Trust grant #2012-PG-MED002.
References
1. Kim H, D’Andrea AD. Regulation of DNA cross-link repair by the Fanconi anemia/BRCA pathway. Genes Dev. 2012; 26:1393–1408. [PubMed: 22751496]
2. Zhang QS, et al. Tempol protects against oxidative damage and delays epithelial tumor onset in Fanconi anemia mice. Cancer Res. 2008; 68:1601–1608. [PubMed: 18316625]
3. Bogliolo M, et al. Mutations in ERCC4, encoding the DNA-repair endonuclease XPF, cause Fanconi anemia. Am J Hum Genet. 2013; 92:800–806. [PubMed: 23623386]
Liu et al. Page 20
Nat Commun. Author manuscript; available in PMC 2015 January 12.
NIH
-PA
Author M
anuscriptN
IH-P
A A
uthor Manuscript
NIH
-PA
Author M
anuscript
4. Moldovan GL, D’Andrea AD. How the fanconi anemia pathway guards the genome. Annu Rev Genet. 2009; 43:223–249. [PubMed: 19686080]
5. Ceccaldi R, et al. Bone marrow failure in fanconi anemia is triggered by an exacerbated p53/p21 DNA damage response that impairs hematopoietic stem and progenitor cells. Cell Stem Cell. 2012; 11:36–49. [PubMed: 22683204]
6. Zhang QS, et al. Fancd2−/− mice have hematopoietic defects that can be partially corrected by resveratrol. Blood. 2010; 116:5140–5148. [PubMed: 20826722]
7. Zhang QS, et al. Fancd2 and p21 function independently in maintaining the size of hematopoietic stem and progenitor cell pool in mice. Stem Cell Res. 2013; 11:687–692. [PubMed: 23721813]
8. Dufour C, et al. TNF-alpha and IFN-gamma are overexpressed in the bone marrow of Fanconi anemia patients and TNF-alpha suppresses erythropoiesis in vitro. Blood. 2003; 102:2053–2059. [PubMed: 12750172]
9. Donahue SL, Lundberg R, Saplis R, Campbell C. Deficient regulation of DNA double-strand break repair in Fanconi anemia fibroblasts. J Biol Chem. 2003; 278:29487–29495. [PubMed: 12748186]
10. Schwaiger H, Hirsch-Kauffmann M, Schweiger M. UV-repair is impaired in fibroblasts from patients with Fanconi’s anemia. Mol Gen Genet. 1982; 185:454–456. [PubMed: 6954346]
11. Crossan GP, et al. Disruption of mouse Slx4, a regulator of structure-specific nucleases, phenocopies Fanconi anemia. Nat Genet. 2011; 43:147–152. [PubMed: 21240276]
12. Navarro S, et al. Hematopoietic dysfunction in a mouse model for Fanconi anemia group D1. Mol Ther. 2006; 14:525–535. [PubMed: 16859999]
13. Papapetrou EP. FA iPS: correction or reprogramming first? Blood. 2012; 119:5341–5342. [PubMed: 22679334]
14. Muller LU, et al. Overcoming reprogramming resistance of Fanconi anemia cells. Blood. 2012; 119:5449–5457. [PubMed: 22371882]
15. Raya A, et al. Disease-corrected haematopoietic progenitors from Fanconi anaemia induced pluripotent stem cells. Nature. 2009; 460:53–59. [PubMed: 19483674]
16. Yung SK, et al. Brief report: human pluripotent stem cell models of fanconi anemia deficiency reveal an important role for fanconi anemia proteins in cellular reprogramming and survival of hematopoietic progenitors. Stem Cells. 2013; 31:1022–1029. [PubMed: 23280624]
17. Yang YG, et al. The Fanconi anemia group A protein modulates homologous repair of DNA double-strand breaks in mammalian cells. Carcinogenesis. 2005; 26:1731–1740. [PubMed: 15905196]
18. Kim TM, Ko JH, Choi YJ, Hu L, Hasty P. The phenotype of FancB-mutant mouse embryonic stem cells. Mutat Res. 2011; 712:20–27. [PubMed: 21458466]
19. Wu C, Dunbar CE. Stem cell gene therapy: the risks of insertional mutagenesis and approaches to minimize genotoxicity. Front Med. 2011; 5:356–371. [PubMed: 22198747]
20. Callen E, et al. A common founder mutation in FANCA underlies the world’s highest prevalence of Fanconi anemia in Gypsy families from Spain. Blood. 2005; 105:1946–1949. [PubMed: 15522956]
21. Li M, et al. Efficient correction of hemoglobinopathy-causing mutations by homologous recombination in integration-free patient iPSCs. Cell Res. 2011; 21:1740–1744. [PubMed: 22105484]
22. Okita K, et al. A more efficient method to generate integration-free human iPS cells. Nat Methods. 2011; 8:409–412. [PubMed: 21460823]
23. Mali P, et al. Butyrate greatly enhances derivation of human induced pluripotent stem cells by promoting epigenetic remodeling and the expression of pluripotency-associated genes. Stem Cells. 2010; 28:713–720. [PubMed: 20201064]
24. Yoshida Y, Takahashi K, Okita K, Ichisaka T, Yamanaka S. Hypoxia enhances the generation of induced pluripotent stem cells. Cell Stem Cell. 2009; 5:237–241. [PubMed: 19716359]
25. Sala-Trepat M, Rouillard D, Escarceller M, Laquerbe A, Moustacchi E, Papadopoulo D. Arrest of S-phase progression is impaired in Fanconi anemia cells. Exp Cell Res. 2000; 260:208–215. [PubMed: 11035915]
Liu et al. Page 21
Nat Commun. Author manuscript; available in PMC 2015 January 12.
NIH
-PA
Author M
anuscriptN
IH-P
A A
uthor Manuscript
NIH
-PA
Author M
anuscript

26. Castella M, et al. Chromosome fragility in patients with Fanconi anaemia: diagnostic implications and clinical impact. J Med Genet. 2011; 48:242–250. [PubMed: 21217111]
27. Liu GH, et al. Targeted gene correction of laminopathy-associated LMNA mutations in patient-specific iPSCs. Cell Stem Cell. 2011; 8:688–694. [PubMed: 21596650]
28. Suzuki K, et al. Highly efficient transient gene expression and gene targeting in primate embryonic stem cells with helper-dependent adenoviral vectors. Proc Natl Acad Sci U S A. 2008; 105:13781–13786. [PubMed: 18768795]
29. Mitani K, Graham FL, Caskey CT, Kochanek S. Rescue, propagation, and partial purification of a helper virus-dependent adenovirus vector. Proc Natl Acad Sci U S A. 1995; 92:3854–3858. [PubMed: 7731995]
30. Palmer DJ, Ng P. Helper-dependent adenoviral vectors for gene therapy. Hum Gene Ther. 2005; 16:1–16. [PubMed: 15703484]
31. Tolar J, et al. Stem cell gene therapy for fanconi anemia: report from the 1st international Fanconi anemia gene therapy working group meeting. Mol Ther. 2011; 19:1193–1198. [PubMed: 21540837]
32. Tulpule A, et al. Knockdown of Fanconi anemia genes in human embryonic stem cells reveals early developmental defects in the hematopoietic lineage. Blood. 2010; 115:3453–3462. [PubMed: 20089964]
33. Lensch MW, Daley GQ. Origins of mammalian hematopoiesis: in vivo paradigms and in vitro models. Curr Top Dev Biol. 2004; 60:127–196. [PubMed: 15094298]
34. Vodyanik MA, Thomson JA, Slukvin II. Leukosialin (CD43) defines hematopoietic progenitors in human embryonic stem cell differentiation cultures. Blood. 2006; 108:2095–2105. [PubMed: 16757688]
35. Lecourt S, et al. Bone marrow microenvironment in fanconi anemia: a prospective functional study in a cohort of fanconi anemia patients. Stem Cells Dev. 2010; 19:203–208. [PubMed: 19572808]
36. Li Y, et al. Mesenchymal stem/progenitor cells promote the reconstitution of exogenous hematopoietic stem cells in Fancg−/− mice in vivo. Blood. 2009; 113:2342–2351. [PubMed: 19129541]
37. Mendez-Ferrer S, et al. Mesenchymal and haematopoietic stem cells form a unique bone marrow niche. Nature. 2010; 466:829–834. [PubMed: 20703299]
38. Faivre L, et al. European Fanconi Anemia Research Group. Association of complementation group and mutation type with clinical outcome in fanconi anemia. Blood. 2000; 96:4064–4070. [PubMed: 11110674]
39. Kalb R, et al. Hypomorphic mutations in the gene encoding a key Fanconi anemia protein, FANCD2, sustain a significant group of FA-D2 patients with severe phenotype. Am J Hum Genet. 2007; 80:895–910. [PubMed: 17436244]
40. Tischkowitz MD, Hodgson SV. Fanconi anaemia. J Med Genet. 2003; 40:1–10. [PubMed: 12525534]
41. Titus TA, et al. The Fanconi anemia/BRCA gene network in zebrafish: embryonic expression and comparative genomics. Mutat Res. 2009; 668:117–132. [PubMed: 19101574]
42. Sii-Felice K, et al. Fanconi DNA repair pathway is required for survival and long-term maintenance of neural progenitors. EMBO J. 2008; 27:770–781. [PubMed: 18239686]
43. Brennand KJ, et al. Modelling schizophrenia using human induced pluripotent stem cells. Nature. 2011; 473:221–225. [PubMed: 21490598]
44. Liu GH, et al. Progressive degeneration of human neural stem cells caused by pathogenic LRRK2. Nature. 2012; 491:603–607. [PubMed: 23075850]
45. Jaime-Perez JC, et al. Danazol as first-line therapy for aplastic anemia. Ann Hematol. 2011; 90:523–527. [PubMed: 21279356]
46. Anur P, et al. p38 MAPK inhibition suppresses the TLR-hypersensitive phenotype in FANCC- and FANCA-deficient mononuclear phagocytes. Blood. 2012; 119:1992–2002. [PubMed: 22234699]
47. Saadatzadeh MR, Bijangi-Vishehsaraei K, Kapur R, Haneline LS. Distinct roles of stress-activated protein kinases in Fanconi anemia-type C-deficient hematopoiesis. Blood. 2009; 113:2655–2660. [PubMed: 19168785]
Liu et al. Page 22
Nat Commun. Author manuscript; available in PMC 2015 January 12.
NIH
-PA
Author M
anuscriptN
IH-P
A A
uthor Manuscript
NIH
-PA
Author M
anuscript

48. Cheng GF, Liu DP, Yang DX, He KQ, Bai JY, Zhu XY. Antiinflammatory effects of Tremulacin, a Salicin-related substance isolated from Populus tomentosa Carr. leaves. Phytomedicine. 1994; 1:209–211. [PubMed: 23195941]
49. Vanderwerf SM, et al. TLR8-dependent TNF-(alpha) overexpression in Fanconi anemia group C cells. Blood. 2009; 114:5290–5298. [PubMed: 19850743]
50. Parmar K, D’Andrea A, Niedernhofer LJ. Mouse models of Fanconi anemia. Mutat Res. 2009; 668:133–140. [PubMed: 19427003]
51. Sii-Felice K, et al. Role of Fanconi DNA repair pathway in neural stem cell homeostasis. Cell Cycle. 2008; 7:1911–1915. [PubMed: 18604174]
52. Offit K, et al. Shared genetic susceptibility to breast cancer, brain tumors, and Fanconi anemia. J Natl Cancer Inst. 2003; 95:1548–1551. [PubMed: 14559878]
53. Garbati MR, Hays LE, Keeble W, Yates JE, Rathbun RK, Bagby GC. FANCA and FANCC modulate TLR and p38 MAPK-dependent expression of IL-1beta in macrophages. Blood. 2013; 122:3197–3205. [PubMed: 24046015]
54. Gonzalez-Murillo A, et al. Development of lentiviral vectors with optimized transcriptional activity for the gene therapy of patients with Fanconi anemia. Hum Gene Ther. 2010; 21:623–630. [PubMed: 20001454]
55. Reyon D, Tsai SQ, Khayter C, Foden JA, Sander JD, Joung JK. FLASH assembly of TALENs for high-throughput genome editing. Nat Biotechnol. 2012; 30:460–465. [PubMed: 22484455]
56. Castella M, et al. Origin, functional role, and clinical impact of Fanconi anemia FANCA mutations. Blood. 2011; 117:3759–3769. [PubMed: 21273304]
57. Liu GH, et al. Recapitulation of premature ageing with iPSCs from Hutchinson-Gilford progeria syndrome. Nature. 2011; 472:221–225. [PubMed: 21346760]
58. Datsenko KA, Wanner BL. One-step inactivation of chromosomal genes in Escherichia coli K-12 using PCR products. Proc Natl Acad Sci U S A. 2000; 97:6640–6645. [PubMed: 10829079]
59. Shayakhmetov DM, et al. Genome size and structure determine efficiency of postinternalization steps and gene transfer of capsid-modified adenovirus vectors in a cell-type-specific manner. J Virol. 2004; 78:10009–10022. [PubMed: 15331734]
60. Palmer DJ, Ng P. Physical and infectious titers of helper-dependent adenoviral vectors: a method of direct comparison to the adenovirus reference material. Mol Ther. 2004; 10:792–798. [PubMed: 15451463]
61. Raymond CS, Soriano P. High-efficiency FLP and PhiC31 site-specific recombination in mammalian cells. PLoS One. 2007; 2:e162. [PubMed: 17225864]
62. Vodyanik MA, Slukvin II. Hematoendothelial differentiation of human embryonic stem cells. Curr Protoc Cell Biol. 2007; 26 Chapter 23, Unit 23.
63. Li W, et al. Rapid induction and long-term self-renewal of primitive neural precursors from human embryonic stem cells by small molecule inhibitors. Proc Natl Acad Sci U S A. 2011; 108:8299–8304. [PubMed: 21525408]
64. Kim D, Pertea G, Trapnell C, Pimentel H, Kelley R, Salzberg SL. TopHat2: accurate alignment of transcriptomes in the presence of insertions, deletions and gene fusions. Genome Biol. 2013; 14:R36. [PubMed: 23618408]
65. Trapnell C, Hendrickson DG, Sauvageau M, Goff L, Rinn JL, Pachter L. Differential analysis of gene regulation at transcript resolution with RNA-seq. Nat Biotechnol. 2013; 31:46–53. [PubMed: 23222703]
66. Langmead B, Salzberg SL. Fast gapped-read alignment with Bowtie 2. Nat Methods. 2012; 9:357–359. [PubMed: 22388286]
67. Zhang Y, et al. Model-based analysis of ChIP-Seq (MACS). Genome Biol. 2008; 9:R137. [PubMed: 18798982]
68. Quinlan AR, Hall IM. BEDTools: a flexible suite of utilities for comparing genomic features. Bioinformatics. 2010; 26:841–842. [PubMed: 20110278]
69. Shao Z, Zhang Y, Yuan GC, Orkin SH, Waxman DJ. MAnorm: a robust model for quantitative comparison of ChIP-Seq data sets. Genome Biol. 2012; 13:R16. [PubMed: 22424423]
Liu et al. Page 23
Nat Commun. Author manuscript; available in PMC 2015 January 12.
NIH
-PA
Author M
anuscriptN
IH-P
A A
uthor Manuscript
NIH
-PA
Author M
anuscript

70. Diep D, Plongthongkum N, Gore A, Fung HL, Shoemaker R, Zhang K. Library-free methylation sequencing with bisulfite padlock probes. Nat Methods. 2012; 9:270–272. [PubMed: 22306810]
Liu et al. Page 24
Nat Commun. Author manuscript; available in PMC 2015 January 12.
NIH
-PA
Author M
anuscriptN
IH-P
A A
uthor Manuscript
NIH
-PA
Author M
anuscript

Fig. 1. Generation of FA-specific iPSCsA, DNA sequencing analysis revealed the presence of biallelic C295T point mutations in
FANCA in FA-iPSCs, and the targeted correction of a FANCA-mutant allele in FA-iPSCs
(C-FA-iPSCs). B, NANOG immunostaining of control (Ctrl) and patient (FA) colonies at
day 25 and day 40 of reprogramming, respectively. Scale bar, 2 cm. C, Quantification of the
number of NANOG-positive colonies at the end of reprogramming experiments. Numbers
are normalized against control (mean±s.d., n=3, *p<0.05, t-test). shp53 indicates the use of
p53 shRNA in the reprogramming cocktail. In both hypoxia (5%) and normoxia conditions,
there were no NANOG-positive colonies without p53 shRNA. D, Immunofluorescence
analysis of pluripotency markers OCT4 and NANOG in FA-iPSCs and C-FA-iPSCs. DNA
was stained with Hoechst. Bar, 20 μm. E, Copy number quantification of reprogramming
factor genes (left panel) and the episomal vector element EBNA1 (right panel). H9 human
ESCs were included as a negative control. Human fibroblasts (hFib) 6 days after
nucleofection were included as a positive control. The average copy numbers are
comparable between H9 human ESCs and five randomly selected FA-iPSCs. Data are
shown as mean±s.d. n=3.
Liu et al. Page 25
Nat Commun. Author manuscript; available in PMC 2015 January 12.
NIH
-PA
Author M
anuscriptN
IH-P
A A
uthor Manuscript
NIH
-PA
Author M
anuscript

Fig. 2. Characterization of FA-specific iPSCsA, DNA methylation profile of the OCT4 promoter region in control-, FA-iPSCs and C-FA-
iPSCs. A diagram showing the position of the CpG dinucleotides relative to the OCT4
transcription start site is provided. B, RT-qPCR analysis of endogenous expression of the
indicated pluripotency genes in the indicated lines. FA fibroblast and H9 human ESCs (Ctrl-
ESC) were included as negative and positive controls, respectively. Data are shown as mean
±s.d. n=3. C, Immunostaining in teratomas derived from FA-iPSCs show in vivo
differentiation towards ectodermal, mesodermal and endodermal tissues. Scale bar, 75 μm.
D, Western blotting analysis of FANCA expression in iPSCs, MSCs, and fibroblasts (Fib)
treated with or without MMC. Ku80 was included as a loading control. Also see
Supplementary Fig. 8. E, Karyotyping analysis revealed normal karyotypes in all of the
indicated iPSC lines. For FA-iPSC, four clones were randomly selected. C-FA-iPSC#1 and
C-FA-iPSC#2 indicate FA-iPSCs corrected by HR and lentiviral vector, respectively.
Liu et al. Page 26
Nat Commun. Author manuscript; available in PMC 2015 January 12.
NIH
-PA
Author M
anuscriptN
IH-P
A A
uthor Manuscript
NIH
-PA
Author M
anuscript

Fig. 3. FA-iPSCs recapitulate FA cellular defectsA, FACS analysis of cell cycle profiles of the indicated iPSCs revealed an increased
percentage of G2/M phase cells (indicated in red squares) in two randomly selected FA-
iPSCs. C-FA-iPSC#1 indicates the targeted gene-correction clone. Values shown are mean
±s.d. B, An identical number of iPSCs were seeded onto MEF feeder cells in the presence of
ROCK inhibitor and allowed to form small colonies. The relative iPSC colony numbers
were determined 10 days later. Data are shown as mean±s.d. n=3. **p<0.01 (t-test). C, MMC sensitivity of Ctrl-iPSCs, FA-iPSCs, C-FA-iPSCs#1, and FA-iPSCs lentivirally
transduced with FANCA (C-FA-iPSC#2). Data are shown as mean±s.d. n=8. D, DEB
induced chromosomal fragility test. Statistical analyses were performed by comparing Ctrl-
iPSCs with other samples. Data are shown as mean±s.d. n=35 **p<0.01 (t-test). E, Western
blotting analysis of FANCA and FANCD2 expression in indicated iPSC lines. WRN was
included as a loading control. L-FANCD2 and S-FANCD2 indicate the mono-ubiquitinated
and non-modified form of FANCD2, respectively. Quantitative analysis shows that targeted
correction of the FANCA gene (C-FA-iPSC#1) or lentiviral introduction of FANCA in FA-
iPSCs (C-FA-iPSC#2) restored expression of FANCA protein and mono-ubiquitination of
FANCD2. F, Immunostaining of FANCD2 and SOX2 in the indicated iPSCs treated with
100 ng/ml MMC for 24 h. The percentage of nuclei positive for FANCD2 foci is indicated
in the bottom left corner. Bar, 10 μm. Arrows denote FANCD2 foci.
Liu et al. Page 27
Nat Commun. Author manuscript; available in PMC 2015 January 12.
NIH
-PA
Author M
anuscriptN
IH-P
A A
uthor Manuscript
NIH
-PA
Author M
anuscript

Fig. 4. Gene correction of FA-specific iPSCsA, Schematic representation of HDAdV-based correction of the C295T mutation at the
FANCA locus. The HDAd-vector includes a neomycin-resistant cassette (neo) and an HSVtk
cassette to allow for positive and negative selection, respectively. Half arrows indicate
primer sites for PCR (P1, P2, P3 and P4). Probes for Southern analysis are shown as black
bars (a, 5′ probe; b, neo probe; c, 3′ probe). The red X indicates the mutation site in exon 4.
Blue triangles indicate the FLPo recognition target (FRT) site. B, PCR analysis of FA-iPSCs
(FA) and gene corrected FA-iPSCs (C-FA) using 5′ primer pair (P1 and P2; 12.7 kb) or 3′
primer pair (P3 and P4; 7.3 kb). M, DNA ladder. C, Southern blot analysis. The approximate
molecular weights (kb) corresponding to the bands are indicated.
Liu et al. Page 28
Nat Commun. Author manuscript; available in PMC 2015 January 12.
NIH
-PA
Author M
anuscriptN
IH-P
A A
uthor Manuscript
NIH
-PA
Author M
anuscript

Fig. 5. Hematopoietic differentiation of FA-iPSCs and characterization of FA-iPSC-derived HPCsFA-iPSCs were differentiated by using a murine OP9 stromal cell-based differentiation
protocol that allows robust generation of hematopoietic cells for downstream quantitative
analyses. A, RT-qPCR analysis of the kinetics of the upregulation of hematopoietic lineage
specific marker genes during hematopoietic differentiation of FA-iPSCs (FA) and FA-iPSCs
corrected by HR (C-FA). Expression levels are normalized against GAPDH. Data are shown
as mean±s. e.m. n=3. B, FACS analysis of the CD34+ and CD43+ populations 13 days after
hematopoietic differentiation of control iPSCs, FA-iPSCs (#5 and #8 clones) and C-FA-
iPSCs. Cells shown are in the Tra-1-85+ gate, which shows only human cells. Numbers
represent percentages. C, Percentage of differentiated iPSCs that are CD34+(Q1 & Q2 in B),
CD34+/CD43+ (Q2 in B) and CD34hi/CD43lo (small gate in Q2 in B). Error bars represent
SEM of 3 independent experiments. ** p<0.01 (t-test). D-E, Colony forming assays of
human iPSC-derived hematopoietic progenitors harvested after 14 days of differentiation.
Data are representative results from two independent experiments. Quantification of the
indicated colony types derived from a total of 1×10⁵ starting differentiated cells. CFU-
GEMM, colony-forming unit granulocyte/erythroid/macrophage/megakaryocyte; CFU-GM,
colony-forming unit granulocyte/monocyte; CFU-M, colony-forming unit macrophage;
CFU-G, colony-forming unit granulocyte; CFU-E, colony-forming unit erythroid; BFU-E,
blast-forming unit erythroid. n=3. ** p<0.01 (t-test). (D). Representative photos of colony
morphology (left columns) and Wright staining of cytospins (right columns) of different
hematopoietic colonies are shown (E). Scale bar, 300 μm. F, MMC sensitivity of Ctrl-iPSC-,
Liu et al. Page 29
Nat Commun. Author manuscript; available in PMC 2015 January 12.
NIH
-PA
Author M
anuscriptN
IH-P
A A
uthor Manuscript
NIH
-PA
Author M
anuscript

FA-iPSC- and C-FA-iPSC-derived blood lineage colonies. Data are shown as mean±s.d.
n=4.
Liu et al. Page 30
Nat Commun. Author manuscript; available in PMC 2015 January 12.
NIH
-PA
Author M
anuscriptN
IH-P
A A
uthor Manuscript
NIH
-PA
Author M
anuscript
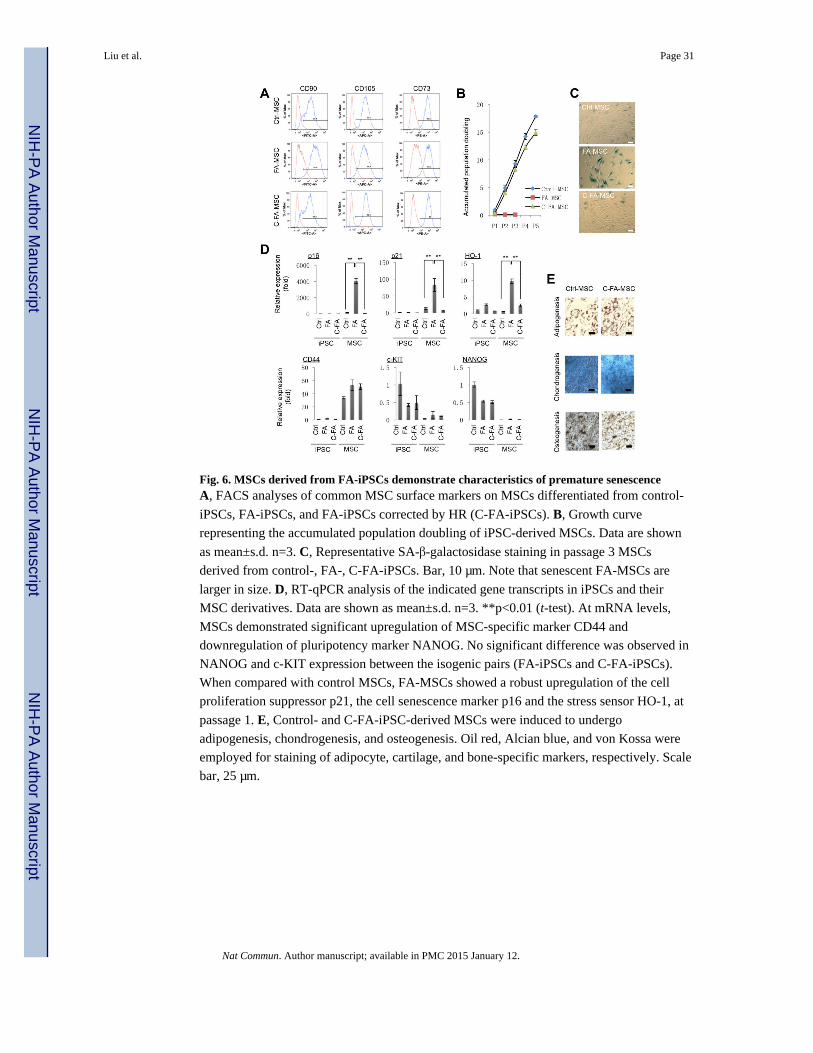
Fig. 6. MSCs derived from FA-iPSCs demonstrate characteristics of premature senescenceA, FACS analyses of common MSC surface markers on MSCs differentiated from control-
iPSCs, FA-iPSCs, and FA-iPSCs corrected by HR (C-FA-iPSCs). B, Growth curve
representing the accumulated population doubling of iPSC-derived MSCs. Data are shown
as mean±s.d. n=3. C, Representative SA-β-galactosidase staining in passage 3 MSCs
derived from control-, FA-, C-FA-iPSCs. Bar, 10 μm. Note that senescent FA-MSCs are
larger in size. D, RT-qPCR analysis of the indicated gene transcripts in iPSCs and their
MSC derivatives. Data are shown as mean±s.d. n=3. **p<0.01 (t-test). At mRNA levels,
MSCs demonstrated significant upregulation of MSC-specific marker CD44 and
downregulation of pluripotency marker NANOG. No significant difference was observed in
NANOG and c-KIT expression between the isogenic pairs (FA-iPSCs and C-FA-iPSCs).
When compared with control MSCs, FA-MSCs showed a robust upregulation of the cell
proliferation suppressor p21, the cell senescence marker p16 and the stress sensor HO-1, at
passage 1. E, Control- and C-FA-iPSC-derived MSCs were induced to undergo
adipogenesis, chondrogenesis, and osteogenesis. Oil red, Alcian blue, and von Kossa were
employed for staining of adipocyte, cartilage, and bone-specific markers, respectively. Scale
bar, 25 μm.
Liu et al. Page 31
Nat Commun. Author manuscript; available in PMC 2015 January 12.
NIH
-PA
Author M
anuscriptN
IH-P
A A
uthor Manuscript
NIH
-PA
Author M
anuscript

Fig 7. Cellular defects and molecular signatures of NSCs derived from FA-iPSCsA, Immunofluorescence analysis of neural progenitor markers in FA-iPSC derived NSCs
(FA-NSCs) and C-FA-iPSC derived NSCs (C-FA-NSCs). Bar, 20 μm. B, Western blotting
analysis of FANCA expression in control-iPSC derived NSCs (Ctrl-NSC), FA-NSCs and C-
FA-NSCs. WRN expression was included as a loading control. Also see Supplementary Fig.
8. C, Immunostaining of FANCD2, lamin B1 and NESTIN in the indicated NSCs treated
with 100 ng/ml MMC for 24 h. Arrows denote FANCD2 foci. Bar, 5 μm. D, MMC
sensitivity of indicated NSCs. Data are shown as mean±s.d. n=8. E, Representative bright
field (left panels) and Tuj1 immunofluorescence (right panels) micrographs of cultures
spontaneously differentiated from Ctrl-, FA-, and C-FA-NSCs. DNA was counterstained
with Hoechst. Bar, 50 μm. F, Hierarchical clustering analysis of genes with a minimum 3-
fold difference in both comparisons (Ctrl-NSC vs. FA-NSC; FA-NSC vs. C-FA-NSC). 96%
of genes (97 out of 101) altered by the FA mutation were rescued in gene corrected NSCs.
Also see Supplementary Data 1. G, Heatmap and hierarchical clustering of DNA
methylation levels at CpG sites in the promoter regions of the genes rescued by C-FA-NSC.
Note that not every gene rescued by C-FA-NSC from gene expression analysis showed
differential DNA methylation on their promoter regions. H, RT-qPCR analysis of the
expression of selected genes in passage 2 NSCs derived from Ctrl-, FA-, and C-FA-iPSCs.
The expression levels of genes in Ctrl-NSCs were set to one. Data are shown as mean±s.d.
n=3. Gene functions are annotated below gene names.
Liu et al. Page 32
Nat Commun. Author manuscript; available in PMC 2015 January 12.
NIH
-PA
Author M
anuscriptN
IH-P
A A
uthor Manuscript
NIH
-PA
Author M
anuscript

Fig 8. Small-molecule screen for compounds rescuing FA hematopoietic defectsTwo randomly selected clones, FA-iPSC#5 and FA-iPSC#8 (data not shown) were used in
this experiment and provided consistent results. A, FACS analysis of the CD34+ and CD43+
populations at day 13 of hematopoietic differentiation of FA-iPSC#5 after one-week
treatment with vehicle (DMSO), resveratrol (1 μM), danazol (50 ng/ml), doramapimod (5
μM) and tremulacin (5 nM). B, Quantification of percentages of FA-HPCs that are CD34+/
CD43+ and CD34hi/CD43lo after drug treatments indicated in A. Error bars represent SEM
of 3 independent experiments. * p<0.05 and ** p<0.01 (t-test). C, RT-qPCR quantification
of expression levels of interferon gamma (INFγ), tumor necrosis factor alpha (TNFα) and
Interleukin 6 (IL6) in differentiation cultures of FA-iPSCs treated with vehicle (DMSO),
danazol (50 ng/ml), doramapimod (5 μM), dasatinib (5 μM) and tremulacin (5 nM).
Expression levels are normalized against GAPDH. Asterisks denote expression levels below
the detection limit. D-E, Colony forming assay of FA patient BM mononuclear cells treated
with compounds. Representative photos of the morphology of different hematopoietic
colonies are shown (D). Bar, 500 μm. E, quantification of the indicated colony types derived
from a total of 5×10² BM CD34+ cells and 2×10⁴ BM cells from healthy donors and FA
patients, respectively. CFU-GEMM, colony-forming unit granulocyte/erythroid/
macrophage/megakaryocyte; CFU-GM, colony-forming unit granulocyte/monocyte; BFU-E,
blast-forming unit erythroid. Data are shown as mean±s.d. n=3. * p<0.05 and ** p<0.01 (t-
test).
Liu et al. Page 33
Nat Commun. Author manuscript; available in PMC 2015 January 12.
NIH
-PA
Author M
anuscriptN
IH-P
A A
uthor Manuscript
NIH
-PA
Author M
anuscript

Fig. 9. Generation and characterization of FANCA knockout ESCsA, Schematic representation of TALEN-based knockout of the FANCA gene. The donor
vectors include a neomycin-resistant cassette (neo) or a puromycin-resistant cassette (puro).
Half arrows indicate primer sites for PCR (P1 and P2). The red line indicates the TALEN
target site in exon 1. The human H9 cells were used as wild type host cells (ESC-FA+/+).
The heterozygous FANCA mutant ESC line (ESC-FA+/−) was generated by one round of
gene targeting, and the biallelic FANCA knockout mutant ESC line (ESC-FA−/−) was
generated by a 2nd round of gene targeting. B, PCR analysis of ESC-FA+/+, ESC-FA+/− and
ESC-FA−/− using P1 and P2 primer pairs shown in (A). M, DNA ladder. C, RT-PCR
analysis of ESC-FA+/+ and ESC-FA−/−. ESC-FA−/− did not express FANCA mRNA. Data
are shown as mean±s.d. n=3. ** p<0.01 (t-test). D, FACS analysis of cell cycle profiles of
the indicated ESCs revealed an increased percentage of G2/M phase cells (indicated in red
squares) in FANCA knockout cell (ESC-FA−/−). E, MMC sensitivity of ESC-FA+/+, ESC-
FA+/− and ESC-FA−/−. Data are shown as mean±s.d. n=8. F, Percentage of differentiated
ESCs that are CD34+/CD43+. Error bars represent SEM of 3 independent experiments. *
p<0.05 (t-test). G, Representative SA-β-galactosidase staining (left panel, Scale bar, 200
μm) in passage 1 MSCs derived from ESC-FA+/+ and ESC-FA−/−, and quantitative data
(right panel). H, RT-qPCR analysis of TUJ1 in ESCs and their pan neuron derivatives. Data
are shown as mean±s.d. n=3. ** p<0.01 (t-test). I, Representative bright field (left panels)
and Tuj1 immunofluorescence (right panels) micrographs of cultures spontaneously
differentiated from NSC-FA+/+ and NSC-FA−/−. DNA was counterstained with Hoechst.
Liu et al. Page 34
Nat Commun. Author manuscript; available in PMC 2015 January 12.
NIH
-PA
Author M
anuscriptN
IH-P
A A
uthor Manuscript
NIH
-PA
Author M
anuscript

Bar, 100 μm. J, Quantification of accumulated doubling population of FA-MSCs with
doramapimod or tremulacin treatments at passage 5. The drug effects were normalized by
the number of DMSO treated cells. Data are shown as mean±s.d. n=3. * p<0.05 (t-test).
Liu et al. Page 35
Nat Commun. Author manuscript; available in PMC 2015 January 12.
NIH
-PA
Author M
anuscriptN
IH-P
A A
uthor Manuscript
NIH
-PA
Author M
anuscript