Group Management Report and Consolidated Financial Statements of Landesbank Hessen-Thüringen Girozentrale 2015

Group Management Report
40 Basic Information About the Group
43 Economic Report
45 Financial Position and Financial Performance
52 Report on Events After the Reporting Date
52 Risk Report
74 Outlook and Opportunities
C-1

Group Management Report
Basic Information About the Group
Business model of the Group
Landesbank Hessen-Thüringen Girozentrale (Helaba) is a credit
institution organised under public law; its long-term strategic
business model is that of a full-service bank with a strong
regional focus, a presence in carefully selected international
markets and a very close relationship with the Sparkasse
organisation. This business model has formed the basis for a
very stable, positive business and earnings performance over
the last few years.
One key aspect of Helaba’s business model is its legal form as
a public-law institution. Helaba operates as a for-profit entity
in line with the applicable provisions of the Charter and the
Treaty of the Formation of a Joint Savings Banks Association
Hesse-Thuringia. The Treaty and the Charter establish the
legal framework for Helaba’s business model. Other factors
central to this business model are Helaba’s status as part of the
Sparkassen-Finanzgruppe with its institutional protection
scheme, the distribution of tasks between Sparkassen, Landes-
banken and other S-Group institutions, the large stake in
Helaba owned by the Sparkassen organisation, and Helaba’s
retention and expansion of its activities in the S-Group and
public development and infrastructure business.
Helaba’s strategic business model centres on the three busi-
ness units: Wholesale Business; S-Group Business, Private
Customers and SME Business; and Public Development and
Infra structure Business. The Bank’s registered offices are situ-
ated in Frankfurt am Main and Erfurt, and it also has branches
in Düsseldorf, Kassel, Paris, London and New York. These are
joined by representative and sales offices, subsidiaries and
affiliates. Helaba will be opening three new representative
offices in Stockholm, Istanbul and São Paulo in 2016 to provide
support for its sales activities. The whole of the Helaba Group
is organised into discrete divisions for operational and busi-
ness control purposes, meaning that all product, customer and
service units are managed on a standardised basis throughout
the Group.
Helaba’s activities in the Wholesale Business unit concentrate
on the six core business divisions of Real Estate, Corporate
Finance, Financial Institutions and Public Finance, Global
Markets, Asset Management and Transaction Banking. In sales,
Helaba follows two different approaches, firstly targeting product
customers from the various product fields and, secondly, direct-
ing customer sales efforts across all products at major companies
and the upper SME segment, institutional customers, municipal
corporations and central, regional and local public authorities.
In the S-Group Business, Private Customers and SME Business
unit, Helaba’s strategic goal is to continue to strengthen its
position as a leading S-Group bank for Germany. In Hesse and
Thuringia, the S-Group Sparkassen and Helaba make up the
Sparkassen-Finanzgruppe Hessen-Thüringen, based on the
business model of economic unity, the preparation of consol-
idated financial statements and a joint S-Group rating. Com-
prehensive co-operation agreements have been entered into
with the Sparkassen and their associations in North Rhine-
Westphalia. In addition, there are sales co-operation agree-
ments with the Sparkassen in Brandenburg. The agreements
with the Sparkassen in North Rhine-Westphalia and Branden-
burg complement the S-Group Concept of the Sparkassen-
Finanzgruppe Hessen-Thüringen, which continues in its cur-
rent form. Helaba is one of the market leaders in the home
loans and savings business in both Hesse and Thuringia
through the legally dependent Landesbausparkasse Hessen-
Thüringen (LBS). Frankfurter Sparkasse, a wholly owned and
fully consolidated subsidiary of Helaba organised under German
public law, is the leading retail bank in the Frankfurt am Main
region with over 800,000 customers; it also has a presence in
the nationwide direct banking market through 1822direkt.
Frankfurter Bankgesellschaft (Schweiz) AG and its wholly owned
subsidiary Frankfurter Bankgesellschaft (Deutschland) AG pro-
vide Helaba’s products and services for Sparkassen in the private
banking and wealth and asset management segment.
In the Public Development and Infrastructure Business unit,
Helaba has been entrusted with administering public-sector
development programmes of the Federal State of Hesse via
“WIBank”, a legally dependent entity within Helaba. WIBank
enjoys a direct statutory guarantee from the State of Hesse as
permitted under EU law. As a consequence, WIBank has an AA
rating from S&P for long-term unsecured liabilities. Helaba
also has stakes in other development institutions in Hesse and
Thuringia.
Management instruments and
non-financial performance indicators
As part of managing the Bank as a whole, Helaba has integrated
systems in place for business and productivity management.
This is based on a multi-level Margin Accounting System and
comprises both the management of absolute income and costs
and the integrated management of contribution margins. The
aim is to achieve a cost-income ratio below 60 %. The annual
planning process, from which a budgeted statement of finan-
cial position and income statement are derived, also follows
this system. Regular plan/actual comparisons are generated
40C-2

and variances analysed based on a management income state-
ment produced in the Margin Accounting System at regular
intervals in the course of the financial year. In line with man-
agement reporting, the segment information is based on inter-
nal management (contribution margin accounting) and also
on external financial reporting.
One key indicator used to manage portfolios is the volume of
new medium- and long-term business (more than one year).
Systematic preliminary costings are carried out for loan agree-
ments, in particular to ensure that new business is managed
with a focus on risk and profitability.
Equity is managed through the allocation of regulatory and
economic limits and through the capital ratio. When the target
capital ratios are set, the targets take into account the addi-
tional own funds requirements specified by the European Cen-
tral Bank (ECB). The profitability targets are managed through
the return on equity and regulatory capital.
The Capital Requirements Regulation (CRR) specifies that
banks must calculate a leverage ratio, a (short-term) liquidity
coverage ratio (LCR) and a net stable funding ratio (NSFR). An
institution-specific minimum requirement for eligible liabili-
ties (MREL) will also be specified as part of the implementation
of the Single Resolution Mechanism (SRM) in Europe. The
MREL is to be determined during the course of 2016 for all
groups of institutions that, like Helaba, are the responsibility
of the Single Resolution Board (SRB). Helaba is already taking
these ratios and requirements into account in its liquidity man-
agement and when fine-tuning its business portfolio.
Helaba’s business activities are geared to customer require-
ments. The Bank provides products and services for a broad
spectrum of different customer groups. The Bank’s business
activities are tightly interconnected with the real economy. The
degree of interconnectedness with the real economy is shown
by the percentage of the total assets accounted for by customer
transactions.
To fund itself, Helaba draws on different sources and products,
focusing in particular on the anchor sources of funding avail-
able through direct and indirect Sparkasse business (propri-
etary and customer transactions) as a result of belonging to a
strong association of financial institutions. Development funds
raised through WIBank and Pfandbrief issues are also a cost-
efficient component of its stable funding base.
As the leading S-Group bank in the Sparkassen-Finanzgruppe,
Helaba is continuously expanding its business relationships
with Sparkassen throughout Germany. In the regions of Hesse,
Thuringia and North Rhine-Westphalia, where Helaba acts as
the Sparkasse central bank, the aim is to achieve an S-Group
ratio in the target range of 60 % to 80 %. The S-Group ratio here
is the volume of business conducted with Helaba and its sub-
sidiaries as a percentage of the total products and services
purchased by the Sparkassen in question. The S-Group ratio is
calculated uniformly for the three aforementioned regions by
a clearing house.
As a public-law credit institution with a mandate to operate in
the public interest, Helaba also assumes a degree of social and
environmental responsibility – over and above its banking
functions and objectives. Helaba has laid down guiding sus-
tainability principles in which it has pledged its commitment
to environmental and social responsibility. The guiding sus-
tainability principles include core statements and standards of
conduct relating to business activities, business operations
(operational environmental protection, corporate governance
and compliance), employees and corporate social responsibil-
ity. Helaba has also translated its responsibility to the environ-
ment and society into binding requirements in its business
strategy. Helaba’s risk assessment and risk management pro-
cesses thus incorporate the identification and assessment of
environmental risks and of issues from a social and ethical
perspective. The Bank is looking into the possibility of creating
and installing a standard process for the appropriate incorpo-
ration of environmental risks and of social and ethical perspec-
tives into relevant lending decisions. Helaba does not finance
the manufacture or trading of controversial types of weapon.
It also undertakes not to enter into speculative transactions
with agricultural commodities or develop investment products
related to such commodities. Helaba contributes to climate
protection by implementing energy-saving measures in its op-
erations. Frankfurter Sparkasse has a certified environmental
management system in accordance with Regulation (EC)
No. 76/2001 (EMAS II) as well as DIN EN ISO 14001. Helaba
and Frankfurter Sparkasse act on their shared commitment to
sustainability by buying power generated from renewable
sources. Helaba makes key elements of its environmental
profile transparent and creates incentives to further reduce
consumption and emissions by calculating environmental
indicators and publishing them on the Internet on an annual
basis. Helaba’s company car policy also incorporates climate
protection objectives in the form of requirements to reduce
emissions. As part of its operating activities, Helaba supports
the financing of plant using energy-efficient technologies and
fosters the use of renewable energies.
Helaba and Frankfurter Sparkasse are among the signatories to
the Diversity Charter, a voluntary commitment by companies
to promote a corporate culture that is without prejudice or dis-
crimination. Helaba also engages, either directly or through
Frankfurter Sparkasse, in many areas of public life by sponsor-
ing numerous cultural, educational, environmental, sports and
social organisations and projects.
Basic Information About the Group Group Management Report 41C-3

Employees
■■ Business and HR strategy
The basic principles of Helaba’s HR activities are derived
from its business strategy. These principles incorporate
social, economic and regulatory changes. The core tasks
include, for example, needs-based recruitment of suitable
employees, the provision of professional services, attractive
remuneration and ancillary benefits (such as occupational
pensions), continuing professional development and the
development of young talent.
■■ Remuneration principles
The business strategy and risk strategy specify the degree of
flexibility available to employees. This then also forms the
basis for the remuneration system. The Bank’s remuneration
strategy and remuneration principles set out the relation-
ship between business strategy, risk strategy and remuner-
ation strategy. The remuneration strategy takes into account
the attainment of targets specified in operational planning
when determining an overall budget for the Bank and allo-
cating the budget for variable remuneration at unit level,
thereby ensuring that there is a link between the remunera-
tion strategy and divisional strategic objectives. For the
corporate centre units, budgets are allocated based on the
results generated by the Bank as a whole and the attainment
of qualitative targets. This system rules out the possibility of
incentives for individual employees to enter into dispropor-
tionately high risks. The fixed salaries are based on market
requirements.
■■ Professional development
Despite a high level of cost-consciousness, Helaba continues
to make a significant investment in developing the skills
and qualifications of its employees. The needs-based range
of seminars covering professional, personal, social and
method ological development helps managers and employees
fulfil their day-to-day responsibilities. These seminars are
complemented by foreign language training, topic-specific
training provided by external providers and courses of study
in business management.
■■ Development of young talent
The social changes resulting from demographic trends and
the ongoing process of digitisation will have an impact on
Helaba’s competitiveness over the long term. This has impli-
cations for the design of processes in HR management.
Demographic change is presenting a particular challenge in
terms of talent management and employer branding, in that
Helaba must be able to attract and retain young talent with
a high degree of potential. In addition, the advances in digi-
tisation are changing the requirements that companies need
to meet to retain their appeal, particularly for a young em-
ployee target group. This is noticeable, for example, in
changing recruitment processes, which are increasingly
characterised by the use of social media for contact with
applicants. With these changes in mind, Helaba has been
exploring new avenues over the past year. For example, in-
dividual appointment processes have been structured for
the first time using an active sourcing strategy in response
to the new requirements.
■■ Other key areas of focus
Other key areas in which HR activities are currently focused
include work-life balance, health management, change
management and managerial training. Various indicators,
such as a low turnover rate, length of service and low absen-
teeism, confirm that employees are satisfied and highly com-
mitted. An employee survey will be carried out throughout
the Bank during the course of 2016. The findings will be used
to extend the work on corporate and management culture
already described above in line with identified requirements
and could also be used to draw up recommendations for fur-
ther strategic action.
42C-4

Economic Report
Macroeconomic and sector-specific conditions in Germany
In 2015, the German economy expanded at a rate of 1.7 % (1.5 %
seasonally adjusted), the second year in succession that it has
exceeded its growth potential, i.e. the growth that would be
anticipated over the long term with a normal level of capacity
utilisation. This economic growth was primarily driven by con-
sumer spending, with household consumption expenditure
accounting for one percentage point of the growth. If govern-
ment consumption expenditure is then included, the total of
1.5 percentage points accounts for almost the entire growth in
gross domestic product (GDP). Substantial collectively agreed
pay rises in combination with largely stable prices and in-
creasing employment boosted consumer incomes in real
terms. Significant migration into Germany also gave a stimulus
to both household and public-sector expenditures.
This contrasted with a disappointing level of capital invest-
ment by businesses, reflecting the uncertainties surrounding
exports, even though the low interest rates in capital markets
and slightly above-average capacity utilisation ought to have
generated more capital spending. Residential construction
expanded on the back of strong demand for residential space
(mainly in large towns and cities), very low mortgage rates,
the lack of investment alternatives and more investment in
the stock of housing. However, activity in the non-residential
construction segment contracted sharply. Businesses also
remained reticent to commit to commercial construction and
public-sector capital investment projects already announced
had not yet reached the construction stage in 2015.
Competitive conditions in the German banking industry are
being influenced by sustained historically low interest rates
and the action taken to implement the European banking
union. Alongside the historically low key interest rates, the
ECB’s asset purchase programmes are flooding the markets
with liquidity. At the same time, institutional investors (insur-
ance companies, pension funds) are increasingly looking for
alternative investment opportunities and are opting to invest
in new asset classes (infrastructure, commercial real estate,
renewable energies). They are thus becoming competitors of
the banks and are ratcheting up the pressure on margins in
long-term new business. Nevertheless, opportunities are aris-
ing for credit institutions with stable funding structures and a
focus on selected core business areas to strengthen and expand
their market positions.
More and more areas of economic activity are becoming digi-
tised, driven by developments in information technology and
the increasing availability of the Internet. This process is offer-
ing financial service providers new ways of accessing custom-
ers and sharing data with them. From a product perspective,
digitisation is opening up the possibility of more flexible
product structures based on IT. The digitisation megatrend is
creating an environment in which an increasing number of
companies that are not themselves banks are able to offer
financial services. This applies particularly to payments busi-
ness and business with retail customers.
Key changes in the regulatory framework were as follows:
■■ Prudential supervision by the ECB (Single Supervisory Mech-
anism, SSM)
Since November 2014, the ECB has held responsibility for the
direct supervision of 123 “significant” banking groups in the
euro zone, including 21 German banks, as part of the changes
under the Single Supervisory Mechanism (SSM). The Helaba
Group, together with its affiliated subsidiaries Frankfurter
Sparkasse and Frankfurter Bankgesellschaft (Deutschland)
AG, is among the banks classified as “significant” and there-
fore subject to direct supervision by the ECB. During the
course of 2015, Helaba held numerous discussions with the
Joint Supervisory Team (JST), a team on which the ECB and
the national supervisory authorities are jointly represented.
One of the outcomes of the supervisory review and evalua-
tion process (SREP) was that the ECB notified Helaba in Feb-
ruary 2015 of the minimum Common Equity Tier 1 (CET 1)
capital ratio (on a consolidated basis) that it required Helaba
to maintain (SREP ratio). The Bank must comply with this
ratio at all times and indeed did so throughout 2015. The
Bank was notified of a capital requirement of 9.25 % for 2016
in a letter dated 20 November 2015.
■■ Capital and liquidity requirements (Basel III/CRD IV/CRR)
As a result of the CRD IV/CRR, the capital requirements for
credit institutions are becoming significantly tighter in
terms of both quality and quantity. The new capital ratios
will be phased in over the period up to 2019. At the end of
2015, the CET 1 capital ratio for the Helaba Group was 13.8 %
(phased in, i.e. taking into account the CRR transitional
arrangements) or 13.1 % (fully loaded, i.e. disregarding the
transitional arrangements) and the total capital ratio was
19.8 % (with the application of the CRR transitional arrange-
ments). Helaba therefore has a comfortable capital position
and satisfies all the regulatory requirements that have cur-
rently been published.
CRD IV provides for a transitional phase until the end of 2021
for capital instruments that are currently recognised as reg-
ulatory Tier 1 capital, but will not meet the future require-
ments for such capital. At Helaba, this affects silent partici-
pations with a nominal amount of € 953 m.
43Basic Information About the Group Group Management Report
Economic Report
C-5

Uniform liquidity requirements to be applied throughout
Europe and measured using the liquidity coverage ratio
(LCR) became mandatory from October 2015. The minimum
LCR requirement will be gradually raised, progressing from
60 % in 2015 to 70 % in 2016 and then to 100 % in 2018. On
31 October 2014, the Basel Committee submitted revised
requirements for the second liquidity ratio, the net stable
funding ratio (NSFR). It can be assumed that these revised
requirements from the Basel Committee will be imple-
mented in European law and this ratio requirement will
come into force in 2018. Both liquidity ratios will generally
lead to an increase in liquidity management costs and there-
fore have a negative impact on profitability. Helaba started
to adapt at an early stage to the new liquidity management
requirements and believes it is in a good position to meet
the regulatory requirements accordingly.
The leverage ratio measures the ratio between regulatory
capital and the unweighted total of all on-balance sheet and
off-balance sheet asset items (including derivatives). Cur-
rently, the leverage ratio has to be reported to the super-
visory authorities as an indicator for monitoring purposes.
The ratio must be publicly disclosed by banks. A mandatory
minimum ratio is expected to be specified with effect from
1 January 2018. The European Commission is likely to decide
on the details during 2016/2017. As at 31 December 2015,
Helaba’s leverage ratio was 4.0 % (with the application of the
CRR transitional arrangements).
■■ Protection schemes
Germany has transposed the requirements of the EU directive
on deposit guarantee schemes into German law with the
Deposit Guarantee Act (EinSiG), which came into force on
3 July 2015. Under this act, institutional protection schemes
can be recognised as deposit guarantee schemes provided
that the criteria specified in the act are satisfied. Accord-
ingly, the institutional protection scheme operated by the
Sparkassen- Finanzgruppe has been recognised by Bundes-
anstalt für Finanzdienstleistungsaufsicht (BaFin) as a de-
posit guarantee scheme within the meaning of EinSiG. Of the
customer deposits held by the Helaba Group, total deposits
of € 14.5 bn qualify as “covered deposits” within the meaning
of EinSiG.
Business performance
Key factors influencing the business performance and results
of operations at Helaba in the 2015 financial year were the
modest rate of economic growth in Germany, which amounted
to 1.7 % in real terms, and the persistently low level of interest
rates, which were reduced to new historic lows during the year.
Helaba’s operating business continued to perform well in this
economic environment. The volume of new medium- and
long-term lending business (more than one year) Helaba en-
tered into with customers (excluding the WIBank development
business, which does not form part of the competitive market)
increased again by almost € 1 bn (4 %) to € 19.2 bn (2014:
€ 18.4 bn). The high volume of new business enabled maturities
and special repayments to be offset. Loans and advances to
customers amounted to € 93.2 bn (2014: € 91.1 bn). Added to
this were loans and advances to affiliated Sparkassen in the
amount of € 7.2 bn (2014: € 9.3 bn). The focus on lending in core
business areas and to the Sparkassen as S-Group partners is in
line with the customer-centric orientation of Helaba’s business
model. The degree of interconnectedness with the real economy,
i.e. the percentage of the total consolidated assets accounted
for by customer transactions, rose to 58 % (2014: 56 %) as a con-
sequence of the contraction in total assets in 2015.
Over the whole of 2015, the market environment for funding
operations was generally positive for financial institutions in
the euro zone. As at 31 December 2015, the volume of medium-
and long-term funding obtained on capital markets amounted
to approximately € 17.3 bn (31 December 2014: € 15.2 bn).
Helaba was able to obtain funding inexpensively and without
difficulty from institutional and retail investors during the
whole of 2015. It benefited here from its strategic business
model and from its sound business and earnings performance.
Unsecured funding amounted to approximately € 11.4 bn
(31 December 2014: € 8.4 bn). Due to the low interest rate envi-
ronment, sales of retail issues placed through the Sparkasse
network declined to around € 2.7 bn (2014: € 3.4 bn). Pfandbrief
issues amounted to almost € 4.8 bn in total (2014: € 6.3 bn), with
mortgage Pfandbriefe accounting for about two-thirds and
public Pfandbriefe about one third. In 2015, subordinated debt
amounting to some € 1.0 bn also helped to strengthen the fund-
ing base. The customer deposits in the retail business within
the Group, in particular through the subsidiary Frankfurter
Sparkasse, bring further diversification to the funding base.
Helaba is the S-Group bank for 162 Sparkassen in four German
states, or around 40 % of all Sparkassen in Germany. Collabo-
ration with the affiliated Sparkassen in Hesse and Thuringia
was maintained in 2015 at the high level attained in the previ-
ous year. The use of a joint clearing house ensures the capture
of S-Group ratios calculated uniformly for all regions in which
Helaba acts as the Sparkasse central bank.
In financial year 2015, Helaba again generated a net profit that
allowed it to service all subordinated debt, profit participation
rights and silent participations, pay a dividend to shareholders
and make appropriations to its retained earnings to strengthen
Tier 1 capital.
The cost-income ratio for 2015 was 58.8 % (2014: 63.9 %) and
therefore well within the target range (2015 target: < 60 %).
Return on equity declined to 8.1 % (2014: 8.3 %) as a result of
the increase in the capital base. This ratio expresses the rela-
tionship between profit before taxes and the average capital
employed in the financial year. In this calculation, equity is
adjusted for as yet unpaid dividends in respect of subscribed
capital.
44C-6
Financial Position and Financial Performance
Changes to basis of consolidation
The changes to the basis of consolidation in 2015 did not have
any material impact on financial position or financial perfor-
mance. The changes related mainly to property companies in
the area of real estate project development.
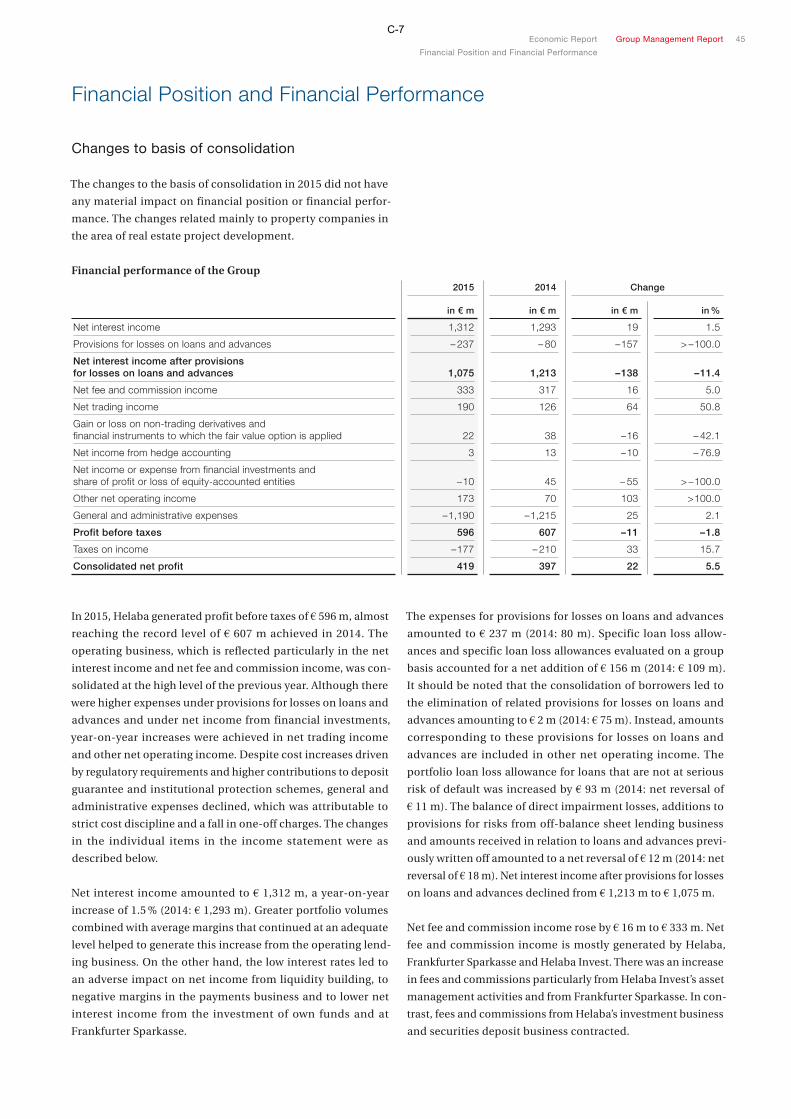
Financial performance of the Group
2015 2014 Change
in € m in € m in € m in %
Net interest income 1,312 1,293 19 1.5
Provisions for losses on loans and advances – 237 – 80 –157 > – 100.0
Net interest income after provisions for losses on loans and advances 1,075 1,213 –138 –11.4
Net fee and commission income 333 317 16 5.0
Net trading income 190 126 64 50.8
Gain or loss on non-trading derivatives and financial instruments to which the fair value option is applied 22 38 –16 – 42.1
Net income from hedge accounting 3 13 –10 – 76.9
Net income or expense from financial investments and share of profit or loss of equity-accounted entities –10 45 – 55 > – 100.0
Other net operating income 173 70 103 > 100.0
General and administrative expenses – 1,190 – 1,215 25 2.1
Profit before taxes 596 607 –11 –1.8
Taxes on income –177 – 210 33 15.7
Consolidated net profit 419 397 22 5.5
In 2015, Helaba generated profit before taxes of € 596 m, almost
reaching the record level of € 607 m achieved in 2014. The
operating business, which is reflected particularly in the net
interest income and net fee and commission income, was con-
solidated at the high level of the previous year. Although there
were higher expenses under provisions for losses on loans and
advances and under net income from financial investments,
year-on-year increases were achieved in net trading income
and other net operating income. Despite cost increases driven
by regulatory requirements and higher contributions to deposit
guarantee and institutional protection schemes, general and
administrative expenses declined, which was attributable to
strict cost discipline and a fall in one-off charges. The changes
in the individual items in the income statement were as
described below.
Net interest income amounted to € 1,312 m, a year-on-year
increase of 1.5 % (2014: € 1,293 m). Greater portfolio volumes
combined with average margins that continued at an adequate
level helped to generate this increase from the operating lend-
ing business. On the other hand, the low interest rates led to
an adverse impact on net income from liquidity building, to
negative margins in the payments business and to lower net
interest income from the investment of own funds and at
Frankfurter Sparkasse.
The expenses for provisions for losses on loans and advances
amounted to € 237 m (2014: 80 m). Specific loan loss allow-
ances and specific loan loss allowances evaluated on a group
basis accounted for a net addition of € 156 m (2014: € 109 m).
It should be noted that the consolidation of borrowers led to
the elimination of related provisions for losses on loans and
advances amounting to € 2 m (2014: € 75 m). Instead, amounts
corresponding to these provisions for losses on loans and
advances are included in other net operating income. The
portfolio loan loss allowance for loans that are not at serious
risk of default was increased by € 93 m (2014: net reversal of
€ 11 m). The balance of direct impairment losses, additions to
provisions for risks from off-balance sheet lending business
and amounts received in relation to loans and advances previ-
ously written off amounted to a net reversal of € 12 m (2014: net
reversal of € 18 m). Net interest income after provisions for losses
on loans and advances declined from € 1,213 m to € 1,075 m.
Net fee and commission income rose by € 16 m to € 333 m. Net
fee and commission income is mostly generated by Helaba,
Frankfurter Sparkasse and Helaba Invest. There was an increase
in fees and commissions particularly from Helaba Invest’s asset
management activities and from Frankfurter Sparkasse. In con-
trast, fees and commissions from Helaba’s investment business
and securities deposit business contracted.
45Economic Report Group Management Report
Financial Position and Financial Performance
C-7

At € 190 m, net trading income was well in excess of the prior-
year figure of € 126 m and resulted mainly from interest-rate-
related business, the focus of the customer-driven capital
market activities. Over the course of the year, the policy of the
ECB resulted in marked movements in interest rates with a
corresponding impact on derivatives write-downs. Credit
spreads were bolstered by the low interest rate policy and the
bond-buying programmes and therefore only had a minor im-
pact on the net income. Helaba Bank was responsible for most
of the Group’s trading activities.
The gain or loss on non-trading derivatives and financial
instruments to which the fair value option is applied fell from
a net gain of € 38 m in 2014 to a net gain of € 22 m in financial
year 2015. One of the main reasons for the drop in the net gain
is that the gain or loss on remeasurement of financial instru-
ments in the consolidated special funds had been heavily in-
fluenced in 2014 by reversals of impairment losses. This figure,
which includes unrealised measurement effects and realised
proceeds from disposals, amounted to a net loss of € 31 m in
2015 compared with a net gain of € 20 m in 2014. There was a
positive impact from the remeasurement of the liquidity com-
ponent of foreign currencies (cross currency basis spread) in
the measurement of derivatives. After inclusion of this liquidity
component, the remeasurement of the banking book deriva-
tives used to manage interest rates resulted in a net gain of
€ 23 m in 2015 compared with a net loss of € 6 m in the previous
year. The net income from hedge accounting, in which the
ineffective portion of micro hedges is reported, amounted to
€ 3 m (2014: € 13 m).
Net income from financial investments decreased from € 33 m
to € 7 m, mainly owing to an impairment loss of € 37 m on a
bond issued by HETA Asset Resolution AG. With the inclusion
of this impairment loss, the impairment losses on available-
for-sale (AfS) financial instruments came to € 56 m (2014:
€ 0 m). The realised gains and losses on disposal of available-
for-sale financial instruments amounted to a net gain of € 63 m
(2014: net gain of € 33 m), predominantly attributable to the
sale of bonds and other fixed-income securities. The share of
profit or loss from associates and joint ventures accounted for
using the equity method amounted to an expense of € 17 m
(2014: income of € 12 m).
Other net operating income improved from € 70 m to € 173 m.
A significant component of this figure is the net income from
investment property, which amounted to € 133 m in 2015
(2014: € 128 m). Most of the net income from investment prop-
erty is generated by the GWH Group. This figure comprises the
balance of rental income, the net proceeds of disposals, oper-
ating costs and impairment losses. The substantial increase in
other net operating income was largely explained by the ab-
sence of or reduction in one-off items that had had an adverse
impact in 2014. These items included the addition to restruc-
turing provisions, which amounted to € 5 m in 2015 compared
with € 40 m in 2014, and the addition to provisions for litigation
risks, which amounted to € 19 m in the year under review com-
pared with € 51 m in the previous year. A positive impact com-
pared with 2014 arose from the consolidation of debt-financed
property companies, which led to the recognition of impair-
ment losses in an amount of approximately € 20 m on the assets
held as collateral (2014: € 61 m).
General and administrative expenses declined by € 25m to
€ 1,190 m. These expenses comprised personnel expenses of
€ 624 m (2014: € 600 m), non-personnel operating expenses of
€ 526 m (2014: € 571 m) as well as depreciation and impairment
losses on property and equipment plus amortisation and
impair ment losses on intangible assets totalling € 40 m (2014:
€ 44 m). The increase in personnel expenses was mainly due to
a pay-scale increase in 2015. The Group employed an average
of 6,200 people in the year under review (2014: 6,274). The
contraction in non-personnel operating expenses was largely
attributable to the absence of expenses for the services of
Portigon AG, which had amounted to € 34 m in 2014. The con-
tributions to the restructuring fund (bank levy) also decreased
from € 36 m in 2014 to € 27 m in the reporting year. On the other
hand, the expenses for the Association overhead allocation and
the reserve funds rose substantially year on year to € 59 m
(2014: € 48 m).
The general and administrative expenses were covered by the
total operating income of € 2,023 m (2014: € 1,902 m), produc-
ing a cost-income ratio of 58.8 % (2014: 63.9 %). Operating
income includes net interest income before provisions for
losses on loans and advances, net fee and commission income,
net trading income, gains and losses on non-trading deriva-
tives and financial instruments to which the fair value option
is applied, net income from hedge accounting, net income
from financial investments and share of profit or loss of equity-
accounted entities as well as other net operating income.
Helaba’s return on equity before taxes fell slightly from 8.3 % to
8.1 %. The return on assets pursuant to article 90 of Capital
Requirements Directive IV (CRD IV) was unchanged compared
with 2014 at 0.2 %.
The income tax expense amounted to € 177 m (2014: € 210 m).
This mainly comprised current taxes relating to Helaba Bank
in Germany (€ 221 m), the New York branch (€ 37 m) and Frank-
furter Sparkasse (€ 32 m). The current taxes included taxes of
€ 103 m relating to prior years. These were offset by deferred tax
income relating to prior years of € 106 m. Deferred tax income
of € 26 m also arose in relation to temporary differences.
The consolidated net profit, i.e. the profit after tax, rose by 5.5 %
to € 419 m. Of the consolidated net profit, a loss of € 8 m (2014:
loss of € 4 m) was attributable to non-controlling interests in
consolidated subsidiaries, with the result that the profit attrib-
utable to the shareholders of the parent company amounted
to € 427 m (2014: € 401 m). From the latter, € 32 m has been
46C-8

earmarked to service the capital contributions of the Federal
State of Hesse that are reported under equity and € 68 m has
been earmarked for distribution to shareholders.
Comprehensive income for financial year 2015 rose from
€ 217 m to € 439 m. This figure includes other comprehensive
income in addition to the consolidated net profit as reported
in the income statement. Other comprehensive income
amounted to € 20 m (2014: loss of € 180 m). This figure was
subject to a positive impact from the remeasurement of the net
liability under defined benefit plans caused by the increase
in the discount rate. This resulted in an increase in comprehen-
sive income before tax of € 77 m (2014: decrease of € 444 m).
The average discount rate used to determine pension provi-
sions was 2.5 % (2014: 2.3 %). In 2015, a net loss of € 62 m before
taxes was recognised in other comprehensive income under
gains and losses on available-for-sale financial instruments,
whereas the equivalent figure recognised in 2014 was a net
gain of € 173 m.
Statement of financial position
Assets
31.12.2015 31.12.2014 Change
in € m in € m in € m in %
Loans and advances to banks including cash reserve 19,053 21,612 – 2,559 –11.8
Loans and advances to customers 93,194 91,109 2,085 2.3
Allowances for losses on loans and advances – 986 – 1,007 21 2.1
Trading assets 26,078 31,262 – 5,184 –16.6
Positive fair values of non-trading derivatives 4,376 5,828 – 1,452 – 24.9
Financial investments and shares in equity-accounted entities 26,609 26,629 – 20 – 0.1
Investment property, property and equipment and intangible assets 2,512 2,493 19 0.8
Income tax assets 495 371 124 33.4
Other assets 925 1,192 – 267 – 22.4
Total assets 172,256 179,489 – 7,233 – 4.0
Equity and liabilities
31.12.2015 31.12.2014 Change
in € m in € m in € m in %
Liabilities due to banks 35,976 35,612 364 1.0
Liabilities due to customers 47,727 45,320 2,407 5.3
Securitised liabilities 47,073 48,320 – 1,247 – 2.6
Trading liabilities 22,423 29,219 – 6,796 – 23.3
Negative fair values of non-trading derivatives 4,380 5,351 – 971 –18.1
Provisions 2,089 2,152 – 63 – 2.9
Income tax liabilities 184 125 59 47.2
Other liabilities 642 630 12 1.9
Subordinated capital 4,086 5,410 – 1,324 – 24.5
Equity 7,676 7,350 326 4.4
Total equity and liabilities 172,256 179,489 – 7,233 – 4.0
Financial Position and Financial Performance Group Management Report 47C-9

Helaba’s consolidated total assets contracted by € 7.2 bn (4.0 %)
year on year to € 172.3 bn as at 31 December 2015. The contrac-
tion in total assets was largely attributable to the decrease in
the loans and advances to banks including cash reserve and
the deliberate scaling back of trading assets. Total business
volume, which included off-balance sheet liabilities in banking
business and fiduciary activities as well as assets, went down
by 2.1 % to € 200.6 bn (31 December 2014: € 204.9 bn).
Loans and advances to banks declined by 16.7 % to € 17.1 bn
(31 December 2014: € 20.6 bn). Of the total loans and advances
to banks, a sum of € 7.2 bn (31 December 2014: € 9.4 bn) was
accounted for by funding made available to the Sparkassen in
Hesse, Thuringia, North Rhine-Westphalia and Brandenburg.
The cash reserve, which consists essentially of balances with
central banks, stood at € 1.9 bn on the reporting date (31 De-
cember 2014: € 1.0 bn).
Loans and advances to customers rose to € 93.2 bn (31 December
2014: € 91.1 bn). Of this total, commercial real estate loans
accounted for € 31.9 bn (31 December 2014: € 32.3 bn) and
infrastructure loans € 15.3 bn (31 December 2014: € 15.1 bn).
Allowances for losses on loans and advances remained un-
changed at € 1.0 bn. Of this amount, € 348 m (31 December
2014: € 255 m) was accounted for by portfolio loan loss allow-
ances recognised to cover lending exposures not at acute risk
of default.
Trading assets recognised at fair value were down by € 5.2 bn
year on year to € 26.1 bn. The portfolio of bonds and other
fixed-income securities, which represented the lion’s share
of trading assets, amounted to € 12.4 bn (31 December 2014:
€ 16.0 bn). Loans held for trading also declined by € 0.7 bn to
€ 1.5 bn, while the positive fair values of derivatives held for
trading decreased by € 1.0 bn to € 11.9 bn.
Financial investments, of which bonds constituted 98 %, re-
mained unchanged year on year at € 26.6 bn.
Liabilities due to banks rose marginally by € 0.4 bn to € 36.0 bn.
Liabilities due to Sparkassen in Hesse, Thuringia, North Rhine-
Westphalia and Brandenburg accounted for € 6.6 bn (31 De-
cember 2014: € 6.5 bn).
Liabilities due to customers amounted to € 47.7 bn (31 Decem-
ber 2014: € 45.3 bn). This increase reflected, in particular,
higher overnight and time deposits and a greater volume of
customer deposits. Of the total liabilities due to customers, a
sum of € 15.5 bn (31 December 2014: € 15.0 bn) was accounted
for by Frankfurter Sparkasse. Home savings deposits grew
slightly to € 4.2 bn (31 December 2014: € 4.1 bn).
Securitised liabilities declined by € 1.2 bn to € 47.1 bn. In par-
ticular, unsecured bonds went down by € 7.8 bn to € 18.6 bn,
whereas issues of public Pfandbriefe and mortgage Pfandbriefe
rose to € 21.4 bn (31 December 2014: € 18.9 bn) and issued
money market instruments to € 7.1 bn (31 December 2014:
€ 3.0 bn).
The year-on-year contraction in the portfolio of trading liabil-
ities from € 29.2 bn to € 22.4 bn was attributable to the dimin-
ished funding requirement as a consequence of the reduced
volume of the securities portfolios. In addition, the Bank was
able to use liquidity surpluses to fund trading assets and avoid
lengthening its balance sheet.
Subordinated capital declined substantially to € 4.1 bn (31 De-
cember 2014: € 5.4 bn) as a consequence of instruments ma-
turing as scheduled.
Equity
As at 31 December 2015, the Helaba Group’s equity amounted
to € 7.7 bn (31 December 2014: € 7.4 bn). The increase was mainly
attributable to the comprehensive income of € 439 m (2014:
€ 217 m). Retained earnings included cumulative remeasurement
losses under pension obligations (after deferred taxes) of € 413 m
(31 December 2014: losses of € 466 m). The improvement was
mainly attributable to an increase in the discount rate. Changes
in the revaluation reserve (after deferred taxes), which are
recognised in other comprehensive income, amounted to a
decrease from € 249 m to € 202 m, chiefly as a result of losses
arising on remeasurement. Equity also included a currency
translation reserve of € 23 m (31 December 2014: € 14 m).
48C-10

Comparison with prior-year forecasts
The following table shows a comparison between the actual
values achieved in 2015 for the key performance indicators
used by Helaba and the original forecasts:
2014 forecast for 2015 2015 actual
Net interest income Down by approx. 10 % year on year
+ 1.5 %
Provisions for losses on loans and advances € 200 m € 237 m
Net fee and commission income Up by approx. 14 % year on year
+ 5.0 %
Net trading income Up by approx. 34 % year on year
+ 50.8 %
Other net operating income € 240 m € 173 m
Headcount (average for the year) Largely unchanged – 1.2 %
Non-personnel operating expenses Down significantly year on year – 7.9 %
General and administrative expenses Down by approx. 1 % year on year
– 2.1 %
Profit before taxes Down by approx. 7 % year on year
– 1.8 %
Cost-income ratio Approximately 61 % 58.8 %
Total assets € 182 bn € 172 bn
Proportion of total assets accounted for by customer business (loans and advances to customers and to affiliated Sparkassen)
+ 2.5 % + 2.3 %
Return on equity (as reported on statement of financial position) Approximately 7.5 % 8.1 %
Volume of new medium- and long-term business (excl. WIBank) € 16.3 bn € 19.2 bn
The main variances are described below.
Net interest income in the operating lending business exceeded
budget because of higher customer loans and advances and
consistently high average margins in the portfolio. This net
interest income performance meant that Helaba was able to
offset the adverse impact from the low interest rates to a degree
that was better than expected.
The higher-than-anticipated provisions for losses on loans and
advances were attributable to an increase of € 93 m in the
portfolio loan loss allowance. The portfolio loan loss allowance
is recognised to cover lending exposures not at acute risk of
default; the change is only reflected in the planning after a time
delay when defaults are recorded and specific loan loss allow-
ances are recognised. When an adjustment for this amount has
been applied and effects in other net operating income from
property companies that are consolidated because of the lend-
ing relationship have been included, the provisions for losses
on loans and advances were almost € 50 m below forecast.
Net fee and commission income fell short of forecasts because
of muted demand in the capital markets business and the
S-Group business. Some of this net income was also recognised
under other items in the income statement. The net fee and
commission income generated from the payments business
remained below the budgeted figure because of the fierce com-
petition in the sector.
Overall, net trading income was significantly above budget.
The reason why net trading income performed so well was the
unplanned impact from remeasurements, mostly in connec-
tion with the interest-rate-related derivatives business.
Other net operating income included unplanned adverse effects
from the consolidation of debt-financed property companies.
As a consequence of the factors referred to above, the con-
traction in consolidated net profit was significantly less than
anticipated.
In 2015, the decrease in Helaba’s consolidated total assets was
greater than forecast. The contraction in total assets was largely
attributable to the decrease in the loans and advances to banks
including cash reserve and the scaling back of trading assets.
The main factor contributing to the volume of new medium-
and long-term business in excess of the budget was the excel-
lent performance in the Real Estate Lending and Corporate
Finance business lines.
Financial Position and Financial Performance Group Management Report 49C-11

Financial performance by segment
The contributions of the individual segments to the profit before
taxes of € 596 m in 2015 (2014: € 607 m) were as follows:
in € m
2015 2014
Real Estate 380 351
Corporate Finance 115 162
Financial Markets 127 109
S-Group Business, Private Customers and SME Business 140 174
Public Development and Infrastructure Business 27 18
Other – 253 – 265
Consolidation/reconciliation 60 58
Group 596 607
The allocation of overheads was revised in the year under
review. This led to an increase in general and administrative
expenses in the Real Estate, Corporate Finance and Financial
Markets segments with a simultaneous fall in these expenses
in the Other segment. The figures for 2014 have not been re-
stated.
Real Estate segment
The Real Estate Lending and Real Estate Management business
lines are reported in the Real Estate segment. The equity in-
vestments operating in the real estate sector (OFB Group and
the GWH Group) are included in this segment.
In real estate lending, the volume of new medium- and long-
term business increased by around 3 % year on year to € 9.8 bn
and therefore exceeded the budgeted level by some way. The
interest margin on the portfolio remained more or less steady
compared with the previous year, although margins on new
business declined. Net interest income rose year on year by
around 5 % on the back of high transaction-related income.
Borrowers at risk of default continued to be consolidated in
this segment in 2015. The associated elimination of provisions
for losses on loans and advances, which accounted for a higher
figure in the previous year, led to an increase in provisions for
losses on loans and advances. Overall however, provisions for
losses on loans and advances remained within budget.
Income from real estate management and from equity invest-
ments in the real estate sector increased slightly year on year,
as expected.
The rise in general and administrative expenses of € 32 m was
mainly attributable to a revision of the allocation of overheads,
which had already been factored into the planning.
Profit before taxes for the segment amounted to € 380 m, which
equated to an increase of 8 % compared with 2014 (€ 351 m).
This profit was therefore well in excess of expectations.
Corporate Finance segment
The Corporate Finance segment comprises the earnings of the
Corporate Finance business line, the share of profit or loss of
the equity-accounted HANNOVER LEASING Group and other
consolidated equity investments.
In the Corporate Finance business line, the volume of new
medium- and long-term business was aided by a high number
of early refinancing arrangements and ended the year around
20 % up on the previous year at € 5.5 bn and therefore well in
excess of budget. Loans and advances to customers saw a slight
year-on-year rise with the result that net interest income also
increased by 6 % compared with 2014, accompanied by high
transaction-related income.
Provisions for losses on loans and advances amounted to
€ 93 m, significantly higher than in the previous year (2014:
€ 74 m), although this increase had also been included in the
budget.
The segment was adversely impacted by expenses of around
€ 30 m resulting from unscheduled one-off items in net income
from financial investments and in the share of profit or loss of
equity-accounted investments.
The rise in general and administrative expenses of € 21 m was
mainly attributable to a revision of the allocation of overheads,
which had already been factored into the planning.
At € 115 m, the segment’s profit before taxes was lower than in
2014 (€ 162 m). The profit in this segment was therefore well
below the forecast.
50C-12

Financial Markets segment
The Financial Markets segment brings together the earnings of
the Capital Markets, Asset/Liability Management, Sales Public
Authorities, and Financial Institutions and Public Finance
business lines. The segment also includes the earnings from
the business involving asset management for institutional in-
vestors operated by Helaba Invest Kapitalanlagegesellschaft
mbH.
The segment’s net interest income is primarily the result of the
lending business with domestic and foreign local and regional
authorities and money market trading with customers. Mu nici-
pal lending in Germany was in line with planning in 2015, with
new medium- and long-term business of € 1.0 bn being written.
The Bank only entered into selective new business with foreign
financial and public-sector institutions in 2015, the value of
this new business amounting to € 0.4 bn. This segment was
adversely affected by the subdued demand for interest rate
products and the low yields on highly liquid securities with
strong credit ratings that the Bank had to hold to meet the LCR
requirements. The year-on-year fall in net interest income was
therefore greater than anticipated.
Net fee and commission income in the segment, which is gen-
erated mostly by asset management and the customer capital
markets business, rose slightly in 2015.
In line with forecasts, the segment’s net trading income went
up in 2015 compared with the low starting point. Contributing
factors included a stable customer business and positive
effects from mark-to-market valuation. The measurement of
OTC derivatives using the overnight index swap (OIS) curve
and the calculation of the credit value adjustments (CVAs) and
debit value adjustments (DVAs) together produced a positive
impact of € 65 m on the net income.
The gain or loss on non-trading derivatives and financial in-
struments to which the fair value option is applied improved
by € 24 m to a net gain of € 42 m. Positive changes in the fair
value of cross currency swaps contributed to this net gain in
2015. Net income from financial investments amounted to a
net expense of € 9 m; this figure included an impairment loss
of € 37 m on a bond issued by HETA Asset Resolution AG.
The rise in general and administrative expenses of € 29 m was
mainly attributable to a revised overhead allocation, which had
already been factored into the planning.
Profit before taxes in the segment was significantly above the
2014 level and 92 % higher than forecast at € 127 m, the main
reason being the year-on-year rise in net trading income.
S-Group Business, Private Customers and SME Business
This segment includes the earnings of Frankfurter Sparkasse,
S-Group bank, Landesbausparkasse Hessen-Thüringen (LBS)
and the Frankfurter Bankgesellschaft Group (FBG).
Net interest income in the segment amounted to € 399 m, mar-
ginally below the previous year’s figure. Falling net interest
income from the retail business at Frankfurter Sparkasse had
an adverse impact on the segment. Net interest income at the
S-Group bank and LBS remained more or less at the level of
2014.
Provisions for losses on loans and advances in the segment
improved year on year by € 11 m. This was largely attributable
to reversals at Frankfurter Sparkasse and the S-Group bank.
Net fee and commission income rose year on year in all units,
but overall fell short of the forecast.
Net income from financial investments at Frankfurter Sparkasse
included income from the disposal of securities. In 2014, a one-
off income amount arising from the disposal of the equity in-
vestment in Corpus Sireo had been reported under other net
operating income.
The increase in general and administrative expenses of € 11 m,
which was slightly higher than forecast, was attributable to a
number of factors including higher personnel expenses and
non-personnel operating expenses at Frankfurter Sparkasse.
Currency effects also led to an increase in general and adminis-
trative expenses at Frankfurter Bankgesellschaft (Schweiz) AG.
Profit before taxes in the S-Group Business, Private Customers
and SME Business segment was below the 2014 level at € 140 m
(2014: € 174 m), primarily because of the absence of the previ-
ous year’s one-off items, but nevertheless exceeded the budget.
Public Development and Infrastructure Business segment
The Public Development and Infrastructure Business segment
mainly comprises the Wirtschafts- und Infrastrukturbank Hessen
(WIBank) business line.
Helaba performs public development functions for the State of
Hesse through WIBank. Net interest income in this segment
went up by € 5 m compared with 2014 to € 51 m. The principal
reason behind this increase was the rise in total assets of
€ 0.9 bn, which in turn was linked to the expansion of the
infrastructure development business.
The increase in net fee and commission income was mainly
attributable to the changeover activities for the new EU fund-
ing period. There was also growth in the volume of services
processed on behalf of the Federal State of Hesse.
Financial Position and Financial Performance Group Management Report 51C-13

The decline in general and administrative expenses was pri-
marily due to lower IT project expenses, although some of the
decrease was offset by higher personnel and building costs.
At € 27 m, the segment’s profit before taxes was significantly
better than in the previous year (2014: € 18 m) and well in excess
of the forecast.
Other segment
The Other segment contains the contributions to income and
expenses that cannot be attributed to the other segments. In
particular, this segment includes the net income from the
transaction banking business as well as the costs of the central
units that cannot be allocated to the other segments in line
with the user-pays principle.
In own funds investing activities, a notable feature was that
lower year-on-year interest income was generated in special
funds because of market conditions.
Provisions for losses on loans and advances included the
increase of € 93 m in the portfolio loan loss allowance, which
is recognised to cover lending exposures not at acute risk of
default.
Net fee and commission income from cash management went
down by more than 5 % and fell short of the forecast. As a result,
the overall net fee and commission income for the segment was
down year on year.
Other net operating income for the reporting year contained
additions to the provisions for the current cost-cutting pro-
gramme amounting to € 33 m.
The Other segment includes further central structural costs in
addition to corporate centre costs not allocated to the other
segments. In 2015, the segment also included the bank levy
payable by Helaba Bank amounting to € 26 m (2014: € 36 m).
Expenses for major regulatory projects were additionally
reported under this segment. The fall in general and adminis-
trative expenses of € 141 m was mainly attributable to a revised
overhead allocation, which had already been factored into the
planning.
The loss for the segment amounted to € 253 m (2014: loss of
€ 265 m) and was therefore substantially impacted by the decline
in general and administrative expenses compared with 2014,
as planned. Some of the impact from the decline in general and
administrative expenses was offset by the reporting in the seg-
ment of the increase in the portfolio loan loss allowance rec-
ognised to cover lending exposures not at acute risk of default.
Consolidation/reconciliation
Effects arising from consolidation and intragroup adjustments
between the segments are reported under consolidation/
reconciliation. Effects that arise from the reconciliation
between the segment figures and the consolidated income
statement, in particular in relation to net interest income, are
also reported under consolidation/reconciliation. Since the
contribution margin statement shows net interest income on
the basis of the market interest rate method, differences also
result in the case of non-recurring income and net interest
income attributable to other periods.
The profit before taxes under consolidation/reconciliation
amounted to € 60 m in 2015 and was therefore stable compared
the previous year (2014: € 58 m).
Report on Events After the Reporting Date
There were no significant events after the end of the financial
year on 31 December 2015.
Risk Report
The Board of Managing Directors is responsible for all of the
risks to which Helaba is exposed and for defining a risk strat-
egy consistent with the business strategy. The risk strategy
lays down, in accordance with the requirements imposed by
the law, the Charter and the banking regulatory authorities,
the principal elements of the approach adopted to dealing with
risk, the risk appetite, the objectives of risk containment and
the measures employed to achieve these objectives at Helaba
and at the companies included in Group-wide risk manage-
ment. Once adopted, the risk strategy is presented to and
discussed with the Supervisory Board and the Board of Public
Owners.
The business strategy and risk strategy of the Helaba Group are
integrally linked to the business strategy and risk strategy of
Sparkassen-Finanzgruppe Hessen-Thüringen.
52C-14
The principal objective of the Helaba Group’s risk strategy is to
maintain the organisation’s conservative risk profile and con-
stant solvency, ensuring that risk-bearing capacity is always
maintained and that all regulatory requirements are met. The
risk management system accordingly plays a central role in the
management of the company.
Helaba has refined the risk management process over the years
to create a range of sophisticated tools and an environment
conducive to effective risk management. The methods em-
ployed to identify, quantify, track and contain risks and the
systems required to implement them have undergone contin-
uous development, as have organisational provisions such as
process and system documentation and guidelines detailing
responsibilities.
Principles
Responsibility of executive management
The Board of Managing Directors bears responsibility for all
of the risks to which Helaba is exposed, irrespective of how
individual responsibilities are assigned, as part of its overall
executive management responsibility. The Board of Managing
Directors is also responsible for the implementation of the risk
policy throughout the Group. It defines the risk strategy and
risk appetite simultaneously, with reference to Helaba’s
risk-bearing capacity as determined in an analysis of the initial
business policy position and an assessment of the associated
primary risks defined in the risk inventory process, and is
responsible for ensuring compliance with the risk strategy
defined by means of the establishment of an efficient risk man-
agement process. The risk strategy covers all material business
activities of the Helaba Group. The strategies, processes and
procedures are implemented at the subsidiary companies in
accordance with their legal and actual scope of influence.
The Group companies are also included in the scope of the
controlling tools for the various risk types in line with their
relative significance and as permitted under company law.
Effective risk controlling throughout the Group is thus assured.
Protection of assets
Risks may in principle be assumed only as permitted under the
risk strategy and only in pursuit of the corporate objectives –
in particular in order to maintain Helaba’s long-term earning
power while protecting its assets as effectively as possible. The
existing risk limit structures and the incentive systems and
associated control mechanisms all serve this purpose.
Protection of the Bank’s reputation
Effective risk management and the avoidance of legal or regu-
latory breaches that could damage its reputation are absolutely
vital for the Bank if it is to preserve its positive image and achieve
the best possible rating. A corresponding control process to
assess reputation risks in new business has been implemented.
Clearly defined responsibilities
The managers of the various front office units are responsible
for ensuring that their unit achieves a reasonable balance be-
tween risks incurred and earnings realised. The units exercising
control must ensure that the maintenance of this balance is
monitored continuously and that the person with the relevant
authority is notified of any existing or potential discrepancies.
Segregation of functions
The independence of risk controlling and risk containment
must be assured in order to maintain objectivity and transpar-
ency. Independent control processes are implemented wher-
ever the type and degree of risk so require.
Transparency
The comprehensive and objective reporting and disclosure of
risks is another important component of Helaba’s risk strategy
and is indispensable for the proper notification, by the Board
of Managing Directors, of the corporate bodies, the banking
regulator and the public at large.
Cost efficiency
The cost efficiency of the units exercising control and, in
particular, of the systems used also has to be considered.
The expenditure incurred in connection with risk control
(and also risk management) is reasonable given the pertinent
regulatory requirements and the risks under consideration
in each case.
Risk-bearing capacity
Helaba’s procedures for measuring and containing risks ensure
that the primary risks always fall within the risk-taking poten-
tial and that its risk-bearing capacity is thus assured. Helaba’s
risk-bearing capacity is one of the factors considered in defining
its risk strategy.
Compliance with regulatory standards
The implementation of regulatory requirements, which pro-
ceeds in close consultation with the banking regulator, also
has a decisive influence on the risk strategy. Helaba’s regu-
latory capital backing and the determination of the regula-
tory capital have been based on the provisions of the Capital
Requirements Regulation (CRR) since 2014 and take account
of the stipulations of the Supervisory Review and Evaluation
Process (SREP).
53Financial Position and Financial Performance Group Management Report
Report on Events After the Reporting Date
Risk Report
C-15

Risk-awareness
Helaba’s achievement of its objectives and application of the
applicable legal standards depend on the discipline of all those
involved with regard to strategy, processes, controls and com-
pliance. Helaba helps to ensure this discipline is maintained
by involving all of the people with relevant responsibilities in
the main risk-related decision making processes, applying
appropriate remuneration structures and facilitating regular
independent audits.
Auditing
The Internal Audit function in principle audits all operating
and business procedures in line with the scale and risk content
of each operation and business. This helps to promote compli-
ance with the procedures defined. Assessments of the efficacy
and adequacy of the internal control system facilitate the on-
going development and improvement of the risk management
processes.
Risk Classification
Risk types
The risk types of relevance to Helaba result directly from its
business activities. The structured risk inventory process
examines, at regular intervals and – where necessary – in
response to relevant developments, which risks have the
potential to cause material damage to the net assets (including
capital resources), financial performance or liquidity position
of the Helaba Group and Helaba Bank. The following primary
risk types have been identified for the Helaba Group and
Helaba Bank (real estate risk excepted).
■■ The default risk or credit risk is the potential economic loss
as a result of non-payment by or a deterioration in the cred-
itworthiness of borrowers, issuers, counterparties or equity
investments and as a result of restrictions on cross-border
payment transactions or performance (country risk). The
potential economic loss is determined using internal or
external credit assessments and risk parameters assessed by
Helaba itself or set out in regulatory specifications. The
default risk does not include credit standing risks, which are
mapped in the market price risk under the residual risk and
the incremental risk.
■■ The equity risk – the potential economic loss as a result of
non-payment by or a deterioration in the creditworthiness
of an equity investment – that is not managed at the level of
the individual risk types also forms part of the default risk.
Such developments can lead to a decline in the value of the
holding, to the reduction or cancellation of dividend pay-
ments, to loss transfers and to contribution, margin call and
liability obligations.
■■ The market price risk is the potential economic loss as a
result of disadvantageous movements in the market value of
exposures due to changes in interest rates, exchange rates,
share prices and commodity prices and their volatility. In
this context changes in interest rate levels in one market seg-
ment lead to general interest rate risks, specific interest rate
changes (for example on the part of an issuer) lead to resid-
ual risks and changes in the price of securities subject to a
credit rating as a result of rating changes (including default)
lead to incremental risks.
■■ The liquidity risk is broken down into three categories. The
short-term liquidity risk is the risk of not being able to meet
payment obligations as they fall due. Structural liquidity
risks result from imbalances in the medium- and long-term
liquidity structure and a negative change in the organisa-
tion’s own funding curve. Market liquidity risks result from
the insufficient liquidity of assets, with the consequence that
positions can be closed out only, if at all, at a disproportion-
ately high cost. The liquidity risks associated with transac-
tions not included in the statement of financial position lead
to short-term and/or structural liquidity risks depending on
their precise nature.
■■ The operational risk is defined as the risk of loss resulting
from inadequate or failed internal processes, people and
systems or from external events. This risk type also includes
the following risks:
■■ Legal risk is defined as the risk of loss for the Bank resulting
from infringements of legal provisions that have the
potential to result in (i) legal proceedings or (ii) internal
actions to avert such losses. Breaches of contract relating
to matters of creditworthiness (for example in the case of
loan contracts) do not fall within this definition.
■■ Misconduct risk is defined as the risk to the institution’s
financial performance and capital as a result of an inap-
propriate offer or intentional misconduct in connection
with the provision of financial (banking) services.
■■ IT risk is defined as the risk of loss resulting from the
operation and development of IT systems.
The operation and development of IT systems involves the
technical implementation of functional requirements and
technical design activities for the provision, support and
development of software and hardware.
The risk of loss relates to situations in which the availabil-
ity, confidentiality or integrity of data is impaired and in
which unforeseen additional expenditure is incurred for
data processing.
■■ Information security risk as a component of operational
risk encompasses the risk of loss as a result of the se cur ity
of information being compromised by the exploitation of
technical, process or organisational weaknesses.
54C-16

■■ The business risk is the potential economic loss attributable
to possible changes in customer behaviour, in competitive
conditions in the market or in general economic conditions.
Damage to Helaba’s reputation could also trigger a change
in customer behaviour.
■■ The reputation risk involves the possibility of a deterioration
in Helaba’s public reputation in respect of its competence,
integrity and trustworthiness as a result of perceptions of the
individuals having a business or other relationship with the
Bank. The material consequences of reputation risks impact
on the business and liquidity risk and are accordingly con-
sidered under these two risk types.
■■ Real estate risks comprises the real estate portfolio risk – the
potential economic loss from fluctuations in the value of an
entity’s own real estate – and the real estate project manage-
ment risk associated with project development business.
Risks associated with the provision of equity and loan capi-
tal for a project are excluded from this risk type, as are risks
associated with real estate finance.
Risk Concentrations
Risk concentrations can occur both within a single risk type
and across different risk types. The areas responsible for risk
monitoring are charged with managing – that is to say identi-
fying, quantifying, containing and monitoring – risk concen-
trations and reporting on identified risk concentrations at
Helaba in line with their respective accountability for major
risk types, risk-bearing capacity and stress tests.
Both concentrations within a risk type (intraconcentrations)
and concentrations across risk types (interconcentrations) are
analysed and integrated into the risk management reporting
and decision-making processes. A capital buffer is maintained
in the risk-bearing capacity calculation for default risk con-
centrations. This complements limit management. No risk-
mitigating diversification effects between the risk types are
applied in the risk-bearing capacity calculation. The design of
the extreme market dislocation stress scenarios across all risk
types, moreover, takes account of the main risk concentrations
between risk types of significance for Helaba.
Risk Management Process
Risk management at Helaba comprises four elements that are
best understood as consecutive phases in a single continuous
process.
1. Risk identification
The risks affecting Helaba and the companies included in
risk management at Group level are identified continuously
as an integral part of daily operations. Once identified, each
risk is assigned to the relevant risk type. Comprehensive iden-
tification and incorporation into existing risk measurement
systems and the associated risk monitoring processes is par-
ticularly important in connection with the introduction of
new products and complex transactions. The central moni-
toring units are involved in the authorisation of new products
as part of the New Product Process for lending business and
trading business. The risk inventory process to be completed
for the Helaba Group annually and on an ad-hoc basis also
helps to identify previously unknown risks and ensure that
any of material significance are incorporated into the risk
management process.
2. Risk quantification
Effective mapping of individual transactions and risk parame-
ters in the risk measuring systems enables qualitatively and
quantitatively robust risk measurement and assessment for the
various risk types. A variety of models, methods and processes
are used for this purpose. The Bank applies corresponding pre-
miums and discounts to cover the model risk that results from
the use of models and is confirmed in the course of validations.
3. Risk containment
The information obtained in the risk identification and quan-
tification phases provides the basis for risk containment by the
local management units. Risk containment encompasses all of
the measures implemented in order to reduce, limit, avoid and
transfer risks and keep risk exposure within the limits defined
by the Board of Managing Directors.
4. Risk monitoring/controlling and reporting
A comprehensive and objective reporting system keeps the
relevant people within the organisation apprised of the existing
risks as part of an independent risk controlling structure. The
methods of the preceding process phases and the quality of the
data used are also reviewed in this phase and plausibility checks
are carried out on the results.
Risk Report Group Management Report 55C-17

Risk Management Structure
Entities involved
The Helaba Board of Managing Directors is responsible for all
of the risks to which the Bank is exposed and for implementing
the risk policy throughout the Group. The Board of Managing
Directors has also established a Risk Committee to implement
and monitor Helaba’s risk strategy, first and foremost, and to
aggregate all of the risks – that is to say the default risks, market
price and liquidity risks, operational risks, business risks and
real estate risks – assumed across the Bank and evaluate their
combined implications. The Risk Committee is charged with
identifying risks within the Helaba Group at the earliest pos-
sible stage, designing and monitoring the calculation of risk-
bearing capacity and deriving measures to avoid risk and gen-
erate containment mechanisms for risk management. It also
approves the containment and quantification methods em-
ployed by the various units and assesses the appropriateness
of the tools applied in light of the extent of the risk.
Operating directly below the Risk Committee are the Asset/
Liability Management Committee, the Credit Management
Committee (KMA) and the Credit Committee of the Board of
Managing Directors (VS-KA). The Asset/Liability Management
Committee has responsibility for monitoring market price
risks, including the associated limit utilisation, and containing
the strategic market risk portfolio and the portfolio of non-
interest-bearing liabilities. The Credit Management Committee
is charged with the containment of default risks for the entire
portfolio and of syndication risks, placement risks and country
risks, while the Credit Committee of the Board of Managing
Directors is responsible for credit and settlement risks associ-
ated with counterparties.
Appointments to the committees and the committees’ duties,
jurisdiction and responsibilities are governed in separate rules
of procedure approved by the Board of Managing Directors.
The organisational guidelines specify that the approval of the
entire Board of Managing Directors or of the Supervisory Board
or one of its committees must be obtained for decisions on
matters of particular significance such as acquiring, changing
or disposing of equity investments, granting loans above a
certain threshold and defining the cumulative limit for market
price risks. The Bank’s Charter, moreover, requires that any
decision to take on or make changes to strategic equity invest-
ments involving a stake in excess of 25 % also be approved by
the Board of Public Owners.
Risk management and Helaba Group companies
Companies belonging to the Group are incorporated into risk
management activities at Group level by taking account of
the risks established in the course of the annual or, where
applicable, an ad-hoc risk inventory. The risk inventory pro-
cess identifies risks at the level of Helaba’s direct equity invest-
ments, with each of these Group companies measuring the
cumulative risk across its own organisation including its own
equity investments. The starting point for determining inclu-
sion is all direct equity investments of Helaba Bank under com-
mercial law plus special purpose entities and special funds.
The regular risk inventory covers the companies belonging to
the Group for which there exists a financial, legal or economic
imperative for inclusion. The list of companies to be included
is drawn up with reference to a catalogue of criteria. Companies
belonging to the Group that are not included in the risk inven-
tory are considered through the mechanism of the residual
equity risk.
The outcome of the materiality assessment conducted as part
of the risk inventory process is used to determine which Group
companies are included in risk management at Group level with
which risk types and which Group companies are considered
only through the mechanism of the residual equity risk. If the
risk exposures of a company belonging to the Group are deemed
to be of material significance, the company concerned must be
included in risk management at Group level in accordance with
clear and binding standards and specifications.
Companies belonging to the Group must in addition establish
an appropriate risk management process for any of their own
risks that are assigned to the risk type at Group level. The
officers responsible for the relevant risk types and methods
stipulate precisely how risks are to be included. The mode of
inclusion in the methods used in the risk management process
varies from risk type to risk type.
Principal risk monitoring areas
Risk containment is a duty of the local front office units, but
responsibility for the identification, quantification and moni-
toring/controlling functions, which include the reporting duty,
and the associated methodological authority rests with the
central monitoring units. Helaba’s organisational structure
keeps risk controlling and risk containment clearly segregated
at all levels including the Board of Managing Directors.
This clear separation of roles and the close co-operation
between the units concerned ensures efficient implementation
of risk policy containment mechanisms.
The units indicated in the table below have central responsi-
bility for containing and monitoring risks falling within the
primary risk types.
56C-18

Risk types Responsible for risk containment Responsible for risk monitoring
Default risk including equity risk Front office units, Capital Markets, Asset/Liability Management (municipal loans)
Risk Controlling (portfolio level), Credit Risk Management (individual exposure level), Group Strategy and Central Staff Division (equity risk)
Market price risk Capital Markets, Asset/Liability Management
Risk Controlling
Liquidity risk Capital Markets (money market trading), Asset/Liability Management
Risk Controlling
Operational risk All units Risk Controlling, Legal Services (legal risk)
Business risk Front office units Risk Controlling
Real estate risk Operationally independent subsidiaries■■ Operational – discharged by management
at the equity investment concerned■■ Strategic – discharged by the supervisory
bodies of the companies and the Real Estate Management unit
Risk Controlling, Real Estate Management
A number of other departments and functions also contribute
to risk management within the Helaba Group in addition to the
units indicated in the preceding table. These are set forth below.
Internal Audit
The Internal Audit function, which reports directly to the Board
of Managing Directors, examines and assesses the activities of
the Bank and of subsidiary companies without need of further
instruction. It plans and conducts its audits with risk in mind,
paying particular attention to the assessment of the risk situ-
ation, the adequacy of processing and the effectiveness of the
internal control system.
The scope and result of each audit are documented in accordance
with uniform standards. Informative audit reports are supplied
to the Board of Managing Directors and the people responsible
for the units audited. Internal Audit reports to the Supervisory
Board on findings of particular significance every quarter.
Capital Market Compliance Office, Money Laundering and
Fraud Prevention Compliance Office, MaRisk Compliance
function and Information Security Management function
The Bank has established a Capital Market Compliance Office,
a Money Laundering and Fraud Prevention Compliance Office,
an MaRisk Compliance function, an Information Security
Management function and a Data Protection Officer, all of
which are independent functions.
The Capital Market Compliance Office advises the operating
units and monitors and evaluates the principles, processes and
practices applied against various criteria including, in par-
ticular, the requirements of the German Securities Trading
Act (Wertpapierhandelsgesetz – WpHG), German Investment
Services Conduct of Business and Organisation Regulation
(Wertpapierdienstleistungs-Verhaltens- und Organisations-
verordnung – WpDVerOV) and German WpHG Employee Noti-
fication Regulation (WpHG-Mitarbeiteranzeigeverordnung –
WpHGMaAnzV), statements of the German Federal Financial
Supervisory Authority (BaFin) and pertinent statements of
the European Securities and Markets Authority (ESMA). The
Capital Market Compliance Office evaluates inherent risks and
checks compliance with the relevant regulatory requirements.
It also performs regular risk-oriented monitoring activities
using a monitoring plan based on a prior risk analysis, paying
particular attention in this regard to the rules prohibiting in-
sider dealing and market manipulation, and identifies and
regulates conflicts of interest throughout the Group that pose
a potential risk.
The Money Laundering and Fraud Prevention Compliance
Office, acting in its capacity as the central authority for the
purposes of Section 25h KWG, develops internal principles and
adequate transaction- and customer-related safeguards and
checks to prevent money laundering, the funding of terrorism
and other criminal acts. The precautionary organisational
measures to be implemented are based in part on the Group
risk analysis (money laundering, terrorism financing and fraud
prevention) and also in part on the Group Policy. This Group
Policy sets out the Group’s general ground rules, which reflect
the pertinent national and international regulatory require-
ments. Monitoring and research software keeps business rela-
tionships under constant surveillance. The Money Laundering
and Fraud Prevention Compliance Office is also responsible
for the implementation of the legal requirements created by
the Agreement Between the United States of America and the
Federal Republic of Germany to Improve International Tax
Compliance (FATCA) and the international Automatic Exchange
of Information (AEOI) process.
Risk Report Group Management Report 57C-19

The MaRisk Compliance function promotes the adoption of
effective procedures to implement and ensure compliance
with the principal legal rules and stipulations identified in the
context of risk and conducts related checks. It also conducts
regular checks and analyses in this connection of the adequacy
and efficacy of the business processes and practices associated
with the implementation of and compliance with the principal
legal rules and stipulations in the Bank.
The Information Security Management function is responsible
for ensuring the proper control, coordination and development
of information security management in line with the Bank’s
business strategy, IT strategy and risk management strategy.
It identifies and analyses the information security risks to this
end using an information security management system (ISMS)
and develops relevant measures and checks for sustainable risk
reduction and risk monitoring. The Information Security Man-
agement function is also charged with ensuring that any neces-
sary security requirements arising in connection with relevant
laws and regulations (German Federal Data Protection Act –
“BDSG”, German IT Security Act, German Minimum Require-
ments for the Security of Internet Payments – “MaSI”, MaRisk,
etc.) are derived and defined without delay, that information
protection classifications and infrastructures are analysed
regularly and that technical and organisational measures
appropriate for this purpose are coordinated to make certain
that a proper level of security is maintained at the Bank.
The Data Protection Officer promotes compliance with and
implementation of data protection requirements and serves
the Board of Managing Directors and Bank Officers as a per-
manent point of contact for any questions relating to data
protection matters. The Data Protection Officer maintains a
process overview (Section 4g (2) BDSG) and monitors the
proper use of data processing programs (Section 4g (1) 1. BDSG).
The Data Protection Officer also carries out prior checks and
ensures that training and measures to raise awareness of
data protection matters are provided regularly for Bank em-
ployees.
These independent functions report directly to the Board of
Managing Directors. The internal control structures and pro-
cedures in place to contain and monitor the specified risks are
thus adequate – in terms of both structural and procedural
organisation – and effective as required by the applicable reg-
ulatory provisions.
Risk-Bearing Capacity
Helaba uses its established procedures for measuring and con-
taining risks to ensure that all primary risks within the Helaba
Group are always covered by risk cover pools and that its
risk-bearing capacity is thus assured.
The calculation of risk-bearing capacity across risk types takes
into account risk exposures in relation to default risks, market
price risks, operational risks, business risks and real estate
risks. Risk exposures are quantified as part of an economic
assessment and the regulatory expected loss (EL) and regula-
tory capital requirement are calculated using the regulatory
measurement specifications. A capital deduction from the reg-
ulatory EL/impairment comparison is taken into account when
quantifying the regulatory capital.
Two other parameters are also reported in addition to the
risk-bearing capacity based on cover pools: the result of the
regulatory interest rate shock, which applies to market price
risks, and the liquidity horizon for liquidity risks.
Risk-bearing capacity is presented on the basis of a time frame
of one year and both risk exposures and risk cover pools are
designed and quantified for this period.
The scenarios applied comprise a base scenario, which maps
the risk-bearing capacity as at the reporting date, plus histori cal
and hypothetical stress scenarios whose implications for the
risk-bearing capacity are regularly investigated. These scenarios
include a macroeconomic stress scenario and a scenario simu-
lating extreme market dislocation on the basis of observed
market behaviour during a global financial crisis. Inverse stress
tests are also conducted.
Helaba’s Group calculation of risk-bearing capacity maps two
distinct situations reflecting the regulatory requirements
stipulating a going-concern approach and a gone-concern
approach.
The going-concern approach aims to verify that the minimum
capital requirements specified by the regulator can be satisfied
even if expected and unexpected losses are incurred. Risk
exposures are quantified with a 95.0 % confidence level for this
purpose. The calculation of risk-bearing capacity under the
gone-concern approach is intended to demonstrate that the
Helaba Group’s capital is sufficient to satisfy all creditors in full
even in the event of exceptional and heavy losses being
incurred (expected and unexpected losses at a confidence level
of 99.9 %).
The going-concern approach involves comparing the total
economic risk exposures according to the Group calculation of
risk-bearing capacity against a sustainable result before risks
and total own funds not committed for regulatory purposes
(minus an internally defined risk buffer, depending on the
58C-20
scenario). The going-concern approach also regularly quan-
tifies the implications of the stress scenarios for the regulatory
capital requirement and regulatory own funds in order to
analyse the impact on the regulatory capital ratios.
Helaba applies particular weight to the going-concern approach,
which focuses on compliance with the regulatory capital ratios,
in its capital allocation decisions and allocates regulatory capi-
tal to divisions and Group units on the basis of the associated
anticipated changes in capital ratios. This ensures consistency
between capital allocation assuming full utilisation of the
limits and the result thus produced in the calculation of risk-
bearing capacity. In addition, the economic risk exposures are
limited to ensure that, if the allocated regulatory capital is
utilised at the same time as the economic risk exposures, the
capital does not fall below the internally specified minimum
capital requirements even if economic risks materialise.
The gone-concern approach draws on an economic cover pool
to cover the internal capital requirement. This pool takes into
account the cumulative consolidated net profit on the reporting
date, the equity capital and the subordinated debt under IFRS.
Cover pool components are also adjusted in accordance with
economic criteria. The gone-concern approach does not treat
silent reserves as a cover pool component.
The risk-bearing capacity assessment for the Group covering
all risk types reveals that the existing risk cover pools once
again exceeded the quantified risk exposures by a substantial
margin at the end of 2015, underlining Helaba’s consistently
conservative approach to risk. The same applies in respect of
the calculation of risk-bearing capacity for Helaba Bank.
The base scenario of the going-concern approach for the Group
shows a capital buffer of € 3.2 bn (2014: € 3.3 bn) with respect
to the economic risk exposures taking account of an internal
risk buffer. The capital buffer with respect to the economic risk
exposures under the gone-concern approach for the Group
amounts to € 6.6 bn (2014: € 6.1 bn).
The capital ratios achieved under the simulated stress scenarios
exceed the regulatory minimum requirements by a significant
margin.
Helaba additionally conducts two inverse stress tests to inves-
tigate what nature of event could jeopardise its continued
existence. The associated scenarios, “minimum capital require-
ments not met” and “illiquid”, examine the implications of a
variety of economic developments that could result in Helaba
being unable to comply with the minimum capital require-
ments specified by the regulator or consuming its liquidity
reserves. There is currently no indication of these scenarios
becoming a reality.
Other deposit security mechanisms
There are other deposit security mechanisms in addition to
the risk cover pool. Helaba is a member of the Reserve Fund of
the Landesbanken and Girozentralen and is thus included in
the Sparkassen-Finanzgruppe’s protection scheme, which
comprises the eleven regional Sparkasse support funds, the
aforementioned reserve fund and the deposit security reserve
fund of the Landesbausparkassen.
The most notable features of this protection scheme are the
way that it safeguards the viability of the affiliated institutions,
especially their liquidity and solvency, its risk monitoring
system for the early detection of specific risk profiles and its
use of a method based on risk parameters defined by the
supervisory authorities to calculate the amounts to be paid
into the protection scheme by the various institutions. The
legally dependent Landesbausparkasse Hessen-Thüringen,
subsidiary Frankfurter Sparkasse and Frankfurter Bankgesell-
schaft (Deutschland) AG, which is a subsidiary of Frankfurter
Bankgesellschaft (Schweiz) AG, are also directly integrated into
this deposit security system.
The German Deposit Guarantee Act (Einlagensicherungsgesetz –
EinSiG), which implements the requirements of the EU Direc-
tive on Deposit Guarantee Schemes, came into force on 3 July
2015. The Sparkassen-Finanzgruppe acted promptly to bring
its deposit protection scheme into line with the amended legal
provisions. The scheme now includes a deposit protection
scheme to protect qualifying deposits up to a value of € 100,000
per customer as well as safeguarding the viability of the affili-
ated institutions themselves. The deposits thus protected at
the Helaba Group amount in total to € 14.5 bn. The target total
value of the protection scheme to be contributed by 2024 was
also raised and an amended basis for assessment was adopted.
The German Federal Financial Supervisory Authority (BaFin)
has recognised the Sparkassen-Finanzgruppe’s institutional
protection scheme as a deposit guarantee scheme for the
purposes of the German Deposit Guarantee Act.
Helaba and Frankfurter Sparkasse are also affiliated to the
Reserve Fund of the Sparkassen- und Giroverband Hessen-
Thüringen under the terms of their Charters. The reserve fund
provides further protection in the event of a default in addi-
tion to the nationwide Joint Liability Scheme and provides
creditors of the affiliated institutions (Helaba, Sparkassen)
with a direct and uncapped entitlement. The total volume of
the fund is equal to 0.5 % of the affiliated institutions’ total
risk exposure amount and stood at € 521 m at the end of 2015
(2014: € 508 m).
The Sparkassen- und Giroverband Hessen-Thüringen has un-
dertaken to make up the shortfall between the amount actually
paid in and the full amount should the fund be required before
such time as the full amount has been contributed.
Risk Report Group Management Report 59C-21

Rheinischer Sparkassen- und Giroverband (RSGV) and Spar-
kassenverband Westfalen-Lippe (SV WL) have each also unilat-
erally set up an additional regional reserve fund for Helaba.
Development institution WIBank, which is organised as a
dependent institution within Landesbank Hessen-Thüringen,
enjoys the direct statutory guarantee of the State of Hesse as
regulated by law and as permitted under EU law on state aid.
Default Risks
Lending business is one of Helaba’s core activities and the
acceptance, control and containment of default risks accordingly
constitutes one of its core competencies. Events in the market
and developments in the regulatory environment for banks are
together generating a continuous stream of new challenges
for internal default risk management, making rigorous exam-
ination of the existing procedures absolutely essential.
Guiding these steps is a comprehensive and universal risk
strategy derived from the business strategy. This risk strategy
was drawn up with reference to the German Minimum Require-
ments for Risk Management (Mindestanforderungen an das
Risikomanagement – MaRisk). The specific risk strategy for de-
fault risks defines the risk propensity, differentiated by product,
customer segment and risk type, for every business segment. It is
reviewed annually and is developed gradually in step with the
continuing extension of active lending portfolio management.
Basel III/CRR
The new EU Capital Requirements Regulation (CRR) based on
Basel III, which came into force on 1 January 2014, governs the
capital adequacy and capital backing requirements for insti-
tutions.
Helaba currently uses the IRBA. The corresponding regulatory
requirements as set out in Basel III/CCR are implemented in
Helaba’s procedures and systems with the internal rating methods
(default rating) for the lending portfolio, the Collateral Manage-
ment System, the credit loss database, which is used to record
and analyse the default portfolio and the specific loan loss
allowances, and a regulatory calculation module.
Risk monitoring using the global limit system
Helaba employs a global limit system that records counterparty-
specific default risks promptly in a structured and transparent
manner. The system uses counterparty limits based on a com-
bination of the creditworthiness (rating) of counterparties and
the Bank’s risk-bearing capacity.
Cumulative limits for each borrower are recorded in the global
limit system at Group level to help monitor, limit and contain
default risks. All types of loans in accordance with Article 389
et seq. of the CRR made to borrowers in both trading and bank-
ing book activities are counted against these cumulative limits.
Advance payment and settlement risks attributable to foreign
currency and securities transactions, current account intraday
risks and what are referred to as “additional risks from con-
structs” are approved as commercial risks and counted against
separate limits.
The approved total limits are allocated to individual borrowers,
product categories and the operating divisions concerned in
accordance with the application for approval. The utilisation
of the individual limits is monitored on a daily basis and
appropriate measures are initiated immediately if any limit is
exceeded.
Swaps, forward transactions and options are counted towards
the total limit at their credit equivalent amounts calculated in
accordance with the CRR. All other trading book positions (for
example money market trading and securities) are valued at
market prices.
Creditor risks associated with direct debits and secondary risks
resulting from leasing commitments (lessees) or guarantees
received are also recorded for the relevant entity bearing the
economic risk as indirect commercial risks.
Chart 1 shows the total volume of lending as at 31 December
2015 comprising drawings and unutilised committed credit
lines of the narrow Group companies (Helaba Bank plus sub-
sidiaries Frankfurter Sparkasse, Frankfurter Bankgesellschaft
(Schweiz) AG and Helaba Asset Services) totalling € 184.6 bn
(2014: € 187.2 bn), broken down by customer group.
60C-22

Total volume of lending by customer group (narrow Group companies) Chart 1 in € bn
51.1
Domestic companies
46.1
Foreign companies
36.7
Domestic public sector
20.7
Domestic credit institutions
20.9
Foreign credit institutions
5.6
Foreign public sector
3.5
Natural persons
Just as in the previous year, Helaba’s lending activities as of
31 December 2015 focused – as provided for in the business
model – on the banking sector, the public sector and the real
estate and housing sector.
The following table provides an overview of the regional break-
down of the total lending volume by borrower’s country of
domicile.
Region Share
Germany 60.49 %
Western Europe 18.88 %
North America 12.47 %
Rest of Europe 4.38 %
Scandinavia 2.37 %
Rest of the world 1.43 %
It can be seen that the most significant risk exposures are in
selected countries of Western Europe, most notably Germany.
Creditworthiness/risk appraisal
The Bank employs 14 rating systems developed together with
DSGV or other Landesbanken and three rating systems devel-
oped internally. Based on statistical models, these systems
classify loan exposures, irrespective of the customer or object
group, by the fixed probability of default (PD) using a 25-point
cardinal default rating scale.
Chart 2 shows the total lending volume for the narrow Group
companies (Helaba Bank with the subsidiaries Frankfurter
Sparkasse, Frankfurter Bankgesellschaft (Schweiz) AG and
Helaba Asset Services) of € 184.6 bn (2014: € 187.2 bn) broken
down by default rating category.
Risk Report Group Management Report 61C-23

Total volume of lending by default rating category (narrow Group companies) Chart 2 in € bn
60
50
40
30
20
10
03 92 81 70 64 10 1412 16 18 24 n. a.232221205 11 1513 17 19
Collateral
Like the creditworthiness of borrowers or counterparties, the
collateral arrangements (or general credit risk reduction tech-
niques) available are of major importance when determining
the extent of default risks. Collateral is measured in accordance
with the Bank’s lending principles. The measurement is adjusted
as part of the regular or ad-hoc monitoring process if there
are any changes in factors relevant for measurement purposes.
Helaba’s Collateral Management System meets the necessary
conditions to allow full advantage to be taken of the compre-
hensive opportunities for recognising credit risk reduction
techniques that enhance shareholders’ equity in accordance
with the CRR. The Collateral Management System provides its
data resources to the central risk data pool, which in turn ver-
ifies and distributes the assets eligible as collateral to the risk
positions secured.
Country risks
The country risk consists of transfer, conversion and event risks
(such as delivery risks). Helaba has a uniform methodology
for the internal measurement and allocation of country risks
based on the entity bearing the economic risk. The risk initially
assigned to the borrower’s country of domicile in accordance
with the strict domicile principle is accordingly transferred,
subject to certain conditions, to the country of domicile of the
parent company of the Group, the lessee or, in the case of cash
flow structures and when collateral is involved, to the country
of the entity bearing the economic risk.
The country risk system is the central tool for the comprehensive,
timely and transparent risk-oriented recording, monitoring and
containment of country risks. All of Helaba’s lending and trading
units, including subsidiaries Helaba Asset Services, Frankfurter
Sparkasse and Frankfurter Bankgesellschaft (Schweiz) AG, are
involved in country risk containment. The total country risk,
excluding the countries of the euro zone, may not exceed six
times the liable capital of the Helaba Group of institutions.
As of 31 December 2015, utilisation was less than three times
the liable capital.
Country limits are defined for all countries apart from a handful
of euro zone countries and certain other countries considered
to be first-class borrowers in respect, in particular, of transfer
risks (currently Switzerland, the UK, the USA, Denmark, Sweden
and Norway). The overall limit assigned to a country is sub-
divided into a lending limit and a trading limit. The country
risks for long-term transactions are also subject to additional
sub-limits.
The internal rating method for country and transfer risks pro-
vides 25 different country rating categories based on the uni-
form master scale used throughout the Bank. All classifications
are established at least annually by the Economics and
Research department and ultimately defined by the Credit Risk
Management unit. A country’s rating will also be reviewed on
an ad-hoc basis before the end of the year in the event of
changes to its political or economic situation. The business
units responsible for international transactions submit appli-
cations for the establishment or adjustment of country limits
on the basis of these country ratings. The Economics and
Research department prepares an economic analysis for each
application and Credit Risk Management gives its opinion on
each application. A new procedure introduced in 2016 provides
for the Credit Management Committee to combine these in-
puts with business policy and risk methodology considerations
specific to the Bank to produce an overall assessment, on the
basis of which the entire Board of Managing Directors defines
the limits for individual countries.
The Bank has no defined country limits for countries falling
into the weakest rating categories.
62C-24

The transfer, conversion and event risks from Helaba loans
issued by the narrow Group companies to borrowers based
outside Germany amounted to € 49.2 bn (2014: € 43.1 bn), most
of which was accounted for by borrowers in Europe (80.2 %) and
North America (17.1 %). As at 31 December 2015, 91.9 % (2014:
91.0 %) of these risks were assigned to country rating classes 0
and 1 and a further 7.2 % (2014: 8.0 %) came from rating catego-
ries 2 – 9. Just 0.2 % (2014: 0.2 %) fell into rating class 14 or worse.
Credit risk processes and organisation
The MaRisk contain differentiated rules in respect of the organ-
isation of lending business, of lending processes and of the
design of the methods used to identify, monitor and contain
risks in lending business.
The Board of Managing Directors has defined the main require-
ments of business policy regarding structural and procedural
organisation in lending business in separate general condi-
tions for lending business.
Approval procedure
The approval procedure followed by the Bank ensures that no
credit risks are entered into without prior approval. The rules
of procedure for the Board of Managing Directors state that
loans above a certain value require the approval of the Super-
visory Board or of one of its committees. Commitments in
amounts below this value are approved at different authorising
levels (Board of Managing Directors, Credit Committee of the
Board of Managing Directors, member of the Board of Manag-
ing Directors, staff members) depending on the amounts in-
volved. Loans are approved on the basis of detailed risk assess-
ments. In accordance with the MaRisk, the loan documents in
what is designated risk-relevant business always comprise two
independent opinions, one from the relevant front office unit
and one from the relevant Credit Risk Management unit. The
representative of the relevant back office unit also always has
a right of veto in this connection as part of an escalation
process. The ultimate decision rests with the entire Board of
Managing Directors.
The procedure also takes account of the concentration limits
derived from the Bank’s risk-bearing capacity, which place an
additional limit on exposures in line with the default rating
category of the economic group of connected clients. All loans
also have to be reviewed at least once every twelve months.
Mechanisms for ensuring on a daily basis that limits are not
exceeded include the use of the global limit system, which
aggregates all loans (credit lines and utilisations) extended by
the narrow Group companies for each group of connected clients.
Quantifying default risks
Expected and unexpected default risks are quantified using
the regulatory calculation module. Expected default risks are
treated for calculation purposes on a transaction-by-trans-
action basis in the form of the expected loss. The calculation
for regulatory purposes is carried out using the internal rating
methods and regulatory loss given default (LGDs). The equity
to be held available in accordance with the CRR to cover unex-
pected losses is also calculated on a transaction-by-transaction
basis and is used for containment purposes for both the specific
transaction and the risk capital. Internal containment addition-
ally involves differentiated quantification of unexpected losses
from default risks with reference to LGD par ameters estimated
internally. The expected and unexpected losses quantified in
this way are assessed against various scenarios to determine
the impact of corresponding stress situations.
The base scenario of the risk-bearing capacity calculation
shows an economic risk exposure from default risks of € 824 m
(2014: € 750 m) for the Group. The change in this figure stems
from both business-driven and methodological amendments
in relation to specific portfolios.
Allowance for losses on loans and advances
An appropriate allowance for losses on loans and advances
is created for default risks. The adequacy of the allowance is
reviewed regularly and adjustments are made where neces-
sary.
Equity risks
The equity risks category brings together those risks attribut-
able to equity investments whose individual risk types are not
considered separately in risk controlling activities by risk type.
Equity risks do not have to be considered for an equity invest-
ment if all risk types of relevance for the equity investment
concerned are integrated into Group-wide risk management
in line with their gravity and the options afforded under com-
pany law. Financial instruments classified under the CRR as
equity exposures are also reported as equity risks alongside the
equity investments under commercial law.
The risk content of each individual equity investment is classi-
fied with regard to value using a two-phase catalogue of cri-
teria (traffic-signal method). In addition, the risk assessment
is based on the appraisal and development of the rating of the
company concerned within the framework of the Bank’s inter-
nal rating method. Equity risks are reported quarterly to the
Risk Committee of the Board of Managing Directors and the
Risk and Credit Committee of the Supervisory Board.
The composition of the equity investments portfolio is virtually
unchanged from year-end 2014. The base scenario of the going-
concern approach for the risk-bearing capacity calculation
indicates that the economic risk exposure for the Group from
equity risks is virtually unchanged from year-end 2014 at
€ 10 m (2014: € 11 m).
Risk Report Group Management Report 63C-25

Market Price Risks
Risk containment
Helaba manages market price risks for the trading book and
the banking book as part of its overall bank management.
Clearly defined responsibilities and business processes create
the necessary conditions for effective limitation and contain-
ment of market price risks. The subsidiaries are integrated into
the containment process as part of Group-wide risk manage-
ment according to a graduated system based on the risk inven-
tory process in line with the specific business activities
involved. Attention in this area focuses principally on sub sidi-
aries Frankfurter Sparkasse and Frankfurter Bankgesellschaft
(Schweiz) AG. Market price risks are quantified using Helaba’s
own methods.
Trading activities focus for strategic purposes on customer-
driven business, which is supported by a demand-led product
range. Responsibility for containing trading book exposures
rests with the Capital Markets unit, while the Asset/Liability
Management unit has responsibility for funding and for the
management of the interest rate and liquidity risks in the bank-
ing book. The own issues repurchase portfolio belonging to the
trading book also falls under the jurisdiction of the Asset/Lia-
bility Management unit.
Limitation of market price risks
Helaba employs a uniform limit structure to limit market price
risks. The process through which limits are allocated involves
the Risk and Credit Committee of the Supervisory Board as well
as the Bank’s internal corporate bodies. The cumulative limit
defined for market price risks, which is proposed by the Board
of Managing Directors on the basis of the Bank’s risk-bearing
capacity, must be approved by the Supervisory Board Credit
Committee.
Acting on the recommendation of the Asset/Liability Manage-
ment Committee, the Risk Committee allocates limits to the
risk- incurring business units and the various types of market
price risk within the scope of the defined cumulative limit for
market price risks. In addition separate limits are defined for
the trading book and the banking book. Responsibility for the
onward allocation of limits to Helaba’s subordinate organisa-
tional units and its various sites rests with the divisions to
which a limit has been assigned. Stop-loss limits and volume
limits are also used independently in the trading units to limit
market price risks.
Compliance with the cumulative market price risk limit was
maintained at all times in the year under review and there were
no limit violations at the main trading book and banking book
aggregation stages (both Bank and Group) or for the individual
market price risk types.
Risk monitoring
The Risk Controlling unit is responsible for identifying, quan-
tifying and monitoring market price risks. This responsibility
includes checking transactions for market conformity and de-
termining the economic profit or loss as well as risk measure-
ment. In addition, the reconciliation statement with external
Accounting is prepared.
Continuous functional and technical development of the
methods and systems used and intensive data entry play a key
role in ensuring that Helaba’s market price risks are recorded
properly. A special process owned by the New Products Com-
mittee has to be completed whenever a new product is intro-
duced. New products must be incorporated correctly into the
required systems for position recording, processing, profit or
loss determination, risk measurement, accounting and report-
ing before they can gain authorisation.
A comprehensive reporting regime ensures that the relevant
members of the Board of Managing Directors and the position-
keeping units are notified daily of the risk figures calculated
and the economic profit and loss generated on the basis of
current market prices. Information about the current risk and
earnings situation is in addition provided weekly to the entire
Board of Managing Directors and the Asset/Liability Manage-
ment committee and monthly to the Risk Committee. Any
breach of a defined limit triggers the escalation process to limit
and reduce the associated risks.
Quantification of market price risks
Market price risks are quantified using a money-at-risk
approach backed up by stress tests, the measurement of re-
sidual risks, sensitivity analyses for credit spread risks and
the assessment of incremental risks for the trading book. The
money- at-risk (MaR) figure corresponds to what is deemed,
with a certain confidence level, to be the upper threshold of the
potential loss of a portfolio or position due to market fluctua-
tions within a prescribed holding period.
The risk measurement systems employed at Helaba for each of
the various types of market price risk (interest rates, share
prices and foreign exchange rates) all use the same statistical
parameters in order to facilitate comparisons across the differ-
ent risk types. This also makes it possible to aggregate the risk
types into an overall risk. The overall risk assumes that the
various different losses occur simultaneously. The MaR figure
calculated using the risk models provides a measure of the
maximum loss that will not be exceeded, with a probability of
99.0 %, on the basis of the underlying historical observation
period of one year and a holding period for the position of ten
trading days.
64C-26

Chart 3 contains a reporting date assessment of the market
price risks (including correlation effects between the portfo-
lios) taken on as at the end of 2015 plus a breakdown by trading
book and banking book. The linear interest rate risk is once
again the most significant of the market price risk types. Rating-
dependent government, financials and corporate yield curves
are also used alongside swap and Pfandbrief curves for
measure ment purposes. Euro positions account for 84 % (2014:
70 %) of the linear interest rate risk for the overall portfolio of
the narrow Group companies, US dollar positions for 9 % (2014:
22 %). In the field of equities, the focus is on securities listed
in the DAX and DJ Euro Stoxx 50. The main foreign currency
risks are attributable to US dollar, Swiss franc, Japanese yen
and sterling positions. The residual risk for the Group amounts
to € 15 m (2014: € 23 m). The incremental risk in the trading
book amounts, with a time horizon of one year and a confidence
level of 99.9 %, to € 201 m (2014: € 192 m). The base scenario of
the going-concern approach for the risk-bearing capacity
calculation shows an economic risk exposure of € 433 m (2014:
€ 273 m) for the Group from market price risks. The increase
in this figure and in the linear interest rate risk stems essen-
tially from more volatile interest rates in the first half of the
year. The markets calmed down somewhat in the second half
of the year.
Group MaR by risk type Chart 3 in € m
Total risk Interest rate risk Currency risk
Equities risk
31.12.2015 31.12.2014 31.12.2015 31.12.2014 31.12.2015 31.12.2014 31.12.2015 31.12.2014
Total 89 45 69 30 1 1 19 14
Trading book 29 11 27 10 0 0 2 1
Banking book 67 36 49 22 1 1 17 13
All risk measuring systems are based on a modified variance-
covariance approach or a Monte Carlo simulation. The latter is
used in particular for mapping complex products and options.
Non-linear risks in the currency field, which are of minor sig-
nificance at Helaba, are monitored using sensitivity analyses.
Internal model in accordance with the
Capital Requirements Regulation (CRR)
Helaba calculates the regulatory capital required for the general
interest rate risk using an internal model in accordance with
the CRR. This model, which consists of the risk measurement
systems MaRC² (linear interest rate risk) and ELLI (interest
option risk), has been approved by the banking regulator.
Market price risks in the trading book
All market price risks are calculated daily on the basis of the
end-of-day position of the previous trading day and the current
market parameters. Helaba also uses the parameters pre-
scribed by the regulatory authorities for internal risk manage-
ment. Chart 4 shows the MaR for the trading book (Helaba
Bank) for the 2015 financial year. The average MaR for 2015 as
a whole amounted to € 26 m (2014: € 18 m), the maximum MaR
was € 34 m (2014: € 32 m) and the minimum MaR was € 11 m
(2014: € 11 m). The increase in risk as compared with 2014
stems essentially from greater volatility associated with the
pronounced market fluctuations experienced in 2015.
Risk Report Group Management Report 65C-27

Daily MaR of the trading book in financial year 2015 Chart 4
40
35
15
30
10
25
5
20
0April Nov.March Oct.Febr. Sept.Jan. Aug.JulyMay Dec.June
€ 34 m max. MaR
€ 11 m min. MaR
€ 26 m ø MaR
Helaba’s international branch offices plus Frankfurter Bank-
gesellschaft (Schweiz) AG and Frankfurter Sparkasse make the
most recent business data from their position-keeping systems
available to Group headquarters in a bottom-up process so
that consolidated MaR figures can be calculated for the Group.
The market parameters, in contrast, are made available in a
standard form right across the Group in a top-down process.
This arrangement means that it is possible to measure risk not
just centrally at headquarters, but also locally at the sites.
Chart 5 shows the average daily MaR amounts for the trading
book.
Average MaR for the trading book in financial year 2015 Chart 5 ø MaR in € m
Q1
Q2
Q3
Q4
Total
2015 2014 2015 2014 2015 2014 2015 2014 2015 2014
Interest rate risk 16 25 26 17 29 13 25 12 24 17
Currency risk 0 0 0 0 0 0 0 0 0 0
Equities risk 1 1 2 1 2 1 2 1 2 1
Total risk 17 26 28 18 31 15 27 13 26 18
Number of trading days: 251 (2014: 249)
The annual average MaR for the trading book for Frankfurter
Sparkasse amounts to € 0 m (2014: € 0 m). The average MaR for
the trading book for Frankfurter Bankgesellschaft (Schweiz) AG
is € 0 m (2014: € 0 m).
Back-testing
Helaba carries out clean back-testing daily for all market price
risk types to check the forecasting quality of the risk models. This
involves determining the MaR figure for a holding period of one
trading day with a one-tailed confidence level of 99 % and a his-
torical observation period of one year. The forecast risk figure is
then compared with the hypothetical change in the net value of
the trading book, which represents the change in the value of the
portfolio over one trading day for an unchanged position and on
the basis of new market prices. Any case in which the decrease
in the net value of the trading book exceeds the potential risk
figure constitutes a back-testing outlier.
Chart 6 shows the back-testing results of the Helaba risk models
for the trading book across all types of market price risk in finan-
cial year 2015. One negative outlier occurred (2014: no negative
outliers). This outlier was caused by the Swiss National Bank
ending its policy of pegging the Swiss franc to the euro in January
2015.
66C-28

Back-testing for the trading book in financial year 2015 Chart 6
MaR
Net change in assets
The internal model for the general interest rate risk produced
no negative outliers in 2015 in regulatory back-testing (2014:
no negative outliers).
Stress test programme
A proper analysis of the effects of extraordinary but not un-
realistic market situations requires the use of stress tests
in addition to the daily risk measurement routine. Various
portfolios are remeasured regularly under the assumption of
extreme market scenarios. Portfolios are selected for stress
testing on the basis of the level of exposure (significance) and
the presence or absence of risk concentrations unless specific
banking regulatory provisions apply. Stress tests are carried out
daily on Helaba’s options book. The results of the stress tests
are included in market price risk reporting to the Board of
Managing Directors and are taken into consideration in the
limit allocation process.
Methods available for use in stress testing include historical
simulation, Monte Carlo simulation, a modified variance-
covariance approach and a variety of scenario calculations –
including those based on the main components of the correla-
tion matrix. Helaba also performs stress tests to simulate
extreme spread changes. The stress tests for market price risks
are supplemented by inverse stress tests and stress tests across
risk types conducted in the course of Helaba’s calculation of
risk-bearing capacity.
Market price risks in the banking book
Helaba employs the MaR approach used for the trading book
to map the market price risks in the banking book. The risk
figures calculated using this approach are supplemented with
maturity gap analyses calculated daily, from which the matu-
rity structure of the positions taken out can be ascertained.
Regular stress tests with holding periods of between ten days
and twelve months back up the daily risk measurement routine
for the banking book.
The quantification of interest rate risks in the banking book is
also subject to regulatory requirements, which stipulate a risk
computation based on standardised interest shocks. The com-
putation examines the effects of a rise and fall of 200 basis
points in interest rates in line with the requirements of the
banking regulator. As of the end of 2015, such an interest rate
shock would, in the unfavourable scenario, have resulted in a
negative change of € 285 m in the value of the Helaba Group
banking book (2014: € 234 m). Of this figure, € 270 m (2014:
€ 215 m) is attributable to local currency and € 15 m (2014:
€ 19 m) to foreign currencies. Helaba carries out an interest rate
shock test at least once every quarter.
Performance measurement
Risk-return comparisons are conducted at regular intervals to
assess the performance of individual organisational units.
Other aspects, including qualitative factors, are also included
in the assessment in acknowledgement of the fact that the
short-term generation of profits is not the sole objective of the
trading offices.
Risk Report Group Management Report 67C-29

Liquidity Risks
Ensuring liquidity so as to safeguard its short-term solvency
and avoid cost risks in procuring medium-term and long-term
funding is a top priority at Helaba, which accordingly employs
a comprehensive set of constantly evolving tools to record,
contain and monitor liquidity risks. The processes, tools and
responsibilities in place for managing liquidity risks have
clearly demonstrated their value over recent years in the face
of the global crisis in the financial markets and the resultant
turmoil in the money and capital markets. Helaba’s liquidity
was once again fully assured at all times in 2015.
The Helaba Group operates a local containment and monitor-
ing policy for liquidity risks under which each company has
responsibility for independent monitoring and for ensuring its
own solvency. The corresponding conditions are agreed with
Helaba. The subsidiaries falling within the narrow Group com-
panies report their liquidity risks regularly to Helaba as part of
group-wide risk management using methods based on Helaba’s
own.
Liquidity and funding risk
The Bank draws a distinction in liquidity risk management
between short-term and structural liquidity management.
Overall responsibility lies with the Asset/Liability Management
unit. Money market staff safeguard short-term solvency, while
the Asset/Liability Management unit is responsible for fund-
ing new lending business (maintaining the balanced medium-
and long-term liquidity structure) in the context of structural
liquidity management. Asset/Liability Management is also
responsible for the central management of liquid securities for
the purposes both of the regulatory liquidity buffer for LCR
compliance and of collateral management. Cost allocation is
governed by a liquidity transfer pricing system.
The Risk Controlling unit reports daily on the short-term
liquidity situation to the relevant managers and reports
monthly in the Risk Committee on the overall liquidity risks
assumed. Reporting also includes various stress scenarios such
as increased drawings on liquidity lines, no availability of
inter bank liquidity in the financial markets and the possible
impact on Helaba of a significant rating downgrade. The stress
scenarios encompass both factors specific to the bank and
broader market influences. Inverse stress tests are also con-
ducted. Additional ad-hoc reporting and decision-making
processes for extreme market situations are in place.
Short-term liquidity risk
Helaba maintains a highly liquid portfolio of securities that
can be used to generate liquidity as required in order to assure
its short- term liquidity. The current liquidity situation is
managed with reference to a short-term liquidity status indi-
cator, determined daily, which compares expected liquidity
requirements for the next 250 trading days against the available
liquidity from the liquid securities portfolio. The available
liquidity is established taking account of markdowns so that
unexpected market developments affecting individual securities
can also be considered. Securities that are used for collateral
purposes in collateral management and are thus earmarked for
a specific purpose are not considered to be part of the liquid
securities portfolio. The main currency for short-term liquidity
at Helaba is the euro, with the US dollar also significant.
Helaba has been authorised by BaFin to use its own liquidity
risk measurement and management procedure in accordance
with Section 10 of the German Regulation on the Liquidity of
Institutions (Liquiditätsverordnung – LiqV). This enables it to
use its own method for establishing its short-term liquidity
status for regulatory reporting rather than the monthly notifi-
cation required under the LiqV standard method. Helaba com-
plied in full with the liquidity requirements imposed by the
banking regulator based on the internal model at all times in
financial year 2015. The model and the parallel calculation and
management of the LCR together provide an important basis
for the supervisory Internal Liquidity Adequacy Assessment
Process (ILAAP).
The short-term liquidity status concept has been selected to
allow various stress scenarios to be mapped. The process in-
volves comparing the net liquidity balance (liquidity needed)
with the available liquidity. The defined limits are 30 days up
to one year depending on the specific scenario. Monitoring the
limits is the responsibility of the Risk Controlling unit. The util-
isation rate in the most relevant scenario (solvency) amounted
on the reporting date to 45 % (2014: 22 %). This increases to
46 % (2014: 29 %) if Frankfurter Sparkasse is included. The
average utilisation rate in 2015 was 28 % (2014: 34 %). The LCR
exceeded the minimum limit of 60 % of relevance for regulatory
purposes at all times from 1 October 2015 onwards.
Money market staff borrow/invest in the money market (inter-
bank and customer business, commercial paper) and make use
of facilities with the European Central Bank (ECB) in perform-
ing the operational cash planning tasks necessary to ensure
short-term liquidity.
Loan and liquidity commitments not included in the state-
ment of financial position, which are maintained in a central
database, are reviewed regularly with regard to their drawing
potential and features of relevance to liquidity and are inte-
grated into liquidity management. US public finance business
and the securitisation platform initiated by Helaba are also
included here. Guarantees and warranties are similarly reviewed.
Liquidity costs are calculated and allocated to the relevant
business lines as a function of the internal risk classification.
Helaba determines and plans the liquidity to be held available
using a scenario calculation that includes a market disturbance.
68C-30

Back-testing investigations have shown that the liquidity main-
tained exceeded the liquidity actually drawn at all times during
the crisis in the financial markets.
A total of € 1.5 bn in liquidity commitments had been drawn
down for the securitisation platform initiated by Helaba as of
the reporting date. This represents an increase of € 0.3 bn as
compared with the previous year. No liquidity had been drawn
down from stand-by lines in US public finance business as of
the reporting date (as was the case at the end of 2014).
Credit agreements, in particular those of consolidated property
companies, may include credit clauses that can result in
distribution restrictions or even in the agreements being
terminated. The Group faces no significant liquidity risk even
if such a termination should threaten in individual cases.
Structural liquidity risk
The Asset/Liability Management unit manages the liquidity
risks in Helaba’s commercial banking activities, which consist
essentially of lending transactions including floating-interest
roll-over transactions, securities held for the purpose of safe-
guarding liquidity and medium- and long-term financing, via
the central asset/liability management system. This aspect is
managed on the basis of cash-flow-oriented liquidity outflow
schedules, with limited matching liquidity. Responsibility for
monitoring rests with the Risk Controlling unit. The funding
matrix at year-end shows an aggregate funding requirement
across all currencies and locations of € 8.2 bn set against a limit
of € 12.5 bn (2014: € 6.6 bn). The main objective of liquidity
management is to ensure that the transactions concluded
deliver the anticipated return.
The major aim of funding management (procurement of funds)
is to avoid cost risks in connection with the procurement of
medium- and long-term borrowed funds and to limit depen-
dence on short-term funding capital. Structural liquidity short-
ages are avoided by pursuing funding arrangements that offer
matching maturities as far as possible and by diversifying the
sources of funding (in terms of products, markets and inves-
tors). The Asset/Liability Management unit’s funding activities
aim to ensure uninterrupted market access to investors by
providing a wide range of products and taking care to look after
investor relations. Any liquidity shortfalls or surpluses arising
are funded or invested temporarily on a short-term basis.
Market liquidity risk
The market liquidity risk is assessed in the MaR model for
market price risks. The very model itself is conservative in its
approach to the liquidity risk with its assumption of a holding
period of ten days. Monthly scenario calculations using a variety
of holding periods are also carried out to track the risk of inad-
equate market liquidity. The scaled MaR suggests no significant
market liquidity risk as at 31 December 2015. Market liquidity
is also monitored on the basis of the margin between bid and
offer prices.
Definition of risk tolerance
The Board of Managing Directors defines the risk tolerance
for the liquidity risk at least annually. This covers the limit ap-
plicable for short-term and structural liquidity risk, liquidity
building for off-balance sheet liquidity risks and the definition
of the corresponding models and assumptions. A comprehen-
sive plan of action in the event of any liquidity shortage is
maintained for all locations.
Operational Risks
Principles of risk containment
Helaba identifies, measures and contains operational risks
using an integrated management approach introduced for this
purpose in line with the regulatory requirements.
The approach taken by Helaba provides for the disciplinary and
organisational segregation of operational risk management
and controlling. Risk management is accordingly a local re-
sponsibility discharged by Helaba’s individual units, which are
supported in this task by central containment units. Central
responsibility for operational risk controlling rests with the
Risk Controlling unit.
Tools
Helaba uses the standardised method to calculate its regulatory
capital backing.
Operational risks are contained and monitored using a risk
management system that identifies, records and presents risks
and losses in a structured manner. This makes it possible to
compare and cross-check risks and loss data systematically
and contain them with appropriate measures.
Operational risks are classified systematically with reference
to Helaba’s proprietary risk model, which is based on the Basel
event categories. The view of risk used for internal risk assess-
ment purposes is thus fully congruent with that of the regulator.
The quantification methodology was expanded significantly in
2014 and is now based entirely on a modelling approach that
encompasses internal and external losses plus risk scenarios
created by the business units and plausibility-checked by the
Risk Controlling unit.
Risk Report Group Management Report 69C-31

Technical assistance to help facilitate the management of
operational risks is provided in the form of a web-based appli-
cation that supports local data access and a central database
and is updated regularly in line with expert recommendations.
Operational risks are avoided or limited using insurance
arrangements that cover specific losses up to agreed maximum
limits and also by means of established measures in internal
processes and other workflows.
Risk monitoring
The risk reporting system keeps the bodies responsible, the
Risk Committee, the Operational Risk management group cre-
ated and the units responsible for risk management at the local
level informed of the risk situation and any losses incurred.
The Bank’s risk profile is updated as part of an annual review.
The risk profiles of the subsidiaries are added to create the
Group risk profile.
Losses attributable to operational risks that have materialised
are reported regularly at the local level by Helaba’s specialist
units. The subsidiaries submit reports concerning losses in-
curred, in principle on a quarterly basis, and these enable the
losses situation in the Group to be presented. External losses
from the VÖB data syndicate are added to the loss data pool for
internal management purposes.
Quantification
Operational risks are quantified for Helaba, Frankfurter Spar-
kasse and Helaba Invest using an internal model based on a
loss distribution approach, which considers risk scenarios and
internal and external losses to calculate unexpected losses
(economic risk exposure). Chart 7 below shows the risk profile
for Helaba, Frankfurter Sparkasse, Helaba Invest and the other
companies of the Helaba Group:
Operational risks – risk profile
Economic risk exposure – base scenario Chart 7 in € m
Reporting date 31.12.2015 Reporting date 31.12.2014
VaR 95.0 % VaR 95.0 %
Helaba Bank 37 35
Frankfurter Sparkasse, Helaba Invest and other companies 34 62
Narrow Group companies 71 97
The base scenario of the going-concern approach for the
risk-bearing capacity calculation shows an unexpected loss
(economic risk exposure) of € 71 m (2014: € 97 m) for the Group
from operational risks. The reduction in this figure stems
essentially from a change to the quantification method for the
other companies.
Documentation system
Helaba’s documentation system complies with the require-
ments imposed by the MaRisk, which lay down details of the
due and proper organisation of business plus internal control
procedures and precautionary security measures relating to
the use of electronic data processing.
Clear responsibilities have been defined within Helaba for the
creation and continuous updating of the various components
of the documentation system. The Bank Organisation depart-
ment assists the specialist units responsible for the activities
and processes to create and publish the regulations.
Legal risks
The Legal Services unit is responsible for monitoring legal risks.
It is represented on the Risk Committee of the Bank with an
advisory vote and reports on the legal risks that have become
quantifiable as ongoing or imminent court proceedings involv-
ing the Bank or its subsidiaries.
The legal aspects of major undertakings are coordinated with
the Legal Services unit. Legal Services provides specimen texts
and explanations for contracts and other declarations with
particular legal relevance where expedient as a contribution to
preventive risk management. The lawyers of the Legal Services
unit have to be involved in the event of any deviations or new
rulings. If the services of external legal experts are sought either
in Germany or elsewhere, their involvement in principle pro-
ceeds under the management of Legal Services.
The Legal Services unit drafts agreements, general business con-
ditions and other relevant legal declarations as part of its legal
counselling support services in co-operation with the other units
of the Bank. The Legal Services unit is involved in the examina-
tion and negotiation of any legal texts submitted by third parties.
70C-32

If any mistakes or unexpected developments detrimental to the
Bank are encountered, the lawyers help to identify and remedy
the problems and avoid any recurrence in future. They assume
responsibility for examining and evaluating events for factors
of particular legal significance and conduct any proceedings
launched. This applies in particular in respect of countering
any claims asserted against the Bank.
Legal Services reports on legal risks by making submissions to
the Board of Managing Directors, documenting ongoing and
imminent court proceedings and coordinating on a formalised
basis with other units.
Outsourcing risks
Risks associated with significant outsourcing arrangements,
which are linked to the defined objectives of the divisions con-
cerned, can arise in any unit that has outsourced services. The
office responsible for the outsourcing arrangement has a duty
to monitor service provision by the outsourcing company con-
tinuously on the basis of reports and to report to the relevant
Dezernent (board member) in order to limit the risks associ-
ated with outsourcing. The nature of these activities depends
on the significance of the outsourcing arrangement. The
Organisation and Information Technology unit maintains a
directory of all implemented insourcing and outsourcing
transactions in its capacity as the central authority and com-
piles the changes that have occurred with regard to existing
insourcing and outsourcing arrangements as part of an annual
quality assurance exercise.
Risks attributable to insourcing arrangements that arise in con-
nection with activities taken on by Helaba from a third party
are treated analogously.
Information security, IT risk management
and business continuity management
Helaba’s defined information security strategies and regula-
tions provide the basis for an appropriate internal controlling
process and for the secure use of electronic data processing.
The level of information security maintained and the extent to
which it is appropriate given the applicable circumstances are
monitored and adapted continuously using an information
security management system (ISMS). Key systems are subject
to constant surveillance as part of monitoring activities, more-
over, and important processes and procedures and key out-
sourcing arrangements are checked in regular information
security audits.
Mandatory information security (IS) guidelines and security
policies for application development and IT operation aim to
ensure that risks are detected at an early stage and that appro-
priate measures to minimise these risks are defined and imple-
mented. These documents are the subject of continuous ongo-
ing development. Helaba also actively manages IT risks (as a
component of the operational risk). IT risks and the associated
security measures and checks are reviewed, periodically and
on an ad-hoc basis, monitored, contained and reported. The
Bank thus takes proper account of all three aspects of infor-
mation security – availability, integrity and confidentiality – in
order to avoid any detrimental impact on its ability to operate.
The Operational Risk management group also receives regular
reports concerning IS and IT risks.
Helaba’s units and branch offices have drawn up emergency
outage and business continuity plans for the critical business
processes as part of business continuity management activities.
These business continuity plans, which ensure restart, proper
emergency operation and restoration of normal operation, are
updated and refined on a regular basis and probed in tests and
exercises to verify their effectiveness.
Where IT services are outsourced to external service providers,
the related contractual documents contain provisions relating
to preventive measures and measures to limit risks. The docu-
mented procedures for safeguarding operation and the tech-
nical restoration of data processing are tested regularly together
with specialist units of Helaba.
Accounting process
The objective of Helaba’s internal control and risk management
system in relation to the accounting process is to ensure proper
and reliable financial reporting. The Helaba Group’s account-
ing process involves individual reporting units that maintain
self-contained posting groups and prepare local (partial) finan-
cial statements in accordance with HGB and IFRS. Helaba’s
reporting units comprise the Bank (Germany), the branch
offices outside Germany, LBS, WIBank, all consolidated com-
panies and sub-groups and all companies and sub-groups
accounted for using the equity method.
Helaba’s Accounting and Taxes unit consolidates the partial
financial statements from the reporting units to produce the
consolidated accounts under IFRS. Accounting and Taxes also
analyses and prepares the closing data and communicates it to
the Board of Managing Directors.
The components of the internal control and risk management
system for the purposes of the accounting process are as
follows:
■■ control environment,
■■ risk assessment,
■■ controls and reconciliations,
■■ monitoring of controls and reconciliations,
■■ process documentation and
■■ communication of results.
The components of Helaba’s control environment for the
accounting process include appropriate staffing of the units
involved, in particular Accounting and Taxes, with properly
Risk Report Group Management Report 71C-33

qualified personnel. Regular communication ensures that the
individual employees receive all of the information they need
for their work promptly. Any failures that occur despite all of
the checks in place are addressed and remedied in a defined
process. The IT system landscape used in the accounting pro-
cess is subject to IT security strategies and rules that ensure
compliance with the German generally accepted accounting
principles (GoB)/German principles for the proper mainte-
nance and archiving of books, records and documents in elec-
tronic form and for data access (GoBD).
Helaba focuses primarily on the probability of occurrence and
the extent of any potential error when assessing risks in the
accounting process. The impact on the closing statements
(completeness, accuracy, presentation, etc.) should the risk
eventuate is also assessed.
The accounting process includes numerous controls and rec-
onciliations in order to minimise its risk content. Extensive
IT-based controls and reconciliations are used in addition to
the control measures (including the double verification prin-
ciple) applied to ensure the accuracy of manual operations
such as data entry and calculations. These IT-based controls
include mechanisms for subsidiary ledger/general ledger
reconciliation checks and HGB/IFRS consistency checks. The
controlling and reconciliation processes are themselves mon-
itored by means of statistical evaluations for the reconcilia-
tions and reviews of individual validation measures. Internal
Audit is involved in the controlling process and carries out
regular audits of accounting.
The procedure to be followed in accounting is set out in a num-
ber of different complementary forms of documentation.
Accounting manuals for HGB and IFRS define stipulations for
the accounting methods to be used and also contain provisions
on group accounting. The latter relate in particular to the par-
ent company of the Group and the sub-groups included. Rules
concerning organisational factors and the preparation process
are included in addition to the stipulations on approach, mea-
surement, reporting and disclosure requirements that apply
throughout the Group. The individual reporting units have
direct responsibility for incorporating stipulations in varying
degrees of detail concerning the procedure to be applied in the
various processes and subprocesses followed in the prepara-
tion of the financial statements. Employees are able to access
accounting manuals and work instructions at any time via the
Bank’s intranet.
Accounting and Taxes performs analytical audit steps on the
results of financial reporting (the closing figures determined).
This entails plausibility checking the development of the figures
over the course of the year. The closing figures are also cross-
checked against planning outputs, expectations and extrapo-
lations based on business progress. Finally, the figures are
checked for consistency with analyses prepared independently
elsewhere within Helaba. Primary and deputy responsibilities
are assigned for this purpose at Group level for each reporting
unit and each entry in the Notes. The figures are discussed
regularly with the Board of Managing Directors following this
preliminary analysis and validation.
Taxes
The Taxes department, which forms part of the Accounting and
Taxes unit, is responsible for tasks relating to the taxation of the
Bank in Germany and of selected subsidiaries. The tax affairs
of the international branch offices and the other units of the
Group are handled locally. Key developments and outcomes
are included in the reports to the Taxes department for the
purposes of centralised financial statement preparation. Exter-
nal tax advice services are used as required and, in principle,
for the tax return of the foreign units. Tax law developments in
Germany and abroad are monitored constantly and their im-
pact on the Bank and the subsidiaries is analysed. Any necessary
measures are initiated by or in consultation with the Taxes de-
partment and in this way tax risks are either avoided or covered
by appropriate provisions in the statement of financial position.
Business Risk
The business risk is the potential economic loss attributable
to possible changes in customer behaviour, in competitive
conditions in the market or in general economic conditions.
Damage to Helaba’s reputation could also trigger a change in
customer behaviour.
The reputation risk involves the possibility of a deterioration
in Helaba’s public reputation in respect of its competence,
integrity and trustworthiness as a result of perceptions of
the individuals having a business or other relationship with
the Bank. The material consequences of reputation risks im-
pact on the business and liquidity risk and are accordingly
considered under these two risk types. The necessary capital
requirements for the calculation of risk-bearing capacity are
maintained via the business risk. The short-term liquidity risk
takes into account any liquidity squeezes resulting from a loss
of reputation.
Operational and strategic risk containment is the responsi-
bility of the Bank’s front office units and the management of
the respective equity investments. The Risk Controlling unit
analyses the development of business risks and is responsible
for quarterly risk reporting to the Risk Committee of the Board
of Managing Directors.
72C-34

Business risks increased by € 8 m to € 164 m in the year to
31 December 2015 (31 December 2014: € 156 m) due to the
inclusion of GWH and Frankfurter Bankgesellschaft on 31 March
2015.
Real Estate Risks
Real estate risks comprise the real estate portfolio risk – the
potential economic loss from fluctuations in the value of an
entity’s own real estate – and the real estate project manage-
ment risk associated with project development business. Risks
associated with the provision of equity and loan capital for a
project are excluded from this risk type, as are risks associated
with real estate finance.
Risks from fluctuations in market values currently arise in
particular for the portfolio properties of the GWH Group (GWH
Wohnungsgesellschaft mbH Hessen) and properties owned by
Helaba. Risks in project development business, which are
associated with deadline, quality, cost and marketing factors,
arise in particular in the operationally independent subsidiaries
of the OFB Group (OFB Projektentwicklung GmbH) and the
GWH Group (in its real estate development business) and
also in real estate developments pursued by Helaba directly,
or indirectly through project companies.
Direct containment at the operationally independent sub sidi-
aries is the responsibility of the management at the sub sidi ary.
There are two aspects to the containment of real estate risks:
■■ operational – the responsibility of management at each of
the Group companies concerned
■■ strategic – the responsibility of the supervisory bodies of the
investment companies and the Real Estate Management
unit.
The Real Estate Management unit is responsible for risk con-
tainment in respect of the directly and indirectly held real
estate project companies, and of Helaba’s own real estate
portfolio. Risk monitoring is performed by the Risk Controlling
and Real Estate Management units.
Project risks are contained with reference to the opportunity
and risk overview prepared every quarter to identify and track
future non-budgeted project opportunities and risks, which
establishes opportunities and cost, earnings and other risks
in a structured process and evaluates both their impact on
the budget (in the manner of a risk-bearing capacity analysis)
and their probability of occurrence (with reference to specific
occurrence scenarios). The Real Estate Management unit
assists with the preparation of the opportunity and risk over-
view and verifies the plausibility of the details. The principal risk
controlling tool for containing risks attributable to portfolio
properties are the value appraisals commissioned regularly for
the portfolio properties and the continuous surveillance of
returns from changes in capital values in the relevant markets,
broken down by region and type of use.
The Risk Controlling unit analyses the development of risks
arising from portfolio properties and from real estate project
management business and is responsible for quarterly risk
reporting to the Risk Committee of the Board of Managing
Directors. The risk situation is also presented as part of opera-
tional management in the meetings of the supervisory body of
each Group company.
The risks associated with real estate projects and real estate
portfolios decreased to € 21 m in 2015 as a result of progress
in various projects (2014: € 31 m). These risks continue to be
fully covered by the expected income from the associated
transactions.
Summary
The controlled acceptance of risks plays a central role at Helaba
in the management of the company. We accept and manage
risks on the basis of our comprehensive risk identification,
quantification, control and containment system. Although they
are already very highly evolved and satisfy all statutory and
supervisory requirements, we refine our methods and systems
continuously. Our fundamental organisational principles put
in place the structures necessary to ensure successful imple-
mentation of the risk strategy defined. Helaba, in conclusion,
has at its disposal a stock of proven and effective methods and
systems with which to master the risks it chooses to accept.
Risk Report Group Management Report 73C-35

Outlook and Opportunities
Economic conditions
In 2016, the main stimulus for the global economy will come
from the industrialised nations, as was the case in 2015. The
US economy will continue to set the pace. The euro zone is
forecast to grow at 1.6 %, once again exceeding its potential.
China’s growth trend will continue to slacken off and the situ-
ation in Russia and other oil-exporting countries will remain
challenging. Global economic growth is expected to be similar
to the previous year at around 3 %.
In 2016, Germany will grow at a rate of 1.7 % (seasonally adjusted),
just a little faster than the euro zone as a whole. Domestic de-
mand should again be the main driver: real incomes and em-
ployment will continue to rise. Significant migration into
Germany is another reason why consumption in the country is
likely to give a substantial boost to growth. Capital investment
will only gradually gain momentum although there will be
growing activity in the construction industry. The outlook for
both residential construction and public-sector activity is more
favourable. Foreign trade will benefit from the weaker euro.
Government finances are likely to show a negligible surplus at
best in 2016 following the surplus of 0.5 % of GDP in 2015.
Although tax receipts will continue to grow, the expenditure
required to integrate migrants and the necessary capital in-
vestment will limit the budget surplus. The differences in
growth rates among the countries of the euro zone will remain
significant. Economic growth will probably be above average
again in Ireland and Spain, where a successful structural policy
has been implemented. On the other hand, France and Italy
were slow to initiate reforms and the pace has been slow.
Growth in both of these countries will be sluggish again in 2016.
As the modest growth continues, accompanied by low inflation,
many central banks will be able to continue their extremely
expansionary monetary policies. Whereas the US Federal
Reserve (Fed) has now changed direction and raised interest
rates, the ECB has extended its bond-buying programme into
2017. Although long-term interest rates in Germany will there-
fore remain low, the influence of the US bond market is likely
to result in a slight rise by the end of the year.
Opportunities
Helaba has long had a stable and viable strategic business
model in place. In the last few years, the Bank has therefore not
only been able to consolidate its market position in its core
areas of business, but it has also been able to continuously im-
prove its operating results. The good operating results gener-
ated by Helaba have enabled it to service all subordinated lia-
bilities, profit participation rights and silent participations in
full at all times and pay regular dividends. The key factors
behind Helaba’s success remain its conservative risk profile,
backed up by effective risk management, and the strategic
business model for the Group as a whole based on the concept
of a full-service bank with its own retail business, a strong base
in the region, a very close relationship with the Sparkassen and
robust capital and liquidity adequacy. Helaba is valued by its
customers as a reliable partner because of its sound business
model. This is reflected particularly in the long-term financing
operations in real estate lending and corporate finance, in
which the Bank is one of the leading providers in Germany.
Helaba was able to maintain the significant profit before taxes
achieved in 2014 despite the persistently low level of interest
rates and a sharp increase in the structural costs of banking
due to changes in the national and international regulatory
environment.
Rating agencies Fitch Ratings (Fitch), Standard & Poor’s (S&P)
and Moody’s Investors Service have awarded Helaba ratings of
A+, A and A1 for long-term senior unsecured liabilities and
F– 1+, A– 1 and P– 1 for short-term liabilities. The agencies have
reviewed the ratings and confirmed them in full, taking into
account the new European resolution arrangements. The
Bank’s deposit rating has even been upgraded from A1 to Aa3
as part of the new rating methodology in January 2016.
The ratings from Fitch and S&P are based on a joint S-Group
rating for the Sparkassen-Finanzgruppe Hessen-Thüringen.
The strategically significant funding instruments “public
Pfandbriefe” and “mortgage Pfandbriefe” both have AAA rat-
ings. Thanks to its excellent standing among institutional and
private investors and its diversified product range, Helaba has
continued to enjoy direct access to the funding markets even
in the face of the financial market difficulties of recent years.
Helaba’s status as part of a strong association of financial in-
stitutions also underpins its ongoing ability to access funding
in the money and capital markets.
Helaba is firmly and permanently established as part of the Ger-
man Sparkassen organisation by virtue of its ownership structure
(88 % of its shares are held by members of the Sparkassen organ-
isation) and its central bank function for 40 % of Sparkassen in
Germany. This means that future changes in the sector will give
rise to numerous strategic opportunities. Further enhancing its
position as a leading S-Group bank for the German Sparkassen
is one of Helaba’s strategic objectives. The pressure on profit-
ability created by the level of competition in retail banking and
exacerbated by the current period of low interest rates will lead
to greater task sharing within the S-Group.
The real estate business is one of Helaba’s strategic core busi-
ness areas. It offers almost all products and services along the
value chain, including structuring, financing and portfolio
management. Long-term customer relationships combined
with a sustainable business policy in the carefully selected
domestic and international target markets have formed the
basis for the growth in new business over the last few years.
74C-36
A representative office will be opened in Stockholm in 2016 to
help Helaba continue the process of tapping into the potential
offered by the Scandinavian real estate markets. Even during
periods of increasing competition and downward pressure on
margins, Helaba believes that there are good opportunities for
the Bank to continue to consolidate its market position in real
estate lending based on its product expertise and on its well-
established presence in the markets over many years.
In lending business, Helaba will both expand the range of prod-
ucts and services it offers customers and investors and fine-
tune the management of its own assets and liabilities to back
up its syndication teams. Syndication arrangements also allow
Sparkassen to participate in lending transactions set up by
Helaba experts and thus diversify their risk.
Export-oriented corporate customers expect their partner bank
to offer a range of products that will help them with their
international activities. The Bank’s institutional roots in the
Sparkassen-Finanzgruppe and its extended customer base are
enabling Helaba to establish itself as a leading provider of
inter national trade finance and payment transactions in the
Sparkassen-Finanzgruppe and lift business volumes and
income in this segment. In this regard, the Bank has specified
various regions in which it intends to focus. To support the
development of business in these regions, further representa-
tive offices are to be opened in São Paulo and Istanbul.
In the payments business, Helaba continues to be Germany’s
second-largest payment transaction clearing house and lead-
ing Landesbank in a market shaped by increasing competitive
pressure and further regulatory requirements. The associated
opportunities, particularly in the clearing and card processing
business, are being systematically exploited with the aim of
generating fees and commissions to counter the prolonged
negative impact from the low interest rates and further increases
in the downward pressure on margins.
The structural shift to digital is leading to an ongoing change
in customer behaviour and impacting on trading and pay-
ment methods in e-commerce and m-commerce. To protect
its anchor product – the current account – and fend off com-
petitors from outside the industry, the banking sector has
developed a joint standard payments system known as “pay-
direkt” that will ensure the retention of as wide a range of
buyers and merchants as possible. The involvement of the
Sparkassen-Finanzgruppe in the paydirekt system was estab-
lished when GIZS GmbH & Co. KG, the representative entity
for the Sparkassen-Finanzgruppe, formally joined the system
on 28 January 2016; the full market launch is currently
planned for the end of April 2016 when a testing and piloting
phase has been completed. The equity investment in GIZS
GmbH & Co. KG is also helping Helaba to reinforce its inno-
vative capability and position as one of the most important
payment services providers in the sector, in Germany and in
the Single Euro Payments Area (SEPA).
Digitisation will be a key issue for banks over the next few years.
Digitisation will open up opportunities to optimise business
and IT processes. The interfaces with the customer are being
redefined, creating other options for developing new products.
At Helaba, digitisation is one of the core areas of activity for the
future.
Overall, Helaba finds itself well placed to meet the challenges
of the future over the long term with its established strategic
business model and sees additional development opportuni-
ties in the expansion of regional private customers and SME
business, S-Group business, public development and infra-
structure business, and in the closure of gaps in its client base
and product range (at both domestic and international levels)
in wholesale business. Helaba’s strategy for profitability aims
to safeguard its sustainable earning power to strengthen its
capital base and enhance its enterprise value while maintain-
ing its risk-bearing capacity and taking account of the changes
in the regulatory environment and marked increase in the
structural costs of banking.
Probable development of the Group
Landesbank Hessen-Thüringen Girozentrale (Helaba) is a
credit institution organised under public law; its business
model is based on a strong regional focus, a presence in care-
fully selected international markets and a very close relation-
ship with the Sparkasse organisation and therefore provides
an excellent foundation for the development of the business
in 2016. The economic forecasts for 2016 predict stable eco-
nomic trends with moderate growth. However, the persistently
low interest rates and the large number of regulatory require-
ments will have an adverse impact on expected performance
in 2016.
In the Real Estate segment, Helaba expects the real estate
lending business in Germany to continue to be characterised
in 2016 by a stable market environment. Real estate lending,
both in Germany and abroad, is increasingly subject to down-
ward pressure on prices with financing competitors showing
a greater appetite for risk – a trend that is also being rein-
forced by the liquidity pumped into the system by central
banks. Against this background, in 2016, Helaba will continue
to stand by its adopted approach, in which medium- and
long-term new business is selected on the basis of a balance
of risk and reward. The volume of new medium- and long-
term lending business in 2016 is therefore budgeted to be
around 20 % down on 2015 at € 7.8 bn. After factoring in the
anticipated redemptions, this new business will lead to a
slight increase in loans and advances to customers and stable
income (before provisions for losses on loans and advances)
at the prior-year level. Budgets for 2016 income from the
equity investments in the real estate business are at the level
of income achieved in 2015. Provisions for losses on loans and
advances will rise compared with the very low prior-year
level by around 46 %. In 2016, based on the projected rise in
provisions for losses on loans and advances, stable income
Outlook and Opportunities Group Management Report 75C-37

and a slight increase in general and administrative expenses,
profit before taxes for the segment is forecast to be approxi-
mately 12 % below the very good level achieved in 2015.
In the Corporate Finance segment, demand for credit is ex-
pected to remain subdued in 2016 despite the generally upbeat
economic environment, and the market will be highly compet-
itive. The volume of new medium- and long-term lending busi-
ness in 2016 is therefore budgeted to be around 13 % down on
2015 at € 4.8 bn. Factoring in the expected redemptions, Helaba
is forecasting a slight rise in loans and advances to customers.
Based on this growth in the portfolio and a greater level of
international trade business with corporate customers, income
before provisions for losses on loans and advances is predicted
to rise slightly compared with the previous year. In 2016,
Helaba is not anticipating any items with an adverse impact
under net income from financial investments or under share
of profit or loss of equity-accounted investments. Profit before
taxes in 2016 is predicted to be 38 % up on 2015, i.e. well above
the prior-year figure, taking into account forecast provisions
for losses on loans and advances below the 2015 level and just
a slight increase in general and administrative expenses.
The Financial Markets segment encompasses the interest-
related business with domestic and foreign local and regional
authorities. The volume of new medium- and long-term lend-
ing in the municipal lending business in Germany is budgeted
to be € 0.7 bn in 2016, which is below the level of 2015. New
business with foreign financial institutions and public author-
ities will continue to be transacted only on a selective basis in
2016, with a volume budgeted at € 0.3 bn. In 2016, this segment
is once again expected to be adversely affected by the low
yields on highly liquid securities with strong credit ratings that
the Bank has to hold to meet the LCR requirements.
In the asset management business, it is planned to push up the
level of net fee and commission income by achieving a further
increase in the volume of assets under management (+5 %). In
the capital markets business, Helaba plans to generate a further
increase in the proportion of customer- and volume-driven
income in 2016 by cross-selling and improving its competitive
position in the primary markets business. Generally speaking,
Helaba does not plan any income for net income from hedge
accounting (in which the ineffective portion of micro hedges
is reported), derivatives or financial investments. Earnings in
capital market operations are therefore anticipated to be
sharply lower year on year, but sustainable over the long term.
In the S-Group Business, Private Customers and SME Busi-
ness segment, there is expected to be a decline of 13 % in the
income of Frankfurter Sparkasse because of the persistently
low interest rates. Income generated by Frankfurter Bankge-
sellschaft and LBS is forecast to remain largely steady for
2016 with profit before taxes remaining at the level of 2015.
In the S-Group bank business with the Sparkassen, Helaba
is aiming to consolidate its position as the leading S-Group
bank for the German Sparkassen organisation based on a
nationwide sales approach. Again in 2016, Helaba is plan-
ning to introduce numerous product improvements and step
up its sales activities. Compared with the profit before taxes
in 2015, the segment profit before taxes in 2016 is expected
to be roughly one third lower because of the low interest
rates and the return of provisions for losses on loans and
advances to normal levels.
Developments in the Public Development and Infrastructure
Business segment in 2016 will be characterised by continued
expansion of the development business and the new EU fund-
ing period, again with regard to the necessary changeover in
systems. New business in 2016 is likely to comprise loans of
around € 1.4 bn (2015: € 1.9 bn) and an unchanged level of
grants. The grants comprise non-repayable funding from the
European Union, the German federal government and the State
of Hesse, to be used for example to support agriculture or
healthcare infrastructure. The grants are administered and
paid out to the recipients by WIBank on behalf of the provider.
Income is expected to contract slightly in 2016 owing to the loss
of some of the long-standing high-margin business that has
now come to an end. General and administrative expenses are
planned to rise slightly compared with 2015. Overall, the profit
before taxes in the segment is projected to be at the average for
previous years at € 17 m.
In the Other segment, slightly rising income is predicted in the
cash management and custody services businesses, driven by
an improvement in market position. Income from the invest-
ment of own funds is budgeted at a figure significantly in ex-
cess of the 2015 level. In 2016, other net operating income is
expected to include slightly higher income from equity invest-
ments than in 2015. In general and administrative expenses, a
modest year-on-year increase in the proportion of centrally
reported project costs has been forecast.
Total new medium- and long-term lending business (including
Frankfurter Sparkasse but excluding the WIBank development
business, which does not form part of the competitive market)
is budgeted at € 16.6 bn again for 2016. Total assets are ex-
pected to increase slightly in 2016 by around € 6 bn to € 178 bn.
The proportion of total assets accounted for by customer busi-
ness is forecast to rise in 2016 by approximately 1.5 percentage
points.
However, overall net interest income for the Group is likely to
be down by around 9 % year on year in 2016. A slight increase
in customer contributions will be offset by the adverse impact
from low interest rates on Frankfurter Sparkasse and on own
funds investing activities.
Provisions for losses on loans and advances are budgeted at
€ 222 m for 2016, slightly lower than in 2015 given that good
76C-38

economic conditions are likely to continue. As before, this does
not include delays in recognition caused by the consolidation
of non-performing loans.
Net fee and commission income has been budgeted at roughly
7 % higher than in 2015, mainly because of the growth in cus-
tomer business.
A year-on-year fall of 26 % in net trading income is anticipated
for 2016.
Other net operating income is projected to amount to € 243 m
in 2016, a significantly higher figure than in 2015.
The Bank is planning to reduce the headcount slightly in 2016.
An increase in the number of posts on a selective basis – in
particular to implement the planned strategic initiatives – will
be offset by planned job cuts as part of the implementation of
the Bank’s programme to improve efficiency and fine-tune
resources. A substantial impact is anticipated from this pro-
gramme in 2016. Taking into account collective pay increases,
overall personnel expenses will rise slightly. In contrast, there
is a significant year-on-year increase in the budgeted non-per-
sonnel operating expenses for 2016. Savings will be more than
offset in 2016 by a continued high level of project costs related
to ensuring compliance with regulatory requirements and by
structural costs of banking. These costs also include rising regu-
latory cost allocations and a higher bank levy. Overall, general
and administrative expenses for the Group are budgeted to be
up by 5 % year on year in 2016.
The consolidated net profit budgeted for 2016 is therefore
approximately 13 % below the level achieved in 2015.
The cost-income ratio for 2016 is forecast at approximately 63 %.
Return on equity for 2016 is forecast at approximately 7.1 %.
The Bank’s aim for 2017 is to continue developing its business
divisions while systematically increasing income from cus-
tomer business. The adverse effects associated with the low
interest rates should dissipate with the expected return of in-
terest rates to normal levels. Overall, Helaba plans to lift earn-
ings over the medium term.
Risks to the Bank’s earnings performance stem from political
and macroeconomic trends. These include the United King-
dom’s potential exit from the EU, a further escalation of the
conflicts in the Middle East and further dampening of the
growth stimulus from China. In the financial sector, unex-
pected outcomes from the stress tests planned by the EBA/ECB
could lead to a slowdown in activity. There is a particular risk
to the Bank if the requirements and costs related to regulatory
initiatives turn out to be greater than expected. The Bank is
assuming that the low interest rates will continue in 2016. Risks
then arise if interest rates become even lower.
Overall assessment
In 2015, Helaba generated profit before taxes of € 596 m, almost
reaching the record level achieved in 2014. A key factor in this
success was the further expansion of the operating business in
the core areas of business. Helaba again increased both net
interest income and net fee and commission income year on
year. Added to this were the market-related rise in customer-
driven capital market business, which is reported under net
trading income, and a significant increase in other net oper-
ating income. The rise in provisions for losses on loans and
advances reflected the continuation of the Bank’s conservative
policy regarding such provisions. Despite collective pay increases
and a further rise in the structural costs of banking and cost
allocations, general and administrative expenses were reduced,
thereby helping to stabilise earnings.
Despite the increasing competitive pressure and the multitude
of regulatory requirements, Helaba is well placed to meet the
challenges of the future over the long term with its strategic
business model focused on the needs of the real economy and
the S-Group. It sees additional development opportunities in
the expansion of regional private customers and SME business,
S-Group business, public development and infrastructure
business, and in the closure of gaps in its client base and prod-
uct range (at both domestic and international levels) in whole-
sale business. Helaba’s strategy for profitability aims to bring
about further improvements in its sustainable earning power
to strengthen its capital base and enhance its enterprise value
while maintaining its risk-bearing capacity and taking account
of the increase in banking structural costs as a result of regu-
latory requirements.
Frankfurt am Main/Erfurt, 1 March 2016
Landesbank Hessen-Thüringen Girozentrale
The Board of Managing Directors
Grüntker Fenk Groß Dr. Hosemann
Krick Mulfinger Dr. Schraad
Outlook and Opportunities Group Management Report 77C-39
Consolidated Financial Statements
80 Income Statement
81 Statement of Comprehensive Income
82 Statement of Financial Position
84 Statement of Changes in Equity
85 Cash Flow Statement
Notes
Accounting Policies
87 (1) Basis of Presentation
90 (2) Principles of Consolidation
93 (3) Basis of Consolidation
94 (4) Financial Instruments
96 (5) Offsetting a Financial Asset and a Financial Liability
96 (6) Hedge Accounting
97 (7) Structured Products
97 (8) Financial Guarantees
98 (9) Repurchase Agreements and Securities Lending
98 (10) Accounting Treatment of Leases
99 (11) Currency Translation
99 (12) Provisions for Losses on Loans and Advances
100 (13) Investment Property
101 (14) Property and Equipment
101 (15) Intangible Assets
102 (16) Non-Current Assets and Disposal Groups Classified as Held for Sale
102 (17) Other Assets and Other Liabilities
102 (18) Provisions for Pensions and Similar Obligations
103 (19) Other Provisions
103 (20) Taxes on Income
104 (21) Subordinated Capital
Income Statement Disclosures
105 (22) Net Interest Income
106 (23) Provisions for Losses on Loans and Advances
106 (24) Net Fee and Commission Income
106 (25) Net Trading Income
107 (26) Gain or Loss on Non-Trading Derivatives and Financial Instruments to which the Fair Value Option is Applied
107 (27) Net Income from Hedge Accounting
107 (28) Net Income from Financial Investments
108 (29) Share of Profit or Loss of Equity-Accounted Entities
108 (30) Other Net Operating Income
109 (31) General and Administrative Expenses
109 (32) Taxes on income
111 (33) Segment Reporting
Statement of Financial Position Disclosures
114 (34) Cash Reserve
114 (35) Loans and Advances to Banks
114 (36) Loans and Advances to Customers
115 (37) Provisions for Losses on Loans and Advances
116 (38) Trading Assets
117 (39) Positive Fair Values of Non-Trading Derivatives
117 (40) Financial Investments
118 (41) Shares in Equity-Accounted Entities
120 (42) Investment Property
121 (43) Property and Equipment
122 (44) Intangible Assets
123 (45) Income Tax Assets
124 (46) Other Assets
124 (47) Liabilities Due to Banks
125 (48) Liabilities Due to Customers
125 (49) Securitised Liabilities
126 (50) Trading Liabilities
126 (51) Negative Fair Values of Non-Trading Derivatives
126 (52) Provisions
133 (53) Income Tax Liabilities
134 (54) Other Liabilities
134 (55) Subordinated Capital
134 (56) Equity
C-40
Further Disclosures about Financial Instruments
136 (57) Provision of Collateral
137 (58) Transfer of Financial Assets without Derecognition
137 (59) Transfer of Financial Assets with Derecognition
138 (60) Disclosures regarding Offsetting Assets and Liabilities in the Statement of Financial Position
139 (61) Subordinated Assets
140 (62) Foreign Currency Volumes
140 (63) Breakdown of Maturities
141 (64) Derivatives
143 (65) Carrying Amounts and Contributions to Earnings, Broken Down by Measurement Category
145 (66) Fair Values of Financial Instruments
150 (67) Reclassification of Financial Assets
151 (68) Disclosures Relating to Financial Instruments to which the Fair Value Option is Applied
152 (69) Disclosures Relating to Issuing Activities
153 (70) Risk Management Disclosures
153 (71) Credit Risks Attributable to Financial Instruments
Off-Balance Sheet Transactions and Obligations
156 (72) Contingent Liabilities and Other Off-Balance Sheet Obligations
157 (73) Letters of Comfort
157 (74) Fiduciary Transactions
Other Disclosures
158 (75) Leasing Disclosures
159 (76) Capital Management and Regulatory Ratio Disclosures
160 (77) Report on Business Relationships with Structured Entities
162 (78) Significant Restrictions on Assets or on the Transfer of Funds
162 (79) Related Party Disclosures
165 (80) Auditors’ Fees
165 (81) Employee Disclosures
166 (82) Members of the Supervisory Board
167 (83) Members of the Board of Managing Directors
168 (84) Positions on Supervisory Boards and Other Executive Bodies
169 (85) List of Shareholdings of Landesbank Hessen-Thüringen Girozentrale in Accordance with Section 315a in Conjunction with Section 313 (s) HGB
177 Responsibility Statement
178 Country by Country Reporting Pursuant to Section 26a KWG
181 Auditor’s Report
C-41

Income Statement
for the period 1 January to 31 December 2015
2015 20141) Change
Notes in € m in € m in € m in %
Interest income 4,385 4,772 – 387 – 8.1
Interest expenses – 3,073 – 3,479 406 11.7
Net interest income (4), (22) 1,312 1,293 19 1.5
Provisions for losses on loans and advances (11), (23) – 237 – 80 – 157 > – 100.0
Net interest income after provisions for losses on loans and advances 1,075 1,213 – 138 – 11.4
Fee and commission income 567 516 51 9.9
Fee and commission expenses – 234 – 199 – 35 – 17.6
Net fee and commission income (24) 333 317 16 5.0
Net trading income (4), (25) 190 126 64 50.8
Gain or loss on non-trading derivatives and financial instruments to which the fair value option is applied (4), (6), (26) 22 38 – 16 – 42.1
Net income from hedge accounting (6), (27) 3 13 – 10 – 76.9
Net income from financial investments (4), (28) 7 33 – 26 – 78.8
Share of profit or loss of equity-accounted entities (2), (29) – 17 12 – 29 > – 100.0
Other net operating income (13), (30) 173 70 103 > 100.0
General and administrative expenses (31) – 1,190 – 1,215 25 2.1
Profit before taxes 596 607 – 11 – 1.8
Taxes on income (20), (32) – 177 – 210 33 15.7
Consolidated net profit 419 397 22 5.5
thereof: Attributable to non-controlling interests – 8 – 4 – 4 – 100.0
thereof: Attributable to shareholders of the parent company 427 401 26 6.5
1) Prior-year figures restated; see also Note (1).
80C-42

Statement of Comprehensive Income
for the period 1 January to 31 December 2015
2015 2014 Change
Notes in € m in € m in € m in %
Consolidated net profit according to the income statement 419 397 22 5.5
Items that will not be reclassified to the income statement:
Remeasurement of net defined benefit liability (52) 77 – 444 521 >100.0
Taxes on income on items that will not be reclassified to the income statement – 23 130 –153 > – 100.0
Subtotal 54 – 314 368 >100.0
Items that will be subsequently reclassified to the income statement:
Gains or losses on available-for-sale financial assets
Measurement gains (+) or losses (–) on available-for-sale financial assets – 60 202 – 262 > – 100.0
Gains (–) or losses (+) reclassified to the income statement upon disposal or impairment of the assets – 2 – 29 27 93.1
Share of other comprehensive income or loss of equity-accounted entities
Gains (–) or losses (+) reclassified to the income statement upon disposal or impairment of the assets – 4 – 4 – 100.0
Changes due to currency translation
Gains (+) or losses (–) on currency translation of foreign operations 9 12 – 3 – 25.0
Taxes on income on items that will be reclassified to the income statement (32) 19 – 55 74 > 100.0
Subtotal – 34 134 –168 > – 100.0
Other comprehensive income after taxes 20 –180 200 > 100.0
Comprehensive income for the reporting period 439 217 222 > 100.0
thereof: Attributable to non-controlling interests – 4 3 – 7 > – 100.0
thereof: Attributable to shareholders of the parent company 443 214 229 > 100.0
81Income Statement Consolidated Financial Statements
Statement of Comprehensive Income
C-43

Statement of Financial Position
as at 31 December 2015
Assets
31.12.2015 31.12.2014 Change
Notes in € m in € m in € m in %
Cash reserve (34) 1,909 1,033 876 84.8
Loans and advances to banks (4), (35) 17,144 20,579 – 3,435 –16.7
Loans and advances to customers (4), (36) 93,194 91,109 2,085 2.3
Allowances for losses on loans and advances (12), (37) – 986 – 1,007 21 2.1
Trading assets (4), (38) 26,078 31,262 – 5,184 –16.6
Positive fair values of non-trading derivatives (4), (6), (39) 4,376 5,828 – 1,452 – 24.9
Financial investments (4), (40) 26,575 26,590 –15 – 0.1
Shares in equity-accounted entities (2), (41) 34 39 – 5 –12.8
Investment property (13), (42) 1,946 1,909 37 1.9
Property and equipment (14), (43) 425 443 –18 – 4.1
Intangible assets (15), (44) 141 141 – –
Income tax assets (20), (45) 495 371 124 33.4
Other assets (17), (46) 925 1,192 – 267 – 22.4
Total assets 172,256 179,489 – 7,233 – 4.0
82C-44

Equity and liabilities
31.12.2015
31.12.2014
Change
Notes in € m in € m in € m in %
Liabilities due to banks (4), (47) 35,976 35,612 364 1.0
Liabilities due to customers (4), (48) 47,727 45,320 2,407 5.3
Securitised liabilities (4), (49) 47,073 48,320 – 1,247 – 2.6
Trading liabilities (4), (50) 22,423 29,219 – 6,796 – 23.3
Negative fair values of non-trading derivatives (4), (6), (51) 4,380 5,351 – 971 – 18.1
Provisions (18), (19), (52) 2,089 2,152 – 63 – 2.9
Income tax liabilities (20), (53) 184 125 59 47.2
Other liabilities (17), (54) 642 630 12 1.9
Subordinated capital (21), (55) 4,086 5,410 – 1,324 – 24.5
Equity (56) 7,676 7,350 326 4.4
Subscribed capital 2,509 2,509 – –
Capital reserves 1,546 1,546 – –
Retained earnings 3,398 3,030 368 12.1
Revaluation reserve 202 249 – 47 – 18.9
Currency translation reserve 23 14 9 64.3
Non-controlling interests – 2 2 – 4 > – 100.0
Total equity and liabilities 172,256 179,489 – 7,233 – 4.0
83Statement of Financial Position Consolidated Financial StatementsC-45
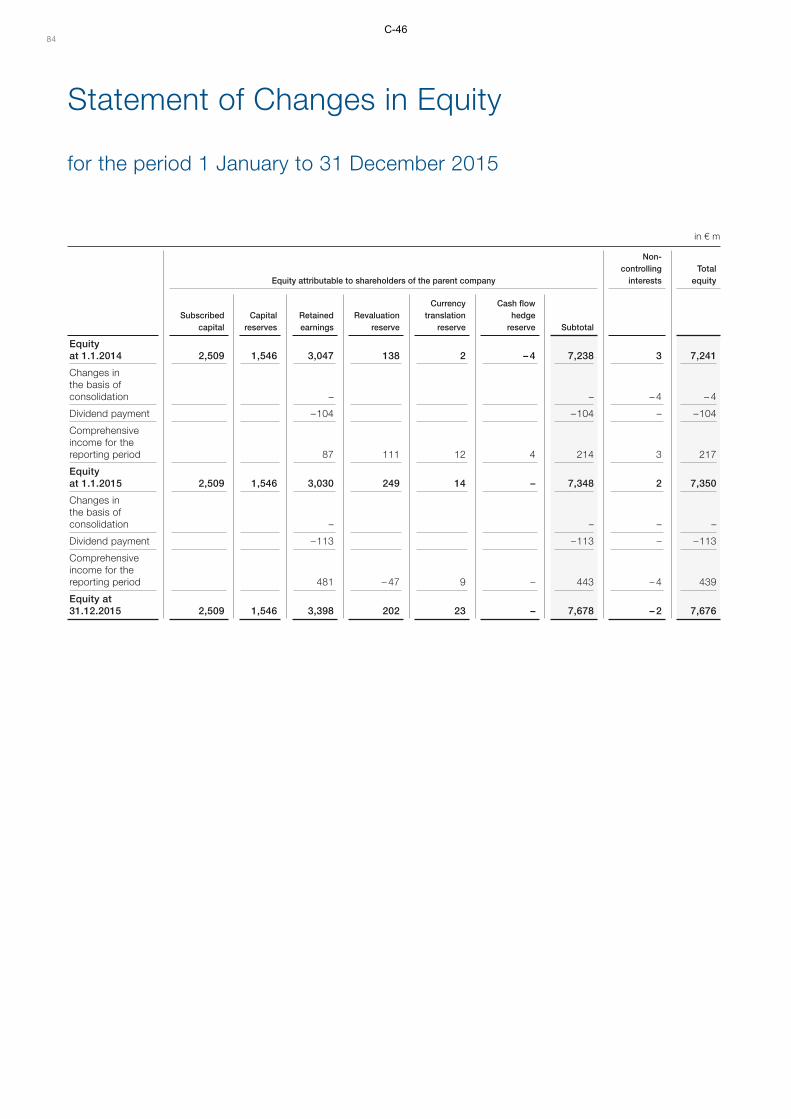
Statement of Changes in Equity
for the period 1 January to 31 December 2015
in € m
Equity attributable to shareholders of the parent company
Non- controlling
interestsTotal
equity
Subscribed
capitalCapital
reservesRetained earnings
Revaluation reserve
Currency translation
reserve
Cash flow hedge
reserve Subtotal
Equity at 1.1.2014 2,509 1,546 3,047 138 2 – 4 7,238 3 7,241
Changes in the basis of consolidation – – – 4 – 4
Dividend payment – 104 – 104 – – 104
Comprehensive income for the reporting period 87 111 12 4 214 3 217
Equity at 1.1.2015 2,509 1,546 3,030 249 14 – 7,348 2 7,350
Changes in the basis of consolidation – – – –
Dividend payment – 113 – 113 – – 113
Comprehensive income for the reporting period 481 – 47 9 – 443 – 4 439
Equity at 31.12.2015 2,509 1,546 3,398 202 23 – 7,678 – 2 7,676
84C-46

Cash Flow Statement
for the period 1 January to 31 December 2015
in € m
2015
2014
Consolidated net profit 419 397
Non-cash items in consolidated net profit and reconciliation to cash flow from operating activities:
Depreciation, amortisation and impairment losses on non-current assets, allowances for losses on loans and advances, and reversals of such impairment losses and allowances 569 – 73
Additions to/reversals of provisions 155 253
Other non-cash expense/income – 599 – 66
Gain or loss on the disposal of non-current assets – 81 – 50
Other adjustments – 1,002 – 1,111
Subtotal – 539 – 650
Changes in assets and liabilities from operating activities after adjustment for non-cash items:
Loans and advances to banks 3,271 807
Loans and advances to customers – 2,174 85
Trading assets/liabilities – 1,235 – 3,629
Other assets from operating activities 336 750
Liabilities due to banks 561 1,441
Liabilities due to customers 2,509 1,416
Securitised liabilities – 1,144 – 288
Other liabilities from operating activities – 18 – 136
Interest and dividends received 4,352 4,946
Interest paid – 3,336 – 3,475
Income tax payments – 242 – 110
Cash flow from operating activities 2,341 1,157
Proceeds from the disposal of:
Financial investments 9,990 8,057
Property and equipment 3 –
Investment property 49 43
Payments for the acquisition of:
Financial investments – 9,944 – 10,025
Property and equipment – 12 – 11
Investment property – 104 – 84
Intangible assets – 16 – 16
Effect of changes in basis of consolidation:
Payments for the acquisition of subsidiaries and associates 3 5
Cash flow from investing activities – 31 – 2,031
Dividend payments – 113 – 104
Other financing activities (subordinated capital) – 1,265 381
Cash flow from financing activities – 1,378 277
85Statement of Changes in Equity Consolidated Financial Statements
Cash Flow Statement
C-47

in € m
2015
2014
Cash and cash equivalents at 1.1. 1,033 1,753
Cash flow from operating activities 2,341 1,157
Cash flow from investing activities – 31 – 2,031
Cash flow from financing activities – 1,378 277
Effect of exchange rate changes, measurement changes and changes in basis of consolidation – 56 – 123
Cash and cash equivalents at 31.12. 1,909 1,033
thereof:
Cash on hand 77 78
Balances with central banks 1,832 955
The cash flow statement shows the composition of and changes
to cash and cash equivalents in the financial year. The changes
in cash and cash equivalents are attributable to operating
activities, investing activities and financing activities.
The cash flow from operating activities comprises proceeds
from and payments for loans and advances, liabilities, trading
assets/liabilities and other assets or liabilities. The interest and
dividend payments resulting from operating activities are
shown separately. The other adjustments relate to net interest
income and taxes on income excluding deferred taxes.
The cash flow from investing activities comprises proceeds and
payments relating to financial investments, property and
equipment, investment property and intangible assets as well
as proceeds and payments in connection with the sale or
acquisition of subsidiaries and associates. Further disclosures
concerning the consolidated companies purchased or sold are
set out in Note (3).
Cash flow from financing activities includes inflows and out-
flows related to subordinated capital. The dividends paid out
in the financial year and the servicing of the silent participa-
tions reported as equity are also recognised under this cash
flow category.
Cash and cash equivalents correspond to the cash reserve,
which comprises cash on hand and balances with central banks.
86C-48

Notes
Accounting Policies
(1) Basis of Presentation
Basis of accounting
The consolidated financial statements of the Helaba Group
for the year ended 31 December 2015 have been prepared
pursuant to section 315a (1) of the German Commercial Code
(Handelsgesetzbuch, HGB) and Regulation (EC) No. 1606/2002
of the European Parliament and of the Council of 19 July 2002
(IAS Regulation) in accordance with the International Financial
Reporting Standards (IFRSs) as published by the International
Accounting Standards Board (IASB) and adopted by the Euro-
pean Union (EU).
The consolidated financial statements comprise the income
statement, the statement of comprehensive income, the state-
ment of financial position, the statement of changes in equity,
the cash flow statement and the notes. The segment reporting
is included within the notes. The group management report in
accordance with section 315 HGB includes a separate report
on the opportunities and risks of future development (oppor-
tunity and risk report) in which the risk management system
is also explained.
The reporting currency of the consolidated financial state-
ments is the euro (€). Euro amounts are generally rounded to
the nearest million.
The IFRSs and International Financial Reporting Standards
Interpretations (IFRICs) that were in force as at 31 December
2015 have been applied in full. The relevant requirements of
German commercial law as specified in section 315a HGB have
also been observed.
IFRSs applied for the first time
The 2015 financial year was the first year in which mandatory
application was required for the following IFRSs and IFRICs
adopted by the EU and of significance for Helaba:
■■ IFRIC 21 Levies
IFRIC 21 is concerned with the accounting treatment of levies
that do not constitute income taxes within the meaning of
IAS 12 and, in particular, clarifies when obligations to pay
levies of this nature must be reported in financial statements
as a liability or a provision. Under IASB requirements, IFRIC 21
ought to have been applicable for the first time in the 2014
financial year. However, when adopting the standards, the
EU postponed mandatory initial application until annual
reporting periods beginning on or after 17 June 2014. IFRIC 21
must be applied retrospectively.
■■ Annual Improvements to IFRSs – 2011 – 2013 Cycle
The annual improvements include changes to IFRSs (with
an impact on recognition, measurement and reporting of
transactions) and also terminology and editorial adjustments.
The following standards were affected by the improvements
in this cycle:
■■ IFRS 1 First-Time Adoption of International Financial
Reporting Standards
■■ IFRS 3 Business Combinations
■■ IFRS 13 Fair Value Measurement
■■ IAS 40 Investment Property
The adoption of the new or amended standards had little or no
impact on the consolidated financial statements.
New financial reporting standards for future financial years
■■ Amendments to IAS 19 Employee Benefits – Defined Benefit
Plans: Employee Contributions
The amendments add an option to the standard regarding
the accounting for defined benefit pension plans to which
employees (or third parties) contribute. Under IASB require-
ments, the amendments to IAS 19 ought to have been appli-
cable for the first time in the 2015 financial year. However,
when adopting the standards, the EU postponed mandatory
initial application until annual reporting periods beginning
on or after 1 February 2015. Helaba did not apply this stan-
dard in the 2015 annual financial statements. The amend-
ments must be applied retrospectively. The application of
this amended standard will not have any impact on Helaba’s
consolidated financial statements.
■■ Annual Improvements to IFRSs – 2010 – 2012 Cycle
Under IASB requirements, the Annual Improvements to
IFRSs – 2010-2012 Cycle ought to have been applicable for
the first time in the 2015 financial year. However, when
adopting the standards, the EU postponed mandatory initial
application until annual reporting periods beginning on or
after 1 February 2015. Helaba did not apply these improve-
ments in the 2015 annual financial statements. The applica-
tion of these changes to the details in various standards will
not have any impact on Helaba’s consolidated financial
statements.
■■ IFRS 15 Revenue from Contracts with Customers
Under IFRS 15, revenue is recognised when control over the
agreed goods and/or services is passed to the customer and
the customer can obtain substantially all of the remaining
Notes Consolidated Financial Statements 87C-49

benefits from the goods and/or services involved. The key
factor is no longer the transfer of substantially all the risks
and rewards as specified in the superseded provisions in
IAS 18 Revenue. The revenue must be measured in the
amount of consideration to which the entity expects to be
entitled in exchange for transferring the promised goods or
services to the customer. The new model sets out a five-step
framework for determining revenue recognition. The provi-
sions and definitions in IFRS 15 will in the future replace the
content of both IAS 18 Revenue and IAS 11 Construction
Contracts; however, they will not have any impact on the
recognition of revenue arising in connection with financial
instruments that fall within the scope of IFRS 9/IAS 39.
IFRS 15 must be applied in annual reporting periods begin-
ning on or after 1 January 2018. Helaba is currently reviewing
the implications of IFRS 15 but no material impact is ex-
pected nor is any early application planned. This standard
still has to be adopted by the EU.
■■ IFRS 16 Leases
The basic thrust of this new standard is that lessees will gen-
erally have to recognise all leases and the associated con-
tractual rights and obligations in the statement of financial
position. From the perspective of the lessee, the previous
distinction between finance and operating leases as speci-
fied by IAS 17 will no longer be required in the future.
In respect of all leases, the lessee must recognise in the state-
ment of financial position a lease liability for the obligation
to make future lease payments. At the same time, the lessee
must recognise an asset representing the right to use the
underlying asset. The amount of the right-of-use asset must
generally equate to the present value of the future lease pay-
ments plus directly assignable costs. During the term of the
lease, the lease liability will be reduced in accordance with
the principles of financial mathematics in a manner similar
to that specified for finance leases in IAS 17 whereas the
right-of-use asset will be amortised. Exemptions from this
accounting treatment will be available for short-term leases
and low-value leased assets.
In contrast, the rules for lessors in the new standard are simi-
lar to the existing provisions in IAS 17. Leases will continue
to be classified either as finance or operating leases. Leases
in which substantially all the risks and rewards of ownership
are transferred must be classified as finance leases; all other
leases are classified as operating leases. The classification
criteria in IAS 17 have been carried over and included in
IFRS 16.
IFRS 16 also includes a range of other provisions covering
recognition, disclosures in the notes and sale-and-leaseback
transactions.
The new provisions must be applied in annual reporting
periods beginning on or after 1 January 2019. Earlier appli-
cation is permitted provided that IFRS 15 is also applied.
IFRS 16 replaces the currently applicable provisions under
IAS 17 governing the accounting treatment of leases and also
supersedes the IFRIC 4, SIC-15 and SIC-27 interpretations.
Helaba is currently reviewing the implications of IFRS 16.
The new standard on leasing will have a particular effect on
the accounting treatment of the leased commercial real es-
tate but Helaba anticipates little impact on financial position
or financial performance. No early application is planned.
This standard still has to be adopted by the EU.
■■ IFRS 9 Financial Instruments
In July 2014, the IASB published the final version of IFRS 9
Financial Instruments, completing its project to replace
IAS 39 Financial Instruments: Recognition and Measure-
ment. In the final version of IFRS 9, the main areas of finan-
cial reporting regulation that have been fundamentally re-
vised are as follows:
■■ Classification and measurement of financial instruments
Compared with IAS 39, the provisions governing the clas-
sification and measurement of financial instruments,
particularly those covering financial assets, have been
fundamentally recast. In the future, the classification and
measurement of these instruments will be based on the
business model concerned and the characteristics of the
contractual cash flows:
– IFRS 9 provides for three basic models for the purposes
of allocating financial assets to a specific business model:
hold to collect the contractual cash flows, hold to collect
and sell, and hold for trading.
– With regard to the characteristics of cash flows, financial
assets will be classified on the basis of a cash flow char-
acteristics test to establish whether the contractual cash
flows at specific points in time are (other than minimal
exceptions) solely payments of principal and interest on
the principal amount outstanding. Given the structure
of the cash flow test, only debt instruments such as
bonds (from the bondholder perspective) can satisfy
these requirements.
– Depending on how the above criteria are satisfied, the
financial asset concerned is classified as “at amortised
cost”, “at fair value through other comprehensive income”
or “at fair value through profit or loss”.
In contrast, there are hardly any changes in IFRS 9 relating
to the classification and measurement provisions govern-
ing financial liabilities. The only change affects liabilities
designated at fair value. In the future, changes in this fair
value attributable to changes in own credit risk will have
to be presented in other comprehensive income (OCI)
rather than in profit or loss.
88C-50

As the classification requirements differ from the existing
assessments under IAS 39, it is likely that the new stan-
dard will give rise to differences in the classification and
measurement of financial assets. It is not anticipated that
these changes will have a significant impact on the state-
ment of financial position and income statement.
■■ Accounting treatment of the impairment of financial assets
As a consequence of the new regulations governing the
accounting treatment of impairment there will be a funda-
mental change in the way that impairment is recognised.
This is because the new model requires the recognition not
only of incurred losses (as previously) but also expected
losses. In addition, there will have to be a differentiation
in the recognition of expected losses depending on whether
the credit risk relating to financial assets has materially
deteriorated or not since initial recognition. The provisions
for losses on loans and advances on initial recognition
will be based on the first 12-month expected credit losses
(12-month ECL). If the credit risk has deteriorated signifi-
cantly and this risk is not classified as low on the reporting
date, all expected losses over the entire lifetime must be
recognised from this date onwards (lifetime expected
credit losses, lifetime ECL). There are exemptions for trade
receivables and lease receivables.
It is anticipated that IFRS 9 will lead to a significant increase
in the level of the provisions for losses on loans and ad-
vances. This expectation is supported by a simulation
carried out in 2015 as part of a preliminary investigation.
Highly simplified assumptions had to be used in this sim-
ulation because the new calculation model and transfer
logic have not yet been implemented. Further refinement
work will be carried out on the simulation during the
course of the implementation project.
■■ Hedge accounting
IFRS 9 also involved the extensive revision of general
hedge accounting provisions. The objective of the new
rules is primarily to align hedge accounting more closely
with economic risk management in an entity.
As in the current requirements, entities must document
the risk management strategy and risk management ob-
jectives at the beginning of a hedging relationship. In the
future however, the ratio between the hedged item and the
hedging instrument (hedge ratio) will generally have to
match the specifications in the risk management strategy.
If this hedge ratio changes during the course of the hedg-
ing relationship but the risk management objective re-
mains the same, the quantity of the hedged item and the
quantity of the hedging instrument in the hedging rela-
tionship will have to be adjusted without the need to end
the hedging relationship (rebalancing).
Some of the restrictions in the current provisions have
also been eliminated under IFRS 9, which means that it
will be possible to use hedge accounting for a greater
selection of hedging instruments and hedged items.
As macro hedge accounting does not form part of the cur-
rent IFRS 9, there is an option to continue to apply all the
provisions in IAS 39 relating to hedge accounting (general
and macro hedge accounting) until the IASB’s macro
hedge accounting project has been completed.
Helaba plans to take up this option.
Subject to the necessary adoption by the EU, IFRS 9 will have
to be applied for the first time in annual reporting periods
beginning on or after 1 January 2018. Generally speaking,
first-time application must be retrospective, but various
simplification options are available. Voluntary application
in earlier years is permitted, but Helaba has no plans to take
up this option.
The other IFRSs and IFRICs that have only been partially
adopted by the EU and that will only become mandatory in
later financial years have not been applied by Helaba in ad-
vance, nor is any early application planned. These standards
and interpretations are expected to have little or no impact
on the consolidated financial statements.
Amendments to recognised amounts,
changes to estimates, correction of errors
In the fourth quarter of 2015, the measurement model for
determining credit value adjustments (CVAs) was refined, in
particular in relation to the simulation of future exposures.
This adjustment of the measurement model amounted to a
change in an accounting estimate as defined by IAS 8.32 et seq.
The refinement of the calculation procedure led, on the date of
the changeover, to an increase in the CVA markdown by € 9 m,
which was recognised as an expense under net trading income.
Reclassifications or adjustments have been applied to prior-
year figures within the disclosures in Notes (22), (36), (40), (41),
(57), (68), (69), (71) and (79). Please refer to the relevant notes
for details.
There was no impact on consolidated net profit or on equity
from the restated prior-year figures referred to above.
Notes Consolidated Financial Statements 89C-51
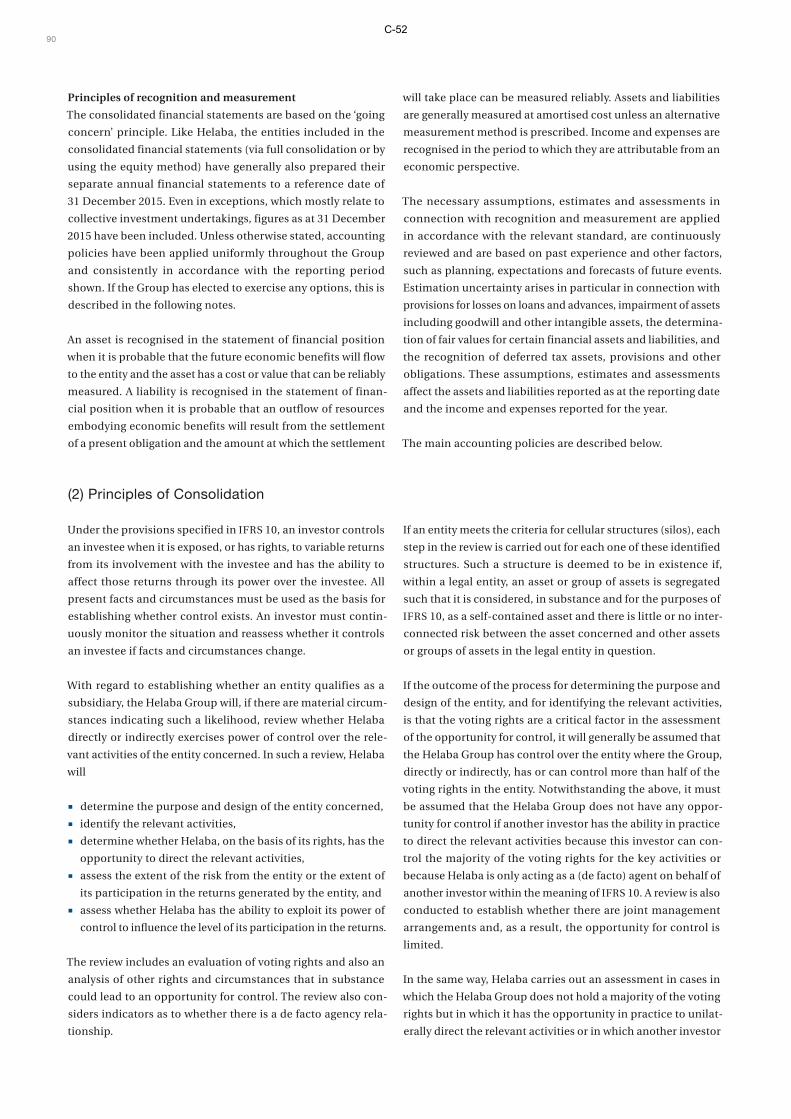
Principles of recognition and measurement
The consolidated financial statements are based on the ‘going
concern’ principle. Like Helaba, the entities included in the
consolidated financial statements (via full consolidation or by
using the equity method) have generally also prepared their
separate annual financial statements to a reference date of
31 December 2015. Even in exceptions, which mostly relate to
collective investment undertakings, figures as at 31 December
2015 have been included. Unless otherwise stated, accounting
policies have been applied uniformly throughout the Group
and consistently in accordance with the reporting period
shown. If the Group has elected to exercise any options, this is
described in the following notes.
An asset is recognised in the statement of financial position
when it is probable that the future economic benefits will flow
to the entity and the asset has a cost or value that can be reliably
measured. A liability is recognised in the statement of finan-
cial position when it is probable that an outflow of resources
embodying economic benefits will result from the settlement
of a present obligation and the amount at which the settlement
will take place can be measured reliably. Assets and liabilities
are generally measured at amortised cost unless an alternative
measurement method is prescribed. Income and expenses are
recognised in the period to which they are attributable from an
economic perspective.
The necessary assumptions, estimates and assessments in
connection with recognition and measurement are applied
in accordance with the relevant standard, are continuously
reviewed and are based on past experience and other factors,
such as planning, expectations and forecasts of future events.
Estimation uncertainty arises in particular in connection with
provisions for losses on loans and advances, impairment of assets
including goodwill and other intangible assets, the determina-
tion of fair values for certain financial assets and liabilities, and
the recognition of deferred tax assets, provisions and other
obligations. These assumptions, estimates and assessments
affect the assets and liabilities reported as at the reporting date
and the income and expenses reported for the year.
The main accounting policies are described below.
(2) Principles of Consolidation
Under the provisions specified in IFRS 10, an investor controls
an investee when it is exposed, or has rights, to variable returns
from its involvement with the investee and has the ability to
affect those returns through its power over the investee. All
present facts and circumstances must be used as the basis for
establishing whether control exists. An investor must contin-
uously monitor the situation and reassess whether it controls
an investee if facts and circumstances change.
With regard to establishing whether an entity qualifies as a
subsidiary, the Helaba Group will, if there are material circum-
stances indicating such a likelihood, review whether Helaba
directly or indirectly exercises power of control over the rele-
vant activities of the entity concerned. In such a review, Helaba
will
■■ determine the purpose and design of the entity concerned,
■■ identify the relevant activities,
■■ determine whether Helaba, on the basis of its rights, has the
opportunity to direct the relevant activities,
■■ assess the extent of the risk from the entity or the extent of
its participation in the returns generated by the entity, and
■■ assess whether Helaba has the ability to exploit its power of
control to influence the level of its participation in the returns.
The review includes an evaluation of voting rights and also an
analysis of other rights and circumstances that in substance
could lead to an opportunity for control. The review also con-
siders indicators as to whether there is a de facto agency rela-
tionship.
If an entity meets the criteria for cellular structures (silos), each
step in the review is carried out for each one of these identified
structures. Such a structure is deemed to be in existence if,
within a legal entity, an asset or group of assets is segregated
such that it is considered, in substance and for the purposes of
IFRS 10, as a self-contained asset and there is little or no inter-
connected risk between the asset concerned and other assets
or groups of assets in the legal entity in question.
If the outcome of the process for determining the purpose and
design of the entity, and for identifying the relevant activities,
is that the voting rights are a critical factor in the assessment
of the opportunity for control, it will generally be assumed that
the Helaba Group has control over the entity where the Group,
directly or indirectly, has or can control more than half of the
voting rights in the entity. Notwithstanding the above, it must
be assumed that the Helaba Group does not have any oppor-
tunity for control if another investor has the ability in practice
to direct the relevant activities because this investor can con-
trol the majority of the voting rights for the key activities or
because Helaba is only acting as a (de facto) agent on behalf of
another investor within the meaning of IFRS 10. A review is also
conducted to establish whether there are joint management
arrangements and, as a result, the opportunity for control is
limited.
In the same way, Helaba carries out an assessment in cases in
which the Helaba Group does not hold a majority of the voting
rights but in which it has the opportunity in practice to unilat-
erally direct the relevant activities or in which another investor
90C-52

is only acting as a (de facto) agent within the meaning of
IFRS 10 on behalf of the Helaba Group. In circumstances other
than one in which Helaba holds a general majority of the voting
rights, this ability to control may arise, for example, in cases
in which contractual agreements give the Helaba Group the
opportunity to direct the relevant activities of the entity or
potential control over voting rights.
If there are options or similar rights relating to voting rights,
these are taken into account in the assessment of whether any
party is able to exercise control through voting rights, provided
that such options or similar rights are considered substantive.
Such assessment takes into account any conditions or exercise
periods and also evaluates the extent to which the exercise of
such options or similar rights would be economically advan-
tageous.
The test as to whether, regardless of any legal basis, there is an
opportunity to exercise control in substance involves the check
to establish whether a formal holder of voting rights or the
holder of a right that could lead to control over an entity is
acting as a (de facto) agent within the meaning of IFRS 10. In
this case, in an analysis of the substance of the arrangement,
the (de facto) agent is deemed to be acting on behalf of another
investor if the agent does not have any material business inter-
ests of its own in the entity concerned. This scenario may also
arise if this other investor does not have any direct rights to
issue instructions but the entity is so geared to the require-
ments of the investor in practice that the investor is exposed
to most of the variability of returns from the entity.
A threshold value for participation in the expected variability
of returns is used as an initial indicator for the existence of a
(de facto) agent within the meaning of IFRS 10. If, from a legal
perspective, the Helaba Group has the opportunity to direct
the relevant activities of an entity, a threshold value is used as
the basis for assessing whether there is any indicator that an
interest should be assigned to third parties in accordance with
IFRS 10. An assignment of this nature could affect, for example,
securities investment funds managed by Helaba Invest.
If it is unclear whether the Helaba Group has the opportunity
to direct the relevant activities of an entity and the Helaba
Group is exposed to approximately 90 % or more of the vari-
ability of returns, an individual in-depth review is carried out
to establish whether Helaba has the opportunity to exercise
control over the entity.
The checks described above are carried out periodically for all
cases exceeding a materiality threshold. A new assessment is
carried out if there are any material changes in the basis of the
assessment or if the materiality threshold is exceeded. A multi-
stage process is used in which an initial assessment is carried
out on the basis of checklists by the local units with customer
or business responsibility. This initial procedure consists of an
analysis of the opportunities to exercise influence based on
legal structures and an assessment of indicators of the expo-
sure to the variability of returns from the entity concerned.
Variability of returns takes into account all expected positive
and negative contributions from the entity that are dependent
on the performance of the entity in an economic analysis and
that are subject to fluctuations in line with differing levels of
profitability.
IFRS 11 Joint Arrangements sets out the rules for the account-
ing treatment of joint ventures or joint operations if two or
more parties exercise joint control over an entity. The existence
of joint control must be reviewed if the relevant facts and
circumstances change.
To establish whether there is joint control, the first step is to
determine who exercises power of control over the relevant
activities, a procedure that is similar to that used in the case of
subsidiaries. If this control is exercised collectively by two or
more parties on a contractual basis, a joint arrangement is
deemed to be in existence. To date, the review of the cases in-
volving joint arrangements has regularly led to a classification
of these arrangements as joint ventures. The review takes into
account separate agreements on joint decision-making or on
the exercise of voting rights, the minimum number of votes
necessary for decisions, the number of shareholders and asso-
ciated proportions of voting rights, possible (de facto) agent
relationships and, on a case-by-case basis, consent require-
ments under other contractual relationships.
In an existing shareholding, there is generally a significant in-
fluence if at least 20 % of the voting rights are held. Other pa-
rameters and circumstances are taken into account in addition
to the extent of the voting rights to assess whether Helaba can
exercise a significant influence in practice over entities in other
scenarios. These parameters and circumstances include, for
example, employee representation on the management or
supervisory bodies of the entity or, where applicable, the exis-
tence of consent requirements for key decisions to be made by
the entity concerned. If such factors are identified during the
course of the review, Helaba may be deemed to have a signifi-
cant influence in such cases even though its equity investment
is equivalent to less than 20 % of voting rights. An in-depth
analysis is carried out covering all opportunities for the exercise
of influence and the relationships between the shareholders.
The review of the existence of joint control or associate rela-
tionships is regularly carried out as part of the process for iden-
tifying subsidiaries subject to consolidation.
All material subsidiaries and other entities directly or indirectly
controlled by Helaba are fully consolidated in the consolidated
financial statements. Material joint ventures and investments
in associates are recognised and measured using the equity
method as specified in IAS 28. In individual cases where the
Notes Consolidated Financial Statements 91C-53

entity concerned is only of minor significance in the context of
the economic circumstances of the Group from both individual
and overall perspectives, the entity concerned has not been
consolidated or been recognised and measured using the
equity method. Materiality is reviewed and decided upon by
comparing the volume of total assets (assessed as being long
term) and level of profit for the entity concerned against
threshold values. The threshold values are determined on the
basis of the average total assets and levels of profit for the
Group over the last five years. If an investment is deemed to be
not material, the shares in the entity concerned are reported
under financial investments.
Entities are consolidated for the first time on the date of acqui-
sition using the acquisition method. The assets and liabilities
are measured at the fair value on the date of this first-time con-
solidation. Any positive differences arising from this initial
acquisition accounting process are recognised as goodwill
under intangible assets on the face of the statement of financial
position. This goodwill is subject to an impairment test at least
once a year (see Note (15)). If any negative goodwill arises from
this initial consolidation, the fair values are first reviewed
before the resulting amount is recognised immediately in profit
or loss.
Any shares in subsidiaries not attributable to the parent
company are reported as a share of equity attributable to
non- controlling interests within the consolidated equity; the
equivalent net profit and comprehensive income is reported
respectively as net profit attributable to non- controlling
interests on the face of the consolidated income statement
and comprehensive income attributable to non- controlling
interests on the face of the statement of comprehensive income.
Non-controlling interests are determined at the time of initial
recognition on the basis of the fair values of the assets and
liabilities attributable to these non-controlling interests.
In the case of a business combination achieved in stages (step
acquisition), the entity is consolidated from the date on which
control is obtained. Any investments acquired prior to the date
on which control is obtained are remeasured at fair value on
the date of acquisition and used as the basis for acquisition
accounting. The difference between the carrying amounts of
these previously recognised investments and the fair value is
recognised in profit or loss after recycling any components of
the carrying amounts hitherto recognised in other comprehen-
sive income (resulting from remeasurement or because the
assets are designated as available for sale).
If entities that have previously been consolidated or accounted
for using the equity method no longer have to be included
in the consolidation, they are deconsolidated with recognition
in profit or loss on the date on which the shares subject to
the consolidation are sold or on the date on which control
ceases to exist. Any recognition of remaining investments in
accordance with IAS 39 or using the equity method is at fair
value.
If investments in subsidiaries, joint ventures or associates are
intended for disposal in the short term, and the other relevant
criteria are satisfied, these investments are measured in
accordance with IFRS 5 and the assets, liabilities and share
of net profit/loss reported under a separate item on the face of
the statement of financial position and income statement.
Any intercompany balances between consolidated entities
and any income and expenses arising between such entities
are eliminated. Intercompany profits and losses arising on
transactions between consolidated entities are also eliminated.
Investments in associates and joint ventures are recognised in
the statement of financial position at their acquisition cost
from the date on which significant influence is obtained or the
date on which joint control is established. The carrying amount
is remeasured in subsequent years taking into account pro rata
changes in equity and the amortisation of identified hidden
reserves and charges. The pro rata net profit or loss for the year
from such investments, any impairment losses and other provi-
sions for losses on loans and advances are reported under
share of profit or loss of equity-accounted entities on the face
of the consolidated income statement. The share of other com-
prehensive income of equity-accounted entities is reported as
a separate line item in the consolidated statement of compre-
hensive income.
If the recoverable amount of an investment accounted for
using the equity method is less than the current carrying
amount, an impairment loss is recognised. If the reasons for a
previously recognised impairment loss no longer exist, the
impairment loss is reversed, but only up to a maximum of
the carrying amount that would have been recognised, includ-
ing any amortisation, if the impairment loss had not been
applied.
92C-54
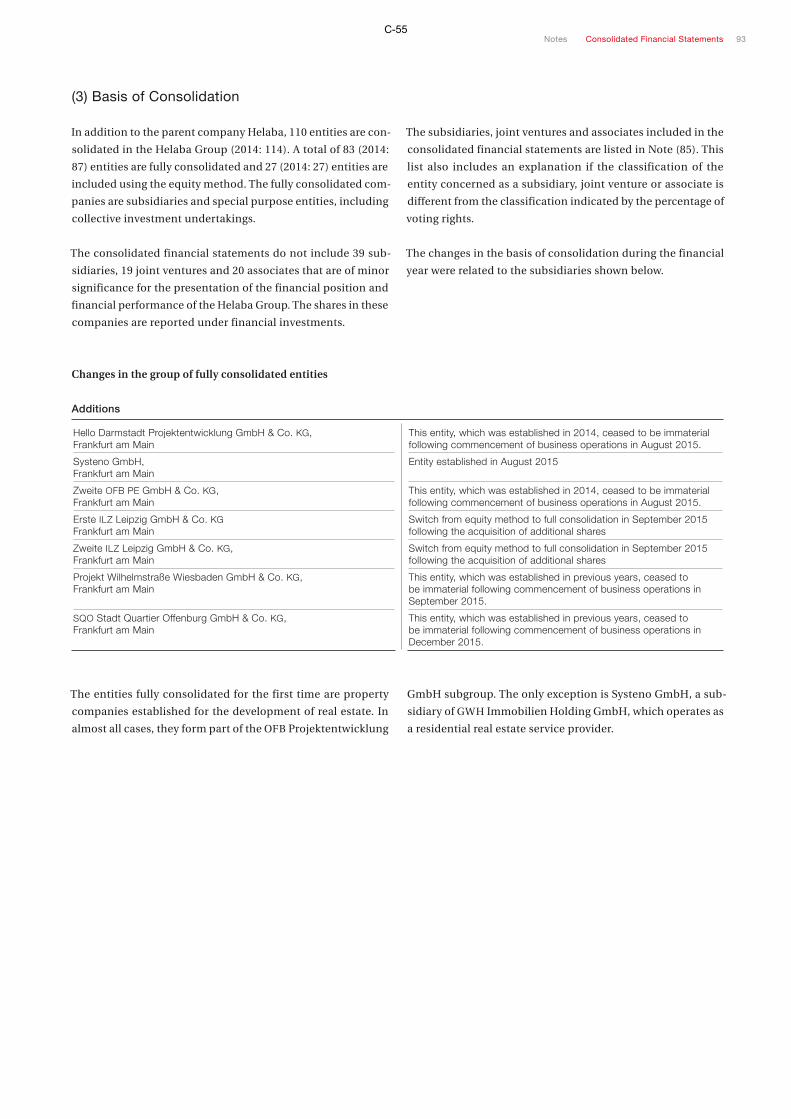
(3) Basis of Consolidation
In addition to the parent company Helaba, 110 entities are con-
solidated in the Helaba Group (2014: 114). A total of 83 (2014:
87) entities are fully consolidated and 27 (2014: 27) entities are
included using the equity method. The fully consolidated com-
panies are subsidiaries and special purpose entities, including
collective investment undertakings.
The consolidated financial statements do not include 39 sub-
sidiaries, 19 joint ventures and 20 associates that are of minor
significance for the presentation of the financial position and
financial performance of the Helaba Group. The shares in these
companies are reported under financial investments.
The subsidiaries, joint ventures and associates included in the
consolidated financial statements are listed in Note (85). This
list also includes an explanation if the classification of the
entity concerned as a subsidiary, joint venture or associate is
different from the classification indicated by the percentage of
voting rights.
The changes in the basis of consolidation during the financial
year were related to the subsidiaries shown below.
Changes in the group of fully consolidated entities
Additions
Hello Darmstadt Projektentwicklung GmbH & Co. KG, Frankfurt am Main
This entity, which was established in 2014, ceased to be immaterial following commencement of business operations in August 2015.
Systeno GmbH, Frankfurt am Main
Entity established in August 2015
Zweite OFB PE GmbH & Co. KG, Frankfurt am Main
This entity, which was established in 2014, ceased to be immaterial following commencement of business operations in August 2015.
Erste ILZ Leipzig GmbH & Co. KG Frankfurt am Main
Switch from equity method to full consolidation in September 2015 following the acquisition of additional shares
Zweite ILZ Leipzig GmbH & Co. KG, Frankfurt am Main
Switch from equity method to full consolidation in September 2015 following the acquisition of additional shares
Projekt Wilhelmstraße Wiesbaden GmbH & Co. KG, Frankfurt am Main
This entity, which was established in previous years, ceased to be immaterial following commencement of business operations in September 2015.
SQO Stadt Quartier Offenburg GmbH & Co. KG, Frankfurt am Main
This entity, which was established in previous years, ceased to be immaterial following commencement of business operations in December 2015.
The entities fully consolidated for the first time are property
companies established for the development of real estate. In
almost all cases, they form part of the OFB Projektentwicklung
GmbH subgroup. The only exception is Systeno GmbH, a sub-
sidiary of GWH Immobilien Holding GmbH, which operates as
a residential real estate service provider.
Notes Consolidated Financial Statements 93C-55
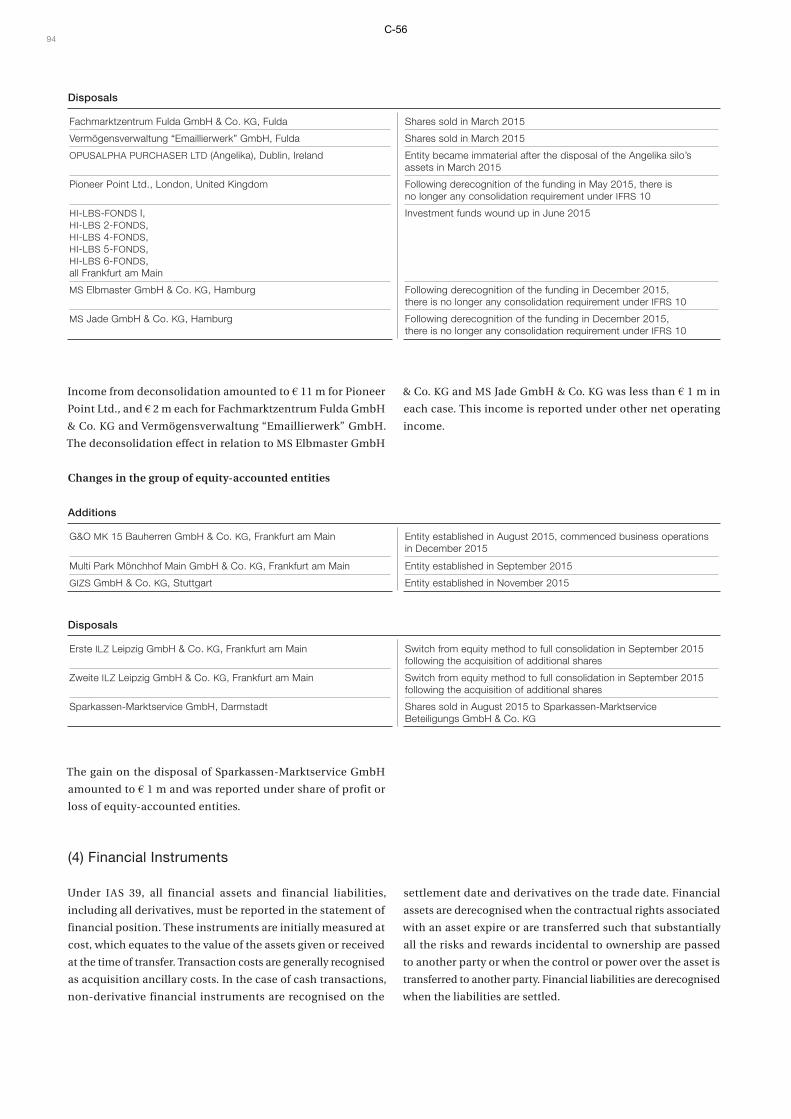
Disposals
Fachmarktzentrum Fulda GmbH & Co. KG, Fulda Shares sold in March 2015
Vermögensverwaltung “Emaillierwerk” GmbH, Fulda Shares sold in March 2015
OPUSALPHA PURCHASER LTD (Angelika), Dublin, Ireland Entity became immaterial after the disposal of the Angelika silo’s assets in March 2015
Pioneer Point Ltd., London, United Kingdom Following derecognition of the funding in May 2015, there is no longer any consolidation requirement under IFRS 10
HI-LBS-FONDS I, HI-LBS 2-FONDS, HI-LBS 4-FONDS, HI-LBS 5-FONDS, HI-LBS 6-FONDS, all Frankfurt am Main
Investment funds wound up in June 2015
MS Elbmaster GmbH & Co. KG, Hamburg Following derecognition of the funding in December 2015, there is no longer any consolidation requirement under IFRS 10
MS Jade GmbH & Co. KG, Hamburg Following derecognition of the funding in December 2015, there is no longer any consolidation requirement under IFRS 10
Income from deconsolidation amounted to € 11 m for Pioneer
Point Ltd., and € 2 m each for Fachmarktzentrum Fulda GmbH
& Co. KG and Vermögensverwaltung “Emaillierwerk” GmbH.
The deconsolidation effect in relation to MS Elbmaster GmbH
& Co. KG and MS Jade GmbH & Co. KG was less than € 1 m in
each case. This income is reported under other net operating
income.
Changes in the group of equity-accounted entities
Additions
G&O MK 15 Bauherren GmbH & Co. KG, Frankfurt am Main Entity established in August 2015, commenced business operations in December 2015
Multi Park Mönchhof Main GmbH & Co. KG, Frankfurt am Main Entity established in September 2015
GIZS GmbH & Co. KG, Stuttgart Entity established in November 2015
Disposals
Erste ILZ Leipzig GmbH & Co. KG, Frankfurt am Main
Switch from equity method to full consolidation in September 2015 following the acquisition of additional shares
Zweite ILZ Leipzig GmbH & Co. KG, Frankfurt am Main
Switch from equity method to full consolidation in September 2015 following the acquisition of additional shares
Sparkassen-Marktservice GmbH, Darmstadt
Shares sold in August 2015 to Sparkassen-Marktservice Beteiligungs GmbH & Co. KG
The gain on the disposal of Sparkassen-Marktservice GmbH
amounted to € 1 m and was reported under share of profit or
loss of equity-accounted entities.
(4) Financial Instruments
Under IAS 39, all financial assets and financial liabilities,
including all derivatives, must be reported in the statement of
financial position. These instruments are initially measured at
cost, which equates to the value of the assets given or received
at the time of transfer. Transaction costs are generally recognised
as acquisition ancillary costs. In the case of cash transactions,
non-derivative financial instruments are recognised on the
settlement date and derivatives on the trade date. Financial
assets are derecognised when the contractual rights associated
with an asset expire or are transferred such that substantially
all the risks and rewards incidental to ownership are passed
to another party or when the control or power over the asset is
transferred to another party. Financial liabilities are derecognised
when the liabilities are settled.
94C-56

The subsequent measurement of financial assets or liabilities
depends on the IAS 39 category to which the instrument is
assigned at the time of acquisition.
Loans and receivables (LaR)
Loans and receivables are non-derivative financial assets with
fixed or determinable payments that are not quoted in an
active market, other than financial assets held for trading or
designated on initial recognition as assets at fair value through
profit or loss. Securities with fixed or determinable payments
for which there is no active market may also be classified as
loans and receivables.
Loans and receivables are measured at amortised cost. Existing
premiums or discounts are allocated over the residual maturity
using the effective interest method and recognised in profit or
loss under net interest income. The carrying amounts of finan-
cial instruments in the loans and receivables category are
reported under loans and advances to banks and loans and
advances to customers on the face of the statement of financial
position. Trade receivables are reported under other assets.
Within hedge accounting, the carrying amounts of loans and
advances that form the hedged items in micro fair value hedges
are adjusted for the changes in the fair value corresponding to
the hedged risk.
Please refer to the disclosures in Note (12) for information on
the recognition of risks arising from the lending business.
Financial assets or liabilities at fair value
through profit or loss (aFV)
Within this category, a distinction is made between financial
instruments that are classified as held for trading and those
that, upon initial recognition, are designated irrevocably as at
fair value through profit or loss (fair value option, FVO). Finan-
cial assets or liabilities in this category are recognised in profit
or loss at fair value. Transaction costs are immediately rec-
ognised in profit or loss. Derivatives not designated as hedges
are always classified as held for trading.
Financial instruments held for trading are instruments
acquired or held for the purpose of selling and generating prof-
its from short-term fluctuations in prices or trader margins.
These instruments are reported under trading assets or trading
liabilities. All income and expenses from financial instruments
held for trading are reported under net trading income. Deriv-
atives not held for trading are recognised as positive or nega-
tive fair values of non-trading derivatives. The income and
expenses from non-trading derivatives are reported in a sepa-
rate line item in the income statement.
The fair value option is used primarily as part of the hedge
management strategy for economic hedges of financial assets
and liabilities for which no micro hedge relationship is docu-
mented in accordance with IAS 39. The fair value option is also
used for financial instruments with embedded derivatives
requiring bifurcation. In addition, Helaba uses the fair value
option for financial assets and liabilities that are managed at
fair value as one unit (portfolio) as part of a documented risk
management strategy. Non-derivative financial instruments for
which the fair value option has been exercised are reported in
the same item in the statement of financial position that would
have been used even if the instrument concerned had not been
designated as at fair value through profit or loss. Interest (in-
cluding amortised premiums and discounts) and dividends
relating to financial instruments for which the fair value option
is used are included in net interest income. Gains or losses
from remeasurement and disposals are recognised under gain
or loss on non-trading derivatives and financial instruments
to which the fair value option is applied.
In the case of financial instruments measured at fair value,
differences may arise between the transaction price and the
fair value (day-one profit or loss). Any day-one profit or loss is
normally recognised immediately in profit or loss. If the calcu-
lation of the fair value is not based on observable measurement
parameters, the day-one profit or loss must be recognised in
profit or loss over the maturity of the asset concerned.
Held-to-maturity financial assets (HtM)
If a financial asset is to be classified in the held-to-maturity
category, it must be a non-derivative financial asset with fixed
or determinable payments and a specified maturity date. When
the purchaser acquires such financial assets, it must also intend
and be able to hold the asset to maturity. The Helaba Group
does not assign any financial instruments to this category.
Available-for-sale financial assets (AfS)
The available-for-sale category is used for all non-derivative
financial assets that have not already been allocated to one of
the other categories specified above. At Helaba, such assets
include bonds, shares, other variable-income securities and
equity investments. Financial instruments in the available-for-
sale category are reported under financial investments. They
are generally measured at fair value. If a fair value cannot be
reliably determined in the case of equity instruments, they are
measured at cost less any impairment losses. This is the case if
there are no prices available from active markets and it is not
possible to reliably determine the parameters relevant for val-
uation models. In the case of purchased rights under endow-
ment insurance policies, the asset is measured on the basis of
the surrender value notified by the insurance company. This
value is then adjusted for contributions and other changes in
value up to the reporting date.
Notes Consolidated Financial Statements 95C-57

Gains and losses on the remeasurement of available-for-sale
financial assets at fair value are reported – after taking into
account deferred taxes – in other comprehensive income and
in a separate equity item (revaluation reserve). When hedge
accounting is used, the portion of gains or losses attributable
to the hedged risk is recognised under net income from hedge
accounting.
If the fair value of an asset is expected to be permanently lower
than the amortised cost as a result of impairment caused by a
change in credit quality, the revaluation reserve is adjusted for
the impairment loss amount, the adjustment being recognised
in profit or loss under net income from financial investments.
Reversals of impairment losses on debt instruments are rec-
ognised in profit or loss, whereas reversals of impairment
losses on equity instruments measured at fair value are rec-
ognised in other comprehensive income. Impairment losses
on equity instruments measured at cost are not reversed. The
criteria for establishing whether an asset is impaired comprise
both timing and value components.
Interest income on securities (including amortised premiums
and discounts) and dividend income on shares and other
equity investments are reported under net interest income.
When a financial asset is sold, the cumulative remeasurement
gains and losses recognised in the revaluation reserve are
reversed and reclassified to profit or loss under net income
from financial investments.
Other financial liabilities (OL)
This category covers financial liabilities that are not classified
as at fair value through profit or loss. The liabilities are mea-
sured at amortised cost. Premiums or discounts are allocated
over the residual maturity using the effective interest method
(amortisation) and recognised in profit or loss under net inter-
est income. The carrying amounts are reported in the state-
ment of financial position under liabilities due to banks, liabil-
ities due to customers, securitised liabilities and subordinated
capital. Trade payables are reported under other liabilities.
Within hedge accounting, the carrying amounts of liabilities
that form the hedged items in micro fair value hedges are
adjusted for the changes in the fair value corresponding to the
hedged risk.
(5) Offsetting a Financial Asset and a Financial Liability
Under IAS 32, an entity may offset a financial asset and a finan-
cial liability and present the net amount in the statement of
financial position if the entity has a legally enforceable right at
any time to set off the recognised amounts and intends either
to settle on a net basis or to realise the asset and settle the lia-
bility simultaneously. The right must be legally enforceable as
part of normal business operations and cannot be restricted
such that it only comes into being if certain circumstances
occur. The disclosures in Note (60) describe the extent of the
net presentation of financial assets and financial liabilities
in the statement of financial position. The information also
includes details of conditional offsetting opportunities that do
not meet the requirements for offsetting under IAS 32.
(6) Hedge Accounting
IAS 39 sets out comprehensive rules for the accounting treat-
ment of hedges, i.e. the recognition of hedging instruments
(particularly derivatives) and the corresponding hedged items.
The Helaba Group enters into derivatives for both trading and
hedging purposes. Subject to certain preconditions, IAS 39 pro-
vides for the application of special hedge accounting rules if
derivatives are demonstrably used for hedging risks arising
from non-trading activities not classified as at fair value through
profit or loss.
At the beginning of the hedging relationship, both the hedge and
the risk management objectives and strategies of the Group, to-
gether with the methods for prospective and retrospective mea-
surement of hedge effectiveness, must be documented. In par-
ticular, the documentation must clearly identify the hedged
item, the risk to be hedged and the hedging instrument involved.
IAS 39 also specifies that hedges should be effective. The effec-
tiveness of hedges is therefore regularly monitored. A hedge is
considered effective if, both at the time of designation and over
the duration of the hedge, the changes in value of the hedged
item are to a large degree offset by those in the hedging instru-
ment (prospective effectiveness test or assumption of effective-
ness) and the current gains and losses fall in a range between
80 % and 125 % (retrospective effectiveness test). If a hedge is
no longer effective, it is reversed. If the hedged item continues
to be recognised in the statement of financial position after the
end of the hedging relationship, the adjustments to the carry-
ing amount of the interest-bearing hedged item applied over
the duration of the hedge are allocated over the residual ma-
turity of the item concerned and recognised in net interest
income.
96C-58

The Helaba Group uses micro fair value hedge accounting to
offset changes in the fair value of hedged items (caused by
changes in interest rates) with changes in the value of deriva-
tives used for hedging. This type of market risk caused by
changes in interest rates affects, in particular, the issuing and
lending activities of the Group and the fixed-income securities
in the liquidity investment portfolio. The hedging instruments
used by Helaba consist exclusively of interest-rate swaps and
cross-currency interest-rate swaps that satisfy the hedge
accounting requirements.
In accordance with the rules for fair value hedge accounting,
derivatives used for hedging purposes are recognised at fair
value and reported under positive or negative fair values of
non- trading derivatives in the statement of financial position.
In the case of hedged items recognised at amortised cost with-
out hedge accounting, changes in the value of the hedged
item attributable to the hedged risk result in a corresponding
adjustment of the carrying amount. This change in the fair
value of the hedged item attributable to the hedged risk is
recognised in profit or loss under net income from hedge
accounting together with the opposite change in the hedging
instrument.
Foreign currency risks are hedged by means of non-derivative
financial instruments. These risks are hedged in connection
with equity investments classified as available for sale and net
investments in a foreign operation. The gains and losses on the
currency translation of the hedge are accounted for in other
comprehensive income and reported under the currency trans-
lation reserve.
Positive and negative fair values of non-trading derivatives
In the Helaba Group, this item is used for reporting derivatives
that are not held for trading purposes. This also includes
derivatives designated as hedging instruments for a micro fair
value hedge. In addition, the item includes derivatives that are
used as economic hedges as part of hedge management, but
that are not accompanied by the relevant documentation
demonstrating fulfilment of the hedge accounting require-
ments in accordance with IAS 39. Positive fair values are
reported on the assets side of the statement of financial posi-
tion, negative fair values on the liabilities side.
The gains and losses on derivatives not held for trading are
r eported either under net income from hedge accounting or
under gain or loss on non-trading derivatives and financial
instruments to which the fair value option is applied, depend-
ing on how the derivatives are used. The current income and
expenses arising from these derivatives are recognised in net
interest income.
(7) Structured Products
Structured products are defined as contracts that consist of a
host contract and one or more embedded derivatives. An em-
bedded derivative is an integral component of the structured
product and cannot be traded separately.
Subject to certain preconditions, IAS 39 specifies that embed-
ded derivatives must be separated from the associated host
contracts (bifurcation) and treated as independent derivatives
for accounting purposes unless the entire structured product
is measured at fair value through profit or loss.
In the Helaba Group, non-trading financial instruments
requiring bifurcation are accounted for separately in each
case. Alternatively, the fair value option is used for the entire
structured product.
(8) Financial Guarantees
A financial guarantee is a contract in which the guarantor is
obliged to make a specified payment that compensates the
beneficiary of the guarantee for a loss incurred because a spec-
ified debtor fails to meet contractual payment obligations in
relation to a debt instrument. The obligation arising in connec-
tion with a financial guarantee is recognised on the date the
contract is signed. Helaba recognises financial guarantees in
which it is the guarantor at fair value, which is zero if the
expected payments (present value of the obligation) are the
same as the consideration in the form of premium instalments
paid in arrears and on an arm’s-length basis (present value
of premiums). When a financial guarantee is subsequently
remeas ured, a provision is recognised for anticipated losses
that may arise from a claim under the guarantee.
In addition, financial guarantees for which the fair value option
was exercised on initial recognition are measured at fair value
both on initial measurement and in any subsequent remeasure-
ment. Gains or losses from remeasurement are recognised
under gain or loss on non-trading derivatives and financial
instruments to which the fair value option is applied.
Notes Consolidated Financial Statements 97C-59

(9) Repurchase Agreements and Securities Lending
The Helaba Group enters into repurchase agreements ( repurchase
agreements in which the buyer is under an obligation to sell back
the transferred assets) both as a seller/borrower (repos) and as
a buyer/lender (reverse repos).
Repos are contracts in which a seller transfers securities that
it owns to a buyer in return for the payment of a specified
amount. At the same time, it is agreed that the buyer will trans-
fer the securities it has received (or securities of the same type)
back to the seller on a specified future date in return for a pay-
ment agreed in advance.
Given the buyer’s absolute obligation to return the securities
at a future point, the seller does not derecognise the securities
and they continue to be measured in the consolidated financial
statements in accordance with their measurement category as
specified in IAS 39 and be reported under trading assets or
within the portfolio of financial investments. Correspondingly,
securities bought by the Helaba Group under reverse repos
are not reported in the consolidated financial statements be-
cause there has been no addition to assets from an economic
perspective.
If Helaba enters into repos for trading purposes, the cash
inflows are measured at fair value and recognised as a liability
under trading liabilities. The difference between the payment
received and the repayment obligation is recognised as a
component of remeasurement gains and losses under net
trading income. Open market operations in which the focus
is on liquidity management are recognised as liabilities due
to banks. The agreed interest payments are reported under
net interest income.
In the opposite scenario, cash outflows under reverse repos
are reported as loans and advances within the trading assets
and measured accordingly (provided that the reverse repos are
entered into with the intention of trading). As in the case of
repos, remeasurement gains and losses are reported in net
trading income in line with the purpose of such transactions.
A distinction must be made between repurchase agreements
and securities lending. In the case of the latter, the Helaba
Group acts as a lender and also as the borrower of securities.
In securities lending transactions, securities are loaned for a
limited period; the borrower undertakes to transfer securities
of the same type, quality and quantity back to the lender at
the end of the period. The transaction therefore involves a
non-cash loan as defined by section 607 of the Bürgerliches
Gesetz buch (German Civil Code, BGB). Any securities trans-
ferred to the borrower under a securities lending agreement
continue to be recognised in the lender’s portfolio of securi-
ties (trading assets, financial investments) and measured in
accordance with the assigned measurement category. The
borrower does not therefore measure or recognise the secu-
rities it has borrowed.
Any cash collateral furnished to the other party in connection
with securities lending is recognised under loans and advances;
any cash collateral received is reported under liabilities. Secu-
rities collateral furnished by the Helaba Group continues to be
recognised in accordance with the accounting method origi-
nally selected.
All income and expenses arising in connection with securities
lending, provided that such transactions are for trading
purposes, are reported under net trading income. Otherwise,
the amounts concerned are reported in net interest income.
Liabilities arising from short-selling of borrowed securities are
recognised at fair value under trading liabilities.
(10) Accounting Treatment of Leases
A lease is classified as an operating lease if substantially all the
risks and rewards incidental to ownership of the leased asset
remain with the lessor. On the other hand, leases in which sub-
stantially all the risks and rewards incidental to ownership of
the leased asset are transferred to the lessee are classified as
finance leases.
Leases in which the Helaba Group is the lessor
Where the Helaba Group enters into operating leases, the ben-
eficial ownership in the asset used for leasing remains with the
Group company concerned. The assets used for leasing are
recognised in the statement of financial position under prop-
erty and equipment or under investment property. The assets
used for leasing are recognised in accordance with the princi-
ples described for the categories concerned. The lease income
is recognised in profit or loss under other net operating income
on a straight-line basis over the term of the lease unless an
alternative distribution of the income is appropriate in indi-
vidual cases. If a lease is classified as a finance lease, a receiv-
able due from the lessee in an amount equivalent to the value
of the net investment in the lease on the date of inception is
recognised under loans and advances to customers or loans
98C-60

and advances to banks. The lease instalments received are split
into an interest component recognised in profit or loss and a
component covering repayment of principal. The interest com-
ponent is reported in net interest income.
Leases in which the Helaba Group is the lessee
Lease instalments paid under operating leases are reported
under general and administrative expenses. In 2015, there were
no contractual arrangements classified as finance leases.
(11) Currency Translation
The provisions in IAS 21 are applied in translating transactions
denominated in foreign currency in the financial statements
of the companies included in the consolidated financial state-
ments and in translating the financial statements of foreign
operations with a functional currency that is different from the
reporting currency.
All monetary items denominated in foreign currency and
equity instruments (shares, equity investments) measured at
fair value in foreign currency are translated at the closing rate
(the spot rate on the reporting date). Non-monetary items
measured at amortised cost (such as property and equipment)
are translated using the exchange rate applicable on initial rec-
ognition. Currency translation differences, with the exception
of differences resulting from equity instruments measured at
fair value through other comprehensive income, are recognised
in profit or loss.
In order to translate financial statements prepared in foreign
currency for operations included in the consolidated financial
statements (subsidiaries, branch offices), the temporal method
is used initially to translate from the foreign currency into the
functional currency where these currencies are different. Fig-
ures are then translated into the reporting currency (euros)
using the modified closing-rate method. In this method, all
monetary and non-monetary assets and liabilities are trans-
lated into the reporting currency using the ECB reference rate
on the reporting date. Income and expenses for the reporting
period are translated using the average rate for the period. All
resulting currency translation differences are recognised in a
separate equity item (currency translation reserve) until the
foreign operation is derecognised or discontinued.
(12) Provisions for Losses on Loans and Advances
Specific loan loss allowances, specific loan loss allowances
evaluated on a group basis and portfolio loan loss allowances
are recognised to account for the risks arising in connection
with the lending business recognised in the statement of finan-
cial position.
At every reporting date, the Helaba Group carries out an im-
pairment test on financial instruments in the loans and receiv-
ables category recognised under loans and advances. In this
process, all significant loans and advances are individually
assessed. If there is objective evidence of impairment, the im-
pairment loss requirement is calculated.
The following are examples of the main indicators that may
point to the existence of impairment:
■■ payment in arrears by more than 90 days,
■■ account overdrawn without authorisation for more than
90 days,
■■ rating-related restructuring,
■■ legal enforcement action,
■■ criteria satisfied for submitting an application for, or initi-
ating, insolvency proceedings,
■■ action to defer payments
The recognition of a loan loss allowance is necessary if it is
probable that not all the contractually agreed interest pay-
ments and repayments of principal will be made. The amount
of a specific loan loss allowance is the difference between the
carrying amount and the recoverable amount for the loan or
advance. The recoverable amount equates to the present value
of expected cash flows, including the recovery of collateral if
applicable. The original effective interest rate for the loan or
advance is used to discount the estimated cash flows; if loans
or advances are subject to floating interest rates, the current
interest rate is used.
If there are no changes to the expected payments, the present
value increases as a result of unwinding the discount over the
course of time. The amount resulting from unwinding the
discount forms a part of interest income. If a specific loan loss
allowance is increased or reversed, the addition or reversal is
recognised under provisions for losses on loans and advances
in profit or loss. These provisions reflect differences between
the amount of actual and expected cash flows, changes in ex-
pectations regarding future cash flows and changes in variable
interest rates since the previous reporting date. The effects
of changes in exchange rates are also recognised in profit or
loss.
Notes Consolidated Financial Statements 99C-61

Small loans and advances with indications of impairment are
aggregated into narrowly defined portfolios with similar risk
structures and measured using a uniform method. Data relat-
ing to the measurement of the credit risk, particularly the
amounts at risk of default, collateral and historical default
probabilities, is fed into the calculation of the specific loan loss
allowances evaluated on a group basis. Country risk is impli-
citly factored into this calculation. This methodology is also
used for determining portfolio loan loss allowances, which are
recognised for loans and advances where there is no objective
evidence of impairment or where no requirement for an im-
pairment loss was identified in the individual assessments of
the loans and advances concerned. The purpose of the portfo-
lio loan loss allowance is to cover impairment that might
already exist but has not yet been identified. In this case, an-
ticipated losses are multiplied by factors that reflect the time
between the occurrence and identification of impairment.
The provisions for losses on loans and advances reported in the
statement of financial position are clearly shown as a deduction
from the loans and advances to banks and loans and advances
to customers. The provisions for losses on off- balance sheet
transactions (contingent liabilities and irrevocable loan commit-
ments) are recognised as a separate provision for risks arising
in connection with the lending business. The procedure for
calculating the amount of this provision largely reflects the
procedure used for determining allowances for the loans and
advances recognised in the statement of financial position.
However, the probability that a loan or advance will be drawn
down is also taken into account in this case.
If loans or advances for which no specific loan loss allowances
have been recognised become uncollectible, they are written
off immediately. Any amounts subsequently recovered on
loans or advances previously written off are recognised in
profit or loss. Any such direct write-offs or amounts subse-
quently recovered on loans and advances previously written
off are recognised under provisions for losses on loans and
advances in the income statement.
(13) Investment Property
Investment property is defined as property held to generate
rental income in the long term or for capital appreciation, or
both.
With regard to the classification of mixed-use property, in other
words property in which some areas are rented out and other
areas are used by Helaba itself, a check is first performed to
determine whether the individual components can be sold or
rented out separately and whether there is an active market for
these components. If it is not possible for the property to be
split, the property is only classified as investment property if
the owner-occupancy area is insignificant in relation to the
overall size of the property. Property in which Helaba Group
companies themselves occupy a significant area is recognised
in accordance with IAS 16 and reported under property and
equipment.
Investment property is measured at amortised cost. Subse-
quent additional costs are only capitalised if they give rise to a
further economic benefit. In contrast, maintenance costs are
expensed as incurred. Borrowing costs are capitalised as part
of the acquisition costs in accordance with the provisions in
IAS 23. Buildings are depreciated on a straight-line basis over
their estimated useful life. The component approach is used if
material parts of the property differ significantly in terms of
useful life.
The bands used for useful lives are as follows, depending on the
type of property usage in each case:
■■ Residential and commercial property 40 – 80 years
■■ Office buildings, other office and
business premises 40 – 60 years
■■ Special property 20 – 60 years
Any additional reductions in value are recognised through im-
pairment losses. An impairment loss is reversed if the reason
for the original impairment loss no longer exists.
Rental income, gains and losses on disposals, depreciation and
other expenses directly attributable to investment property are
reported in other net operating income.
Different procedures depending on size of property are used
to determine the property fair values disclosed in Note (42). In
the case of medium-sized and large properties, a valuation is
carried out by an external property surveyor at least every three
to five years. This valuation is reviewed and updated by an in-
ternal expert on an annual basis in the intervening years. The
annual valuation of smaller properties is generally carried out
internally.
The income approach is used to value the properties.
100C-62

(14) Property and Equipment
Property and equipment comprises assets used by the Helaba
Group itself, including the following: land and buildings, op-
erating and office equipment, properties under construction
(provided that they are not being constructed or developed for
future use as investment property) and assets leased out to
third parties under operating leases.
Property and equipment is measured at amortised cost. This
cost comprises the purchase price and all directly assignable
costs incurred in order to bring the asset to working condition.
Subsequent additional costs are only capitalised if they give
rise to a further economic benefit. In contrast, maintenance
costs for property and equipment are expensed as incurred.
Where applicable, property and equipment is depreciated on
a straight-line basis over its normal useful life with due regard
to legal and contractual restrictions. This does not apply to
low-value assets, which are written off in full in the year of
acquisition.
The range of anticipated useful lives is as follows:
■■ Buildings 40 – 80 years
■■ Operating and office equipment 1 – 25 years
■■ Assets used for leasing 3 – 25 years
Impairment losses are recognised if there are indications of
impairment and the carrying amount of an item of property or
equipment is greater than the higher of value in use and fair
value less costs to sell. If the reasons for an impairment loss
no longer exist in subsequent years, the impairment loss is
reversed up to a maximum of the carrying amount that would
have been recognised including depreciation if the impairment
loss had not been recognised.
The depreciation expense and impairment losses on property
and equipment are included in general and administrative
expenses. Gains and losses on the disposal of assets are
reported in other net operating income.
(15) Intangible Assets
The main items reported under intangible assets are goodwill
arising from acquisition accounting, software and intangible
assets acquired as part of a business combination.
Goodwill is subject to an impairment test at least once a year
and additionally if there are any indications of impairment.
The impairment test is carried out for every cash-generating
unit to which goodwill has been allocated. Goodwill is allocated
to the identifiable groups of assets that generate cash inflows
largely independently of the cash flows from other assets or
groups of assets and that are intended to derive benefit from
the synergies generated by the business combination. Various
factors (including the nature of the control over the business
activity exercised by the management) are involved in deter-
mining whether an asset or a group of assets generates cash
inflows that are largely independent of those generated by
other assets or groups of assets. In the impairment test, the
recoverable amount is compared against the net carrying
amount of the cash-generating unit including the carrying
amounts of the allocated goodwill. The recoverable amount is
the higher of value in use and fair value less costs to sell. If there
are no recent comparable transactions or observable market
prices available, the value is generally determined using a
discounted earnings model which calculates the present value
of anticipated future income surpluses. Income forecasts are
taken from budgets and individual assumptions regarding
growth trends in revenue and costs. To cover the period beyond
the period covered by corporate planning, the planning figures
are used to determine a sustainable rate of net income that can
then be used in an annuity model. The present value is calcu-
lated using current local long-term discount rates including a
risk supplement comprising a market risk premium and a beta
factor. If the goodwill is derived from an asset-related special
purpose entity, the present value can also be calculated in re-
lation to the specific asset. An asset is impaired if the carrying
amount of the cash-generating unit exceeds the recoverable
amount. In this case, an impairment loss in the amount of the
difference is recognised. This impairment loss is reported in
other net operating income.
Software is measured at amortised cost. Such assets are amor-
tised in most cases over a period of three years. Acquired orders
on hand are amortised according to contractual maturity. Am-
ortisation expenses and impairment losses related to software
and other intangible assets are included in general and admin-
istrative expenses. Gains and losses on disposals are reported
under other net operating income.
Notes Consolidated Financial Statements 101C-63

(16) Non-Current Assets and Disposal Groups Classified as Held for Sale
Non-current assets held for sale, subsidiaries already acquired
with a view to onward disposal, disposal groups as defined by
IFRS 5 and the liabilities associated with these assets are
reported in a separate item on the face of the statement of
financial position. In the case of subsidiaries already acquired
with a view to onward disposal, the income and expenses
associated with this item (including changes in deferred taxes)
are recognised in profit or loss under net profit after tax from
discontinued operations.
If non-current assets and disposal groups are to be recognised
in this way in accordance with IFRS 5, it must be highly prob-
able that the assets and disposal groups concerned will actually
be sold within twelve months.
Until the relevant criteria are satisfied, the assets are measured
in accordance with the general recognition and measurement
provisions. As soon as the criteria under IFRS 5 are satisfied,
the assets are measured from then on at the lower of the carry-
ing amount and fair value less costs to sell.
(17) Other Assets and Other Liabilities
Other assets include property held for sale as part of ordinary
business activities. These assets comprise properties, both
completed and under construction, that Helaba is itself devel-
oping and marketing. The properties are measured at the lower
of cost and fair value less cost to sell, i.e. the estimated recover-
able sales proceeds less anticipated remaining costs for com-
pletion and sale. Borrowing costs are capitalised provided that
the relevant criteria are satisfied. Income and expenses in
connection with property held for sale are reported under
other net operating income.
Other assets and other liabilities are used for reporting any
other assets or liabilities that, viewed in isolation, are of minor
significance and that cannot be allocated to any other item in
the statement of financial position.
(18) Provisions for Pensions and Similar Obligations
Company pension arrangements in the Helaba Group com-
prise various types of benefit plans. There are both defined
contribution plans and defined benefit plans.
In the case of defined contribution plans, fixed contributions
are paid to external pension providers. No provisions are gen-
erally recognised in connection with these defined contribu-
tion plans because the Group is not subject to any further pay-
ment obligations. The ongoing contributions for defined
contribution plans are recognised in general and administra-
tive expenses.
As regards defined benefit plans, Helaba operates a number of
schemes involving total benefit commitments, final salary
schemes and pension module schemes. Some of the pension
obligations are covered by assets that represent plan assets as
defined by IAS 19. These plan assets are offset against the pen-
sion obligations. If this gives rise to an asset surplus, the car-
rying amount of the net asset value is limited to the present
value of the associated economic benefits available to the
Group during the term of the pension plan or following settle-
ment of the obligations (asset ceiling). Economic benefits may
be available, for example, in the form of refunds from the plan
or reductions in future contributions to the plan.
Defined benefit obligations are determined annually by external
actuaries. The obligations are measured using the projected
unit credit method based on biometric assumptions, salary and
pension increases expected in the future, and a current market
discount rate. This discount rate is based on the coupon for in-
vestment-grade corporate bonds in the same currency with a
maturity matched to the weighted average maturity for the pay-
ment obligations. In Germany, a reference discount rate is ap-
plied that takes into account a large number of AA-rated bonds
and has been adjusted for statistical outliers. Helaba determines
this discount rate largely on the basis of Mercer’s discount rate
recommendation. The actual discount rate used is in a range
covered by 0.5 percentage points, within which three expected
scenarios are calculated. Based on Mercer’s rate recom mendation,
Helaba uses the discount rate from the scenario deemed to be
the best estimate taking into account the duration and discount
rate recommendations from other actuaries. This procedure is
intended to avoid positive or negative outliers.
As part of a regular review of the procedure for determining
discount rates, Mercer applied some adjustments to the Mercer
Yield Curve in mid-2015. According to Mercer, these adjust-
ments only had a minor impact. These changes had no impact
at all at Helaba because of Helaba’s system of comparing
Mercer’s recommendation with the recommendations from
other actuaries and adjusting as appropriate.
102C-64

In accordance with IAS 19, the defined benefit expense to be
recognised in profit or loss is largely determined right at the
start of a financial year. The pension expense to be recognised
in the income statement includes mainly the net interest com-
ponent and the current service cost.
The net interest component comprises both the expense
arising from unwinding the discount on the present value of
the pension obligation and the imputed interest income on
the plan assets. The net interest is determined by multiplying
the net defined benefit liability (present value of the defined
bene fit obligation less plan assets) at the start of the period by
the applicable discount rate, taking into account any changes
in the net defined benefit liability during the period as a result
of contribution and benefit payments. If a surplus of plan
assets arises, the net interest component also includes the
net interest on the effect of the asset ceiling. The net interest
expense is included as part of the net interest income figure
reported in the income statement.
The current service cost represents the increase in pension
obligations attributable to the service provided by employees
in the financial year; it is reported under general and adminis-
trative expenses.
If the present value of a defined benefit obligation changes as
a result of the amendment or curtailment of a plan, the result-
ing effects are recognised in profit or loss under general and
administrative expenses as a past service cost. The amount
concerned is recognised on the date the amendment or cur-
tailment occurs. Any gain or loss arising from the settlement of
defined benefit obligations is treated in the same way.
Any variances between the actuarial assumptions at the start of
the period and actual trends during the financial year, together
with any updates made to the measurement par ameters at the
end of the financial year, result in remeasurement effects, which
are then reported in other comprehensive income.
If the Helaba Group is involved in joint defined benefit plans
with a number of other employers and these defined benefit
plans cannot be recognised as such because there is insuffi-
cient reliable information available, the plans are reported as
defined contribution plans accompanied by supplementary
information.
(19) Other Provisions
Other provisions are recognised in accordance with IAS 37 if
the Helaba Group has incurred a present obligation (legal or
constructive) as a result of a past event, it is probable that settle-
ment will result in an outflow of resources and the amount can
be reliably estimated. The timing or amount of the obligation
is uncertain. The amount recognised as a provision is the best
possible estimate as at the reporting date of the expense that
will be necessary to settle the obligation. Non-current provisions
are recognised at present value if the effect of discounting is
material. Provisions are discounted using a standard market
discount rate commensurate with the risk involved.
Other provisions also include personnel-related provisions,
which are measured in accordance with IAS 19.
(20) Taxes on Income
Taxes on income are recognised and measured in accordance
with the provisions in IAS 12. Current income tax assets and
liabilities are calculated using the latest tax rates that will be
applicable when the tax concerned arises.
Deferred tax assets and liabilities are generally recognised
for temporary differences between the carrying amounts of
assets and liabilities in the statement of financial position in
accordance with IFRS and those in the corresponding tax base.
They are measured using the tax rates that have been enacted
as at the reporting date and that will be relevant for the date
on which the deferred taxes are realised. Deferred tax liabilities
are recognised for temporary differences that will result in a tax
expense when the differences reverse. If a tax refund is antici-
pated on reversal of temporary differences and it is probable
that this refund can be utilised, then deferred tax assets are
recognised. Deferred tax assets are only recognised for tax loss
carryforwards if it is sufficiently probable that they will be able
to be utilised in the future. Deferred tax assets and liabilities
are netted provided that they relate to the same type of tax, tax
authority and maturity. They are not discounted. Deferred taxes
on temporary differences in other comprehensive income are
also recognised in other comprehensive income and in the
revaluation reserve. Current and deferred tax assets and liabil-
ities are reported separately in the disclosures within the notes
relating to the income tax asset and liability items.
Notes Consolidated Financial Statements 103C-65

(21) Subordinated Capital
Issues of profit-sharing certificates, securitised and unsecuri-
tised subordinated liabilities, together with silent participa-
tions, which must be classified as debt in accordance with the
criteria specified in IAS 32, are all reported as subordinated
capital.
The financial instruments reported under subordinated capital
are generally allocated to the other financial liabilities (OL)
category and measured at amortised cost. A micro fair value
hedge or the fair value option is used for some of the subordi-
nated capital in order to avoid accounting mismatches.
104C-66

Income Statement Disclosures
(22) Net Interest Income
in € m
2015
20141)
Interest income from
Lending and money market transactions 2,763 2,994
Fixed-income securities 270 309
Hedging derivatives under hedge accounting 249 296
Derivatives not held for trading 1,003 1,073
Financial instruments to which the fair value option is applied 66 74
Financial liabilities (negative interest) 4 1
Current income from
Equity shares and other variable-income securities 22 17
Shares in affiliates 2 2
Equity investments 6 6
Interest income 4,385 4,772
Interest expense on
Liabilities due to banks and customers – 1,178 – 1,385
Securitised liabilities – 358 – 405
Subordinated capital – 156 – 166
Hedging derivatives under hedge accounting – 257 – 318
Derivatives not held for trading – 841 – 836
Financial instruments to which the fair value option is applied – 237 – 319
Financial assets (negative interest) – 5 –
Provisions – 41 – 50
Interest expenses – 3,073 – 3,479
Total 1,312 1,293
1) Prior-year figures restated: negative interest reported separately.
The interest income from lending and money market transactions
included the effect of unwinding the discount on impaired loans
and advances, given otherwise unchanged payment expectations,
in the amount of € 31 m (2014: € 36 m).
Current income from equity shares and other variable-income
securities included dividends and distributions from financial
instruments to which the fair value option is applied amount-
ing to € 7 m (2014: € 8 m).
Current income from shares in affiliates encompasses dividends
as well as income from profit and loss transfer agreements.
Interest expense on provisions included net interest expense
arising from pension obligations amounting to € 38 m (2014:
€ 46 m).
Notes Consolidated Financial Statements 105C-67
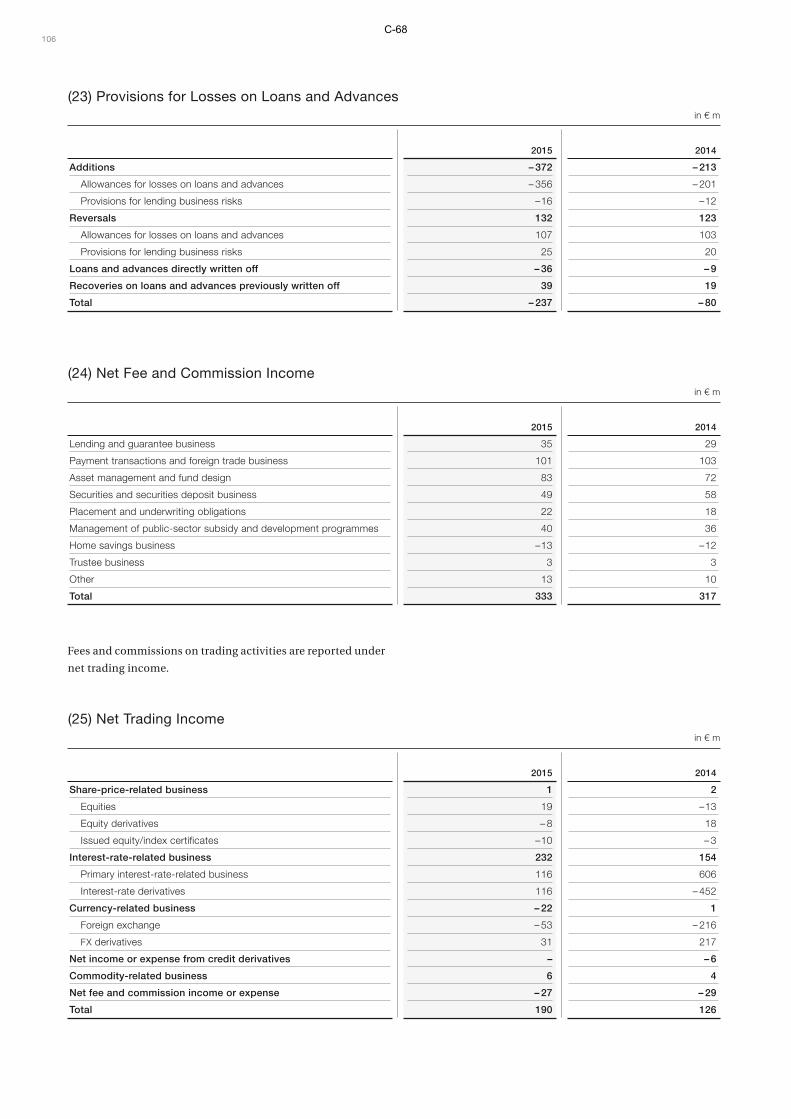
(23) Provisions for Losses on Loans and Advancesin € m
2015 2014
Additions – 372 – 213
Allowances for losses on loans and advances – 356 – 201
Provisions for lending business risks –16 – 12
Reversals 132 123
Allowances for losses on loans and advances 107 103
Provisions for lending business risks 25 20
Loans and advances directly written off – 36 – 9
Recoveries on loans and advances previously written off 39 19
Total – 237 – 80
(24) Net Fee and Commission Incomein € m
2015 2014
Lending and guarantee business 35 29
Payment transactions and foreign trade business 101 103
Asset management and fund design 83 72
Securities and securities deposit business 49 58
Placement and underwriting obligations 22 18
Management of public-sector subsidy and development programmes 40 36
Home savings business –13 – 12
Trustee business 3 3
Other 13 10
Total 333 317
Fees and commissions on trading activities are reported under
net trading income.
(25) Net Trading Incomein € m
2015 2014
Share-price-related business 1 2
Equities 19 – 13
Equity derivatives – 8 18
Issued equity/index certificates –10 – 3
Interest-rate-related business 232 154
Primary interest-rate-related business 116 606
Interest-rate derivatives 116 – 452
Currency-related business – 22 1
Foreign exchange – 53 – 216
FX derivatives 31 217
Net income or expense from credit derivatives – – 6
Commodity-related business 6 4
Net fee and commission income or expense – 27 – 29
Total 190 126
106C-68

Net trading income includes disposal and remeasurement gains
or losses on derivative and non-derivative financial instruments
held for trading, current interest and dividends resulting from
trading assets as well as fees and commissions in connection
with trading activities.
The net income from primary interest-rate-related business
consists mainly of the contributions to income of fixed-income
securities, promissory note loans, money trading transactions
as well as issued money market instruments.
(26) Gain or Loss on Non-Trading Derivatives and Financial Instruments to which the Fair Value Option is Applied
in € m
2015
2014
Gain or loss on non-trading derivatives – 104 309
Gain or loss on financial instruments to which the fair value option is applied 126
– 271
Total 22 38
This item includes the net gain or loss from economic hedges
(hedged items and derivatives). It also includes the realised and
unrealised gains or losses on other financial instruments des-
ignated voluntarily at fair value. Interest and dividend income
from financial instruments to which the fair value option is
applied is recognised in net interest income. Of the net loss
from non-trading derivatives, credit derivatives accounted for
a gain of € 3 m (2014: gain of € 10 m). Within the gain or loss on
non-trading derivatives and financial instruments to which the
fair value option is applied, the amount attributable to such
instruments held by consolidated special and retail funds was
a net loss of € 31 m (2014: net gain of € 20 m).
(27) Net Income from Hedge Accounting
The net income from hedge accounting comprises the remea-
surement gains or losses on the hedged items and hedging
instruments under hedge accounting.
in € m
2015
2014
Remeasurement gains (losses) on hedging instruments – 10 370
Remeasurement gains (losses) on hedged items 13 – 357
Total 3 13
(28) Net Income from Financial Investments
The net income or expense from financial investments includes
the net disposal and remeasurement gains or losses on available-
for-sale financial investments.
in € m
2015
2014
Net disposal gains (losses) on available-for-sale financial investments 63 33
Shares in affiliated companies 11 –
Equity investments 15 1
Bonds and other fixed-income securities 36 26
Equity shares and other variable-income securities 1 6
Remeasurement gains (losses) on available-for-sale financial investments – 56 –
Impairment losses – 56 –
Total 7 33
Notes Consolidated Financial Statements 107C-69

(29) Share of Profit or Loss of Equity-Accounted Entities
The share of profit or loss of equity-accounted entities com-
prises the earnings contributions of equity-accounted joint
ventures and associates, which are recognised in the income
statement.
in € m
2015
2014
Share of profit or loss of equity-accounted joint ventures 2 6
Share of profit or loss of equity-accounted associates – 20 – 4
Gains on the disposal of equity-accounted joint ventures – 10
Gains on the disposal of equity-accounted associates 1 –
Total – 17 12
(30) Other Net Operating Income in € m
2015
2014
Other operating income 462 476
Rental and lease income (operating leases) 325 332
Income from the disposal of non-financial assets 41 53
Income from the reversal of provisions 12 12
Income from non-banking services 32 36
Reversal of impairment losses on non-financial assets 1 4
Income from the deconsolidation of subsidiaries 15 4
Income associated with loss absorption – 2
Miscellaneous other operating income 36 33
Other operating expenses – 289 – 406
Operating costs of property not used for owner occupancy – 149 – 155
Expenses from the disposal of non-financial assets – 1 –
Depreciation, amortisation and impairment losses on non-financial assets – 56 – 97
Restructuring expenses – 5 – 40
Profit transfer expenses – 2 –
Miscellaneous other operating expenses – 76 – 114
Total 173 70
The main components of other net operating income are in-
come and expenses attributable to investment property as well
as leasing income.
108C-70
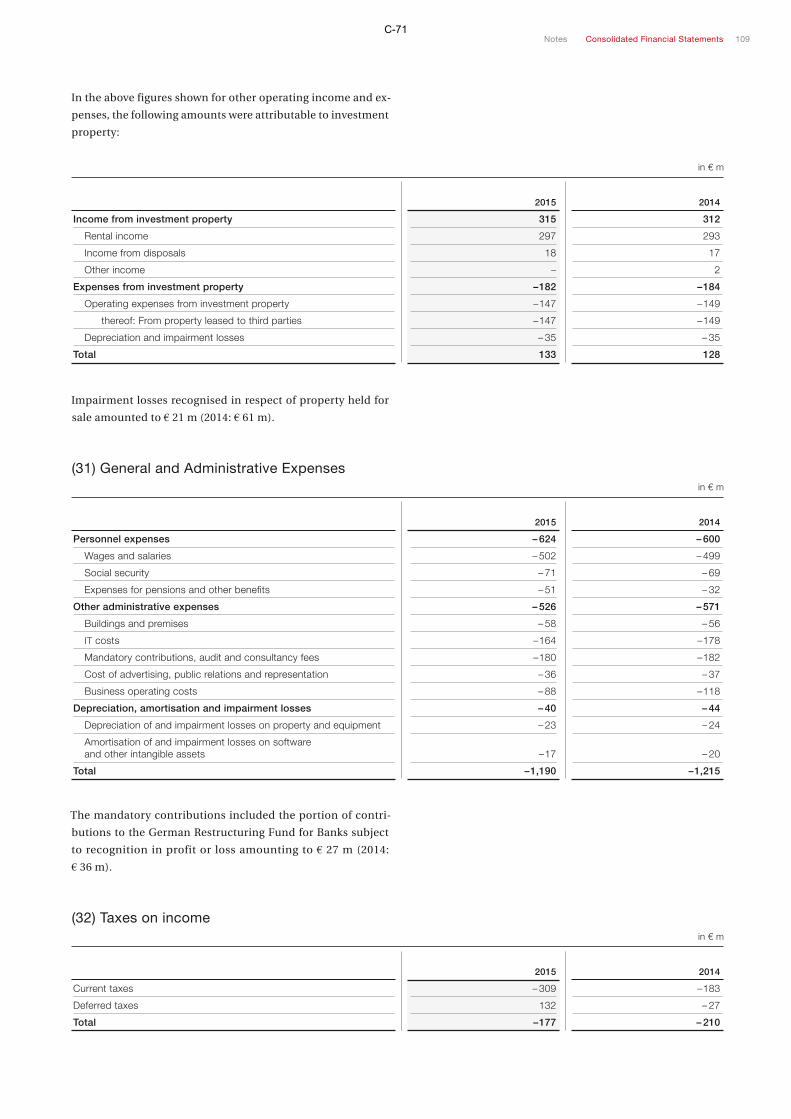
In the above figures shown for other operating income and ex-
penses, the following amounts were attributable to investment
property:
in € m
2015
2014
Income from investment property 315 312
Rental income 297 293
Income from disposals 18 17
Other income – 2
Expenses from investment property – 182 – 184
Operating expenses from investment property – 147 – 149
thereof: From property leased to third parties – 147 – 149
Depreciation and impairment losses – 35 – 35
Total 133 128
Impairment losses recognised in respect of property held for
sale amounted to € 21 m (2014: € 61 m).
(31) General and Administrative Expenses in € m
2015
2014
Personnel expenses – 624 – 600
Wages and salaries – 502 – 499
Social security – 71 – 69
Expenses for pensions and other benefits – 51 – 32
Other administrative expenses – 526 – 571
Buildings and premises – 58 – 56
IT costs – 164 – 178
Mandatory contributions, audit and consultancy fees – 180 – 182
Cost of advertising, public relations and representation – 36 – 37
Business operating costs – 88 – 118
Depreciation, amortisation and impairment losses – 40 – 44
Depreciation of and impairment losses on property and equipment – 23 – 24
Amortisation of and impairment losses on software and other intangible assets – 17 – 20
Total – 1,190 – 1,215
The mandatory contributions included the portion of contri-
butions to the German Restructuring Fund for Banks subject
to recognition in profit or loss amounting to € 27 m (2014:
€ 36 m).
(32) Taxes on income in € m
2015
2014
Current taxes – 309 – 183
Deferred taxes 132 – 27
Total – 177 – 210
Notes Consolidated Financial Statements 109C-71

The current tax expense incurred in the year under review was
primarily attributable to the Bank in Germany (€ 221 m), the
New York branch (€ 37 m) and Frankfurter Sparkasse (€ 32 m).
It included expenses relating to prior years amounting to
€ 103 m (2014: € 17 m).
Because of the use of tax losses not taken into account previ-
ously, the current tax expense was reduced by € 1 m in the year
under review (2014: € 1 m).
Deferred tax income recognised in the year under review related
mainly to the occurrence or reversal of temporary differences
(tax income of € 138 m). This included deferred tax income
relating to prior years of € 106 m. There was no tax income or
expense arising from changes in tax rates in 2015. The net out-
come from new tax loss carryforwards and the utilisation of
such carryforwards was a deferred tax expense of € 6 m in 2015.
The reconciliation statement is based on the applicable tax rate
for the parent company. This is a rate of 32 %, the rounded in-
come tax rate applicable to Helaba Bank in Germany.
in € m
2015
2014
Profit before taxes 596 607
Applicable income tax rate in % 32 32
Expected income tax expense in the financial year – 191 – 194
Effect of variance in tax rates – – 4
Effect of changes in the tax rate – – 1
Effect of prior-period taxes recognised in the financial year 3 1
Non-creditable income tax – – 1
Non-taxable income 23 24
Non-deductible operating expenses – 11 – 33
Trade tax add-backs and deductions 3 4
Impairment losses and adjustments – 5 – 1
Other effects 1 – 5
Income tax expense – 177 – 210
In addition to income taxes recognised in the income state-
ment, other deferred taxes are recognised in relation to the
individual components of other comprehensive income. The
following table shows a breakdown of the gains and losses
recognised in other comprehensive income and the related
deferred taxes.
in € m
Before tax
Taxes
After tax
2015 2014 2015 2014 2015 2014
Items that will not be reclassified to the income statement:
Remeasurement of net defined benefit liability 77 – 444 – 23 130 54 – 314
Items that will be subsequently reclassified to the income statement:
Gains or losses on available-for-sale financial assets – 62 173 19 – 55 – 43 118
Changes due to currency translation 9 12 – – 9 12
Share of other comprehensive income or loss – 4 – – – 4
Total 24 – 255 – 4 75 20 – 180
110C-72

(33) Segment Reporting in € m
Real Estate Corporate Finance Financial Markets
S-Group Business, Private Customers and SME Business
2015 2014 2015 2014 2015 2014 2015 2014
Net interest income 407 388 354 333 56 75 399 407
Provisions for losses on loans and advances – 66 – 28 – 93 – 74 – 2 11 – 3
Net interest income after provisions for losses on loans and advances 341 360 261 259 56 77 410 404
Net fee and commission income 22 19 18 16 76 75 146 137
Net trading income – – – – 178 103 24 23
Gain or loss on non-trading derivatives and financial instruments to which the fair value option is applied 11 1 – – 42 18 – 3 8
Net income from hedge accounting – – – – 3 13 – –
Net income from financial investments 11 5 – 17 2 – 9 14 8 12
Share of profit or loss of equity-accounted entities 5 16 – 21 – 6 – – 1 2
Other net operating income 217 145 – 4 – 8 5 4 16 39
Total income 607 546 237 263 351 304 602 625
General and administrative expenses – 227 – 195 – 122 – 101 – 224 – 195 – 462 – 451
Profit before taxes 380 351 115 162 127 109 140 174
Assets (€ bn) 34.1 33.8 26.1 25.4 60.7 73.6 37.1 37.4
Liabilities (€ bn) 3.3 3.4 2.9 3.2 68.0 80.3 61.1 69.1
Risk-weighted assets (€ bn) 16.7 16.9 14.0 14.0 10.7 10.3 5.9 5.6
Allocated capital (€ m) 2,261 2,352 1,898 1,914 1,437 1,398 791 750
Return on allocated capital (%) 16.8 14.9 6.0 8.5 8.8 7.7 17.7 23.2
Cost-income ratio before provisions for losses on loans and advances (%) 33.7 33.9 37.1 29.9 63.8 65.0 78.1 71.8
in € m
Public Development and Infrastructure
Business OtherConsolidation/ reconciliation Group
2015 2014 2015 2014 2015 2014 2015 2014
Net interest income 51 46 – 36 6 81 38 1,312 1,293
Provisions for losses on loans and advances – – – 92 24 3 – 1 – 237 – 80
Net interest income after provisions for losses on loans and advances 51 46 – 128 30 84 37 1,075 1,213
Net fee and commission income 42 38 29 34 – – 2 333 317
Net trading income – – – – – 12 – 190 126
Gain or loss on non-trading derivatives and financial instruments to which the fair value option is applied – – – 28 11 – – 22 38
Net income from hedge accounting – – – – – – 3 13
Net income from financial investments – – 14 – – – 7 33
Share of profit or loss of equity-accounted entities – – – 2 – – – – 17 12
Other net operating income – 1 – 8 – 53 – 68 – 57 173 70
Total income 92 84 – 107 22 4 – 22 1,786 1,822
General and administrative expenses – 65 – 66 – 146 – 287 56 80 – 1,190 – 1,215
Profit before taxes 27 18 – 253 – 265 60 58 596 607
Assets (€ bn) 16.1 15.2 6.4 6.9 – 8.2 – 12.8 172.3 179.5
Liabilities (€ bn) 16.3 15.2 10.2 9.5 10.5 – 1.2 172.3 179.5
Risk-weighted assets (€ bn) 1.1 1.2 6.5 5.8 – – 54.9 53.8
Allocated capital (€ m) 148 168 862 783 – – 87 7,397 7,278
Return on allocated capital (%) 18.4 10.7 – – – – 8.1 8.3
Cost-income ratio before provisions for losses on loans and advances (%) 70.4 78.4 – – – – 58.8 63.9
Notes Consolidated Financial Statements 111C-73

The segment report is broken down into the five operating seg-
ments explained below.
■■ The Real Estate Lending and Real Estate Management business
lines are reported in the Real Estate segment. The services
Helaba provides for real estate customers are thus pooled
in one operating segment. The range of products covers
traditional real estate financing in Germany and abroad,
residential investments, planning and support for own and
third-party real estate as well as public-private partnership
projects right through to facility management. The OFB
Group and the GWH Group are included in this operating
segment.
■■ The Corporate Finance segment comprises the Corporate
Finance business line. Financing solutions tailored specifi-
cally to meet the needs of corporate customers are pooled
in this segment. These include structured finance, invest-
ment finance, asset-backed securities, lease finance as well
as the structuring and distribution of fund concepts. The
share of profit or loss of the HANNOVER LEASING Group is
allocated to this segment as an equity-accounted invest-
ment. Certain property companies of HANNOVER LEASING
continue to be fully consolidated as special purpose entities
of Helaba in accordance with IFRS 10 and are also reported
in the Corporate Finance segment.
■■ The Financial Markets segment brings together the earnings
of the Capital Markets, Asset/Liability Management, Sales
Public Authorities, Financial Institutions and Public Finance
business lines and those of various special purpose entities
and of the equity investment in Helaba Invest Kapitalanlage-
gesellschaft mbH. The segment primarily pools the treasury,
trading and sales activities of Helaba. The Financial Markets
product portfolio contains traditional capital market prod-
ucts, financial instruments for managing interest rate risk,
currency risk, credit risk and liquidity as well as financing
solutions tailored to meet the needs of businesses and the
public sector. The asset management products at Helaba
Invest Kapitalanlagegesellschaft mbH also include tradition-
al asset management and administration, the management
of special and retail funds for institutional investors and
support for master investment trust clients.
■■ The S-Group Business, Private Customers and SME Business
segment encompasses the retail banking and private bank-
ing businesses, the S-Group Bank and Landesbausparkasse
Hessen-Thüringen. Frankfurter Sparkasse reflects the earn-
ings from the conventional products of a retail bank. The
Frankfurter Bankgesellschaft Group rounds off the range
of private banking products available from Helaba. This
segment deals primarily with providing support for the
Sparkassen and their customers for whom products are
developed and provided.
■■ The Public Development and Infrastructure Business seg-
ment mainly comprises the Wirtschafts- und Infrastruktur-
bank Hessen (WIBank) business line. This segment thus
pools the earnings from Helaba’s development activities in
the fields of infrastructure and economic development,
housing and urban development, agriculture and European
Structural Funds.
In line with management reporting, the segment informa-
tion is based on internal management (contribution margin
accounting) and also on external financial reporting.
For internal management purposes, net interest income in the
lending business is calculated using the market interest rate
method from the difference between the customer interest rate
and the market interest rate for an alternative transaction with
a matching structure. Gains or losses on maturity transfor-
mation are reported as net interest income in Asset/Liability
Management.
The net trading income, gain or loss on non-trading derivatives
and financial instruments to which the fair value option is ap-
plied, net income from hedge accounting and financial invest-
ments and share of profit or loss of equity-accounted entities
is determined in the same way as the figures for external finan-
cial reporting under IFRSs.
The directly attributable costs plus corporate centre costs,
which are allocated internally on the basis of arm’s-length pric-
ing agreements and volume drivers according to the user-pays
principle, are reported under general and administrative
expenses. The allocation of overheads was revised in the
reporting year to ensure that the allocation was more in line
with the origin of the costs (user-pays principle). This led to an
increase in general and administrative expenses in the Real
Estate, Corporate Finance and Financial Markets segments
with a simultaneous fall in these expenses in the Other seg-
ment. The figures for 2014 have not been restated.
Assets included in the statement of financial position are
reported under assets, and equity and liabilities under equity
and liabilities of the respective units. Contribution margin
accounting is used for allocating these items to the operating
segments. The risk exposure item comprises the risk exposure
of the banking and trading book, including the market risk
exposure in accordance with the Capital Requirements Regu-
lation (CRR). The average equity shown in the statement of
financial position is broken down according to risk exposures
and, in relation to the real estate and other non-bank activities,
allocated in accordance with the assets reported in the state-
ment of financial position.
The return ratios reflect the net profit before provisions for
losses on loans and advances expressed as a percentage of the
112C-74

allocated capital. The cost-income ratio is the ratio of general
and administrative expenses to income before provisions for
losses on loans and advances.
The Other segment contains the contributions to income and
expenses that cannot be attributed to the operating segments.
In particular, this segment includes the net income from the
transaction banking business as well as the costs of the central
units that cannot be allocated to the individual segments in
line with the user-pays principle. The profit generated by cen-
trally investing own funds as well as through strategic planning
decisions is also shown in this segment.
Effects arising from consolidation and intragroup adjustments
between the segments are reported under consolidation/rec-
onciliation. Effects that arise from the reconciliation between
the segment figures and the consolidated income statement,
in particular in relation to net interest income, are also reported
under consolidation/reconciliation. Since the contribution
margin statement shows net interest income on the basis of the
market interest rate method, differences also result in the case
of non-recurring income and net interest income attributable
to other periods.
Income after provisions for losses on loans and advances is
attributable to products and services as follows:
in € m
Income after provisions for losses on loans and advances
2015 2014
Real estate loans 428 387
Real estate management 25 33
Real estate services 154 126
Corporate loans 237 263
Treasury products 75 95
Trading products 185 118
Loans to financial institutions 41 45
Fund management/asset management 92 77
Home savings business 55 53
Sparkassen S-Group business 127 116
Public development and infrastructure business 92 84
Retail 378 425
Other products/reconciliation – 103 –
Group 1,786 1,822
The breakdown by region is as follows:
in € m
Income after provisions for losses on loans and advances
2015 2014
Germany 1,531 1,585
Europe (excluding Germany) 144 136
Rest of world (excluding Europe) 111 101
Group 1,786 1,822
Notes Consolidated Financial Statements 113C-75

Statement of Financial Position Disclosures
(34) Cash Reserve
in € m
31.12.2015
31.12.2014
Cash on hand 77 78
Balances with central banks 1,832 955
Total 1,909 1,033
Of the total balances with central banks, € 547 m (2014: € 421 m)
was accounted for by balances with Deutsche Bundesbank.
(35) Loans and Advances to Banks in € m
31.12.2015
31.12.2014
Affiliated Sparkassen 7,195 9,348
Central giro institutions 382 452
Banks 9,567 10,779
Total 17,144 20,579
thereof:
Domestic banks 12,105 14,710
Foreign banks 5,039 5,869
in € m
31.12.2015
31.12.2014
Loans and advances repayable on demand 6,318 9,089
Other loans and advances 10,826 11,490
Total 17,144 20,579
thereof:
Sight deposits 409 666
Overnight and time deposits 4,687 4,218
Cash collateral provided 4,407 5,895
Forwarding loans 5,076 5,247
Registered bonds 887 482
Promissory note loans 776 1,034
(36) Loans and Advances to Customers in € m
31.12.2015
31.12.2014
Corporate customers 67,090 65,728
Retail customers 5,586 5,634
Public sector 20,518 19,747
Total 93,194 91,109
thereof:
Domestic customers 59,537 62,337
Foreign customers 33,657 28,772
114C-76
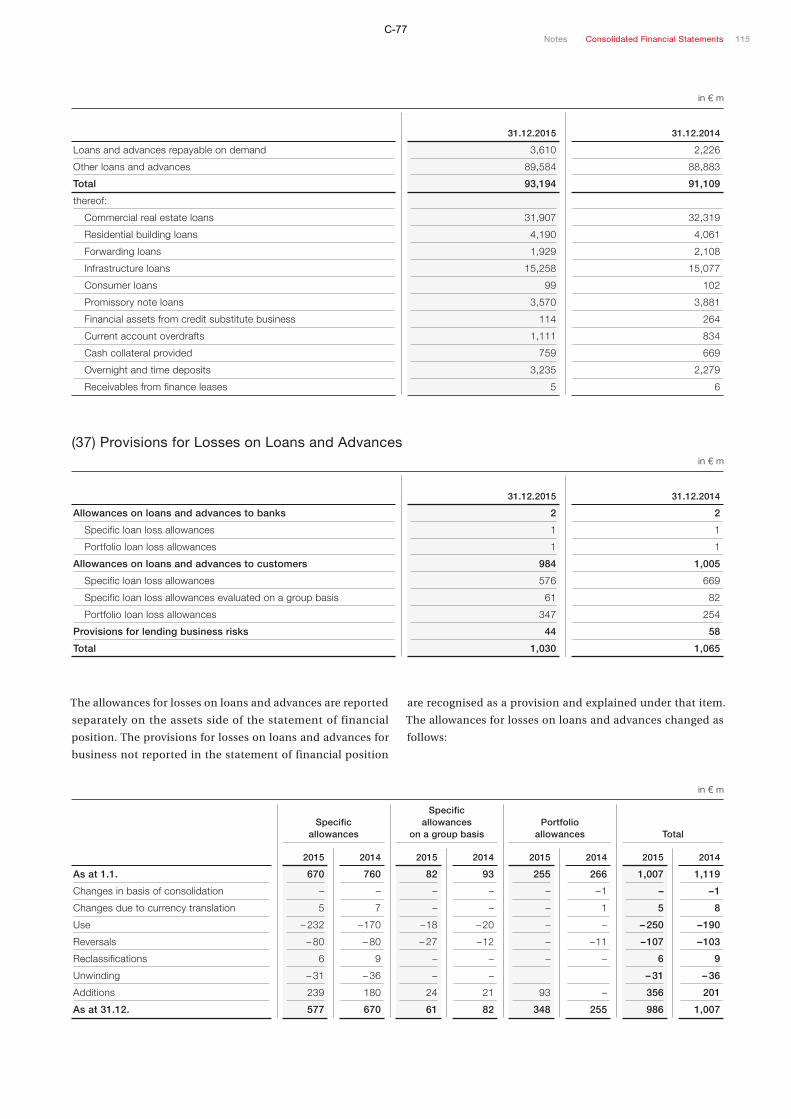
in € m
31.12.2015
31.12.2014
Loans and advances repayable on demand 3,610 2,226
Other loans and advances 89,584 88,883
Total 93,194 91,109
thereof:
Commercial real estate loans 31,907 32,319
Residential building loans 4,190 4,061
Forwarding loans 1,929 2,108
Infrastructure loans 15,258 15,077
Consumer loans 99 102
Promissory note loans 3,570 3,881
Financial assets from credit substitute business 114 264
Current account overdrafts 1,111 834
Cash collateral provided 759 669
Overnight and time deposits 3,235 2,279
Receivables from finance leases 5 6
(37) Provisions for Losses on Loans and Advances in € m
31.12.2015
31.12.2014
Allowances on loans and advances to banks 2 2
Specific loan loss allowances 1 1
Portfolio loan loss allowances 1 1
Allowances on loans and advances to customers 984 1,005
Specific loan loss allowances 576 669
Specific loan loss allowances evaluated on a group basis 61 82
Portfolio loan loss allowances 347 254
Provisions for lending business risks 44 58
Total 1,030 1,065
The allowances for losses on loans and advances are reported
separately on the assets side of the statement of financial
position. The provisions for losses on loans and advances for
business not reported in the statement of financial position
are recognised as a provision and explained under that item.
The allowances for losses on loans and advances changed as
follows:
in € m
Specific allowances
Specific allowances
on a group basisPortfolio
allowances Total
2015 2014 2015 2014 2015 2014 2015 2014
As at 1.1. 670 760 82 93 255 266 1,007 1,119
Changes in basis of consolidation – – – – – – 1 – – 1
Changes due to currency translation 5 7 – – – 1 5 8
Use – 232 – 170 – 18 – 20 – – – 250 – 190
Reversals – 80 – 80 – 27 – 12 – – 11 – 107 – 103
Reclassifications 6 9 – – – – 6 9
Unwinding – 31 – 36 – – – 31 – 36
Additions 239 180 24 21 93 – 356 201
As at 31.12. 577 670 61 82 348 255 986 1,007
Notes Consolidated Financial Statements 115C-77

The allowances for losses on loans and advances to customers
were broken down by customer group (Deutsche Bundesbank
customer classification) as follows:
in € m
31.12.2015 31.12.2014
Government 2 3
Agriculture, forestry and fishing 1 1
Mining and quarrying 9 8
Manufacturing 67 68
Electricity, gas, steam and air-conditioning supply 36 42
Water supply, sewerage, waste management and remediation activities – 9
Construction 8 23
Wholesale and retail trade; repair of motor vehicles and motorcycles 15 25
Transportation and storage 337 223
Accommodation and food service activities 2 4
Information and communication 24 2
Real estate activities 138 315
Professional, scientific and technical activities 25 30
Administrative and support service activities 44 45
Education – 1
Human health and social work activities 8 7
Arts, entertainment and recreation 1 1
Other service activities 113 91
Other financial activities 104 43
Households 50 64
Total 984 1,005
(38) Trading Assetsin € m
31.12.2015 31.12.2014
Bonds and other fixed-income securities 12,428 15,983
Money market instruments 2 187
Public-sector issuers 2 20
Other issuers – 167
Bonds and notes 12,426 15,796
Public-sector issuers 4,753 5,348
Other issuers 7,673 10,448
Equity shares and other variable-income securities 192 140
Positive fair values of derivatives 11,934 12,885
Share-price derivatives 167 131
Interest-rate derivatives 10,417 11,585
Currency derivatives 1,311 1,136
Credit derivatives 31 26
Commodity derivatives 8 7
Loans held for trading 1,524 2,254
Total 26,078 31,262
The financial instruments under trading assets are measured
at fair value and assigned exclusively to the category of finan-
cial assets at fair value through profit or loss (held-for-trading
sub-category). Loans held for trading mainly comprise prom-
issory note loans, repos and money trading transactions.
116C-78

Of the total bonds and other fixed-income securities and of the
total equity shares and other variable-income securities, secu-
rities with a value of € 12,588 m were listed (31 December 2014:
€ 16,015 m).
(39) Positive Fair Values of Non-Trading Derivatives in € m
31.12.2015
31.12.2014
Hedging derivatives under hedge accounting 926 1,256
Other non-trading derivatives 3,450 4,572
Total 4,376 5,828
The hedging derivatives under hedge accounting are used
within the framework of qualifying micro fair value hedges
under IAS 39. Other non-trading derivatives comprise deriva-
tive financial instruments used as economic hedges as part of
hedge management, although fulfilment of the hedge accounting
requirements is not documented in accordance with IAS 39.
(40) Financial Investments
Financial investments consist of bonds and other fixed-income
securities as well as equity shares and other variable-income
securities classified as available for sale or to which the fair
value option has been applied. Shares in non-consolidated
affiliates and equity investments are always measured at fair
value. If such shares or equity investments are classified as
available for sale, measurement gains or losses are recognised
in other comprehensive income. Alternatively, if the fair value
option is applied, the gains or losses are recognised through
profit or loss. If fair value cannot be reliably determined, these
assets are measured at cost net of any impairment losses.
The breakdown of financial investments was as follows:
in € m
31.12.2015
31.12.20141)
Bonds and other fixed-income securities 26,065 25,970
Public-sector issuers 9,543 10,024
Other issuers 16,522 15,946
Equity shares and other variable-income securities 249 346
Equities 92 87
Other variable-income securities 157 259
Shares in non-consolidated affiliates 25 27
Measured at fair value 18 18
Measured at cost 7 9
Equity investments 82 80
Measured at fair value 59 56
Measured at cost 23 24
Purchase of receivables from endowment insurance policies 154 167
Measured at fair value 154 167
Total 26,575 26,590
1) Prior-year figures restated: reclassification of equity investments at fair value (– € 2 m) to other variable-income securities (+ € 2 m). The reclassification relates to equity investments in investment limited partnerships, which have to be reported under equity shares and other variable-income securities as a result of a change in section 17 of the German Regulation on the Accounting of Banks and Financial Services Institutions (Verordnung über die Rechnungslegung der Kreditinstitute und Finanzdienst-leistungsinstitute, RechKredV) and section 1 of the German Investment Code (Kapitalanlagegesetzbuch, KAGB).
The other variable-income securities mainly comprise shares
in collective investment undertakings and in investment limited
partnerships and similar foreign structures.
Notes Consolidated Financial Statements 117C-79
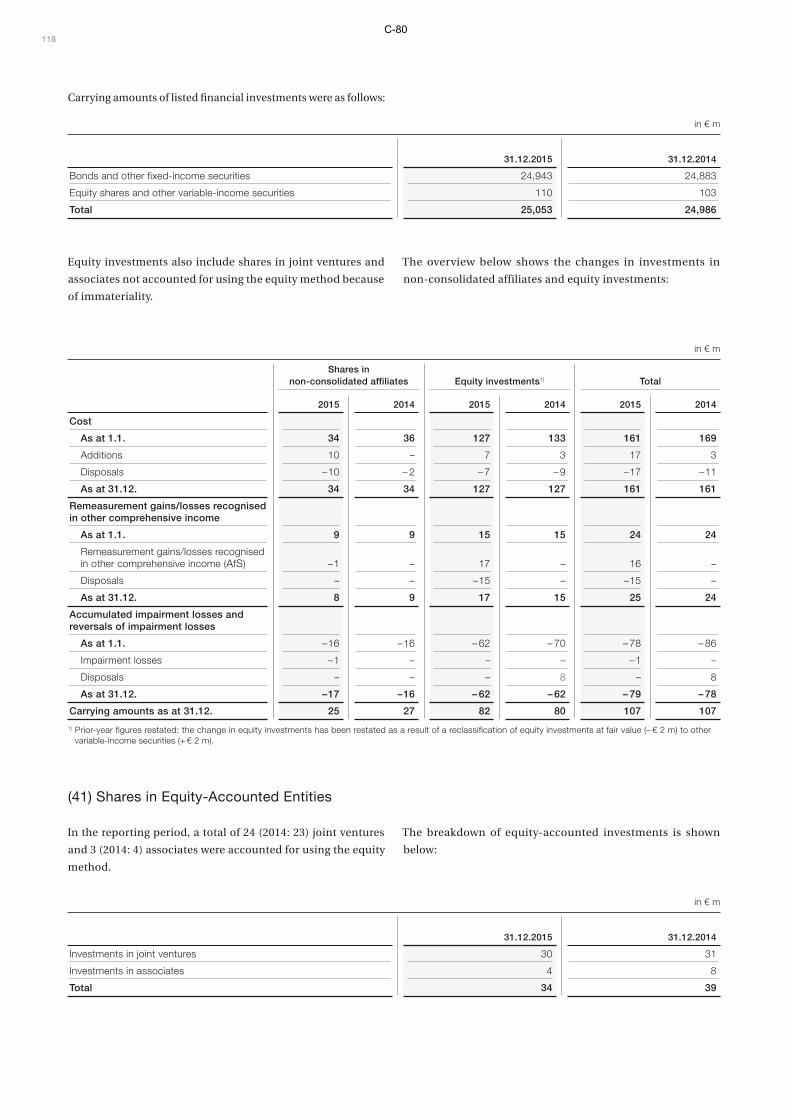
Carrying amounts of listed financial investments were as follows:
in € m
31.12.2015
31.12.2014
Bonds and other fixed-income securities 24,943 24,883
Equity shares and other variable-income securities 110 103
Total 25,053 24,986
Equity investments also include shares in joint ventures and
associates not accounted for using the equity method because
of immateriality.
The overview below shows the changes in investments in
non-consolidated affiliates and equity investments:
in € m
Shares in non-consolidated affiliates
Equity investments1)
Total
2015 2014 2015 2014 2015 2014
Cost
As at 1.1. 34 36 127 133 161 169
Additions 10 – 7 3 17 3
Disposals – 10 – 2 – 7 – 9 – 17 – 11
As at 31.12. 34 34 127 127 161 161
Remeasurement gains/losses recognised in other comprehensive income
As at 1.1. 9 9 15 15 24 24
Remeasurement gains/losses recognised in other comprehensive income (AfS) – 1 – 17 – 16 –
Disposals – – – 15 – – 15 –
As at 31.12. 8 9 17 15 25 24
Accumulated impairment losses and reversals of impairment losses
As at 1.1. – 16 – 16 – 62 – 70 – 78 – 86
Impairment losses – 1 – – – – 1 –
Disposals – – – 8 – 8
As at 31.12. – 17 – 16 – 62 – 62 – 79 – 78
Carrying amounts as at 31.12. 25 27 82 80 107 107
1) Prior-year figures restated: the change in equity investments has been restated as a result of a reclassification of equity investments at fair value (– € 2 m) to other variable- income securities (+ € 2 m).
(41) Shares in Equity-Accounted Entities
In the reporting period, a total of 24 (2014: 23) joint ventures
and 3 (2014: 4) associates were accounted for using the equity
method.
The breakdown of equity-accounted investments is shown
below:
in € m
31.12.2015
31.12.2014
Investments in joint ventures 30 31
Investments in associates 4 8
Total 34 39
118C-80

There are no listed companies among the equity-accounted
entities.
The share of losses of equity-accounted entities not recognised
for the current period amounted to € 7 m (2014: € 1 m); the
cumulative total of such unrecognised losses amounted to
€ 17 m as at 31 December 2015 (31 December 2014: € 13 m).
The table below contains summarised financial information
about equity-accounted joint ventures and associates based
on the separate or consolidated financial statements of the
equity-accounted entities and based on the Helaba Group’s
interest in the assets, liabilities, profit or loss from continuing
operations and comprehensive income.
in € m
31.12.2015
31.12.20141)
Investments in joint ventures – total
Total assets 276 326
Total liabilities 201 263
Profit or loss from continuing operations 23 8
Comprehensive income 23 8
Investments in joint ventures – proportionate
Total assets 152 175
Total liabilities 122 144
Profit or loss from continuing operations 12 4
Comprehensive income 12 4
1) Prior-year figures restated: total profit or loss from continuing operations and comprehensive income each adjusted by + € 16 m to + € 8 m, and pro rata figures each adjusted by + € 8 m to + € 4 m as a result of an adjustment in a group company.
in € m
31.12.2015
31.12.2014
Investments in associates – total
Total assets 876 1,274
Total liabilities 904 1,289
Profit or loss from continuing operations – 12 64
Other comprehensive income 8 37
Comprehensive income – 4 101
Investments in associates – proportionate
Total assets 414 609
Total liabilities 433 622
Profit or loss from continuing operations – 8 29
Other comprehensive income 4 18
Comprehensive income – 4 47
Notes Consolidated Financial Statements 119C-81

(42) Investment Property in € m
31.12.2015
31.12.2014
Land and buildings leased to third parties 1,826 1,835
Undeveloped land 55 43
Vacant buildings 3 4
Property under construction 62 27
Total 1,946 1,909
Of the total investment property, € 1,841 m (31 December 2014:
€ 1,800 m) was accounted for by real estate in the GWH Group.
The table below shows the changes in investment property:
in € m
2015
2014
Cost
As at 1.1. 2,241 2,190
Additions 103 84
Reclassifications to property held for sale – – 1
Disposals – 36 – 32
As at 31.12. 2,308 2,241
Accumulated depreciation and impairment losses
As at 1.1. – 332 – 305
Depreciation – 33 – 33
Impairment losses – 2 – 2
Disposals 5 8
As at 31.12. – 362 – 332
Carrying amounts as at 31.12. 1,946 1,909
There were contractual obligations amounting to € 118 m
(31 December 2014: € 57 m) to purchase, construct, or develop
investment property.
As at the reporting date, the fair values of the properties
amounted to € 2,906 m (31 December 2014: € 2,593 m) and were
allocated to Level 3.
The fair value of investment property is calculated using inter-
nationally recognised valuation methodologies. The vast ma-
jority of the residential buildings, commercial properties,
parking facilities and undeveloped land areas in the Group’s
portfolio are valued by independent experts on the basis of
market values, mainly by using the discounted cash flow
method. In this method, the fair value is calculated by deter-
mining the present value of the rental income achievable over
the long term, taking into account management costs and
forecast property vacancy rates.
For the purposes of the calculation, the properties are struc-
tured according to a location and property appraisal and sub-
divided into clusters. This is based on the following par ameters:
market (macro location), site (micro location), property and
cash flow quality. Properties are thus grouped, each of the
properties within a particular group sharing similar character-
istics. The groups differ in terms of position, quality of manage-
ment unit and therefore also in terms of their respective risk.
In 2015, the following details (unchanged compared with 2014)
were determined and applied on the basis of the resulting
clusters:
■■ annual rates of increase for rent;
■■ non-allocatable operating costs;
■■ effective vacancy rates;
■■ discount rates.
120C-82

The following details were determined and applied on the basis
of the properties:
■■ market rent as at the valuation date;
■■ maintenance, management and other costs;
■■ trends in the rent per square metre of rentable area based on
an extrapolation of market rents and current rents;
■■ trends in vacant property levels based on cluster-specific
assumptions regarding target vacancy level;
■■ trends in costs for maintenance, management, non-allocat-
able operating costs, other costs and any ground rent.
The cash flow is determined in two stages. The first stage com-
prises a detailed forecast period of ten years in which the cash
inflows from the current target rent based on full occupancy
are reduced by the effect of the current vacancy level in the first
year and then the assumed structural vacancy levels in years
two to ten. The resulting amount reduced by management
costs, non-allocatable operating costs, maintenance and repair
costs and ground rent produces the available cash flow (before
taxes and debt servicing) which can then be discounted. In the
eleventh year, the methodology assumes a hypothetical dis-
posal of the property and the sale price is used as a residual
value in the calculation. The total of the present values from
the cash flows in the detailed forecast period and from the
hypothetical resale of the property represent the fair value of
the property concerned.
The discount rate comprises a risk-free interest rate together
with mark-ups and discounts for existing property, location
and market risks.
(43) Property and Equipment in € m
31.12.2015
31.12.2014
Owner-occupied land and buildings 368 378
Operating and office equipment 57 59
Assets used for leasing – 6
Total 425 443
The changes in property and equipment were as follows:
in € m
Owner-occupied land and buildings
Operating and office equipment
Assets used for leasing Total
2015 2014 2015 2014 2015 2014 2015 2014
Cost
As at 1.1. 555 553 205 210 17 17 777 780
Changes in basis of consolidation – – – – – 8 – – 8 –
Changes due to currency translation 1 2 1 1 – – 2 3
Additions – – 11 11 – – 11 11
Disposals – – – 9 – 17 – 9 – – 18 – 17
As at 31.12. 556 555 208 205 – 17 764 777
Accumulated depreciation and impairment losses
As at 1.1. – 177 – 170 – 146 – 148 – 11 – 10 – 334 – 328
Changes in basis of consolidation – – – – 5 – 5 –
Changes due to currency translation – 1 – 1 – 1 – 1 – – – 2 – 2
Depreciation – 10 – 10 – 13 – 13 – – – 23 – 23
Impairment losses – – – – – – 1 – – 1
Reversals of impairment losses – 4 – – – – – 4
Disposals – – 9 16 6 – 15 16
As at 31.12. – 188 – 177 – 151 – 146 – – 11 – 339 – 334
Carrying amounts as at 31.12. 368 378 57 59 – 6 425 443
Notes Consolidated Financial Statements 121C-83
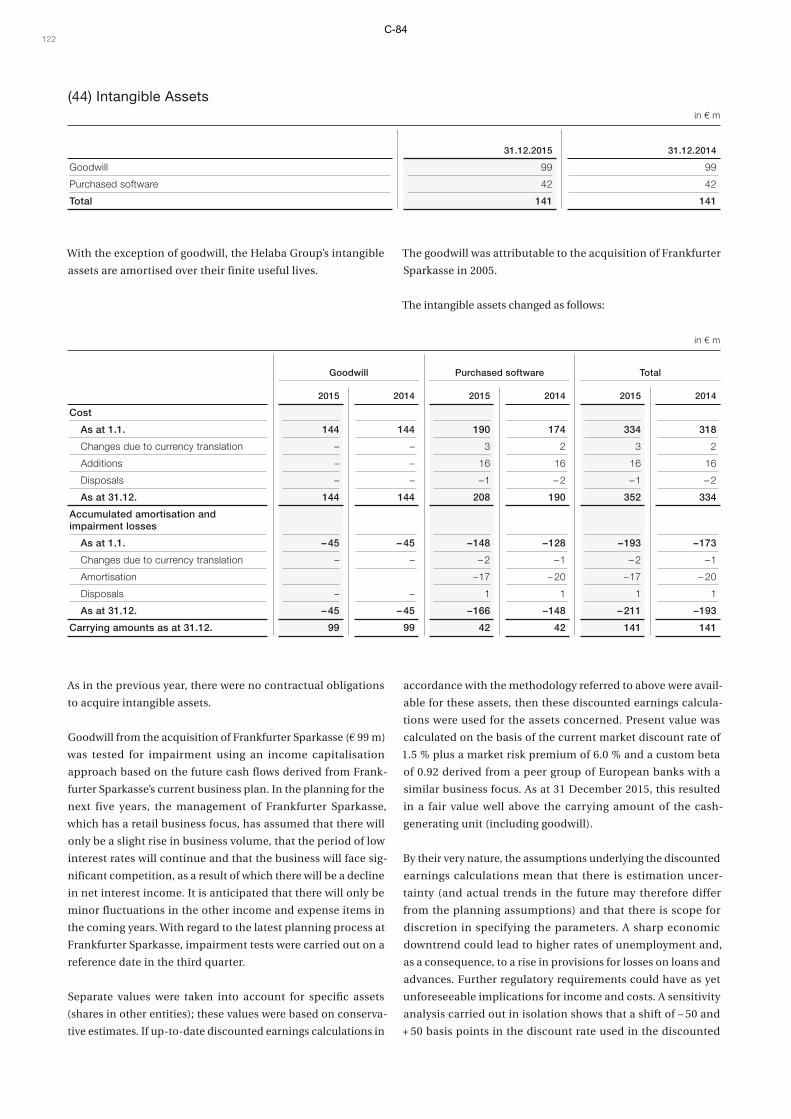
(44) Intangible Assets in € m
31.12.2015
31.12.2014
Goodwill 99 99
Purchased software 42 42
Total 141 141
With the exception of goodwill, the Helaba Group’s intangible
assets are amortised over their finite useful lives.
The goodwill was attributable to the acquisition of Frankfurter
Sparkasse in 2005.
The intangible assets changed as follows:
in € m
Goodwill
Purchased software
Total
2015 2014 2015 2014 2015 2014
Cost
As at 1.1. 144 144 190 174 334 318
Changes due to currency translation – – 3 2 3 2
Additions – – 16 16 16 16
Disposals – – – 1 – 2 – 1 – 2
As at 31.12. 144 144 208 190 352 334
Accumulated amortisation and impairment losses
As at 1.1. – 45 – 45 – 148 – 128 – 193 – 173
Changes due to currency translation – – – 2 – 1 – 2 – 1
Amortisation – 17 – 20 – 17 – 20
Disposals – – 1 1 1 1
As at 31.12. – 45 – 45 – 166 – 148 – 211 – 193
Carrying amounts as at 31.12. 99 99 42 42 141 141
As in the previous year, there were no contractual obligations
to acquire intangible assets.
Goodwill from the acquisition of Frankfurter Sparkasse (€ 99 m)
was tested for impairment using an income capitalisation
approach based on the future cash flows derived from Frank-
furter Sparkasse’s current business plan. In the planning for the
next five years, the management of Frankfurter Sparkasse,
which has a retail business focus, has assumed that there will
only be a slight rise in business volume, that the period of low
interest rates will continue and that the business will face sig-
nificant competition, as a result of which there will be a decline
in net interest income. It is anticipated that there will only be
minor fluctuations in the other income and expense items in
the coming years. With regard to the latest planning process at
Frankfurter Sparkasse, impairment tests were carried out on a
reference date in the third quarter.
Separate values were taken into account for specific assets
(shares in other entities); these values were based on conserva-
tive estimates. If up-to-date discounted earnings calculations in
accordance with the methodology referred to above were avail-
able for these assets, then these discounted earnings calcula-
tions were used for the assets concerned. Present value was
calculated on the basis of the current market discount rate of
1.5 % plus a market risk premium of 6.0 % and a custom beta
of 0.92 derived from a peer group of European banks with a
similar business focus. As at 31 December 2015, this resulted
in a fair value well above the carrying amount of the cash-
generating unit (including goodwill).
By their very nature, the assumptions underlying the discounted
earnings calculations mean that there is estimation uncer-
tainty (and actual trends in the future may therefore differ
from the planning assumptions) and that there is scope for
discretion in specifying the parameters. A sharp economic
downtrend could lead to higher rates of unemployment and,
as a consequence, to a rise in provisions for losses on loans and
advances. Further regulatory requirements could have as yet
unforeseeable implications for income and costs. A sensitivity
analysis carried out in isolation shows that a shift of – 50 and
+ 50 basis points in the discount rate used in the discounted
122C-84

earnings calculation for goodwill (excluding special assets of
Frankfurter Sparkasse) would lead to a variance of around
€ 50 m. Even if the lower value were to materialise, this would
still not give rise to a requirement for the recognition of an
impairment loss.
(45) Income Tax Assetsin € m
31.12.2015 31.12.2014
Current income tax assets 30 41
Deferred income tax assets 465 330
Total 495 371
The deferred income tax assets relate to the following items:
in € m
31.12.2015 31.12.2014
Loans and advances to banks and customers 70 6
Trading assets/liabilities and derivatives 1,311 1,542
Financial investments 103 99
Other assets 86 84
Liabilities due to banks and customers 304 413
Provisions for pensions 298 318
Sundry provisions 34 37
Other liabilities 66 63
Tax loss carryforwards 14 20
Deferred tax assets, gross 2,286 2,582
Netted against deferred tax liabilities – 1,821 – 2,252
Total 465 330
thereof: Non-current 439 306
Deferred tax assets and deferred tax liabilities have been offset
in accordance with IAS 12.74.
The calculation of deferred tax assets for the domestic and
foreign reporting units was based on individual tax rates. In
Germany, the Bank had a combined income tax rate in 2015 of
31.7 % (2014: 31.7 %) with an average municipality trade tax
multiplier of 452 % (2014: 452 %).
In the case of deferred tax assets, the recovery of which depends
on future taxable profits that extend beyond the impact on
earnings from the reversal of taxable temporary differences in
existence on the reporting date, the Helaba Group only recog-
nises such deferred tax assets to the extent that it is reasonably
certain they could be utilised. If the deferred tax assets are to
be utilised, there must be sufficient taxable profits in the fore-
seeable future against which the associated tax loss carryfor-
wards can be offset. In this regard, the Helaba Group generally
uses a planning horizon of five years.
As at the reporting date Helaba had recognised deferred tax
assets of € 3 m (31 December 2014: € 13 m) in respect of corpo-
rate income tax loss carryforwards of € 18 m (31 December
2014: € 64 m) and deferred tax assets of € 11 m (31 December
2014: € 7 m) in respect of trade tax loss carryforwards of € 98 m
(31 December 2014: € 81 m).
Overall, no deferred tax assets had been recognised in respect
of corporate income tax loss carryforwards of € 67 m (31 De-
cember 2014: € 68 m) and in respect of trade tax loss carryfor-
wards of € 71 m (31 December 2014: € 50 m) because Helaba
did not believe there was sufficient probability of taxable profits
in the foreseeable future against which these tax loss carryfor-
wards could be used. There is no time limit for the utilisation
of loss carryforwards.
As at the reporting date, deferred income tax assets of € 183 m
were recognised in other comprehensive income (31 December
2014: € 212 m).
Notes Consolidated Financial Statements 123C-85

(46) Other Assets in € m
31.12.2015
31.12.2014
Property held for sale 278 421
Completed property 18 156
Property under construction 260 265
Advance payments and payments on account 69 65
Trade accounts receivable 51 41
Other taxes receivable (excl. income taxes) 3 19
Other assets 524 646
Total 925 1,192
The decline in the portfolio of completed property was largely
attributable to the deconsolidation of real estate entities.
(47) Liabilities Due to Banks in € m
31.12.2015
31.12.2014
Central banks 2,450 2,858
Affiliated Sparkassen 6,626 6,539
Central giro institutions 718 1,595
Banks 26,182 24,620
Total 35,976 35,612
thereof:
Domestic banks 32,610 31,001
Foreign banks 3,366 4,611
in € m
31.12.2015
31.12.2014
Amounts payable on demand 6,715 5,984
Amounts due with an agreed maturity or period of notice 29,261 29,628
Total 35,976 35,612
thereof:
Promissory note loans raised 4,405 6,352
Forwarding loans 7,410 7,772
Issued registered bonds 2,555 2,792
Liabilities from securities repurchase transactions (repos) 3,602 896
Overnight and time deposits 4,666 5,510
Sight deposits 5,783 5,067
124C-86

(48) Liabilities Due to Customers in € m
31.12.2015
31.12.2014
Corporate customers 27,419 25,856
Retail customers 16,616 15,983
Public sector 3,692 3,481
Total 47,727 45,320
thereof:
Domestic customers 44,304 42,562
Foreign customers 3,423 2,758
in € m
31.12.2015
31.12.2014
Amounts payable on demand 23,682 20,103
Amounts due with an agreed maturity or period of notice 24,045 25,217
Total 47,727 45,320
thereof:
Sight deposits 13,044 9,980
Overnight and time deposits 14,729 13,395
Savings deposits 1,870 2,000
Home savings deposits 4,230 4,098
Issued registered bonds 10,452 11,281
Promissory note loans raised 2,211 3,261
(49) Securitised Liabilities in € m
31.12.2015
31.12.2014
Bonds issued 39,992 45,271
Mortgage Pfandbriefe 6,964 4,096
Public Pfandbriefe 14,443 14,806
Other debt instruments 18,585 26,369
Issued money market instruments 7,081 3,049
Total 47,073 48,320
The issued money market instruments included certificates
of deposits (€ 3,840 m), commercial paper (€ 2,162 m), asset-
backed commercial paper (€ 879 m) and other money market
instruments (€ 200 m). For detailed disclosures on issuance
activities see Note (69).
Notes Consolidated Financial Statements 125C-87

(50) Trading Liabilities in € m
31.12.2015
31.12.2014
Negative fair values of derivatives 10,390 12,727
Share-price derivatives 165 117
Interest-rate derivatives 9,172 11,589
Currency derivatives 1,016 989
Credit derivatives 29 25
Commodity derivatives 8 7
Issued money market instruments 4,535 1,889
Issued equity/index certificates 129 130
Liabilities held for trading 7,369 14,473
Total 22,423 29,219
This item solely comprises financial instruments classified as
financial liabilities at fair value through profit or loss (held-for-
trading sub-category). The liabilities held for trading mainly
comprise money trading transactions.
(51) Negative Fair Values of Non-Trading Derivatives in € m
31.12.2015
31.12.2014
Hedging derivatives under hedge accounting 369 553
Other non-trading derivatives 4,011 4,798
Total 4,380 5,351
The hedging derivatives under hedge accounting are used
within the framework of qualifying micro fair value hedges
under IAS 39. Other non-trading derivatives comprise deriva-
tive financial instruments used as economic hedges as part of
hedge management, although fulfilment of the hedge account-
ing requirements is not documented in accordance with IAS 39.
(52) Provisions in € m
31.12.2015
31.12.2014
Provisions for pensions and similar obligations 1,657 1,713
Other provisions 432 439
Personnel provisions 127 100
Provisions for lending business risks 44 58
Restructuring provisions 23 56
Provisions for litigation risks 57 57
Sundry provisions 181 168
Total 2,089 2,152
126C-88

In 2015, the changes in provisions for pensions and similar
obligations reported in the statement of financial position
were as follows:
in € m
DBO Plan assets
Amount not recognised (IAS 19.64)
Net defined benefit liability
As at 1.1. 2,037 – 324 – 1,713
Total pension cost 83 – 8 – 75
Interest expense (+)/interest income (–) 46 – 8 – 38
Current service cost 37 37
Total gains or losses on remeasurement – 77 – – – 77
Actuarial gains (–)/losses (+) on financial assumptions – 103 – 103
Actuarial gains (–)/losses (+) on demographic assumptions 7 7
Experience adjustment gains (–)/losses (+) 19 19
Employee contributions 5 – 5 –
Employer contributions – – 8 – 8
Benefits paid – 55 7 – 48
Changes due to currency translation 9 – 7 – 2
As at 31.12. 2,002 – 345 – 1,657
The corresponding changes in 2014 were as follows:
in € m
DBO Plan assets
Amount not recognised (IAS 19.64)
Net defined benefit liability
As at 1.1. 1,538 – 303 23 1,258
Total pension cost 76 – 11 – 65
Interest expense (+) / interest income (–) 57 – 11 – 46
Current service cost 29 29
Past service cost from plan adjustments – 10 – 10
Total gains or losses on remeasurement 472 – 5 – 23 444
Actuarial gains (–)/losses (+) on financial assumptions 462 462
Actuarial gains (–)/losses (+) on demographic assumptions – 1 – 1
Experience adjustment gains (–)/losses (+) 11 11
Gains or losses on remeasurement of plan assets – 5 – 5
Gains or losses on remeasurement of amount not recognised (IAS 19.64) – 23 – 23
Employee contributions 4 – 4 –
Employer contributions – – 8 – 8
Benefits paid – 57 11 – 46
Changes due to currency translation 4 – 4 – –
As at 31.12. 2,037 – 324 – 1,713
Notes Consolidated Financial Statements 127C-89
The main defined benefit plans (in the form of direct commit-
ments) at Landesbank Hessen-Thüringen are as follows:
In the case of employees who joined the Bank on or before
31 December 1985 and who are eligible for pension benefits,
there is a fully dynamic comprehensive defined benefit plan,
in which the annual benefits payable under the plan are up to
a maximum of 75 % of the pensionable remuneration on retire-
ment date, subject to deduction of third-party pension entitle-
ments. During the period in which a pension is drawn, pension
benefits are increased in line with any pay-scale increases.
The existing beneficiaries are primarily retirees and surviving
dependants. However, there is also a small proportion of bene-
ficiaries who are still active or who have left the Bank but have
retained vested entitlements.
The retirement benefit system in place between 1986 and 1998
is a scheme based on final salary with a split pension benefits
formula. The annual pension benefits are linked to a certain
percentage of pensionable remuneration earned for each year
of service depending on the contribution assessment ceiling
in the statutory pension insurance scheme (salary components
above the ceiling being weighted differently from those below the
ceiling). The plan is based on a maximum of 35 years of service
and pension benefits rise in line with pay-scale increases
during the period in which the benefits are drawn. The existing
beneficiaries are predominantly current employees and indi-
viduals who have left the Bank but have vested rights.
For the defined benefit plan in force since 1999, the retirement
pension is calculated by adding all the pension credits accrued
during the pensionable period of service. The pension credits
are determined by multiplying the pensionable remuneration
for the respective calendar year by an age-dependent factor.
During the period in which the pension is drawn, the benefits
are subject to an annual increase of one percent. The plan is
open to new members. The current members of the scheme are
almost exclusively active employees and individuals who have
left the Bank but have vested rights.
In addition, the Helaba Group has individual commitments to
pay annual pension benefits. These commitments for the most
part involve comprehensive defined benefit plans similar to
those used by the civil service in Germany in which the benefits
represent the difference between a target pension and the stat-
utory pension entitlement and in which the pension benefits
are increased in line with pay-scale increases during the period
in which pensions are drawn. The existing beneficiaries under
these plans are mainly retirees, surviving dependants and in-
dividuals who have left the Bank but still have vested rights.
However, the plans remain open to new members.
As a result of the takeover of the S-Group Bank business, the
transfer of the business unit in accordance with section 613a
BGB meant that the pension obligations of Portigon AG to the
new employees were also transferred to Helaba.
Employees who, as a result of the break-up of Westdeutsche
Landesbank Girozentrale into the public-law Landesbank NRW
(currently NRW.Bank) and the private-law WestLB AG (cur-
rently Portigon AG) in 2002, were assigned to NRW.Bank were
put on special leave so that they could enter into a second em-
ployment relationship with Portigon AG (VBB dual contract
holders). The pension commitments are maintained by NRW.
Bank without change. Economically, however, the costs are
charged to Helaba because NRW.Bank has to be reimbursed for
the pension payments it has to make.
For the vested pension rights of the other employees, the ac-
crued entitlement was determined at the time of transfer of the
business unit and the corresponding obligation was transferred
to Helaba. The externally funded vested pension rights vis-à-vis
BVV Versorgungskasse des Bankgewerbes e. V., Berlin, were ex-
empted from contributions as from the date of the transfer of
the business unit. As from the date of transfer of the business
unit, the employees were registered with Helaba’s company pen-
sion scheme under the service agreement in force since 1999.
There is also an employee-funded pension plan in the form of
a deferred compensation scheme in which the benefits com-
prise lump-sum capital payments. In this case, investment
fund units are purchased for each amount of deferred compen-
sation and an age-dependent capital component is calculated
for the employee concerned. Upon retirement, the employee
is paid the higher of the total capital components or the fund
assets. The deferred compensation scheme is open to new
members.
At Frankfurter Sparkasse, all employees are entitled to a pen-
sion from the pension fund. Frankfurter Sparkasse has a regu-
lated pension fund. The pension fund’s obligation to regularly
adjust the lifetime benefits is implemented in the form of a
direct commitment by Frankfurter Sparkasse. Employees of the
former Stadtsparkasse Frankfurt are entitled to a pension from
Zusatzversorgungskasse der Stadt Frankfurt (ZVK Frankfurt),
which Helaba identified as an obligation during the course of
its acquisition of Frankfurter Sparkasse and recognises in its
statement of financial position. There are also individual com-
mitments, largely in the form of comprehensive defined benefit
plans (in which the benefits represent the difference between
a target pension and third-party pension entitlements) and an
employee-funded pension plan.
Employees at the London branch are members of a defined
benefit plan, although the plan is now closed to new entrants.
This plan is a pension fund that follows local measurement ar-
rangements. It is reviewed at regular intervals to ensure that it
meets the requirements for external financing. In the past,
some use has been made of pension buyouts when an em-
ployee leaves the Bank. Under such a buyout arrangement, the
Bank makes a settlement payment to a third-party pension
provider to release itself from its liability under the plan and
transfer the obligation to the new provider.
128C-90

At the subsidiary Frankfurter Bankgesellschaft (Schweiz) AG,
the statutory requirements related to occupational pensions
are satisfied by a separate pension scheme linked to a collec-
tive arrangement under the auspices of a third-party provider.
The following table shows the funding status of the pension
plans as at 31 December 2015:
in € m
DBO Plan assets
Amount not recognised (IAS 19.64)
Net defined benefit liability
Domestic defined benefit plans 1,874 – 245 – 1,629
Landesbank Hessen-Thüringen 1,327 – 30 – 1,297
Comprehensive defined benefit plans 860 – – 860
Defined benefit plan up to 1985 743 – – 743
Individual commitments 82 – – 82
VBB dual contract holders 35 – – 35
Final salary plans (Retirement pension scheme 1986 – 1998) 196 – – 196
Pension credit system (Retirement pension scheme from 1999) 174 – – 174
Other plans 97 – 30 – 67
Frankfurter Sparkasse 483 – 208 – 275
Frankfurter Sparkasse pension fund 228 – 207 – 21
Pension fund adjustment obligation 81 – – 81
ZVK Frankfurt 93 – – 93
Individual commitments 70 – – 70
Other plans 11 – 1 – 10
Other Group companies 64 – 7 – 57
Foreign defined benefit plans 128 – 100 – 28
Total 2,002 – 345 – 1,657
The corresponding figures as at 31 December 2014 were as
follows:
in € m
DBO Plan assets
Amount not recognised (IAS 19.64)
Net defined benefit liability
Domestic defined benefit plans 1,928 – 240 – 1,688
Landesbank Hessen-Thüringen 1,373 – 27 – 1,346
Comprehensive defined benefit plans 914 – – 914
Defined benefit plan up to 1985 793 – – 793
Individual commitments 86 – – 86
VBB dual contract holders 35 – – 35
Final salary plans (Retirement pension scheme 1986 – 1998) 206 – – 206
Pension credit system (Retirement pension scheme from 1999) 169 – – 169
Other plans 84 – 27 – 57
Frankfurter Sparkasse 489 – 208 – 281
Frankfurter Sparkasse pension fund 226 – 207 – 19
Pension fund adjustment obligation 82 – – 82
ZVK Frankfurt 98 – – 98
Individual commitments 72 – – 72
Other plans 11 – 1 – 10
Other Group companies 66 – 5 – 61
Foreign defined benefit plans 109 – 84 – 25
Total 2,037 – 324 – 1,713
Notes Consolidated Financial Statements 129C-91

The following table shows the breakdown of plan assets:
in € m
31.12.2015
31.12.2014
Plan assets quoted in active markets 296 282
Cash reserve 25 16
Bonds and other fixed-income securities 187 198
Equity shares and other variable-income securities 83 67
Other assets 1 1
Other plan assets 49 42
Qualifying insurance contracts 49 42
Fair value of plan assets 345 324
Of the plan assets, € 16 m (31 December 2014: € 27 m) was
accounted for by the Group’s own transferable financial instru-
ments; as in 2014, no investments were made in other assets
used by the Group itself.
For the next financial year, Helaba expects to make contribu-
tions to plan assets of € 7 m (31 December 2014: € 8 m).
Pension obligations for which there are no plan assets in
accordance with IAS 19 are funded for the most part by long-
term special funds with an investment focus on bonds.
The Helaba Group’s pension obligations are exposed to various
risks. This exposure is attributable to general market volatility
and also specific risks. However, there are no extraordinary
risks arising in connection with pension obligations.
Risks from general market volatility mostly involve risks arising
from changes in the inflation rate and market interest rates.
Other risks include the risk of longevity, for example.
■■ General market volatility
The main impact from general market volatility on the level
of the defined benefit obligations is through changes in the
discount rate. Over the last few years there has already been
a noticeable increase in pension provisions as a result of the
general fall in discount rates. The principal reason why
discount rates have such a significant impact on defined
benefit obligations is the length of the maturities involved
in these obligations.
■■ Inflation risk – pension adjustment
The Helaba Group applies the principles in the German
Occupational Pensions Act (Betriebsrentengesetz, BetrAVG)
when determining adjustments as part of benefit reviews for
its defined benefit plans. The more recent schemes, which
are structured as pension credit systems, are subject to fixed
adjustment rates and thus are largely independent of the
inflation rate and future pay-scale increases.
■■ Inflation risk – salary increases, pay scale increases, increases
in civil servant remuneration
In most of the older pension arrangements (comprehensive
defined benefit plan up to 1985 and final salary plan), Helaba
increases pensions in line with pay-scale trends in both pri-
vate and public-sector banks. Increases in pay scales cover-
ing pensionable salaries therefore have an effect on the level
of current pension benefits. Individual defined benefit plans
provide for the adjustment of pensions on the basis of civil
service pay in accordance with the regulations in the federal
state concerned (Hesse, Thuringia, North Rhine-Westphalia).
■■ Risk of longevity
Given that by far the most common form of benefit is an
annuity, Helaba bears the risk that the beneficiaries will live
longer than the period estimated in the actuarial calcula-
tions. Normally, this risk balances out across all the bene-
ficiaries as a whole and only becomes material if general life
expectancy turns out to be higher than forecast.
As far as specific risks are concerned, it is worth mentioning
that defined benefit obligations are to a certain extent depen-
dent on external factors. In addition to the factors already
referred to (adjustments related to pay-scale increases or
increases in civil servant pay), there are other influences sub-
ject to variation beyond the control of Helaba. This is particu-
larly true in the case of changes to statutory pensions and other
externally funded pensions, which are offset as part of the
comprehensive defined benefit plans. Helaba must bear the
risk in this regard.
130C-92

The principal actuarial assumptions on which the measure-
ment of the defined benefit obligations is based are shown in
the following table (weighted average rates):
in %
31.12.2015 31.12.2014
Discount rate 2.5 2.3
Salary trend 2.4 2.3
Pension trend 1.7 1.8
Employee turnover rate 2.9 2.9
In both 2015 and 2014, the probability of invalidity and death
in Germany was based on the 2005 generation mortality tables
published by Professor Dr. Heubeck.
Changes in the main actuarial assumptions would have the
following effects on the present value of all the defined benefit
obligations:
in € m
31.12.2015 31.12.2014
Discount rate (decreased by 50 basis points) 199 205
Salary trend (increased by 25 basis points) 77 75
Pension trend (increased by 25 basis points) 83 81
Life expectancy (improved by 10 %) 76 76
Employee turnover rate (decreased by 50 basis points) 9 9
The sensitivity analysis shown above reflects the change in one
assumption, all the other assumptions remaining as in the
original calculation. In other words, the analysis does not fac-
tor in any possible correlation effects between the individual
assumptions.
As at 31 December 2015, the weighted average maturity of the
defined benefit obligations was 18.9 years (31 December 2014:
19.4 years). The following table shows the maturity structure of
the forecast pension payments:
in € m
31.12.2015 31.12.2014
Forecast pension payments with maturities of up to one year 58 58
Forecast pension payments with maturities of one year to five years 268 263
Forecast pension payments with maturities of five years to ten years 413 425
The Helaba Group participates in multi-employer defined
bene fit plans. These plans are treated as if they were defined
contribution plans. They involve membership of pay-as-you-go
pension schemes in the form of regulated pension funds that
switched to an “as funded” basis on 1 January 2002. The funds
concerned are the regional supplementary pension funds and
Versorgungsanstalt des Bundes und der Länder, all of which
have similar statutes in terms of content. With the switch to
the “as funded” basis, the existing defined benefit obligations
were converted to a defined contribution system. The statutes
authorise the collection of additional contributions if neces-
sary in order to fund agreed benefits; alternatively, benefits can
be reduced if there is insufficient cover in the fund (recovery
money, recovery clause). There is no allocation of assets and
liabilities according to originator. The pension fund publishes
information on its business performance and risk trends solely
in an annual report. It does not disclose any further informa-
tion. As in 2014, expenses amounting to € 1 m were incurred in
connection with these plans.
Notes Consolidated Financial Statements 131C-93

There are also defined contribution plans arising from Helaba’s
membership of BV V Versicherungsverein des Bankgewerbes
a. G. and further defined contribution plans that are externally
funded through direct insurance with insurers subject to pub-
lic law. As far as possible, these arrangements are through
SV SparkassenVersicherung and Provinzial Lebensversicherung
AG. The foreign branches in London and New York also have
their own defined contribution plans. The total expenses in
2015 for defined contribution plans were € 4 m (2014: € 3 m).
The employer subsidy for pension insurance in 2015 amounted
to € 34 m, the same amount as in 2014.
The changes in other provisions were as follows:
in € m
Personnel provisions
Provisions for lending business risks
Restructuring provisions
2015 2014 2015 2014 2015 2014
As at 1.1. 100 98 58 77 56 18
Changes due to currency translation 1 1 1 1 – –
Use – 70 – 68 – – 3 – 1 –
Reversals – 1 – 1 – 25 – 20 – –
Reclassifications 36 3 – 6 – 9 – 37 – 3
Interest cost – 1 – – – 1
Additions 61 66 16 12 5 40
As at 31.12. 127 100 44 58 23 56
in € m
Provisions for litigation risks Sundry provisions Total
2015 2014 2015 2014 2015 2014
As at 1.1. 57 36 168 136 439 365
Changes in basis of consolidation – – – 7 – – 7 –
Changes due to currency translation – – 1 1 3 3
Use – 19 – 31 – 62 – 80 – 152 – 182
Reversals – 2 – 2 – 7 – 9 – 35 – 32
Reclassifications – 2 – 7 – 7 –
Interest cost 2 1 1 1 3 4
Additions 19 51 87 112 188 281
As at 31.12. 57 57 181 168 432 439
The personnel provisions relate primarily to provisions for par-
tial and early retirement, long-service bonuses and special
payments to employees. The sundry provisions mainly relate
to obligations in connection with share transactions, obliga-
tions to deposit guarantee schemes as well as risks related to
real estate projects and lease agreements.
The restructuring provisions largely relate to the Helaba PRO
programme initiated in 2013, the objectives of which are to
optimise costs by using more efficient processes and to reduce
complexity.
Additions to and reversals of personnel provisions are normally
reported under personnel expenses, those relating to provi-
sions for lending business risks under provisions for losses on
loans and advances, and those relating to restructuring provi-
sions and sundry provisions under other net operating income.
Interest costs (unwinding of discount) are included in net in-
terest income.
Claims are pursued against Helaba before the courts and in
arbitration proceedings. Provisions for litigation risks have
been recognised if it is estimated that the probability of a suc-
cessful claim is greater than 50 %.
The amount of the provision is the amount that the Bank is likely
to have to pay in the event of a successful claim. The provisions
for litigation risks recognised by Helaba also take into account
amounts to cover litigation costs (court costs and other expenses
in connection with litigation, such as legal and other fees).
132C-94

Helaba has recognised provisions for litigation risks mainly to
cover lawsuits brought by investors in closed funds. Investors
who believe that their expectations with regard to a particular
investment have not been met base their claims on non-com-
pliance with consumer protection regulations. Depending on
the circumstances in each individual case, the Bank will exam-
ine the possibility of settling a claim in terms of the nature and
scope of a potential settlement. Helaba will not provide a
detailed description here of individual cases or proceedings,
nor a breakdown of the overall amount for the provision for
litigation risks. Claimants could otherwise draw conclusions
about the Bank’s litigation and settlement strategy.
The provisions for litigation risks are reviewed quarterly to en-
sure they are appropriate. The provisions may be increased or
reversed on the basis of management assessments taking into
account the legal situation. The final costs incurred in connec-
tion with litigation risks could differ from the recognised provi-
sions because an assessment of probability and the determi-
nation of figures for uncertain liabilities arising from litigation
to a large degree requires measurements and estimates that
could prove to be inaccurate as litigation proceedings progress.
Cases that do not meet the criteria for the recognition of provi-
sions are reviewed to establish whether they need to be dis-
closed under contingent liabilities and, where appropriate, are
included in the information disclosed in Note (72).
Of the total for other provisions, current provisions accounted
for € 263 m (31 December 2014: € 224 m).
(53) Income Tax Liabilities in € m
31.12.2015
31.12.2014
Current income tax liabilities 175 117
Deferred income tax liabilities 9 8
Total 184 125
The deferred income tax liabilities relate to the following items:
in € m
31.12.2015
31.12.2014
Loans and advances to banks and customers 56 109
Trading assets/liabilities and derivatives 1,557 1,876
Financial investments 165 221
Other assets 32 34
Liabilities due to banks and customers 7 7
Provisions for pensions 1 1
Sundry provisions 2 4
Other liabilities 10 8
Deferred tax liabilities, gross 1,830 2,260
Netted against deferred tax assets – 1,821 – 2,252
Total 9 8
thereof: Non-current 9 5
For the measurement of temporary differences, which give rise
to deferred income tax liabilities, please refer to the disclosures
on deferred income tax assets (see Note (45)).
As at the reporting date, deferred income tax liabilities of
€ 96 m were recognised in other comprehensive income (31 De-
cember 2014: € 121 m).
Notes Consolidated Financial Statements 133C-95
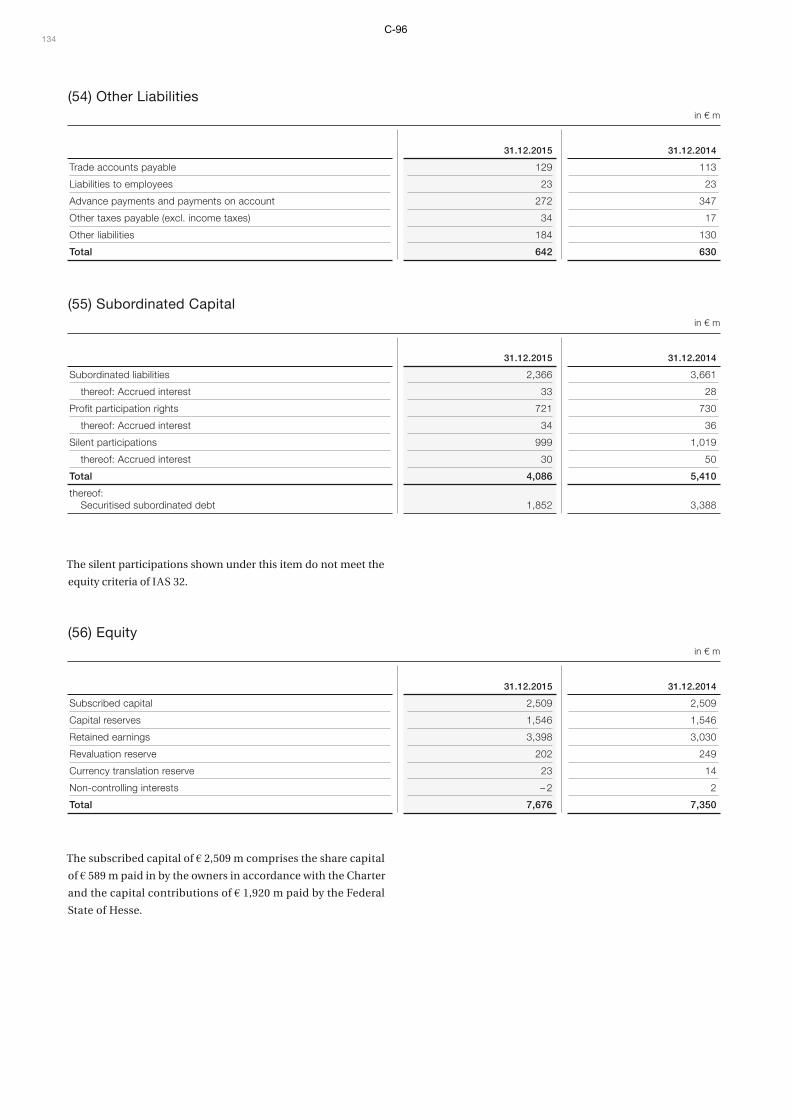
(54) Other Liabilities in € m
31.12.2015
31.12.2014
Trade accounts payable 129 113
Liabilities to employees 23 23
Advance payments and payments on account 272 347
Other taxes payable (excl. income taxes) 34 17
Other liabilities 184 130
Total 642 630
(55) Subordinated Capital in € m
31.12.2015
31.12.2014
Subordinated liabilities 2,366 3,661
thereof: Accrued interest 33 28
Profit participation rights 721 730
thereof: Accrued interest 34 36
Silent participations 999 1,019
thereof: Accrued interest 30 50
Total 4,086 5,410
thereof: Securitised subordinated debt 1,852 3,388
The silent participations shown under this item do not meet the
equity criteria of IAS 32.
(56) Equity in € m
31.12.2015
31.12.2014
Subscribed capital 2,509 2,509
Capital reserves 1,546 1,546
Retained earnings 3,398 3,030
Revaluation reserve 202 249
Currency translation reserve 23 14
Non-controlling interests – 2 2
Total 7,676 7,350
The subscribed capital of € 2,509 m comprises the share capital
of € 589 m paid in by the owners in accordance with the Charter
and the capital contributions of € 1,920 m paid by the Federal
State of Hesse.
134C-96

As at 31 December 2015, the share capital was attributable to
the owners as follows:
in € m in %
Sparkassen- und Giroverband Hessen-Thüringen 405 68.85
State of Hesse 48 8.10
Rheinischer Sparkassen- und Giroverband 28 4.75
Sparkassenverband Westfalen-Lippe 28 4.75
Fides Beta GmbH 28 4.75
Fides Alpha GmbH 28 4.75
State of Thuringia 24 4.05
Total 589 100.00
The capital reserves comprise the premiums from issuing share
capital to the owners.
The retained earnings comprise the profits retained by the
parent company and the consolidated subsidiaries as well as
amounts from the amortised results of acquisition accounting
and other consolidation adjustments. In addition, retained
earnings also include remeasurement gains or losses on
defined benefit obligations, which have to be recognised in
other comprehensive income, taking into account the appro-
priate deferred taxes.
The revaluation reserve contains the remeasurement gains or
losses, after deferred taxes, on available-for-sale financial
instruments recognised in other comprehensive income. The
gains or losses are only recognised in the income statement
when the asset is sold or derecognised.
The currency translation reserve holds the currency translation
differences (recognised in other comprehensive income) from
the translation of the financial statements of economically
independent foreign operations (subsidiaries, branches) into
the Group currency (see Note (11)); the items are held there
until disposal. In addition, the currency translation gains or
losses on hedges of a net investment in a foreign operation are
reported under the currency translation reserve in accordance
with Note (6).
Notes Consolidated Financial Statements 135C-97
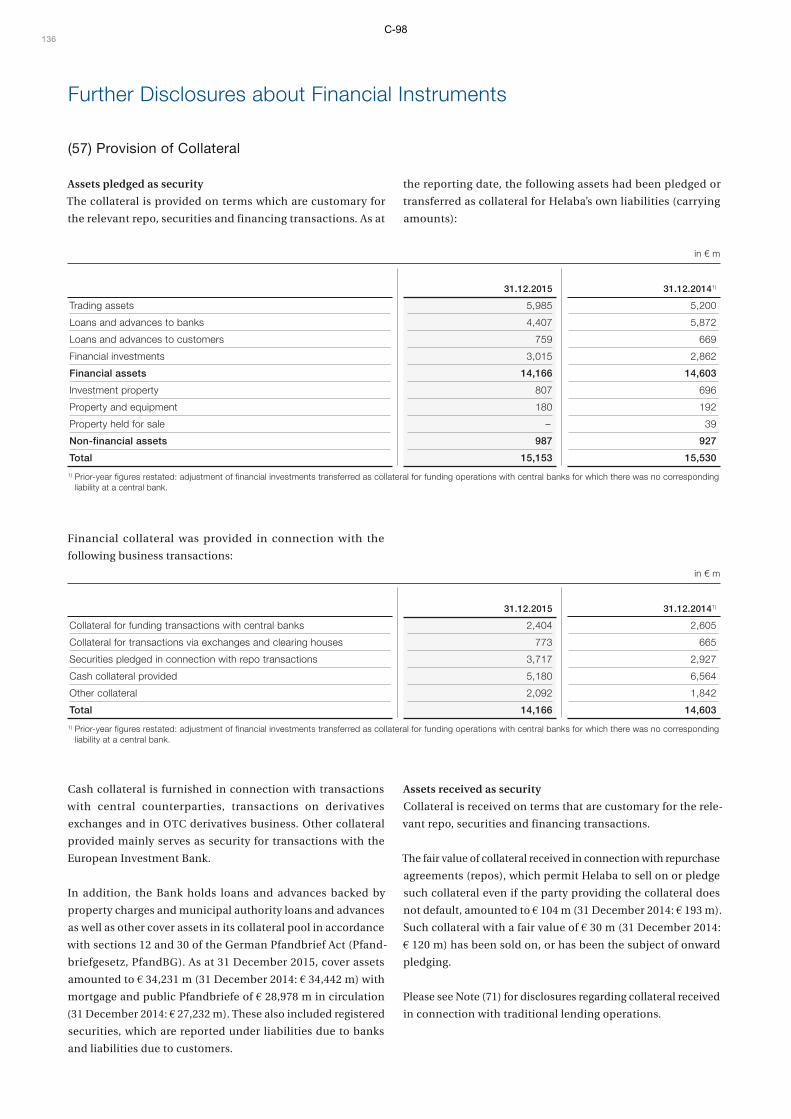
Further Disclosures about Financial Instruments
(57) Provision of Collateral
Assets pledged as security
The collateral is provided on terms which are customary for
the relevant repo, securities and financing transactions. As at
the reporting date, the following assets had been pledged or
transferred as collateral for Helaba’s own liabilities (carrying
amounts):
in € m
31.12.2015
31.12.20141)
Trading assets 5,985 5,200
Loans and advances to banks 4,407 5,872
Loans and advances to customers 759 669
Financial investments 3,015 2,862
Financial assets 14,166 14,603
Investment property 807 696
Property and equipment 180 192
Property held for sale – 39
Non-financial assets 987 927
Total 15,153 15,530
1) Prior-year figures restated: adjustment of financial investments transferred as collateral for funding operations with central banks for which there was no corresponding liability at a central bank.
Financial collateral was provided in connection with the
following business transactions:
in € m
31.12.2015
31.12.20141)
Collateral for funding transactions with central banks 2,404 2,605
Collateral for transactions via exchanges and clearing houses 773 665
Securities pledged in connection with repo transactions 3,717 2,927
Cash collateral provided 5,180 6,564
Other collateral 2,092 1,842
Total 14,166 14,603
1) Prior-year figures restated: adjustment of financial investments transferred as collateral for funding operations with central banks for which there was no corresponding liability at a central bank.
Cash collateral is furnished in connection with transactions
with central counterparties, transactions on derivatives
exchanges and in OTC derivatives business. Other collateral
provided mainly serves as security for transactions with the
European Investment Bank.
In addition, the Bank holds loans and advances backed by
property charges and municipal authority loans and advances
as well as other cover assets in its collateral pool in accordance
with sections 12 and 30 of the German Pfandbrief Act (Pfand-
briefgesetz, PfandBG). As at 31 December 2015, cover assets
amounted to € 34,231 m (31 December 2014: € 34,442 m) with
mortgage and public Pfandbriefe of € 28,978 m in circulation
(31 December 2014: € 27,232 m). These also included registered
securities, which are reported under liabilities due to banks
and liabilities due to customers.
Assets received as security
Collateral is received on terms that are customary for the rele-
vant repo, securities and financing transactions.
The fair value of collateral received in connection with repurchase
agreements (repos), which permit Helaba to sell on or pledge
such collateral even if the party providing the collateral does
not default, amounted to € 104 m (31 December 2014: € 193 m).
Such collateral with a fair value of € 30 m (31 December 2014:
€ 120 m) has been sold on, or has been the subject of onward
pledging.
Please see Note (71) for disclosures regarding collateral received
in connection with traditional lending operations.
136C-98

(58) Transfer of Financial Assets without Derecognition
In connection with securities repurchase and lending
trans actions, the Helaba Group transfers financial assets,
but retains the main credit rating, interest rate and currency
risks as well as the opportunities for capital appreciation
associated with the ownership of these assets. Thus, the
requirements for derecognition in accordance with IAS 39
are not fulfilled and the financial assets continue to be rec-
ognised in the consolidated statement of financial position
and measured in accordance with the measurement category
to which they are assigned.
The following table shows the carrying amounts of the trans-
ferred assets that do not qualify for derecognition, broken
down by the type of underlying transaction, as well as the
corresponding liabilities.
in € m
31.12.2015
31.12.2014
Carrying amount of financial assets transferred in connection with securities repurchase transactions but not derecognised 3,377 2,140
Trading assets 2,090 945
Financial investments 1,287 1,195
Carrying amount of liabilities from securities repurchase transactions 3,295 2,045
Carrying amount of financial assets transferred in connection with securities lending transactions but not derecognised 87 184
Trading assets – 83
Financial investments 87 101
All of the financial assets listed above are securities owned by
the Helaba Group. In the context of securities repurchase and
lending transactions, securities accepted from third parties as
part of reverse repos or borrowed securities, which may not be
recognised in the consolidated statement of financial position,
may also be transferred.
The transferee or borrower, as the case may be, may sell on or
pledge the transferred securities at any time. Nevertheless, the
Helaba Group generally continues to receive the contractually
agreed cash flows from these securities.
The liabilities from securities repurchase transactions result
from the amount paid by the transferee for the transferred
securities. This amount corresponds to the fair value of the
transferred securities less a safety margin on the date on which
the transaction is entered into. When the securities are trans-
ferred back at the end of the term of the securities repurchase
agreement, this amount, plus agreed interest, must be repaid
to the transferee. The liabilities from securities repurchase
transactions are recognised under trading liabilities or under
liabilities due to banks and liabilities due to customers.
The corresponding liabilities in connection with securities
lending transactions arise out of the obligation to repay the
cash collateral received. The main counterparties in the Helaba
Group’s securities lending transactions comprise affiliated and
non-affiliated Sparkassen. Additional cash collateral is generally
demanded only from counterparties outside the Sparkassen-
Finanzgruppe.
Given that the transferred securities are assigned to the measure-
ment categories “held for trading” (HfT) or “available for sale”
(AfS), their fair values reflect their carrying amounts. As at
31 December 2015, the fair value of the corresponding liabilities
from securities repurchase transactions amounted to € 3,295 m
(31 December 2014: € 2,045 m) and therefore also equated to
the carrying amounts. The fair value of the cash collateral
received in connection with securities lending transactions
always equals its carrying amount. However, the Helaba Group
has only entered into unsecured securities lending transactions.
(59) Transfer of Financial Assets with Derecognition
Contracts for the sale and acquisition of shares in companies
(equity investments and affiliates) include the warranties cus-
tomary with such transactions, in particular in respect of the
tax and legal position. Provisions of € 4 m (31 December 2014:
€ 10 m) have been recognised for such warranties.
Notes Consolidated Financial Statements 137C-99

(60) Disclosures regarding Offsetting Assets and Liabilities in the Statement of Financial Position
In accordance with the disclosure requirements in IFRS 7
relating to offsetting financial instruments, the tables below
show a reconciliation from the gross to the net risk exposure
for financial instruments. The disclosures relate both to finan-
cial instruments that have been offset and also to those that
are subject to a master netting agreement.
Offsetting in derivatives transactions involves the positive and
negative values of derivatives as well as the associated cash
collateral, which is reported under loans and advances to cus-
tomers or liabilities due to customers.
The following table shows the reconciliation of the gross carry-
ing amounts for the offset financial assets and liabilities to the
amounts recognised in the statement of financial position as
at 31 December 2015.
in € m
Gross carrying amount before
offsetting
Gross carrying amount of
offset financial instruments
Net carrying amount
Assets
Derivatives 18,290 – 1,980 16,310
Securities repurchase transactions 105 – 105
Other assets 3,837 – 3,636 201
Total 22,232 – 5,616 16,616
Liabilities
Derivatives 16,705 – 1,935 14,770
Securities repurchase transactions 3,627 – 3,627
Other liabilities 4,240 – 3,681 559
Total 24,572 – 5,616 18,956
Helaba has also entered into master netting agreements with
counterparties in the derivatives and securities repurchase
business. These agreements include conditional netting rights.
If the conditions are met – for example if a counterparty defaults
for reasons related to its credit rating – the transactions are
settled on a net basis. These agreements resulted in the follow-
ing net amounts as at 31 December 2015:
in € m
Conditional netting rights on basis of master netting agreements
Carrying amount
Collateral in the form of
liabilities/assets Cash collateral1)
Net amount after conditional netting
rights are taken into account
Assets
Derivatives 16,310 – 8,858 – 1,231 6,221
Securities repurchase transactions 105 –103 – 2
Other assets 201 – – 201
Total 16,616 – 8,961 –1,231 6,424
Liabilities
Derivatives 14,770 – 8,857 – 5,045 868
Securities repurchase transactions 3,627 – 3,622 – 5
Other liabilities 559 – – 559
Total 18,956 –12,479 – 5,045 1,432
1) The figures do not include any other conditional offsetting options under property charges or in connection with other loan collateral not covered by master nettingagreements.
138C-100

The following table shows the corresponding amounts as at
31 December 2014:
in € m
Gross carrying amount before
offsetting
Gross carrying amount of offset
financial instrumentsNet carrying
amount
Assets
Derivatives 20,487 – 1,774 18,713
Securities repurchase transactions 196 – 196
Other assets 9,214 – 9,024 190
Total 29,897 – 10,798 19,099
Liabilities
Derivatives 19,833 – 1,755 18,078
Securities repurchase transactions 2,776 – 2,776
Other liabilities 9,580 – 9,043 537
Total 32,189 – 10,798 21,391
in € m
Conditional netting rights on basis of master netting agreements
Carrying amount
Collateral in the form of
liabilities/assets Cash collateral1)
Net amount after conditional netting
rights are taken into account
Assets
Derivatives 18,713 – 9,782 – 538 8,393
Securities repurchase transactions 196 – 193 – 3
Other assets 190 – – 190
Total 19,099 – 9,975 – 538 8,586
Liabilities
Derivatives 18,078 – 9,782 – 6,520 1,776
Securities repurchase transactions 2,776 – 2,767 – 9
Other liabilities 537 – – 537
Total 21,391 – 12,549 – 6,520 2,322
1) The figures do not include any other conditional offsetting options under property charges or in connection with other loan collateral not covered by master netting agreements.
(61) Subordinated Assets
The following statement of financial position items include
subordinated assets:
in € m
31.12.2015
31.12.2014
Loans and advances to banks 33 73
Loans and advances to customers 353 605
thereof: To long-term investees and investors 15 18
Total 386 678
Assets are reported as subordinated if, in the case of liquidation
or insolvency of the debtor, they can be repaid only after the
claims of the other creditors have been satisfied.
Notes Consolidated Financial Statements 139C-101

(62) Foreign Currency Volumes in € m
Foreign currency assets
Foreign currency liabilities
31.12.2015 31.12.2014 31.12.2015 31.12.2014
USD 19,140 14,887 10,348 8,212
GBP 7,181 6,926 2,393 2,722
CHF 1,799 2,377 357 670
JPY 437 402 424 450
Other currencies 943 951 384 321
Total 29,500 25,543 13,906 12,375
The foreign currency assets and liabilities shown under this
item relate to non-derivative financial instruments. The foreign
currency exposures are hedged by corresponding derivatives.
(63) Breakdown of Maturities in € m
Payable on
demandLess than
three monthsThree months
to one yearOne year to
five yearsMore than five years
Non-derivative financial liabilities 31,306 22,023 28,481 42,569 30,890
Trading liabilities 884 5,340 5,685 – 124
Liabilities due to banks 6,725 5,540 5,854 11,834 8,472
Liabilities due to customers 23,697 3,605 6,809 7,322 10,161
Securitised liabilities – 7,529 9,483 22,153 8,960
Subordinated capital – 9 650 1,260 3,173
Derivative financial liabilities 10,390 423 616 2,413 1,599
Trading liabilities 10,390 – – – –
Negative fair values of non-trading derivatives – 423 616 2,413 1,599
Irrevocable loan commitments 602 821 2,681 12,529 2,581
Total 42,298 23,267 31,778 57,511 35,070
The following table shows the corresponding amounts as at
31 December 2014:
in € m
Payable on
demandLess than
three monthsThree months
to one yearOne year to
five yearsMore than five years
Non-derivative financial liabilities 27,306 19,053 36,931 48,084 28,659
Trading liabilities 1,094 5,848 9,420 6 124
Liabilities due to banks 5,996 1,980 5,369 14,923 9,341
Liabilities due to customers 20,216 3,603 7,055 8,475 9,650
Securitised liabilities – 7,611 12,611 23,068 7,306
Subordinated capital – 11 2,476 1,612 2,238
Derivative financial liabilities 12,727 466 711 3,019 1,961
Trading liabilities 12,727 – – – –
Negative fair values of non-trading derivatives – 466 711 3,019 1,961
Irrevocable loan commitments 1,593 339 3,069 10,594 1,659
Total 41,626 19,858 40,711 61,697 32,279
140C-102
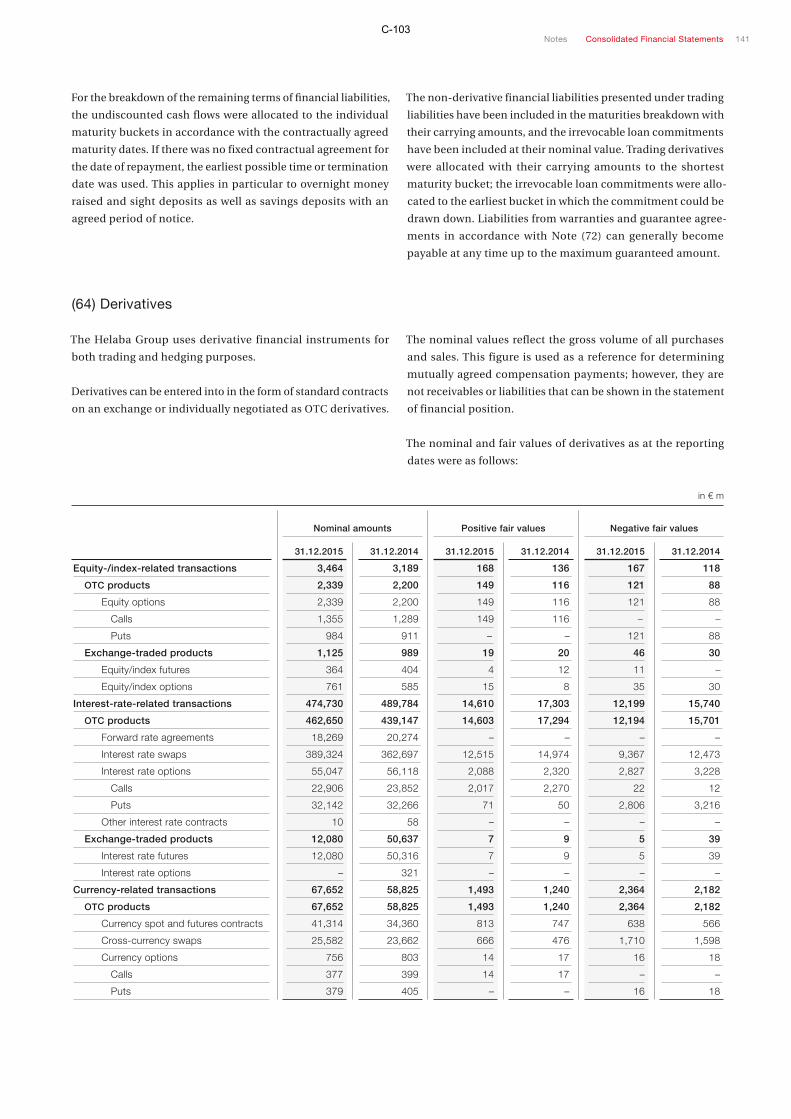
For the breakdown of the remaining terms of financial liabilities,
the undiscounted cash flows were allocated to the individual
maturity buckets in accordance with the contractually agreed
maturity dates. If there was no fixed contractual agreement for
the date of repayment, the earliest possible time or termination
date was used. This applies in particular to overnight money
raised and sight deposits as well as savings deposits with an
agreed period of notice.
The non-derivative financial liabilities presented under trading
liabilities have been included in the maturities breakdown with
their carrying amounts, and the irrevocable loan commitments
have been included at their nominal value. Trading derivatives
were allocated with their carrying amounts to the shortest
maturity bucket; the irrevocable loan commitments were allo-
cated to the earliest bucket in which the commitment could be
drawn down. Liabilities from warranties and guarantee agree-
ments in accordance with Note (72) can generally become
payable at any time up to the maximum guaranteed amount.
(64) Derivatives
The Helaba Group uses derivative financial instruments for
both trading and hedging purposes.
Derivatives can be entered into in the form of standard contracts
on an exchange or individually negotiated as OTC derivatives.
The nominal values reflect the gross volume of all purchases
and sales. This figure is used as a reference for determining
mutually agreed compensation payments; however, they are
not receivables or liabilities that can be shown in the statement
of financial position.
The nominal and fair values of derivatives as at the reporting
dates were as follows:
in € m
Nominal amounts
Positive fair values
Negative fair values
31.12.2015 31.12.2014 31.12.2015 31.12.2014 31.12.2015 31.12.2014
Equity-/index-related transactions 3,464 3,189 168 136 167 118
OTC products 2,339 2,200 149 116 121 88
Equity options 2,339 2,200 149 116 121 88
Calls 1,355 1,289 149 116 – –
Puts 984 911 – – 121 88
Exchange-traded products 1,125 989 19 20 46 30
Equity/index futures 364 404 4 12 11 –
Equity/index options 761 585 15 8 35 30
Interest-rate-related transactions 474,730 489,784 14,610 17,303 12,199 15,740
OTC products 462,650 439,147 14,603 17,294 12,194 15,701
Forward rate agreements 18,269 20,274 – – – –
Interest rate swaps 389,324 362,697 12,515 14,974 9,367 12,473
Interest rate options 55,047 56,118 2,088 2,320 2,827 3,228
Calls 22,906 23,852 2,017 2,270 22 12
Puts 32,142 32,266 71 50 2,806 3,216
Other interest rate contracts 10 58 – – – –
Exchange-traded products 12,080 50,637 7 9 5 39
Interest rate futures 12,080 50,316 7 9 5 39
Interest rate options – 321 – – – –
Currency-related transactions 67,652 58,825 1,493 1,240 2,364 2,182
OTC products 67,652 58,825 1,493 1,240 2,364 2,182
Currency spot and futures contracts 41,314 34,360 813 747 638 566
Cross-currency swaps 25,582 23,662 666 476 1,710 1,598
Currency options 756 803 14 17 16 18
Calls 377 399 14 17 – –
Puts 379 405 – – 16 18
Notes Consolidated Financial Statements 141C-103

in € m
Nominal amounts
Positive fair values
Negative fair values
31.12.2015 31.12.2014 31.12.2015 31.12.2014 31.12.2015 31.12.2014
Credit derivatives 5,135 3,879 31 27 32 31
OTC products 5,135 3,879 31 27 32 31
Commodity-related transactions 141 156 8 7 8 7
OTC products 141 156 8 7 8 7
Commodity swaps 40 44 8 5 8 5
Commodity options 101 112 – 2 – 2
Total 551,122 555,833 16,310 18,713 14,770 18,078
Nominal amounts broken down by term to maturity:
in € m
Equity-/index-related transactions
Interest-rate-related transactions
Currency-related transactions
31.12.2015 31.12.2014 31.12.2015 31.12.2014 31.12.2015 31.12.2014
Up to three months 672 594 34,053 76,141 24,960 19,879
More than three months and up to one year 890 832 87,297 86,255 14,901 13,096
More than one year and up to five years 1,826 1,698 186,850 178,552 22,056 19,513
More than five years 76 65 166,530 148,836 5,735 6,337
Total 3,464 3,189 474,730 489,784 67,652 58,825
in € m
Credit derivativesCommodity-related
transactions Total
31.12.2015 31.12.2014 31.12.2015 31.12.2014 31.12.2015 31.12.2014
Up to three months 87 182 50 50 59,822 96,846
More than three months and up to one year 608 443 46 15 103,742 100,641
More than one year and up to five years 4,356 3,249 45 91 215,133 203,103
More than five years 84 5 – – 172,425 155,243
Total 5,135 3,879 141 156 551,122 555,833
Derivatives have been entered into with the following counter-
parties:
in € m
Nominal amounts
Positive fair values
Negative fair values
31.12.2015 31.12.2014 31.12.2015 31.12.2014 31.12.2015 31.12.2014
Banks in OECD countries 219,785 229,973 8,944 10,144 11,759 14,444
Banks outside OECD countries 13 17 – – 1 3
Other counterparties (including exchanges) 283,465 264,908 3,180 3,493 1,033 1,160
Public institutions in OECD countries 47,859 60,935 4,186 5,076 1,977 2,471
Total 551,122 555,833 16,310 18,713 14,770 18,078
142C-104

(65) Carrying Amounts and Contributions to Earnings, Broken Down by Measurement Category
The following table sets out the carrying amounts of financial
assets and liabilities as at 31 December 2015 in accordance
with the measurement categories of IAS 39. It also shows the
figures reported in the statement of financial position.
in € m
LaR/OL
AfS
HfT
FVO
Total
Assets
Cash reserve 1,909 1,909
Loans and advances to banks 17,144 – 17,144
Loans and advances to customers 92,587 607 93,194
Trading assets 26,078 26,078
Positive fair values of non-trading derivatives 4,376 4,376
Financial investments 23,521 3,054 26,575
Total 111,640 23,521 30,454 3,661 169,276
Liabilities
Liabilities due to banks 35,735 241 35,976
Liabilities due to customers 44,346 3,381 47,727
Securitised liabilities 40,926 6,147 47,073
Trading liabilities 22,423 22,423
Negative fair values of non-trading derivatives 4,380 4,380
Subordinated capital 3,986 100 4,086
Total 124,993 26,803 9,869 161,665
As was the case in the previous year, the financial assets reported
under other assets and the financial liabilities reported under
other liabilities were allocated to the categories LaR and OL
respectively.
The corresponding carrying amounts as at 31 December 2014
were as follows:
in € m
LaR/OL
AfS
HfT
FVO
Total
Assets
Cash reserve 1,033 1,033
Loans and advances to banks 20,571 8 20,579
Loans and advances to customers 90,457 652 91,109
Trading assets 31,262 31,262
Positive fair values of non-trading derivatives 5,828 5,828
Financial investments 23,397 3,193 26,590
Total 112,061 23,397 37,090 3,853 176,401
Liabilities
Liabilities due to banks 35,222 390 35,612
Liabilities due to customers 41,664 3,656 45,320
Securitised liabilities 39,520 8,800 48,320
Trading liabilities 29,219 29,219
Negative fair values of non-trading derivatives 5,351 5,351
Subordinated capital 4,838 572 5,410
Total 121,244 34,570 13,418 169,232
Notes Consolidated Financial Statements 143C-105

The following table shows the contributions to earnings from
financial instruments in each measurement category for the
2015 financial year:
in € m
LaR
OL
AfS
HfT
FVONon-trading derivatives
Total
Net interest income 2,758 – 1,687 292 – 164 154 1,353
Provisions for losses on loans and advances – 237 – 237
Net trading income 190 190
Gain or loss on non- trading derivatives and financial instruments to which the fair value option is applied 126 – 104 22
Net income from hedge accounting 3 10 – 10 3
Net income from financial investments 7 7
Contributions to earnings recognised under other comprehensive income – 62 – 62
Total 2,524 – 1,677 237 190 – 38 40 1,276
The equivalent amounts for 2014 were as follows:
in € m
LaR
OL
AfS
HfT
FVONon-trading derivatives
Total
Net interest income 2,994 – 1,956 326 – 237 216 1,343
Provisions for losses on loans and advances – 80 – 80
Net trading income 126 126
Gain or loss on non- trading derivatives and financial instruments to which the fair value option is applied – 271 309 38
Net income from hedge accounting – 69 – 288 370 13
Net income from financial investments 33 33
Contributions to earnings recognised under other comprehensive income 173 173
Total 2,845 – 2,244 532 126 – 508 895 1,646
Net interest income as per the income statement includes not
only interest from financial instruments but also net interest
attributable to pension obligations and other non-current
provisions.
Net interest income includes interest income and interest ex-
penses from financial instruments not measured at fair value
through profit or loss amounting to € 3,050 m (2014: € 3,320 m)
and € 1,687 m (2014: € 1,956 m) respectively.
144C-106

(66) Fair Values of Financial Instruments
The following overview compares the fair values of financial
assets and liabilities with their corresponding carrying
amounts. In addition, other financial assets and liabilities
whose fair values correspond to their carrying amounts are
reported under other assets and other liabilities.
in € m
Fair Value
Carrying amount
Difference
31.12.2015 31.12.2014 31.12.2015 31.12.2014 31.12.2015 31.12.2014
Assets
Cash reserve 1,909 1,033 1,909 1,033 – –
Loans and advances to banks1) 17,281 20,824 17,142 20,577 139 247
Loans and advances to customers1) 97,474 95,391 92,210 90,104 5,264 5,287
Trading assets 26,078 31,262 26,078 31,262 – –
Positive fair values of non-trading derivatives 4,376 5,828 4,376 5,828 – –
Financial investments 26,575 26,590 26,575 26,590 – –
Total 173,693 180,928 168,290 175,394 5,403 5,534
Liabilities
Liabilities due to banks 37,074 36,884 35,976 35,612 1,098 1,272
Liabilities due to customers 48,983 47,009 47,727 45,320 1,256 1,689
Securitised liabilities 47,511 48,937 47,073 48,320 438 617
Trading liabilities 22,423 29,219 22,423 29,219 – –
Negative fair values of non-trading derivatives 4,380 5,351 4,380 5,351 – –
Subordinated capital 4,497 5,602 4,086 5,410 411 192
Total 164,868 173,002 161,665 169,232 3,203 3,770
1) Net carrying amount after provisions for losses on loans and advances.
Fair value is defined as the amount for which an asset could be
exchanged or a liability settled between knowledgeable, willing
parties in an arm’s-length transaction (except in the case of
emergency settlement).
The market price is the best indicator of the fair value of financial
instruments. If an active market exists, observable market prices
are used to measure the financial instruments recognised at fair
value. These are normally prices quoted on a stock exchange or
market prices quoted on the interbank market (Level 1).
If an observable market price does not exist for a financial in-
strument, recognised and customary valuation techniques are
used for measurement purposes, with all input data (e.g. yield
curves, volatilities, spreads) being based on observable market
data and taken from external sources. These methods mainly
comprise discounted-cash-flow-based forward pricing and
swap pricing models or option price models (e.g. Black-Scholes
and variants thereof ). These valuation techniques are normally
used for OTC derivatives (including credit derivatives) and
financial instruments that are recognised at fair value and not
traded on an active market (Level 2).
In those cases in which not all input parameters are directly
observable on the market, the fair values are calculated using
realistic assumptions based on market conditions. This valua-
tion technique is used in particular for complex structured
(derivative) basket products where correlations not directly
observable in the market are significant to the measurement.
If no market prices are available for non-derivative financial
instruments, arranger prices are used. Unlisted equity invest-
ments recognised at fair value are also measured on the basis
of input parameters that cannot be observed, particularly the
surpluses derived from corporate planning (Level 3).
Notes Consolidated Financial Statements 145C-107

The breakdown of financial instruments on the assets side
measured at fair value according to the hierarchy of the inputs
used was as follows:
in € m
Level 1 Level 2 Level 3 Total
31.12.2015 31.12.2014 31.12.2015 31.12.2014 31.12.2015 31.12.2014 31.12.2015 31.12.2014
Non-derivative financial instruments 36,246 39,161 4,320 5,511 729 920 41,295 45,592
Loans and advances to banks – 8 – – – 8
Loans and advances to customers 504 542 103 110 607 652
Trading assets 11,532 15,077 2,504 3,157 108 143 14,144 18,377
Financial investments 24,714 24,084 1,312 1,804 518 667 26,544 26,555
Derivatives 26 29 16,164 18,577 120 107 16,310 18,713
Trading assets 21 22 11,816 12,797 97 66 11,934 12,885
Positive fair values of non-trading derivatives 5 7 4,348 5,780 23 41 4,376 5,828
Total 36,272 39,190 20,484 24,088 849 1,027 57,605 64,305
The financial instruments recognised as liabilities in the state-
ment of financial position were broken down as follows:
in € m
Level 1 Level 2 Level 3 Total
31.12.2015 31.12.2014 31.12.2015 31.12.2014 31.12.2015 31.12.2014 31.12.2015 31.12.2014
Non-derivative financial instruments 347 707 21,095 28,666 460 537 21,902 29,910
Liabilities due to banks 231 354 10 36 241 390
Liabilities due to customers 3,344 3,611 37 45 3,381 3,656
Securitised liabilities – – 5,734 8,344 413 456 6,147 8,800
Trading liabilities 347 707 11,686 15,785 – – 12,033 16,492
Subordinated capital – – 100 572 – – 100 572
Derivatives 51 69 14,612 17,940 107 69 14,770 18,078
Trading liabilities 47 46 10,244 12,615 99 66 10,390 12,727
Negative fair values of non-trading derivatives 4 23 4,368 5,325 8 3 4,380 5,351
Total 398 776 35,707 46,606 567 606 36,672 47,988
The changes within the three measurement levels largely arose
as a result of additions or disposals and not as a consequence
of transfers between the levels.
146C-108

The breakdown of assets-side non-derivative financial instru-
ments in Level 3 was as follows:
in € m
31.12.2015
31.12.2014
Loans and advances to customers 103 110
Bonds and other fixed-income securities 268 345
Bonds 161 194
Promissory notes 107 143
Asset-backed securities – 8
Unlisted equity investments 77 75
Investment units 127 223
Purchase of receivables from endowment insurance policies 154 167
Total 729 920
The breakdown of Level 3 bonds and other fixed-income secu-
rities over the various rating categories was as follows:
in € m
31.12.2015
31.12.2014
AAA 38 8
AA 214 243
A 15 89
BBB and below 1 –
No external rating – 5
Bonds and other fixed-income securities 268 345
Helaba’s model for measuring the Level 3 instruments used
inputs producing a price that knowledgeable market participants
would apply. For individual inputs, more or less favourable
factors could have been applied as an alternative.
For loans and advances to customers, bonds and other fixed-
income securities, this is particularly true of the inputs used in
estimating and determining credit spreads. The process uses
scenario values on the basis of determined historical standard
deviations in the sectors concerned. As was the case in the pre-
vious year, the deviations calculated in this way were negligible.
Simulations were carried out for unlisted equity investments
and investment units for which a discounted earnings ap-
proach is used to determine fair value. The main variations in
the simulations were to increase or reduce the cash flows by
10 % before discounting. The fair values calculated in this way
were used as the basis for determining alternative values,
which were then found to be up to € 21 m (31 December 2014:
€ 31 m) higher or lower.
There were no significant sensitivities evident in the other
Level 3 instruments.
Notes Consolidated Financial Statements 147C-109

The following tables show the changes in the portfolio of finan-
cial instruments that are measured at fair value and allocated
to Level 3 as well as the net gains or losses on remeasurement
of the financial instruments still held in the portfolio as at
31 December:
in € m
Loans and advances to customers Trading assets Financial investments
Assets 2015 2014 2015 2014 2015 2014
Carrying amounts as at 1.1. 110 106 143 20 667 641
Gains or losses recognised in profit or loss
Net interest income 13 – 10 –
Net trading income – 2 –
Gain or loss on non-trading derivatives and financial instruments to which the fair value option is applied – 1 8 – 6 – 1
Net income from financial investments 2 1
Gains or losses recognised in other comprehensive income – 2 1
Additions – – 102 153 12 17
Disposals/liquidations – 19 – 4 – 83 – 30 – 193 – 180
Changes due to currency translation – – – – 5 14
Transfers from Level 1 – – – – – 160
Transfers from Level 2 – – – – 28 34
Transfers to Level 2 – – – 52 – – 5 – 20
Carrying amounts as at 31.12. 103 110 108 143 518 667
Gains or losses on financial assets in the portfolio recognised in profit or loss 1 8 – 1 – – 6 – 3
in € m
Positive fair values of the trading portfolio
Positive fair values of non-trading derivatives
Assets 2015 2014 2015 2014
Carrying amounts as at 1.1. 66 29 41 36
Gains or losses recognised in profit or loss
Net interest income – 1 – 4
Net trading income 45 21
Gain or loss on non-trading derivatives and financial instruments to which the fair value option is applied – 16 11
Additions 5 3 – – 2
Disposals/liquidations – 8 – 16 – 1 –
Transfers from Level 2 – 29 – –
Transfers to Level 2 – 11 – – –
Carrying amounts as at 31.12. 97 66 23 41
Gains or losses on financial assets in the portfolio recognised in profit or loss 69 34 – 11 13
148C-110

in € m
Liabilities due to banks
Liabilities due to
customersSecuritised
liabilities
Liabilities 2015 2014 2015 2014 2015 2014
Carrying amounts as at 1.1. 36 38 45 37 456 508
Gains or losses recognised in profit or loss
Net interest income 1 – 2 – 2 5 – 2
Gain or loss on non-trading derivatives and financial instruments to which the fair value option is applied – 1 5 6 – 18 14
Additions 21 4 36 7 45 97
Disposals/liquidations – 48 – 7 – 51 – 3 – 75 – 161
Carrying amounts as at 31.12. 10 36 37 45 413 456
Gains or losses on liabilities in the portfolio recognised in profit or loss – 1 – 1 – 6 – 6 33 – 13
in € m
Trading liabilities
Negative fair values of the trading
portfolio
Negative fair values of non-trading
derivatives
Liabilities 2015 2014 2015 2014 2015 2014
Carrying amounts as at 1.1. – – 66 7 3 8
Gains or losses recognised in profit or loss
Net interest income – – 1
Net trading income – – 45 26
Gain or loss on non-trading derivatives and financial instruments to which the fair value option is applied 4 – 6
Additions – – 5 3 1 –
Disposals/liquidations – – – 8 – 11 – –
Transfers from Level 2 – 6 – 41 – 2
Transfers to Level 1 – – 6 – – – –
Transfers to Level 2 – – – 9 – – –
Carrying amounts as at 31.12. – – 99 66 8 3
Gains or losses on liabilities in the portfolio recognised in profit or loss – – – 69 – 34 – 7 4
Notes Consolidated Financial Statements 149C-111

The following overview shows a breakdown of financial instru-
ments not measured at fair value according to the hierarchy of
the inputs used:
in € m
Level 1
Level 2
Level 3
Total
31.12.2015 31.12.2014 31.12.2015 31.12.2014 31.12.2015 31.12.2014 31.12.2015 31.12.2014
Assets
Cash reserve 1,909 1,033 1,909 1,033
Loans and advances to banks 12,515 15,790 4,766 5,026 17,281 20,816
Loans and advances to customers 87,581 81,314 9,286 13,425 96,867 94,739
Financial investments – – – – 31 35 31 35
Total 1,909 1,033 100,096 97,104 14,083 18,486 116,088 116,623
Liabilities
Liabilities due to banks 31,625 31,320 5,208 5,174 36,833 36,494
Liabilities due to customers 41,028 38,037 4,574 5,316 45,602 43,353
Securitised liabilities 2,015 1,627 39,349 38,469 – 41 41,364 40,137
Subordinated capital 524 506 3,873 4,524 – – 4,397 5,030
Total 2,539 2,133 115,875 112,350 9,782 10,531 128,196 125,014
The portfolios reported under Level 3 involve types of business
for which observable measurement parameters are not generally
available for all the key inputs. The development and retail
businesses are the main types of business involved in this case.
(67) Reclassification of Financial Assets
In line with IAS 39 and IFRS 7, the Helaba Group reclassified
certain trading assets and financial assets available for sale as
loans and receivables in the second half of 2008. This reclassi-
fication procedure covered assets that, on 1 July 2008, were
clearly no longer intended to be sold or traded in the short
term and that instead were intended to be held for the foresee-
able future. In accordance with the amended IAS 39, such
assets were reclassified with effect from 1 July 2008 using the
fair value determined on this reference date. No further reclas-
sifications have been carried out since that time.
The reclassification also resulted in a change in the line item
in which the assets are shown in the statement of financial
position. The following table shows the carrying amounts and
the fair values of the reclassified assets.
in € m
31.12.2015 Carrying amount
31.12.2015 Fair value
31.12.2014 Carrying amount
31.12.2014 Fair value
1.7.2008 Carrying amount
Trading assets reclassified to loans and advances to customers 73 71 96 96 437
Financial investments reclassified to loans and advances to customers 41 40 161 162 1,722
Total 114 111 257 258 2,159
If the reclassifications had not been carried out, this would
have resulted in 2015 in additional unrealised measurement
losses of € 1 m (2014: measurement gains of € 9 m) for trading
assets in profit or loss and additional unrealised measurement
losses of € 1 m (2014: measurement gains of € 11 m) for finan-
cial assets in other comprehensive income.
150C-112
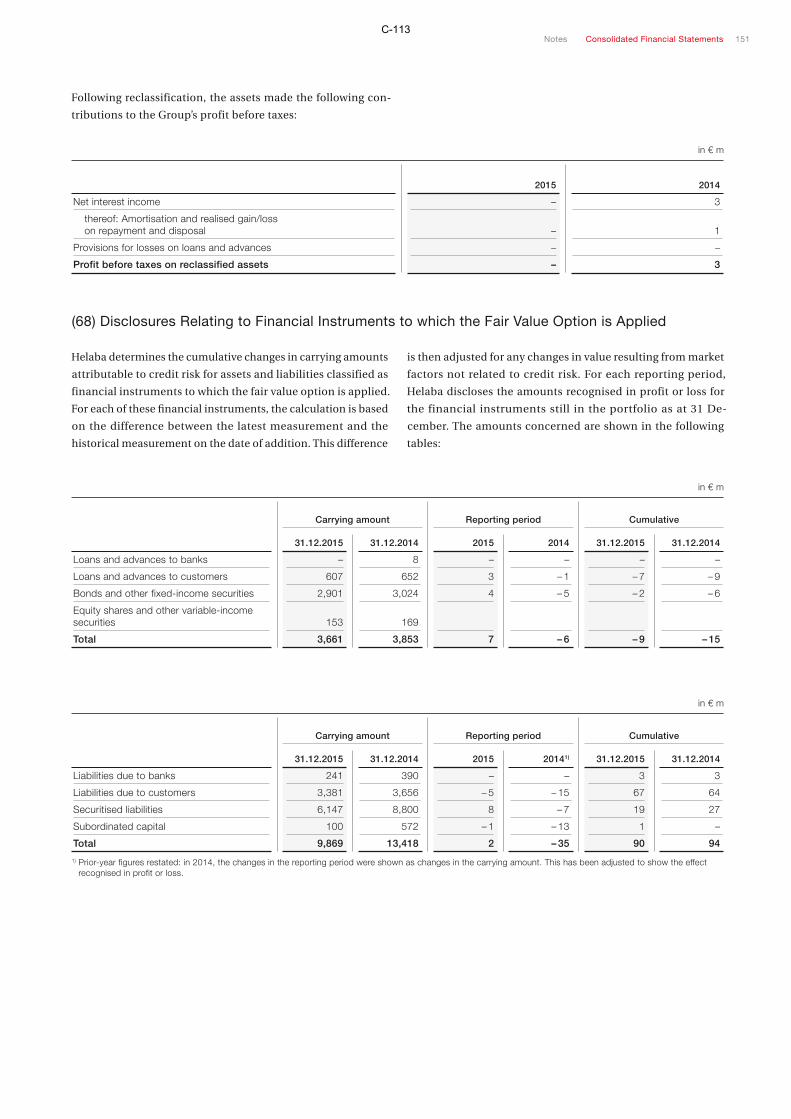
Following reclassification, the assets made the following con-
tributions to the Group’s profit before taxes:
in € m
2015
2014
Net interest income – 3
thereof: Amortisation and realised gain/loss on repayment and disposal – 1
Provisions for losses on loans and advances – –
Profit before taxes on reclassified assets – 3
(68) Disclosures Relating to Financial Instruments to which the Fair Value Option is Applied
Helaba determines the cumulative changes in carrying amounts
attributable to credit risk for assets and liabilities classified as
financial instruments to which the fair value option is applied.
For each of these financial instruments, the calculation is based
on the difference between the latest measurement and the
historical measurement on the date of addition. This difference
is then adjusted for any changes in value resulting from market
factors not related to credit risk. For each reporting period,
Helaba discloses the amounts recognised in profit or loss for
the financial instruments still in the portfolio as at 31 De-
cember. The amounts concerned are shown in the following
tables:
in € m
Carrying amount
Reporting period
Cumulative
31.12.2015 31.12.2014 2015 2014 31.12.2015 31.12.2014
Loans and advances to banks – 8 – – – –
Loans and advances to customers 607 652 3 – 1 – 7 – 9
Bonds and other fixed-income securities 2,901 3,024 4 – 5 – 2 – 6
Equity shares and other variable-income securities 153 169
Total 3,661 3,853 7 – 6 – 9 – 15
in € m
Carrying amount
Reporting period
Cumulative
31.12.2015 31.12.2014 2015 20141) 31.12.2015 31.12.2014
Liabilities due to banks 241 390 – – 3 3
Liabilities due to customers 3,381 3,656 – 5 – 15 67 64
Securitised liabilities 6,147 8,800 8 – 7 19 27
Subordinated capital 100 572 – 1 – 13 1 –
Total 9,869 13,418 2 – 35 90 94
1) Prior-year figures restated: in 2014, the changes in the reporting period were shown as changes in the carrying amount. This has been adjusted to show the effect recognised in profit or loss.
Notes Consolidated Financial Statements 151C-113

The following overview compares the settlement amounts for
the liabilities to which the fair value option is applied and the
carrying amounts of these liabilities:
in € m
Settlement amount
Carrying amount
Difference
31.12.2015 31.12.2014 31.12.2015 31.12.2014 31.12.2015 31.12.2014
Liabilities due to banks 247 371 241 390 6 – 19
Liabilities due to customers 4,129 4,269 3,381 3,656 748 613
Securitised liabilities 6,335 8,991 6,147 8,800 188 191
Subordinated capital 98 533 100 572 – 2 – 39
Total 10,809 14,164 9,869 13,418 940 746
(69) Disclosures Relating to Issuing Activities
The following table provides an overview of changes in the
Helaba Group’s securitised funding during the reporting
period:
in € m
Securitised trading
liabilitiesSecuritised
liabilitiesSecuritised
subordinated capital Total
2015 2014 2015 20141) 2015 2014 2015 2014
As at 1.1. 2,019 2,746 48,320 48,371 3,388 3,283 53,727 54,400
Changes in basis of consolidation – – – – – – – –
Changes due to currency translation 153 187 364 239 3 – 520 426
Additions from issues 13,861 7,412 49,158 29,901 289 178 63,308 37,491
Additions from reissue of previously repurchased instruments – – 2,020 1,599 3 – 2,023 1,599
Redemptions – 11,375 – 8,322 – 50,252 – 30,171 – 1,784 – 23 – 63,411 – 38,516
Repurchases – 10 – 9 – 2,178 – 1,617 – 3 – 1 – 2,191 – 1,627
Changes in accrued interest – – – 105 – 34 – – 1 – 105 – 35
Changes in value recognised through profit or loss 16 5 – 254 32 – 44 – 48 – 282 – 11
As at 31.12. 4,664 2,019 47,073 48,320 1,852 3,388 53,589 53,727
1) ) Prior-year figures restated: in 2014, the additions from the reissue of previously repurchased instruments had been reported under additions from issues.
As part of its issuing activities, the Helaba Group places short-
term commercial paper, equities and index certificates, medium-
and long-term bonds, and subordinated sources of funding on
the money and capital markets.
Additions from issues and redemptions also include the
placement volume of short-term commercial paper that could
be repaid by as early as the end of the financial year. The
changes in value recognised through profit or loss result from
remeasure ment gains or losses on financial liabilities held as
at the reporting date that were either accounted for as hedged
items or to which the fair value option was applied.
In the year under review, subordinated bonds with a nominal
value of € 250 m were redeemed prior to maturity.
152C-114

(70) Risk Management Disclosures
The Group’s risk strategy focuses on the assumption of risks
with a view to making profits and takes account of the com-
pany’s economic and regulatory capital. The identified risks
are continuously measured and monitored for risk manage-
ment purposes. The methods used are subject to constant
improvement. With regard to the organisation of risk manage-
ment, the individual risk types as well as risk concentrations,
please refer to the risk report, which forms an integral part of
the management report.
(71) Credit Risks Attributable to Financial Instruments
The following table shows the carrying amounts of loans and
advances in the loans and receivables category for which spe-
cific loan loss allowances or specific loan loss allowances
evaluated on a group basis have been recognised. The table
also shows the gross carrying amounts before impairment
losses on available-for-sale financial assets.
in € m
Carrying amount before allowances/impairment losses
Amount of allowances/impairment losses
Carrying amount after allowances/impairment losses
31.12.2015 31.12.2014 31.12.2015 31.12.2014 31.12.2015 31.12.2014
Loans and advances to banks (LaR) 3 4 1 1 2 3
Loans and advances to customers (LaR) 1,668 1,989 637 751 1,031 1,238
Financial investments (AfS) 260 193 148 95 112 98
Total 1,931 2,186 786 847 1,145 1,339
With the exception of loans and advances to banks and loans
and advances to customers, the maximum credit risk in
accordance with IFRS 7.36 (a) as at the reporting date was
equivalent to the carrying amount of the financial assets as
detailed in Note (65) plus the contingent liabilities and irre-
vocable loan commitments as per Note (72). For loans and
advances to banks and loans and advances to customers, the
maximum credit risk was equivalent to the carrying amount
less the allowances for losses on loans and advances (see
Note (37)). These amounts do not factor in any deduction of
collateral or other agreements that reduce risk.
No impairment losses were recognised for loans, advances and
other receivables measured at amortised cost with a carrying
amount of € 162 m (31 December 2014: € 260 m) and that were
past due as at the reporting date. This was because Helaba had
noted no material change in the rating of the debtors and still
expected the outstanding amounts to be repaid.
A financial asset is classified as past due if the party to the
agreement fails to make the contractually agreed payments in
respect of the financial instrument on time. Even if only certain
contractually agreed part payments (interest or partial repay-
ments of principal) are overdue, the asset is still considered
past due.
The following table shows an aged breakdown of loans, ad-
vances and other receivables past due, but not impaired, as at
31 December 2015:
in € m
Carrying amount
Past due by ≤ one month
Past due by > one month
and ≤ three months
Past due by > three
months and ≤ one year
Past due by > one year
Total past due
Loans and advances to banks (LaR) 17,144 – – – – –
Loans and advances to customers (LaR) 92,587 94 34 19 12 159
Trade accounts receivable (LaR) 51 1 1 1 – 3
Total 109,782 95 35 20 12 162
Notes Consolidated Financial Statements 153C-115

The following table shows the corresponding amounts as at
31 December 2014:
in € m
Carrying amount
Past due by ≤ one
month
Past due by > one
month and ≤ three
months
Past due by > three
months and ≤ one
year
Past due by > one
yearTotal
past due
Loans and advances to banks (LaR) 20,571 – – – – –
Loans and advances to customers (LaR) 90,457 155 56 8 38 257
Trade accounts receivable (LaR) 41 1 2 – – 3
Total 111,069 156 58 8 38 260
Trade accounts receivable, which are reported under Other
assets in the statement of financial position, are mainly attrib-
utable to third-party consulting fees (for which there are liabil-
ities in the same amount), real estate project management and
residential construction business.
The following table shows a breakdown of deferred or renego-
tiated loans and advances as at the reporting date:
in € m
Carrying amountthereof: Deferred or
renegotiated loans and advances
31.12.2015 31.12.2014 31.12.2015 31.12.2014
Loans and advances to banks 17,144 20,579 – –
Loans and advances to customers 93,194 91,109 2,144 3,054
Total 110,338 111,688 2,144 3,054
Deferred or renegotiated loans and advances are determined
in accordance with the definition of forborne exposures issued
by the European Banking Authority (EBA). A forborne exposure
refers to debts in connection with which forbearance action
has been applied. Such action includes concessions or restruc-
turing as a result of existing or anticipated financial difficulties
on the part of the debtor.
The following table shows a breakdown of allowances for losses
on loans and advances related to deferred or renegotiated
loans and advances as at the reporting date:
in € m
Carrying amount
thereof: Related to deferred or renegotiated loans and advances
and loan commitments
31.12.2015 31.12.2014 31.12.2015 31.12.20141)
Allowances on loans and advances to banks 2 2 – –
Specific loan loss allowances 1 1 – –
Portfolio loan loss allowances 1 1 – –
Allowances on loans and advances to customers 984 1,005 421 508
Specific loan loss allowances 576 669 386 464
Specific loan loss allowances evaluated on a group basis 61 82 20 24
Portfolio loan loss allowances 347 254 15 20
Provisions for lending business risks 44 58 3 4
Total 1,030 1,064 424 512
1) The prior-year figures for provisions for lending business risks related to deferred or renegotiated loan commitments have been restated.
154C-116

In order to secure its loans, the Helaba Group holds, in par ticu-
lar, property charges in relation to real estate, guarantees and
warranties as well as securities. Financial collateral arrange-
ments that are customary in the industry are also used. The
estimated fair value of the collateral is based on a valuation of
that collateral. Depending on the type and volume of the loans
in question, the collateral is constantly monitored and updated
in accordance with the credit guidelines.
The following table shows the estimated fair values of the
collateral held in respect of traditional lending operations as
at the reporting date:
in € m
Carrying amount
Fair value of collateral
31.12.2015 31.12.2014 31.12.2015 31.12.20141)
Loans and advances to banks 17,144 20,579 169 295
Loans and advances to customers 93,194 91,109 33,837 32,748
Contingent liabilities 5,355 5,178 420 994
Irrevocable loan commitments 19,248 17,254 351 245
Total 134,941 134,120 34,777 34,282
1) The prior-year figures for the fair values of collateral received in respect of loans and advances to customers and contingent liabilities have been restated.
In the case of OTC derivative transactions, Helaba applies a
CVA adjustment for default risk in order to cover any expected
losses in the lending business. This CVA adjustment is determined
by assessing the potential credit risk for a given counterparty.
This assessment takes into account any collateral held, any
offsetting effects under master agreements, the expected loss
in the event of a default and the credit risk based on market
data, including CDS spreads. As at 31 December 2015, the CVA
adjustments for both trading book and banking book derivatives
with positive fair values amounted to € 142 m (31 December
2014: € 160 m).
For further information on credit risks, please refer to the risk
report, which forms an integral part of the management report.
Notes Consolidated Financial Statements 155C-117

Off-Balance Sheet Transactions and Obligations
(72) Contingent Liabilities and Other Off-Balance Sheet Obligations
The Helaba Group’s contingent liabilities and other obligations
are mainly potential future payment obligations of the Group
attributable to credit lines that have been granted to customers
but have not yet been drawn down and to financial guarantees
that have been provided. The figures shown reflect potential
liabilities and assume that the credit lines extended are utilised
in full and that the financial guarantees are called upon.
Provisions are recognised for irrevocable loan commitments
if it is probable that the resulting loan will be impaired as soon
as it is drawn down. Provisions are recognised for financial
guarantees or other obligations if it is likely that the guarantees
will be called upon or the obligations will materialise.
in € m
31.12.2015
31.12.2014
Irrevocable loan commitments 19,248 17,254
Financial guarantees 4,053 3,912
Other obligations 4,334 3,517
Liabilities from guarantees and warranty agreements 1,302 1,266
Placement and underwriting obligations 2,795 2,103
Contribution obligations 54 51
Contractual obligations for the acquisition of property and equipment, intangible assets and other assets 41 29
Contractual obligations in connection with investment property 118 57
Litigation risk obligations 3 1
Sundry obligations 21 10
Total 27,635 24,683
On the reporting date, € 44 m of the contribution obligations
was attributable to 35 commercial partnerships, while € 10 m
was attributable to four corporations. No contribution obliga-
tions existed in respect of affiliated companies.
In its capacity as the legal successor of one of its subsidiaries,
the Bank assumed the obligations arising from the merger of
that subsidiary. The latter was involved in a demerger, which
resulted in the temporary assumption of liabilities under the
German Transformation Act (Umwandlungsgesetz, UmwG). No
actual costs are currently expected.
The Bank is a partner with unlimited liability in GLB GmbH &
Co. OHG, Frankfurt am Main.
The Bank is also jointly liable for ensuring that other members
belonging to the Deutscher Sparkassen- und Giroverband e. V.
(DSGV) meet their obligations to make additional contribu-
tions. If a claim were made against a former guarantor of Deka-
Bank under the grandfathering provisions applicable to the
guarantor liability in accordance with the Brussels Accord I,
Helaba would be obliged to pay pro-rata internal liability com-
pensation. The owners of DekaBank on 18 July 2005 are liable
for the fulfilment of all liabilities of DekaBank existing at that
point of time. For such liabilities entered into on or before
18 July 2001, the owners are liable without time limitation; with
regard to liabilities entered into after this date and on or before
18 July 2005, they are liable only for liabilities whose term to
maturity does not extend beyond 31 December 2015.
The Bank is a member of the protection scheme of the Sparkassen-
Finanzgruppe through its membership of the reserve fund of
the Landesbanken and Girozentralen in Germany. Frankfurter
Sparkasse AG is a member of the Sparkassen Support Fund of
the Sparkassen- und Giroverband Hessen-Thüringen. The
purpose of these protection schemes is to guarantee the insti-
tution, i.e. to protect the continued existence of the affiliated
institutions as going concerns. With effect from 3 July 2015, the
protection scheme operated by the German Sparkassen-
Finanzgruppe was adjusted in line with the requirements of
the German Deposit Protection Act (Einlagensicherungsgesetz,
EinSiG). If the institutional protection should fail in excep-
tional circumstances, the customer is entitled to reimburse-
ment of his/her deposits up to an amount of € 100,000. The
relevant EinSiG provisions apply. If a situation should arise
in which a scheme has to provide financial support or pay
compensation, Helaba could be required to pay additional
or special contributions.
156C-118
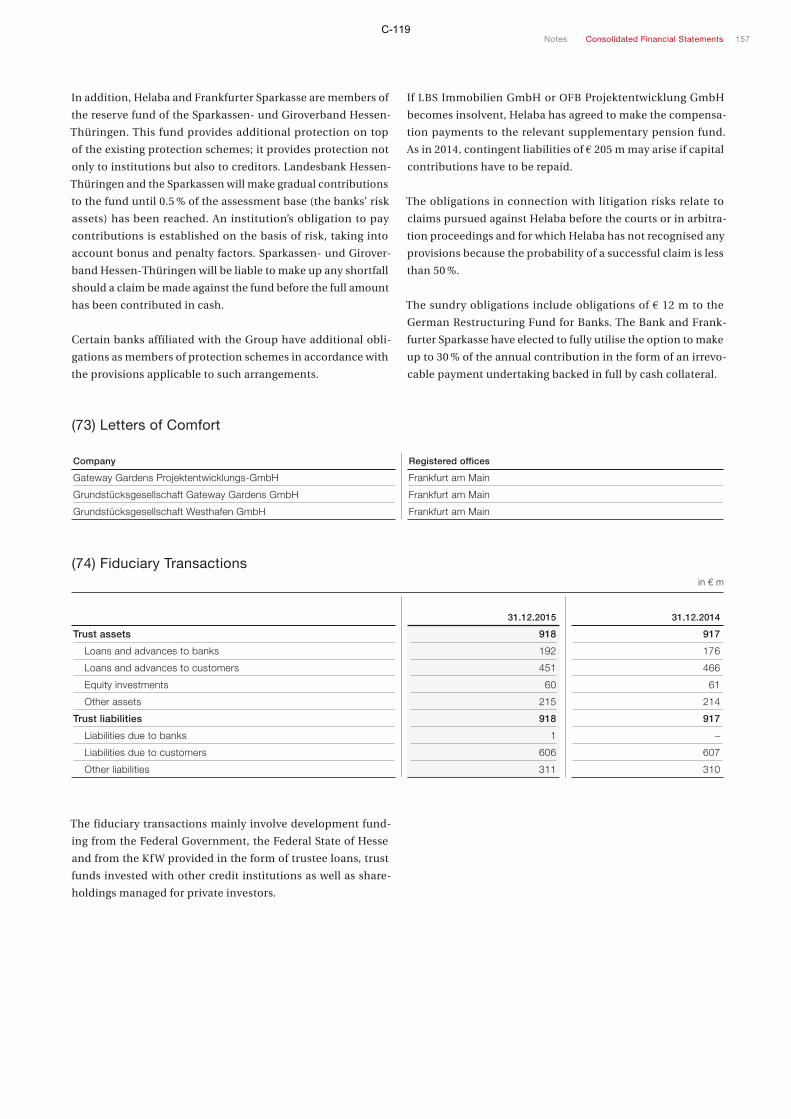
In addition, Helaba and Frankfurter Sparkasse are members of
the reserve fund of the Sparkassen- und Giroverband Hessen-
Thüringen. This fund provides additional protection on top
of the existing protection schemes; it provides protection not
only to institutions but also to creditors. Landesbank Hessen-
Thüringen and the Sparkassen will make gradual contributions
to the fund until 0.5 % of the assessment base (the banks’ risk
assets) has been reached. An institution’s obligation to pay
contributions is established on the basis of risk, taking into
account bonus and penalty factors. Sparkassen- und Girover-
band Hessen-Thüringen will be liable to make up any shortfall
should a claim be made against the fund before the full amount
has been contributed in cash.
Certain banks affiliated with the Group have additional obli-
gations as members of protection schemes in accordance with
the provisions applicable to such arrangements.
If LBS Immobilien GmbH or OFB Projektentwicklung GmbH
becomes insolvent, Helaba has agreed to make the compensa-
tion payments to the relevant supplementary pension fund.
As in 2014, contingent liabilities of € 205 m may arise if capital
contributions have to be repaid.
The obligations in connection with litigation risks relate to
claims pursued against Helaba before the courts or in arbitra-
tion proceedings and for which Helaba has not recognised any
provisions because the probability of a successful claim is less
than 50 %.
The sundry obligations include obligations of € 12 m to the
German Restructuring Fund for Banks. The Bank and Frank-
furter Sparkasse have elected to fully utilise the option to make
up to 30 % of the annual contribution in the form of an irrevo-
cable payment undertaking backed in full by cash collateral.
(73) Letters of Comfort
Company Registered offices
Gateway Gardens Projektentwicklungs-GmbH Frankfurt am Main
Grundstücksgesellschaft Gateway Gardens GmbH Frankfurt am Main
Grundstücksgesellschaft Westhafen GmbH Frankfurt am Main
(74) Fiduciary Transactions in € m
31.12.2015
31.12.2014
Trust assets 918 917
Loans and advances to banks 192 176
Loans and advances to customers 451 466
Equity investments 60 61
Other assets 215 214
Trust liabilities 918 917
Liabilities due to banks 1 –
Liabilities due to customers 606 607
Other liabilities 311 310
The fiduciary transactions mainly involve development fund-
ing from the Federal Government, the Federal State of Hesse
and from the Kf W provided in the form of trustee loans, trust
funds invested with other credit institutions as well as share-
holdings managed for private investors.
Notes Consolidated Financial Statements 157C-119
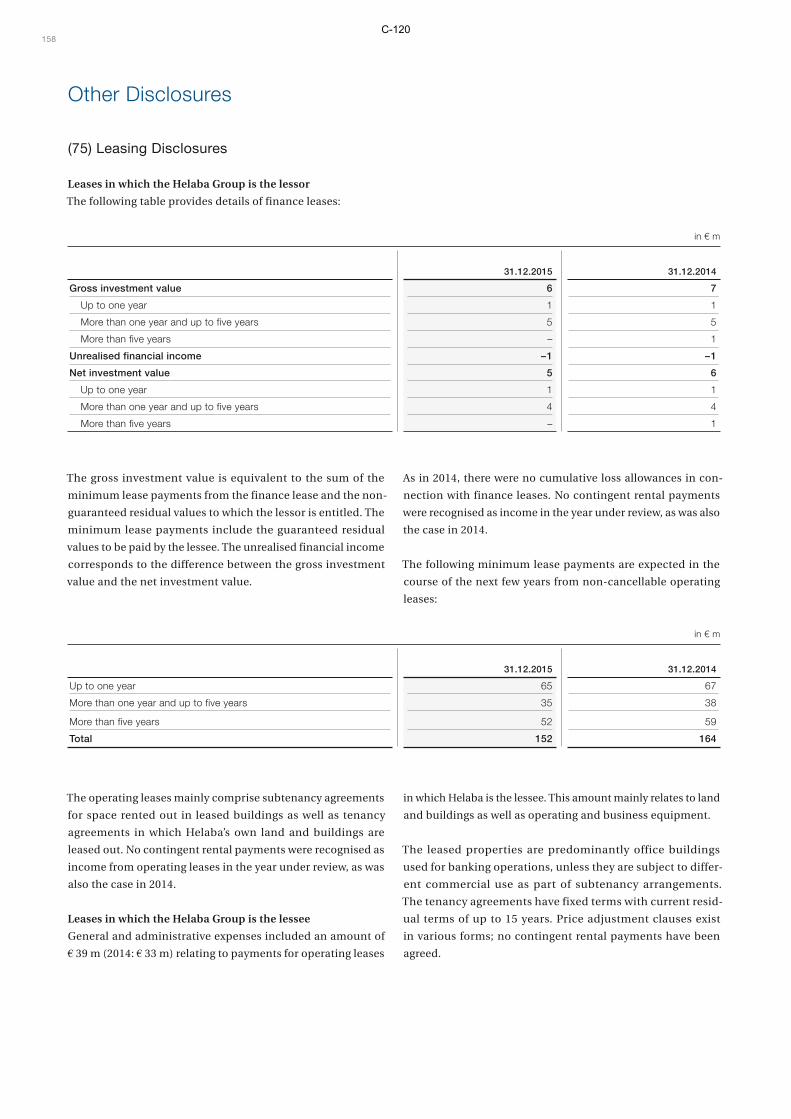
Other Disclosures
(75) Leasing Disclosures
Leases in which the Helaba Group is the lessor
The following table provides details of finance leases:
in € m
31.12.2015
31.12.2014
Gross investment value 6 7
Up to one year 1 1
More than one year and up to five years 5 5
More than five years – 1
Unrealised financial income – 1 – 1
Net investment value 5 6
Up to one year 1 1
More than one year and up to five years 4 4
More than five years – 1
The gross investment value is equivalent to the sum of the
minimum lease payments from the finance lease and the non-
guaranteed residual values to which the lessor is entitled. The
minimum lease payments include the guaranteed residual
values to be paid by the lessee. The unrealised financial income
corresponds to the difference between the gross investment
value and the net investment value.
As in 2014, there were no cumulative loss allowances in con-
nection with finance leases. No contingent rental payments
were recognised as income in the year under review, as was also
the case in 2014.
The following minimum lease payments are expected in the
course of the next few years from non-cancellable operating
leases:
in € m
31.12.2015
31.12.2014
Up to one year 65 67
More than one year and up to five years 35 38
More than five years 52 59
Total 152 164
The operating leases mainly comprise subtenancy agreements
for space rented out in leased buildings as well as tenancy
agreements in which Helaba’s own land and buildings are
leased out. No contingent rental payments were recognised as
income from operating leases in the year under review, as was
also the case in 2014.
Leases in which the Helaba Group is the lessee
General and administrative expenses included an amount of
€ 39 m (2014: € 33 m) relating to payments for operating leases
in which Helaba is the lessee. This amount mainly relates to land
and buildings as well as operating and business equipment.
The leased properties are predominantly office buildings
used for banking operations, unless they are subject to differ-
ent commercial use as part of subtenancy arrangements.
The tenancy agreements have fixed terms with current resid-
ual terms of up to 15 years. Price adjustment clauses exist
in various forms; no contingent rental payments have been
agreed.
158C-120

The following minimum lease payments for non-cancellable
operating leases are expected to be made over the next few
years:
in € m
31.12.2015
31.12.2014
Up to one year 38 34
More than one year and up to five years 119 105
More than five years 80 86
Total 237 225
As at the reporting date, future minimum rental payments of
€ 2 m were expected under non-cancellable subtenancy
arrangements (31 December 2014: € 4 m). In the year under
review, income of € 3 m (2014: € 3 m) was generated from sub-
tenancy agreements. This income is reported under other net
operating income.
In 2015, there were no finance leases in which the Helaba
Group was the lessee.
(76) Capital Management and Regulatory Ratio Disclosures
Capital management in the Helaba Group comprises planning
regulatory own funds as part of the planning process, allocating
own funds, monitoring changes in risk exposures and complying
with capital limits, monitoring and determining the plausibility
of the remaining capital buffer as well as recognising a projected
cost of capital as part of contribution margin accounting. The
aim of capital management is to allocate capital over the various
divisions of the Group, with due consideration being given to
risk and return aspects, and also in line with the need to comply
with regulatory requirements concerning capital adequacy.
The regulatory own funds of the Helaba banking group are
determined in accordance with Regulation (EU) No. 575/2013
(CRR) and the complementary provisions in sections 10 and
10a of the German Banking Act (Kreditwesengesetz, KWG). In
accordance with the classification specified in the CRR, own
funds comprise Common Equity Tier 1 capital, Additional Tier 1
capital and Tier 2 capital. Since 2015, Helaba has had to comply
with the requirements of the European Single Supervisory
Mechanism (SSM), which extend beyond those of the CRR.
The regulatory own funds requirements and the capital ratios
are also determined in accordance with the provisions of the
CRR.
As at 31 December 2015, the breakdown of the own funds of the
Helaba banking group was as follows (each amount shown after
regulatory adjustments):
in € m
31.12.2015
31.12.2014
Tier 1 capital 8,171 7,703
Common Equity Tier 1 capital (CET 1) 7,564 7,212
Additional Tier 1 capital 607 491
Tier 2 capital 2,708 2,262
Own funds, total 10,879 9,965
Notes Consolidated Financial Statements 159C-121
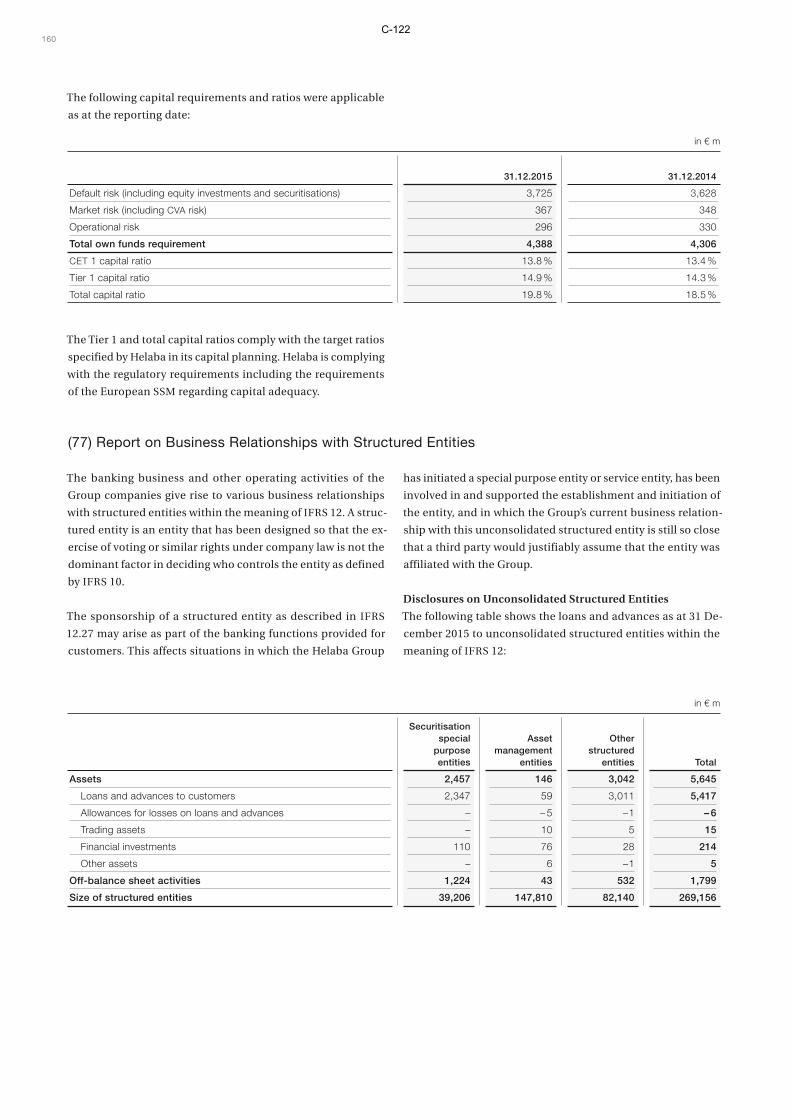
The following capital requirements and ratios were applicable
as at the reporting date:
in € m
31.12.2015
31.12.2014
Default risk (including equity investments and securitisations) 3,725 3,628
Market risk (including CVA risk) 367 348
Operational risk 296 330
Total own funds requirement 4,388 4,306
CET 1 capital ratio 13.8 % 13.4 %
Tier 1 capital ratio 14.9 % 14.3 %
Total capital ratio 19.8 % 18.5 %
The Tier 1 and total capital ratios comply with the target ratios
specified by Helaba in its capital planning. Helaba is complying
with the regulatory requirements including the requirements
of the European SSM regarding capital adequacy.
(77) Report on Business Relationships with Structured Entities
The banking business and other operating activities of the
Group companies give rise to various business relationships
with structured entities within the meaning of IFRS 12. A struc-
tured entity is an entity that has been designed so that the ex-
ercise of voting or similar rights under company law is not the
dominant factor in deciding who controls the entity as defined
by IFRS 10.
The sponsorship of a structured entity as described in IFRS
12.27 may arise as part of the banking functions provided for
customers. This affects situations in which the Helaba Group
has initiated a special purpose entity or service entity, has been
involved in and supported the establishment and initiation of
the entity, and in which the Group’s current business relation-
ship with this unconsolidated structured entity is still so close
that a third party would justifiably assume that the entity was
affiliated with the Group.
Disclosures on Unconsolidated Structured Entities
The following table shows the loans and advances as at 31 De-
cember 2015 to unconsolidated structured entities within the
meaning of IFRS 12:
in € m
Securitisation special
purpose entities
Asset management
entities
Other structured
entities Total
Assets 2,457 146 3,042 5,645
Loans and advances to customers 2,347 59 3,011 5,417
Allowances for losses on loans and advances – – 5 – 1 – 6
Trading assets – 10 5 15
Financial investments 110 76 28 214
Other assets – 6 – 1 5
Off-balance sheet activities 1,224 43 532 1,799
Size of structured entities 39,206 147,810 82,140 269,156
160C-122

The following table shows the corresponding amounts as at
31 December 2014:
in € m
Securitisation special
purpose entities
Asset management
entities
Other structured
entities Total
Assets 3,117 212 3,021 6,350
Loans and advances to customers 2,992 82 2,982 6,056
Allowances for losses on loans and advances – 1 – 4 – – 5
Trading assets 3 17 17 37
Financial investments 123 102 22 247
Other assets – 15 – 15
Off-balance sheet activities 1,341 20 147 1,508
Size of structured entities 66,901 145,602 85,068 297,571
The asset management entities predominantly relate to the
investment assets managed by Helaba Invest Kapitalanlage-
gesellschaft mbH and LB(Swiss) Investment AG, the breakdown
of which was as follows:
in € m
31.12.2015 31.12.2014
Retail funds 76 (2014: 70) 6,249 5,000
Special funds 247 (2014: 248) 107,073 97,136
Total 113,322 102,136
Some of the securitisation entities business comprises service
functions for securitisation entities in the OPUSALPHA Group.
The lines of liquidity provided for the entities in the OPUSALPHA
Group amounted to € 2,353 m (31 December 2014: € 2,201 m),
of which € 1,476 m had been drawn down as at 31 December
2015 (31 December 2014: € 1,108 m). The liquidity provision
commitments relate to the maximum planned purchase com-
mitments; Helaba has further obligations in connection with
flat-rate premiums of 2 % and is exposed to subordinated lia-
bilities should the discounts on purchases and risks borne by
third parties be insufficient. The table above shows the Group’s
default risk from asset exposures plus any current interest
and fees due to the Group as at 31 December 2015 after taking
into account issues of € 872 m (31 December 2014: € 793 m).
From the current perspective, there are no plans to provide
support for the structured entities beyond the normal banking
financing functions and services. As at 31 December 2015,
there were undrawn liquidity lines for third-party securitisa-
tion platforms amounting to € 65 m. The Helaba Group had
also provided finance for factoring entities for customers in-
cluding OPUSDELTA in an amount of € 182 m (31 December
2014: € 151 m) and OPUSLAMBDA in an amount of € 184 m
(31 December 2014: € 289 m).
The recognised loans and advances to other structured entities
related to a number of financing transactions for property and
special purpose entities. These structured entities predominantly
act as property entities for leasing or real estate transactions.
Disclosures on Consolidated Structured Entities
If a structured entity is included in the basis of consolidation
in accordance with IFRS 10, the business relationships with
other consolidated entities are subject to the normal consoli-
dation requirements. The structured entities consolidated as
at 31 December 2015 included special funds in which Helaba
or a subsidiary held a majority or all of the shares/units. Other
entities consolidated in accordance with IFRS 10 were a prop-
erty entity related to real estate partly used by Helaba itself
(Helicon Verwaltungsgesellschaft mbH & Co. Immobilien KG)
and a funding entity for purchasing entities in the OPUSALPHA
securitisation structure (OPUSALPHA Funding LTD). The con-
solidation in accordance with IFRS 10 additionally required the
inclusion of four entities (HANNOVER LEASING Life Invest
Deutschland I GmbH & Co. KG, Life Invest Deutschland II
GmbH & Co. KG, Egeria Verwaltungsgesellschaft mbH and
Cordelia Verwaltungsgesellschaft mbH) that formed part of the
structures of closed-end funds with investments in acquired
rights under life insurance policies.
Notes Consolidated Financial Statements 161C-123

In the year under review, two consolidated property entities
that formed part of the structures of closed-end funds for
investments in acquired rights under life insurance policies
were subject to debt waivers. These debt waivers are already
provided for in the contracts on a conditional basis depending
on trends in investments in acquired rights under life insur-
ance policies and, in substance, reduce the obligations of the
Bank to the fund companies in connection with issued invest-
ment certificates.
(78) Significant Restrictions on Assets or on the Transfer of Funds
In addition to the information in the disclosures on legal
restrictions affecting control over financial instruments (see
Notes (57) and (58)), there were restrictions for the following
entities as at the reporting date on current dividend distribu-
tions because of contractual arrangements or rules in the
articles of association:
■■ Bürgschaftsbank Thüringen GmbH, Erfurt,
■■ Bürgschaftsbank Hessen GmbH, Wiesbaden,
■■ Hessische Landgesellschaft mbH Staatliche Treuhandstelle
für ländliche Bodenordnung, Kassel,
■■ Hessenkapital I GmbH, Frankfurt am Main,
■■ Hessenkapital II GmbH, Frankfurt am Main,
■■ MBG H Mittelständische Beteiligungsgesellschaft Hessen
mbH, Frankfurt am Main,
■■ Mittelhessenfonds GmbH, Frankfurt am Main,
■■ Mittelständische Beteiligungsgesellschaft Thüringen mbH,
Erfurt.
At Frankfurter Sparkasse, a statutory requirement in the German
Act Establishing Frankfurter Sparkasse as a Public-Law Institu-
tion (Gesetz zur Errichtung der Frankfurter Sparkasse als Anstalt
des öffentlichen Rechts, Fraspa-Gesetz) specifies an obligation
to appropriate 30 % of the net income reported in the annual
financial statements of Frankfurter Sparkasse to reserves.
The consolidation of special purpose entities in accordance
with IFRS 10 is frequently not based on holding the majority of
voting rights. Accordingly, in the case of these consolidated
special purpose entities, there is no basis in law requiring un-
conditional, immediate appropriation of profits or transfer of
assets for the benefit of Helaba. The total volume of assets in
consolidated special purpose entities in accordance with IFRS
prior to consolidation amounted to € 2,410 m (31 December 2014:
€ 2,644 m). This total figure included an amount of € 1,883 m
(31 December 2014: € 1,363 m) related to the consolidated fund-
ing entity in the OPUSALPHA securitisation structure.
The business activities of Landesbausparkasse Hessen- Thüringen
and WIBank, and the activities in the Pfandbrief business op-
erated by the Bank, are subject to special legal frameworks,
namely the German Building and Loan Associations Act (Bau-
sparkassengesetz, BSpKG), the Act Governing WIBank (Gesetz
über die Wirtschafts- und Infrastrukturbank Hessen) and the
German Pfandbrief Act (Pfandbriefgesetz, PfandBG). Most of
the assets and liabilities in these business operations are there-
fore subject to restrictions because the operations are focused
on the object of the entity in each case and the appropriation
of funds is tied to statutory requirements. In some cases, the
way funding is used is also restricted. For example, in the case
of certain development programmes, such as those related to
the construction of social housing or the development of infra-
structure, the provider of the development funding (such as
national or international development banks, federal or state
governments) limits the purpose for which the funds may be
used to ensure that the funding is properly targeted to achieve
the desired development impact. In the case of the “Wohnungs-
wesen und Zukunftsinvestition” and “Hessischer Investitions-
fonds” special funds, two funds focusing on housing/investing
for the future and capital investment in the State of Hesse
respectively, there are also restrictions on the use of the return
inflows derived from the application of the funding. In their
respective annual reports as at 31 December 2015, WIBank
reported total assets of € 16,813 m (31 December 2014:
€ 15,861 m) and LBS total assets of € 5,191 m (31 December
2014: € 4,988 m).
Regulatory requirements relating to the recognition of own
funds specified certain contractual details for issues of subor-
dinated liabilities and silent participations. Under these re-
quirements, the Helaba Group’s right of termination is limited
if certain conditions are met and the consent of the regulator
must be obtained. The contractual rules for some issues require
a replenishment following any loss before any actual repay-
ment is made.
(79) Related Party Disclosures
In the course of the ordinary activities of Helaba, transactions
with parties deemed to be related in accordance with IAS 24 are
conducted on an arm’s-length basis. The following disclosures
relate to transactions with non-consolidated affiliated compa-
nies, with associates and with joint ventures of the Helaba
Group as well as their subordinated subsidiaries.
162C-124

With regard to the Sparkassen- und Giroverband Hessen-
Thüringen, the Federal State of Hesse and the Free State of
Thuringia in their capacity as shareholders and owners, the
criteria for exemption from reporting on related parties that
are public-sector entities are satisfied; this option is always
utilised if the business volumes involved are insignificant.
The business relations with our shareholders and their sub-
ordinated subsidiaries in accordance with IAS 24 comprise
normal banking services. The extent of business relations with
the shareholders and main subordinated companies in the year
under review is detailed in the balances at the end of the year
shown in the following table. The disclosures relating to per-
sons in key positions of the Helaba Group as defined in IAS 24,
including their close family relations and companies con-
trolled by those persons, are also included in the following
table.
The Helaba Group had the following receivables from, liabilities
due to and off-balance sheet commitments to related parties as
at 31 December 2015:
in € m
Non- consolidated subsidiaries
Equity investments
in joint ventures and
associatesHelaba
shareholders
Other related parties
Total
Assets 62 1,173 2,987 1 4,223
Loans and advances to banks – 3 – – 3
Loans and advances to customers 38 1,111 1,209 1 2,359
Allowances for losses on loans and advances – – 16 – – – 16
Trading assets – 9 1,065 – 1,074
Financial investments 24 49 597 – 670
Other assets – 1 116 – 117
Liabilities 5 344 875 63 1,287
Liabilities due to banks – – 189 – 189
Liabilities due to customers 5 342 449 37 833
Trading liabilities – – 125 – 125
Subordinated capital – – 100 – 100
Other liabilities – 2 12 26 40
Off-balance sheet activities 3 142 68 – 213
The equivalent amounts as at 31 December 2014 were as follows:
in € m
Non- consolidated subsidiaries
Equity investments
in joint ventures and
associatesHelaba
shareholders
Other related
parties1)
Total1)
Assets 127 1,615 3,134 80 4,956
Loans and advances to banks – 3 40 – 43
Loans and advances to customers 62 1,558 1,154 80 2,854
Allowances for losses on loans and advances – 6 – 24 – – – 30
Trading assets 40 10 1,308 – 1,358
Financial investments 25 38 516 – 579
Other assets – 6 116 – 122
Liabilities 23 283 1,048 24 1,378
Liabilities due to customers 13 281 816 24 1,134
Trading liabilities 9 1 175 – 185
Subordinated capital – – 43 – 43
Other liabilities 1 1 14 – 16
Off-balance sheet activities 17 165 59 3 244
1) Prior-year figures restated: reclassification of € 62 m from loans and advances to banks to loans and advances to customers.
Notes Consolidated Financial Statements 163C-125
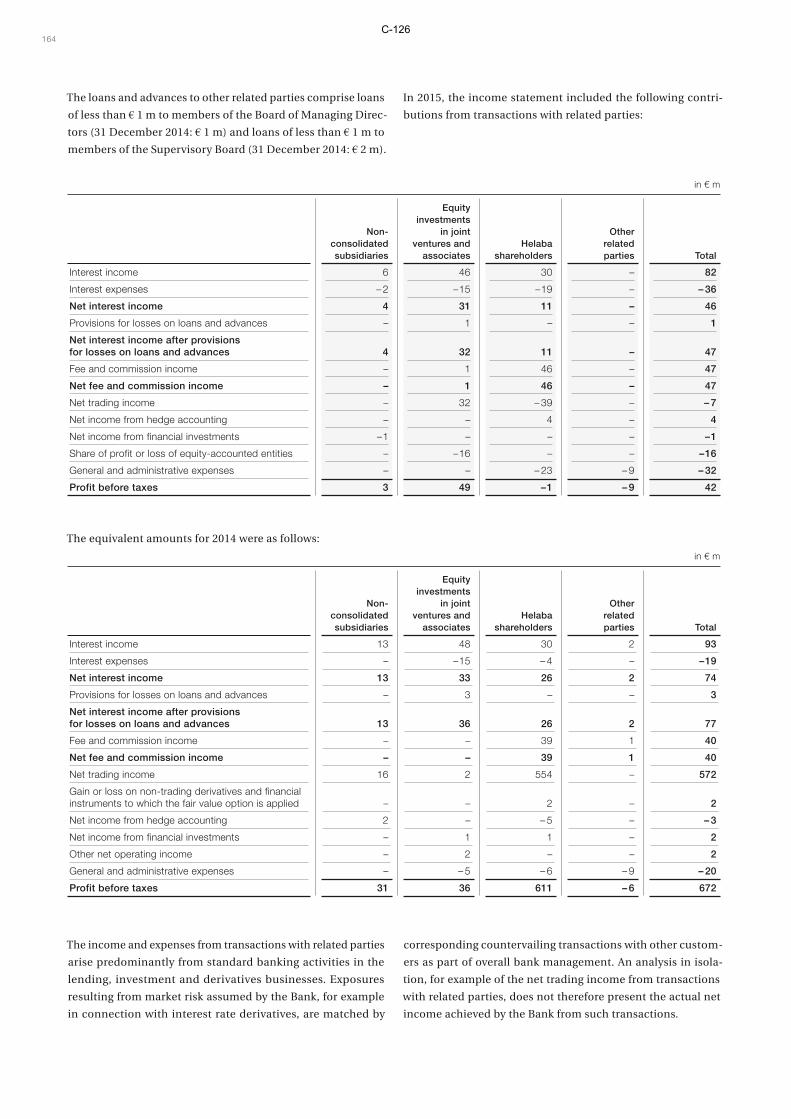
The loans and advances to other related parties comprise loans
of less than € 1 m to members of the Board of Managing Direc-
tors (31 December 2014: € 1 m) and loans of less than € 1 m to
members of the Supervisory Board (31 December 2014: € 2 m).
In 2015, the income statement included the following contri-
butions from transactions with related parties:
in € m
Non- consolidated subsidiaries
Equity investments
in joint ventures and
associatesHelaba
shareholders
Other related parties
Total
Interest income 6 46 30 – 82
Interest expenses – 2 – 15 – 19 – – 36
Net interest income 4 31 11 – 46
Provisions for losses on loans and advances – 1 – – 1
Net interest income after provisions for losses on loans and advances 4 32 11 – 47
Fee and commission income – 1 46 – 47
Net fee and commission income – 1 46 – 47
Net trading income – 32 – 39 – – 7
Net income from hedge accounting – – 4 – 4
Net income from financial investments – 1 – – – – 1
Share of profit or loss of equity-accounted entities – – 16 – – – 16
General and administrative expenses – – – 23 – 9 – 32
Profit before taxes 3 49 – 1 – 9 42
The equivalent amounts for 2014 were as follows:
in € m
Non- consolidated subsidiaries
Equity investments
in joint ventures and
associatesHelaba
shareholders
Other related parties
Total
Interest income 13 48 30 2 93
Interest expenses – – 15 – 4 – – 19
Net interest income 13 33 26 2 74
Provisions for losses on loans and advances – 3 – – 3
Net interest income after provisions for losses on loans and advances 13 36 26 2 77
Fee and commission income – – 39 1 40
Net fee and commission income – – 39 1 40
Net trading income 16 2 554 – 572
Gain or loss on non-trading derivatives and financial instruments to which the fair value option is applied – – 2 – 2
Net income from hedge accounting 2 – – 5 – – 3
Net income from financial investments – 1 1 – 2
Other net operating income – 2 – – 2
General and administrative expenses – – 5 – 6 – 9 – 20
Profit before taxes 31 36 611 – 6 672
The income and expenses from transactions with related parties
arise predominantly from standard banking activities in the
lending, investment and derivatives businesses. Exposures
resulting from market risk assumed by the Bank, for example
in connection with interest rate derivatives, are matched by
corresponding countervailing transactions with other custom-
ers as part of overall bank management. An analysis in isola-
tion, for example of the net trading income from transactions
with related parties, does not therefore present the actual net
income achieved by the Bank from such transactions.
164C-126

The remuneration paid to the Board of Managing Directors of
Helaba was broken down as follows:
in € m
2015
2014
Short-term benefits 4.9 4.6
Post-employment benefits – –
Other long-term benefits 1.6 1.2
Benefits payable on termination of employment – –
Additions of € 1.0 m were also made to the pension provisions
for members of the Board of Managing Directors (31 December
2014: € 0.7 m). This amount represented the current service
cost.
As in 2014, a total of € 0.9 m was paid to the Supervisory Board
and € 0.1 m to the members of the Advisory Board. In addi-
tion, the employee representatives on the Supervisory Board
(including deputy members) received a combined amount of
€ 3 m in salary payments as company employees. This amount
was unchanged compared with 2014. An amount of € 4 m was
paid to former members of the Board of Managing Directors
and their surviving dependants (2014: € 3 m). As at 31 December
2015, provisions of € 65 m were recognised in accordance with
IAS 19 for pension obligations for this group of persons (31 De-
cember 2014: € 64 m).
(80) Auditors’ Fees
The following fees for services rendered by Group companies
of PricewaterhouseCoopers AG Wirtschaftsprüfungsgesell-
schaft were invoiced for financial year 2015:
in € m
31.12.2015
31.12.2014
Audit fees 3 3
Other services 1 2
Total 4 5
(81) Employee Disclosures
Average number of employees during the year
Female Male Total
2015 2014 2015 2014 2015 2014
Bank as a whole 1,580 1,585 1,896 1,934 3,476 3,519
Bank 1,175 1,183 1,604 1,635 2,779 2,818
WIBank 237 235 173 175 410 410
Landesbausparkasse 168 167 119 124 287 291
Group subsidiaries 1,366 1,400 1,358 1,355 2,724 2,755
Group 2,946 2,985 3,254 3,289 6,200 6,274
Notes Consolidated Financial Statements 165C-127

(82) Members of the Supervisory Board
Gerhard Grandke Executive President Sparkassen- und GiroverbandHessen-ThüringenFrankfurt am Main/Erfurt– Chairman –
Dr. Werner HenningChief Administrative OfficerCounty District of Eichsfeld Heiligenstadt– First Vice-Chairman –
Dr. Thomas SchäferMinister of StateMinistry of Finance of the State of HesseWiesbaden– Second Vice-Chairman –
Hans MartzChairman of the Board of Managing DirectorsSparkasse EssenEssen– Third Vice-Chairman –– until 31 December 2015 –
Dr. Alfons LauerPresidentSparkassenverband SaarSaarbrücken– Fifth Vice-Chairman –– until 21 January 2015 –
Andreas BauseweinMayorCity of ErfurtErfurt– since 13 May 2015 –
Dr. Annette BellerMember of the Management BoardB. Braun Melsungen AGMelsungen– since 1 July 2015 –
Prof. Dr. h.c. Ludwig G. BraunChairman of the Supervisory BoardB. Braun Melsungen AGMelsungen– until 24 April 2015 –
Ingo BuchholzChairman of the Board of Managing Directors Kasseler SparkasseKassel
Patrick BurghardtMayorCity of RüsselsheimRüsselsheim– since 15 August 2015 –
Dirk DiedrichsSecretary of State (ret.)Erfurt– until 5 February 2015 –
Georg FahrenschonPresidentDeutscher Sparkassen- und Giroverband e. V.Berlin
Peter FeldmannMayorCity of Frankfurt am MainFrankfurt am Main– until 30 June 2015 –
Ulrich HeilmannChairman of the Board of Managing DirectorsKyffhäusersparkasse Artern-SondershausenSondershausen
Bertram HilgenMayorCity of KasselKassel
Dr. Christoph KrämerChairman of the Board of Managing DirectorsSparkasse IserlohnIserlohn
Stefan LauerIdstein– until 30 June 2015 –
Christoph MatschieMember of the State Parliament of ThuringiaErfurt– until 30 June 2015 –
Manfred MichelChief Administrative OfficerCountry District of Limburg-WeilburgLimburg an der Lahn
Gerhard MöllerMayorCity of FuldaFulda– until 14 August 2015 –
Frank NickelChairman of the Board of Managing DirectorsSparkasse Werra-MeissnerEschwege
Clemens ReifMember of the State Parliament of HesseWiesbaden
Stefan ReußChief Administrative OfficerCounty District of Werra-MeissnerEschwege– until 3 May 2015 –
Thorsten Schäfer-GümbelMember of the State Parliament of Hesse Wiesbaden
Uwe SchmidtChief Administrative OfficerCounty District of KasselKassel– since 13 May 2015 –
Dr. Hartmut SchubertSecretary of StateMinistry of Finance of the State of ThuringiaErfurt– since 24 March 2015 –
Wolfgang SchusterChief Administrative OfficerCounty District of Lahn-DillWetzlar
Dr. Eric TjarksChairman of the Board of Managing DirectorsSparkasse BensheimBensheim
Alfred WeberChairman of the Board of Managing DirectorsKreissparkasse Saalfeld-RudolstadtSaalfeld– until 31 December 2015 –
Stephan ZieglerChairman of the Board of Managing DirectorsNassauische SparkasseWiesbaden– until 30 September 2015 –
Ulrich ZinnChairman of the Board of Managing DirectorsSparkasse GrünbergGrünberg
Arnd ZinnhardtMember of the Group Executive BoardSoftware AGDarmstadt
166C-128

Employee representatives:
Thorsten DerlitzkiBank employeeFrankfurt am Main– Fourth Vice-Chairman –
Frank BeckVice PresidentFrankfurt am Main
Brigitte BerleBank employeeFrankfurt am Main
Isolde BurhenneVice PresidentFrankfurt am Main– until 30 June 2015 –
Werner DölitzscherVice President Frankfurt am Main– since 1 July 2015 –
Gabriele FuchsBank employeeFrankfurt am Main
Thorsten KiwitzVice PresidentFrankfurt am Main
Christiane Kutil-BleibaumVice PresidentDüsseldorf
Annette LangnerVice PresidentFrankfurt am Main
Susanne NollBank employeeFrankfurt am Main
Hans PeschkaVice PresidentFrankfurt am Main
Erich RothBank employeeFrankfurt am Main– until 30 June 2015 –
Birgit Sahliger-RasperBank employeeFrankfurt am Main
Susanne SchmiedebachVice PresidentDüsseldorf
Wolf-Dieter TeschSenior Vice PresidentFrankfurt am Main– until 30 June 2015 –
(83) Members of the Board of Managing Directors
Herbert Hans Grüntker– since 1 August 2015 –– Chairman since 1 October 2015
(Vice-Chairman until 30 September) –
Hans-Dieter BrennerChairman – until 30 September 2015 –
Thomas Groß– Vice-Chairman since 1 October 2015 –
Jürgen Fenk
Dr. Detlef Hosemann
Rainer Krick
Klaus-Jörg Mulfinger– since 1 January 2015 –
Dr. Norbert Schraad
Notes Consolidated Financial Statements 167C-129

(84) Positions on Supervisory Boards and Other Executive Bodies
Positions held by the members of the Board
of Managing Directors
Office holder Corporation Function
Herbert Hans Grüntker Frankfurter Bankgesellschaft (Schweiz) AG, Zurich, Switzerland Member
Helaba Invest Kapitalanlagegesellschaft mbH, Frankfurt am Main Chairman
Jürgen Fenk GWH Immobilien Holding GmbH, Frankfurt am Main Chairman
Frankfurter Sparkasse, Frankfurt am Main First Vice-Chairman
Helaba Invest Kapitalanlagegesellschaft mbH, Frankfurt am Main Member
Thomas Groß Deutscher Sparkassen Verlag GmbH, Stuttgart Member
Frankfurter Sparkasse, Frankfurt am Main Member
Dr. Detlef Hosemann Deutsche WertpapierService Bank AG, Frankfurt am Main Member
Frankfurter Sparkasse, Frankfurt am Main Chairman
GWH Immobilien Holding GmbH, Frankfurt am Main Vice-Chairman
Rainer Krick Frankfurter Bankgesellschaft (Deutschland) AG, Frankfurt am Main Vice-Chairman
Frankfurter Bankgesellschaft (Schweiz) AG, Zurich, Switzerland Member
Helaba Invest Kapitalanlagegesellschaft mbH, Frankfurt am Main Vice-Chairman
Klaus-Jörg Mulfinger Frankfurter Sparkasse, Frankfurt am Main Member
Thüringer Aufbaubank, Erfurt Member
Positions held by other employees
Office holder Corporation Function
Jörg Hartmann AKA Ausfuhrkredit-Gesellschaft mbH, Frankfurt am Main Member
Dieter Kasten GWH Immobilien Holding GmbH, Frankfurt am Main Member
Holger Mai Frankfurter Bankgesellschaft (Deutschland) AG, Frankfurt am Main Chairman
Dirk Mewesen Helaba Asset Services, Dublin, Ireland Member
Dr. Ulrich Pähler Helaba Asset Services, Dublin, Ireland Vice-Chairman
Dr. Michael Reckhard Bürgschaftsbank Hessen GmbH, Wiesbaden Member
Dr. Alois Rhiel Helmholtz Zentrum München Deutsches Forschungszentrum für Gesundheit und Umwelt (GmbH), Munich
Member
Klaus Georg Schmidbauer Bürgschaftsbank Thüringen GmbH, Erfurt Member
Erich Vettiger Frankfurter Bankgesellschaft (Deutschland) AG, Frankfurt am Main Member
168C-130
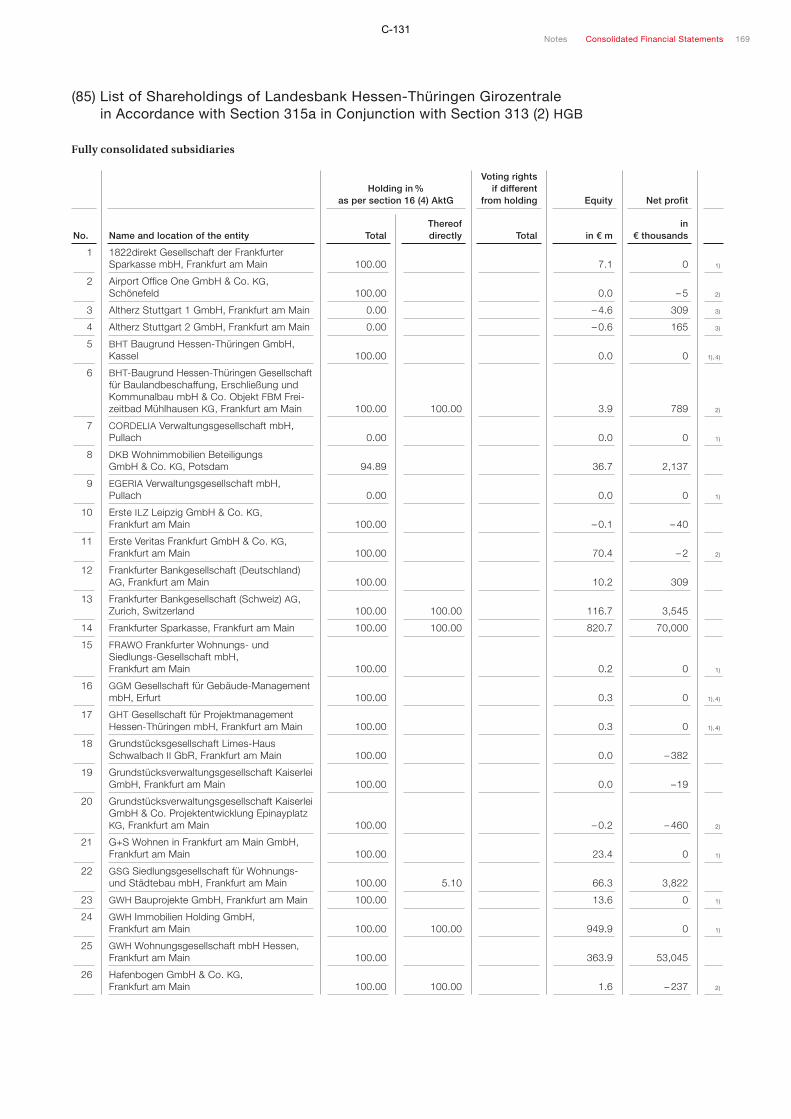
(85) List of Shareholdings of Landesbank Hessen-Thüringen Girozentrale in Accordance with Section 315a in Conjunction with Section 313 (2) HGB
Fully consolidated subsidiaries
Holding in %
as per section 16 (4) AktG
Voting rights if different
from holding Equity Net profit
No. Name and location of the entity TotalThereof directly Total in € m
in € thousands
1 1822direkt Gesellschaft der Frankfurter Sparkasse mbH, Frankfurt am Main 100.00 7.1 0 1)
2 Airport Office One GmbH & Co. KG, Schönefeld 100.00 0.0 – 5 2)
3 Altherz Stuttgart 1 GmbH, Frankfurt am Main 0.00 – 4.6 309 3)
4 Altherz Stuttgart 2 GmbH, Frankfurt am Main 0.00 – 0.6 165 3)
5 BHT Baugrund Hessen- Thüringen GmbH, Kassel 100.00 0.0 0 1), 4)
6
BHT-Baugrund Hessen- Thüringen Gesellschaft für Baulandbeschaffung, Erschließung und Kommunalbau mbH & Co. Objekt FBM Frei-zeitbad Mühlhausen KG, Frankfurt am Main 100.00 100.00 3.9 789 2)
7 CORDELIA Verwaltungsgesellschaft mbH, Pullach 0.00 0.0 0 1)
8 DKB Wohnimmobilien Beteiligungs GmbH & Co. KG, Potsdam 94.89 36.7 2,137
9 EGERIA Verwaltungsgesellschaft mbH, Pullach 0.00 0.0 0 1)
10 Erste ILZ Leipzig GmbH & Co. KG, Frankfurt am Main 100.00 – 0.1 – 40
11 Erste Veritas Frankfurt GmbH & Co. KG, Frankfurt am Main 100.00 70.4 – 2 2)
12 Frankfurter Bankgesellschaft (Deutschland) AG, Frankfurt am Main 100.00 10.2 309
13 Frankfurter Bankgesellschaft (Schweiz) AG, Zurich, Switzerland 100.00 100.00 116.7 3,545
14 Frankfurter Sparkasse, Frankfurt am Main 100.00 100.00 820.7 70,000
15
FRAWO Frankfurter Wohnungs- und Siedlungs-Gesellschaft mbH, Frankfurt am Main 100.00 0.2 0 1)
16 GGM Gesellschaft für Gebäude-Management mbH, Erfurt 100.00 0.3 0 1), 4)
17 GHT Gesellschaft für Projektmanagement Hessen- Thüringen mbH, Frankfurt am Main 100.00 0.3 0 1), 4)
18 Grundstücksgesellschaft Limes-Haus Schwalbach II GbR, Frankfurt am Main 100.00 0.0 – 382
19 Grundstücksverwaltungsgesellschaft Kaiserlei GmbH, Frankfurt am Main 100.00 0.0 – 19
20
Grundstücksverwaltungsgesellschaft Kaiserlei GmbH & Co. Projektentwicklung Epinayplatz KG, Frankfurt am Main 100.00 – 0.2 – 460 2)
21 G+S Wohnen in Frankfurt am Main GmbH, Frankfurt am Main 100.00 23.4 0 1)
22 GSG Siedlungsgesellschaft für Wohnungs- und Städtebau mbH, Frankfurt am Main 100.00 5.10 66.3 3,822
23 GWH Bauprojekte GmbH, Frankfurt am Main 100.00 13.6 0 1)
24 GWH Immobilien Holding GmbH, Frankfurt am Main 100.00 100.00 949.9 0 1)
25 GWH Wohnungsgesellschaft mbH Hessen, Frankfurt am Main 100.00 363.9 53,045
26 Hafenbogen GmbH & Co. KG, Frankfurt am Main 100.00 100.00 1.6 – 237 2)
Notes Consolidated Financial Statements 169C-131

Holding in %
as per section 16 (4) AktG
Voting rights if different
from holding Equity Net profit
No. Name and location of the entity TotalThereof directly Total in € m
in € thousands
27 HANNOVER LEASING Life Invest Deutschland I GmbH & Co. KG, Pullach 0.00 13.5 – 541 3)
28 HANNOVER LEASING Life Invest Deutschland II GmbH & Co. KG, Pullach 0.00 14.0 – 333 3)
29 Haus am Brüsseler Platz GmbH & Co. KG, Frankfurt am Main 100.00 0.0 – 107 2)
30 Haus am Zentralen Platz GmbH & Co. KG, Frankfurt am Main 100.00 100.00 6.3 441 2)
31 Helaba Asset Services, Dublin, Ireland 100.00 100.00 58.0 2,360
32 Helaba Invest Kapitalanlagegesellschaft mbH, Frankfurt am Main 100.00 100.00 13.0 0 1)
33 Helicon Verwaltungsgesellschaft mbH & Co. Immobilien KG, Pullach 5.92 – 132.4 4,044 3)
34 Hello Darmstadt Projektentwicklung GmbH & Co. KG, Frankfurt am Main 100.00 0.0 – 1
35 HeWiPPP II GmbH & Co. KG, Frankfurt am Main 100.00 2.5 17 2)
36 Honua‘ula Partners LLC, Wailea, Hawaii, USA 0.00 107.5 – 56,290 3)
37 Horrido-Grundstücksverwaltungsgesellschaft mbH & Co. Vermietungs OHG, Mainz 95.00 95.00 24.00 – 7.7 1,653 3)
38 HTB Grundstücksverwaltungsgesellschaft mbH, Frankfurt am Main 100.00 100.00 0.0 9
39 Kornmarkt Arkaden Dritte GmbH & Co. KG, Frankfurt am Main 100.00 0.0 – 11 2)
40 Kornmarkt Arkaden Erste GmbH & Co. KG, Frankfurt am Main 100.00 – 2.0 2,181 2)
41 Kornmarkt Arkaden Vierte GmbH & Co. KG, Frankfurt am Main 100.00 0.0 – 34 2)
42 Kornmarkt Arkaden Zweite GmbH & Co. KG, Frankfurt am Main 100.00 – 0.2 – 198 2)
43 LB(Swiss) Investment AG, Zurich, Switzerland 100.00 10.5 1,586
44 LHT MSIP, LLC, Wilmington, USA 100.00 6.0 370
45 LHT Power Three LLC, Wilmington, USA 100.00 100.00 49.1 702
46 LHT TCW, LLC, Wilmington, USA 100.00 23.3 1,414
47 LHT TPF II, LLC, Wilmington, USA 100.00 21.5 527
48 Logistica CPH K/S, Kastrup, Denmark 53.33 53.33 – 0.1 – 151
49 Main Capital Funding II Limited Partnership, St. Helier, Jersey 0.00 16.3 119 3)
50 Main Capital Funding Limited Partnership, St. Helier, Jersey 0.00 7.5 – 1 3)
51 MAVEST Vertriebsgesellschaft mbH, Frankfurt am Main 100.00 0.0 0 1)
52 MAVEST Wohnungsbaugesellschaft mbH, Frankfurt am Main 99.99 5.7 907
53 Merian GmbH Wohnungsunternehmen, Frankfurt am Main 94.90 20.7 1,049
54 Montindu S.A./N.V., Brussels, Belgium 100.00 99.97 14.7 99
55 Neunte P 1 Projektgesellschaft mbH & Co. KG, Frankfurt am Main 100.00 0.0 – 57 2)
56 OFB Beteiligungen GmbH, Frankfurt am Main 100.00 5.6 209
57 OFB Projektentwicklung GmbH, Frankfurt am Main 100.00 100.00 1.1 0 1), 4)
58 OPUSALPHA FUNDING LTD, Dublin, Ireland 0.00 0.0 5 3)
59 Projekt Hirschgarten MK8 GmbH & Co. KG, Frankfurt am Main 100.00 – 0.2 – 176 2)
60 Projekt Wilhelmstraße Wiesbaden GmbH & Co. KG, Frankfurt am Main 100.00 – 1.0 – 1,104
170C-132

Holding in % as per section 16 (4) AktG
Voting rights if different
from holding Equity Net profit
No. Name and location of the entity TotalThereof directly Total in € m
in € thousands
61 Projektentwicklung Königstor GmbH & Co. KG, Kassel 100.00 0.0 159 2)
62 Projektentwicklung Lutherplatz GmbH & Co. KG, Frankfurt am Main 100.00 0.0 –152 2)
63 Projektgesellschaft Eichplatz Jena mbH & Co. KG, Frankfurt am Main 100.00 0.0 – 2 2)
64 PVG GmbH, Frankfurt am Main 100.00 100.00 0.2 152 1), 4)
65 SQO Stadt Quartier Offenburg GmbH & Co. KG, Frankfurt am Main 100.00 0.0 – 59
66 Systeno GmbH, Frankfurt am Main 100.00 0.9 – 93
67 TE Kronos GmbH, Frankfurt am Main 100.00 100.00 3.0 3,144
68 uniQus Projektentwicklung GmbH & Co. KG, Frankfurt am Main 100.00 0.0 –17 2)
69 Versicherungsservice der Frankfurter Sparkasse GmbH, Frankfurt am Main 100.00 0.3 0 1)
70 Verso Grundstücksentwicklung GmbH & Co. KG, Frankfurt am Main 100.00 0.1 – 46 2)
71 Verso Projektentwicklung GmbH & Co. KG, Frankfurt am Main 100.00 0.0 0 2)
72 Zweite ILZ Leipzig GmbH & Co. KG, Frankfurt am Main 100.00 0.0 –11
73 Zweite OFB PE GmbH & Co. KG, Frankfurt am Main 100.00 0.0 –1
Holding in %Fund
volume
No.Securities investment funds in accordance with KAGB Total
Thereof directly in € m
74 HI A-FSP Fonds, Frankfurt am Main 100.00 139.0 3), 5)
75 HI C-FSP Fonds, Frankfurt am Main 100.00 126.4 3), 5)
76 HI FBI Fonds, Frankfurt am Main 100.00 132.3 3), 5)
77 HI FBP Fonds, Frankfurt am Main 100.00 93.3 3), 5)
78 HI FSP Fonds, Frankfurt am Main 100.00 169.0 3), 5)
79 HI H-FSP Fonds, Frankfurt am Main 100.00 136.5 3), 5)
80 HI-HT-KOMP-Fonds, Frankfurt am Main 100.00 165.6 3), 5)
81 HI-HTNW, Frankfurt am Main 100.00 100.00 989.0 3), 5)
82 HI-RENTPLUS-FONDS, Frankfurt am Main 100.00 100.00 499.5 3), 5)
83 HI-TURBO-FONDS, Frankfurt am Main 100.00 100.00 773.6 3), 5)
Notes Consolidated Financial Statements 171C-133
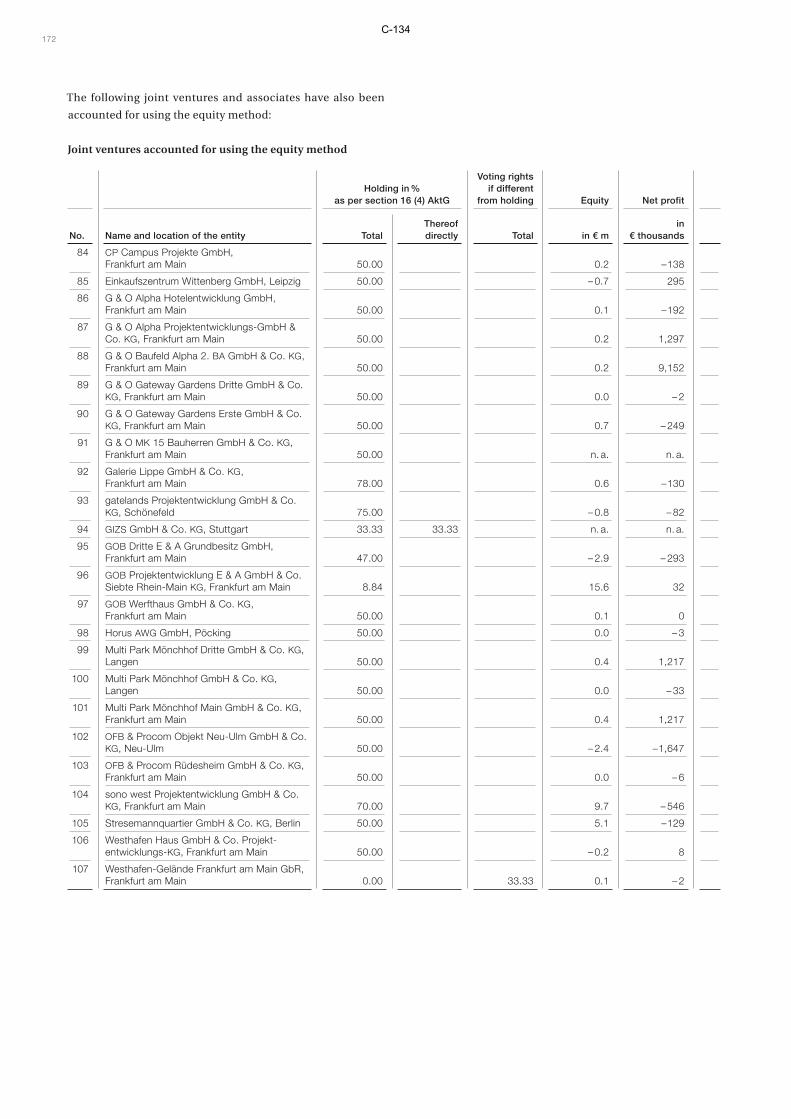
The following joint ventures and associates have also been
accounted for using the equity method:
Joint ventures accounted for using the equity method
Holding in %
as per section 16 (4) AktG
Voting rights if different
from holding Equity Net profit
No. Name and location of the entity TotalThereof directly Total in € m
in € thousands
84 CP Campus Projekte GmbH, Frankfurt am Main 50.00 0.2 – 138
85 Einkaufszentrum Wittenberg GmbH, Leipzig 50.00 – 0.7 295
86 G & O Alpha Hotelentwicklung GmbH, Frankfurt am Main 50.00 0.1 – 192
87 G & O Alpha Projektentwicklungs-GmbH & Co. KG, Frankfurt am Main 50.00 0.2 1,297
88 G & O Baufeld Alpha 2. BA GmbH & Co. KG, Frankfurt am Main 50.00 0.2 9,152
89 G & O Gateway Gardens Dritte GmbH & Co. KG, Frankfurt am Main 50.00 0.0 – 2
90 G & O Gateway Gardens Erste GmbH & Co. KG, Frankfurt am Main 50.00 0.7 – 249
91 G & O MK 15 Bauherren GmbH & Co. KG, Frankfurt am Main 50.00 n. a. n. a.
92 Galerie Lippe GmbH & Co. KG, Frankfurt am Main 78.00 0.6 – 130
93 gatelands Projektentwicklung GmbH & Co. KG, Schönefeld 75.00 – 0.8 – 82
94 GIZS GmbH & Co. KG, Stuttgart 33.33 33.33 n. a. n. a.
95 GOB Dritte E & A Grundbesitz GmbH, Frankfurt am Main 47.00 – 2.9 – 293
96 GOB Projektentwicklung E & A GmbH & Co. Siebte Rhein-Main KG, Frankfurt am Main 8.84 15.6 32
97 GOB Werfthaus GmbH & Co. KG, Frankfurt am Main 50.00 0.1 0
98 Horus AWG GmbH, Pöcking 50.00 0.0 – 3
99 Multi Park Mönchhof Dritte GmbH & Co. KG, Langen 50.00 0.4 1,217
100 Multi Park Mönchhof GmbH & Co. KG, Langen 50.00 0.0 – 33
101 Multi Park Mönchhof Main GmbH & Co. KG, Frankfurt am Main 50.00 0.4 1,217
102 OFB & Procom Objekt Neu-Ulm GmbH & Co. KG, Neu-Ulm 50.00 – 2.4 – 1,647
103 OFB & Procom Rüdesheim GmbH & Co. KG, Frankfurt am Main 50.00 0.0 – 6
104 sono west Projektentwicklung GmbH & Co. KG, Frankfurt am Main 70.00 9.7 – 546
105 Stresemannquartier GmbH & Co. KG, Berlin 50.00 5.1 – 129
106 Westhafen Haus GmbH & Co. Projekt-entwicklungs-KG, Frankfurt am Main 50.00 – 0.2 8
107 Westhafen-Gelände Frankfurt am Main GbR, Frankfurt am Main 0.00 33.33 0.1 – 2
172C-134

Associates accounted for using the equity method
Holding in %
as per section 16 (4) AktG
Voting rights if different
from holding Equity Net profit
No. Name and location of the entity TotalThereof directly Total in € m
in € thousands
108 Grundstücksgesellschaft Gateway Gardens GmbH, Frankfurt am Main 33.33 6.6 – 130
109 HANNOVER LEASING GmbH & Co. KG, Pullach 49.34 49.34 22.8 424
110 WoWi Media GmbH & Co. KG, Hamburg 23.72 19.24 2.8 7
Non-consolidated subsidiaries
Holding in %
as per section 16 (4) AktG
Voting rights if different
from holding Equity Net profit
No. Name and location of the entity TotalThereof directly Total in € m
in € thousands
111 Arealogics GmbH, Frankfurt am Main 100.00 0.0 1
112
BGT-Grundstücksverwaltungs- und Beteiligungs gesellschaft mbH, Frankfurt am Main 100.00 100.00 0.0 0 1)
113
BHT Baugrund Hessen- Thüringen Gesell-schaft für Baulandbeschaffung, Erschließung und Kommunalbau mbH & Co. Objekt Bauhof Maintal KG, Frankfurt am Main 50.00 50.00 66.67 0.8 90
114
BHT-Baugrund Hessen- Thüringen Gesell-schaft für Baulandbeschaffung, Erschließung und Kommunalbau mbH & Co. Objekt GZH Gemeindezentrum Hünstetten KG, Frankfurt am Main 100.00 100.00 1.1 146
115
BHT-Baugrund Hessen- Thüringen Gesell-schaft für Baulandbeschaffung, Erschließung und Kommunalbau mbH & Co. Objekt MGK Marstall-Gebäude Kassel KG, Kassel 50.00 50.00 66.67 0.4 54
116
BHT-Baugrund Hessen- Thüringen Gesell-schaft für Baulandbeschaffung, Erschließung und Kommunalbau mbH & Co. Objekt Sparkassenfiliale Seeheim-Jugenheim KG, Frankfurt am Main 100.00 100.00 1.7 199
117
BHT-Baugrund Hessen- Thüringen Gesell-schaft für Baulandbeschaffung, Erschließung und Kommunalbau mbH & Co. Objekt TFK II Tiefgarage Kassel 2. BA KG, Kassel 33.33 33.33 66.67 1.7 244
118 BM H Beteiligungs-Managementgesellschaft Hessen mbH, Frankfurt am Main 100.00 100.00 1.3 608
119 Bürogebäude Darmstädter Landstraße GmbH & Co. KG, Frankfurt am Main 100.00 100.00 0.2 18
120
BWT Beteiligungsgesellschaft für den Wirtschaftsaufbau Thüringens mbH, Frankfurt am Main 100.00 100.00 5.2 9
121 Div Deutsche Immobilienfonds Verwaltungs-gesellschaft mbH, Frankfurt am Main 100.00 0.1 0 1)
122 Dritte OFB PE GmbH & Co. KG, Frankfurt am Main 100.00 n. a. n. a.
123 FAM-Grundstücksverwaltungs- und Betei-ligungsgesellschaft mbH, Frankfurt am Main 100.00 100.00 0.2 6
124 FMZ Fulda Verwaltung GmbH, Frankfurt am Main 100.00 0.1 21
Notes Consolidated Financial Statements 173C-135

Holding in %
as per section 16 (4) AktG
Voting rights if different
from holding Equity Net profit
No. Name and location of the entity TotalThereof directly Total in € m
in € thousands
125
GIMPRO Beteiligungs- und Geschäftsführungs gesellschaft mbH, Frankfurt am Main 100.00 0.2 3
126 HaemoSys GmbH, Jena 38.33 – 4.8 – 524
127 HT-Finanzanlage Ltd, St. Helier, Jersey 0.00 0.0 129 3), 6)
128 Helaba Gesellschaft für Immobilienbewertung mbH, Frankfurt am Main 100.00 100.00 0.2 0
129 Helaba Projektbeteiligungsgesellschaft für Immobilien mbH, Frankfurt am Main 100.00 100.00 3.0 – 8
130 IHB Investitions- und Handels- Aktiengesellschaft, Frankfurt am Main 100.00 100.00 0.9 38
131 Innovationsfonds Hessen-Verwaltungs-gesellschaft mbH i.L., Frankfurt am Main 100.00 100.00 0.1 – 7
132 Kalypso Projekt GmbH & Co. KG, Frankfurt am Main 100.00 0.0 – 14
133
KHR Hessengrund-Gesellschaft für Baulandbeschaffung, Erschließung und Kommunalbau mbH & Co. Objekt Kulturhalle Rödermark KG, Frankfurt am Main 50.00 50.00 66.67 2.7 432
134 Komplementarselskabet Logistica CPH ApS, Kastrup, Denmark 52.00 52.00 0.0 – 1
135 Königstor Verwaltungs-GmbH, Kassel 100.00 0.0 0
136 Kornmarkt Arkaden Verwaltung GmbH, Frankfurt am Main 100.00 0.0 0
137 LBS Immobilien GmbH, Frankfurt am Main 100.00 100.00 1.3 21
138 Nötzli, Mai & Partner Family Office AG, Zurich, Switzerland 100.00 0.3 32
139 OFB Berlin Projekt GmbH, Berlin 100.00 0.0 – 1
140 OFB Projektverwaltung GmbH, Frankfurt am Main 100.00 0.0 1
141 Office One Verwaltung GmbH, Schönefeld 100.00 0.0 2
142 Projekt Erfurt B38 GmbH & Co. KG, Frankfurt am Main 100.00 n. a. n. a.
143 Projekt Feuerbachstraße Verwaltung GmbH, Frankfurt am Main 70.00 0.0 0
144 S-Beteiligungsgesellschaft Hessen- Thüringen mbH, Frankfurt am Main 100.00 100.00 6.1 – 42
145 TE Beta GmbH, Frankfurt am Main 100.00 100.00 0.3 94
146 TE Gamma GmbH, Frankfurt am Main 100.00 100.00 0.0 7
147
TF H Technologie-Finanzierungsfonds Hessen Gesellschaft mit beschränkter Haftung (TF H GmbH), Frankfurt am Main 66.67 66.67 66.66 0.6 0
148
TFK Hessengrund-Gesellschaft für Baulandbeschaffung, Erschließung und Kommunalbau mbH & Co. Objekt Tiefgarage Friedrichsplatz Kassel KG i.L., Kassel 33.33 33.33 66.67 1.6 27
149 Unterstützungseinrichtung der Landesbank Hessen- Thüringen GmbH, Frankfurt am Main 100.00 100.00 0.0 0
174C-136
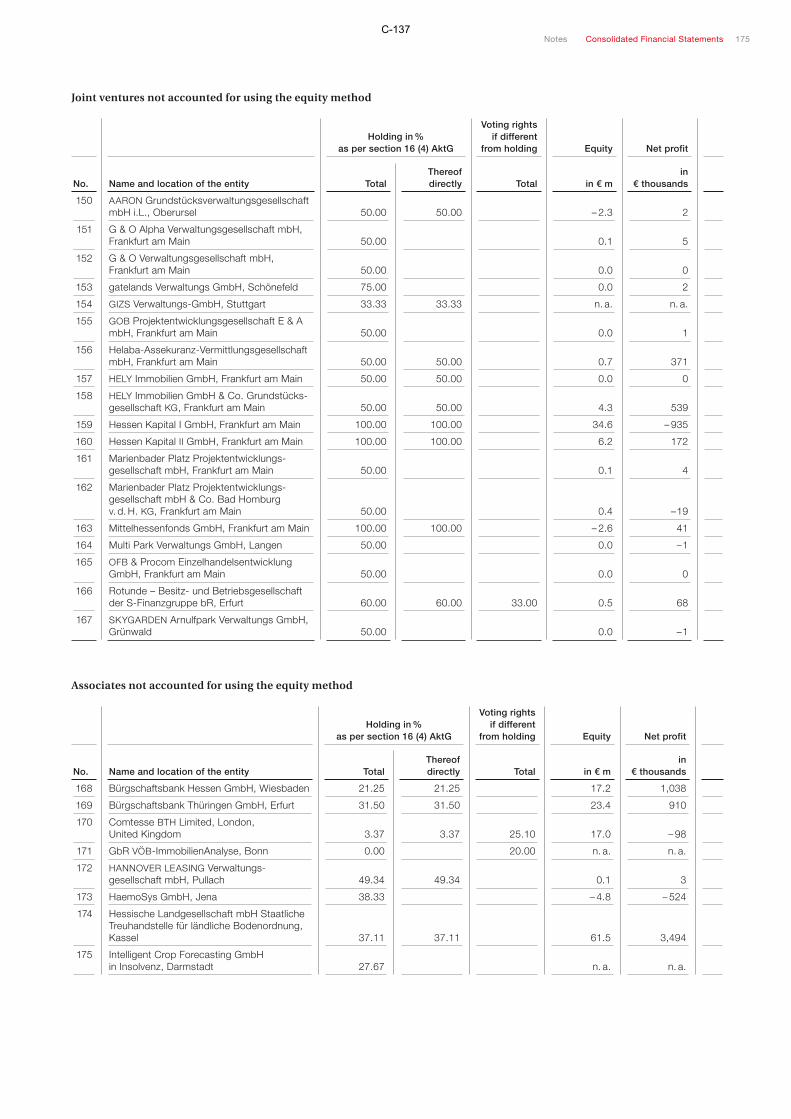
Joint ventures not accounted for using the equity method
Holding in %
as per section 16 (4) AktG
Voting rights if different
from holding Equity Net profit
No. Name and location of the entity TotalThereof directly Total in € m
in € thousands
150 AARON Grundstücksverwaltungsgesellschaft mbH i.L., Oberursel 50.00 50.00 – 2.3 2
151 G & O Alpha Verwaltungsgesellschaft mbH, Frankfurt am Main 50.00 0.1 5
152 G & O Verwaltungsgesellschaft mbH, Frankfurt am Main 50.00 0.0 0
153 gatelands Verwaltungs GmbH, Schönefeld 75.00 0.0 2
154 GIZS Verwaltungs-GmbH, Stuttgart 33.33 33.33 n. a. n. a.
155 GOB Projektentwicklungsgesellschaft E & A mbH, Frankfurt am Main 50.00 0.0 1
156 Helaba- Assekuranz-Vermittlungsgesellschaft mbH, Frankfurt am Main 50.00 50.00 0.7 371
157 HELY Immobilien GmbH, Frankfurt am Main 50.00 50.00 0.0 0
158 HELY Immobilien GmbH & Co. Grundstücks-gesellschaft KG, Frankfurt am Main 50.00 50.00 4.3 539
159 Hessen Kapital I GmbH, Frankfurt am Main 100.00 100.00 34.6 – 935
160 Hessen Kapital II GmbH, Frankfurt am Main 100.00 100.00 6.2 172
161 Marienbader Platz Projektentwicklungs-gesellschaft mbH, Frankfurt am Main 50.00 0.1 4
162
Marienbader Platz Projektentwicklungs-gesellschaft mbH & Co. Bad Homburg v. d. H. KG, Frankfurt am Main 50.00 0.4 – 19
163 Mittelhessenfonds GmbH, Frankfurt am Main 100.00 100.00 – 2.6 41
164 Multi Park Verwaltungs GmbH, Langen 50.00 0.0 – 1
165 OFB & Procom Einzelhandelsentwicklung GmbH, Frankfurt am Main 50.00 0.0 0
166 Rotunde – Besitz- und Betriebsgesellschaft der S-Finanzgruppe bR, Erfurt 60.00 60.00 33.00 0.5 68
167 SKYGARDEN Arnulfpark Verwaltungs GmbH, Grünwald 50.00 0.0 – 1
Associates not accounted for using the equity method
Holding in %
as per section 16 (4) AktG
Voting rights if different
from holding Equity Net profit
No. Name and location of the entity TotalThereof directly Total in € m
in € thousands
168 Bürgschaftsbank Hessen GmbH, Wiesbaden 21.25 21.25 17.2 1,038
169 Bürgschaftsbank Thüringen GmbH, Erfurt 31.50 31.50 23.4 910
170 Comtesse BTH Limited, London, United Kingdom 3.37 3.37 25.10 17.0 – 98
171 GbR VÖB-ImmobilienAnalyse, Bonn 0.00 20.00 n. a. n. a.
172 HANNOVER LEASING Verwaltungs-gesellschaft mbH, Pullach 49.34 49.34 0.1 3
173 HaemoSys GmbH, Jena 38.33 – 4.8 – 524
174
Hessische Landgesellschaft mbH Staatliche Treuhandstelle für ländliche Bodenordnung, Kassel 37.11 37.11 61.5 3,494
175 Intelligent Crop Forecasting GmbH in Insolvenz, Darmstadt 27.67 n. a. n. a.
Notes Consolidated Financial Statements 175C-137

Holding in %
as per section 16 (4) AktG
Voting rights if different
from holding Equity Net profit
No. Name and location of the entity TotalThereof directly Total in € m
in € thousands
176
Liparit Grundstücksverwaltungsgesellschaft mbH & Co. Objekt Benary Vermietungs KG, Mainz 21.62 4.0 1,483
177 Logistikzentrum Rodgau GmbH, Schönefeld 25.00 – 0.8 – 150
178 MBG H Mittelständische Beteiligungs-gesellschaft Hessen mbH, Frankfurt am Main 32.52 32.52 9.9 468
179 Mittelständische Beteiligungsgesellschaft Thüringen mbH, Erfurt 38.56 38.56 21.5 841
180 MS „EAGLE STRAIT“ GmbH & Co. KG, Hamburg 0.00 – 0.1 – 378
181 MS „EMERALD STRAIT“ GmbH & Co. KG, Hamburg 0.00 – 0.1 – 378
182 MS „ENDEAVOUR STRAIT“ GmbH & Co. KG, Hamburg 0.00 – 0.1 – 378
183 MS „ESSEX STRAIT“ GmbH & Co. KG, Hamburg 0.00 – 0.1 – 378
184 Riedemannweg 59 – 60 GbR, Berlin 32.00 32.00 – 4.0 198
185 Sparkassen-Marktservice Beteiligungs GmbH & Co. KG, Frankfurt am Main 50.00 40.00 n. a. n. a.
186 Sparkassen-Marktservice Verwaltungs GmbH, Frankfurt am Main 50.00 40.00 n. a. n. a.
187 Vierte Airport Bureau-Center KG Airport Bureau Verwaltungs GmbH & Co., Berlin 31.98 31.98 – 3.2 – 33
Holding of more than 20 %
Holding in %
as per section 16 (4) AktG
Voting rights if different
from holding Equity Net profit
No. Name and location of the entity TotalThereof directly Total in € m
in € thousands
188 BIL Leasing GmbH & Co. Objekt Verwaltungsgebäude Halle KG, Munich 100.00 0.21 – 0.6 3
Interests in large corporations in which the holding is 5 % or larger
Holding in %
as per section 16 (4) AktG
Voting rights if different
from holding Equity Net profit
No. Name and location of the entity TotalThereof directly Total in € m
in € thousands
189 Deutscher Sparkassen Verlag Gesellschaft mit beschränkter Haftung, Stuttgart 5.41 5.41 141.2 23,383
1) A profit and loss transfer agreement has been signed with the entity.
2) Section 264b HGB has been applied with regard to the entity’s annual financial statements.
3) The entity is classified as a subsidiary, but not based on the majority of voting rights held.
4) Section 264 (3) HGB has been applied with regard to the company’s annual financial statements.
5) Financial year end: 31 January.
6) The silo structures in the entity are attributable to third parties.
n. a.: There are no adopted financial statements.
176C-138
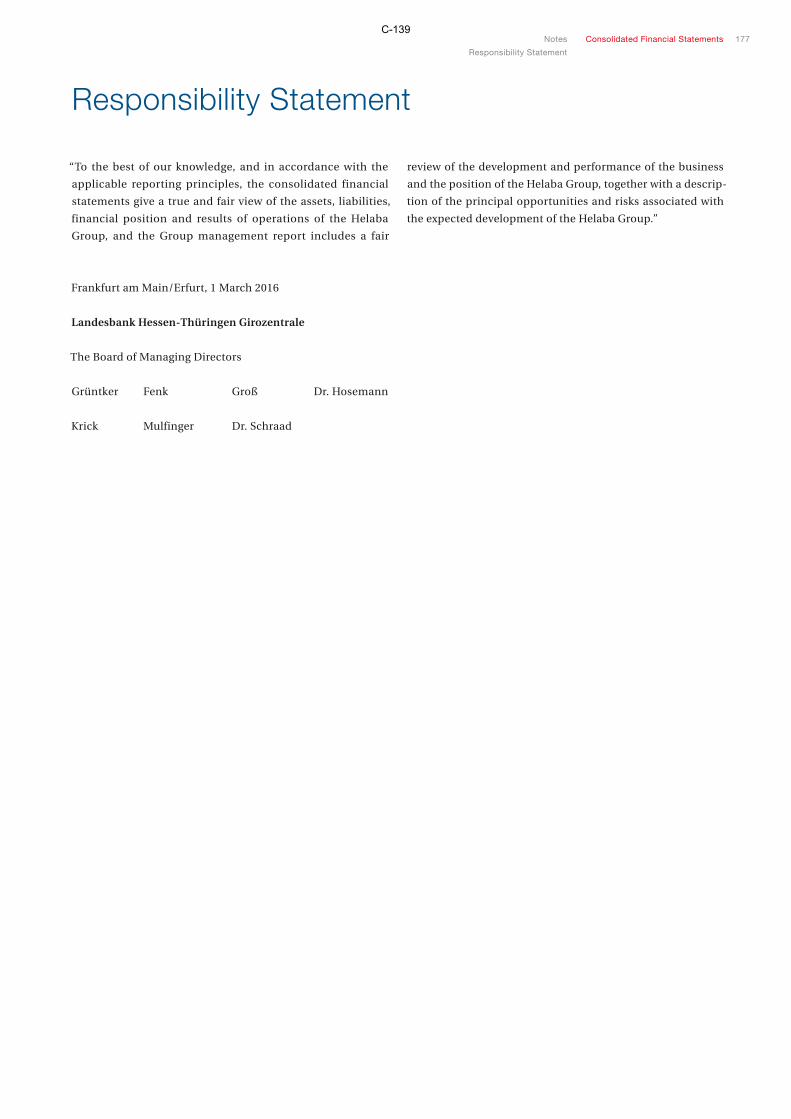
Responsibility Statement
“To the best of our knowledge, and in accordance with the
applicable reporting principles, the consolidated financial
statements give a true and fair view of the assets, liabilities,
financial position and results of operations of the Helaba
Group, and the Group management report includes a fair
review of the development and performance of the business
and the position of the Helaba Group, together with a descrip-
tion of the principal opportunities and risks associated with
the expected development of the Helaba Group.”
Frankfurt am Main/Erfurt, 1 March 2016
Landesbank Hessen- Thüringen Girozentrale
The Board of Managing Directors
Grüntker Fenk Groß Dr. Hosemann
Krick Mulfinger Dr. Schraad
177Notes Consolidated Financial Statements
Responsibility Statement
C-139

Country by Country Reporting Pursuant to Section 26a KWG
“Country by country reporting” has to be performed in accordance
with the requirements stipulated in EU Directive 2013/36/EU
(“Capital Requirements Directive”, CRD IV) and transposed
into German law by section 26a of the German Banking Act
(Kreditwesengesetz, KWG).
The report sets out the sales revenues generated and number
of employees in 2015 for each EU member state and third coun-
try in which, as at 31 December 2015, the entities included in
the consolidated financial statements via full consolidation
have a branch or their head office.
The figures disclosed as sales revenue, consolidated net profit
and income tax expenses are before consolidation effects. The
figures disclosed as sales revenue are each office’s net profit,
before allowances for losses on loans and advances and general
and administrative expenses, as included in the consolidated
accounts under IFRS. The figures disclosed as consolidated net
profit before taxes and taxes on income refer to the balance of
contributions to these two items on the consolidated income
statement in accordance with IFRS. Income tax expenses refers
to the corporation taxes for the reporting unit in question.
The figures disclosed under number of employees are based on
full-time equivalent (FTE) employees. Within the meaning of
an EU subsidy program, the consolidated entities did not
receive any subsidies during 2015.
Sales revenue in € m
Consolidated net profit be-fore taxes on
income in € m
Taxes on income in € m 1)
Number of employees
Germany 1,879 531 –140 5,460
France – 1 – 14
Ireland 9 2 – 3
Switzerland 36 – – 103
USA 109 33 –32 86
United Kingdom 83 72 –13 70
Other –6 –6 3 –
1) The amount of tax reported for a country can be affected by two factors, for example: effects on personal taxation, which is not borne by consolidated entities, are notincluded; in addition, loss-making entities can reduce their comprehensive income without being able to report tax income.
Entity Nature of activity Head office/location Country
1822direkt Gesellschaft der Frankfurter Sparkasse mbH
Provider of ancillary services
Frankfurt am Main Germany
Airport Office One GmbH & Co. KG Other undertaking Schönefeld Germany
Altherz Stuttgart 1 GmbH Other undertaking Frankfurt am Main Germany
Altherz Stuttgart 2 GmbH Other undertaking Frankfurt am Main Germany
BHT Baugrund Hessen- Thüringen GmbH Other undertaking Kassel Germany
BHT-Baugrund Hessen- Thüringen Gesellschaft für Baulandbeschaffung, Erschließung und Kommunalbau mbH & Co. Objekt FBM Freizeitbad Mühlhausen KG
Financial institution Frankfurt am Main Germany
CORDELIA Verwaltungsgesellschaft mbH Other undertaking Pullach Germany
DKB Wohnimmobilien Beteiligungs GmbH & Co. KG Financial institution Potsdam Germany
EGERIA Verwaltungsgesellschaft mbH Other undertaking Pullach Germany
Erste ILZ Leipzig GmbH & Co. KG Other undertaking Frankfurt am Main Germany
Erste Veritas Frankfurt GmbH & Co. KG Other undertaking Kriftel Germany
Frankfurter Bankgesellschaft (Deutschland) AG Bank Frankfurt am Main Germany
Frankfurter Sparkasse Bank Frankfurt am Main Germany
FRAWO Frankfurter Wohnungs- und Siedlungs-Gesellschaft mbH
Other undertaking Frankfurt am Main Germany
G+S Wohnen in Frankfurt am Main GmbH Other undertaking Frankfurt am Main Germany
178C-140

Entity Nature of activity Head office/location Country
GGM Gesellschaft für Gebäude-Management mbH Provider of ancillary services
Erfurt Germany
GHT Gesellschaft für Projektmanagement Hessen- Thüringen mbH
Other undertaking Frankfurt am Main Germany
Grundstücksgesellschaft Limes-Haus Schwalbach II GbR
Other undertaking Frankfurt am Main Germany
Grundstücksverwaltungsgesellschaft Kaiserlei GmbH Other undertaking Frankfurt am Main Germany
Grundstücksverwaltungsgesellschaft Kaiserlei GmbH & Co. Projektentwicklung Epinayplatz KG
Other undertaking Frankfurt am Main Germany
GSG Siedlungsgesellschaft für Wohnungs- und Städtebau mbH
Other undertaking Frankfurt am Main Germany
GWH Bauprojekte GmbH Other undertaking Frankfurt am Main Germany
GWH Immobilien Holding GmbH Financial institution Frankfurt am Main Germany
GWH Wohnungsgesellschaft mbH Hessen Other undertaking Frankfurt am Main Germany
Hafenbogen GmbH & Co. KG Other undertaking Frankfurt am Main Germany
HANNOVER LEASING Life Invest Deutschland I GmbH & Co. KG
Other undertaking Pullach Germany
HANNOVER LEASING Life Invest Deutschland II GmbH & Co. KG
Other undertaking Pullach Germany
Haus am Brüsseler Platz GmbH & Co. KG Other undertaking Frankfurt am Main Germany
Haus am Zentralen Platz GmbH & Co. KG Other undertaking Frankfurt am Main Germany
Helaba Invest Kapitalanlagegesellschaft mbH Investment trust company Frankfurt am Main Germany
Helicon Verwaltungsgesellschaft mbH & Co. Immobilien KG
Financial institution Pullach Germany
Hello Darmstadt Projektentwicklung GmbH & Co. KG Other undertaking Frankfurt am Main Germany
HeWiPPP II GmbH & Co. KG Other undertaking Frankfurt am Main Germany
HI A-FSP FONDS Securities investment fund Frankfurt am Main Germany
HI C-FSP FONDS Securities investment fund Frankfurt am Main Germany
HI FBI FONDS Securities investment fund Frankfurt am Main Germany
HI FBP FONDS Securities investment fund Frankfurt am Main Germany
HI FSP FONDS Securities investment fund Frankfurt am Main Germany
HI H-FSP FONDS Securities investment fund Frankfurt am Main Germany
HI-HT-KOMP-FONDS Securities investment fund Frankfurt am Main Germany
HI-HTNW-FONDS Securities investment fund Frankfurt am Main Germany
HI-RENTPLUS-FONDS Securities investment fund Frankfurt am Main Germany
HI-TURBO-FONDS Securities investment fund Frankfurt am Main Germany
Horrido-Grundstücksverwaltungsgesellschaft mbH & Co. Vermietungs OHG
Financial institution Mainz Germany
HTB Grundstücksverwaltungsgesellschaft mbH Other undertaking Frankfurt am Main Germany
Kornmarkt Arkaden Dritte GmbH & Co. KG Other undertaking Frankfurt am Main Germany
Kornmarkt Arkaden Erste GmbH & Co. KG Other undertaking Frankfurt am Main Germany
Kornmarkt Arkaden Vierte GmbH & Co. KG Other undertaking Frankfurt am Main Germany
Kornmarkt Arkaden Zweite GmbH & Co. KG Other undertaking Frankfurt am Main Germany
Landesbank Hessen- Thüringen Girozentrale Düsseldorf
Bank Düsseldorf Germany
Landesbank Hessen- Thüringen Girozentrale Bank Frankfurt am Main/Erfurt Germany
Landesbausparkasse Hessen- Thüringen – legally dependent division of Landesbank Hessen- Thüringen Girozentrale
Bank
Offenbach
Germany
Landeskreditkasse zu Kassel – branch of Landesbank Hessen- Thüringen Girozentrale
Bank Kassel Germany
MAVEST Vertriebsgesellschaft mbH Other undertaking Frankfurt am Main Germany
MAVEST Wohnungsbaugesellschaft mbH Other undertaking Frankfurt am Main Germany
Merian GmbH Wohnungsunternehmen Other undertaking Frankfurt am Main Germany
Neunte P 1 Projektgesellschaft mbH & Co. KG Other undertaking Frankfurt am Main Germany
OFB Beteiligungen GmbH Financial institution Frankfurt am Main Germany
OFB Projektentwicklung GmbH Other undertaking Frankfurt am Main Germany
Projekt Hirschgarten MK8 GmbH & Co. KG Other undertaking Frankfurt am Main Germany
179Country by Country Reporting Consolidated Financial StatementsC-141

Entity Nature of activity Head office/location Country
Projekt Wilhelmstraße Wiesbaden GmbH & Co. KG Other undertaking Frankfurt am Main Germany
Projektentwicklung Königstor GmbH & Co. KG Other undertaking Kassel Germany
Projektentwicklung Lutherplatz GmbH & Co. KG Other undertaking Frankfurt am Main Germany
Projektgesellschaft Eichplatz Jena mbH & Co. KG Other undertaking Frankfurt am Main Germany
PVG GmbH Other undertaking Frankfurt am Main Germany
SQO Stadt Quartier Offenburg GmbH & Co. KG Other undertaking Frankfurt am Main Germany
Systeno GmbH Other undertaking Frankfurt am Main Germany
TE Kronos GmbH Financial institution Frankfurt am Main Germany
uniQus Projektentwicklung GmbH & Co. KG Other undertaking Frankfurt am Main Germany
Versicherungsservice der Frankfurter Sparkasse GmbH
Other undertaking Frankfurt am Main Germany
Verso Grundstücksentwicklung GmbH & Co. KG Other undertaking Frankfurt am Main Germany
Verso Projektentwicklung GmbH & Co. KG Other undertaking Frankfurt am Main Germany
Wirtschafts- und Infrastrukturbank Hessen – legally dependent entity within Landesbank Hessen- Thüringen Girozentrale
Bank
Frankfurt am Main
Germany
Zweite ILZ Leipzig GmbH & Co. KG Other undertaking Frankfurt am Main Germany
Zweite OFB PE GmbH & Co. KG Other undertaking Frankfurt am Main Germany
Montindu S.A./N.V. Other undertaking Brussels Belgium
Logistica CPH K/S Other undertaking Copenhagen Denmark
Landesbank Hessen- Thüringen Girozentrale Paris branch
Bank Paris France
Helaba Asset Services Financial institution Dublin Ireland
OPUSALPHA FUNDING LTD Financial institution Dublin Ireland
Landesbank Hessen- Thüringen Girozentrale London branch
Bank London United Kingdom
Landesbank Hessen- Thüringen Girozentrale Grand Cayman branch
Bank Georgetown Cayman Islands
Main Capital Funding II Limited Partnership Financial institution St. Helier Jersey
Main Capital Funding Limited Partnership Financial institution St. Helier Jersey
Frankfurter Bankgesellschaft (Schweiz) AG Kreditinstitut Zurich Switzerland
LB(Swiss) Investment AG Investment trust company Zurich Switzerland
Honua’ula Partners LLC Other undertaking Wailea USA
Landesbank Hessen- Thüringen Girozentrale New York branch
Bank New York USA
LHT MSIP LLC Financial institution Wilmington USA
LHT Power Three LLC Financial institution Wilmington USA
LHT TCW LLC Financial institution Wilmington USA
LHT TPF II LLC Financial institution Wilmington USA
180C-142

Auditor’s Report
“We have audited the consolidated financial statements pre-
pared by Landesbank Hessen-Thüringen Girozentrale, Frankfurt
am Main/Erfurt, consisting of the statement of financial position,
the income statement and the statement of comprehensive
income, statement of changes in equity, cash flow statement
and the notes to the consolidated financial statements, together
with the group management report for the financial year from
1 January to 31 December 2015. The preparation of the consol-
idated financial statements and the group management report
in accordance with the IFRSs, as adopted by the EU, and the
additional requirements of German commercial law pursuant
to section 315a (1) of the German Commercial Code (Handels-
gesetzbuch – HGB) is the responsibility of the Board of Managing
Directors of Landesbank Hessen-Thüringen Girozentrale. Our
responsibility is to express an opinion on the consolidated
financial statements and on the group management report
based on our audit.
We conducted our audit of the consolidated financial state-
ments in accordance with section 317 of the German Commer-
cial Code (Handelsgesetzbuch – HGB) and the German gener-
ally accepted standards for the audit of financial statements
promulgated by the Institute of Public Auditors in Germany
(Institut der Wirtschaftsprüfer in Deutschland – IDW). Those
standards require that we plan and perform the audit such that
misstatements materially affecting the presentation of the net
assets, financial position and results of operations in the con-
solidated financial statements in accordance with the applicable
financial reporting framework and in the group management
report are detected with reasonable assurance. Knowledge of
the business activities and the economic and legal environ-
ment of the Group and expectations as to possible misstate-
ments are taken into account in the determination of audit
procedures. The effectiveness of the accounting-related internal
control system and the evidence supporting the disclosures in
the consolidated financial statements and the group manage-
ment report are examined primarily on a test basis within the
framework of the audit. The audit includes assessing the annual
financial statements of those entities included in consolidation,
the determination of the entities to be included in consolidation,
the accounting and consolidation principles used and signifi-
cant estimates made by the Company’s Board of Managing
Directors as well as evaluating the overall presentation of the
consolidated financial statements and the group management
report. We believe that our audit provides a reasonable basis
for our opinion.
Our audit has not led to any reservations.
In our opinion, based on the findings of our audit, the consol-
idated financial statements comply with the IFRSs as adopted
by the EU and the additional requirements of German com-
mercial law pursuant to section 315a (1) of the German Com-
mercial Code (Handelsgesetzbuch – HGB) and give a true and
fair view of the net assets, financial position and results of op-
erations of the Group in accordance with these requirements.
The group management report is consistent with the consoli-
dated financial statements and as a whole provides a suitable
view of the Group’s position and suitably presents the oppor-
tunities and risks of future development.”
Frankfurt am Main, 1 March 2016
PricewaterhouseCoopers
Aktiengesellschaft
Wirtschaftsprüfungsgesellschaft
Burkhard Eckes Peter Flick
Wirtschaftsprüfer Wirtschaftsprüfer
(German Public Auditor) (German Public Auditor)
181Country by Country Reporting Consolidated Financial Statements
Auditor’s Report
C-143