ORIGINAL ARTICLE
GPCR-MPredictor: multi-level prediction of G protein-coupledreceptors using genetic ensemble
Muhammad Naveed • Asif Ullah Khan
Received: 3 September 2010 / Accepted: 26 March 2011 / Published online: 20 April 2011
� Springer-Verlag 2011
Abstract G protein-coupled receptors (GPCRs) are
transmembrane proteins, which transduce signals from
extracellular ligands to intracellular G protein. Automatic
classification of GPCRs can provide important information
for the development of novel drugs in pharmaceutical
industry. In this paper, we propose an evolutionary approach,
GPCR-MPredictor, which combines individual classifiers
for predicting GPCRs. GPCR-MPredictor is a web predictor
that can efficiently predict GPCRs at five levels. The first
level determines whether a protein sequence is a GPCR or a
non-GPCR. If the predicted sequence is a GPCR, then it is
further classified into family, subfamily, sub-subfamily, and
subtype levels. In this work, our aim is to analyze the dis-
criminative power of different feature extraction and clas-
sification strategies in case of GPCRs prediction and then to
use an evolutionary ensemble approach for enhanced pre-
diction performance. Features are extracted using amino acid
composition, pseudo amino acid composition, and dipeptide
composition of protein sequences. Different classification
approaches, such as k-nearest neighbor (KNN), support
vector machine (SVM), probabilistic neural networks
(PNN), J48, Adaboost, and Naives Bayes, have been used to
classify GPCRs. The proposed hierarchical GA-based
ensemble classifier exploits the prediction results of SVM,
KNN, PNN, and J48 at each level. The GA-based ensemble
yields an accuracy of 99.75, 92.45, 87.80, 83.57, and 96.17%
at the five levels, on the first dataset. We further perform
predictions on a dataset consisting of 8,000 GPCRs at the
family, subfamily, and sub-subfamily level, and on two other
datasets of 365 and 167 GPCRs at the second and fourth
levels, respectively. In comparison with the existing meth-
ods, the results demonstrate the effectiveness of our pro-
posed GPCR-MPredictor in classifying GPCRs families. It is
accessible at http://111.68.99.218/gpcr-mpredictor/.
Keywords GPCRs � Support vector machine �Amino acid � Pseudo amino acid � Dipeptide compositions �GA-based ensemble � GPCR-MPredictor
Introduction
G protein-coupled receptors (GPCRs) are transmembrane
proteins, which can be activated by various extracellular
signals, and on ligands binding, they transduce these sig-
nals into intracellular responses via heterotrimeric G pro-
teins. GPCRs are composed of integral membrane proteins
that regulate many important physiological processes
including automatic nervous system transmission, sense of
smell, and regulation of immune system activity. GPCRs
are the largest known class of cell surface receptors
(Strader et al. 1994) and represent [1% of the total
mammalian genes (Goudet et al. 2003). GPCRs can thus
play an effective role in secretion, proliferation, chemo-
taxis, heart rate, and neurotransmission (Spiegel et al.
1992). Ligands, a heterogeneous set of molecules, con-
sisting of ions, peptides, and proteins are binded to GPCRs
and consequently activate GPCRs by allowing it to bind
with G proteins. The binding interactions of these receptors
with G proteins can be understood by means of structural
bioinformatics (Chou 2005a). Horn et al. (2003) divided
Electronic supplementary material The online version of thisarticle (doi:10.1007/s00726-011-0902-6) contains supplementarymaterial, which is available to authorized users.
M. Naveed � A. U. Khan (&)
Department of Computer and Information Science,
Pakistan Institute of Engineering and Applied Sciences,
Nilore, Islamabad, Pakistan
e-mail: [email protected]
123
Amino Acids (2012) 42:1809–1823
DOI 10.1007/s00726-011-0902-6
GPCRs into six major classes based on sequence homology
and functional similarity: rhodopsin-like, secretin-like,
metabotropic glutamate receptors, pheromone receptors,
cAMP receptors, and the frizzled/smoothened receptors.
The rhodopsin-like receptors, known as class A, comprise
80% of all the GPCRs and can transduce a range of stimuli
including peptide hormone, light, nucleotides, and che-
mokines (Bryson-Richardson et al. 2004). The human non-
olfactory receptors of rhodopsin-like class bind peptides
and biogenic amines (Fridmanis et al. 2006). Class B
secretin-like, second family of GPCRs, contains receptors
like glucagon, glucagon-like peptide 1(GLP1), calcitonin,
vasoactive intestine peptide, growth hormone-releasing
factor, parathyroid hormone, and pituitary cyclase-acti-
vating polypeptide (PACAP) (Liu et al. 1999). Both class
A and class B of GPCRs have no clear sequence homology
but have same functions, identical transmembrane topo-
logy, and common extracellular loop 1 and 2 in trans-
membrane domain. Class C, metabotropic glutamate
receptors (mGluRs) are glutamate receptors that bind with
glutamate. mGluRs have been implicated for neuronal
functions (Dolen and Bear 2008) and play a central role in
modulation of nociperception (Hu et al. 2007). Class D,
pheromone receptors are a small class of GPCRs used for
chemical communication by the organisms and play a role
in controlling interactions between individuals of a single
species (Martini et al. 2001). Class E, cAMP receptors
contribute towards chemotactic signaling system of slime
molds (Prabhu and Eichinger 2006). Class F, Frizzled/
smoothened is required for the hedgehog signaling. These
classes are called the families of GPCRs and are denoted as
family level GPCRs in our work. The decomposition of
these classes into their subfamilies, sub-subfamilies, and
subtypes are termed as subfamily, sub-subfamily, and
subtype levels of GPCRs. Nowadays, researchers are more
interested in the functional roles of GPCRs at the finest
subtype level. Because each subtype has its own cha-
racteristic ligand-binding property, coupling partners of
trimeric G-proteins, and interaction partners of oligomeri-
zation (Kristiansen 2004), prediction of GPCRs at the fifth
level becomes significant in the effort to decipher GPCRs.
However, it is a challenging task. Fortunately, more and
more GPCR sequences are now being accumulated into the
GPCRDB database, which makes it possible to accurately
predict GPCRs at all the five levels.
GPCR classification plays a crucial role in predicting the
function of the protein and a step towards applications of
GPCRs. The prediction of GPCRs, based on structure and
function is possible because of the production of very
large-scale genome sequencing projects (Vaidehi et al.
2002). However, it is difficult to develop a comprehensive
classification system for all the subtypes of GPCR due to
its inherent diversity (Daives et al. 2007). In recent years,
many GPCR prediction methods have been proposed, in
which some of the methods are also based on the sequence
similarity searching in protein database using alignment
tools (Pearson 2000). However, one of the major problems
of sequence similarity search-based methods is that it fails
if the tested protein sequences have no match to the data-
base sequences. In addition, in case of GPCRs, function-
similarity relationship is still unclear. Other methods
include the use of covariant discriminant algorithm (Elrod
and Chou 2002), support vector machine (SVM) (Karchin
et al. 2002), k-nearest neighbors (KNN) (Gao and Wang
2006; Khan et al. 2008a), statistical analysis method (Chou
and Elrod 2002), Hidden Markov Models (Qian et al.
2003), and binary topology pattern (Inoue et al. 2004).
Ensemble approaches have also been used for protein
identification (Huang et al. 2004; Shen and Chou 2007;
Shen et al. 2007). A number of computational methods
have been developed to predict GPCRs based on their
sequences (Guo et al. 2006; Wen et al. 2007; Chou 2005b).
Of these entire classification approaches, SVM is quite
promising regarding its performance. However, SVM is a
binary classifier while GPCRs classification is a multi-class
problem. The selective top-down approach by Daives et al.
(2007) is also very effective regarding GPCRs classifica-
tion. They have employed selective top-down approach. In
their approach, a numeric feature vector is constructed,
whereby 5 z-values such as lipophilicity (z1), bulk and
polarisability (z2), polarity (z3), and electronics effects (z4
and z5) are derived from 26 real physiochemical properties
of amino acids. Other two recent methods are GPCR-CA
(Xiao et al. 2009) to classify GPCRs at first two levels and
PCA-GPCR (Peng et al. 2010) to classify GPCRs at all five
levels and have yielded good results.
In this work, our aim was to analyze the discriminative
power of different feature extraction and classification
strategies in case of GPCRs prediction and then to use a
hierarchical evolutionary ensemble approach for further
enhancing the prediction performance. We have used dif-
ferent classifiers for prediction of GPCRs at super-family,
family, subfamily, sub-subfamily, and subtype levels using
amino acid composition (AAC), pseudo amino acid com-
position (PseAA), and dipeptide composition. Our objec-
tive is to classify GPCRs at all five levels. The task at
super-family level is to predict GPCRs against non-GPCR.
If the result is a GPCR sequence then the task is to predict
its family, subfamily, sub-subfamily, and subtype levels. A
hierarchical classification approach such as used in (Daives
et al. 2007, Xiao et al. 2009, and Peng et al. 2010) has been
used in this work. Individual classifiers being employed in
our work are KNN, SVM, probabilistic neural networks
(PNN), J48, Adaboost, and Naives Bayes (NB). However,
we have observed that SVM performs better on dipeptide
composition among all of these classifiers. For SVM,
1810 M. Naveed, A. U. Khan
123
one-vs-the-rest strategy has been employed to build clas-
sifier for multi-class classification of GPCRs families. The
dipeptide composition has been used for GPCR classifi-
cation (Gao and Wang 2006) as well as to predict the
contents of protein secondary structures (Chou 1999; Liu
and Chou 1999). Dipeptide composition encapsulates the
local order information of protein sequences. It has been
observed that dipeptide is better than simple AAC and the
ordering information is usually useful for prediction. The
only problem with dipeptide composition is its high
dimensionality, 400-D feature vector. In order to handle
this problem, we have used genetic algorithm (GA)-based
feature selection to reduce the dimensionality and to
improve the classification accuracy. The careful selection
of features that depend upon data domain affects the pre-
dictive performance. In the recent years, combination
strategies for developing ensemble classifier have been
widely used. Although there are several other combination
strategies available as well (Hayat and Khan 2011; Khan
et al. 2005) GA is the most widely used evolutionary
approach for this purpose. Research shows that the per-
formance of an ensemble classifier strongly depends upon
the careful selection of individual classifiers. In our
ensemble, we have chosen four individual classifiers,
whereby each one is expected to bring some diversity
because J48 is decision tree based classifier like C4.5, PNN
is based on neural networks with radial distribution func-
tion, SVM is based on the margin optimization theory, and
KNN on the other hand, is a non-parametric simple clas-
sifier. Therefore, in our ensemble technique, we have used
KNN, PNN, SVM, and J48 with dipeptide composition-
based features. After obtaining the prediction results from
these four classifiers, a GA-based ensemble was used for
the final prediction. It was observed that GA-based
ensemble offers the best performance at all the five levels
of GPCRs. The predicted accuracy of our proposed
GA-based ensemble, GPCR-MPredictor, is better than the
existing methods including PCA-GPCR by Peng et al.
(2010) at all levels, selective top-down approach by Daives
et al. (2007) at family, subfamily, and sub-subfamily lev-
els, and GPCR-CA by Xiao et al. (2009) at the first two
levels. Thus, it shows the discriminative power of the
proposed GA-based ensemble that uses dipeptide compo-
sition features for GPCRs classification.
Materials
GPCRs dataset
In this paper, the dataset constructed by Peng et al. (2010)
has been used for classification of GPCRs sequences. The
protein sequences have been downloaded from the
GPCRDB database and then the high-homology sequences
are filtered out using the program CD-HIT (Li and Godzik
2006). Different thresholds in CD-HIT have been applied
at different levels. They are 0.4, 0.7, 0.8, and 0.9 for the
family, subfamily, sub-subfamily, and subtype levels,
respectively. After filtering GPCRs (families, subfamilies,
sub-subfamilies, and subtypes), having more than ten
sequences are retained for training classifiers. Finally,
1,589, 4,772, 4,924, and 2,741 GPCRs are left at family,
sub family, sub-sub family, and sub type levels, respec-
tively. A negative dataset of non-GPCRs is then con-
structed to make classification at super family where family
level sequences are used as positive examples. The five-
level dataset is denoted as GDFL (GPCR Datasets for Five
Levels) and is available at http://www1.spms.ntu.du.sg/*chenxin/PCA_GPCR.
In order to perform comparison with other methods, we
have used three other datasets and for simplicity, we denote
these as GDS, D167, and D365. The GDS dataset has been
developed by Daives et al. (2007) and can be downloaded
from http://www.cs.kent.ac.uk/projects/biasprofs/down
loads.html. There are some constraints on the protein
sequences as any sequence shorter than 280 amino acids
has been removed in order to eliminate the incomplete
protein sequences. However, the dataset might exhibit
sequence homology and thus the prediction might be easy.
The GDS dataset contains 8,354 protein sequences com-
prising of five classes at the family level (A–E), 40 classes
at the subfamily level, and 108 classes at the sub-subfamily
level. On the other hand, the protein sequences in the
dataset D167 (Elrod and Chou 2002) are classified into four
sub-subfamilies: (1) Acetycholine, (2) Adrenoceptor, (3)
Dopamine, and (4) Serotonin. The dataset D365 (Xiao et al.
2009) contains protein sequences that are divided into six
families: (1) Rhodopsin-like (2) Secretin-like (3) Metabo-
trophic/glutamate/pheromone, (4) Fungal pheromone (5)
cAMP receptor, and (6) Frizzled/Smoothened family.
The sequence homology is an important factor that
affects the classification accuracy. Chou and Elrod (Chou
2005b, Elrod and Chou 2002, and Chou and Elrod 2002)
reported that all the receptor sequences in the aforemen-
tioned datasets were generally lower than 40% similarity
according to their definition of the average sequence-
identity percentage between two protein sequences.
Therefore, it is very necessary to look at the sequence
similarity in the dataset before performing any evaluation
test. Peng et al. (2010) used a CD-HIT program, which is a
protein-clustering program employed on each dataset with
different thresholds of sequence identity. According to
Peng et al. analysis, the dataset D167 has high-homology
protein pairs. On the other hand, the dataset D365 does not
GPCR-MPredictor: multi-level prediction 1811
123
contain any protein pairs having C40% pairwise sequence
identity. The CD-HIT clustering has been applied on
dataset D167 with the selected threshold of 0.4, which
gives us the number of clusters equal to 30 and thus
reduces the average sequence identity of proteins to a low
value.
Proteins representations
In order to predict GPCRs using information about protein
sequences only, we have used different properties of amino
acids for protein representation: AAC, PseAA, and dipep-
tide composition. A brief description of these properties is
described below.
Amino acid composition
The amino acid composition of a protein sequence repre-
sents the occurrence frequency of all the 20 natural amino
acids found in proteins. This produces a 20-dimensional
(20-D) feature vector for each protein sequence in the
dataset. The occurrence frequency of an amino acid i is
calculated using Eq. 1:
aðiÞ ¼ nðiÞN
ð1Þ
where n(i) is the total number of amino acids of type i and
N is the total number of amino acids in the protein
sequence.
Pseudo amino acid composition
AAC uses only the frequency of occurrence of each amino
acid in the protein sequences. However, PseAA uses an
additional feature by varying the value of k, which repre-
sents the rank of sequence order, and constructs a vector of
discrete components of dimension (20 ? k) - D. PseAA
employed in this work is also called type 2 or the series
correlation type that generates 20 ? i 9 k discrete num-
bers to represent a protein; here i is the number of amino
acid attributes selected, which was introduce by Chou
(2005c). Many authors have already used PseAA for the
protein classification like (Chou and Shen 2006; Khan et al.
2010; Chou 2001; Xiao et al. 2006; Wang 2006; Gao et al.
2005; Diao et al. 2007; Zhang et al. 2006). In the work by
Chou (2005c), the idea behind type 2 PseAA is given in
detail and the same approach for computing PseAA has
been carried out in this work. We obtain a pseudo amino
acid composition with (20 ? 2k) components. The opti-
mized value for k is 17 in our case which results in a
feature vector of 54-D. In other words, the representation
for a protein sample X is formulated as
X ¼ p1; p2; . . .p20; p20þ 1 . . .p20þ k; p20½þkþ 1 . . .p20þ 2k �T ð2Þ
where
pu ¼
fuP20
i¼1 fi þ wP2k
j¼1 sj
; ð1� u� 20Þ
wsuP20
i¼1 fi þ wP2k
j¼1 sj
; ð20þ 1� u� 20þ 2kÞ
8>>><
>>>:
9>>>=
>>>;
ð3Þ
and fi is the normalized occurrence frequency of the 20
amino acids in the protein X, j is the j-tier sequence-
correlation factor, and w is the weight factor. As in Eq. 2,
the first 20 components show the effect of the natural
amino acid composition, while the elements from 20 ? 1
to 20 ? 2k represent the amphipathic sequence-order
pattern.
Dipeptide composition
Dipeptide composition represents the occurrence frequency
of every consecutive pair of amino acids and generates a
400D feature vector. The occurrence frequency of amino
acid pair i is calculated using Eq. 4.
dðiÞ ¼ mðiÞM
ð4Þ
where m(i) is the occurrence frequency of pair i and M is
the total number of pairs in a protein sequence. However,
the accuracy of a classifier may decrease if information that
is more irrelevant is present in the feature vector. Thus, to
reduce the feature space, we have used GA to select the
most effective pairs.
Performance measures
To measure the predictive performance, we have used
jackknife test on the GDS dataset. In the jackknife test, one
sequence is singled out in turn, as a test sample and the
remaining are used as the training samples. Thus, for n
samples, the algorithm is repeated n times. Jackknife test is
considered as one of the rigorous and reliable among all of
the cross validation methods (Mardia et al. 1979). Overall
accuracy, Matthew’s correlation coefficient (MCC), and
F-measures (F-m) are computed at each level to measure
the performance of over method. The sensitivity (Se),
specificity (Sp), MCC, accuracy, and F-m are computed
using the following equations:
Se ¼ TP
TPþ FNð5Þ
1812 M. Naveed, A. U. Khan
123
Sp ¼ TN
TNþ FPð6Þ
MCC ¼ TP� TN� FP� FNffiffiffiffiffiffiffiffiffiffiffiffiffiffiffiffiffiffiffiffiffiffiffiffiffiffiffiffiffiffiffiffiffiffiffiffiffiffiffiffiffiffiffiffiffiffiffiffiffiffiffiffiffiffiffiffiffiffiffiffiffiffiffiffiffiffiffiffiffiffiffiffiffiffiffiffiffiffiffiffiffiffiffiffiffiðTPþ FPÞðTPþ FNÞðTNþ FPÞðTNþ FNÞ
p
ð7Þ
Overall accuracy ¼ TPþ TN
TPþ FNþ FPþ FNð8Þ
F ¼ 2� Se� precision
ðSeþ precisionÞ ð9Þ
Precision ¼ TP
TPþ FPð10Þ
where TP, FN, TN, and FP are true positive, false negative,
true negative, and false positive, respectively. The Se and
Sp are calculated for every class in a family by one verse
rest (1-v-r) strategy. One class is labeled as positive, all the
other classes are labeled as negative, and then at the end,
the mean Se and Sp are calculated. Similarly, MCC and
F-measure are computed for each class in a family using
1-v-r strategy and then the mean value for each is calculated.
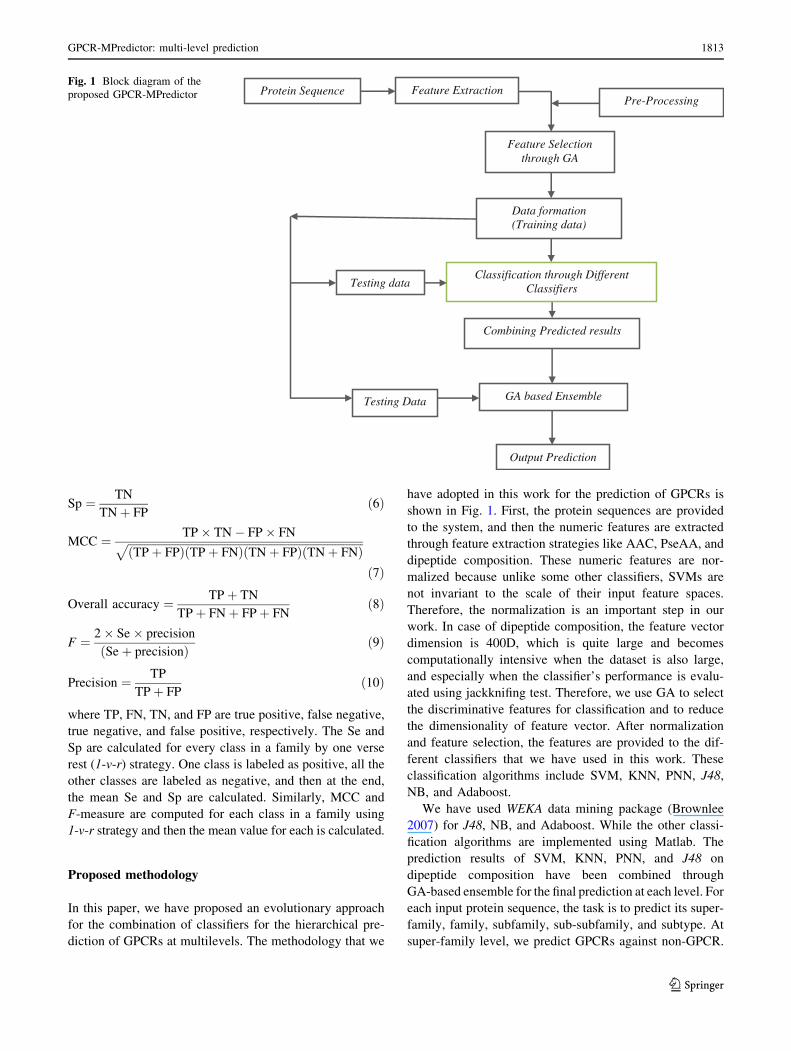
Proposed methodology
In this paper, we have proposed an evolutionary approach
for the combination of classifiers for the hierarchical pre-
diction of GPCRs at multilevels. The methodology that we
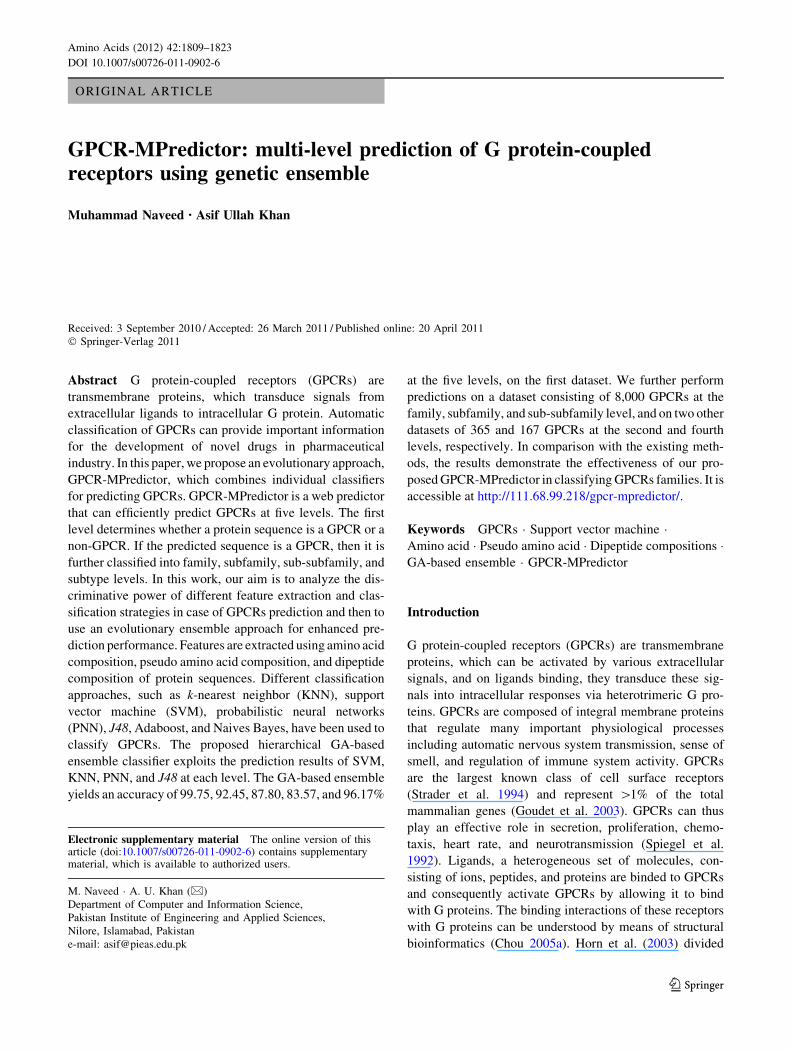
have adopted in this work for the prediction of GPCRs is
shown in Fig. 1. First, the protein sequences are provided
to the system, and then the numeric features are extracted
through feature extraction strategies like AAC, PseAA, and
dipeptide composition. These numeric features are nor-
malized because unlike some other classifiers, SVMs are
not invariant to the scale of their input feature spaces.
Therefore, the normalization is an important step in our
work. In case of dipeptide composition, the feature vector
dimension is 400D, which is quite large and becomes
computationally intensive when the dataset is also large,
and especially when the classifier’s performance is evalu-
ated using jackknifing test. Therefore, we use GA to select
the discriminative features for classification and to reduce
the dimensionality of feature vector. After normalization
and feature selection, the features are provided to the dif-
ferent classifiers that we have used in this work. These
classification algorithms include SVM, KNN, PNN, J48,
NB, and Adaboost.
We have used WEKA data mining package (Brownlee
2007) for J48, NB, and Adaboost. While the other classi-
fication algorithms are implemented using Matlab. The
prediction results of SVM, KNN, PNN, and J48 on
dipeptide composition have been combined through
GA-based ensemble for the final prediction at each level. For
each input protein sequence, the task is to predict its super-
family, family, subfamily, sub-subfamily, and subtype. At
super-family level, we predict GPCRs against non-GPCR.
Combining Predicted results
Testing data
Protein Sequence Feature Extraction Pre-Processing
Feature Selection through GA
Classification through Different Classifiers
Data formation (Training data)
GA based Ensemble Testing Data
Output Prediction
Fig. 1 Block diagram of the
proposed GPCR-MPredictor
GPCR-MPredictor: multi-level prediction 1813
123
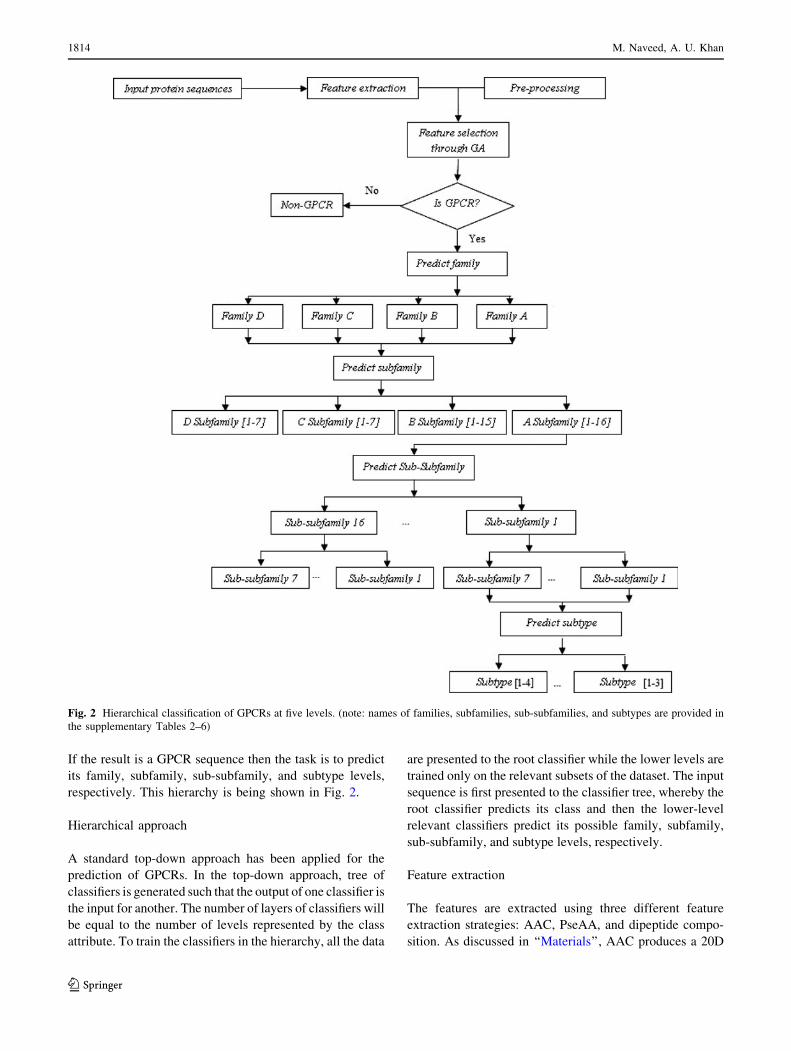
If the result is a GPCR sequence then the task is to predict
its family, subfamily, sub-subfamily, and subtype levels,
respectively. This hierarchy is being shown in Fig. 2.
Hierarchical approach
A standard top-down approach has been applied for the
prediction of GPCRs. In the top-down approach, tree of
classifiers is generated such that the output of one classifier is
the input for another. The number of layers of classifiers will
be equal to the number of levels represented by the class
attribute. To train the classifiers in the hierarchy, all the data
are presented to the root classifier while the lower levels are
trained only on the relevant subsets of the dataset. The input
sequence is first presented to the classifier tree, whereby the
root classifier predicts its class and then the lower-level
relevant classifiers predict its possible family, subfamily,
sub-subfamily, and subtype levels, respectively.
Feature extraction
The features are extracted using three different feature
extraction strategies: AAC, PseAA, and dipeptide compo-
sition. As discussed in ‘‘Materials’’, AAC produces a 20D
Fig. 2 Hierarchical classification of GPCRs at five levels. (note: names of families, subfamilies, sub-subfamilies, and subtypes are provided in
the supplementary Tables 2–6)
1814 M. Naveed, A. U. Khan
123
feature vector, PseAA produces a 54D feature vector by
setting the value of k to 17 and similarly, dipeptide com-
position produces a feature vector of 400D.
Mean/variance normalization
One of the most common approaches for feature normali-
zation is subtraction of population mean and scaling. This
enables us to achieve unit variance. The numerical series
obtained after applying feature extraction strategies are
normalized through Eq. 11:
xij ¼xij � �xj
rjð11Þ
where xij is some property value of the ith amino acid in the
jth sequence, �xj is the mean value, and rj is the standard
deviation of the jth sequence.
Genetic algorithm for feature selection
In this work, we have used GA for feature selection in case
of dipeptide composition. The classifier to which the
selected subset would be provided as an input is being used
as a wrapper for feature selection. Thus, the subset d is
selected in such a way that it does not degrade the per-
formance of the wrapper classifier. This is because each
feature is used as a part of a classification procedure and
thus increases running time of a system, so there is a strong
motivation to use a small feature set (Fan and Verma
2009). Evolutionary algorithms have been successfully
applied for feature selection (Jirapech-Umpai and Aitken
2005) and optimization-related applications (Usman and
Khan 2010; Khan et al. 2008b).
Consider that there are some features that make a very
little contribution towards an accurate classificationthan we
can afford to remove them. We want to select a subset d
from the feature space. The need for feature selection is
due to the reason that when the feature space is large,
usually combinatorial explosion occurs and it is not prac-
tical to do an exhaustive search. GA is appropriate in
handling such cases. It performs a direct random search for
its objective functions. Here, our objective is to use GA for
two main purposes: first, to reduce the dimension and
second to improve the performance by reducing the noise
factor, as it is very robust to noise. The main objectives of
GA feature selection are to minimize the generalization
error and try to minimize the training error as much as
possible. The fitness function is based on Cwrapper_accuracy
using jackknifing test and a ratio of the number of selected
features versus the total number of features. Cwrapper_accu-
racy is the mean accuracy of the predictive accuracies in the
hierarchy for all levels of GPCRs using the classifier for
which the feature selection is being performed. The subset
is selected by chromosome encoding to the feature space as
each locus on the chromosome is simply 0 or 1 corre-
sponding to the presence or absence of a feature in a subset.
Each time we select only those features for which the
chromosome bit string contains 1 s. The highly discrimi-
native dipeptide features are selected for all the three levels
of GPCRs. The parameters used for this purpose are pop-
ulation size = 30, number of generations = 100, mutation
rate is = 0.08, and the crossover is selected as ‘scattered’.
The fitness function has two main objectives: one is to
maximize the classification accuracy, and the other is to
minimize the number of selected features. The fitness is
computed using Eq. 12
fitness ¼ Cwrapper accuracyþ 1� n
N
� �
ð12Þ
where n is the number of selected features while N is the
number of total features. An elite chromosome from the
current population will be passed onto the next generation.
The GA feature selection algorithm is implemented using
Matlab based GA toolbox and its pseudo-code is as fol-
lows;
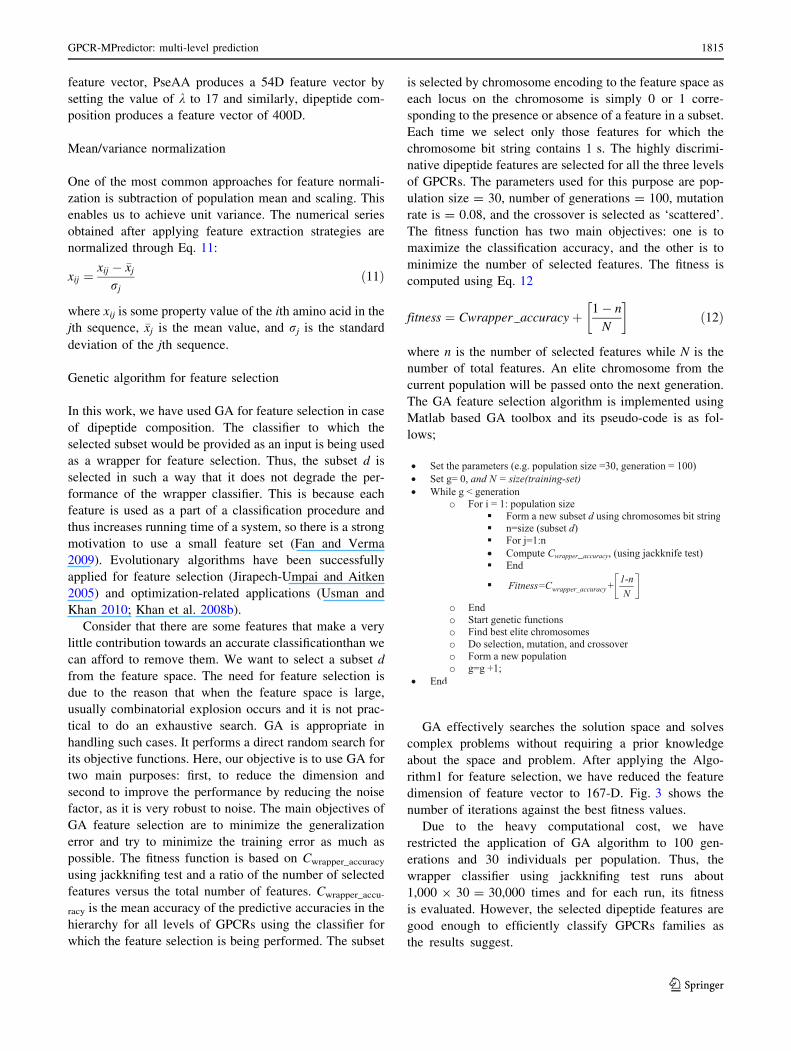
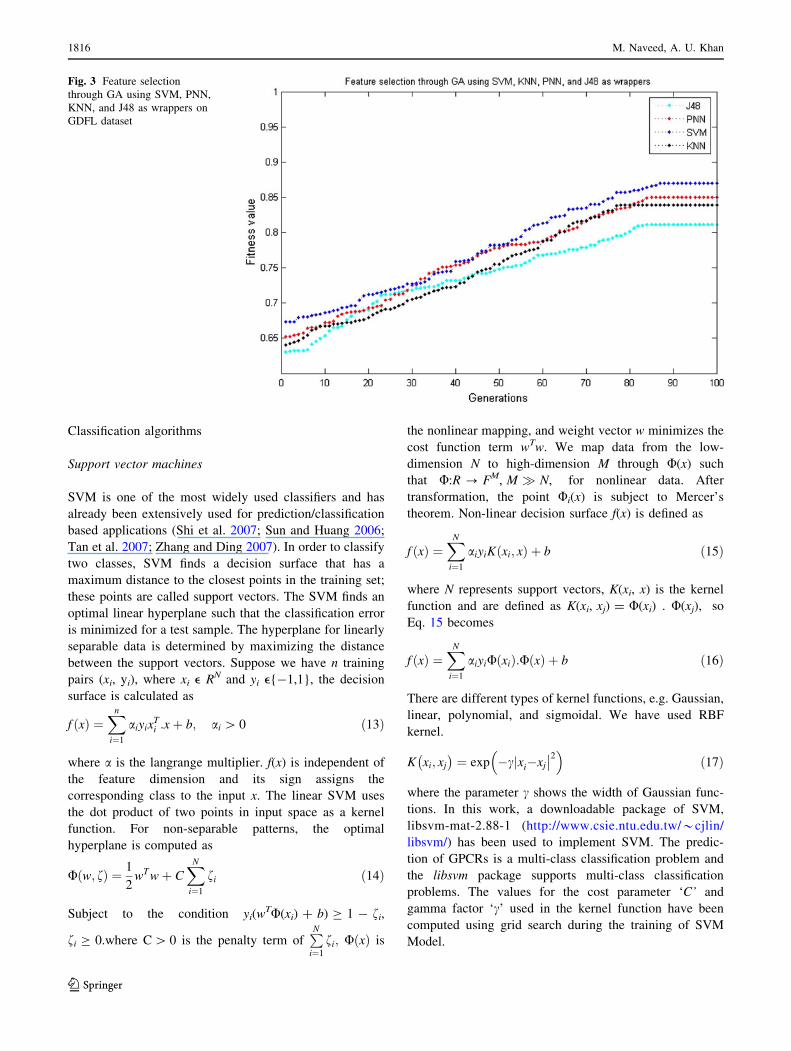
GA effectively searches the solution space and solves
complex problems without requiring a prior knowledge
about the space and problem. After applying the Algo-
rithm1 for feature selection, we have reduced the feature
dimension of feature vector to 167-D. Fig. 3 shows the
number of iterations against the best fitness values.
Due to the heavy computational cost, we have
restricted the application of GA algorithm to 100 gen-
erations and 30 individuals per population. Thus, the
wrapper classifier using jackknifing test runs about
1,000 9 30 = 30,000 times and for each run, its fitness
is evaluated. However, the selected dipeptide features are
good enough to efficiently classify GPCRs families as
the results suggest.
GPCR-MPredictor: multi-level prediction 1815
123
Classification algorithms
Support vector machines
SVM is one of the most widely used classifiers and has
already been extensively used for prediction/classification
based applications (Shi et al. 2007; Sun and Huang 2006;
Tan et al. 2007; Zhang and Ding 2007). In order to classify
two classes, SVM finds a decision surface that has a
maximum distance to the closest points in the training set;
these points are called support vectors. The SVM finds an
optimal linear hyperplane such that the classification error
is minimized for a test sample. The hyperplane for linearly
separable data is determined by maximizing the distance
between the support vectors. Suppose we have n training
pairs (xi, yi), where xi e RN and yi e{-1,1}, the decision
surface is calculated as
f ðxÞ ¼Xn
i¼1
aiyixTi :xþ b; ai [ 0 ð13Þ
where a is the langrange multiplier. f(x) is independent of
the feature dimension and its sign assigns the
corresponding class to the input x. The linear SVM uses
the dot product of two points in input space as a kernel
function. For non-separable patterns, the optimal
hyperplane is computed as
Uðw; fÞ ¼ 1
2wT wþ C
XN
i¼1
fi ð14Þ
Subject to the condition yi(wTU(xi) ? b) C 1 - fi,
fi C 0.where C [ 0 is the penalty term ofPN
i¼1
fi; UðxÞ is
the nonlinear mapping, and weight vector w minimizes the
cost function term wTw. We map data from the low-
dimension N to high-dimension M through U(x) such
that U:R ? FM, M � N, for nonlinear data. After
transformation, the point Ui(x) is subject to Mercer’s
theorem. Non-linear decision surface f(x) is defined as
f ðxÞ ¼XN
i¼1
aiyiKðxi; xÞ þ b ð15Þ
where N represents support vectors, K(xi, x) is the kernel
function and are defined as K(xi, xj) = U(xi) . U(xj), so
Eq. 15 becomes
f ðxÞ ¼XN
i¼1
aiyiUðxiÞ:UðxÞ þ b ð16Þ
There are different types of kernel functions, e.g. Gaussian,
linear, polynomial, and sigmoidal. We have used RBF
kernel.
K xi; xj
� �¼ exp �c xj i�xj
��2
� ð17Þ
where the parameter c shows the width of Gaussian func-
tions. In this work, a downloadable package of SVM,
libsvm-mat-2.88-1 (http://www.csie.ntu.edu.tw/*cjlin/
libsvm/) has been used to implement SVM. The predic-
tion of GPCRs is a multi-class classification problem and
the libsvm package supports multi-class classification
problems. The values for the cost parameter ‘C’ and
gamma factor ‘c’ used in the kernel function have been
computed using grid search during the training of SVM
Model.
Fig. 3 Feature selection
through GA using SVM, PNN,
KNN, and J48 as wrappers on
GDFL dataset
1816 M. Naveed, A. U. Khan
123
K-nearest neighbor and probabilistic neural network
KNN is a method for classifying objects based on closest
training examples in the feature space. The KNN algorithm
is amongst the simplest of all machine-learning algorithms;
an object is classified by a majority vote of its neighbors,
with the object being assigned to the class most common
amongst its nearest neighbors. Mathematically, suppose
there are m protein sequences (X1,X2,X3…Xm) with labels
(1, 2, 3,…, l). Now if we have a test sample X, then our
task is to assign it a label. For this purpose, a generalized
distance between X and Xi is considered, where i = 1,
2,…, m as in Eq. 18:
DðX;XiÞ ¼ 1� X:Xi
Xk k: Xik k; ð18Þ
where Xk k: Xik k is the dot product of two vectors and Xk kand Xik k are the norms. Now according to KNN algorithm,
if the distance D between X and Xk(k = 1, 2,… m) is the
one that satisfies Eq. (19)
DðX;XkÞ ¼ MinfDðX;X1Þ;DðX;X2Þ; . . .DðX;XmÞg ð19Þ
then we assign label to X as that of Xk. Thus, the KNN
algorithm is sensitive to the local structure of the data.
Probabilistic neural networks are radial basis network,
introduced by Specht (1990). PNN is able to solve effec-
tively a variety of classification problems and approximates
the theoretically optimal classifier, the Bayesian optimal
classifier. For PNN, we have selected the optimum value of
spread for the radial bases function in every case of
classification.
Adaboost, Naive Bayes and J48
The idea of Adaboost comes from boosting. Freund and
Schapire (1996) have introduced the algorithm, and it has
solved many of the practical difficulties of the earlier
boosting algorithms. Adaboost calls a given weak learner
repeatedly in a series of rounds. In our work, we have used
decision stumps as a weak learner, while the rest of the
parameters are set as default. NB is a simple probabilistic
classifier and is based on Bayes’ theorem, while J48 is a
decision tree algorithm like C4.5.
GA-based ensemble classifier
Ensemble classifiers are widely used in bioinformatics for
prediction. The main objective is to create a system with
more accurate and precise prediction. Many combination
techniques have been applied so far, for example, the
majority voting (Xu et al. 1992), Borda count that is a
generalized form of majority voting (Ho et al. 1994),
Bayesian method used by Franke and Mandler (1992), and
behavior–knowledge space and Dempster–Shafer theories
of evidence used for protein classification by Zaki et al.
(2003), etc. Neural networks, which are usually, called
committee machines and fuzzy algorithms (Yamaoka et al.
1994) have also been used for combination purposes.
Majority voting is a simple ensemble approach and
needs no extra memory; however, one of its drawbacks is
that it treats classifiers equally without considering their
differences in performance; the class that is supported by
the majority of the classifiers is selected by the majority
voting method as a class of the particular sample. In order
to overcome this problem of majority voting, weighted
majority voting can be used. In the weighted majority
voting, weights are assigned to the classifiers based on their
performance. However, the task is challenging as how to
set the weight according to the performance of the classi-
fier. In this work, we select the optimal weights through
real-valued GA. GA are heuristic search and optimization
techniques, based on the theory of natural selection and
evolution. Based on its search and optimization power, we
propose a GA-based ensemble method to combine pre-
diction from different classifiers. The proposed method has
been developed in order to improve the GPCRs prediction
at all levels. The GA-based method for combining multiple
classifiers is as follows:
Let us consider that X be a pattern space that consists of
N mutually exclusive sets X = {C1U, C2U, C3,…, UCN}
where each of Ci e {1, 2, 3, …, N} represent a class. For a
given input pattern x, say the classifier output is
ek(x) = {vki (x)} where k is the number of classifiers k = 1,
2, 3,…, K and i e {1, 2, 3,…, N}, means that classifier k
assigns the input pattern x to each class i with a value vki (x).
Suppose for an input pattern x, the final output Ei(x) for
class i is calculated as the weighted sum of measured
values of vki (x) and the corresponding weight values wi(k),
and is expressed as
EiðxÞ ¼XK
k¼1
wikvi
k xð Þ; where i ¼ 1; 2; . . .; N: ð20Þ
The final decision is given by selecting the class label
with the highest value of Ei(x) for each input pattern x. In
GA, each weight vector is encoded into a string called a
chromosome; a real value string is used to represent a
chromosome. The initial population consists of a set of
weights distributed randomly. After the initial population is
generated, the GA evaluates each individual according to
the fitness evaluation function. The fitness function for jth
weight set is calculated based on the overall accuracy and
MCC values of the data. The role of the fitness function is
to encode the performance of each individual numerically.
The aim of this method is to find the set of weights capable
of generating the optimized combination of predictions.
GPCR-MPredictor: multi-level prediction 1817
123
The proposed GA based ensemble approach is given as
follows:
Results and discussion
The results of proposed method show that the hierarchical
approach using GA-based ensemble with GA-selected
dipeptide composition features performs better in classi-
fying GPCRs at multi-level. Dipeptide composition per-
forms better at all levels showing the discriminative
property of protein local order information. However, the
results using PseAA are comparable to that of AAC in case
of almost all of the individual classifiers at all levels;
similarly, SVM performs better than other individual
classifiers (as shown in the supplementary table where the
results of individual classifiers using AAC, PseAA,
dipeptide composition on GDFL dataset are provided). In
order to implement the GA-based ensemble, we have
selected the best individual classifiers with dipeptide
composition-based features. GA-based ensemble boosted
the predictive accuracy and consequently its performance
is better than other individual classifiers. GA is usually a
robust and reliable approach. However, sometimes its
performance might be better because of the over fitting for
a certain pattern. In order to handle this problem and to test
the novelty of our GA-based ensemble, we have performed
tenfold cross validation on GDS dataset. For this purpose,
the families having \10 sequences are eliminated. There-
fore, only 5 families, 38 subfamilies, and 87 sub-subfam-
ilies are left. The test is repeated 30 times and mean-values
are reported. The improvement in the results shows that our
GA-based ensemble is good enough to classify GPCRs
families with high performance as compared with the
existing methods. For simplicity, we denote our proposed
GA-based ensemble as GPCR-MPredictor in the remaining
work.
GPCRs identification using different datasets
Predicting GPCRs at all five levels using GDFL dataset
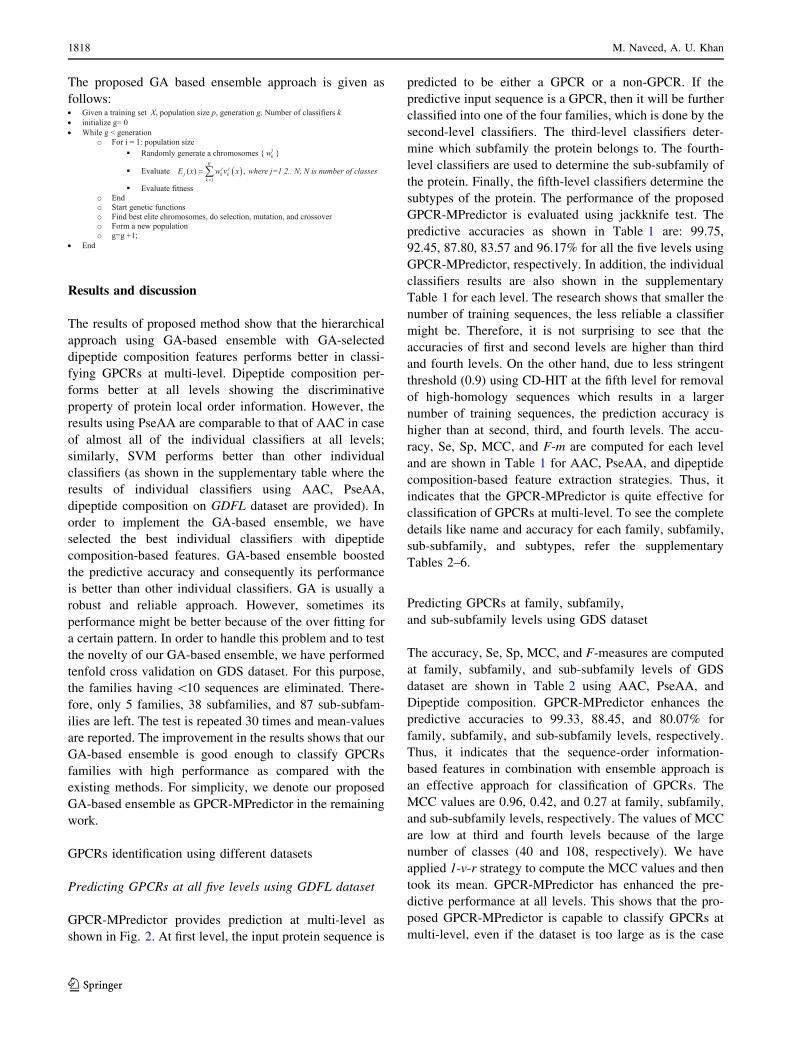
GPCR-MPredictor provides prediction at multi-level as
shown in Fig. 2. At first level, the input protein sequence is
predicted to be either a GPCR or a non-GPCR. If the
predictive input sequence is a GPCR, then it will be further
classified into one of the four families, which is done by the
second-level classifiers. The third-level classifiers deter-
mine which subfamily the protein belongs to. The fourth-
level classifiers are used to determine the sub-subfamily of
the protein. Finally, the fifth-level classifiers determine the
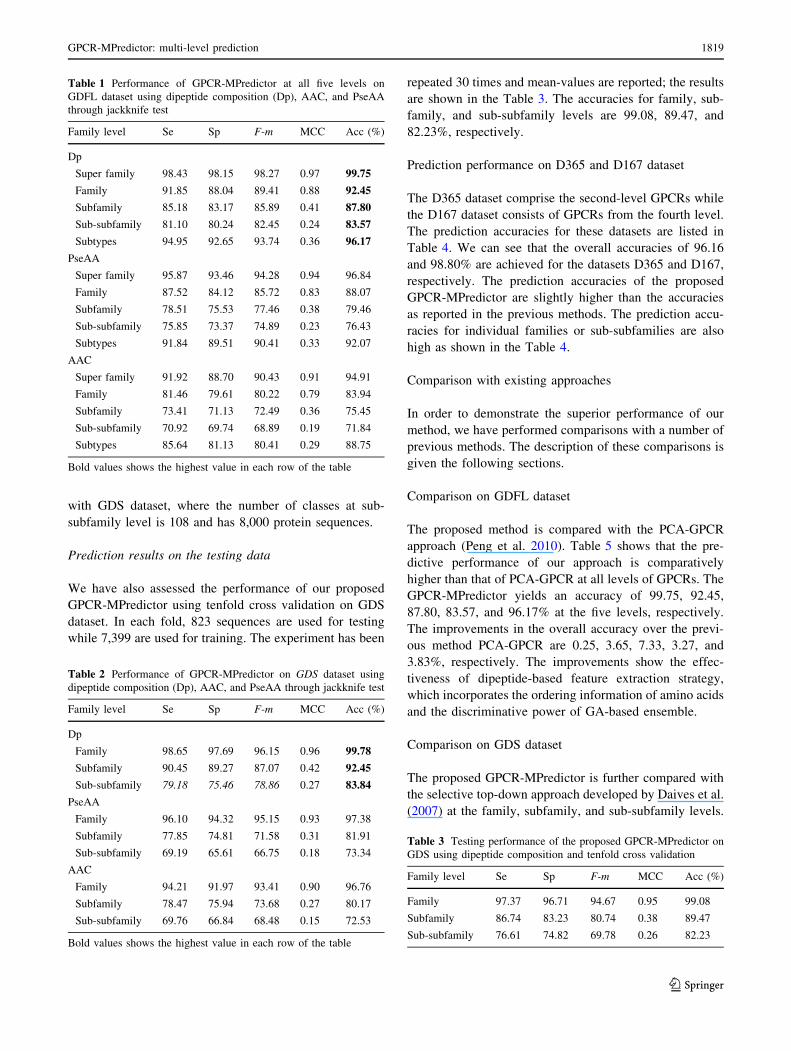
subtypes of the protein. The performance of the proposed
GPCR-MPredictor is evaluated using jackknife test. The
predictive accuracies as shown in Table 1 are: 99.75,
92.45, 87.80, 83.57 and 96.17% for all the five levels using
GPCR-MPredictor, respectively. In addition, the individual
classifiers results are also shown in the supplementary
Table 1 for each level. The research shows that smaller the
number of training sequences, the less reliable a classifier
might be. Therefore, it is not surprising to see that the
accuracies of first and second levels are higher than third
and fourth levels. On the other hand, due to less stringent
threshold (0.9) using CD-HIT at the fifth level for removal
of high-homology sequences which results in a larger
number of training sequences, the prediction accuracy is
higher than at second, third, and fourth levels. The accu-
racy, Se, Sp, MCC, and F-m are computed for each level
and are shown in Table 1 for AAC, PseAA, and dipeptide
composition-based feature extraction strategies. Thus, it
indicates that the GPCR-MPredictor is quite effective for
classification of GPCRs at multi-level. To see the complete
details like name and accuracy for each family, subfamily,
sub-subfamily, and subtypes, refer the supplementary
Tables 2–6.
Predicting GPCRs at family, subfamily,
and sub-subfamily levels using GDS dataset
The accuracy, Se, Sp, MCC, and F-measures are computed
at family, subfamily, and sub-subfamily levels of GDS
dataset are shown in Table 2 using AAC, PseAA, and
Dipeptide composition. GPCR-MPredictor enhances the
predictive accuracies to 99.33, 88.45, and 80.07% for
family, subfamily, and sub-subfamily levels, respectively.
Thus, it indicates that the sequence-order information-
based features in combination with ensemble approach is
an effective approach for classification of GPCRs. The
MCC values are 0.96, 0.42, and 0.27 at family, subfamily,
and sub-subfamily levels, respectively. The values of MCC
are low at third and fourth levels because of the large
number of classes (40 and 108, respectively). We have
applied 1-v-r strategy to compute the MCC values and then
took its mean. GPCR-MPredictor has enhanced the pre-
dictive performance at all levels. This shows that the pro-
posed GPCR-MPredictor is capable to classify GPCRs at
multi-level, even if the dataset is too large as is the case
1818 M. Naveed, A. U. Khan
123
with GDS dataset, where the number of classes at sub-
subfamily level is 108 and has 8,000 protein sequences.
Prediction results on the testing data
We have also assessed the performance of our proposed
GPCR-MPredictor using tenfold cross validation on GDS
dataset. In each fold, 823 sequences are used for testing
while 7,399 are used for training. The experiment has been
repeated 30 times and mean-values are reported; the results
are shown in the Table 3. The accuracies for family, sub-
family, and sub-subfamily levels are 99.08, 89.47, and
82.23%, respectively.
Prediction performance on D365 and D167 dataset
The D365 dataset comprise the second-level GPCRs while
the D167 dataset consists of GPCRs from the fourth level.
The prediction accuracies for these datasets are listed in
Table 4. We can see that the overall accuracies of 96.16
and 98.80% are achieved for the datasets D365 and D167,
respectively. The prediction accuracies of the proposed
GPCR-MPredictor are slightly higher than the accuracies
as reported in the previous methods. The prediction accu-
racies for individual families or sub-subfamilies are also
high as shown in the Table 4.
Comparison with existing approaches
In order to demonstrate the superior performance of our
method, we have performed comparisons with a number of
previous methods. The description of these comparisons is
given the following sections.
Comparison on GDFL dataset
The proposed method is compared with the PCA-GPCR
approach (Peng et al. 2010). Table 5 shows that the pre-
dictive performance of our approach is comparatively
higher than that of PCA-GPCR at all levels of GPCRs. The
GPCR-MPredictor yields an accuracy of 99.75, 92.45,
87.80, 83.57, and 96.17% at the five levels, respectively.
The improvements in the overall accuracy over the previ-
ous method PCA-GPCR are 0.25, 3.65, 7.33, 3.27, and
3.83%, respectively. The improvements show the effec-
tiveness of dipeptide-based feature extraction strategy,
which incorporates the ordering information of amino acids
and the discriminative power of GA-based ensemble.
Comparison on GDS dataset
The proposed GPCR-MPredictor is further compared with
the selective top-down approach developed by Daives et al.
(2007) at the family, subfamily, and sub-subfamily levels.
Table 1 Performance of GPCR-MPredictor at all five levels on
GDFL dataset using dipeptide composition (Dp), AAC, and PseAA
through jackknife test
Family level Se Sp F-m MCC Acc (%)
Dp
Super family 98.43 98.15 98.27 0.97 99.75
Family 91.85 88.04 89.41 0.88 92.45
Subfamily 85.18 83.17 85.89 0.41 87.80
Sub-subfamily 81.10 80.24 82.45 0.24 83.57
Subtypes 94.95 92.65 93.74 0.36 96.17
PseAA
Super family 95.87 93.46 94.28 0.94 96.84
Family 87.52 84.12 85.72 0.83 88.07
Subfamily 78.51 75.53 77.46 0.38 79.46
Sub-subfamily 75.85 73.37 74.89 0.23 76.43
Subtypes 91.84 89.51 90.41 0.33 92.07
AAC
Super family 91.92 88.70 90.43 0.91 94.91
Family 81.46 79.61 80.22 0.79 83.94
Subfamily 73.41 71.13 72.49 0.36 75.45
Sub-subfamily 70.92 69.74 68.89 0.19 71.84
Subtypes 85.64 81.13 80.41 0.29 88.75
Bold values shows the highest value in each row of the table
Table 2 Performance of GPCR-MPredictor on GDS dataset using
dipeptide composition (Dp), AAC, and PseAA through jackknife test
Family level Se Sp F-m MCC Acc (%)
Dp
Family 98.65 97.69 96.15 0.96 99.78
Subfamily 90.45 89.27 87.07 0.42 92.45
Sub-subfamily 79.18 75.46 78.86 0.27 83.84
PseAA
Family 96.10 94.32 95.15 0.93 97.38
Subfamily 77.85 74.81 71.58 0.31 81.91
Sub-subfamily 69.19 65.61 66.75 0.18 73.34
AAC
Family 94.21 91.97 93.41 0.90 96.76
Subfamily 78.47 75.94 73.68 0.27 80.17
Sub-subfamily 69.76 66.84 68.48 0.15 72.53
Bold values shows the highest value in each row of the table
Table 3 Testing performance of the proposed GPCR-MPredictor on
GDS using dipeptide composition and tenfold cross validation
Family level Se Sp F-m MCC Acc (%)
Family 97.37 96.71 94.67 0.95 99.08
Subfamily 86.74 83.23 80.74 0.38 89.47
Sub-subfamily 76.61 74.82 69.78 0.26 82.23
GPCR-MPredictor: multi-level prediction 1819
123
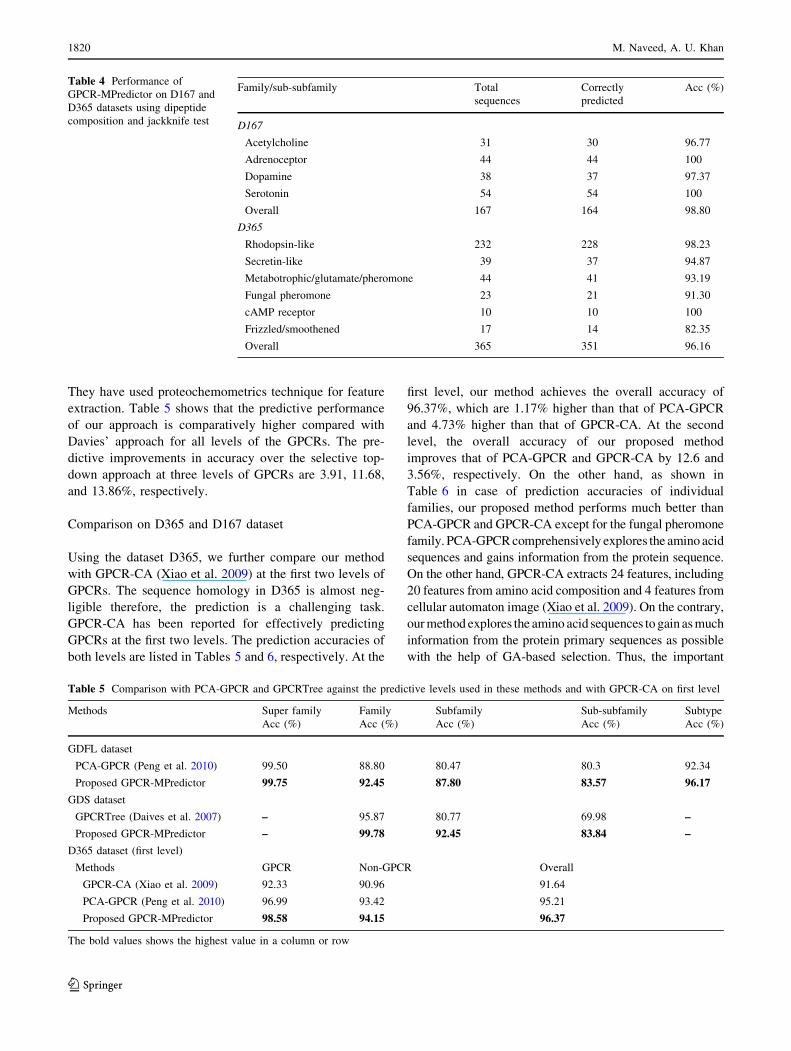
They have used proteochemometrics technique for feature
extraction. Table 5 shows that the predictive performance
of our approach is comparatively higher compared with
Davies’ approach for all levels of the GPCRs. The pre-
dictive improvements in accuracy over the selective top-
down approach at three levels of GPCRs are 3.91, 11.68,
and 13.86%, respectively.
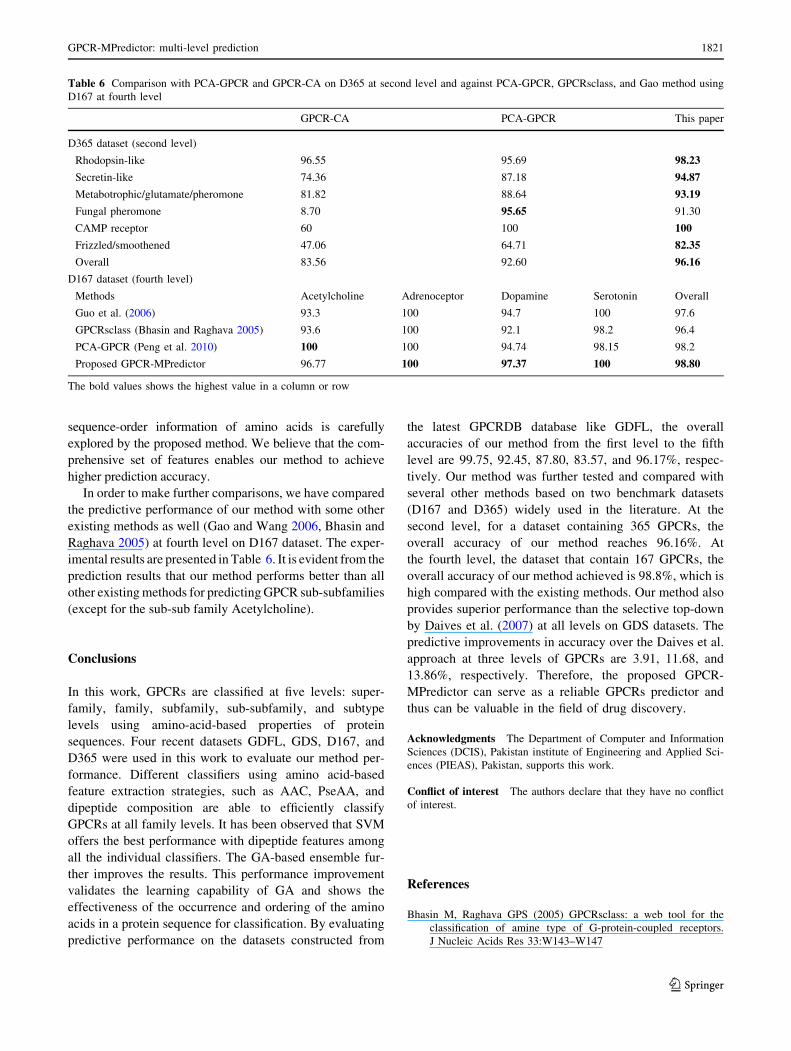
Comparison on D365 and D167 dataset
Using the dataset D365, we further compare our method
with GPCR-CA (Xiao et al. 2009) at the first two levels of
GPCRs. The sequence homology in D365 is almost neg-
ligible therefore, the prediction is a challenging task.
GPCR-CA has been reported for effectively predicting
GPCRs at the first two levels. The prediction accuracies of
both levels are listed in Tables 5 and 6, respectively. At the
first level, our method achieves the overall accuracy of
96.37%, which are 1.17% higher than that of PCA-GPCR
and 4.73% higher than that of GPCR-CA. At the second
level, the overall accuracy of our proposed method
improves that of PCA-GPCR and GPCR-CA by 12.6 and
3.56%, respectively. On the other hand, as shown in
Table 6 in case of prediction accuracies of individual
families, our proposed method performs much better than
PCA-GPCR and GPCR-CA except for the fungal pheromone
family. PCA-GPCR comprehensively explores the amino acid
sequences and gains information from the protein sequence.
On the other hand, GPCR-CA extracts 24 features, including
20 features from amino acid composition and 4 features from
cellular automaton image (Xiao et al. 2009). On the contrary,
our method explores the amino acid sequences to gain as much
information from the protein primary sequences as possible
with the help of GA-based selection. Thus, the important
Table 4 Performance of
GPCR-MPredictor on D167 and
D365 datasets using dipeptide
composition and jackknife test
Family/sub-subfamily Total
sequences
Correctly
predicted
Acc (%)
D167
Acetylcholine 31 30 96.77
Adrenoceptor 44 44 100
Dopamine 38 37 97.37
Serotonin 54 54 100
Overall 167 164 98.80
D365
Rhodopsin-like 232 228 98.23
Secretin-like 39 37 94.87
Metabotrophic/glutamate/pheromone 44 41 93.19
Fungal pheromone 23 21 91.30
cAMP receptor 10 10 100
Frizzled/smoothened 17 14 82.35
Overall 365 351 96.16
Table 5 Comparison with PCA-GPCR and GPCRTree against the predictive levels used in these methods and with GPCR-CA on first level
Methods Super family
Acc (%)
Family
Acc (%)
Subfamily
Acc (%)
Sub-subfamily
Acc (%)
Subtype
Acc (%)
GDFL dataset
PCA-GPCR (Peng et al. 2010) 99.50 88.80 80.47 80.3 92.34
Proposed GPCR-MPredictor 99.75 92.45 87.80 83.57 96.17
GDS dataset
GPCRTree (Daives et al. 2007) – 95.87 80.77 69.98 –
Proposed GPCR-MPredictor – 99.78 92.45 83.84 –
D365 dataset (first level)
Methods GPCR Non-GPCR Overall
GPCR-CA (Xiao et al. 2009) 92.33 90.96 91.64
PCA-GPCR (Peng et al. 2010) 96.99 93.42 95.21
Proposed GPCR-MPredictor 98.58 94.15 96.37
The bold values shows the highest value in a column or row
1820 M. Naveed, A. U. Khan
123
sequence-order information of amino acids is carefully
explored by the proposed method. We believe that the com-
prehensive set of features enables our method to achieve
higher prediction accuracy.
In order to make further comparisons, we have compared
the predictive performance of our method with some other
existing methods as well (Gao and Wang 2006, Bhasin and
Raghava 2005) at fourth level on D167 dataset. The exper-
imental results are presented in Table 6. It is evident from the
prediction results that our method performs better than all
other existing methods for predicting GPCR sub-subfamilies
(except for the sub-sub family Acetylcholine).
Conclusions
In this work, GPCRs are classified at five levels: super-
family, family, subfamily, sub-subfamily, and subtype
levels using amino-acid-based properties of protein
sequences. Four recent datasets GDFL, GDS, D167, and
D365 were used in this work to evaluate our method per-
formance. Different classifiers using amino acid-based
feature extraction strategies, such as AAC, PseAA, and
dipeptide composition are able to efficiently classify
GPCRs at all family levels. It has been observed that SVM
offers the best performance with dipeptide features among
all the individual classifiers. The GA-based ensemble fur-
ther improves the results. This performance improvement
validates the learning capability of GA and shows the
effectiveness of the occurrence and ordering of the amino
acids in a protein sequence for classification. By evaluating
predictive performance on the datasets constructed from
the latest GPCRDB database like GDFL, the overall
accuracies of our method from the first level to the fifth
level are 99.75, 92.45, 87.80, 83.57, and 96.17%, respec-
tively. Our method was further tested and compared with
several other methods based on two benchmark datasets
(D167 and D365) widely used in the literature. At the
second level, for a dataset containing 365 GPCRs, the
overall accuracy of our method reaches 96.16%. At
the fourth level, the dataset that contain 167 GPCRs, the
overall accuracy of our method achieved is 98.8%, which is
high compared with the existing methods. Our method also
provides superior performance than the selective top-down
by Daives et al. (2007) at all levels on GDS datasets. The
predictive improvements in accuracy over the Daives et al.
approach at three levels of GPCRs are 3.91, 11.68, and
13.86%, respectively. Therefore, the proposed GPCR-
MPredictor can serve as a reliable GPCRs predictor and
thus can be valuable in the field of drug discovery.
Acknowledgments The Department of Computer and Information
Sciences (DCIS), Pakistan institute of Engineering and Applied Sci-
ences (PIEAS), Pakistan, supports this work.
Conflict of interest The authors declare that they have no conflict
of interest.
References
Bhasin M, Raghava GPS (2005) GPCRsclass: a web tool for the
classification of amine type of G-protein-coupled receptors.
J Nucleic Acids Res 33:W143–W147
Table 6 Comparison with PCA-GPCR and GPCR-CA on D365 at second level and against PCA-GPCR, GPCRsclass, and Gao method using
D167 at fourth level
GPCR-CA PCA-GPCR This paper
D365 dataset (second level)
Rhodopsin-like 96.55 95.69 98.23
Secretin-like 74.36 87.18 94.87
Metabotrophic/glutamate/pheromone 81.82 88.64 93.19
Fungal pheromone 8.70 95.65 91.30
CAMP receptor 60 100 100
Frizzled/smoothened 47.06 64.71 82.35
Overall 83.56 92.60 96.16
D167 dataset (fourth level)
Methods Acetylcholine Adrenoceptor Dopamine Serotonin Overall
Guo et al. (2006) 93.3 100 94.7 100 97.6
GPCRsclass (Bhasin and Raghava 2005) 93.6 100 92.1 98.2 96.4
PCA-GPCR (Peng et al. 2010) 100 100 94.74 98.15 98.2
Proposed GPCR-MPredictor 96.77 100 97.37 100 98.80
The bold values shows the highest value in a column or row
GPCR-MPredictor: multi-level prediction 1821
123
Brownlee J (2007), WEKA Classification Algorithms, Version 1.6.
http://sourceforge.net/projects/wekaclassalgos
Bryson-Richardson RJ, Logan DW, Currie PD, Jackson IJ (2004)
Large-scale analysis of gene structure in rhodopsin-like GPCRs:
evidence for widespread loss of an ancient intron. Gene
338:15–23. doi:10.1016/j.gene.2004.05.001
Chou KC (1999) Using pair-coupled amino acid composition to
predict protein secondary structure content. J Protein Chem
18:473–480
Chou KC (2001) Prediction of protein cellular attributes using
pseudo-amino acid composition. Proteins Struct Funct Genet
43:246–255
Chou KC (2005a) Coupling interaction between thromboxane A2
receptor and alpha-13 subunit of guanine nucleotide-binding
proteins. J Proteome Res 4:1681–1686
Chou KC (2005b) Prediction of G-protein-coupled receptor classes.
J Proteome Res 4:1413–1418
Chou KC (2005c) Using amphiphilic pseudo amino acid composition
to predict enzyme subfamily classes. Bioinformatics 21:10–19
Chou KC, Elrod DW (2002) Bioinformatical analysis of G-protein-
coupled receptors. J Proteome Res 1:429–433
Chou KC, Shen HB (2006) Predicting protein subcellular location by
fusing multiple classifiers. J Cell Biochem 99:517–527
Daives MN, Secker A, Freitas AA, Mendao M, Timmis J, Flower DR
(2007) On the hierarchy classification of G protein-couples
receptors. Bioinformatics 23:3113–3118
Diao Y, Ma D, Wen Z, Yin J, Xiang J, Li M (2007) Using pseudo
amino acid composition to predict transmembrane regions in
protein: cellular automata and Lempel-Ziv complexity. Amino
Acids, doi:10.1007/s00726-007-0550-z
Dolen G, Bear MF (2008) Role for metabotropic glutamate receptor 5
(mGluR5) in the pathogenesis of fragile X syndrome. J Physiol
586.6:1503–1508
Elrod DW, Chou KC (2002) A study on the correlation of G-protein-
coupled receptor types with amino acid composition. Protein
Eng 15:713–715
Fan X, Verma B (2009) Selection and fusion of facial features for face
recognition. Expert Systems with Applications. doi:10.1016/
j.eswa.2008.08.052
Franke J, Mandler E (1992) A comparison of two approaches for
combining the votes of cooperating classifiers. Proceeding of the
11th International Conference on Pattern Recognition, pp 611–614
Freund Y, Schapire RE (1996) Experiments with a new boosting
algorithm. In: Proceedings of the Thirteenth International
Conference on Machine Learning, pp 148–156
Fridmanis D, Fredriksson R, Kapa I, Schioth HB, Klovins J (2006)
Formation of new genes explains lower intron density in
mammalian Rhodopsin G protein-coupled receptors. Mol Phylo-
genet Evol 43:864–880
Gao QB, Wang ZZ (2006) Classification of G protein-coupled
receptors at four levels. Prot Eng Design Sel 19:511–516
Gao Y, Shao SH, Xiao X, Ding YS, Huang YS, Huang ZD, Chou KC
(2005) Using pseudo amino acid composition to predict protein
subcellular location: approached with Lyapunov index, Bessel
function, and Chebyshev filter. Amino Acids 28:373–376
Goudet C, Gaven F, Kniazeff J, Vol C, Liu J, Cohen-Gonsaud M,
Acher F, Prezeau L, Pin JP (2003) Heptahelical domain of
metabotropic glutamate receptor 5 behaves like rhodopsin-like
receptors. PNAS 101:378–383. doi:10.1073/pnas.0304699101
Guo YZ, Li M, Lu M, Wen Z, Wang K, Li G, Wu J (2006)
Classifying G protein-coupled receptors and nuclear receptors on
the basis of protein power spectrum from fast Fourier transform.
Amino Acids 30:397–402
Hayat M, Khan A (2011) Predicting membrane protein types by
fusing composite protein sequence features into pseudo amino
acid composition. J Theor Biol 271:10–17
Ho TK, Hull JJ, Srihair SN (1994) Decision combination in multiple
classifier systems. IEEE Trans Pattern Anal Mach Intell
16(1):66–75
Horn F et al (2003) GPCRDB information system for G protein-
couples receptors. Nucleic Acids Res 31:294–297
Hu HJ, Alter BJ, Carrasquillo Y, Qiu CS, RW GereauIV (2007)
Metabotropic glutamate receptor 5 modulates nociceptive
plasticity via extra cellular signal-regulated kinase-Kv4.2
signaling in spinal cord dorsal horn neurons. J Neurosci
27:13181–13191
Huang Y, Cai J, Ji L, Li YD (2004) Classifying G-protein coupled
receptors with bagging classification tree. Comput Biol Chem
28:39–49
Inoue Y, Ikeda M, Shimizu T (2004) Proteome-wide classification
and identification of mammalian-type GPCRs by binary topol-
ogy pattern. Comput Biol Chem 28:39–49
Jirapech-Umpai T, Aitken S (2005) Feature selection and classifica-
tion for microarray data analysis: evolutionary methods for
identifying predictive genes. BMC Bioinformatics 6:148. doi:
10.1186/1471-105-6-148
Karchin R, Karplus K, Haussler D (2002) Classifying G-protein
coupled receptors with support vector machines. Bioinformatics
18:147–159
Khan A, Majid A, Mirza AM (2005) Combination and optimization of
classifiers in gender classification using genetic programming.
Int J Knowl-Based Intell Eng Syst 9:1–11
Khan A, Khan MF, Choi TS (2008a) Proximity based GPCRs
prediction in transform domain. Biochem Biophys Res Commun
371:411–415
Khan A, Tahir SF, Majid A, Tae-Sun Choi (2008b) Machine learning
based adaptive watermark decoding in view of an anticipated
attack. Pattern Recogn 41:2594–2610
Khan A, Majid A, Tae-Sun Choi (2010) Predicting protein subcellular
location: exploiting amino acid based sequence of feature spaces
and fusion of diverse classifiers. Amino Acids 38:347–350
Kristiansen K (2004) Molecular mechanisms of ligand binding,
signaling, and regulation within the superfamily of G-protein-
coupled receptors: molecular modeling and mutagenesis
approaches to receptor structure and function. Pharmacol Ther
103:21–80
Li W, Godzik A (2006) Cd-hit: a fast program for clustering and
comparing large sets of protein or nucleotide sequences.
Bioinformatics 22:1658–1659
Liu W, Chou KC (1999) Prediction of protein secondary structure
content. Protein Eng 12:1041–1050
Liu M, Parker RMC, Darby K, Eyre HJ, Copeland NG, Crawford J,
Gilbert DJ, Sutherland GR, Jenkins NA, Herzog H (1999)
GPR56, a Novel secretin-like human G-protein-coupled receptor
gene. Genomics 55:296–305. doi:10.1006/geno.1998.5644Mardia KV, Kent JT, Bibby JM (1979) Multivariate analysis.
Academic Press, London 521 pp
Martini S, Silvotti L, Shirazi A, Ryba NJP, Tirindelli R (2001)
Co-expression of putative pheromone receptors in the sensory
neurons of the vomeronasal organ. Neuroscience 21:843–848
Pearson WR (2000) Flexible sequence similarity searching with the
FASTA3 program package. Methods Mol Biol 132:185–219
Peng ZL, Yang JY, Chen X (2010) An improved classification of
G-protein-coupled receptors using sequence-derived features.
BMC Bioinformatics 11:420
Prabhu Y, Eichinger L (2006) The dictyostelium repertoire of seven
transmembrane domain receptors. Eur J Cell Biol 85:937–946
Qian B, Soyer OS, Neubig RR, Goldstein RA (2003) Depicting a
protein’s two faces: GPCR classification by phylogenetic tree-
based HMMs. FEBS Lett 554:95–99
Shen HB, Chou KC (2007) Using ensemble classifier to identify
membrane protein types. Amino Acids 32:483–488
1822 M. Naveed, A. U. Khan
123
Shen HB, Yang J, Chou KC (2007) Euk-PLoc: an ensemble classifier
for large-scale eukaryotic protein subcellular location prediction.
Amino Acids 33:57–67
Shi JY, Zhang SW, Pan Q, Cheng YM, Xie J (2007) Prediction of
protein subcellular localization by support vector machines using
multi-scale energy and pseudo amino acid composition. Amino
Acids 33:69–74
Specht DF (1990) Probabilistic neural networks. Neural Networks
3:109–118
Spiegel AM, Shenker A, Weinstein LS (1992) Receptor-effect or
coupling by G proteins: implications for normal and abnormal
signal transduction. Endocr Rev 13:536–565
Strader SD, Fong TM, Tota MR, Underwood D (1994) Structure and
function of G proteins-coupled receptors. Annu Rev Biochem
63:101–132
Sun XD, Huang RB (2006) Prediction of protein structural classes
using support vector machines. Amino Acids 30:469–475
Tan F, Feng X, Fang Z, Li M, Guo Y, Jiang L (2007) Prediction of
mitochondrial proteins based on genetic—algorithm partial least
squares and support vector machine. Amino Acids, doi:
10.1007/s00726-006-0465-0
Usman I, Khan A (2010) BCH coding and intelligent watermark
embedding: employing both frequency and strength selection.
Appl Soft Comput 10:332–343
Vaidehi N, Floriano WB, Trabanino R, Hall SE, Freddolino P, Choi
EJ, Zamanakos G, GoddarIII WA (2002) Prediction of structure
and function of G protein-coupled receptors. Proc Natl Acad Sci
USA 99:12622–12627
Wang SQ, Yang J, Chou KC (2006) Using stacked generalization to
predict membrane protein types based on pseudo amino acid
composition. J Theor Biol 242:941–946
Wen Z, Li M, Li Y, Guo Y, Wang K (2007) Delaunay triangulation
with partial least squares projection to latent structures: a model
for G-protein coupled receptors classification and fast structure
recognition. Amino Acids 32:277–283
Xiao X, Shao S, Ding Y, Huang Z, Chou KC (2006) Using cellular
automata images and pseudo amino acid composition to predict
protein sub-cellular location. Amino Acids 30:49–54
Xiao X, Wang P, Chou KC (2009) A cellular automaton image
approach for predicting G-protein-coupled receptor functional
classes. J Comput Chem 30:1413–1423
Xu L, Krzyak A, Suen CY (1992) Method of combining multiple
classifiers and their application to handwriting recognition. IEEE
Trans Syst Man Cybern 22(3):418–435
Yamaoka F, Lu Y, Shout A, Shridhar M (1994) Fuzzy integration of
classification results in handwriting digit recognition system In:
Proceedings of 4th IWFHR, pp 255–264
Zaki NM, Deris S, Arjunan SNV (2003) Assignment of protein
sequence to functional family using neural network and Demp-
ster-Shafer Theory. J Theoretics, vol 5-1
Zhang TL, Ding YS (2007) Using pseudo amino acid composition
and binary-tree support vector machines to predict protein
structural classes. Amino Acids, doi:10.1007/s00726-007-0496-1
Zhang SW, Pan Q, Zhang HC, Shao ZC, Shi JY (2006) Prediction
protein homo-oligomer types by pseudo amino acid composition:
approached with an improved feature extraction and naive Bayes
feature fusion. Amino Acids 30:461–468
GPCR-MPredictor: multi-level prediction 1823
123