International Monetary FundJanuary 28, 2021
THE 9th NCAER
C. D. DESHMUKH LECTURE 2021
Global Economic Outlook: Averting a Great Divergence
Gita Gopinath
Chief Economist
0
2
4
6
8
10
12
Mar-
20
Ap
r-20
May-2
0
Jun
-20
Jul-
20
Au
g-2
0
Sep
-20
Oct
-20
No
v-2
0
Dec-
20
Jan
-21
0
100
200
300
400
500
600
700
Mar-
20
Ap
r-20
May-2
0
Jun
-20
Jul-
20
Au
g-2
0
Sep
-20
Oct
-20
No
v-2
0
Dec-
20
Jan
-21
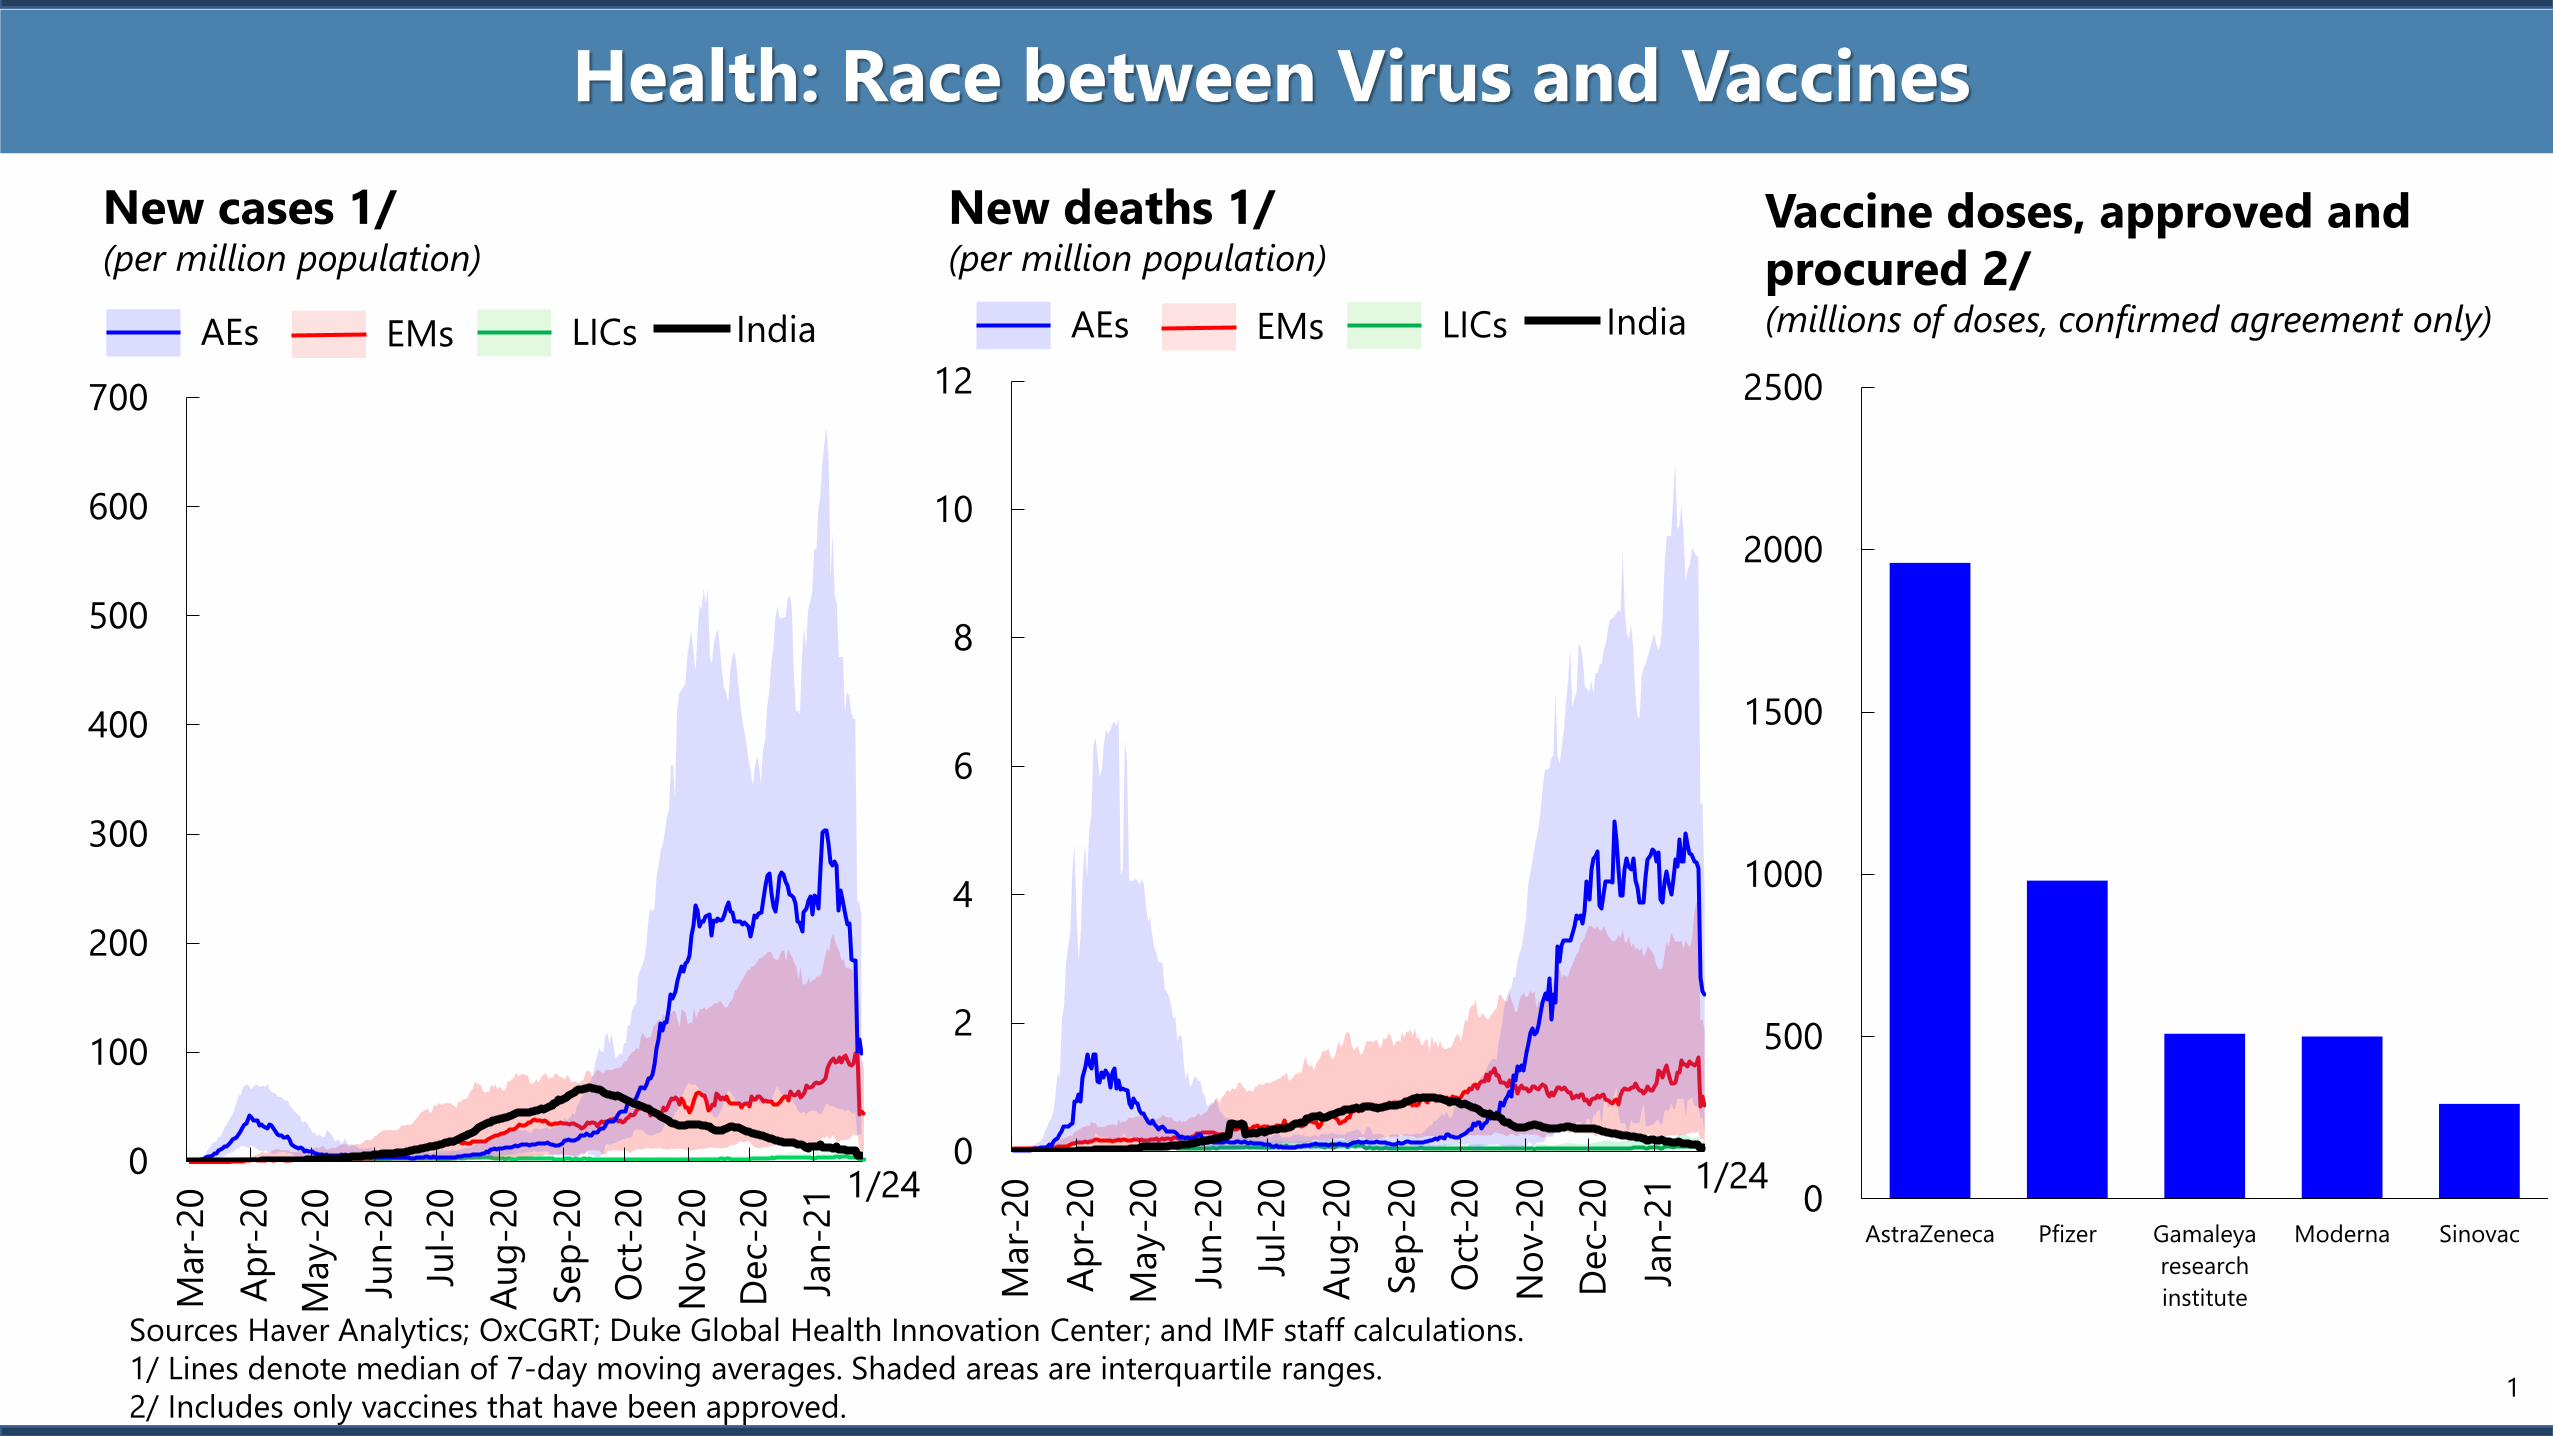
Health: Race between Virus and Vaccines
New deaths 1/(per million population)
New cases 1/(per million population)
Sources Haver Analytics; OxCGRT; Duke Global Health Innovation Center; and IMF staff calculations.
1/ Lines denote median of 7-day moving averages. Shaded areas are interquartile ranges.
2/ Includes only vaccines that have been approved.
Vaccine doses, approved and
procured 2/(millions of doses, confirmed agreement only) AEs EMs LICs India AEs EMs LICs India
1/24 1/240
500
1000
1500
2000
2500
AstraZeneca Pfizer Gamaleya
research
institute
Moderna Sinovac
1

86
88
90
92
94
96
98
100
102
-2 -1 0 1 2 3
Devia
tio
n f
rom
peak
Quarters around real GDP peak
Great Lockdown, AEs Great Lockdown, EMs Great Financial Crisis Other recessions
Economic activity: Q3 surprised strongly on upside; Q4 backsliding
Real GDP 1/ (index; pre-recession peak = 100)
Sources: IMF, World Economic Outlook; IMF, Global Data Source; Haver Analytics; and IMF staff calculations.
1/ Lines denote averages.2

-35
-30
-25
-20
-15
-10
-5
0
May-2
0
May-2
0
Jun
-20
Jul-
20
Jul-
20
Au
g-2
0
Sep
-20
Sep
-20
Oct
-20
No
v-2
0
No
v-2
0
Dec-
20
-3.0
-2.5
-2.0
-1.5
-1.0
-0.5
0.0
Sources: Haver Analytics; OxCGRT; Google, COVID-19 Community Mobility Data; Duke Global Health Innovation Center; Global Advisor; and IMF staff calculations.
1/ Lines denote median of 7-day moving averages. Shaded areas are interquartile ranges. A full lockdown includes all “containment and closure” measures in the OxCGRT. The
regression sample includes 128 countries.
Targeted lockdowns and economies adapting to social distancing
Sensitivity of mobility to cases
and lockdowns 1/ (coefficient)
Impact of full lockdown
Impact of doubling of daily cases (rhs)
PMI services (index; >50 = expansion)
AUS
BRA
CHN
DEU
ESPFRA
GBR
IND
IRL
ITA
JPN
KAZRUS
USA
AUS
BRA
CHN
DEUESP
FRAGBRIND IRL
ITA
JPN
RUS
USA
0
10
20
30
40
50
60
0 5 10 15 20 25 30 35 40 45 50 55
PM
I se
rvic
es
Cases per million population
Apr. 20 Dec. 20
12/31
3
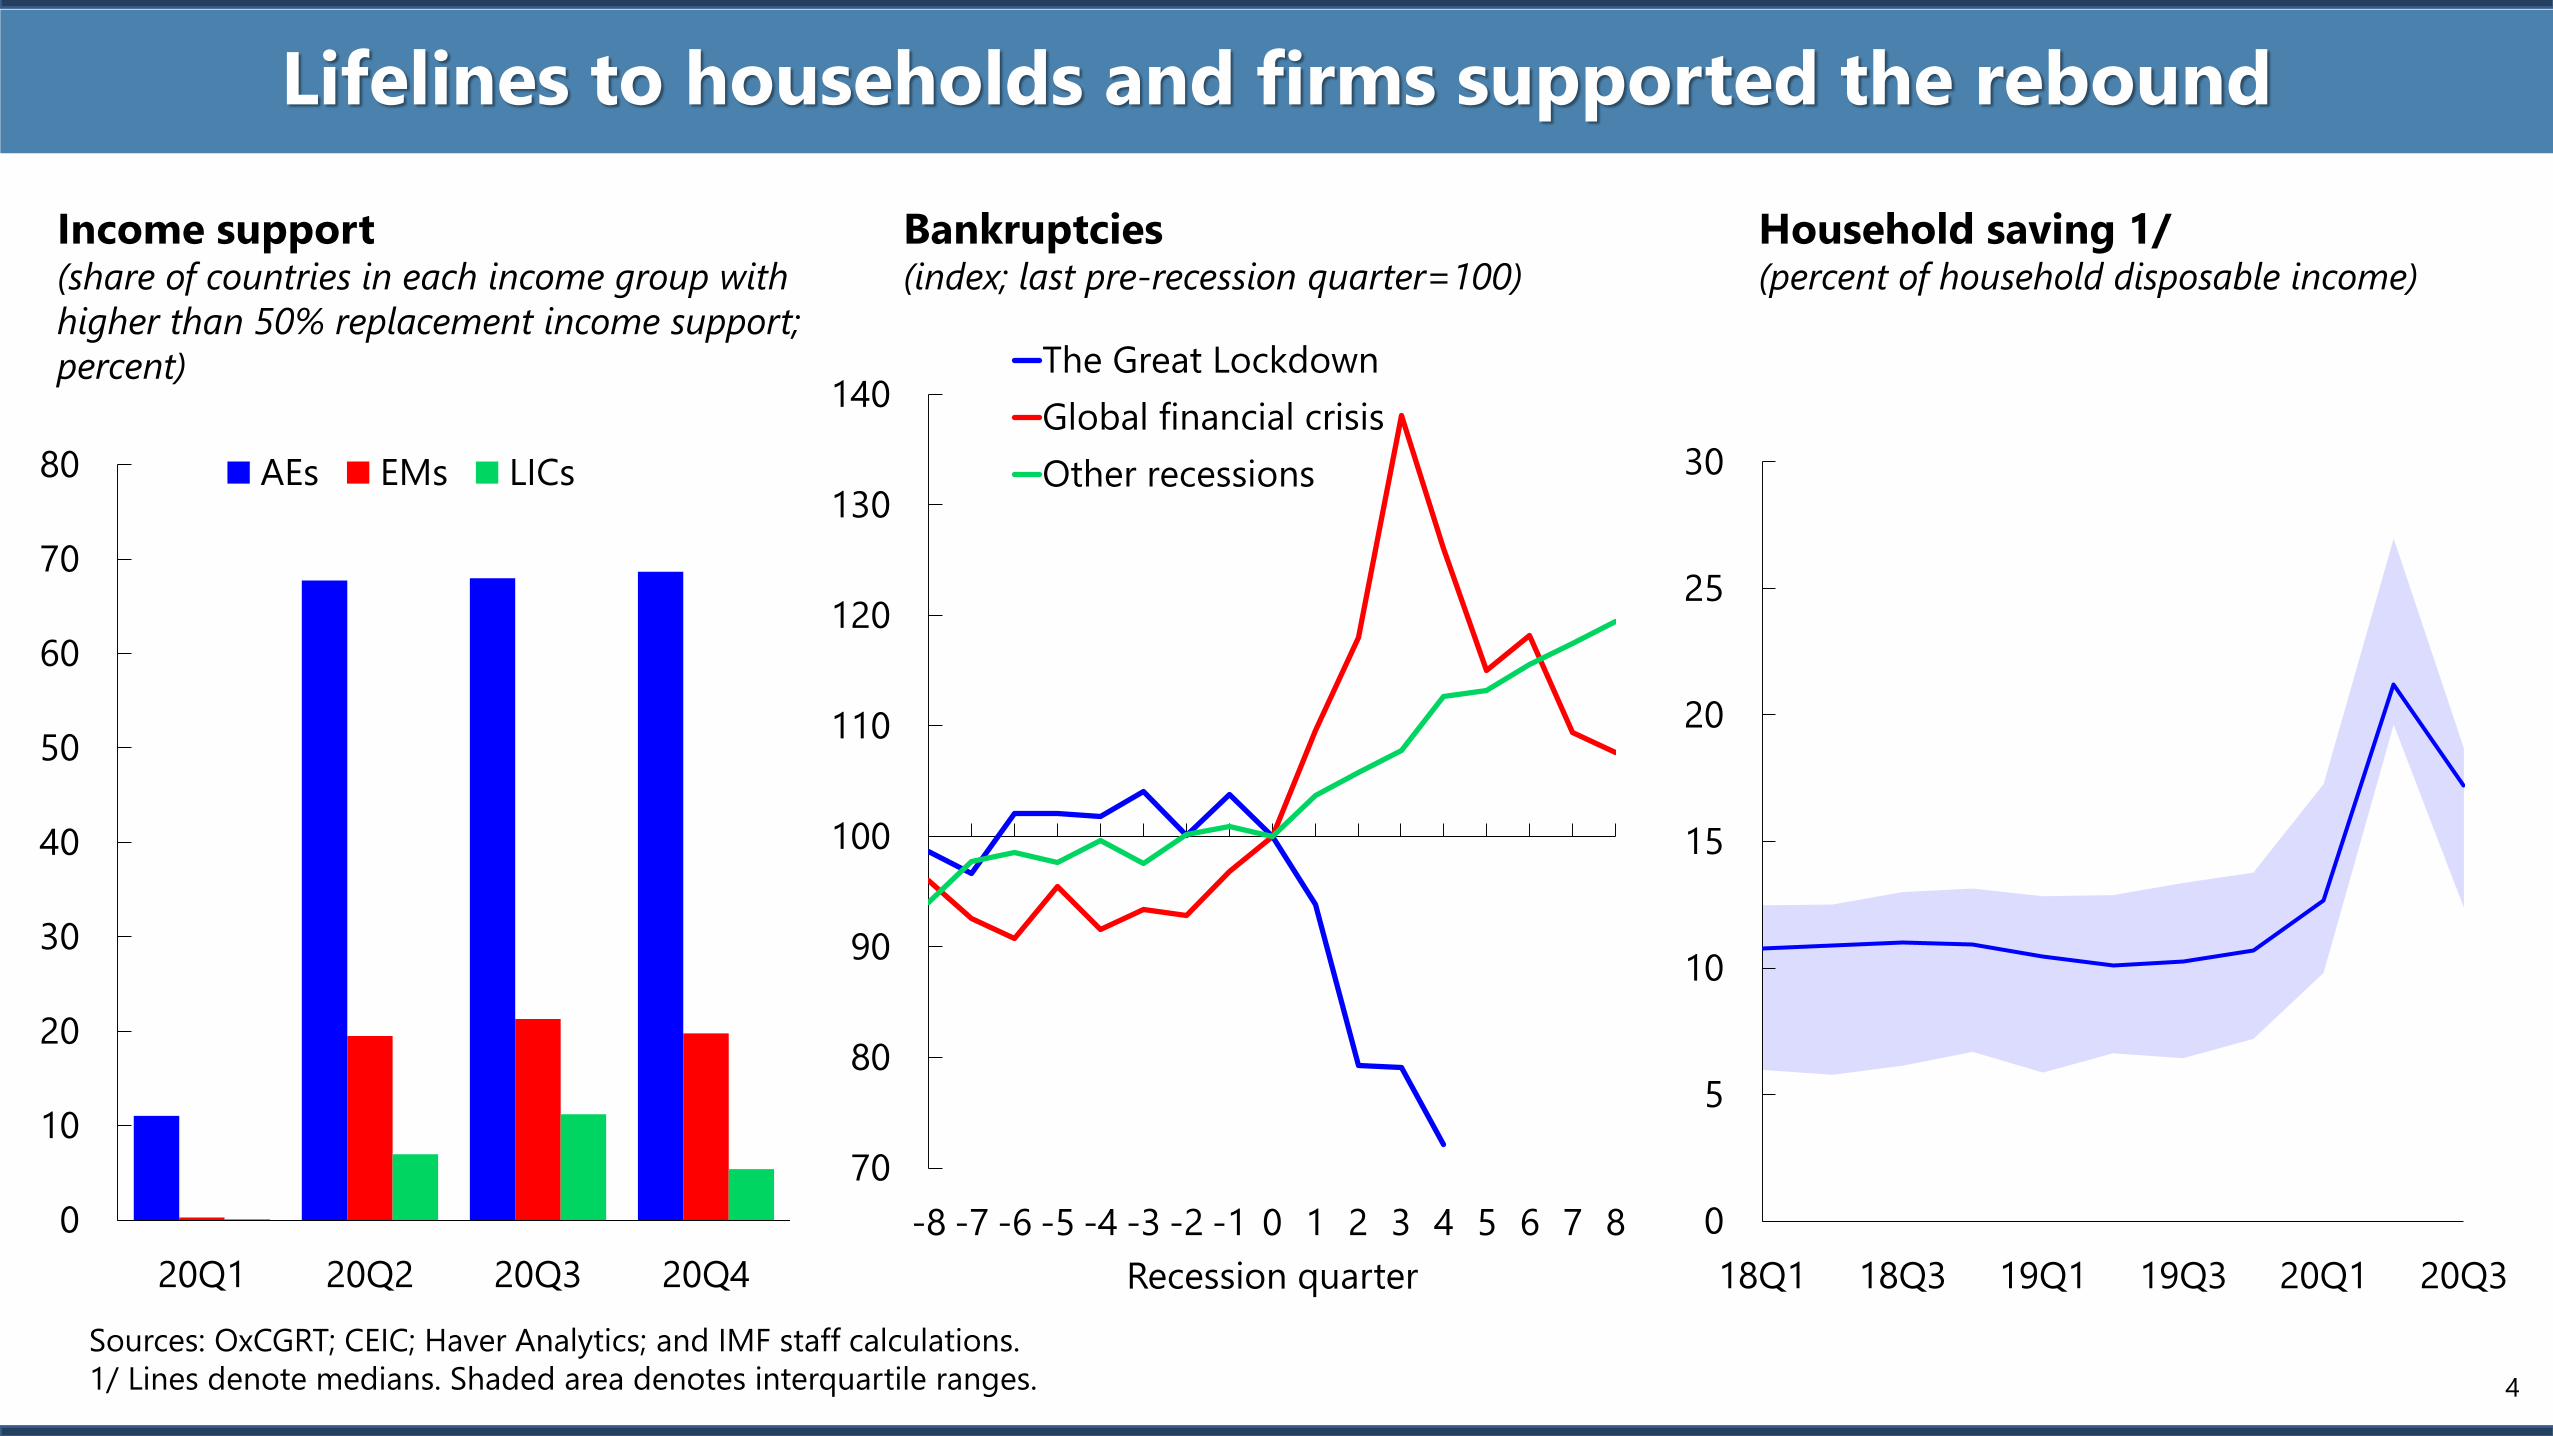
Lifelines to households and firms supported the rebound
Income support(share of countries in each income group with
higher than 50% replacement income support;
percent)
Sources: OxCGRT; CEIC; Haver Analytics; and IMF staff calculations.
1/ Lines denote medians. Shaded area denotes interquartile ranges.
Household saving 1/(percent of household disposable income)
0
10
20
30
40
50
60
70
80
20Q1 20Q2 20Q3 20Q4
AEs EMs LICs
0
5
10
15
20
25
30
18Q1 18Q3 19Q1 19Q3 20Q1 20Q3
Bankruptcies (index; last pre-recession quarter=100)
70
80
90
100
110
120
130
140
-8 -7 -6 -5 -4 -3 -2 -1 0 1 2 3 4 5 6 7 8
Recession quarter
The Great Lockdown
Global financial crisis
Other recessions
4
25
30
35
40
45
40
50
60
70
80
90
100
Jan-19 Jul-19 Jan-20 Jul-20
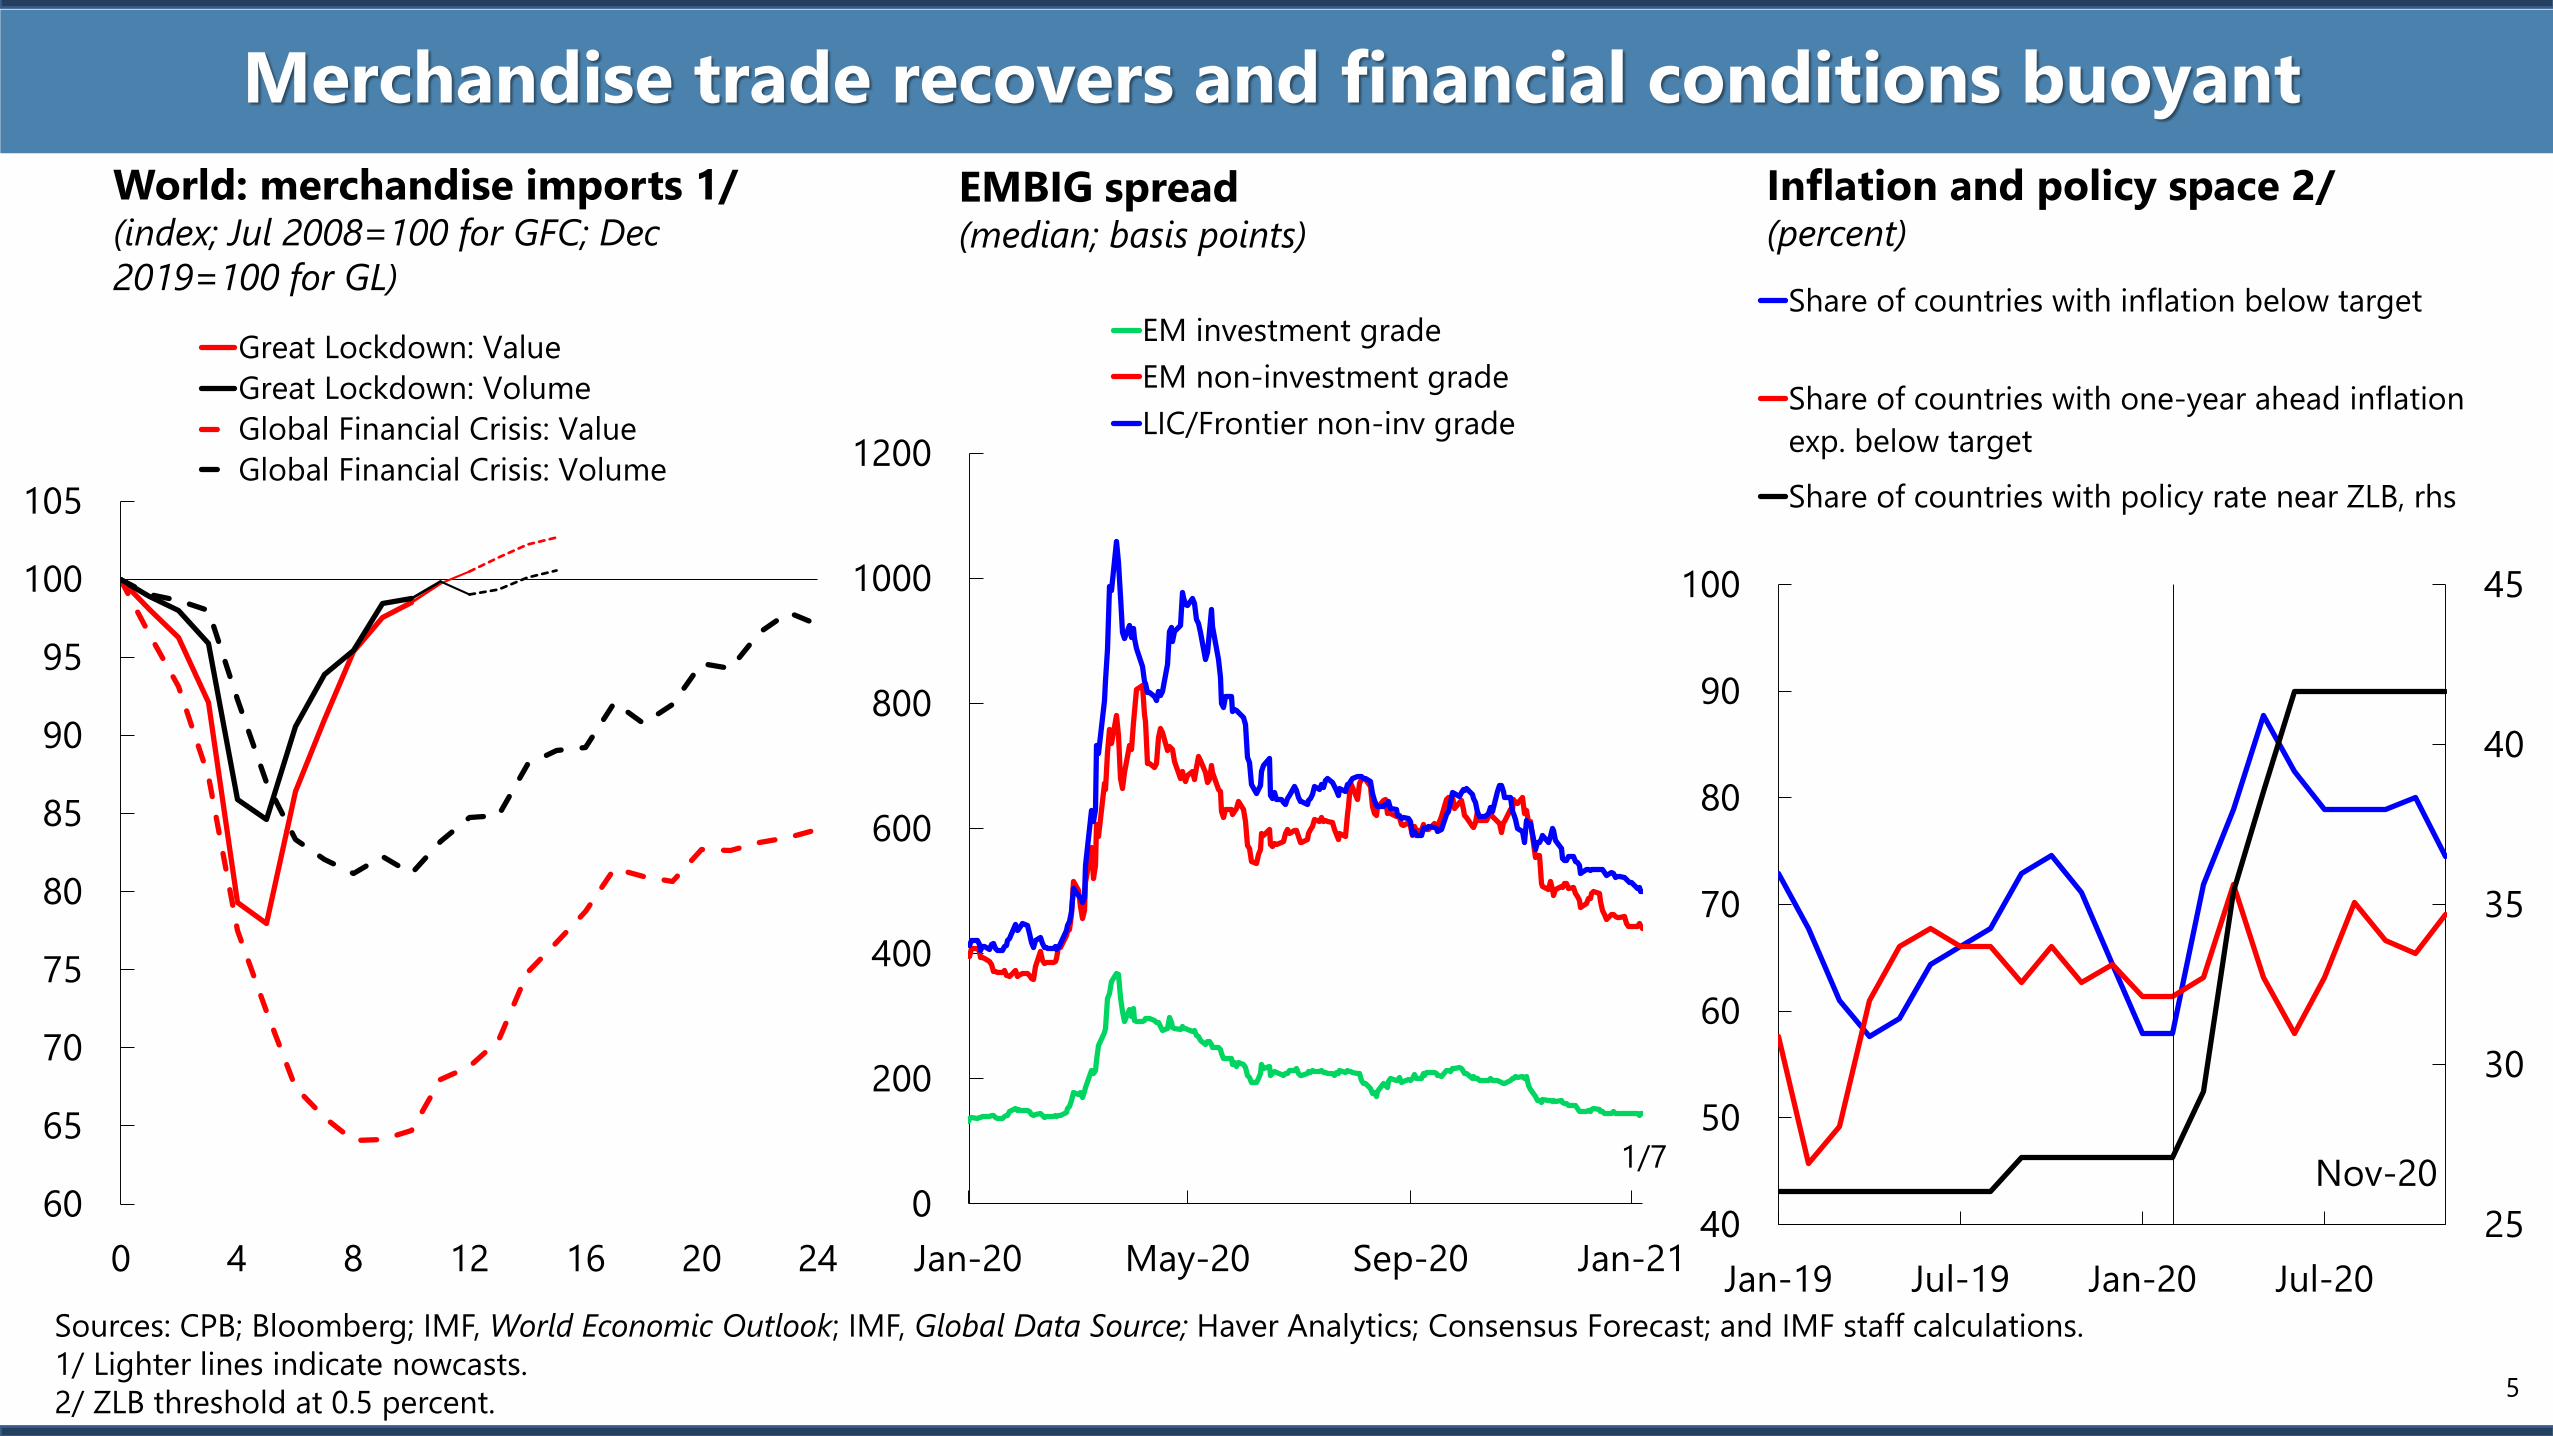
Share of countries with inflation below target
Share of countries with one-year ahead inflation
exp. below target
Share of countries with policy rate near ZLB, rhs
0
200
400
600
800
1000
1200
Jan-20 May-20 Sep-20 Jan-21
EM investment grade
EM non-investment grade
LIC/Frontier non-inv grade
Merchandise trade recovers and financial conditions buoyant
World: merchandise imports 1/(index; Jul 2008=100 for GFC; Dec
2019=100 for GL)
Sources: CPB; Bloomberg; IMF, World Economic Outlook; IMF, Global Data Source; Haver Analytics; Consensus Forecast; and IMF staff calculations.
1/ Lighter lines indicate nowcasts.
2/ ZLB threshold at 0.5 percent.
EMBIG spread(median; basis points)
1/7
Inflation and policy space 2/(percent)
60
65
70
75
80
85
90
95
100
105
0 4 8 12 16 20 24
Great Lockdown: Value
Great Lockdown: Volume
Global Financial Crisis: Value
Global Financial Crisis: Volume
Nov-20
5
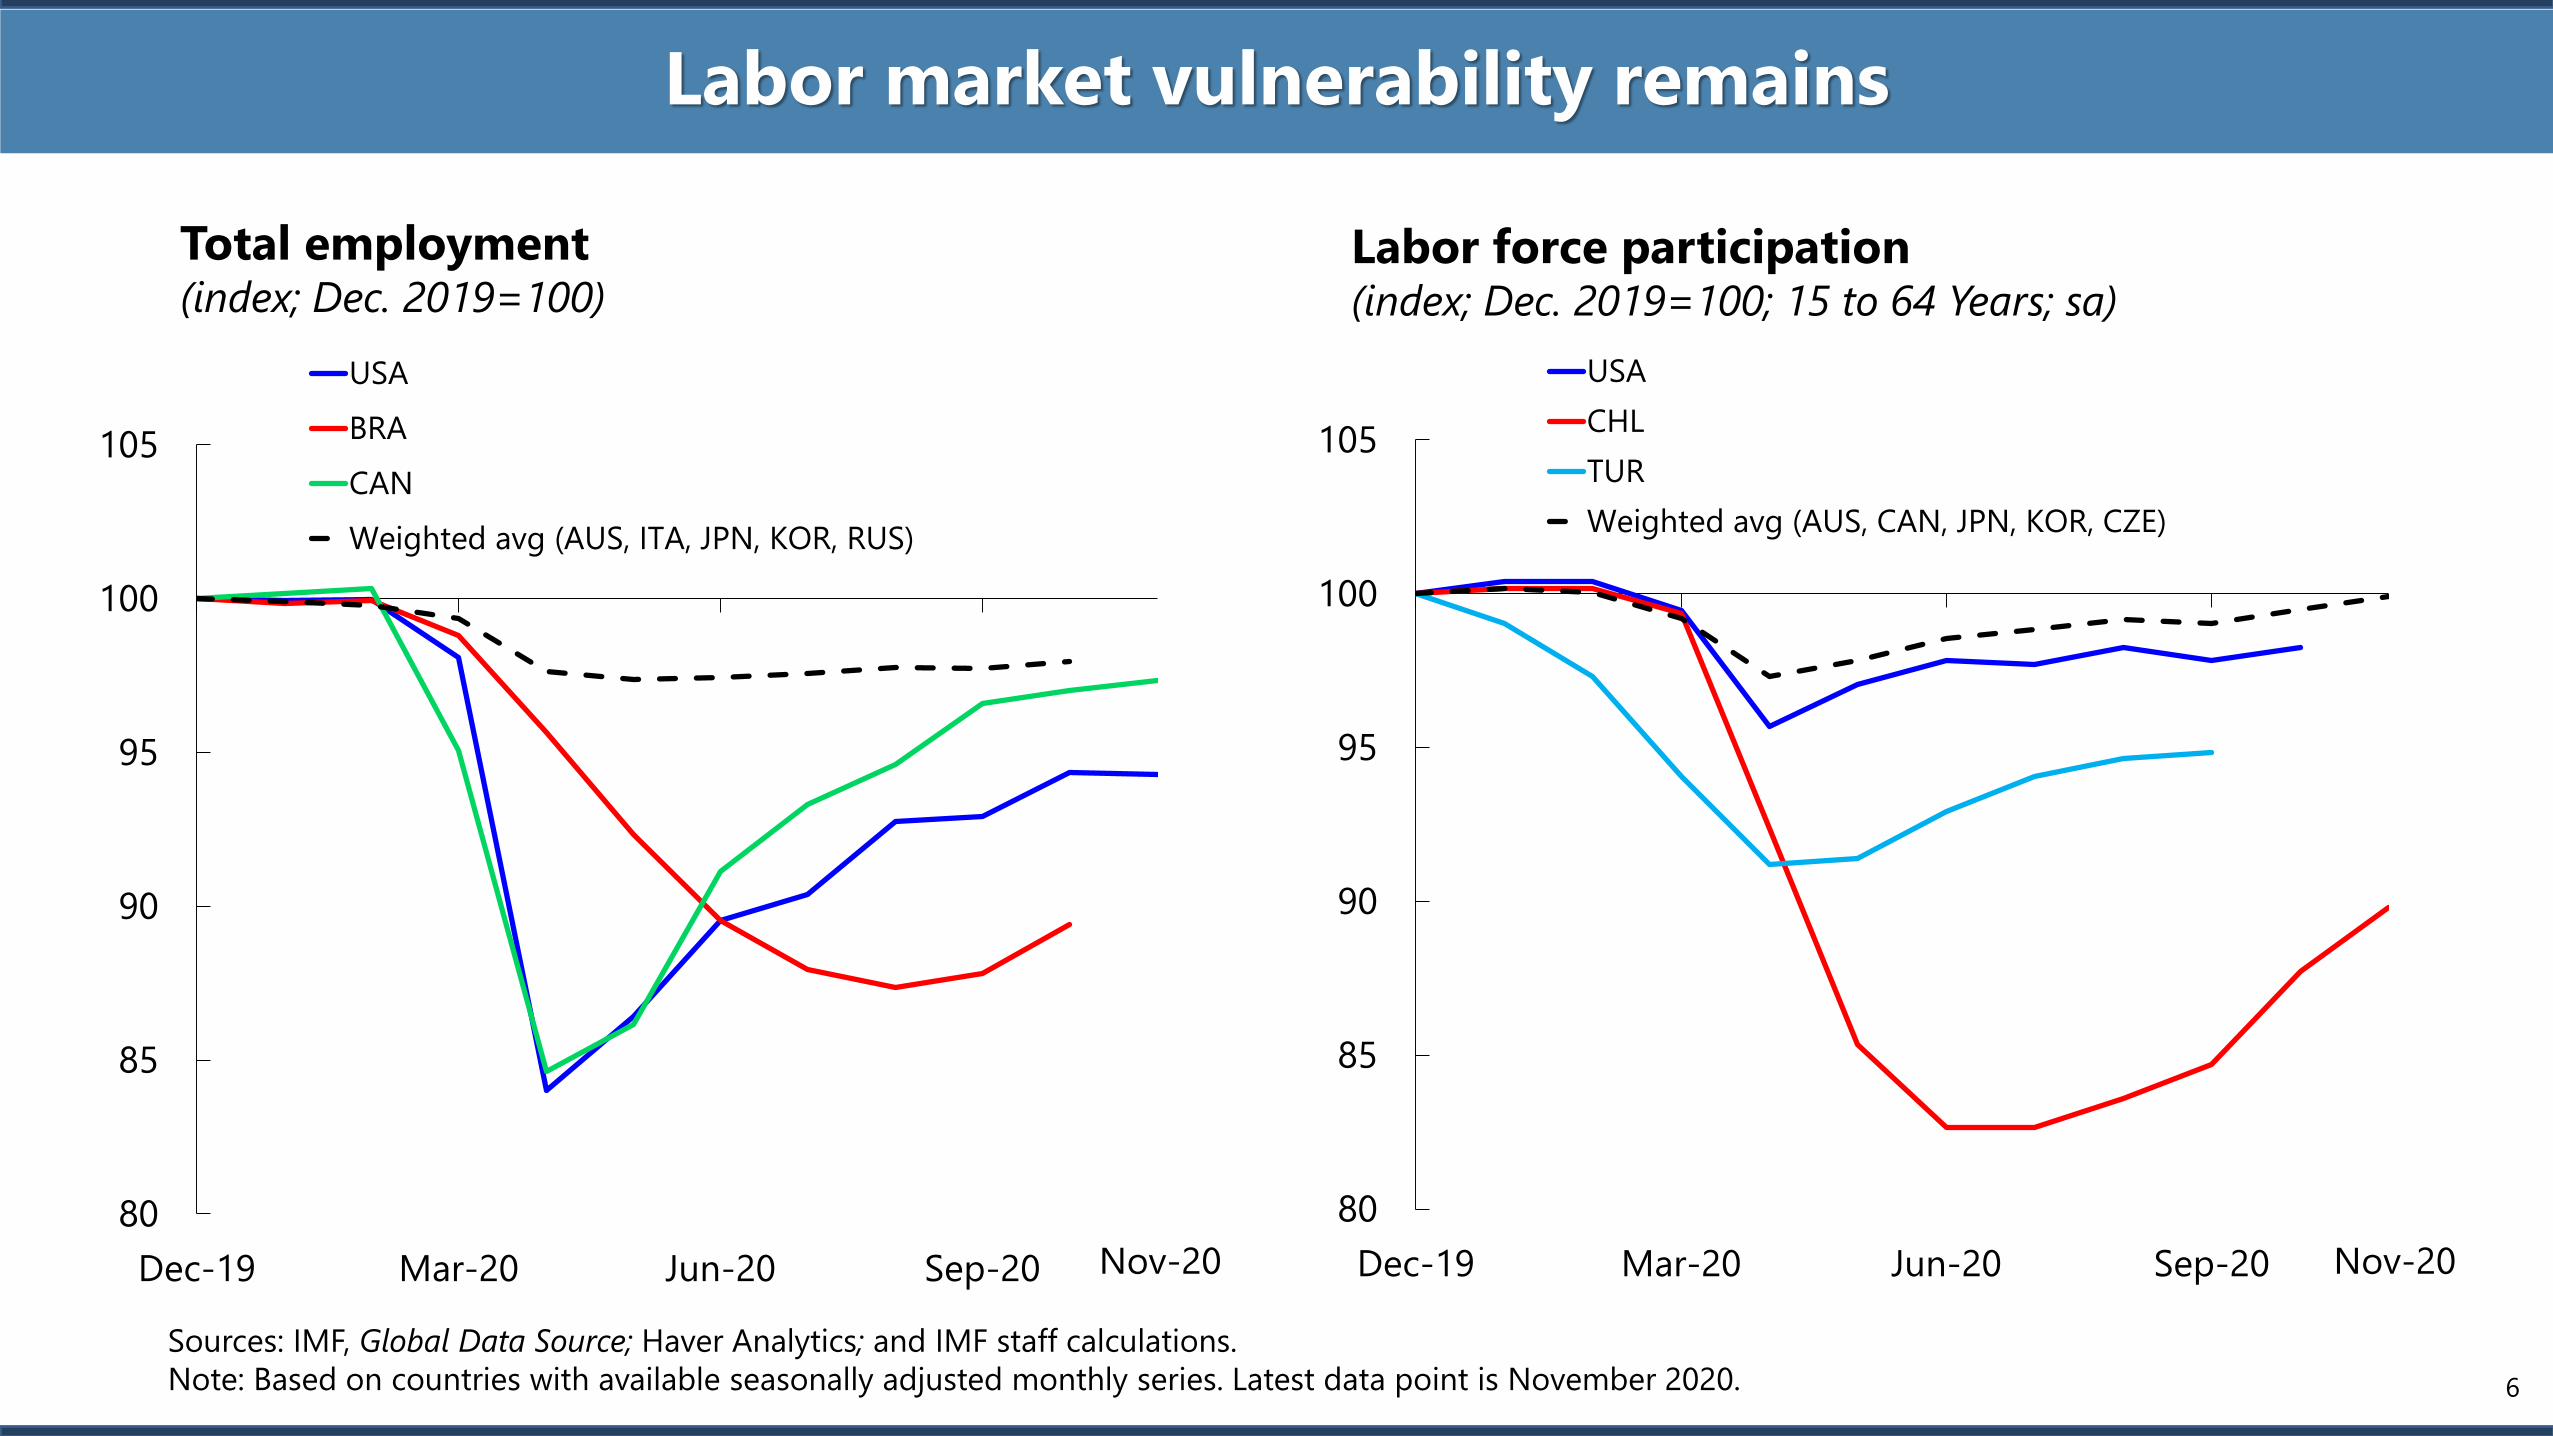
Labor market vulnerability remains
Labor force participation (index; Dec. 2019=100; 15 to 64 Years; sa)
Total employment(index; Dec. 2019=100)
Sources: IMF, Global Data Source; Haver Analytics; and IMF staff calculations.
Note: Based on countries with available seasonally adjusted monthly series. Latest data point is November 2020.
80
85
90
95
100
105
Dec-19 Mar-20 Jun-20 Sep-20
USA
CHL
TUR
Weighted avg (AUS, CAN, JPN, KOR, CZE)
80
85
90
95
100
105
Dec-19 Mar-20 Jun-20 Sep-20
USA
BRA
CAN
Weighted avg (AUS, ITA, JPN, KOR, RUS)
Nov-20Nov-20
6
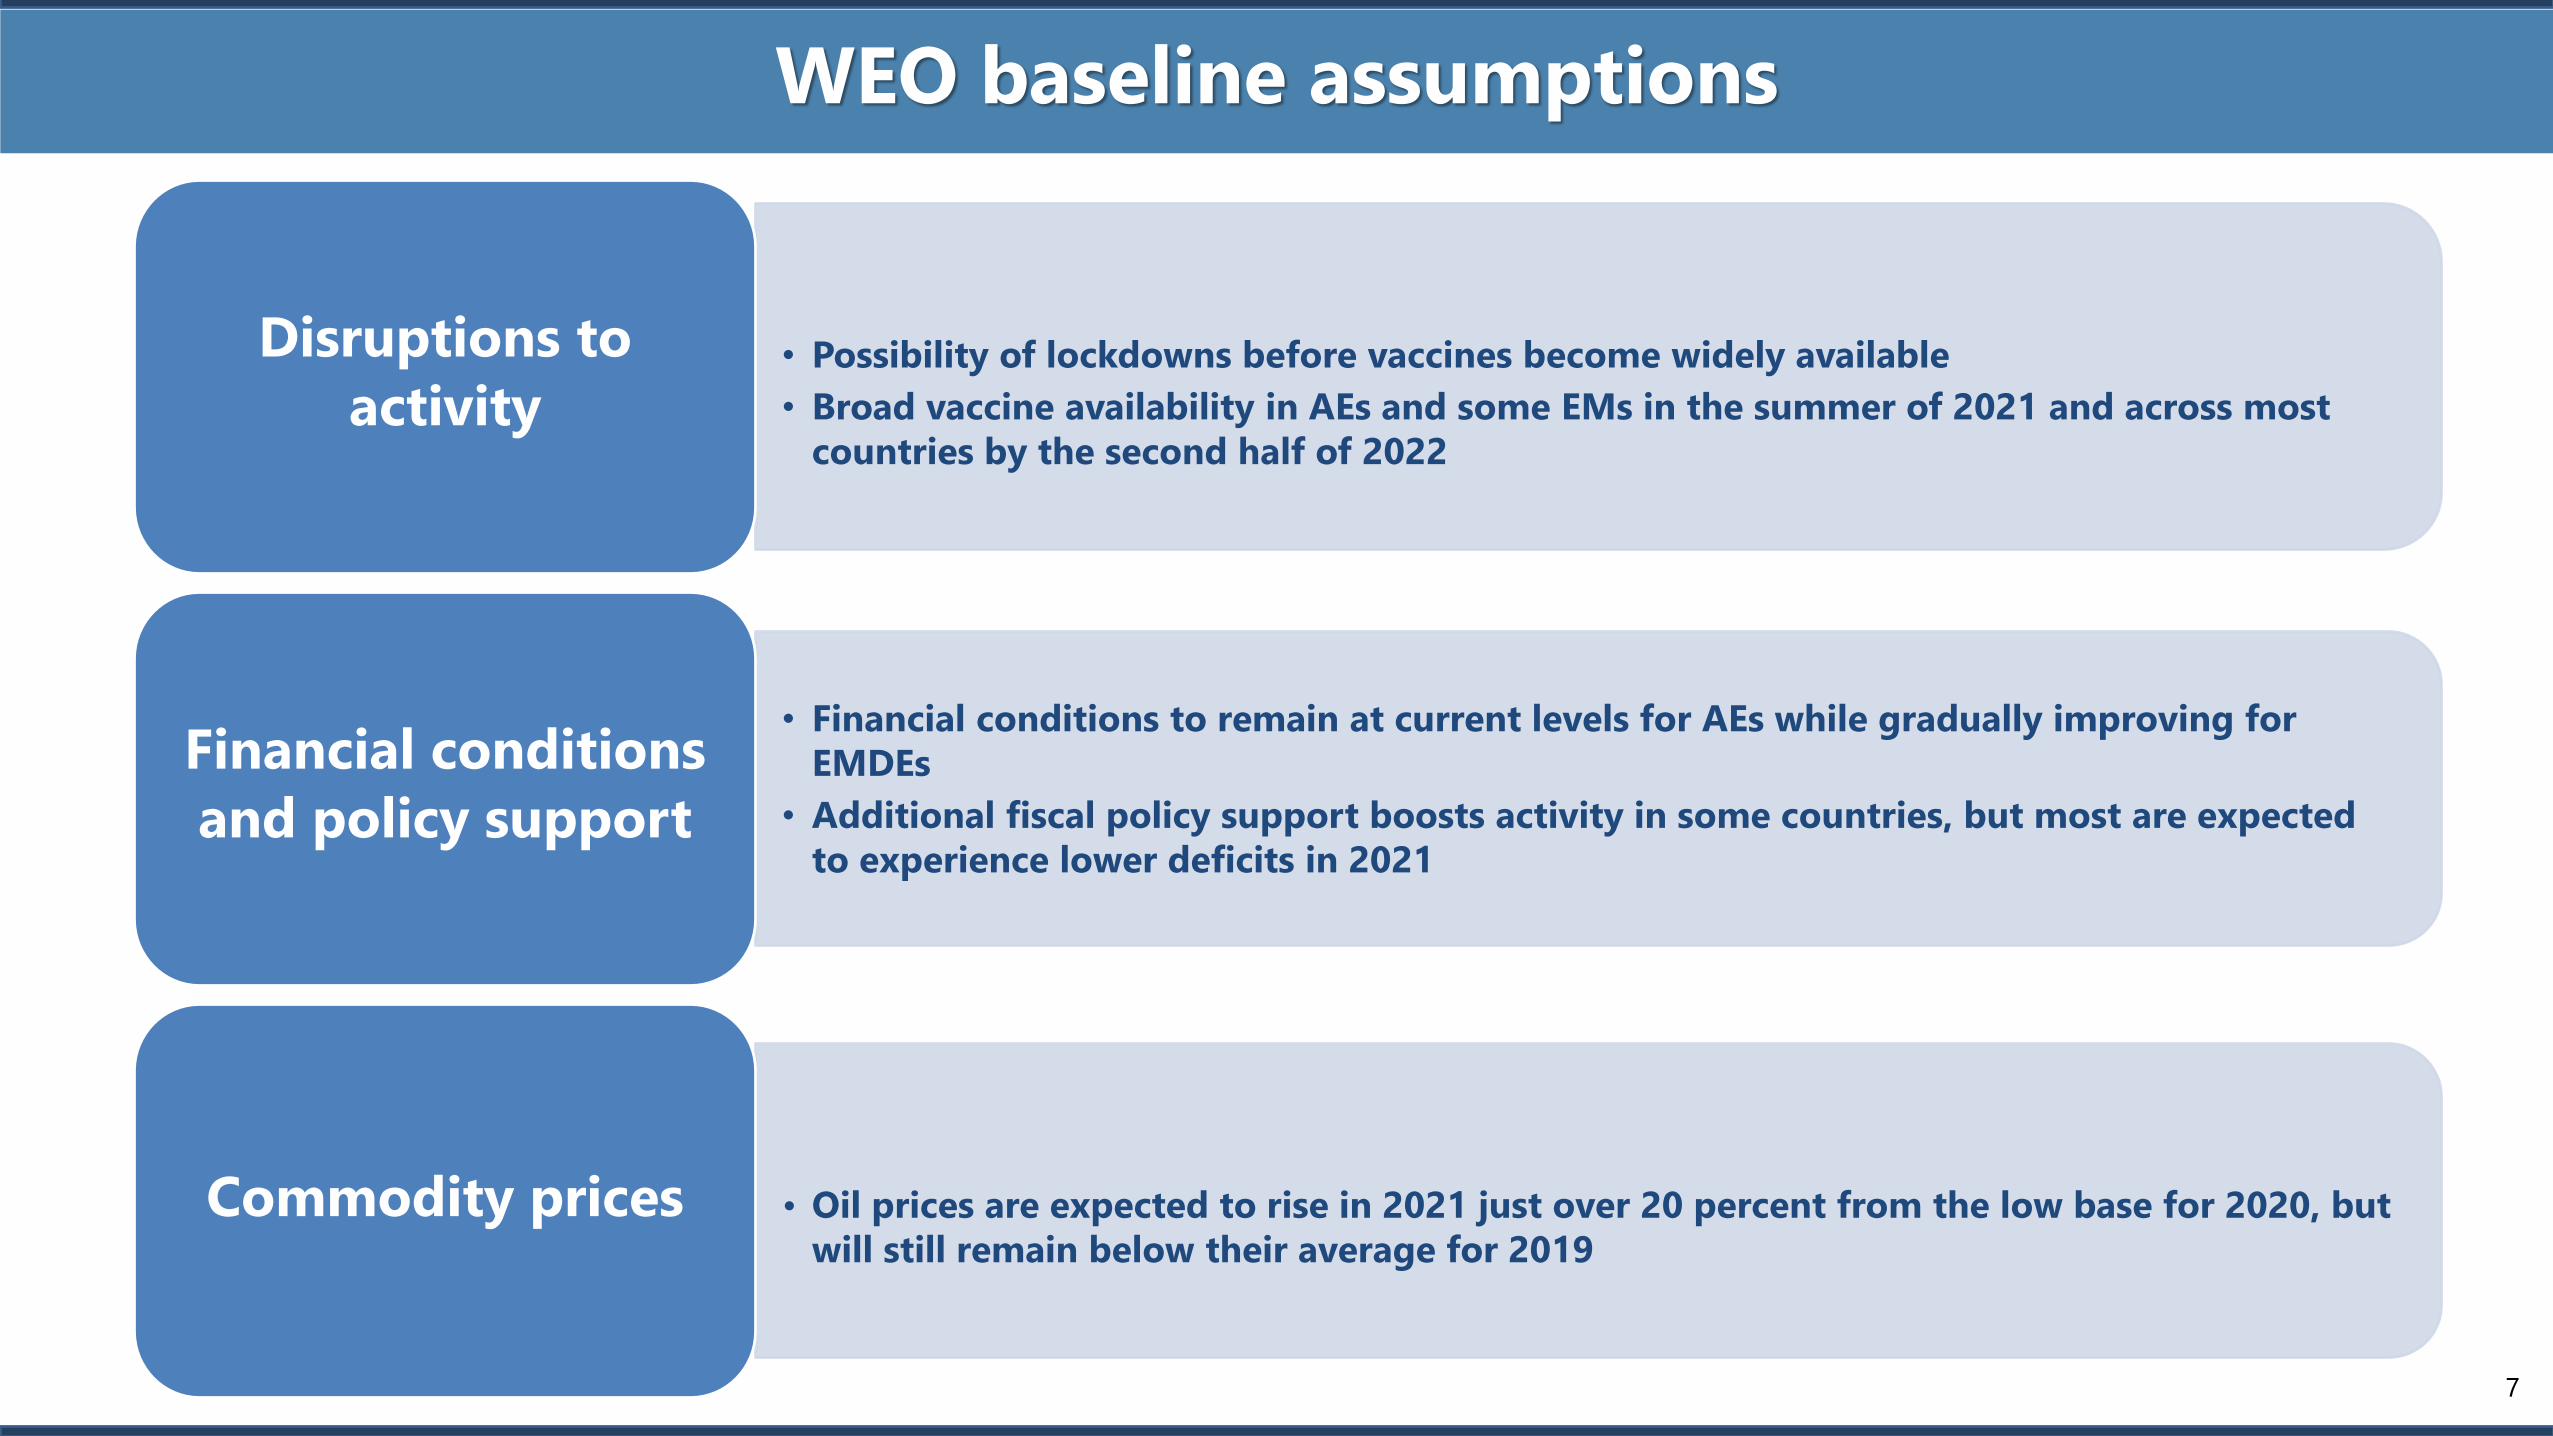
WEO baseline assumptions
• Possibility of lockdowns before vaccines become widely available
• Broad vaccine availability in AEs and some EMs in the summer of 2021 and across most
countries by the second half of 2022
Disruptions to
activity
• Financial conditions to remain at current levels for AEs while gradually improving for
EMDEs
• Additional fiscal policy support boosts activity in some countries, but most are expected
to experience lower deficits in 2021
Financial conditions
and policy support
• Oil prices are expected to rise in 2021 just over 20 percent from the low base for 2020, but
will still remain below their average for 2019
Commodity prices
7

WEO Projections

World
Advanced
Economies U.S. Euro Area Japan U.K. Canada
Other
Advanced
Asia
2020 -3.5 -4.9 -3.4 -7.2 -5.1 -10.0 -5.5 -1.5
Revision from
Oct. 2020 0.9 0.9 0.9 1.1 0.2 -0.2 1.6 1.4
2021 5.5 4.3 5.1 4.2 3.1 4.5 3.6 3.6
Revision from
Oct. 2020 0.3 0.4 2.0 -1.0 0.8 -1.4 -1.6 0.3
2022 4.2 3.1 2.5 3.6 2.4 5.0 4.1 2.9
Revision from
Oct. 2020 0.0 0.2 -0.4 0.5 0.7 1.8 0.7 0.1
Growth projections: Advanced economies (percent change from a year earlier)
Source: IMF, World Economic Outlook January 2021. 9
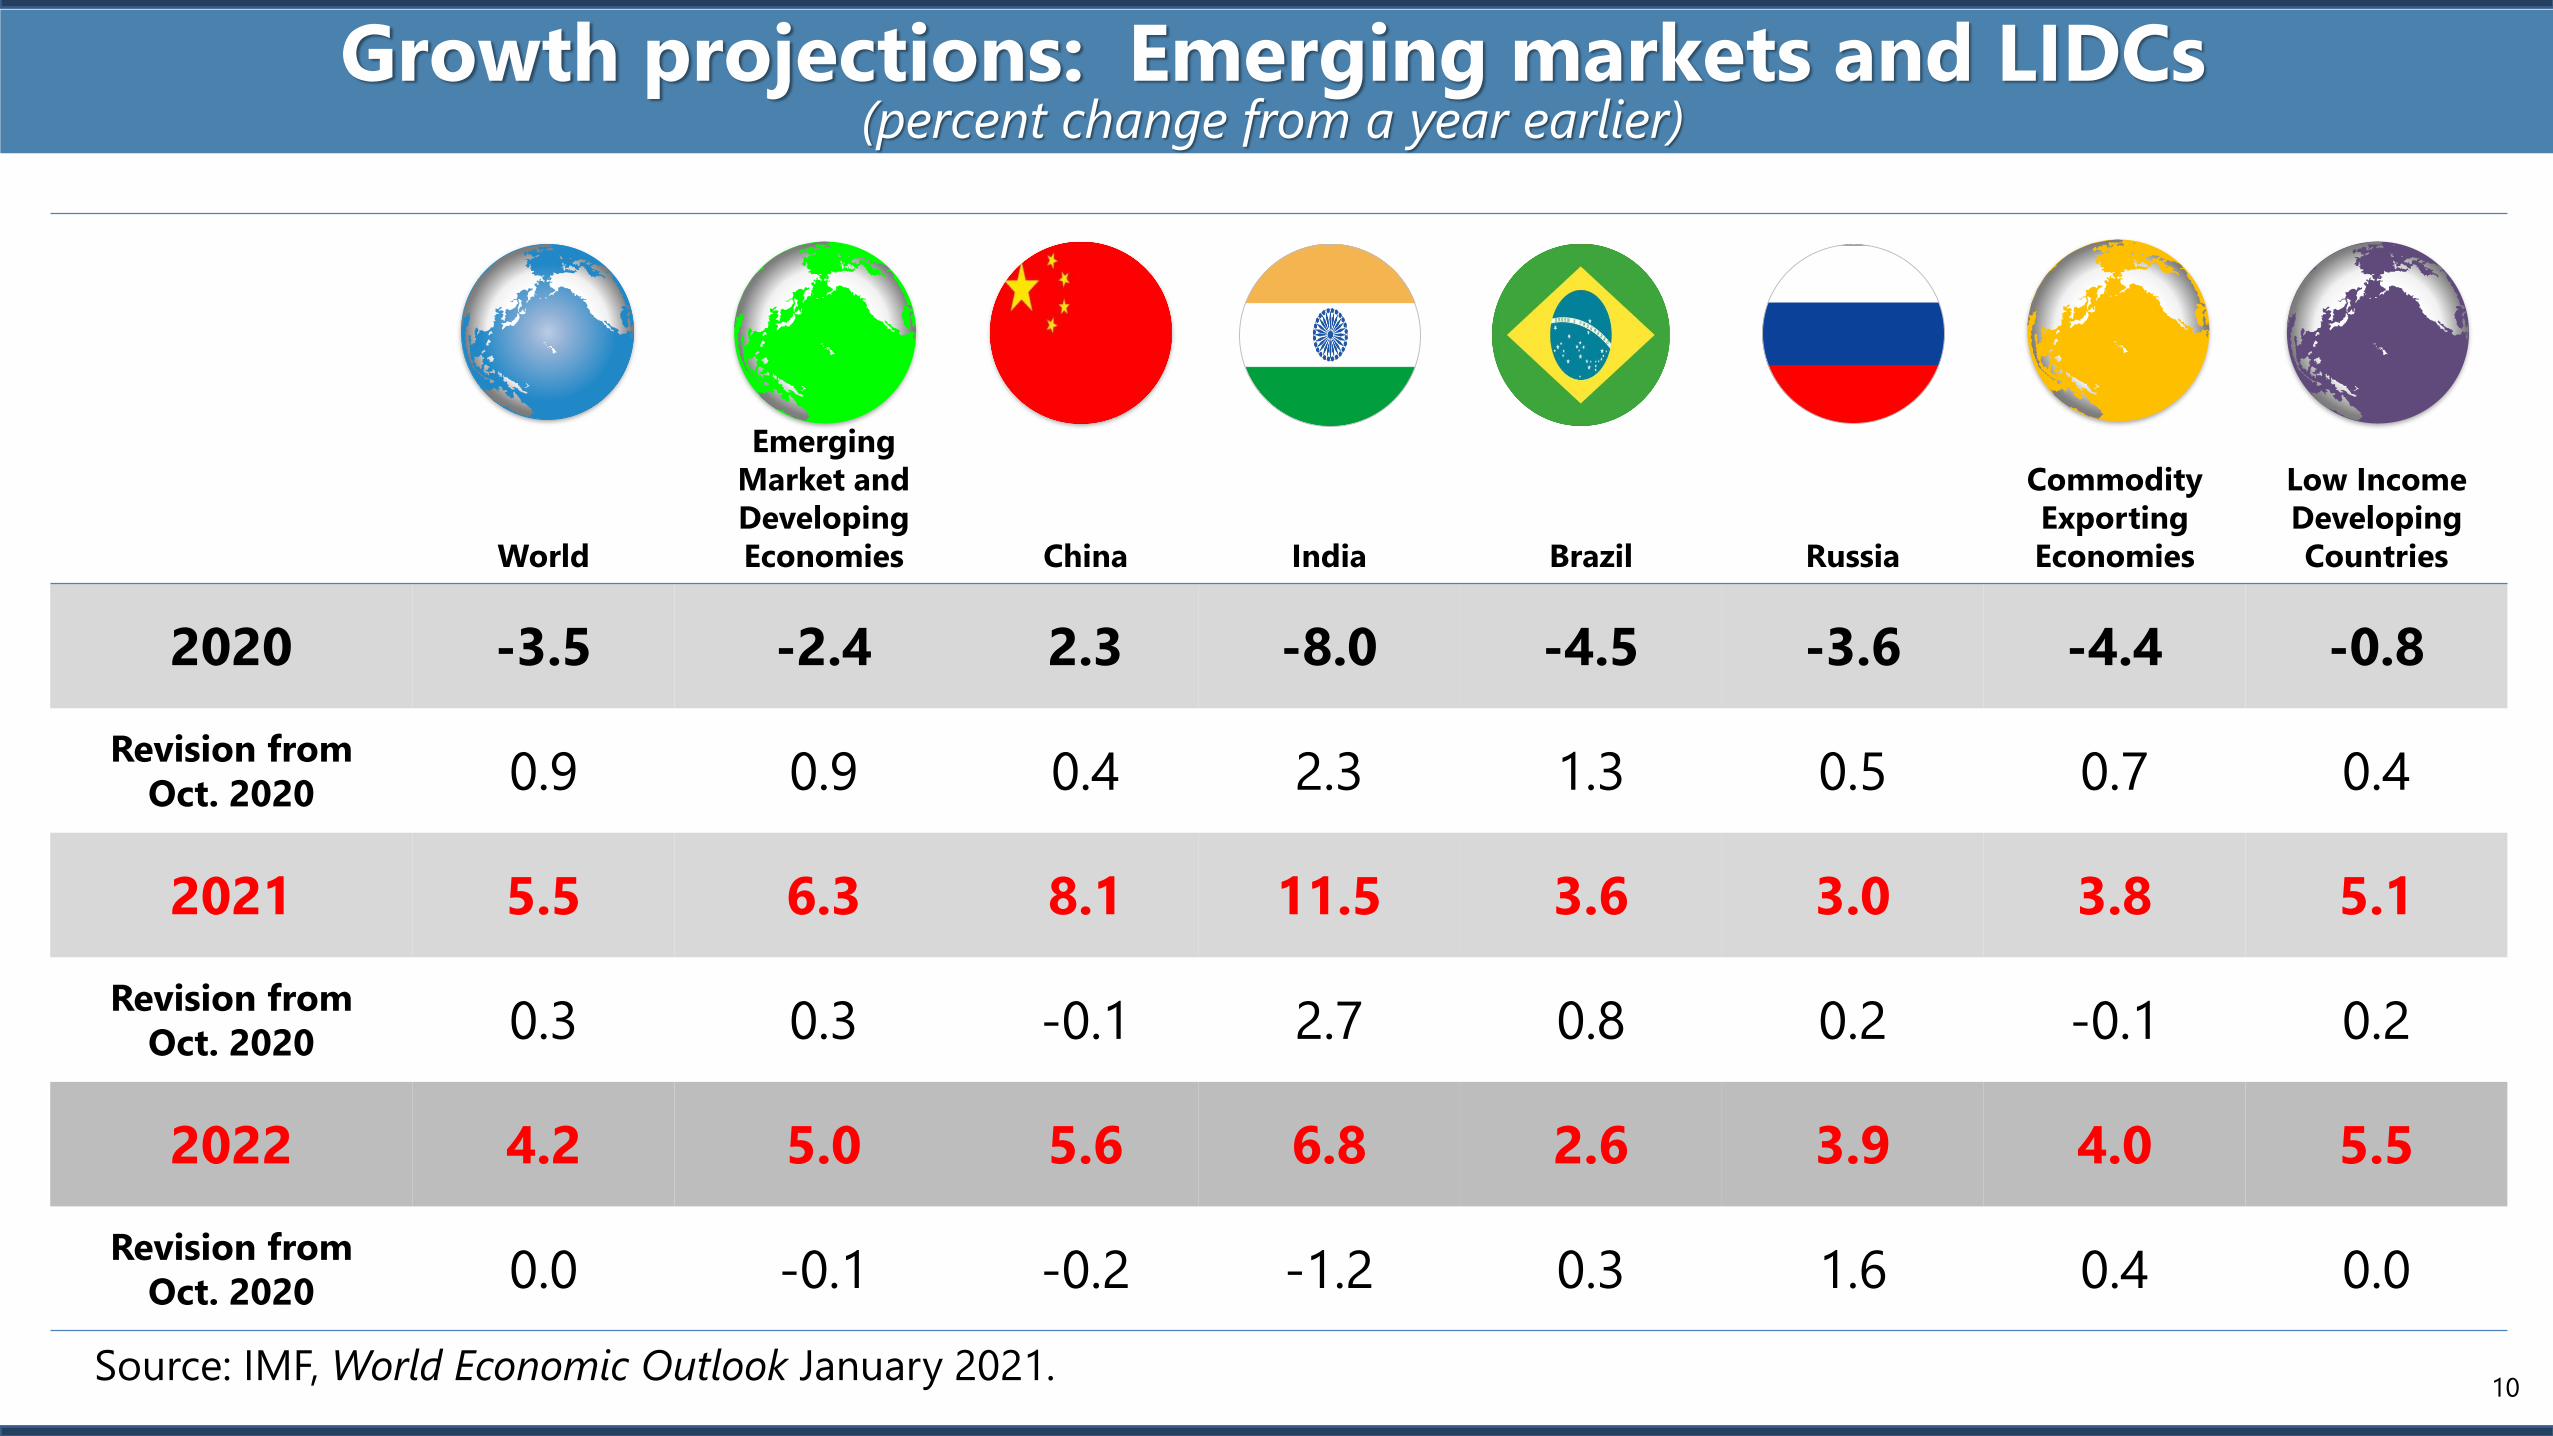
World
Emerging
Market and
Developing
Economies China India Brazil Russia
Commodity
Exporting
Economies
Low Income
Developing
Countries
2020 -3.5 -2.4 2.3 -8.0 -4.5 -3.6 -4.4 -0.8
Revision from
Oct. 2020 0.9 0.9 0.4 2.3 1.3 0.5 0.7 0.4
2021 5.5 6.3 8.1 11.5 3.6 3.0 3.8 5.1
Revision from
Oct. 2020 0.3 0.3 -0.1 2.7 0.8 0.2 -0.1 0.2
2022 4.2 5.0 5.6 6.8 2.6 3.9 4.0 5.5
Revision from
Oct. 2020 0.0 -0.1 -0.2 -1.2 0.3 1.6 0.4 0.0
Growth projections: Emerging markets and LIDCs (percent change from a year earlier)
Source: IMF, World Economic Outlook January 2021.10
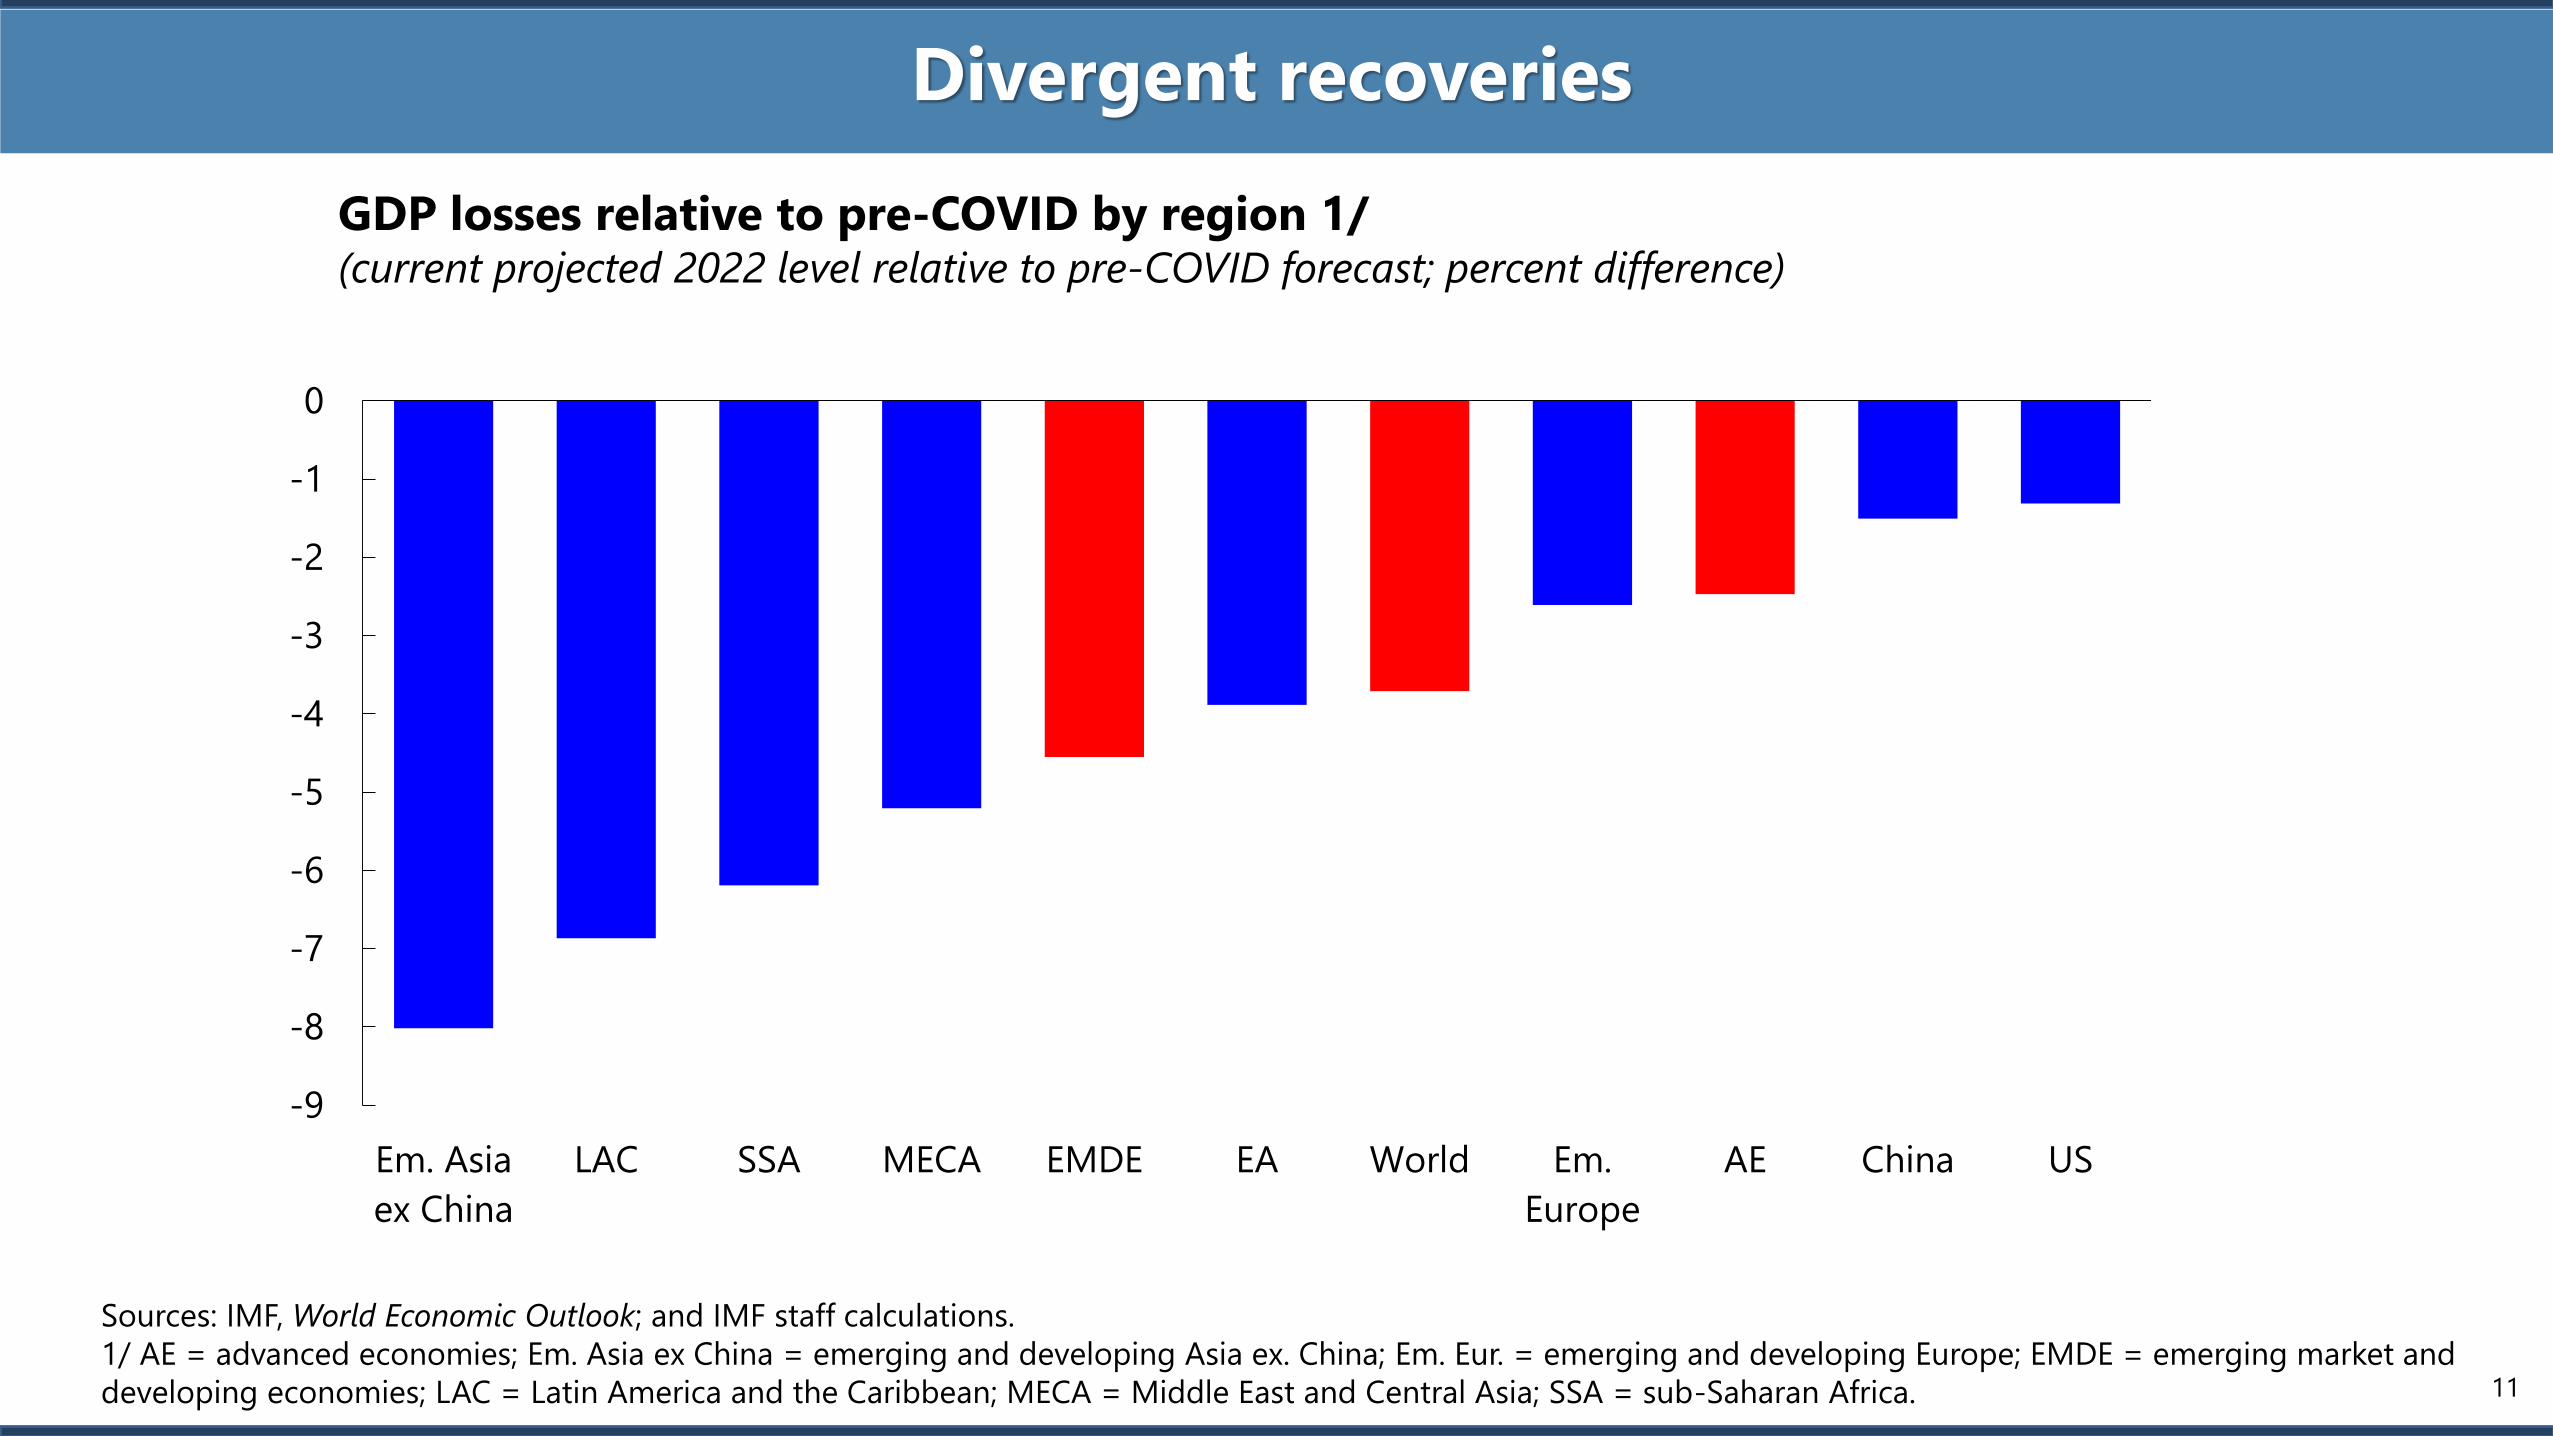
Divergent recoveries
Sources: IMF, World Economic Outlook; and IMF staff calculations.
1/ AE = advanced economies; Em. Asia ex China = emerging and developing Asia ex. China; Em. Eur. = emerging and developing Europe; EMDE = emerging market and
developing economies; LAC = Latin America and the Caribbean; MECA = Middle East and Central Asia; SSA = sub-Saharan Africa.
GDP losses relative to pre-COVID by region 1/(current projected 2022 level relative to pre-COVID forecast; percent difference)
-9
-8
-7
-6
-5
-4
-3
-2
-1
0
Em. Asia
ex China
LAC SSA MECA EMDE EA World Em.
Europe
AE China US
11
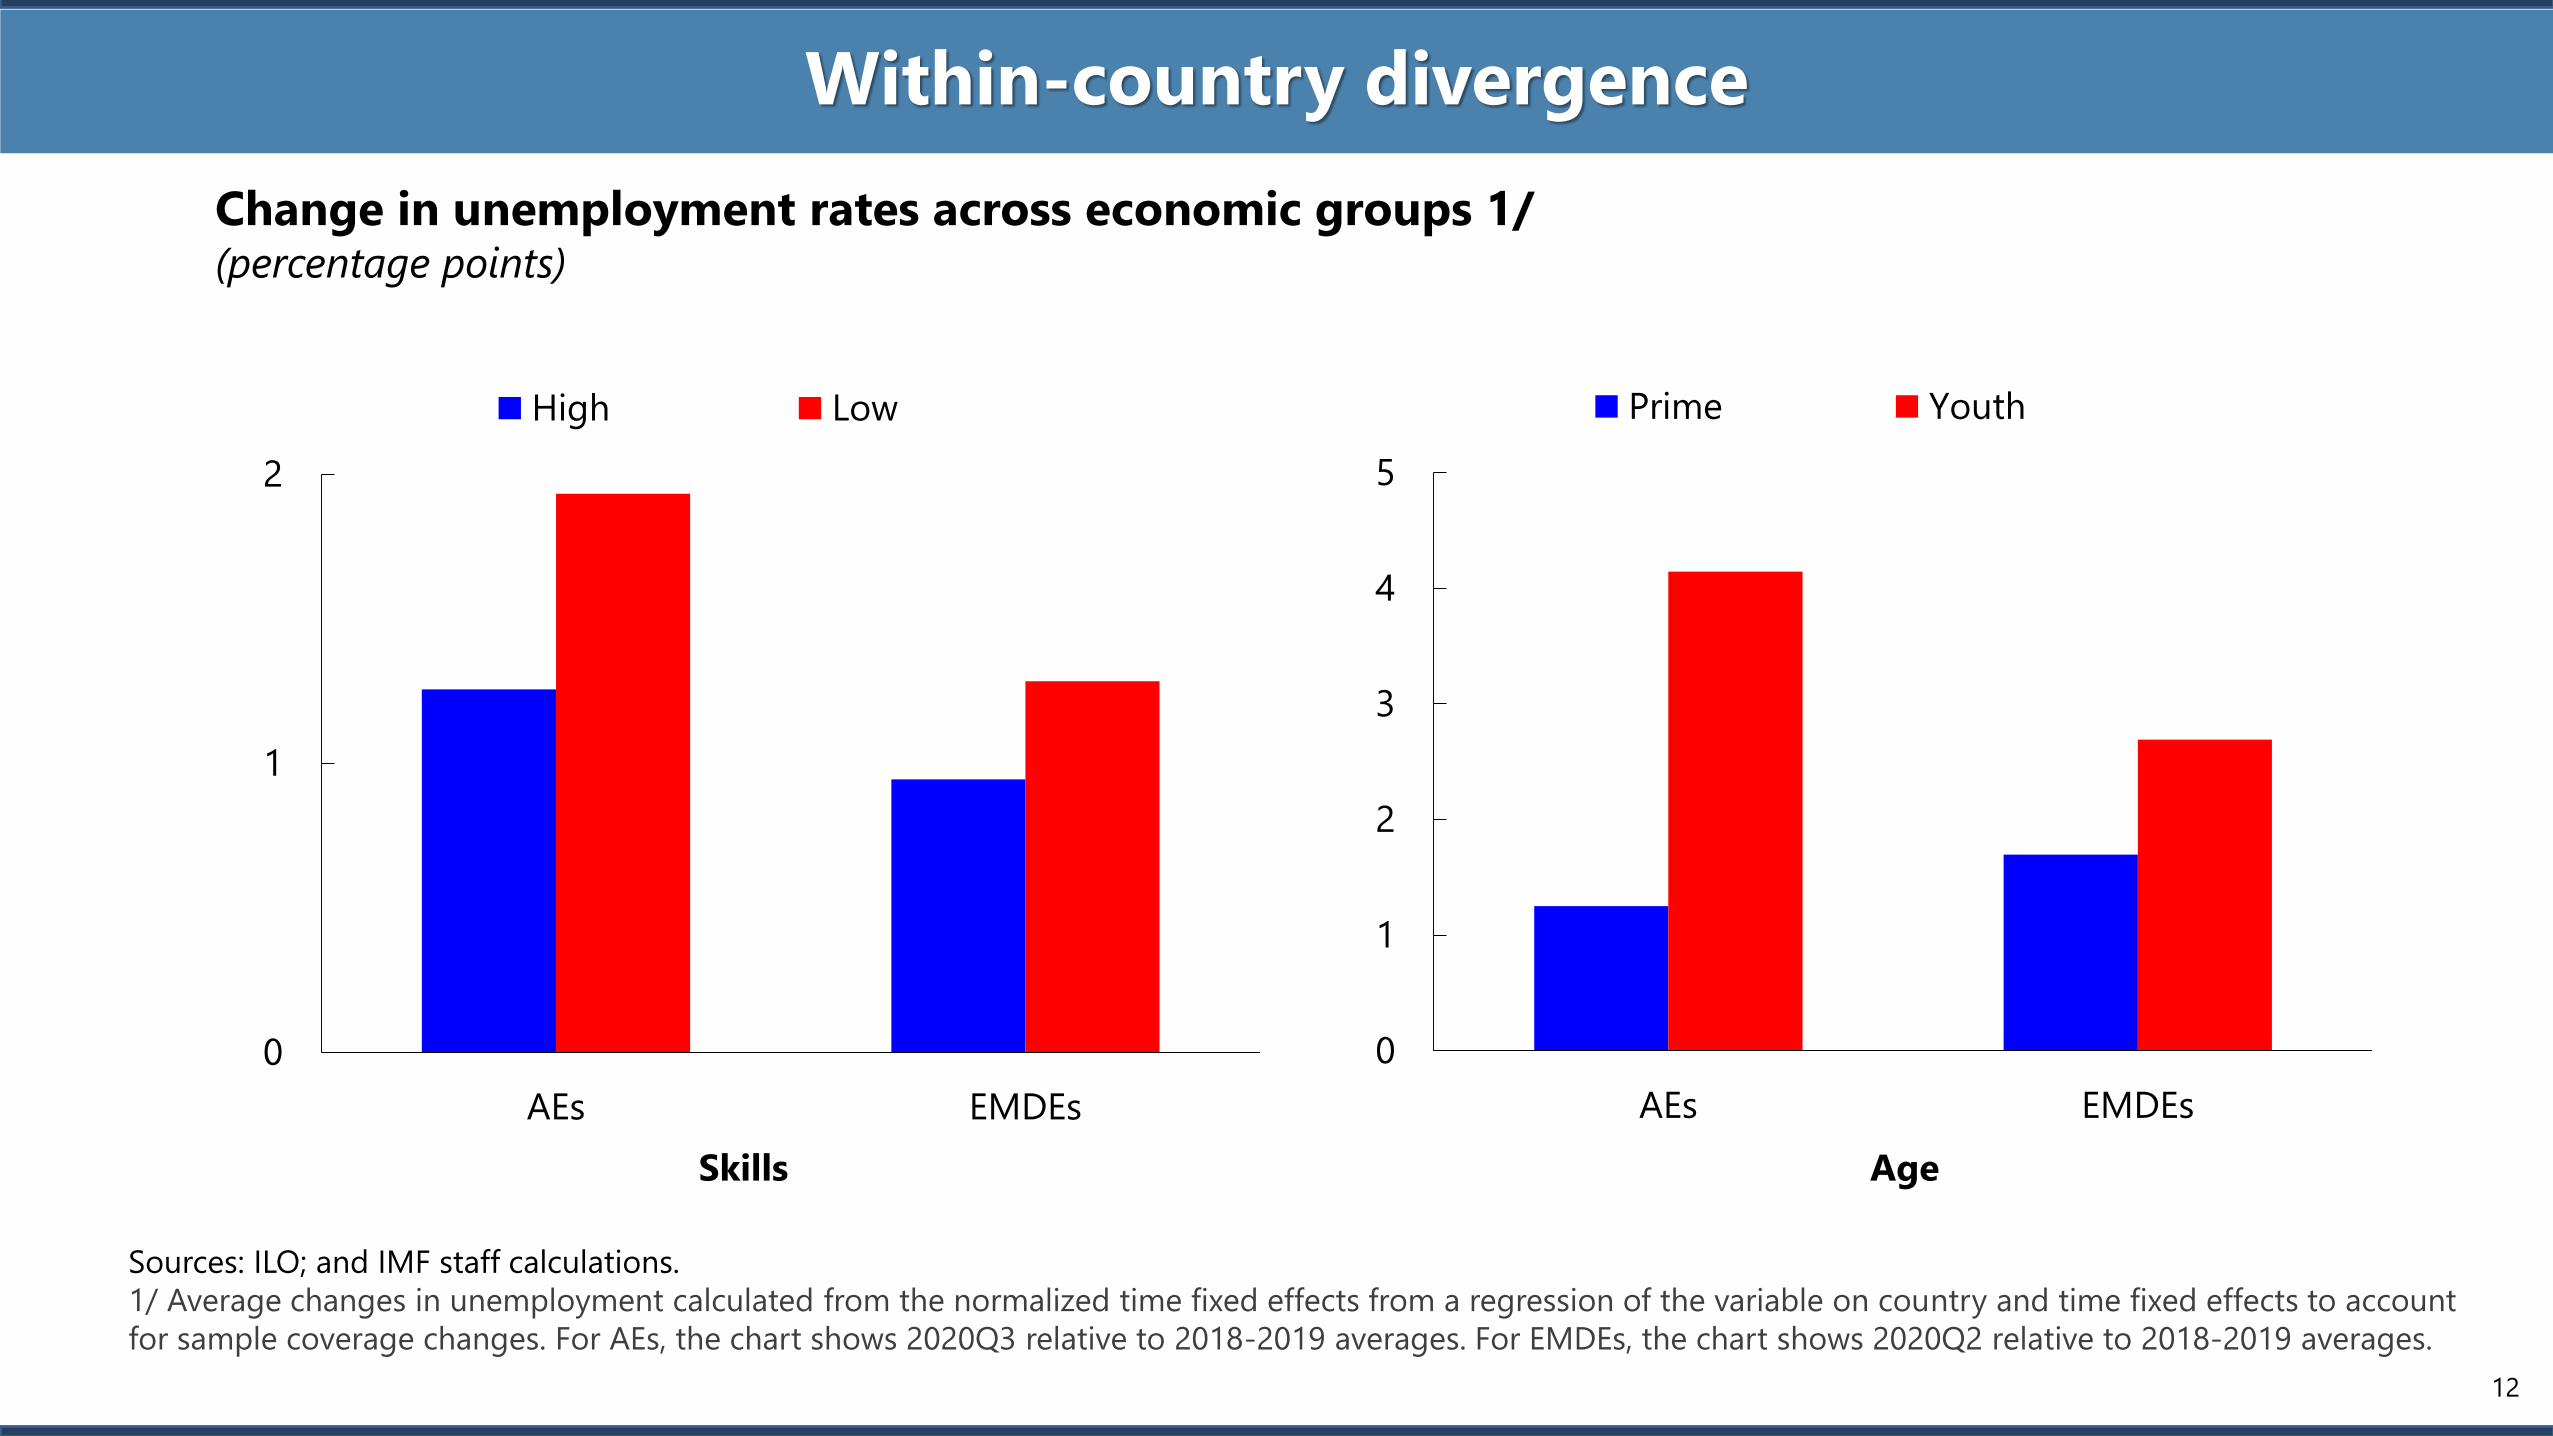
Within-country divergence
Sources: ILO; and IMF staff calculations.
1/ Average changes in unemployment calculated from the normalized time fixed effects from a regression of the variable on country and time fixed effects to account
for sample coverage changes. For AEs, the chart shows 2020Q3 relative to 2018-2019 averages. For EMDEs, the chart shows 2020Q2 relative to 2018-2019 averages.
Change in unemployment rates across economic groups 1/(percentage points)
0
1
2
3
4
5
AEs EMDEs
Prime Youth
0
1
2
AEs EMDEs
High Low
Skills Age
12

40%
43%
53%
60%
62%
62%
65%
64%
71%
75%
75%
77%
77%
78%
80%
54%
68%
69%
65%
64%
69%
69%
76%
83%
79%
78%
79%
81%
85%
35% 55% 75% 95%
France
Russia
South Africa
Japan
Italy
Spain
Germany
United States
Canada
South Korea
Australia
Mexico
United Kingdom
Brazil
China
Willingness to get COVID-19 vaccine
Sources Haver Analytics; OxCGRT; Duke Global Health Innovation Center; Global Advisor; Ipsos; and IMF staff calculations.
1/ Based on18,526 online adults aged 16-74 across 15 countries.
Divergences: Vaccines/Therapies
COVID-19 doses administered (per100 persons; as of 1/25/ 2021)
Vaccine supply coverage
(percent of population; confirmed
agreements only)December 2020 October 2020
0
50
100
150
200
250
300
G20 AEs G20 EMs non-G20
EMs
non-G20
LIDCs
2020Q4
2021Q1
2021Q2
2021Q3
2021Q4
Unknown
Vaccine demand 1/(percent)
(1/23/2021)
(1/24/2021)
(1/23/2021)
(1/24/2021)
(1/13/2021)
(1/23/2021)
(1/17/2021)
(1/24/2021)
(1/24/2021)
(1/22/2021)
(1/24/2021)
(1/20/2021)
(1/22/2021)
(1/23/2021)
(1/23/2021)
(1/23/2021)
(1/20/2021)
(1/23/2021)
(1/24/2021)
(1/24/2021)
0 10 20 30 40 50
India
Brazil
Mexico
Argentina
Russia
World
Saudi Arabia
Turkey
France
Germany
Italy
Ireland
Spain
Slovenia
Denmark
United States
Bahrain
United Kingdom
United Arab Emirates
Israel
13
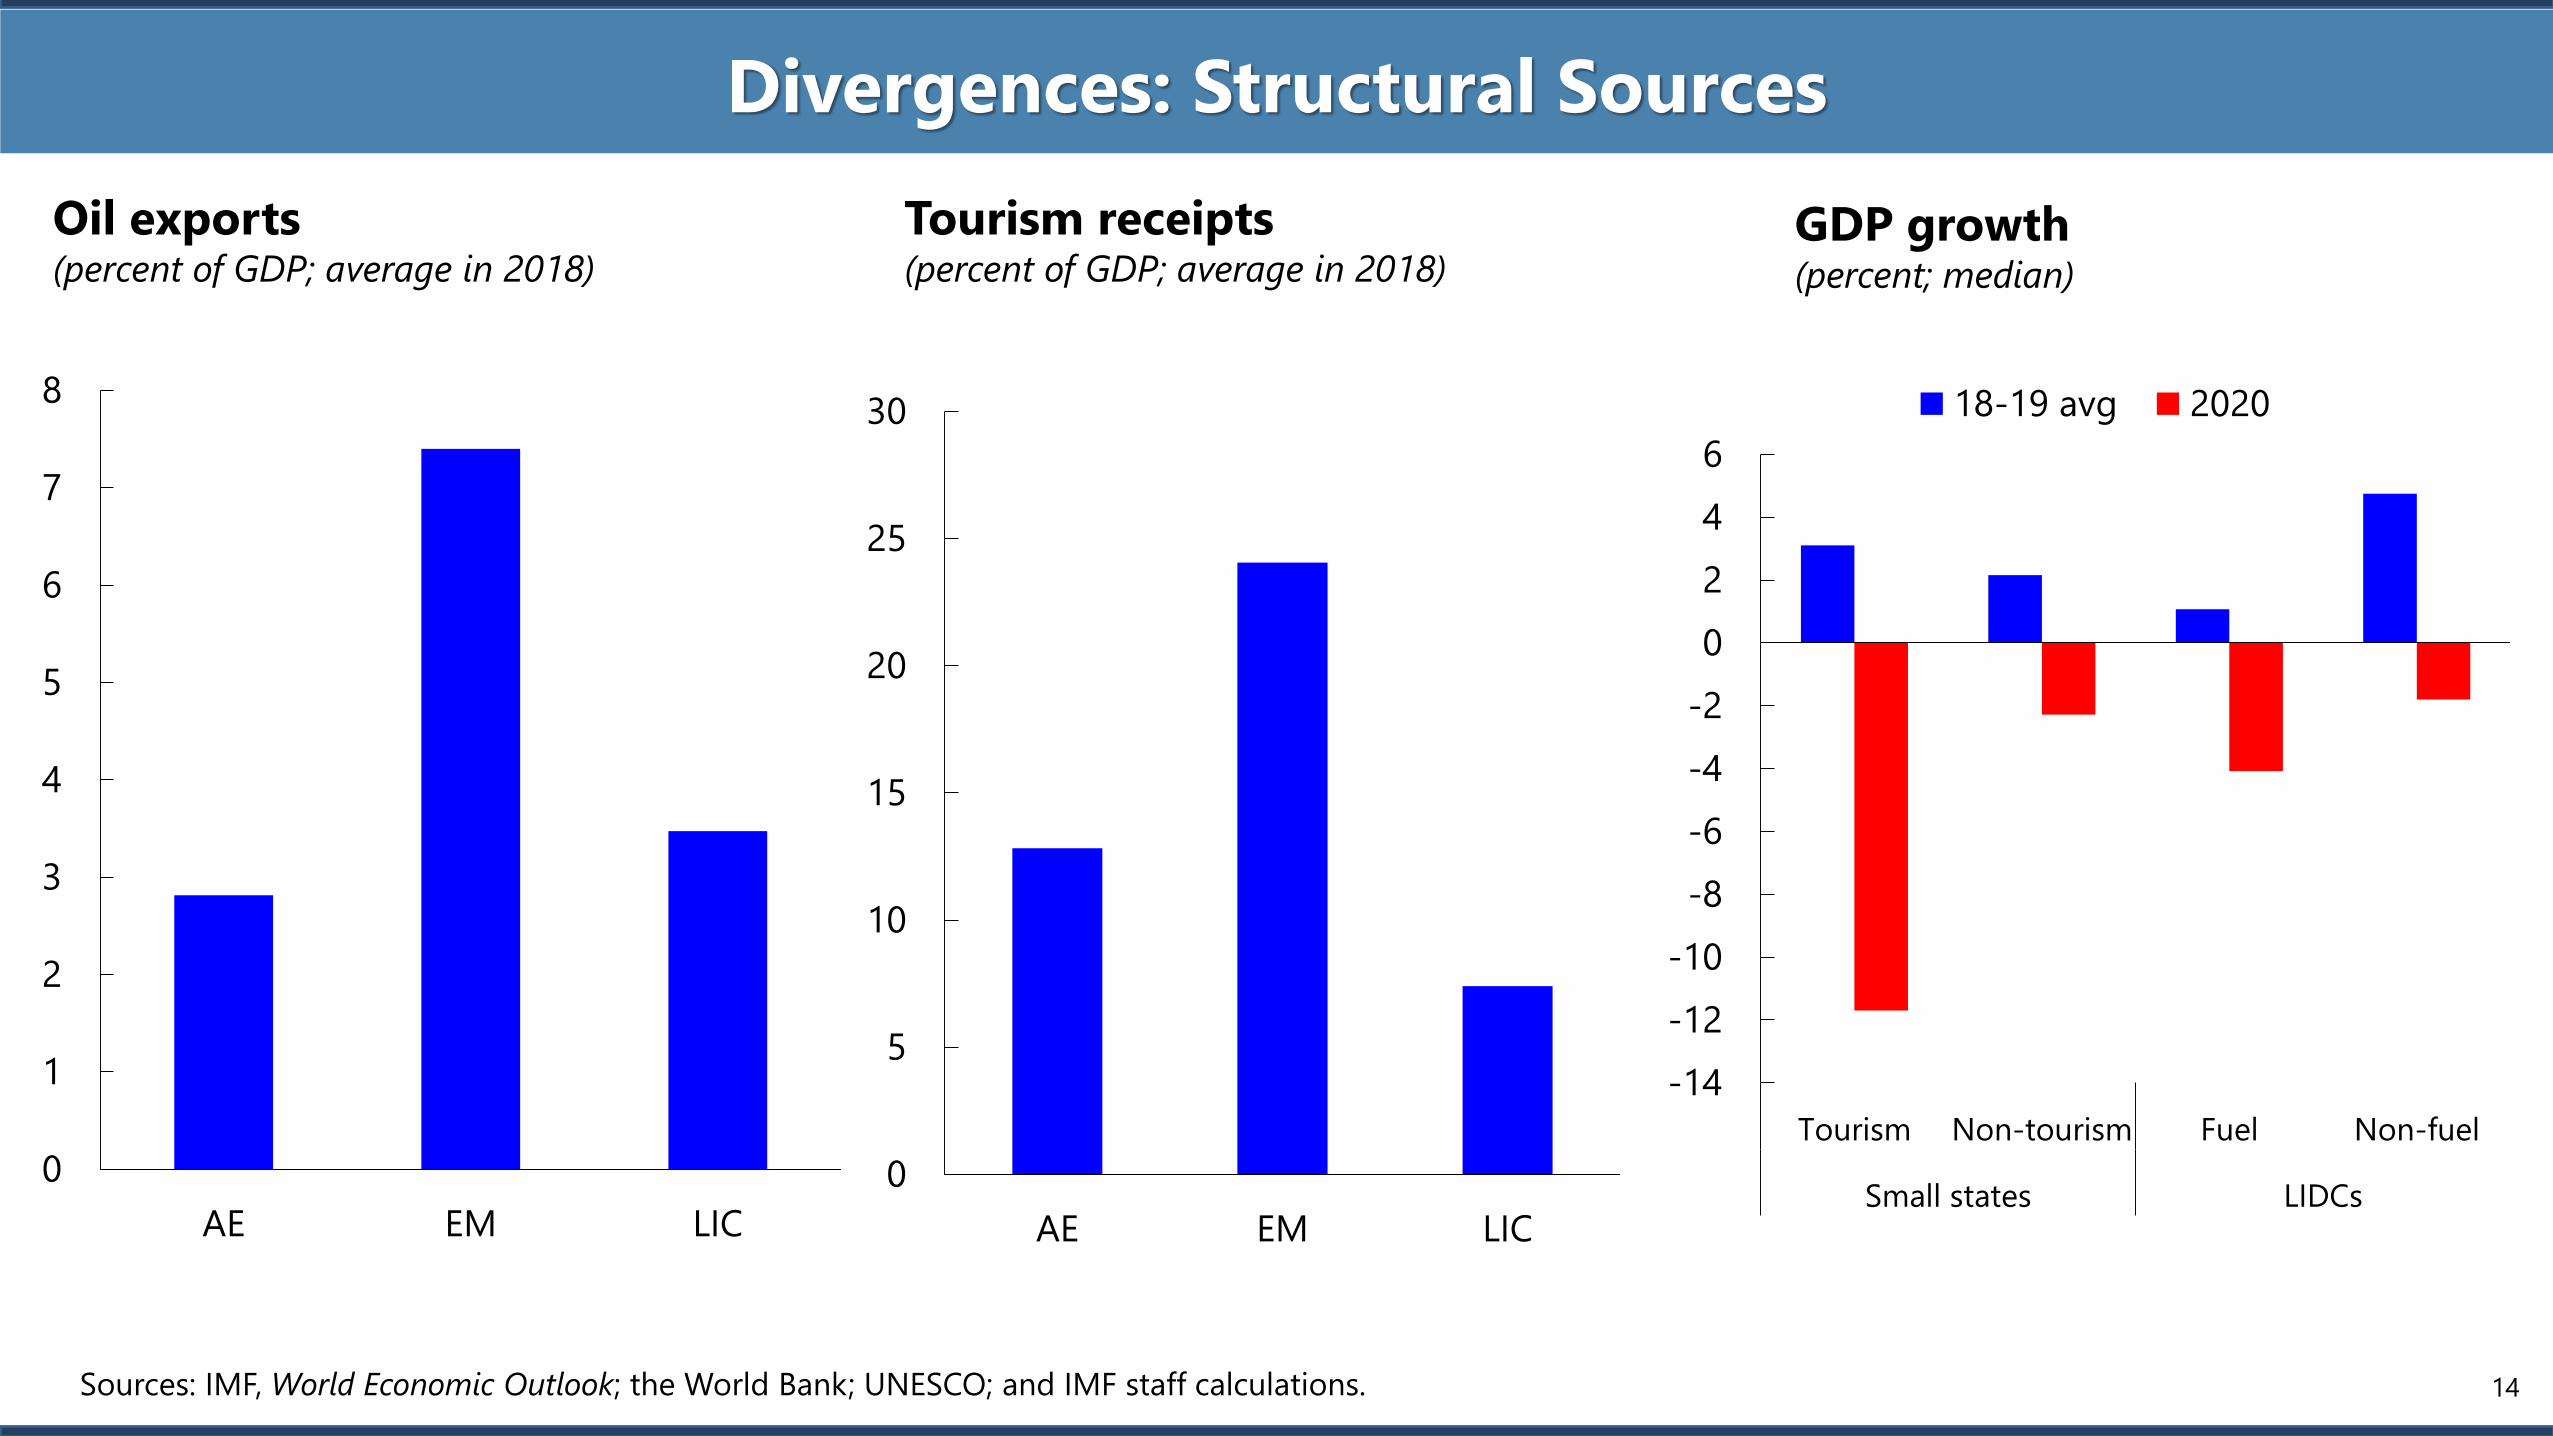
Divergences: Structural Sources
Sources: IMF, World Economic Outlook; the World Bank; UNESCO; and IMF staff calculations.
GDP growth(percent; median)
-14
-12
-10
-8
-6
-4
-2
0
2
4
6
Tourism Non-tourism Fuel Non-fuel
Small states LIDCs
18-19 avg 2020
Oil exports(percent of GDP; average in 2018)
Tourism receipts(percent of GDP; average in 2018)
0
1
2
3
4
5
6
7
8
AE EM LIC
0
5
10
15
20
25
30
AE EM LIC
14
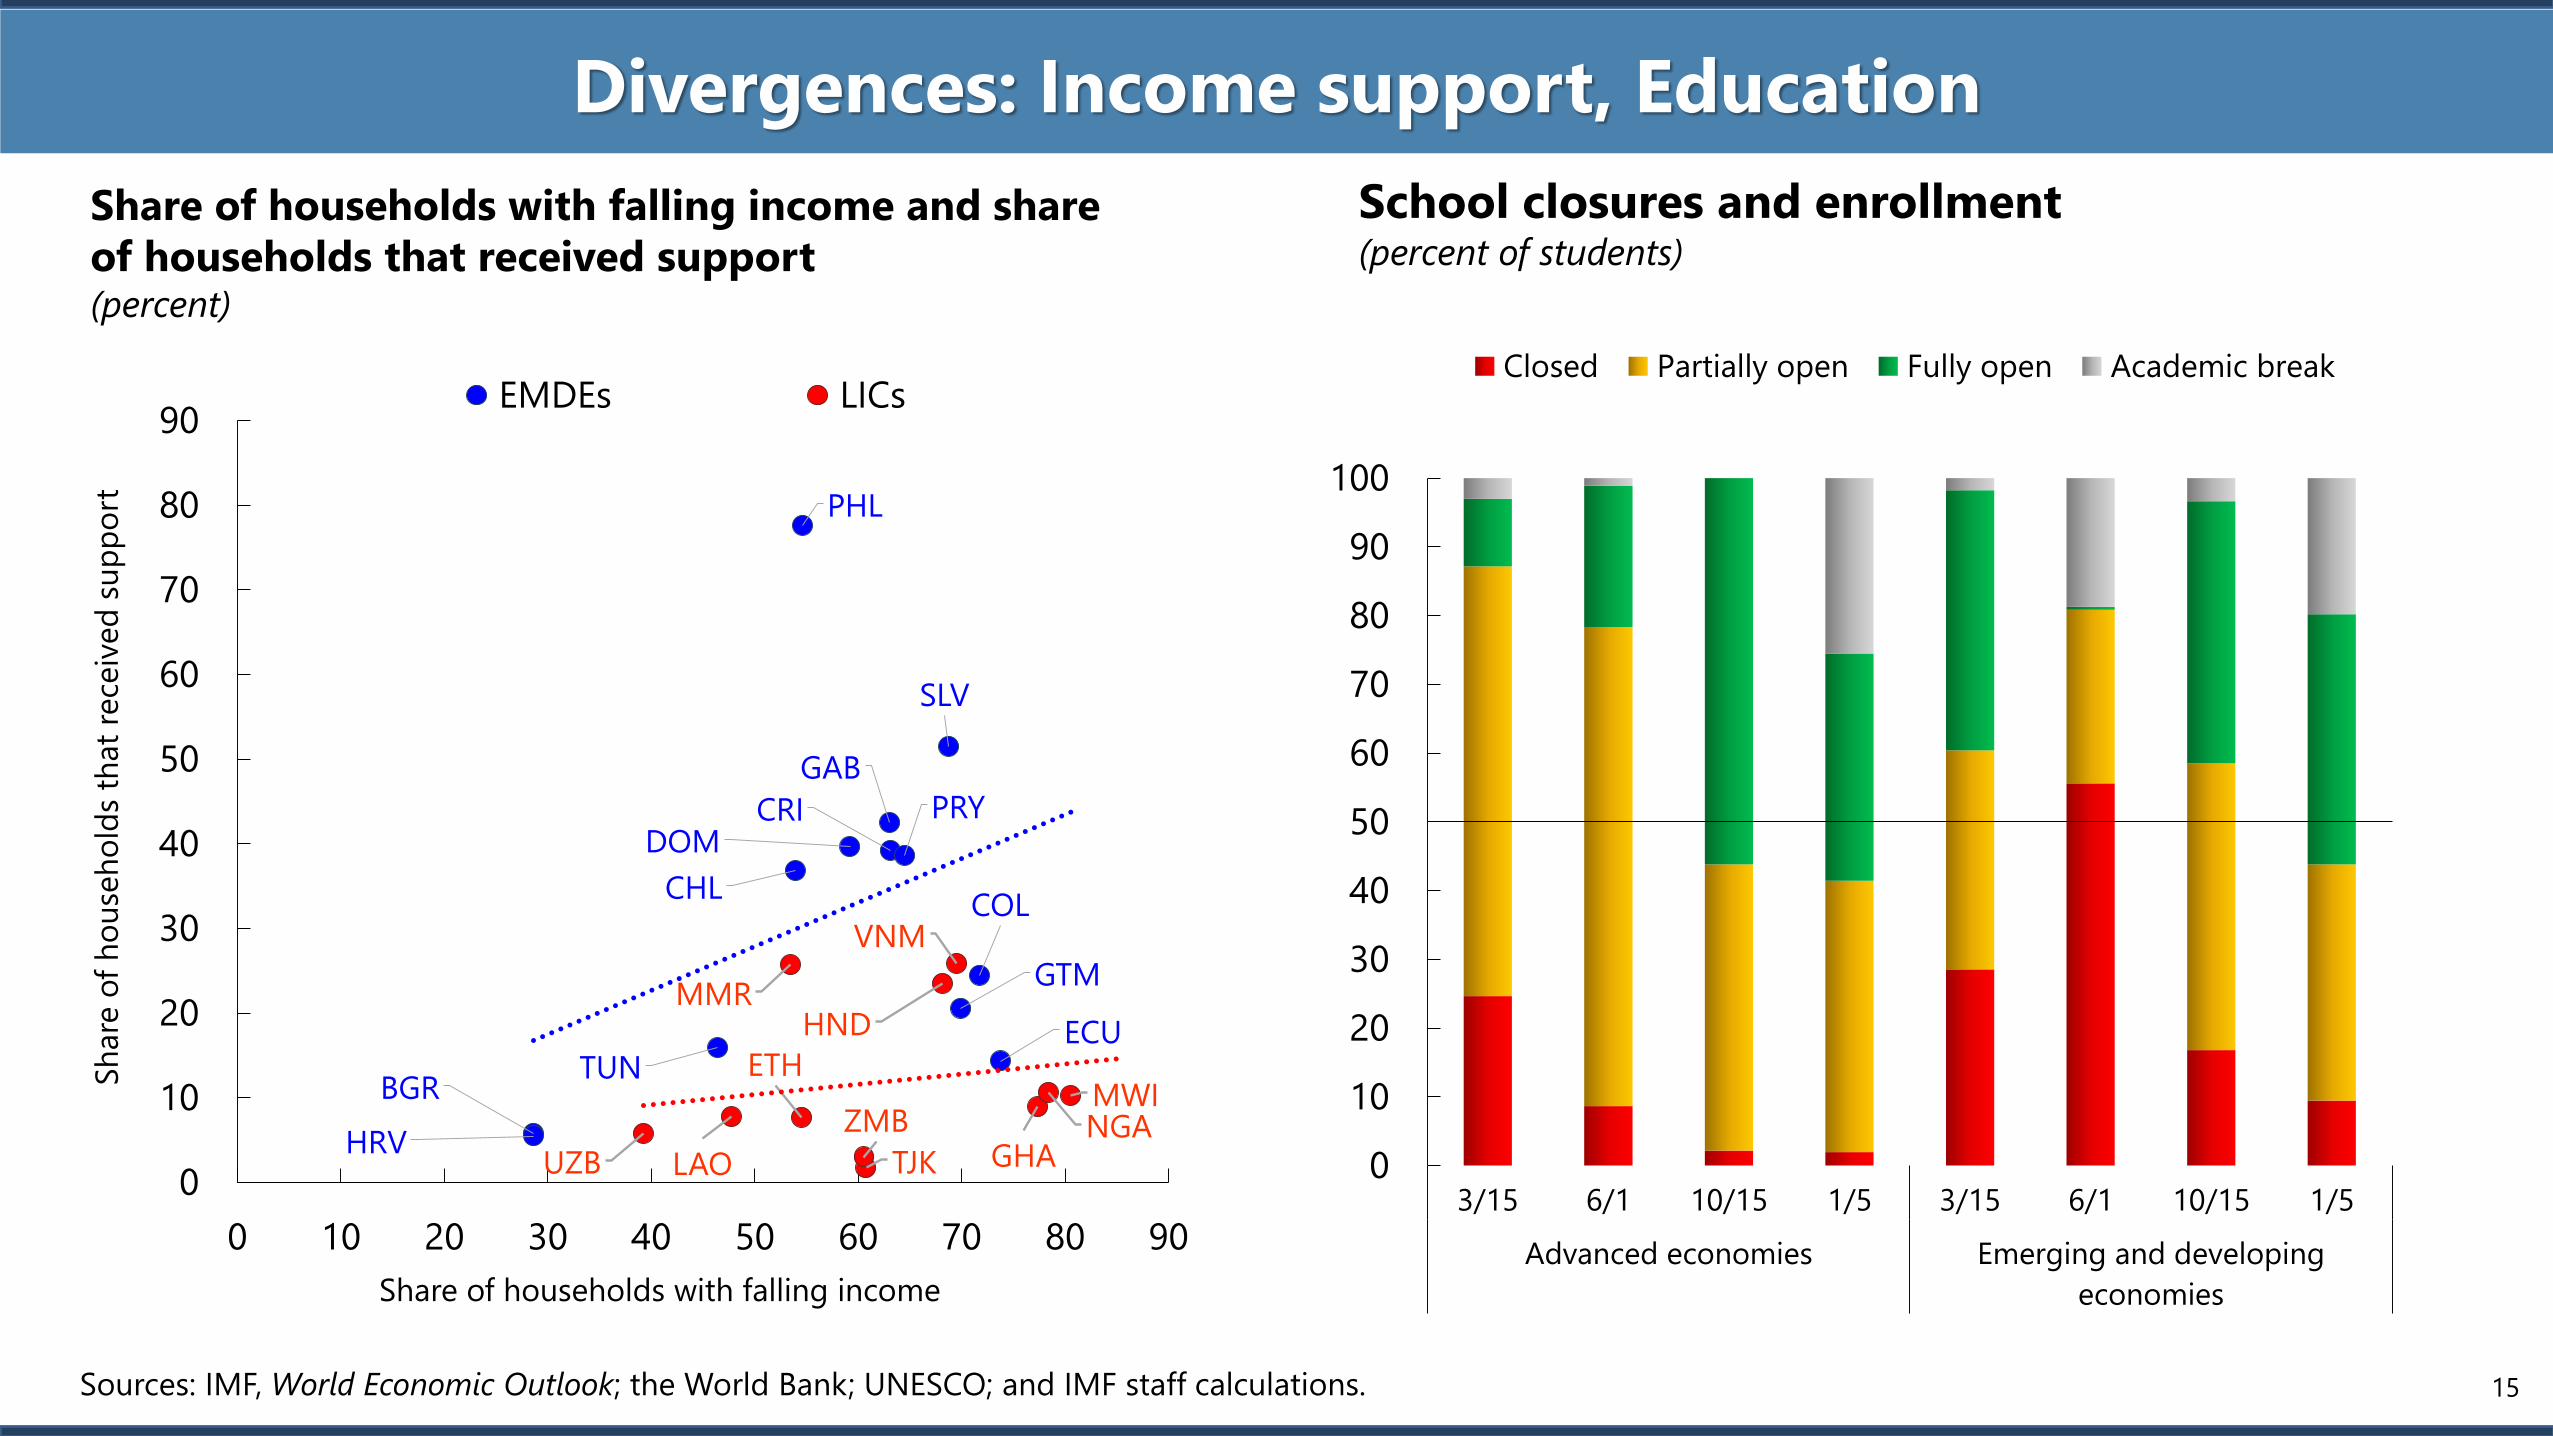
Divergences: Income support, Education
Sources: IMF, World Economic Outlook; the World Bank; UNESCO; and IMF staff calculations.
School closures and enrollment(percent of students)
0
10
20
30
40
50
60
70
80
90
100
3/15 6/1 10/15 1/5 3/15 6/1 10/15 1/5
Advanced economies Emerging and developing
economies
Closed Partially open Fully open Academic break
Share of households with falling income and share
of households that received support (percent)
BGR
CHLCOL
CRIDOM
ECU
GAB
GTM
HRV
PHL
PRY
SLV
TUN ETH
GHA
HND
LAO
MMR
MWINGA
TJKUZB
VNM
ZMB
0
10
20
30
40
50
60
70
80
90
0 10 20 30 40 50 60 70 80 90
Sh
are
of
ho
use
ho
lds
that
rece
ived
su
pp
ort
Share of households with falling income
EMDEs LICs
15
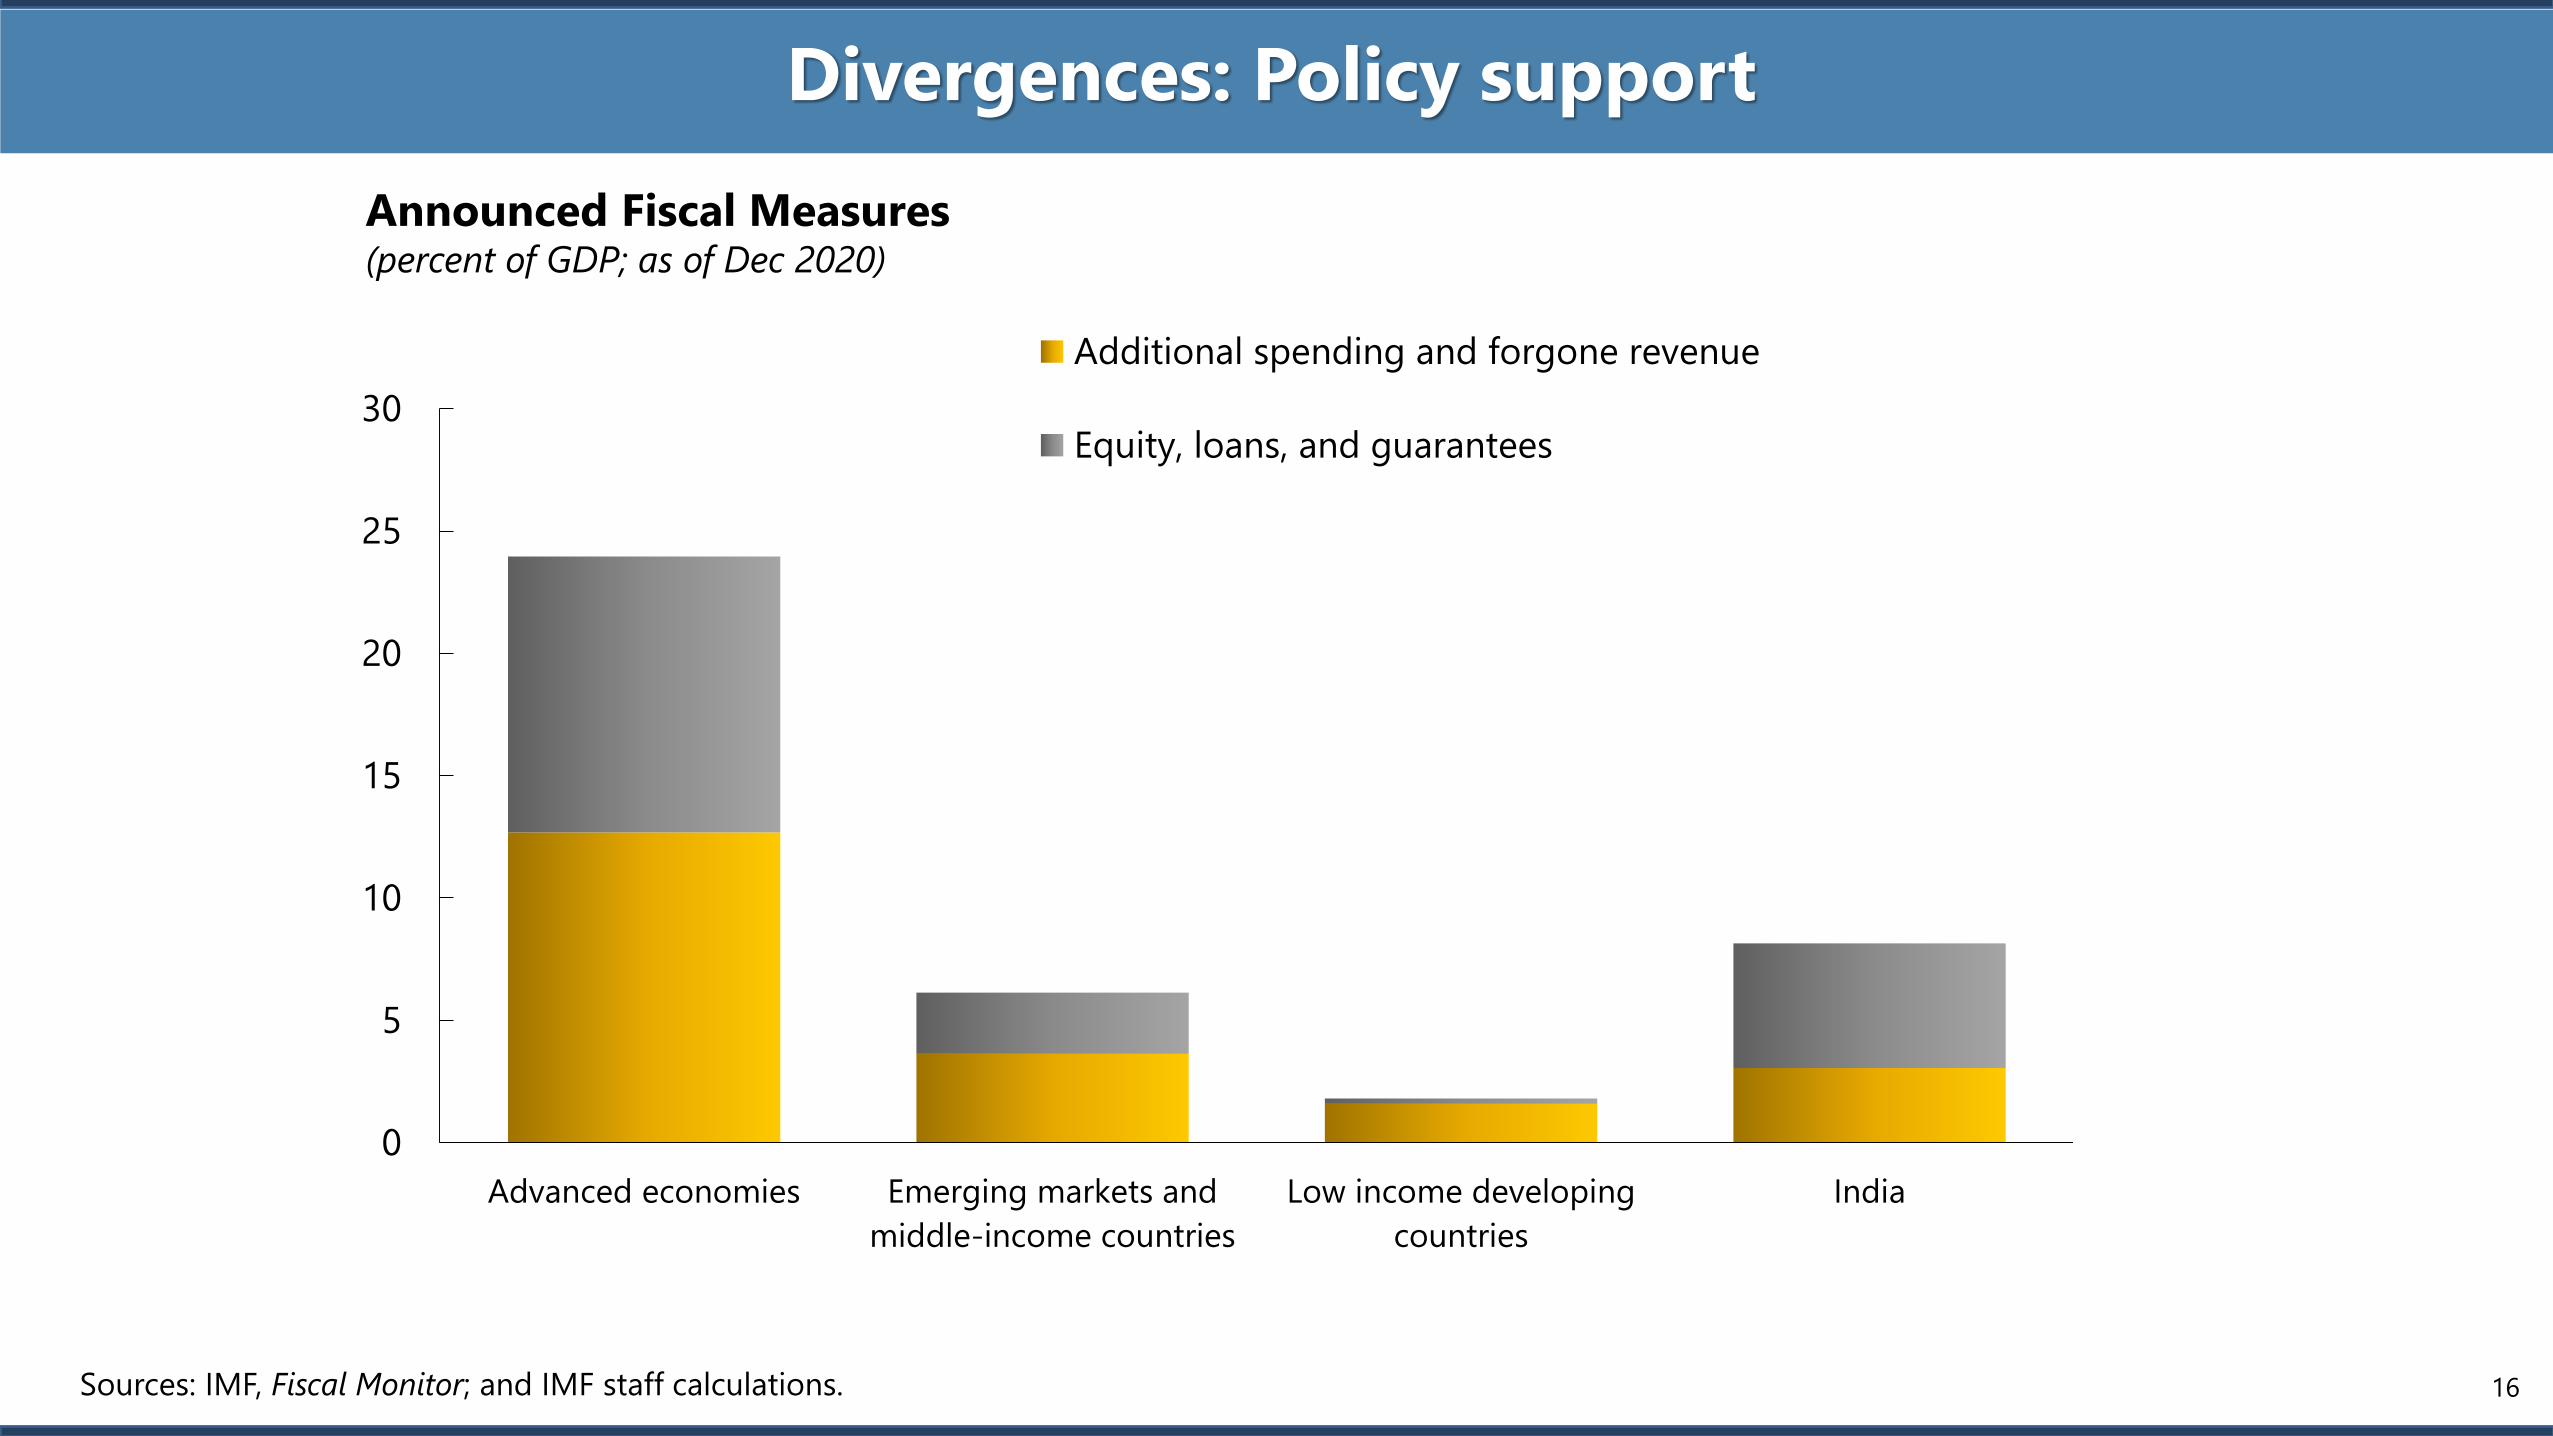
Divergences: Policy support
16
0
5
10
15
20
25
30
Advanced economies Emerging markets and
middle-income countries
Low income developing
countries
India
Additional spending and forgone revenue
Equity, loans, and guarantees
Announced Fiscal Measures(percent of GDP; as of Dec 2020)
Sources: IMF, Fiscal Monitor; and IMF staff calculations.
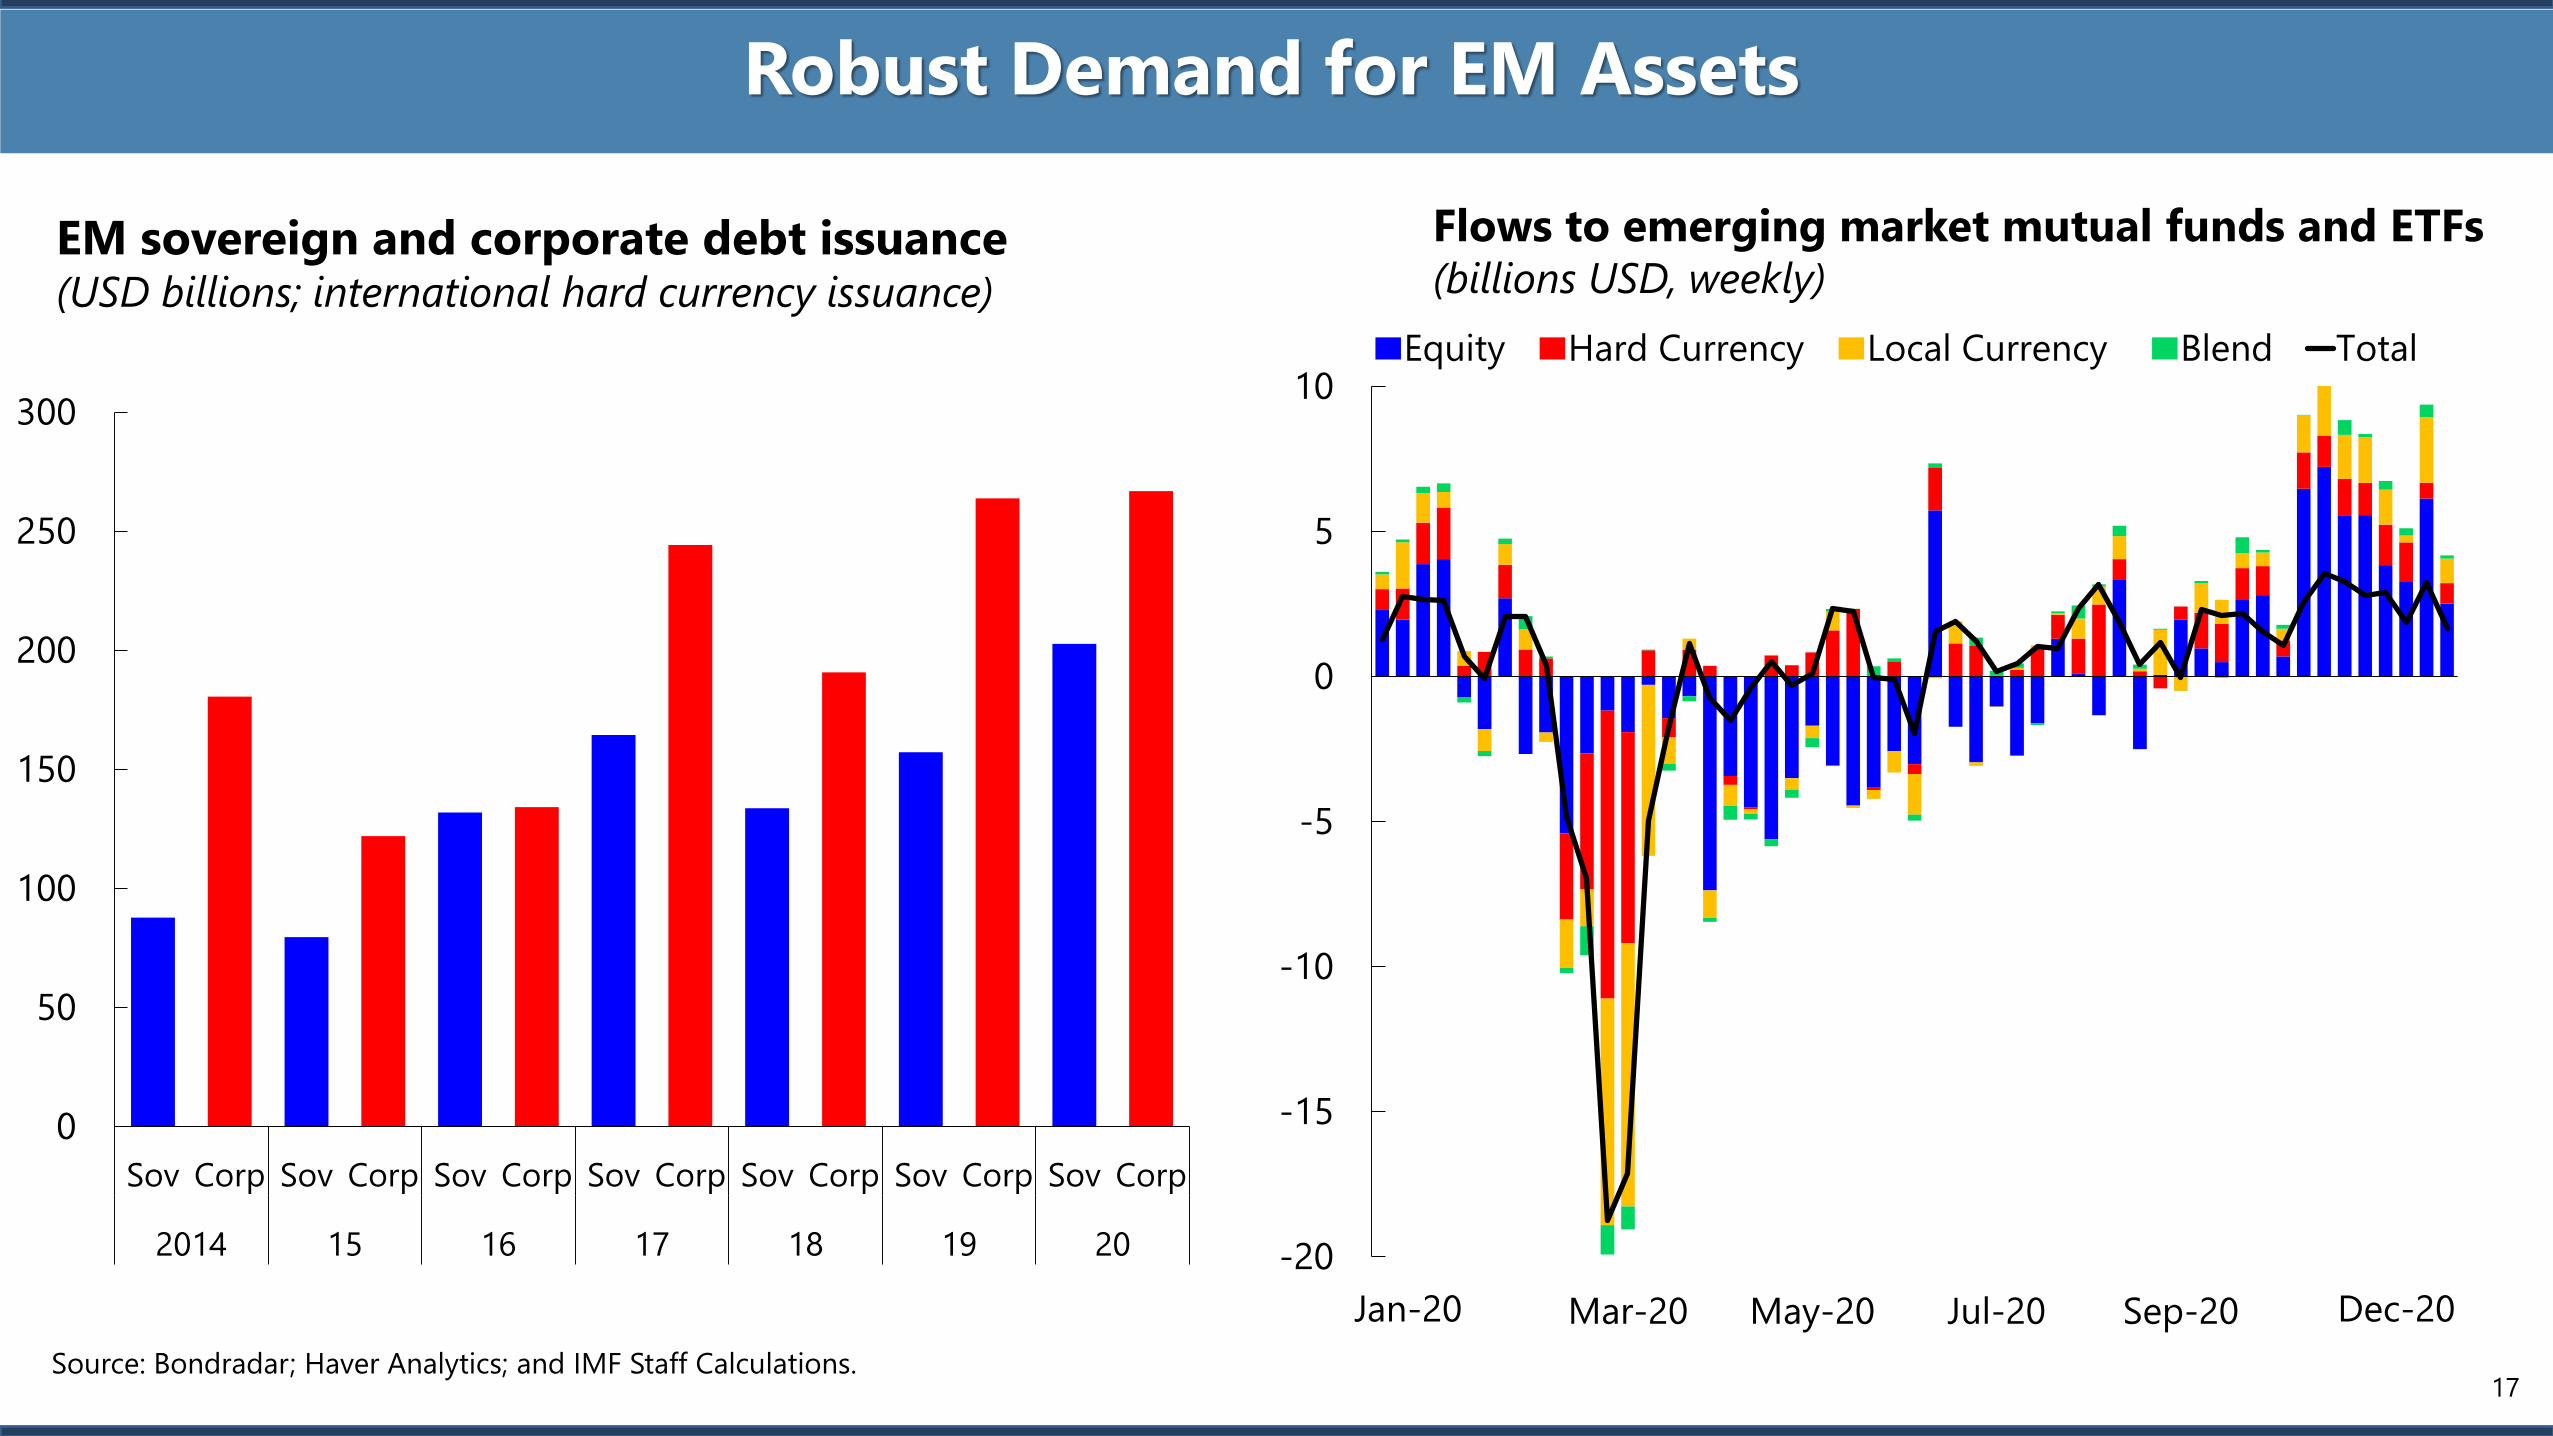
Robust Demand for EM Assets
EM sovereign and corporate debt issuance(USD billions; international hard currency issuance)
17
Flows to emerging market mutual funds and ETFs(billions USD, weekly)
0
50
100
150
200
250
300
Sov Corp Sov Corp Sov Corp Sov Corp Sov Corp Sov Corp Sov Corp
2014 15 16 17 18 19 20
Source: Bondradar; Haver Analytics; and IMF Staff Calculations.
-20
-15
-10
-5
0
5
10
Mar-20 May-20 Jul-20 Sep-20
Equity Hard Currency Local Currency Blend Total
Jan-20 Dec-20

Supportive Borrowing Conditions
18
India: Bond Yields and General Government Debt(yield in percent, general government debt in percent of GDP)
Source: IMF, Historical Public Debt Database; IMF, World Economic Outlook; JST Macro-History database; Maddison Database Project; Thomson Reuters Datastream, Global Financial Data;
Refinitiv, Reserve Bank of India; Ministry of Finance of the Government of India and IMF Staff Calculations.
0
2
4
6
8
10
12
14
0
20
40
60
80
100
120
140
1880
1890
1900
1910
1920
1930
1940
1950
1960
1970
1980
1990
2000
2010
2020
Advanced
Economies
Debt (% GDP,
LHS)
WWI WWIIGlobal
Financial
Crisis
Great
Lockdown
Advanced
Economies
Long-term
interest rate (%,
RHS)
Great
Depression
50
55
60
65
70
75
80
85
90
5
6
7
8
9
10
2000/0
1
2001/0
2
2002/0
3
2003/0
4
2004/0
5
2005/0
6
2006/0
7
2007/0
8
2008/0
9
2009/1
0
2010/1
1
2011/1
2
2012/1
3
2013/1
4
2014/1
5
2015/1
6
2016/1
7
2017/1
8
2018/1
9
2019/2
0 (
est
imate
)
2020/2
1 (
pro
ject
ion
)
10-Year Sovereign Yields General Government Debt (Right Scale)
Public debt and bond yields in historical perspective(yields in percent; public debt in percent of GDP)
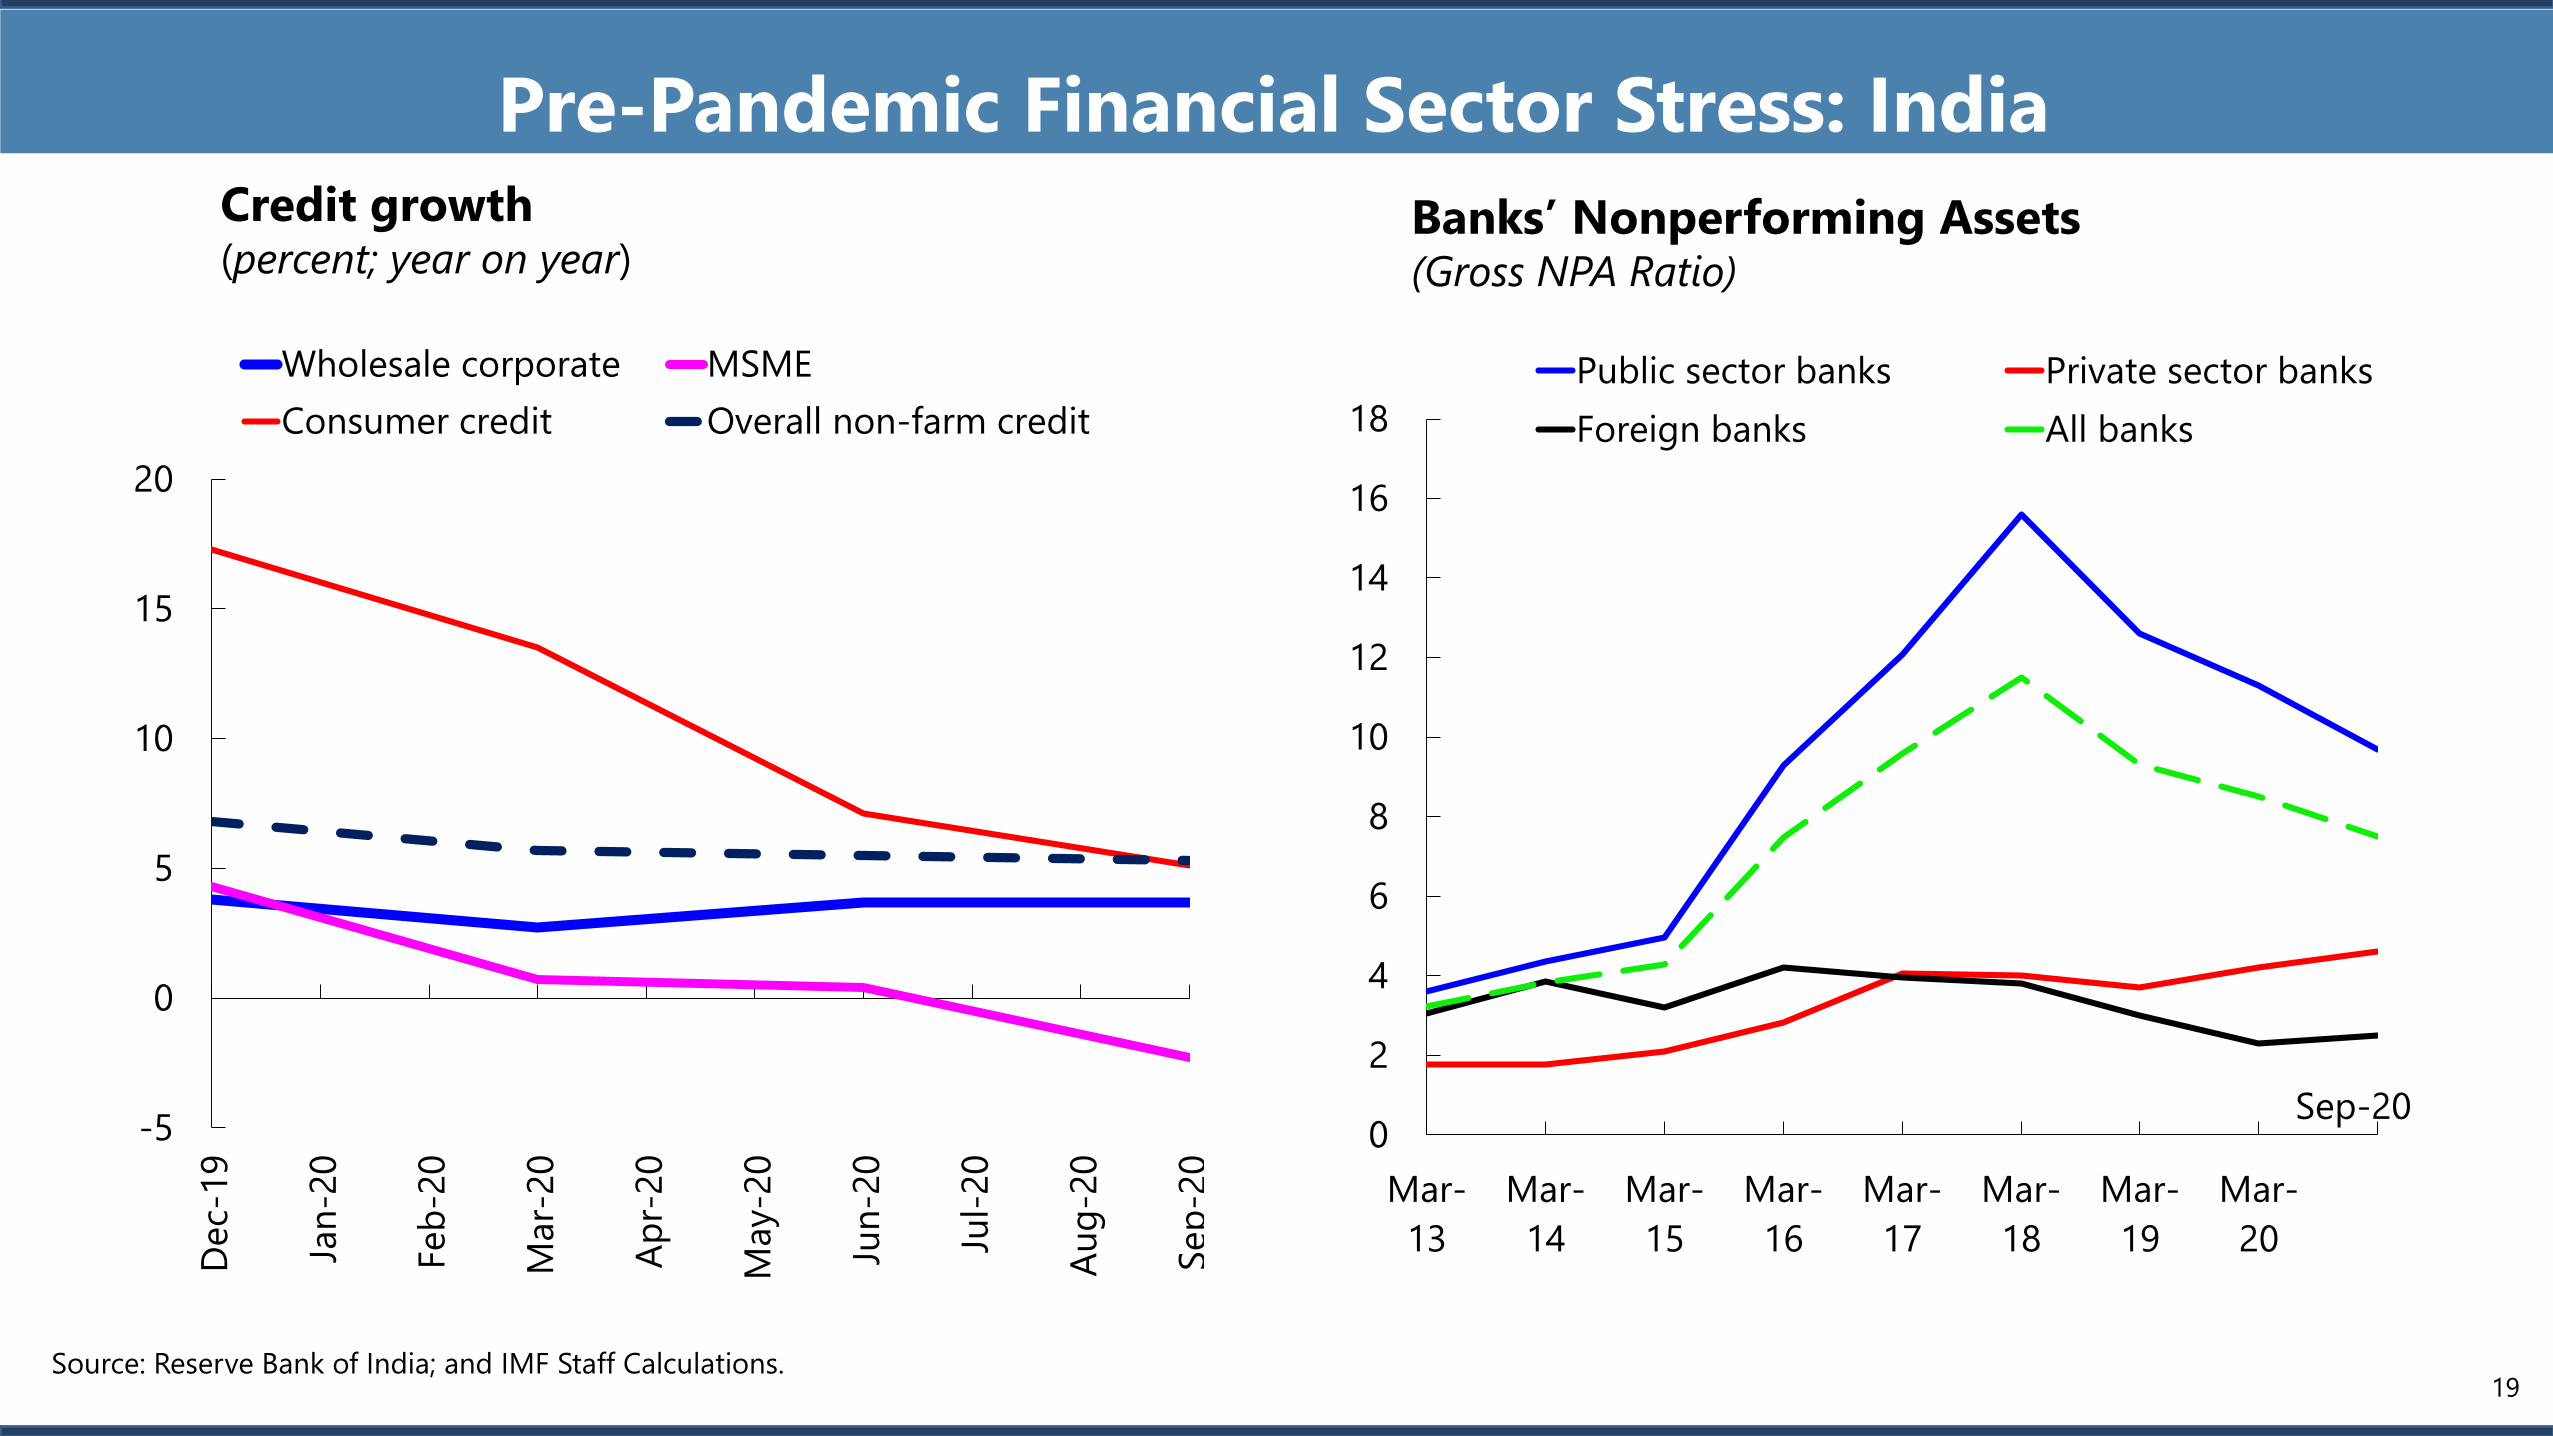
Pre-Pandemic Financial Sector Stress: India
-5
0
5
10
15
20
Dec-
19
Jan
-20
Feb
-20
Mar-
20
Ap
r-20
May-2
0
Jun
-20
Jul-
20
Au
g-2
0
Sep
-20
Wholesale corporate MSME
Consumer credit Overall non-farm credit
Credit growth(percent; year on year)
0
2
4
6
8
10
12
14
16
18
Mar-
13
Mar-
14
Mar-
15
Mar-
16
Mar-
17
Mar-
18
Mar-
19
Mar-
20
Public sector banks Private sector banks
Foreign banks All banks
Banks’ Nonperforming Assets(Gross NPA Ratio)
Sep-20
Source: Reserve Bank of India; and IMF Staff Calculations.19

Accelerate shift to more inclusive and sustainable growth
Global CO2 emissions(gigatons of CO2)
Sources: carbonmonitor.org; IMF, World Economic Outlook; IMF VE database; and IMF staff calculations.
1/ Other consists of compensatory transfers to households and avoided damages from climate change.
Impact on real GDP from
infrastructure investment(percent deviation from baseline)
0.0
0.5
1.0
1.5
2.0
2.5
3.0
20 21 22 23 24 25
G-20 AEs: Without spillovers
G-20 AEs: With spillovers
G-20 EMs: Without spillovers
G-20 EMs: With spillovers
Global: Without spillovers
Global: With spillovers
0
10
20
30
40
50
60
70
80
90
100
EM LIDC
High
Medium
EM and LIDC: Fiscal vulnerabilities(percent of total countries)
0
10
20
30
40
50
60
70
80
20 25 30 35 40 45 50
(1) Baseline
(2) 1 + Deviation from green infrastructure and subsidy
(3) 2 + Deviation from carbon pricing and other 1/
20