MPSA 2015 KnowBureaucracies Moscovich
1
Get to Know your Bureaucracies. Mapping Subnational Bureaucratic Bodies with
Evidence from Official Household Surveys.Argentina2003-2011
Lorena Moscovich
Universidad de San Andrés*
Work in progress and preliminary version. Please, do not quote without permission.
I would appreciate to hear your comments and suggestions
Paper prepared for the Midwest Political Science Association Annual Meeting
Chicago, April 15-18, 2015

MPSA 2015 KnowBureaucracies Moscovich
2
Introduction1
According to Cortazar Velarde, Lafuente and Sangines (2014) in 2012, on
average, 16 countries of Latin America have invested 5.8% of their GDP, around 40%
of tax revenues and 26% of public expenditure to pay salaries of bureaucrats.
Bureaucrats are crucial for state capacity; from national defense to policy success; from
the functioning of democratic process to property and citizen rights enforcement. The
characteristics and quality of bureaucratic human capital have a number of implications
for policy making, economic growth, democratic governance and citizens rights, among
others. However, beyond public policy analysis, bureaucracies do not seem to matter for
political scientists and comparative politics (Fukuyama 2012). Moreover we lack good
indicators of the characteristics and the quality of work that public servants perform
(Fukuyama 2013). Reliable indicators that allow us to classify bureaucratic bodies
across different political units and in time would help us to understand their influence
on the issues above mentioned.
Two simple claims structure this paper, the first one is that we can have a better
understanding of bureaucratic bodies if we know their characteristics. In other words if
we want to know more about bureaucracies we should ask bureaucrats to answer
questions such as what are your qualifications? How many hours do you work? Is this
your only job? Etc. The second is that we can use information from country statistics
with this aim. I see only advantages in complementing existing measures with
information from surveys made regularly by national statistics institutes using random
samples of bureaucrats and, such as household surveys. The data is available, standard,
public, free, official, and potentially useful for time series cross sectional comparisons
at national and subnational levels.
I propose a map of bureaucracies at the subnational level in, Argentina, a
federal country considering information available in the Permanent Household Survey
(Encuesta Permanente de Hogares) such as education, income, career, qualification,
permanence, the use of technology, hours worked, exclusivity, hierarchy and turnover.
1 I want to thank Ernesto Calvo for his insights and suggestions and to Federico Merke for comments
made on an earlier draft. This paper would not have been possible without the superb research assistance
of Marcos Salgado. Final results, omissions and/or errors are my sole responsibility.
MPSA 2015 KnowBureaucracies Moscovich
3
This set of variables allowed me to cover the main features of bureaucracies. Mapping
the distances between the bureaucratic bodies in the provinces in relation to these
variables, without an “a priory” or value attached to the performance of these variables,
allowed me to describe them and also to identify some outcomes not necessarily
suggested by the weberian (and hardly real -Migdal 2011-) ideal of autonomous
bureaucracies with well-paid qualified professionals that guarantee the quality of policy
making. Results show some interesting findings. For instance, that under some
circumstances, a stable and exclusive position does not always make bureaucrats
perform better in comparison with other bureaucratic bodies with a higher turnover rate.
This happens when stability and exclusivity do not come hand in hand with
qualifications. Another finding is that tenured positions do not always shape bureaucrats
expectations, as a result a tenured position can neither foster long term horizons nor
improve policy making, unless appointments are programmatic.
Scholars in the field of comparative politics, public policy and development
studies, also students of bureaucracy and administrative state capacity, should be able to
count on systematic data produced by national statistics institutes, to use as a unique
source or combined with other measures of bureaucratic quality. In sum I suggest the
need of public official data to use as reliable indicators of bureaucracies. To do this I
first review some of the most important sources of indicators for bureaucratic quality
and I give an example of one of the multiple possible uses of this data.
What is Good Bureaucracy Good for?
The combination of coercion and consensus has been acknowledged as the
Weberian formula for successful legitimate domination. The third part of this formula is
administration. Weber‟s (1995) seminal analyses of bureaucracies sometimes are taken
in isolation and not connected with his studies on political legitimacy. Bureaucracies are
at the core of the studies on political order. Bureaucracies are the kind of administrative
bodies which accompany modern states and they are necessary for legitimate
democratic governments to reach all their citizens and social relations within their
territory. As Weber suggests, while politicians give the strategic direction and content to

MPSA 2015 KnowBureaucracies Moscovich
4
policy making, bureaucrats ideally apply the best tools to help them achieve expected
results. Already in Weber‟s time, bureaucracies also affected public policy priorities.
Thus bureaucracies have always mattered for democracies, state capacity, policymaking
and political order.
Scholars on state capacity acknowledge the important role of bureaucracies
(Hendrix 2010). Bureaucratic capacity is one of the central components of
administrative state capacity (Back and Hadenius 2008, Soifer and Vom Haw 2008),
and of its institutional strength (Kurtz 2013, Levitsky and Murillo 2009).1 Authors like
Charron and Lapuente (2010) use the level of corruption and bureaucratic quality to
assess the performance of state capacity in both democratic and authoritarian regimes.
Knutsen, (in Cingolani 2013) links regime type and state capacity to growth; he studied
state capacity through policy implementation and bureaucratic professionalism.
For Evans (1995) professional bureaucracies are a precondition for a
developmental state. Their features are directly linked to economic growth (Olson et. al.
2000) and markets (Wibbels 2005). A meritocratic, well paid and stable bureaucracy
will be less prone to corruption and will have more incentives to provide state
infrastructure (En Bai and Jin Wei 2000). As a result, a country with such bureaucracy
will be preferred for investments and this country will be more likely to grow and
develop (Evans and Rauch 1999). Rothstein (2005) stresses that social trust is fostered
by good bureaucracies. When bureaucracies deliver policies on programmatic, public
and universal basis, citizens understand that discretion is low. It increases their trust in
government because they think they are more likely to have fair and equal opportunities.
Bureaucracies are important for policy success (Berkman et al 2008), from the
control of specific knowledge and the implementation of central government directions
(Agranoff 2001), to the daily contact in the delivery of goods and services needed to
reach citizens (Honig 2006). When bureaucracies fail, within the same political regime,
variations in bureaucratic performance may result in the asymmetric rule of law and the
uneven enforcement of citizen‟s rights (O‟Donnell 2007, Smulovitz 2010), civil
conflicts or even wars (Hendrix 2010). Professional bureaucracies last longer than
governments and are the safeguard of programmatic politics. This is due to the status of
bureaucrats‟ appointment and their management of specific knowledge. It is not the case

MPSA 2015 KnowBureaucracies Moscovich
5
when patrimonialism rules and bureaucrats access positions through political or
personal favors (Mazzuca 2012).2
We know, like Migdal (2011) suggests, that there are no handbook states in
which bureaucracies have clear limits in society. He stresses the fuzzy borders between
state and society. Ideal bureaucracies do not exist, and when scholars only focus on their
Weberian features it hampers their capacity to understand the conflicting interactions
within government agencies (Arnold 1989) and between state and society actors. In fact
bureaucrats can hinge on society and also on politicians (and legislatures). For Sikkin
and Wolfson (1993) the autonomy from society was a precondition which allowed
Brazil to develop a more professional bureaucracy than Argentina.3Geddes (1996) also
stresses that bureaucratic autonomy is needed for policy success. On the other hand,
bureaucrats depend on politicians appointments and budget approval. However
politicians and bureaucrats can have conflicting interests. The same knowledge
supposed to be a distinctive quality of bureaucracy can results in an undesirable
autonomy when it is used in their favor. They may give government selective
information or ignore its instructions. Politicians give money and directions to
bureaucrats, but they actually lack information about the results of policies and depend
on their expertise (Bendor et. al. 1985).
Main Indicators Used for the Study of Bureaucracy
Researchers on bureaucracy sometimes use their own measures of bureaucratic
quality (some of them build databases), others use indicators from risk agencies,
foundations or international organizations, and a last group of scholars combines
different measures. As you will soon notice, sources on bureaucratic quality are usually
part of broader measures for different aims. These sources usually rely on more or less
standard surveys applied to non-randomized samples of experts (usually a few per
country). To avoid the potential bias implied by these sources, others gather very
different data (i.e. World Bank) and develop specific controls (i.e. Bertelsmann
2 For Gailmard and Patty (2007) there is a situation in which selective incentives distributed discretionally
by legislatures to bureaucrats can explain the choices to increase their expertise. 3 For a more recent comparison between Argentine and Brazilian bureaucracies see Souza 2015.

MPSA 2015 KnowBureaucracies Moscovich
6
Stiftung's Transformation Index), while others use a variety of indirect indicators, such
as corruption, (Bai and Wei 2000, Dalsthröm and Lapuente 2012, Albornoz and Cabrera
2013) or the politicization of removal of central bank governors (Cingolani et al 2013).
A number of studies gather, comment on and use indicators of bureaucratic
quality (or at least include some of them). Institutional performance, measured trough
bureaucracies, corruption, policy performance or public sector management, is one of
the indicators of good governance included in some of the 52 measures reviewed by the
UNDP (2007). Berkman and her colleagues (2008) did extensive research, gathering
and reorganizing information of different sources to explore the conditions of success of
policy making processes, policy enforcement and implementation. They developed a
number of dimensions; one is the institutional dimension within which they create a
bureaucracy index made of a combination of selected questions from the
Columbia University State Capacity Survey and data from the Political Risk Service
Index.
Hanson and Sigman (2013) use 24 different sources of indicators on state
capacity. They work with data reduction and Bayesian techniques (so do Bersch et al
2013).They also explore the administrative dimension of state capacity understood in
terms of policy success and the quality of bureaucracy.4Cingolani (2013) wrote one of
the most complete literature reviews on state capacity with its different definitions and
operationalization. Also Cingolani reviews the most common issues with which it has
been analyzed, such as development, autonomy from society, etc. Hendrix (2010) also
uses 15 different operationalizations of state capacity (some of them gathered in the
administrative capacity of the state) and introduces a test of dimensionality using factor
analysis.
Van de Walle (2006) focuses on how bureaucratic quality has been addressed by
governance indicators. His study reveals that there are no indicators for bureaucratic
quality in all policy areas for most countries (particularly for OECD countries) since
cross country studies tend to focus on just one policy area. On the other hand he
critically describes main features and uses of the European Central Bank‟s working
paper „„Public Sector Efficiency: An International Comparison‟‟(2003), the World
4 Like Soifer (2013) they use the frequency of Census as proxy for the state capacity. Bersch, Praca and
Taylor (2013) use census data from the International Programs Center of the U.S. Census Bureau

MPSA 2015 KnowBureaucracies Moscovich
7
Bank‟s „„Government Effectiveness‟‟ indicator, the „„Public Institutions Index‟‟, part of
the World Economic Forum‟s Growth Competitiveness Index, and the International
Institute for Management Development‟s (IMD‟s) World Competitiveness Yearbook‟s
„„Government Efficiency Ranking‟‟ (Van de Walle 2006). He also considers the
measures used by each document, such us the chapter of bureaucracies of the
International country Risk guide of the Political Risk Services or the Transparency
International Corruption Perceptions Index".
Although mainly used for the development studies, aid agencies and investment
decisions, Van de Walle states that the use of indicators for bureaucratic quality for
academic and public policy research, comparative politics, and public policy decisions
has been limited. Reasons underlying this limitation are: lack of specific data on
bureaucracy5, the subjective nature of the sources,
6doubts regarding sampling design
and the selection of sources, confusion regarding the validity of these indicators in
relation to what they study, and the normative implications of the definitions of the
quality of bureaucracy used. .
Many studies review and classify existing indicators used to describe and
measure bureaucratic capacity and its applications for different aims. These studies also
underscore some of their limitations. Alternative measures could complement and
enhance the explanatory power of existing indicators. Following I summarize some of
the advantages that come with the use of different sources, particularly official sources,
and with the use of more simple and parsimonious measures for the assessment of
bureaucracies.
Why yet another Indicator of Bureaucratic Quality?
5 Remember that these indicators are a subset of broader measures of something else, like governance,
state capacity, good government, etc. 6 The five different sources of measures on bureaucratic capacity reviewed by Savoia and Sen (2012) are
also based on expert surveys. It is worth noticing that one of them also gathers standardized data and it is
not intertwined with subjective measures. Fukuyama (2012) suggests that the “Quality of Government
Dataset” initiative (http://qog.pol.gu.se/data) conducted by professor Bo Rothstein from the University of
Gothenburg has promising perspectives in order to overcome some problems of existing measures.

MPSA 2015 KnowBureaucracies Moscovich
8
I suggest that measures of bureaucracy are indirectly and partially useful in
comparative politics. Main existing indicators of bureaucracies are part of broader
measures, such as governance, state capacity, institutional quality or investment risks,
are based on subjective sources (such as expert surveys that are neither random nor
representative). To solve this potential source of bias, other measures combine or use
different indexes and/or kinds of information. As a result their complexity impedes
understanding what exactly they describe. Sometimes measures do not cover all
countries or years7, and a few are made at a subnational level. Overall, most depend on
particular databases, from research projects and are only updated while the project lasts.
Other databases belong to risk agencies, sometimes unaffordable for researchers and
institutions from developing countries.8
An indicator to describe bureaucracies that can be used as a tool to assess their
influence should meet some conventional requirements for measures in social research:
- Non biased. The indicator or measure must accurately describe the features of existent
bureaucratic bodies. It must have a proper, randomized, large enough N, representative
sample of bureaucrats. This sample seems to be a better source than, or at least a good
companion for, expert surveys.
- Parsimonious. In the way that variables represent relevant features of bureaucratic
quality, such as education, appointment, hierarchy, but at the same time the resulting
indicators are transparent and understandable.
- Comparable. Apart from official data, household surveys of national statistics
institutes are usually standard and (with some limitations) comparable across districts
(at national and subnational level), also many are permanent increasing the temporal
scope of comparisons thanks to the use of longer time series of information. .
- Available. Public and accessible information allows both its use and replication. Of
course the quality of national statistics is diverse and also varies with time, but it is
more likely to be available for researchers. A good measure should not have to depend
on databases not only many of them of subjective nature, but also that do not always
7 As a result some researchers try to replicate these measures for their countries (see Souza 2015)
8 Last footnote applies

MPSA 2015 KnowBureaucracies Moscovich
9
cover all countries, are not updated, or are expensive National statistics are usually
available, sometimes on request, free of charge (or cheaper).
Surveys and interviews are powerful tools to assess characteristics of
bureaucracies by qualitative means. Expert surveys account for opinions and
interpretations not facts.9 Expert interviews are better interpreted using qualitative
means. Qualitative approaches can contextualize testimonies giving them meaning;
allowing us to know experts‟ reasons or conclusions, and also their particular interest or
position in relation to the topic involved.10
For instance, in some countries experts from
certain universities can support the government or be in the opposition. This is not a
minor problem in the context in which political polarization deeply divides academia.11
When standardized questionnaires are used instead of surveys for cross-country
comparison, indicators may gain reliability because the reply coding is homogeneous.
However researchers who design these questionnaires can omit unknown aspects from
bureaucracies, such as informal practices which vary from country to country. Experts
surveys of any kind barely capture some practices at the local level in which bureaucrats
are hired and work, of course it would be impossible for them to be familiarized with
day to day work and the already mentioned very important informal practices,
particularly in developing countries. Of course if we ask bureaucrats instead of experts
these previously unknown aspects are more likely to become evident.12
This leads to the
last concern; even the best measures and more complete databases mostly have
information at the national level. In highly decentralized countries, such as Argentina,
subnational bureaucracies matter a lot for policy success and enforcement of citizens‟
9 This is such a basic problem of social sciences, we, researchers, work with subjects that have already
understood their world. In this way, as Giddens (1998) suggests, ours is a double hermeneutic. We try to
understand a reality that was already understood. This is not only the big difference between social and
natural sciences, but also a limitation to the scope of our conclusions. Because people also learn from
experience and can change their actions and meanings assigned to their experiences. Moreover they can
read our studies and perform in different ways. In this sense using only expert surveys result in trying to
build scientific knowledge from a reality previously understood by subjects, then understood by experts.
Drawing new conclusions only from expert sources is like working at this third level of understanding,
one level away from facts and reality. 10
Another option is to study state and bureaucracy using a comparative historical path dependence
approach (Arnold 1989). However when one wants to move to the comparative field, the use of these
approaches (and also quantitative ones for one paper or case) is limited.
11 Try to interpret standardized anonymous surveys in countries such as Venezuela and do not fail in the
attempt. 12
For instance, in my analysis I use objective and subjective data on bureaucratic stability whose results
are contradictory. Employees fear losing their jobs, this allows me to infer the uses of informal and
clientelistic appointments which make bureaucrats feel their positions are precarious even in provinces
with lower levels of turnover.

MPSA 2015 KnowBureaucracies Moscovich
10
rights. Aggregating expert opinions and transforming them into data as if they were
facts can be a source of bias.
Of course this problem is widely acknowledged and some indexes develop
safeguards to avoid potential biases. One is to combine different standard surveys and
conduct interviews to control results (Rauch and Evans 2000). The other possible
solution is adding information to the expert surveys, such as the Quality of Government
Data Set and the Worldwide Governance Indicators (Kaufmann et al 2007) do. The
latter multiplies the indexes in order to reduce this danger, also they are transparent with
their sources, procedures and possible errors. Also the “dark side” of this strategy is that
the many kinds of data disconnect sources from the substantive contents of the variables
Van de Walle (2006) wonders what the aggregation of 31 different indicators actually
tells us ? What they measure is not clear.
Longer time series is another way to reduce errors, sources like the ICRG have
generated data monthly for a large number of countries since the 50‟s. However there
are normative concerns regarding the concept of bureaucratic quality implied in
investments risk evaluation. From this point of view, bureaucratic quality assesses the
bureaucrats ability to be isolated from political turbulence. Is this independence
desirable? Independent from politicians and dependent on business interests? Does it
give bureaucracies too much autonomy from their principals (legislatures or citizens)?
When bureaucrats manage expert knowledge in their fields they can use this asymmetry
in their own interest. A discussion must be given on the normative and practical
implications of some definitions of bureaucratic quality. Otherwise the result could be
giving bureaucracy more power than we should expect in democratic settings. These
questions remain open.
Even when we conclude that although not perfect, these indicators are the best
available they may have other problems. First as long as in order to gain accuracy,
measures became more complex , and researchers totally depend on the institutions that
develop and update them. Some of these measures are public, but others like the
belonging to risk agencies are expensive, limiting their access for independent
researchers or those from developing countries. Moreover when projects for some
reasons finish so do the updates and sometimes the availability of the information.13
I
13
Such as the IRIS project of Maryland University

MPSA 2015 KnowBureaucracies Moscovich
11
suggest that we can have a better understanding of bureaucratic bodies if we learn their
characteristics by asking bureaucrats. The use of permanent and standardized household
surveys as source of information can both give an alternative indicator to know public
servants, likely, to be replicated and also become a complementary source to control the
validity of existent measures.
How could Official Statistics Improve our Understanding of Bureaucracies?
National statistics are far from perfect and objective sources of information. It is
known that some national statistics institutes for different reasons do not meet basic
quality standards. However most do and the standard and public information they
provide, can help us to improve our understanding of different groups and elites.14
So
far it seems that specialists in national statistics and political scientists live in a parallel
universe (Leuprecht and Goldstone 2013).15
For instance, Rodrigues-Silveira (2014)
highlights the usefulness of census, statistics and more generally a demographic
approach to explore changes in municipal local elites in Brazil.16
Bersch, Praca and
Taylor (2013) also use official information from the Brazilian federal state from a
variety of sources to study the autonomy and capacity of bureaucracies. The databases
they use contain public information on federal officials, updated regularly. However,
their work is based on a variety of sources difficult (but not impossible, of course) to be
replicated or comparable, particularly at the subnational level where the information is
more diverse. Again national standard surveys would help us to overcome this problem.
Food aid programs, public health accounts, migrations, researchers in different
fields, stress the need and validity of national permanent household surveys in order to
produce reliable data. For instance, since no global data exists on middle classes,
14
Domicilary surveys have many kind of errors, field, coding, sampling errors, but we do not expect
respondents to be biased in their replies, such as not giving accurate information regarding their years of
schooling or hours worked. Expert surveys can be systematically biased in a politically polarized country
or when respondent has a personal or private interest in the survey‟s results. 15
Although Leuprecht and Goldstone (2013) focus on political demography, understood as “the study of
the size, composition, and distribution of population in relation to both government and politics” (online,
no page number given) this claim also applies to the use of different systematic sources of information
produced by demographers and national statistics centers, like permanent household surveys. 16
National statistics themselves relate to state capacity, its success is a proxy for the reach of the state
(Soifer 2013, Hanson and Sigman 2013)
MPSA 2015 KnowBureaucracies Moscovich
12
Banerjee and Duflo (2008) used household survey data from 13 countries to identify
patterns of consumptions and features of middle classes in developing countries. In
particular they are able to compare these surveys because countries included the Living
Standard Measurement Surveys (LSMS) in household surveys. Many studies have used
permanent official household surveys in order to measure income (Milanovic 2002) or
social inequality (Calvo and Moscovich 2013). In his comprehensive analysis to
household surveys, Deaton (1997) distinguishes a number of areas for which they can
be used. He zooms in on methodological concerns relevant in order to successfully
replicate household survey data in these fields, such as saving and consumption,
nutrition and intra-house allocation, welfare and inequality, among others.
The Socio-Economic Database for Latin America and the Caribbean is a joint
initiative from CEDLAS, of the Universidad de la Plata, and The World Bank which
gathers comparable information from permanent household surveys conducted by
national statistics institutes in 24 Latin-American countries
(http://sedlac.econo.unlp.edu.ar/eng/).Household surveys are particularly useful to
collect information in developing countries where there are not as many sources of
systematic and reliable data as in other countries. However research aiming to kick off
comparative endeavors should take into account this fact and consider using the same
sources for developed countries, even having alternative ones, in order to have standard
comparable information for cross-country comparisons .
Household surveys vary across countries however most include data on income,
employment, education and living conditions. Panizza and his coauthors (2001) warn us
about the difficulties arising from the differences in permanent household surveys in
order to study the public sector. However they manage to gather comparable
information from household surveys from 17 Latin-American countries to analyze how
salaries affect public sector quality. I already mentioned the initiative of the SEDLAC
which gathers and harmonizes household surveys from different countries or the use of
the LSC in the work of Banerjee and Duflo (2008). Governments themselves carry out
initiatives in order to make their data comparable at a regional level. For instance,
occupational categories (for both public and private employees) are standard and
comparable in the surveys from the Mercosur countries (INDEC 2011). With household
surveys you can know if a person is an employee, if he or she works as a public servant
and if this is his/her main occupation and how many hours he/she devotes to it. Length

MPSA 2015 KnowBureaucracies Moscovich
13
of studies is included with other information. It allows us to know the bureaucratic
human capital. This basic information, for instance is going help me assess bureaucrats
preparation, motivation (Dalbo et al 2013) and their expectations, all of them crucial for
policy success.
An Example of the Use of Official National Data to Map Bureaucracies at the
Subnational Level
Using data reduction techniques I show how household surveys can help us to
improve our knowledge of the features of bureaucratic human capital. Permanent
household surveys gather individual quarterly data from Argentine survey respondents
in thirty two urban areas, I use data from a nine year period, 2003-2011. The sample is
composed of bureaucrats, those who replied that they work in the administration of the
state (excluding for instance teachers and doctors)17
.
Argentina is a federal country with twenty three provinces and an autonomous
federal district. In the city is based most of the federal administration. Since I focus on
provinces bureaucracies, I excluded this district in order to avoid the noise represented
by the disproportionate number of federal bureaucrats living in the city.18
Argentine
provinces can be gathered in three different groups: the poorer of the northeast, the less
populated though developed region of the Patagonia and the richer metropolitan
provinces from the center (Cicowiez 2004). Peripheral provinces have less competitive
political environments, higher governors‟ reelection rates, and fewer resources (Ardanaz
et al 2014). I used an original sample from a national permanent household survey
composed of 53358 public employees, collapsed at their median per province and year.
The variables used for this analysis are: Career, Education, Monthly Income (ratio),
Hours worked, Hourly Wage, Hourly Wage (ratio), Exclusivity, Permanence
17
For the variable “public servants” I use the proportion of public employees over total –private/public-
in the province. It does include all kinds of public servants. Except for this variable, the rest of the
analysis was made using a sample of bureaucrats, those who declared their main job to be working state
administration. 18
The replies do not differentiate the level of government the bureaucrats work at. However, since
household surveys are taken in urban areas where provincial administrations are located, respondents are
much more likely to be public employees at the provincial level rather than other levels.

MPSA 2015 KnowBureaucracies Moscovich
14
(subjective), Beginner, Outgoing , Qualification and Technology.19
I also used two
more variables at the provincial level, one is the proportion of public servants over total
employees (private and public), and the other is bureaucrats, public employees in the
administration of the state over total employees (private and public). I also built sub-
samples to isolate the effect of certain variables in bureaucrats with positions of
authority (hierarchic or directions positions) from the rest of the bureaucrats.
Multidimensional scaling is a means of visualization of the data. It distributes
objects according to their relative distance in a space organized along two or more
dimensions.20
Imagine that you know distances between a number of cities but not their
location. , MDS would distribute each city and allow you to see the map. The objects
are located in a space in a way that the distances between them are preserved. When
instead of distances we have a number of variables, MDS identifies patterns of relations
among objects according to the values of the variables. For instance MDS has been used
to summarize information and cluster objects as a way of reducing data dimensionality
of many variables, it can be also used to model people perceptions according to an ex
post evaluative criteria of their replies or to classify them in many ways (i.e. politicians
perceptions regarding bureaucrats –Waterman 1998). Last MDS can also be used to test
theories and see if the data is consistent with some expected parameters of the spatial
model (Jacoby 2012)
MDS can be also used to map conceptual distances (Jacoby 2012). I know the
values of a set of variables which describe basic features of my objects: bureaucrats.
The objects I aim to map along certain dimensions are bureaucrats per province and
year. However, I do not know how these values relate, neither how similar or different
bureaucratic bodies are as a result of their within-province variation. The advantage of
MDS is that dimensions are determined by the data itself, there are not assumptions
regarding the relation among variables in a given bureaucratic body.21
Variables have
certain influence on each dimension. The combinations of the values of the variables for
each object locate them in a point in space. Since I work with two dimensions this space
19
Since variables used to assess bureaucratic characteristics have a different scale, first it was necessary to
standardize them. Find a complete list of variables in the appendix.
20 Distances result from objects according to their similarities and dissimilarities. Hendrix (2010),
Hendrix (2010), Hanson and Sigman (2013) and Bersch, Praca and Taylor ( 2013) used reduction data
techniques, factor analysis and Bayesian approaches. Only Bersch and her coauthors focus on
bureaucracies. 21
Torgeson quoted in Borg and Groensen (2005).
MPSA 2015 KnowBureaucracies Moscovich
15
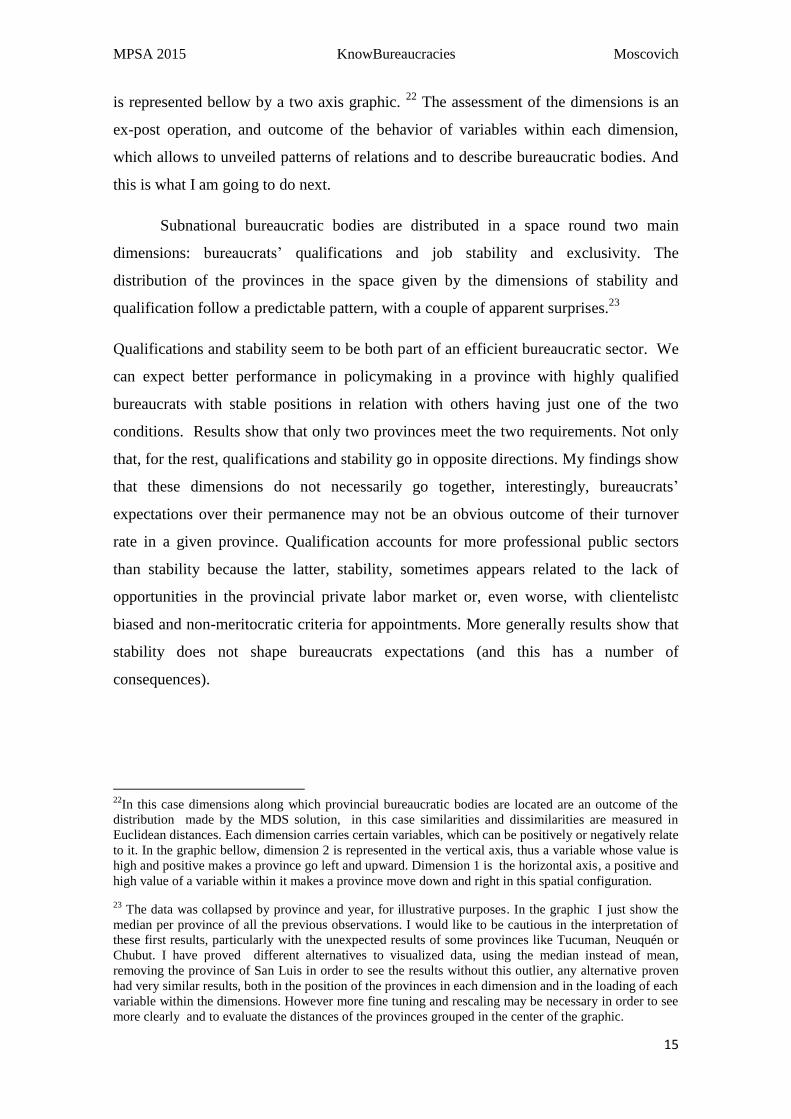
is represented bellow by a two axis graphic. 22
The assessment of the dimensions is an
ex-post operation, and outcome of the behavior of variables within each dimension,
which allows to unveiled patterns of relations and to describe bureaucratic bodies. And
this is what I am going to do next.
Subnational bureaucratic bodies are distributed in a space round two main
dimensions: bureaucrats‟ qualifications and job stability and exclusivity. The
distribution of the provinces in the space given by the dimensions of stability and
qualification follow a predictable pattern, with a couple of apparent surprises.23
Qualifications and stability seem to be both part of an efficient bureaucratic sector. We
can expect better performance in policymaking in a province with highly qualified
bureaucrats with stable positions in relation with others having just one of the two
conditions. Results show that only two provinces meet the two requirements. Not only
that, for the rest, qualifications and stability go in opposite directions. My findings show
that these dimensions do not necessarily go together, interestingly, bureaucrats‟
expectations over their permanence may not be an obvious outcome of their turnover
rate in a given province. Qualification accounts for more professional public sectors
than stability because the latter, stability, sometimes appears related to the lack of
opportunities in the provincial private labor market or, even worse, with clientelistc
biased and non-meritocratic criteria for appointments. More generally results show that
stability does not shape bureaucrats expectations (and this has a number of
consequences).
22
In this case dimensions along which provincial bureaucratic bodies are located are an outcome of the
distribution made by the MDS solution, in this case similarities and dissimilarities are measured in
Euclidean distances. Each dimension carries certain variables, which can be positively or negatively relate
to it. In the graphic bellow, dimension 2 is represented in the vertical axis, thus a variable whose value is
high and positive makes a province go left and upward. Dimension 1 is the horizontal axis, a positive and
high value of a variable within it makes a province move down and right in this spatial configuration.
23 The data was collapsed by province and year, for illustrative purposes. In the graphic I just show the
median per province of all the previous observations. I would like to be cautious in the interpretation of
these first results, particularly with the unexpected results of some provinces like Tucuman, Neuquén or
Chubut. I have proved different alternatives to visualized data, using the median instead of mean,
removing the province of San Luis in order to see the results without this outlier, any alternative proven
had very similar results, both in the position of the provinces in each dimension and in the loading of each
variable within the dimensions. However more fine tuning and rescaling may be necessary in order to see
more clearly and to evaluate the distances of the provinces grouped in the center of the graphic.
MPSA 2015 KnowBureaucracies Moscovich
16
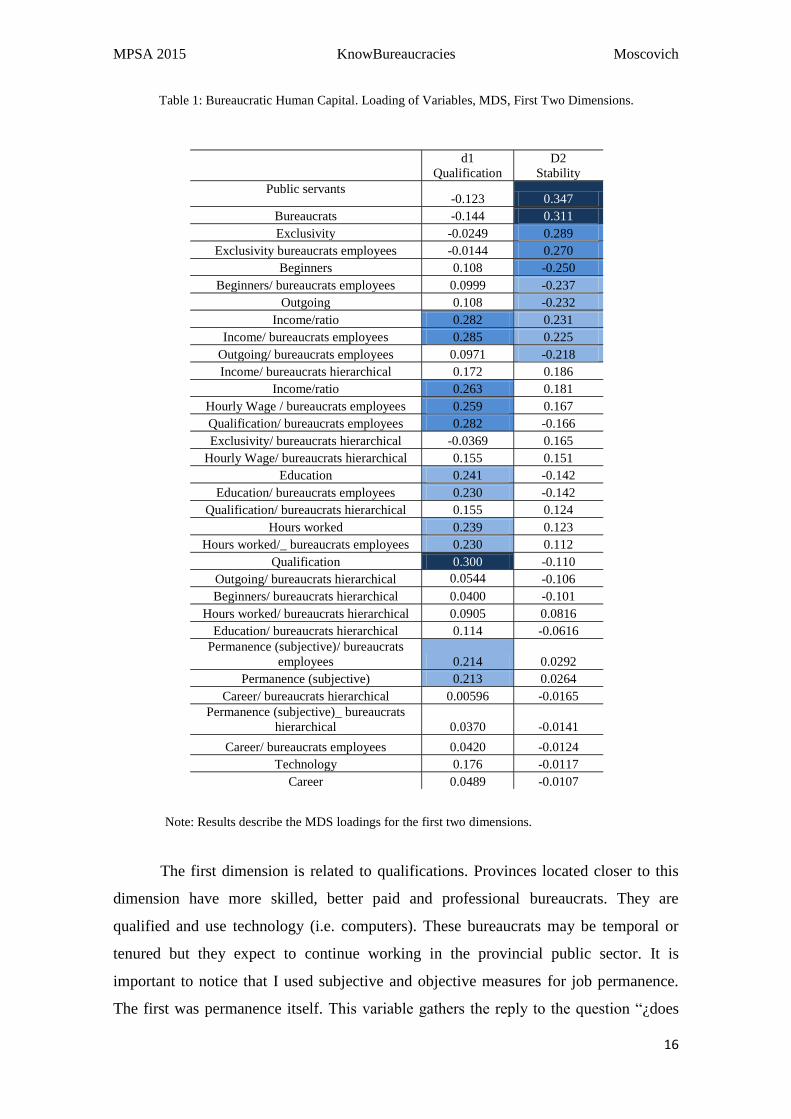
The first dimension is related to qualifications. Provinces located closer to this
dimension have more skilled, better paid and professional bureaucrats. They are
qualified and use technology (i.e. computers). These bureaucrats may be temporal or
tenured but they expect to continue working in the provincial public sector. It is
important to notice that I used subjective and objective measures for job permanence.
The first was permanence itself. This variable gathers the reply to the question “¿does
Table 1: Bureaucratic Human Capital. Loading of Variables, MDS, First Two Dimensions.
d1
Qualification
D2
Stability
Public servants -0.123 0.347
Bureaucrats -0.144 0.311
Exclusivity -0.0249 0.289
Exclusivity bureaucrats employees -0.0144 0.270
Beginners 0.108 -0.250
Beginners/ bureaucrats employees 0.0999 -0.237
Outgoing 0.108 -0.232
Income/ratio 0.282 0.231
Income/ bureaucrats employees 0.285 0.225
Outgoing/ bureaucrats employees 0.0971 -0.218
Income/ bureaucrats hierarchical 0.172 0.186
Income/ratio 0.263 0.181
Hourly Wage / bureaucrats employees 0.259 0.167
Qualification/ bureaucrats employees 0.282 -0.166
Exclusivity/ bureaucrats hierarchical -0.0369 0.165
Hourly Wage/ bureaucrats hierarchical 0.155 0.151
Education 0.241 -0.142
Education/ bureaucrats employees 0.230 -0.142
Qualification/ bureaucrats hierarchical 0.155 0.124
Hours worked 0.239 0.123
Hours worked/_ bureaucrats employees 0.230 0.112
Qualification 0.300 -0.110
Outgoing/ bureaucrats hierarchical 0.0544 -0.106
Beginners/ bureaucrats hierarchical 0.0400 -0.101
Hours worked/ bureaucrats hierarchical 0.0905 0.0816
Education/ bureaucrats hierarchical 0.114 -0.0616
Permanence (subjective)/ bureaucrats
employees 0.214 0.0292
Permanence (subjective) 0.213 0.0264
Career/ bureaucrats hierarchical 0.00596 -0.0165
Permanence (subjective)_ bureaucrats
hierarchical 0.0370 -0.0141
Career/ bureaucrats employees 0.0420 -0.0124
Technology 0.176 -0.0117
Career 0.0489 -0.0107
Note: Results describe the MDS loadings for the first two dimensions.
MPSA 2015 KnowBureaucracies Moscovich
17
your job have a time limit?” In this first variable, replies on job permanence are based
on people‟s perceptions regarding their chances to continue working in their position.
For this reason this is a subjective measure of permanence because the perception may
not necessarily mean that they have a tenured position. A person who gives services on
regular bases to the state, even having consecutive temporary contracts, as it is the rule
in some districts in Argentina, can feel that his/her work has no time limit (no matter if
formally it is a temporary job). Due to procedurals impediments and/or budgetary
constraints to hire tenured employees, many agencies at the federal or provincial level
use consultancy or freelancing schemes in a way that actually cover the status of
employees. On the other hand I use an objective measure form permanence composed
of two variables with information about turnover. The beginners are the ones who were
in the first quarter of their public post at the moment of being surveyed. Outgoing
variable shows the employees that were just leaving their jobs at the moment of
replying. Higher and positive values of these two variables mean more weight of
turnover in a given dimension (this is the case of dimension 1).
The dimension 1 of qualification gathers non-exclusive employees, who also
rotate more, but with expectations of longer permanence. Since they have better
qualifications and they live in richer provinces (see below), bureaucrats in the
qualification dimension have more choices and usually their public employment is not
their only job. Exclusivity negatively relates to this dimension. Employees of provinces
closer to dimension 1, can distribute their labor day in different positions and charge
hourly for their services, average salary per hour is as important for them as their
monthly income. They can either have more than one job in the public or private sector,
and can also leave and enter the provincial administration, it may explain why both
turnover and subjective expectancy over job permanence are both positively related to
dimension 1.24
The apparent contradictory values of turnover, time limit and exclusivity account
for the particular features of Latin-American bureaucratic sector in which informal
24
Another interesting finding is the lack of influence of careers, time spent in the position, for both
dimensions. Since dimensions explain 65% of spatial distribution of bureaucracies (see table 1) it can be
inferred that career is captured by a third dimension. Even in this case the fact that it is not important for
the two first dimensions is a fact worth noticing. For different reasons I only worked with two
dimensions, there was no clear elbow where dimensions drop, two dimensions are easier to visualize and
analyze and since the first two explain the 65 % of the spatial distribution I decided to work with just two
of them for the sake of parsimony.

MPSA 2015 KnowBureaucracies Moscovich
18
practices and no clear meritocratic procedures for recruitment are the rule (Zuvanic, et
al. 2010). Evans and Rauch suggest that expectancy over permanence is important
because stability makes bureaucrats less prone to corruption and allows them to, plan on
long term basis. The global result of this long term planning and the security regarding
stability is that they are more prone to deliver better services and to develop more
public infrastructure. A district with such bureaucratic body is more attractive for
investment and more likely to grow. But when Evans and Rauch talk of stability they
mean that bureaucrats improve their performance as they work with longer time
horizons because they expect to last in their position. Overall if we replace stability with
expectations of stability (the subjective measure of permanence) the results would be
quite similar, since expectations shape the structure of incentives for public players.
Job stability and exclusivity are main factors for a bureaucracy up and left,
closer to axis 2. Both beginners and outgoing, the ones who are either leaving or
entering or leaving the public sector, load negatively in this dimension. A province
upper and more close to the left in dimension 2 is one that has less turnover of
employees, but more turnover of those in higher positions (it makes sense because they
are more qualified and they follow the pattern of turnover described for dimension 1).
Then provinces closer to this dimension have more objective stability of employees
(90% of the sample) and higher turnover in the personnel with hierarchy.
Of course in extreme turnover can hamper the quality of policies, however
results show that in dimension 2 more stable bureaucrats do not always guarantee better
ones. First it is because, dimension 2 not only accounts for lower levels of turnover but
also for lower levels of education, qualification and hierarchy. In this context a stable
bureaucracy does not necessarily mean that has more expertise. Stability does not
guarantee quality by itself, if it does not come with preparation, qualification and the
use of basic technology (which is not the case of dimension2).
Moreover, in the expectations realm, these stable and exclusive bureaucratic
bodies that move up and left through axis 2, curiously, are also the more uncertain
regarding their job permanence. Why do not bureaucrats of dimension 2 expect to last in
their jobs? Because they are appointed on a clientelistic basis and they know they can be
MPSA 2015 KnowBureaucracies Moscovich
19
removed as easily as they got there, even really they tend to remain employed. .25
First it
should be noticed that another variable that locates a provincial public sector up and
left, dimension 2 defined by stability and exclusivity, is the proportion of public over
total employees. The higher the share of public employees in the labor market in a given
province, the closer this province to this dimension. It can be inferred, and the spatial
distribution of the provinces support this guess, that not only do people depend on
public employment because local economies are less diversified and offer no choices,
but also because they are appointed on political (non-programmatic and procedural)
basis (Calvo and Murillo 2004, Gibson et al 2004). In these cases, expectation regarding
job stability may be weaker since he/she “owes” that position to a politician or broker.
Other reasons for this perception may be associated with the condition of being a
beneficiary of a social program. In poorer provinces some positions in the states are
given to workfare beneficiaries who have to work a number of hours as a condition to
keep getting the benefit. This is a precarious situation that can nevertheless last in time..
What are the consequences of this lack of expectations? This sense of instability
promotes corrupt practices since bureaucrats take all they can while it lasts, also they
have shorter time horizons affecting long term planning both for public policies and
particularly for the development of public infrastructure. As suggested before a more
corrupt bureaucracy and the lack of infrastructure makes a district less attractive for
investment thus hampering districts‟ growth (Evans and Rauch 1999).
25
Calvo and Murillo (2013) show how expectations to get a position in the state is relation to , ideology
and closeness to political networks.
MPSA 2015 KnowBureaucracies Moscovich
20
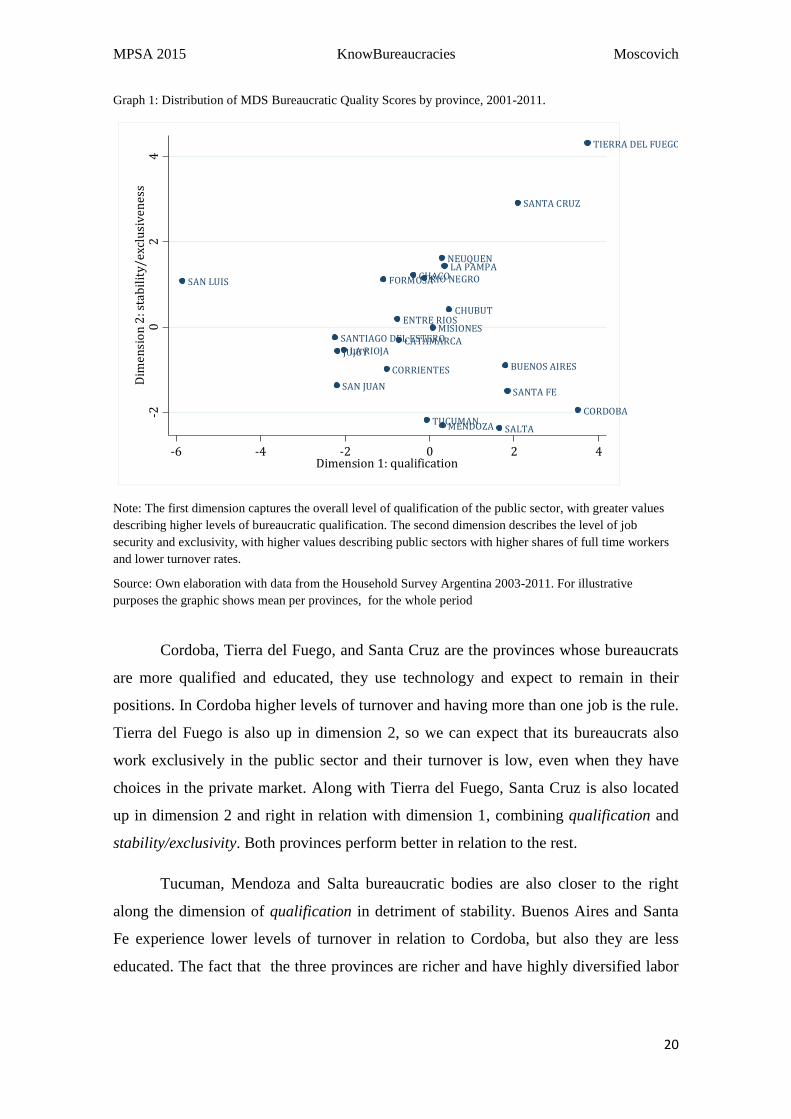
Cordoba, Tierra del Fuego, and Santa Cruz are the provinces whose bureaucrats
are more qualified and educated, they use technology and expect to remain in their
positions. In Cordoba higher levels of turnover and having more than one job is the rule.
Tierra del Fuego is also up in dimension 2, so we can expect that its bureaucrats also
work exclusively in the public sector and their turnover is low, even when they have
choices in the private market. Along with Tierra del Fuego, Santa Cruz is also located
up in dimension 2 and right in relation with dimension 1, combining qualification and
stability/exclusivity. Both provinces perform better in relation to the rest.
Tucuman, Mendoza and Salta bureaucratic bodies are also closer to the right
along the dimension of qualification in detriment of stability. Buenos Aires and Santa
Fe experience lower levels of turnover in relation to Cordoba, but also they are less
educated. The fact that the three provinces are richer and have highly diversified labor
Graph 1: Distribution of MDS Bureaucratic Quality Scores by province, 2001-2011.
Note: The first dimension captures the overall level of qualification of the public sector, with greater values
describing higher levels of bureaucratic qualification. The second dimension describes the level of job
security and exclusivity, with higher values describing public sectors with higher shares of full time workers
and lower turnover rates.
Source: Own elaboration with data from the Household Survey Argentina 2003-2011. For illustrative
purposes the graphic shows mean per provinces, for the whole period
BUENOS AIRES
CATAMARCA
CHACO
CHUBUT
CORDOBA
CORRIENTES
ENTRE RIOS
FORMOSA
JUJUY
LA PAMPA
LA RIOJA
MENDOZA
MISIONES
NEUQUEN
RIO NEGRO
SALTA
SAN JUAN
SAN LUIS
SANTA CRUZ
SANTA FE
SANTIAGO DEL ESTERO
TIERRA DEL FUEGO
TUCUMAN
-20
24
Dim
ensi
on
2: s
tab
ilit
y/ex
clu
siv
enes
s
-6 -4 -2 0 2 4Dimension 1: qualification

MPSA 2015 KnowBureaucracies Moscovich
21
markets, allow bureaucrats to have more than one job and enter and exit the public
sector even when they do not expect the job to end in the short term.
The metropolitan provinces of Cordoba, Santa Fe, Mendoza and Buenos Aires
are grouped closer to the qualification dimension. One first curiosity is that Tucuman
joins this group of metropolitan districts and is far from peripheral provinces (Gibson
and Calvo 2000). The group of peripheral provinces also includes Santiago del Estero,
Jujuy, La Rioja and San Juan, which, as expected, have less educated and qualified
bureaucrats, who rotate less, but whose time horizons are shorter due to their pattern of
appointment. Entre Rios, Catamarca and Corrientes are at the right of these provinces,
closer to the qualification dimension, but still farther than Neuquén, Chubut, Chaco, Rio
Negro and Misiones. Other outlier is San Luis, its position is closer to Neuquén
Formosa, Rio Negro and La Pampa in relation to dimension 2. They share relative
higher turnover, more public employees in relation to the private sector, and they only
have one job. However San Luis is the only province in the extreme of the upper left
quadrant, far from the dimension of qualification.
Final remarks
I claim that national official data from household surveys, and also, why not,
from census, are not only accurate but necessary complement to existing measures of
bureaucratic human capital. Most used measures are, generally, just one particular
indicator within a wider measure (i.e. governance, risk investment, state capacity,
institutional performance, etc.) and mainly based on surveys made using neither -
randomized nor representative samples of country experts. The use of official statistics
gives a standard, public, free, regular and comparable (at national and subnational level)
information to extend the scope of our conclusions in the assessment of bureaucracies
and bureaucratic practices.
To illustrate my arguments I used data on permanent household surveys made by
the national statistics institute in Argentina to map subnational bureaucracies. The map
of bureaucratic sectors help me to do three things: describe what variables matter in
order to describe the composition of bureaucratic bodies, pattern their relations (and
MPSA 2015 KnowBureaucracies Moscovich
22
showing that they do not always meet the expectations suggested by the literature ) and
show the suitability of official data used to do so. Bureaucratic bodies were located
along two dimensions, one related to their stability (lack of turnover) and the other to
qualification. More qualified bureaucrats are also more educated and less dependent on
their position. Being up and left along the axis of the stability/exclusivity dimension,
does not mean a better performance in policy making, because stability does not shape
expectations. Expectations are more conditioned by patronage and the sense that one
can lose the job at any moment (even when in these bureaucratic bodies turnover is
lower).
In the era of big data this paper makes it a point to come down to basics to take
advantage of existent classical standard decimononic official national statistics data. It
uses a tool to describe provincial public sectors to give an example of the application of
this official data. However, at this point I cannot advance in the understanding of all
mechanisms underlying the location of provincial bureaucratic bodies in relation to the
configurational space composed by stability and qualification. The next step is to use
the dimensions found in order to compare the Argentine case with others. Also to assess
how the features of bureaucratic bodies relate to governors turnover, policy success and
provincial state capacity. It is my desire that this proposal represents a meaningful
contribution for the understanding of the main factors shaping bureaucracy and that it
can offer new tools for practitioners and scholars in the field of comparative politics and
public policy research assessing bureaucratic human capital.
References
Agranoff, R. (2001). "Managing Within the Matrix: Do Collaborative
Intergovernmental. Relations Exist?." Publius 31(1): 31:56.
Albornoz, F. and A. Cabrales (2013). "Decentralization, Political Competition and
Corruption." Journal of Development Economics 105: 103-111.
Ardanaz, M., M. Leiras, et al. (2014). "The Politics of Federalism in Argentina and its
Effects on Governance and Accountability " World Development 53: 26-45.
Arnold, W. (1989). "Bureaucratic Politics, State Capacity, and Taiwan's Automobile
Industrial Policy." Modern China 15(2): 178-214.

MPSA 2015 KnowBureaucracies Moscovich
23
Bäck, H. and Hadenius (2008). "Democracy and State Capacity: Exploring a J-Shaped
Relationship." Governance: An International Journal of Policy, Administration, and
Institutions, 21(1): 1-24.
Banerjee, A. and E. Duflo (2008). "What is Middle Class about the Middle Classes
around the World?" The Journal of Economic Perspectives 22(2): 3-28.
Bendor, J., S. Taylor, et al. (1985). "Bureaucratic Expertise versus Legislative
Authority: A Model of Deception and Monitoring in Budgeting." The American
Political Science Review 74(4): 1041-1060.
Berkman, H., C. Scartascini, et al. (2008). Political Institutions, State Capabilities, and
Public Policy: An International Dataset. Washington DC, IDB
Bersch, K., S. Praça, et al. (2013). State Capacity and Bureaucratic Autonomy Within
National States: Mapping the Archipelago of Excellence in Brazil. Latin American
Studies Association Conference. Washington.
Borg, I. and P. J. F. Groenen (2005). Modern Multidimensional Scaling. Theory and
Applications. New York, Springer.
Calvo, E. and L. Moscovich (2013). No Protest, No Redistribution: Inequality, Social
Conflict, and the allocation of Cash Transfers in the Argentine Provinces. LASA.
Washington DC.
Calvo, E. and M. V. Murillo (2013). "When Parties Meet Voters: Assessing Political
Linkages through Partisan Networks and Distributive Expectations in Argentina and
Chile." Comparative Political Studies 46(4): 851-882.
(2004). "Who delivers? Partisan Clients in the Argentine Electoral Market."
American Journal of Political Science 48(4): 742-747.
Charron, N. and V. Lapuente (2010). "Does Democracy Produce Quality of
Government?" European Journal of Political Research 49: 443–470.
Cicowiez, M. (2004). Caracterización Economico-Social de las Provincias Argentinas.
Disparidades regionales y federalismo fiscal A. Porto. La Plata, Universidad de La
Plata.
Cingolani, L. (2013). The State of State Capacity: a review of concepts, evidence and
measures Working Paper Series on Institutions and Economic Growth. Maastricht,
UNU-MERIT.
Cingolani, L., K. Thomsson, et al. (2013). Minding Weber more than ever? The impacts
of State Capacity and Bureaucratic Autonomy on development goals. Working Paper
Series on Institutions and Economic Growth. Maastricht, UNU-MERIT.
MPSA 2015 KnowBureaucracies Moscovich
24
Cortázar Velarde, J. C., M. Lafuente, et al., Eds. (2014). Al servicio del ciudadano una
década de reformas del servicio civil en América Latina (2004–13) Washington, dc,
IDB.
Dahlström, C. and V. Lapuente (2012). Weberian bureaucracy and corruption
prevention. DPADM Expert Group Meeting on Prevention of Corruption in Public
Administration, New York.
Dal Bo, E., F. Finan, et al. (2013 ). "Strengthening State Capabilities: The Role Of
Financial Incentives in the Call to Public Service." The Quarterly Journal of Economics
(2013) 128 (3): 128(3): 1169-1218.
Deaton, A. (1997). The Analysis of Household Surveys. Baltimore, World Bank and
The John Hopkins University Press.
En Bai, C. and S. Jin Wei (2000) Quality of Bureaucracy and Open-Economy Macro
Policies. National Bureau of Economic Research
Evans, P. (1995). Embedded Autonomy Princenton Princenton University Press.
Evans, P. and Rauch (1999). "Bureaucracy and Growth: A Cross-National Analysis of
the Effects of "Weberian" State Structures on Economic Growth." American
Sociological Review 64(5): 748-765.
Fukuyama, F. (2013). What Is Governance? Working Paper. Washington, DC, Center
for Global Development.
(2012). "The Strange Absence of the State in Political Science." Retrieved from
http://www.the-american-interest.com/2012/10/02/the-strange-absence-of-the-state-in-
political-science/ Accessed on April 2015
Gailmard, S. and J. Patty (2007). "Slackers and Zealots: Civil Service, Policy
Discretion, and Bureaucratic Expertise." American Journal of Political Science 51(4):
873–889
Geddes, B. (1994). Politicians Dilemma. Building State Capacity in Latin America
Berkeley University of California
Gibson, E. and E. Calvo (2000). "Federalism and Low-Maintenance Constituencies:
Territorial Dimensions of Economic Reforms in Argentina " Studies in Comparative
International Development 35(3): 32-55.
Gibson, E., E. Calvo, et al. (2004). Reallocative Federalism Legislative
Overrepresentation and Public Spending in the Western Hemisphere. Federalism and
Democracy in Latin America. E. Gibson. Baltimore, John Hopkins University Press.
Hanson, J. and R. Sigman (2013). Leviathan‟s Latent Dimensions: Measuring State
Capacity for Comparative Political Research. Syracuse.

MPSA 2015 KnowBureaucracies Moscovich
25
Hendrix, C. (2010). "Measuring State Capacity: Theoretical and Empirical Implications
for the Study of Civil Conflict." Journal of Peace Research 47(3): 273-285
Honig, M. (2006). "Street-Level Bureaucracy Revisited: Frontline District Central-
Office Administrators as Boundary Spanners in Education Policy Implementation."
Educational Evaluation and Policy Analysis 28(4): 357–383.
INDEC (2011). Clasificación de Actividades Económicas para Encuestas
Sociodemográficas del MERCOSUR. Buenos Aires, INDEC.
Jacoby, W. (2012). Multidimensional Scaling: An Introduction Workshop In Methods
Indiana University. Indiana, Workshop In Methods Indiana University.
Kaufmann, D., A. Kraay, et al. (2007). The Worldwide Governance Indicators Project:
Answering the Critics. Washington, dc, World Bank.
Kurtz, M. (2013). Latin America State Building in Comparative Perspective. Social
Foundations of Institutional Order. Cambridge, Cambridge University Press.
Leuprecht, C. and J. Goldstone (2013) Political Demography. E-International Relations
retrieved from: http://www.e-ir.info/2013/02/23/political-demography/ acceded April
2015
Levitsky, S. and M. V. Murillo (2005). Building Castles in the Sand? The Politics of
Institutional Weakness in Argentina. Argentine Democracy. The Politics of Institutional
Weakness. S. Levitsky and M. V. Murillo. Pennsilvania, Pennsylvania State University
Press.
Mazzuca, S. (2012). Access to Power versus Exercise of Power. La calidad de la
democracia: perspectivas desde América Latina. G. Munck and S. Mantilla. Quito.
Migdal, J. (2011). Estados débiles, Estados fuertes. FCE, México.
Milanovic, B. (2002). "True World Income Distribution, 1988 And 1993: First
Calculation Based On Household Surveys Alone." The Economic Journal 112: 51-92.
O'Donnell, G. (2007). Las poliarquías y la (in)efectividad de la ley en América Latina
Disonancias. Criticas Democráticas a la Democracia. . G. O'Donnell. Buenos Aires
Prometeo.
Olson, M., N. Sarna, et al. (2000). "Governance and Growth: A Simple Hypothesis
Explaining Cross-Country Differences in Productivity Growth Public Choice 102(3/4):
341-364.
Panizza, U., R. d. Tella, et al. (2001). "Public Sector Wages and Bureaucratic Quality:
Evidence from Latin America" Economía 2(1): 97-151.
Rauch, J. and P. Evans (2000). "Bureaucratic Structure and Bureucratic Performance in
Less Developed Countries." Journal of Public Economics 75: 49-71.

MPSA 2015 KnowBureaucracies Moscovich
26
Rodrigues-Silveira, R. (2014). A demografia das elites políticas locais: usando os dados
do censo para avaliar a estrutura e as mudanças nos grupos políticos dominantes no
nível local. In Eleições, partidos e representação política nos municípios brasileiros. M.
Mendes Rocha and M. T. Miceli Kerbauy. Juiz de Fora, UFJF.
Savoia, A. and K. Sen (2012). Measurement and evolution of state capacity: exploring a
lesser known aspect of governance. Manchester, ESID.
SEDLAC (2014) Database. Available in http://sedlac.econo.unlp.edu.ar/eng/. Accessed
April 2015
Sikkink, K. and L. Wolfson (1993). "Las capacidades y la autonomia del Estado en
Brazil y la Argentina. un enfoque neoinstitucionalista." Desarrollo Económico 32(128):
543-574.
Smulovitz, C. (2012). Public Defense and Access to Justice in a Federal Context: Who
Gets What, and How in the Argentinean Provinces?. APSA.
Soifer, H. (2013). "State Power and the Economic Origins of Democracy." Studies in
Comparative International Development 48(1): 1-22.
Soifer, H. and M. vom Hau (2008). "Unpacking the Strength of the State: The Utility of
State Infrastructural Power." Studies in Comparative International Development 43:
219–230.
Souza, C. (2015). Capacidade burocrática no brasil e na argentina: quando a política faz
a diferença1 celina souza2. Texto para discussão Brasília : Rio de Janeiro, Instituto de
Pesquisa Econômica.
UNDP (2007). Governance Indicators: A Users‟ Guide. New York, UNDP.
Van de Walle, S. (2006). "The State of the World‟s Bureaucracies." Journal of
Comparative Policy Analysis, 8(4): 437-448.
Waterman, R., A. Rouse, et al. (1998). "The Venues of Influence: A New Theory of
Political Control of the Bureaucracy." Journal of Public Administration Research and
Theory 8(1): 13-38.
Weber, M. (1995). Economía y Sociedad. Mexico d. f, Fondo de cultura económica.
Wibbels, E. (2005). Federalism and the Market. Intergovernmental Conflict and
Economic Reform in the Developing World. Cambridge, Cambridge University Press.

MPSA 2015 KnowBureaucracies Moscovich
27
Appendix
Multidimensional Scaling for the assessment of Bureaucratic Bodies of Argentina Provinces. Dimension
1 Qualification, Dimension 2 Stability/Exclusivity
Source: Own elaboration. MDS solution used in Euclidean distances, with information of 747
observations for 14 variables collapsed per province and year, from an original sample of 53338
bureaucrats interviewed, included in the Permanent Household Survey, Argentina from 2003 to 2011. .
10 652.3445 3.50 78.63 1.29 95.36
9 663.84043 3.56 75.13 1.33 94.07
8 726.79445 3.90 71.57 1.60 92.73
7 833.59235 4.47 67.67 2.10 91.13
6 1032.1646 5.53 63.20 3.23 89.03
5 1100.5824 5.90 57.67 3.67 85.81
4 1270.9555 6.82 51.77 4.89 82.14
3 1995.3256 10.70 44.95 12.05 77.25
2 2438.8404 13.08 34.25 18.01 65.20
1 3948.3194 21.17 21.17 47.19 47.19
Dimension Eigenvalue Percent Cumul. Percent Cumul.
abs(eigenvalue) (eigenvalue)^2
Retained dimensions = 2 Mardia fit measure 2 = 0.6520
Eigenvalues > 0 = 33 Mardia fit measure 1 = 0.3425
Number of obs = 630
dissimilarity: L2, computed on 33 variables
Classical metric multidimensional scaling
. mds std1*, id(id)

MPSA 2015 KnowBureaucracies Moscovich
28
Variable Definition
Career An average of an ordinal scale for26
time spent in the same public position
1 = less than a month
2= 1 to 3 months
3= 3 to 6 months
4= 6 to 12 months
5= 1 to 5 years 6= more than 5 years
Education An average of an ordinal scale for educational status
0= no education
1= primary (incomplete)
2= primary school
3= high school (incomplete)
4= high school
5= college (incomplete)
6=bachelor degree
Income (ratio) Average per province and year of employee monthly income, over the mean income of
all public employees for this trimester
Hours worked Average per province and year of number of hours worked in the last week in the
person‟s main occupation (bureaucrats post)
Hourly Wage Average per province and year of income over hours worked
Hourly Wage (ratio) Person‟s hourly wage over the mean of all public employees hourly wage in this
trimester
Exclusivity Average per province and year of a dichotomous variable taking the value of 1 if the
position in the public sector is the person‟s sole employment or 0 otherwise
Permanence
(Subjective)
Average per province and year of a dichotomous variable taking the value of 1 if the
person replies that this job has no time limit or 0 otherwise.
Beginners Average per province and year of a dichotomous variable taking the value of 1 if
during the former trimester the person did not work in the public sector or 0 otherwise.
Outgoing Average per province and year of a dichotomous variable taking the value of 1 if in the
next semester the person does not work in the public sector or 0 otherwise.
Qualification Average per province and year of an ordinal scale for job qualifications
1=not qualified
2=operative
3=technician
4=professional
Technology Average per province and year of a dichotomous variable taking the value of 1 if the
person woks with some kind of computerized system or 0 otherwise.
Public servants Average per province and year of the ratio of people working in the estate in all
positions ( also doctors, teachers, etc.) over the total province employees (private or
public).
Bureaucrats Average per province and year of the ratio of people working in the administration of
the state over the total of province employees (private or public).
26
Averages of ordinal variables make sense as long as higher values represent, somehow, more of this attribute, for instance higher category 4, means more job qualifications than category 1, the same happens with education, a number 6 refers to a higher educational status.

MPSA 2015 KnowBureaucracies Moscovich
29
Descriptive statistics
Mean Median Min Max StDv Obs
Hourly Wage
(ratio) 0,97 0,92 0,39 3,83 0,31 747
Income (ratio) 0,97 0,92 0,40 2,19 0,31 747
Exclusivity 0,88 0,89 0,67 1,00 0,06 747
Permanence
(Subjective) 0,82 0,84 0,16 1,00 0,13 747
Hours 34,28 34,28 25,28 44,32 2,94 747
Education 4,05 4,05 2,86 5,12 0,37 747
Career 5,44 5,47 3,07 5,94 0,23 747
Beginners 0,02 0,00 0,00 0,22 0,03 747
Outgoing 0,02 0,00 0,00 0,31 0,03 747
Technology 0,44 0,48 0,00 0,84 0,18 747
Qualification 2,30 2,30 1,42 2,98 0,19 747
Data from Household Surveys. Public employees in the administration of the state, per province and year.
Argentina 2003-2011