1
Geophysical Survey with 2D Resistivity
Pine Creek, British Columbia
ON PLACER TENURES 611136, 619743 and 896529
ATLIN MINING DIVISON
MAPSHEET 104N.063
Latitude 59° 36’ 30.0’’N, Longitude 133° 29’ 24.2’’W
WORK PERFORMED ON MAY 25th – 26th 2012
OWNER: SCOTT, BRIAN WILLIAM 50% – Box 77 Tagish YT, Y0B 1T0
MARTINDALE, MARDELL 50% – Box 24 Tagish YT, Y0B 1T0
CONSULTANT: ARCTIC GEOPHYSICS INC. – BOX 747 DAWSON CITY YT, Y0B 1G0
AUTHOR: PHILIPP MOLL
DATE SUBMITTED: September 21st 2012

2
Table of Contents
1. Introduction ............................................................................................................................................... 3
2. Crew ........................................................................................................................................................... 4
3. Fieldwork - Schedule .................................................................................................................................. 4
4. Geophysical Method .................................................................................................................................. 4
5. Use of Geophysical Methods ..................................................................................................................... 5
5.1. Instrumentation .................................................................................................................................. 5
5.2. Data Acquisition .................................................................................................................................. 6
5.3. Processing ........................................................................................................................................... 6
5.4. Interpretation ...................................................................................................................................... 6
6. Mining History of Pine Creek ..................................................................................................................... 7
7. General Geology ......................................................................................................................................... 8
7.1. Bedrock ............................................................................................................................................... 9
7.2. Physiography, Glaciation, Placer Deposits at Pine Creek .................................................................. 12
8. Profile image ............................................................................................................................................ 16
9. Line Arrangement .................................................................................................................................... 16
10. Geophysical Implications ....................................................................................................................... 16
11. Placer Targets in Profiles ........................................................................................................................ 17
12. Survey Map ............................................................................................................................................ 18
13. Interpretation of Profiles ....................................................................................................................... 19
Pine Creek 01 ........................................................................................................................................... 19
Pine Creek 02 ........................................................................................................................................... 21
14. Qualifications ......................................................................................................................................... 23
15. Confirmation .......................................................................................................................................... 23
Appendix ...................................................................................................................................................... 24
Literature.................................................................................................................................................. 24
Geophysical Data Table ............................................................................................................................ 25
List of Costs .............................................................................................................................................. 26
GPS-Data .................................................................................................................................................. 27

3
1. Introduction
The Atlin gold rush was an off shoot of the 1898 Klondike gold rush. Gold mining activities have
continued in Atlin to the present day; and although some of the traditional creeks have been
thoroughly mined out there are still potentially rich placer areas to be discovered.
The geology of the Atlin area shows extensive signs of glaciation. At Pine Creek (Atlin BC)
commercial placer gold deposits are potentially sitting in glaciofluvial gravels, glaciolacustrine
sediments, till on top of bedrock, and pre-glacial gravels which have been preserved.
This geophysical survey, using 2D Resistivity, was done on the placer tenures 611136, 619743
and 896529 at Pine Creek (Latitude 59° 36’ 30.0’’N, Longitude 133° 29’ 24.2) for Brian Scott and
Martindale Mardell.

4
The claims are 15km east of Atlin and were accessed via the Surprise Lake Road and the Birch
Creek road.
A total of 950m of measuring line was produced during the survey.
The survey was focussed on measuring and interpreting following subsurface characteristics:
1. Depth and topography of bedrock
- Paleochannels
2. Sedimentary stratification
3. Groundwater table
4. Mining/prospecting history
This geophysical survey using Resistivity is delivering subsurface information as the foundation
for a systematic advanced prospection with technological means such as trenching, drilling, or
shafting.
2. Crew
Survey Leader: Stefan Ostermaier
Assistance in the field: Franz Piechotta
Support, Documentation: Philipp Moll
3. Fieldwork - Schedule
Fieldwork: 25th May 2011 – 26th May 2012
Processing, Interpretation, First Documentation: 27th - 28th May 2012
4. Geophysical Method
Resistivity is not a time domain geophysical method such as Ground Penetrating Radar or
Seismic. Resistivity measures a material property. In the Resistivity model the different
underground zones are material-dependently differentiated according to their electrical
conductivity. Thus, Resistivity promises good chances in respect of measuring the kind and
character of the subsurface materials as well as the groundwater distribution, which would be of
interest for placer mining. The equipment used (see below) allows for measuring of layer
interfaces in depths from 0.5m to 100m by varying the electrode spacing. – Therefore, this
prospecting concept is based on the use of 2D Resistivity.

5
5. Use of Geophysical Methods
5.1. Instrumentation
For this survey a lightweight, custom-built 2D RESISTIVITY and INDUCED POLARIZATION (IP)
imaging system with rapid data acquisition was used. The system includes:
• “4 POINT LIGHT” EARTH RESISTIVITY METER1
• 96 ELECTRODE CONTROL MODULES2
• 96 STAINLESS STEEL ELECTRODES3
480m MULTICORE CABLE: CONNECTOR SPACING: 5m4
1 Constructed and produced by LGM (Germany) 2 Ditto
3 Constructed and produced by GEOANALYSIS.DE (Germany)
4 Ditto
Figure: 2D Resistivity measurement, Stefan Ostermaier, Arctic Geophysics
Inc., Yukon 2009

6
This system weighs approximately 120 kg which is about one third of regular standard
equipment. It can be run with a 12V lead battery. The equipment facilitates high mobility and
rapid data acquisition with a small crew.
5.2. Data Acquisition
Resistivity
The data acquisition is carried out by the automatic activation of 4-point-electrodes. Thus
several thousand measurements are taken, one every 1-2 seconds. The AC transmitter current
of 0.26 to 30 Hz is amplified by the electrode control modules, up to a maximum of 100mA and
400V peak to peak. The voltage measured at the receiver electrodes (M, N) is also amplified.
In this geoelectrical survey the Schlumberger-array were used. The Schlumberger array is
appropriate to image horizontal layers as is needed for placer prospecting.
The 2D Resistivity imaging system, used for this survey, allows measurements with a depth of up
to 90m. With a depth to bedrock of more than 6m, an electrode spacing of 5m can be used for
placer surveys. This allows the measuring of large profile lengths in short time with a horizontal
measuring resolution of 2.5m. This quantification has proven itself to be reliable in the
determination of the bedrock topography and sedimentary arrangement for placer investigation
at the most environmental conditions.
5.3. Processing
Resistivity
The measured Resistivity data were processed with the RES2DINV inversion program5.
Schlumberger arrays, used in this geoelectrical survey, is appropriate to measure subsurface
conditions predominantly showing a horizontal zoning of the ground materials.
5.4. Interpretation
In this survey the interpretation of the Resistivity models is high likely since the data quality is
very high and the data structure of the models is most plausible!
The resistivity profile is the basic source for the interpretation of placer-related subsurface
aspects of overburden and bedrock.
5 Produced by GEOTOMO SOFTWARE (Malaysia)
7
6. Mining History of Pine Creek6
The first discovery of gold in the camp was in surface gravel
in Pine Creek in 1898 near what became the settlement of Discovery. By the
next season 640 miners were working the surface gravels of the valley bottom
and farther upstream at Gold Run were mining underground, and the total
recorded production was 13,828 ounces which is more than was produced in any
other season. Many of the miners left at the end of the 1899 season. Ditches
to bring water for hydraulic mining were dug in 1900 and were put into use in
1902. A dredge was built at Gold Run in 1903 and was operated in 1904 and part of 1905, but
could not successfully handle boulders encountered.
A dam was built at the mouth of Surprise Lake in 1905 to increase its storage
capacity and provide more water for hydraulicking. A steam shovel was operated
in 1906 and 1907 to handle gravel east of Discovery, and then in 1908 and
major hydraulic operation was started. This continued until 1922, and at
the end of that period the main pit had almost the extent it has now.
After suspension of the large scale hydraulic operation in
most years only a few underground operations and some sniping was carried on
and production generally was much less. A hydraulic operation at the southeast
limit of the pit was successful in 1932-1935 and another along the
southern limit was successful in 1938 and 1939. In 1940 a company was formed
that used a dragline and bulldozers to move gravel along the northern part of
the pit to a mobile washing plant. This operation was continued until 1942.
Since then production has been low.
A company was formed in 1925 to hydraulic gravel west of the
main hydraulic cut and presumed to be in an old channel of Pine Creek. The
operation was continued until 1930 and in that period about two million yards
of gravel was handled and a 1,500 foot length of bedrock was cleaned but no
pay gravel was found.
The grade of bedrock in parts of the pit was too low for
sluicing efficiently, and during operations it was necessary to cut ditches
into bedrock and sluices were laid in these. Much of the bedrock is soft
decomposed serpentinized rock and easily eroded. Intruding this are hard
6 Black, J. M.: Report in the Atlin Placer Camp, 1953

8
dark green dykes and these project as ribs above the general rock surface. Preglacial gravel
occurs or did occur in some areas, but much of it has been worked [...]. Yellow
gravel is exposed in the banks of the pit and continues for an unknown distance
north and south of the pit. Some of it has been drift-mined but the
remaining gravel is not being worked. East and west of the main area except
at Gold Run till rests on bedrock, some of which is glaciated and much of
the remainder presumably is. Parts of Gold Run have been drift-mined but this section
has not been hydraulicked and some sections presumably are of economic interest.
7. General Geology7 The survey area at Pine Creek is located in the Cache Creek Terrain west of Surprise Lake.
Figure: Cache Creek Terrain8
7 W. Gruenwald, B. Sc.: Geological, Geochemical and Geophysical Report on the Eagle, Margarita and Butterfly
Claims, Atlin Mining Division, BC, 1984
Black, J. M.: Report in the Atlin Placer Camp, 1953
Asg, C. H.: Origin and Tectonic Setting of Rocks in the Atlin Area, BC (NTS104N), Ophiolitic, Ultramafic and Related,
Geological Survey Branch, Bulletin 94, 1994 8 British Columbia Geological Survey Branch, Bulletin 105v25C05, Chapter 5

9
7.1. Bedrock
During the upper Paleozoic (Permo-carboniferous 360 - 250 million years ago) common
components of the contemporary Cache Creek bedrock complex were created: Quarzite,
argillite, greenstone9, and marble.
In the Mesozoic (250 - 65 million years ago) numerous irregular bodies of ultrabasic rocks have
intruded into host rock dominated by the above mentioned rock types (Atlin Intrusions). The
majority of these bodies were altered to masses of quartz-carbonate with variable amounts of
greenish nickel-chromium micas.
During the Jurassic period (200 - 145 million years ago) granitic intrusions occurred in the Cache
Creek area: for example the granodiorite body at Mt. Carter north of Atlin, and the alaskite10
quartz monzonite masses of the Surprise Lake Batholith east of Atlin.
The youngest rocks mapped in the Atlin area are the olivine basalt flows and scoria near the
headwaters of Volcanic and Ruby Creeks.
Today the host rocks for the above mentioned intrusions are the sedimentary, metamorphic,
and volcanic rocks of the Cache Creek Group seen in the Bedrock Geology Map below.
Lode gold occurrences, which are thought to be the source of the Atlin placer gold deposits, are
found in quartz veins, veinlets and/or stockworks associated with structural features such as
faults or shear zones within, along, or near intrusive bodies.
9 Term for green schist including chlorite, actinolite, epidote
10 American term for alcali feldspare granite

10
Figure: Bedrock Geology Map – Atlin Area11
11
Massey, N.W.D., MacIntyre, D.G., Desjardins, P.J. and Cooney, R.T., 2005: Digital Geology Map of British
Columbia: Tile NO8 Northwest B.C., B.C. Ministry of Energy and Mines, Geofile, 2005-8, scale 1:250,000

11

12
Figure: Bedrock Geology Map – Atlin Area – Pine Creek12
7.2. Physiography, Glaciation, Placer Deposits at Pine Creek13
As Atlin glacier thickened and advanced a lobe or tongue from
it moved up Pine Valley, the lowest outlet to the east. In an ice marginal
lake east of the advancing lobe detritus was deposited and then, as the lake
advanced, was dispersed and the valley bottom was glaciated. Bedrock in a
hydraulic cut south of Halfway is glaciated. The surface of the bedrock
slopes indicating that possibly the old channel of Pine Creek at this point
is south of the hydraulic cut.
Bedrock near the west limits of a large hydraulic cut on the
central part of Pine Valley has also been glaciated. This suggests that
most of the floor of the valley west of the cut is probably glaciated and
12
Massey, N.W.D., MacIntyre, D.G., Desjardins, P.J. and Cooney, R.T., 2005: Digital Geology Map of British
Columbia: Tile NO8 Northwest B.C., B.C. Ministry of Energy and Mines, Geofile, 2005-8, scale 1:250,000 13 Black, J. M.: Report in the Atlin Placer Camp, 1953
Asg, C. H.: Origin and Tectonic Setting of Rocks in the Atlin Area, BC (NTS104N), Ophiolitic, Ultramafic and Related,
Geological Survey Branch, Bulletin 94, 1994

13
that any placer deposits on it have been dispersed. However, the bedrock
of the hydraulic cut has not been glaciated and the writer believes that
because of the great load of detritus picked up to the west the erosive
power of the lake was decreased and it did not erode to bedrock but moved
over pre-glacial gravels. These gravels in the western part of the cut are
only a few feet thick but towards the east become as much as 40 feet thick.
This difference in thickness indicates that the ice eroded less deeply as
it moved eastward. Along this section of the valley the glacier straightened
and smoothed the slope of Munroe Mountain. Probably it dammed Spruce Creek.
The area in which there are undisturbed gravel deposits extends
east of the hydraulic cut for an unknown but comparatively short distance
and to the east bedrock is glaciated and till rests on it. The limit
of unglaciated bedrock is not known. [...] The reason that the glacier here
eroded to bedrock east of Discovery is attributed to an influx of ice from
Spruce Creek Valley, which could enter Pine Valley through a pass on the
northwest slope of Spruce Mountain. Movement of ice on this slope apparently
straightened and steepened the slope of Spruce Mountain.
One other section of Tertiary gravel deposits has been found
in Pine Valley east of the main section. It is about at the point where a
lobe of ice from Spruce Creek presumable flowed into the valley
and occurs where a ridge of rock on the southern part of an old rim
protected the channel from glaciation by a glacier moving northeastwards. This
section, known as Gold Run, is covered with about 30 feet of gravel and till.
Pine glacier as it moved up the valley, straightened the walls
and made the valley more nearly U-shaped. Probably a glacier flowed down
Otter Creek valley to join it and thereby increased its effectiveness as an
erosive agent and it eroded more deeply to form the basin occupied by Surprise
Lake.
As the glacier moved through the part of Pine Valley now
occupied by the lake, it probably glaciated the lower parts of the valleys
of the tributary streams and dispersed gravel deposits and dammed the streams
causing them to form ice marginal lakes. At the maximum extent of the ice,
glaciers probably advanced down these tributary valleys and increased the
erosive power of the main glacier. The valley towards the northeast is narrower
, and here where the glacier was constricted the effects of glaciation
are most marked.

14
The valley occupied by a main tributary of Cracker Creek from
the southwest is glaciated and U-shaped but it does not head in high ground
where ice could have accumulated and therefore ice must have moved into it.
From the configuration of the ground it appears probably that a lobe from
Pine glacier moved up Ruby Valley and through the valley tributary to Cracker
into Cracker Valley.
With continued expansion the glacier in Pine Valley thickened
and glaciated the upper parts of the valley slopes and subsidiary lobes moved
up the valleys of tributary streams. Lobes in the tributary streams also
widened and the entire area may have been covered for a comparatively short
time by ice.
When wastage of ice exceeded accumulation much till was deposited
and then Pine Creek, swollen by meltwater, started to cut through the
till and removed much of it from the valley. In some parts of the valley
there is more than 70 feet of overburden, of which much is till but over considerable
areas the depth of overburden is much less and in places bedrock is
exposed. At Gold Run there is about 32 feet of overburden, of which eight
feet is till; in the vicinity of the main hydraulic cut, till was largely
removed and Tertiary gravels were exposed and some were removed.
Some sections of the new course nearly coincided with the old,
as at Discovery. Other sections of the new channel are incised in a rim of
the old channel and have formed rock canyons. A narrow canyon west of Discovery
and north of the present course, suggests that Pine Creek for a time
was diverted through it and probably at that time flowed into Trend Gulch
and, on into Fourth of July Creek.
A terrace of stratified sands and gravels more than 50 feet
thick extends for about two miles across the valley, at an altitude of 2,500
feet. The upper beds dip gently downstream but the lower beds are covered
with debris from above and their attitude is now known. The beds probably
formed in a lake dammed behind ice that remained in the lower part of the
valley at a late stage in the disappearance of the ice.
Several terraces lo-15 feet high which slope gently downstream
north of Halfway, probably are remnants of flood plains left as the creek cut
down to its present grade.
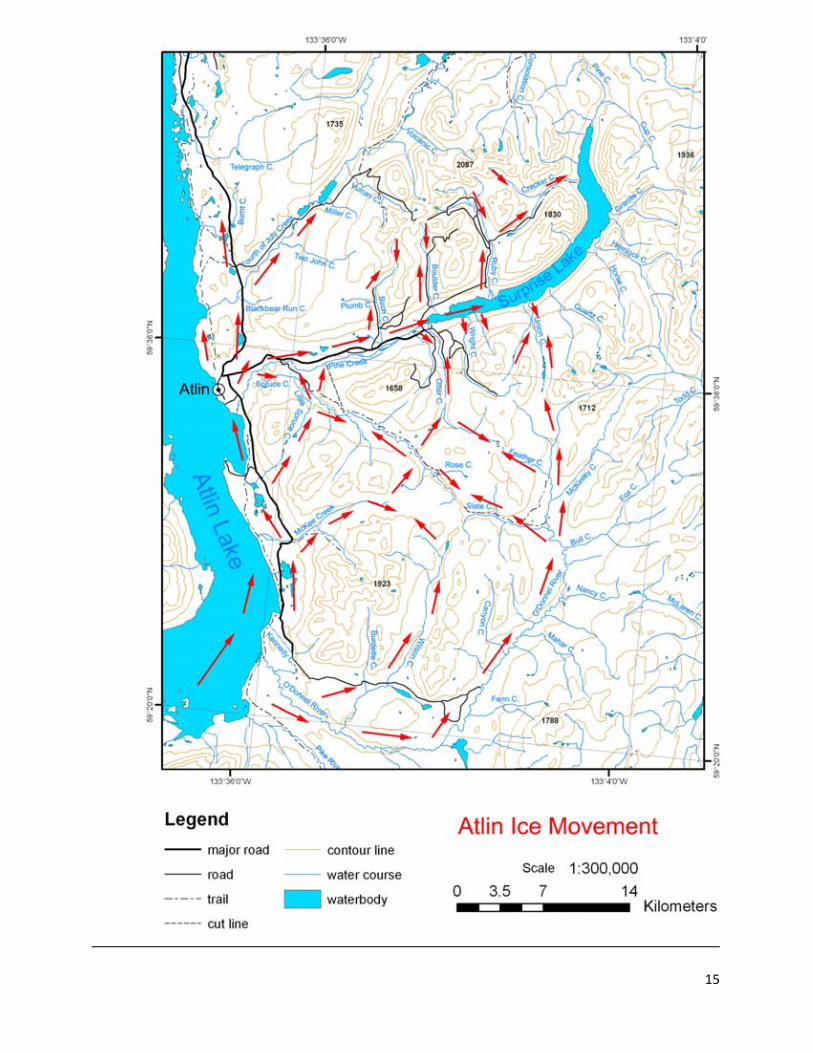
Figure below: Atlin Ice Movement14
14 Black, J. M.: Report in the Atlin Placer Camp, 1953 and Ph. Moll, Arctic Geophysics Inc
15

16
8. Profile image
In the Resistivity profile the interpreted layer interfaces are marked with a black line. The
profiles show ground-layers approximately 15% thicker than they are in reality. The thickening of
the model layers is caused by the inversion software. The correction factor of 0.85 for the
determination of the true layer thickness has been established by the Arctic Geophysics Inc.
team on the basis of numerous geoelectrical profiles verified by drilling, trenching, and mining
done by our customers.15
The graphical markings showing the interpreted layer interfaces in the profiles (using a black
line) are done according to the data structure in the profile itself. This means: the layers there
will also show up approximately 15% thicker than they are expected in reality. At the measuring
sticks in the profile image as well as in the interpretation text, the layer thicknesses and depths
have been recalculated to the expected real values.
9. Line Arrangement
The line locations were discussed and decided upon by Stefan Ostermaier from Arctic
Geophysics Inc. and Brian Scott. The goal of the survey was to establish the depth to bedrock
and other mining relevant subsurface information, such as groundwater.
10. Geophysical Implications
The different components of the overburden (till, glaciofluvial/-lacustrine sediments, and non-
glacial alluvium) can hardly be differentiated in the Resistivity profiles, because they show quite
similar resistivity data and are sometimes too thin to be measured. The reason for the similar
resistivity of the overburden materials is the relatively high amount of ground water in the
sediments. The rock components of the gravels, clasts, or boulders show low resistivity itself and
support the similarity of the resistivity.
However, interfaces between different overburden materials can sometimes be detected
anyway. At data interfaces where high conducting overburden layers are sitting on top of low
conducting overburden layers, a clay-rich layer could start downwards acting as a seal layer for
groundwater.
The interface between overburden and bedrock was clearly measured and realistically
interpreted in resistivity models.
15
Program settings in RES2DINV for modifying the layer thickness do frequently not work well for our use and could
falsify the profile. That’s why this mode was not used.

17
11. Placer Targets in Profiles16
Seal-layers (consisting of clay) described in the “Geophysical Implications, could act as “false
bedrock”: The upper part of the clay-layer itself and the material closely on top of it could
contain concentrations of placer gold. The interpreted "false bedrock" layers in the profiles are
not too likely - but the data structures in the resistivity models indicate its possible existence - so
it seems to be reasonable to check the existence of the "false bedrock" since it would be a
promising prospecting target for placer gold, laying shallower than bedrock sources.
Clay layers can also protect the deposits underneath from glacial erosion. So, the material below
a clay-rich layer could have preserved older placers.
Normally, glaciofluvial gravels have much higher potential for placer gold deposits than till,
especially if they reworked pre-existing placers or eroded and re-depositing gold-bearing
bedrock.
The general case is that glacial till will incorporate placer gold into it and dilute rich paystreaks
into a larger volume lower grade deposit which may be uneconomic. So placer gold in till is
actually fairly rare in most settings, and usually only occurs when the glacial activity is right on
top of a bedrock gold source. But this actually may be the case at Pine Creek .
All of the sandy, gravelly, silty, and clay-containing sediments at Pine valley can potentially
contain placer gold. Each new sediment discovered when doing physical prospecting would be
worth sampling.
16
Discussion between William LeBarge and Philipp Moll

18
12. Survey Map

19
13. Interpretation of Profiles
Pine Creek 01

20
Interpretation
Resistivity profile_01 (2012) might show 26-41m of overburden on top of
bedrock.
Below the surface we see a low conducting layer (overburden1), 0.5-6m
thick, most likely representing dry compacted gravel. This gravel seem to be
modern stream gravel on top of glacial till and glaciofluvial deposits.17
The second layer (overburden2) is very well conducting as a result of high
water-saturation of this gravel-dominated material.18 This gravel deposit is
most likely a mosaic of glacial till, glaciofluvial deposits, and possibly
glaciolacustrine sediments. Because of the high water content these
different materials cannot be differentiated in the resistivity model. Just at
around 400m in the profile a glaciolacustrine inter-layer (turquoise), 6m
deep, consisting of mainly clay ("false bedrock") could be located. However,
more clay-rich layers, too thin to be measured, could sit in this gravel
deposit acting as "false bedrock".
The third layer (overburden3) could be a sediment rich in fine materials such
as silt and clay. So this layer could be a seal layer for groundwater acting as
"false bedrock" again.
The likeliness of this scenario (a gravel deposit underlain by a clay-rich
deposit) would be supported by the following aspect: The overburden is
relatively thick at this profile location; here the glacial erosion must have
17
The existence of a dry compacted topmost gravel layer was verified in 2010 when
running a resistivity profile nearby which was dug by Al Dendys up to a depth of
about 3m. 18
The existence of a highly water-saturated gravel layer was verified in 2010 when
running a resistivity profile nearby which was dug by Al Dendys up to a depth of
about 3m. The groundwater was quite mobile and did drain quickly into the
excavated hole.
been lower than at the valley floor a bit more southern.19 The ice move
seems to have left a large lateral moraine at the right limit of the valley
(north) which was not too much eroded by the meltwater flow. This lateral
moraine and the ice on top of it could have been a barrier for meltwater in
the northern part of the valley. This way glaciolacustrine clay-/silt-rich
sediments could have been deposited along this profile. - Alternatively, the
relatively thick overburden in this profile could be dominated by just till and
glaciofluvial deposits. Both theories sound realistic.
At 200-260m a 41m deep paleochannel in bedrock seems to be located. This
deep channel could have been formed by the ice move in an earlier glacial
cycle or by a powerful glaciofluvial stream running before the
glaciolacustrine deposition has started. It is not unlikely that this channel is
pre-glacial, filled with original river gravel on the bottom which has been
preserved from the glacial erosion.20
Around 400m we see another bedrock depression, approx. 38m deep, which
most likely does have a glacial origin, with mainly glaciofluvial influence.
The bedrock shows relatively homogeneous, high resistivity in the same
range as at Resistivity profile_01 (2010). This bedrock seems to consist of
Oceanic crustal ultramafic rocks: peridotite, dunite, pyroxenite, generally
serpentized; locally includes pods of nephrite jade and small bodies of
listwanite, rodingite and talc.21
19
See Resistivity profile_02 (2012) and profile_01 (2010) 20
Compare J.M. Black: 7.2. Physiography, Glaciation at Pine Creek 21
Bedrock Geology Map

21
Pine Creek 02

22
Interpretation
Resistivity profile_02 (2012) might show 5-26m of overburden on top of
bedrock.
At 0-240m we see again the low conducting material (overburden1), here 3-
8m thick, on the surface: It should be again dry gravel consisting of modern
stream gravel on top of glacial till and glaciofluvial deposits.
At 240-400m the topmost layer (overburden2), 5-13m thick, is very well
conducting: This material is highly saturated with groundwater and should
be also modern stream gravel on top of glacial till and glaciofluvial deposits.
Alternatively, overburden2 could be a clay-/silt-rich glaciolacustrine deposit.
At least in the middle of the profile, around 240m, there must be some clay
to seal the groundwater at overburden2 against overburden1.
After 400m the overburden seems to become thicker. This accords with
profile_01 showing a thickening of the overburden towards the northern
side of the valley.
At 90-260m an U-shaped channel, around 25m deep, is sitting in the
bedrock. This channel must have been produced by glacial erosion (ice
move) since lot's of energy is needed to deform a hard bedrock type in such
a distinctive way. This channel is located on the valley floor where the "large
hydraulic cut on the central part of Pine Valley"22 was formed. This channel
must be filled with till and a larger amount of glaciofluvial gravel - possibly
sitting above pre-glacial river gravel which has been preserved.23 In case this
channel is filled with 100% glacial deposits, a glaciofluvial stream likely has
deepened this ice-formed channel at its left limit, at around 105m. Despite
22
Compare J.M. Black: 7.2. Physiography, Glaciation at Pine Creek 23
Ditto
the large grade of erosion (by both ice move and meltwater flow) it is not
impossible that glaciolacustrine clay/silt was deposited in this bedrock
depression this would be possible when ice damming would have hindered
the meltwater flow.
After 250m two bedrock benches, formed like stairs, 13 and 5m deep, are
located. The surface of the bedrock is also leveled which is typical for glacial
erosion by ice. A significant amount of glaciofluvial deposits sitting in these
benches would be quite likely.
After 400m a bedrock bench, approx 11m deep, goes down. It might show
the same overburden complex.
After 450m a next deeper bedrock bench seems to start.
The bedrock shows relatively homogeneous, high resistivity in the same
range as at Resistivity profile_01 (2010). This bedrock seems to consist of
Oceanic crustal ultramafic rocks: peridotite, dunite, pyroxenite, generally
serpentized; locally includes pods of nephrite jade and small bodies of
listwanite, rodingite and talc.24
24
Bedrock Geology Map

23
14. Qualifications
Philipp Moll Box 747, Dawson City, Yukon, Y0B 1G0 Phone: 001-867-993 3671 (Canada) 01149 (0)781 970 5893 (Germany) Email: [email protected]
Certificate of Qualifications I, Philipp Moll, currently residing at “Am Holderstock 7, 77652 Offenburg, Germany, do hereby certify that: 1. I have studied Geology at the University of Freiburg, Germany. 2. I have visited of geophysical field courses at the University of Karlsruhe in Germany.
3. I have been working for Arctic Geophysics Inc. since June 2007 (foundation). For this company I have
carried out geophysical field surveys using 2D Resistivity, Induced Polarization, and Magnetics: Data
acquisition, processing, interpretation, documentation.
4. I have done geophysical surveying for mining exploration in the Yukon since 2005, and geological
prospecting for precious metals and minerals in the Yukon, NWTs, and Alaska since 1989
5. I have written the following publications/reports:
A) Numerous Assessment Reports about geophysical surveys done for Yukon mining companies,
filed at Yukon Mining Recorder, Dawson City and Whitehorse, Yukon.
B) Publication about a geophysical survey (45 field days) for the Yukon Government: Yukon
Geological Survey:
http://www.geology.gov.yk.ca/recent.html Open Files:
Moll, P., & Ostermaier, S., 2010. 2D Resistivity/IP Data Release for Placer Mining and shallow
Quartz Mining - Yukon 2010. Yukon Geological Survey Miscellaneous Report MR-4. PDF Report
[10.3 MB ] & Data Profiles, 45.4 MB ] ]
15. Confirmation I have prepared this report entitled 2D Resistivity Survey on the Pine Creek Property for assessment
credit, and reviewed the data contained in the report titled: “Geophysical Survey with 2D Resistivity
Pine Creek, British Columbia”. The survey was carried out by Arctic Geophysics Inc.
Offenburg, Germany, 21st September 2012 “Signed and Sealed” Philipp Moll
____________________________________
Philipp Moll

24
Appendix
Literature
Location-specific
Asg, C. H.: Origin and Tectonic Setting of Rocks in the Atlin Area, BC (NTS104N), Ophiolitic, Ultramafic and
Related, Geological Survey Branch, Bulletin 94, 1994
Black, J. M.: Report in the Atlin Placer Camp, 1953
British Columbia Geological Survey Branch, Bulletin 105v25C05, Chapter 5
KERR, DAWSON AND ASSOCIATES LTD. 1984 “GEOLOGICAL, GEOCHEMICAL AND GEOPHYSICAL REPORT - on the –
EAGLE, MARGARITA AND BUTTERFLY CLAIMS, ATLIN MINING DIVISION, BRITISH COLUMBIA”
W. Gruenwald, B. Sc.: Geological, Geochemical and Geophysical Report on the Eagle, Margarita and Butterfly
Claims, Atlin Mining Division, BC, 1984
Literature – Background
Chesterman W. Ch. and Lowe K.E. Field Guide to Rocks and Minerals - North America, Chanticleer Press Inc. New
York 2007
Evans A.M. Erzlagerstättenkunde, Ferdinand Enke Verlag Stuttgart (1992)
Griffiths, D.H.,Turnbull, J. and Olayinka,A.I. Two dimensional resistivity mapping with a computer-controlled array,
First Break 8: 121-129 (1990)
Griffiths, D.H. and Barker, R.D. Two-dimensional resistivity imaging and modeling in areas of complex geology.
Journal of Applied Geophysics 29 : 211 - 226. (1993)
Keller, G.V.and Frischknecht, F.C. Electrical methods in geophysical prospecting. Oxford: Pergamon Press Inc.
(1966)
Loke M.H. and Barker R.D. Rapid least-squares inversion of apparent resistivity pseudosections by a quasi-Newton
method. Geophysical Prospecting 44: 131-152 (1996)
Ostensoe Eric A. “Report on the Gladstone Creek, Placer Gold Property, Kluane Area” (Feb 1984), for: CATEAR
RESOURCES LTD.
Press F., Siever R., Grotzinger J., Thomas H.J. Understanding Earth, W.H. Freeman and Company, New York (2004)
Robb L. Introducing to Ore-Forming Processes, Backwell Science Ltd., 2005

25
Maps
Massey, N.W.D., MacIntyre, D.G., Desjardins, P.J. and Cooney, R.T., 2005: Digital Geology Map of British Columbia:
Tile NO8 Northwest B.C., B.C. Ministry of Energy and Mines, Geofile, 2005-8, scale 1:250,000
British Columbia: Whole Province, B.C. Ministry of Energy and Mines, Geofile 2005-1,scale 1:250,000
Geophysical Data Table

26
List of Costs
2012 Statement of Costs Pine Creek Geophysical Program
Project Conducted from May 25th to May 26th 2012
Date Item Contractor Description Days Km Item Cost Total
25-26.05.2012 Geophysical Lines Arctic Geophysics Inc. Field Crew (2 people) 2.0 $1 186.50 $2 373.00
Transportation Arctic Geophysics Inc. Vehicle 2.25 $73.50 $165.38
(2 people) 0.25
$472.48 $118.12
Kilometres 200.00
$0.55
plus GST $115.50
Accommodation and
meals
$490.00
Sub-Total
$3.262.00
Report
Data Arctic Geophysics Inc. Data processing, interpretation
$367.50
Report Arctic Geophysics Inc. Report Preparation
$735.00
Sub-Total
$1 102.50
Total Value of Work
$4 364.50
Total Person Days = 4

27
GPS-Data
Pine Creek 01
Electrode
No.
Location
in Profile
[m]
GPS-
Coordinates
UTM Zone 8
NAD 83
GPS-Accuracy
[m]
Post
[ * ]
1 0.0 585209, 6608762 3 *
2 5.0 585206, 6608768 3
3 10.0 585205, 6608772 3
4 15.0 585205, 6608772 3
5 20.0 585206, 6608778 3
6 25.0 585207, 6608785 3
7 30.0 585207, 6608791 3
8 35.0 585208, 6608796 3
9 40.0 585209, 6608801 3
10 45.0 585209, 6608805 3
11 50.0 585208, 6608808 3
12 55.0 585209, 6608813 3
13 60.0 585209, 6608817 3
14 65.0 585211, 6608824 3
15 70.0 585210, 6608829 3
16 75.0 585209, 6608836 3
17 80.0 585210, 6608840 3
18 85.0 585208, 6608842 3
19 90.0 585209, 6608846 3
20 95.0 585211, 6608852 3
21 100.0 585211, 6608856 3
22 105.0 585211, 6608861 3
23 110.0 585215, 6608869 3
24 115.0 585213, 6608873 3
25 120.0 585213, 6608876 3
26 125.0 585214, 6608881 3
27 130.0 585213, 6608886 3
28 135.0 585215, 6608891 3
29 140.0 585215, 6608897 3
30 145.0 585215, 6608904 3
31 150.0 585216, 6608907 3
32 155.0 585217, 6608910 3
33 160.0 585217, 6608914 3
34 165.0 585217, 6608920 3
35 170.0 585218, 6608925 3
36 175.0 585219, 6608931 3
37 180.0 585220, 6608937 3
38 185.0 585219, 6608942 3
39 190.0 585220, 6608948 3
40 195.0 585220, 6608954 3
41 200.0 585222, 6608958 3
Electrode
No.
Location
in Profile
[m]
GPS-
Coordinates
UTM Zone 8
NAD 83
GPS-Accuracy
[m]
Post
[ * ]
42 205.0 585223, 6608963 3
43 210.0 585223, 6608968 3
44 215.0 585224, 6608972 3
45 220.0 585224, 6608977 3
46 225.0 585225, 6608982 3
47 230.0 585226, 6608986 3
48 235.0 585228, 6608991 3
49 240.0 585228, 6608996 3
50 245.0 585228, 6609001 3
51 250.0 585227, 6609007 3 *
52 255.0 585227, 6609011 3
53 260.0 585228, 6609017 3
54 265.0 585228, 6609022 3
55 270.0 585229, 6609026 3
56 275.0 585229, 6609031 3
57 280.0 585230, 6609037 3
58 285.0 585230, 6609042 3
59 290.0 585230, 6609047 3
60 295.0 585231, 6609053 3
61 300.0 585230, 6609057 3
62 305.0 585230, 6609062 3
63 310.0 585234, 6609065 3
64 315.0 585232, 6609071 3
65 320.0 585233, 6609077 3
66 325.0 585232, 6609083 3
67 330.0 585231, 6609088 3
68 335.0 585232, 6609094 3
69 340.0 585232, 6609097 3
70 345.0 585233, 6609100 3
71 350.0 585234, 6609105 3
72 355.0 585234, 6609111 3
73 360.0 585233, 6609118 3
74 365.0 585234, 6609123 3
75 370.0 585233, 6609126 3
76 375.0 585233, 6609132 3
77 380.0 585236, 6609134 3
78 385.0 585236, 6609142 3
79 390.0 585232, 6609146 3
80 395.0 585232, 6609153 3
81 400.0 585232, 6609155 3
82 405.0 585233, 6609160 3

28
Electrode
No.
Location
in Profile
[m]
GPS-
Coordinates
UTM Zone 8
NAD 83
GPS-Accuracy
[m]
Post
[ * ]
83 410.0 585233, 6609164 3
84 415.0 585231, 6609171 3
85 420.0 585230, 6609175 3
86 425.0 585233, 6609179 3
87 430.0 585232, 6609182 3
88 435.0 585232, 6609188 3
89 440.0 585230, 6609195 3
Electrode
No.
Location
in Profile
[m]
GPS-
Coordinates
UTM Zone 8
NAD 83
GPS-Accuracy
[m]
Post
[ * ]
90 445.0 585230, 6609198 3
91 450.0 585231, 6609203 3
92 455.0 585232, 6609207 3
93 460.0 585231, 6609214 3
94 465.0 585230, 6609219 3
95 470.0 585230, 6609224 3
96 475.0 585231, 6609229 3 *
Pine Creek 02
Electrode
No.
Location
in Profile
[m]
GPS-
Coordinates
UTM Zone 8
NAD 83
GPS-Accuracy
[m]
Post
[ * ]
1 0.0 584966, 6608257 3 *
2 5.0 584964, 6608262 3
3 10.0 584961, 6608266 3
4 15.0 584959, 6608271 3
5 20.0 584957, 6608271 3
6 25.0 584954, 6608275 3
7 30.0 584952, 6608279 3
8 35.0 584950, 6608283 3
9 40.0 584947, 6608287 3
10 45.0 584944, 6608291 3
11 50.0 584942, 6608294 3
12 55.0 584940, 6608298 3
13 60.0 584938, 6608302 3
14 65.0 584935, 6608307 3
15 70.0 584932, 6608311 3
16 75.0 584929, 6608316 3
17 80.0 584927, 6608320 3
18 85.0 584924, 6608325 3
19 90.0 584921, 6608329 3
20 95.0 584919, 6608332 3
21 100.0 584918, 6608335 3
22 105.0 584915, 6608340 3
23 110.0 584912, 6608344 3
24 115.0 584910, 6608349 3
25 120.0 584908, 6608352 3
26 125.0 584904, 6608362 3
Electrode
No.
Location
in Profile
[m]
GPS-
Coordinates
UTM Zone 8
NAD 83
GPS-Accuracy
[m]
Post
[ * ]
27 130.0 584903, 6608366 3
28 135.0 584902, 6608369 3
29 140.0 584900, 6608373 3
30 145.0 584896, 6608377 3
31 150.0 584893, 6608381 3
32 155.0 584893, 6608386 3
33 160.0 584890, 6608390 3
34 165.0 584887, 6608395 3
35 170.0 584885, 6608400 3
36 175.0 584883, 6608405 3
37 180.0 584881, 6608409 3
38 185.0 584878, 6608416 3
39 190.0 584876, 6608420 3
40 195.0 584875, 6608425 3
41 200.0 584872, 6608429 3
42 205.0 584870, 6608432 3
43 210.0 584868, 6608436 3
44 215.0 584866, 6608443 3
45 220.0 584864, 6608445 3
46 225.0 584861, 6608450 3
47 230.0 584857, 6608454 3
48 235.0 584854, 6608457 3
49 240.0 584852, 6608463 3
50 245.0 584849, 6608467 3
51 250.0 584846, 6608471 3 *
52 255.0 584844, 6608475 3

29
Electrode
No.
Location
in Profile
[m]
GPS-
Coordinates
UTM Zone 8
NAD 83
GPS-Accuracy
[m]
Post
[ * ]
53 260.0 584840, 6608479 3
54 265.0 584838, 6608484 3
55 270.0 584836, 6608490 3
56 275.0 584833, 6608494 3
57 280.0 584832, 6608497 3
58 285.0 584829, 6608502 3
59 290.0 584825, 6608507 3
60 295.0 584822, 6608509 3
61 300.0 584819, 6608514 3
62 305.0 584816, 6608518 3
63 310.0 584814, 6608522 3
64 315.0 584812, 6608527 3
65 320.0 584809, 6608532 3
66 325.0 584805, 6608535 3
67 330.0 584802, 6608538 3
68 335.0 584799, 6608542 3
69 340.0 584797, 6608546 3
70 345.0 584794, 6608550 3
71 350.0 584791, 6608555 3
72 355.0 584789, 6608559 3
73 360.0 584786, 6608563 3
74 365.0 584783, 6608566 3
Electrode
No.
Location
in Profile
[m]
GPS-
Coordinates
UTM Zone 8
NAD 83
GPS-Accuracy
[m]
Post
[ * ]
75 370.0 584781, 6608571 3
76 375.0 584779, 6608575 3
77 380.0 584776, 6608579 3
78 385.0 584773, 6608584 3
79 390.0 584770, 6608589 3
80 395.0 584766, 6608593 3
81 400.0 584764, 6608596 3
82 405.0 584762, 6608601 3
83 410.0 584760, 6608605 3
84 415.0 584758, 6608609 3
85 420.0 584755, 6608614 3
86 425.0 584752, 6608617 3
87 430.0 584750, 6608621 3
88 435.0 584747, 6608626 3
89 440.0 584745, 6608630 3
90 445.0 584742, 6608634 3
91 450.0 584738, 6608638 3
92 455.0 584735, 6608643 3
93 460.0 584733, 6608646 3
94 465.0 584731, 6608650 3
95 470.0 584728, 6608654 3
96 475.0 584725, 6608659 3 *

30