Gene-Lifestyle Interaction and Type 2 Diabetes: The EPICInterAct Case-Cohort StudyClaudia Langenberg1.*, Stephen J. Sharp1., Paul W. Franks2,3., Robert A. Scott1, Panos Deloukas4,
Nita G. Forouhi1, Philippe Froguel5, Leif C. Groop6,7, Torben Hansen8,9, Luigi Palla1, Oluf Pedersen8,10,11,
Matthias B. Schulze12, Maria-Jose Tormo13,14,15, Eleanor Wheeler4, Claudia Agnoli16,
Larraitz Arriola14,17,18, Aurelio Barricarte14,19, Heiner Boeing12, Geraldine M. Clarke20, Francoise Clavel-
Chapelon21,22, Eric J. Duell23, Guy Fagherazzi21,22, Rudolf Kaaks24, Nicola D. Kerrison1, Timothy J. Key25,
Kay Tee Khaw26, Janine Kroger12, Martin Lajous21,27,28, Andrew P. Morris20, Carmen Navarro13,14,29,
Peter M. Nilsson2, Kim Overvad30,31, Domenico Palli32, Salvatore Panico33, J. Ramon Quiros34,
Olov Rolandsson3, Carlotta Sacerdote35,36,37, Marıa-Jose Sanchez14,38, Nadia Slimani39,
Annemieke M. W. Spijkerman40, Rosario Tumino41,42, Daphne L. van der A40, Yvonne T. van der
Schouw43, Ines Barroso4,44, Mark I. McCarthy20,45,46, Elio Riboli47, Nicholas J. Wareham1*
1 Medical Research Council Epidemiology Unit, University of Cambridge, Cambridge, United Kingdom, 2 Lund University, Malmo, Sweden, 3 Umea University, Umea,
Sweden, 4 The Wellcome Trust Sanger Institute, Cambridge, United Kingdom, 5 Imperial College London, London, United Kingdom, 6 University Hospital Scania, Malmo,
Sweden, 7 Institute for Molecular Medicine Finland, University of Helsinki, Helsinki, Finland, 8 The Novo Nordisk Foundation Center for Basic Metabolic Research, Faculty of
Health and Medical Sciences, University of Copenhagen, Copenhagen, Denmark, 9 Faculty of Health Sciences, University of Southern Denmark, Odense, Denmark,
10 Faculty of Health Science, University of Aarhus, Aarhus, Denmark, 11 Institute of Biomedical Science, Faculty of Health Sciences, University of Copenhagen,
Copenhagen, Denmark, 12 German Institute of Human Nutrition, Potsdam-Rehbruecke, Germany, 13 Department of Epidemiology, Murcia Regional Health Council,
Murcia, Spain, 14 Consorcio de Investigacion Biomedica de Epidemiologıa y Salud Publica, Instituto de Salud Carlos III, Madrid, Spain, 15 Department of Health and Social
Sciences, Universidad de Murcia, Spain, 16 Epidemiology and Prevention Unit, Milan, Italy, 17 Public Health Division of Gipuzkoa, San Sebastian, Spain, 18 Instituto de
Investigacion Sanitaria BioDonostia, Basque Government, San Sebastian, Spain, 19 Navarre Public Health Institute, Pamplona, Spain, 20 Wellcome Trust Centre for Human
Genetics, University of Oxford, Oxford, United Kingdom, 21 Inserm, CESP U1018, Villejuif, France, 22 Universite Paris-Sud, UMRS 1018, Villejuif, France, 23 Catalan Institute
of Oncology, Bellvitge Biomedical Research Institute, Barcelona, Spain, 24 German Cancer Research Center, Heidelberg, Germany, 25 University of Oxford, Oxford, United
Kingdom, 26 University of Cambridge, Cambridge, United Kingdom, 27 Center for Research on Population Health, National Institute of Public Health of Mexico,
Cuernavaca, Mexico, 28 Department of Epidemiology, Harvard School of Public Health, Boston, Massachusetts, United States of America, 29 Unit of Preventive Medicine
and Public Health, School of Medicine, University of Murcia, Murcia, Spain, 30 Department of Public Health, Aarhus University, Aarhus, Denmark, 31 Aalborg University
Hospital, Aalborg, Denmark, 32 Cancer Research and Prevention Institute, Florence, Italy, 33 Dipartimento di Medicina Clinica e Chirurgia, Federico II University, Naples,
Italy, 34 Public Health Directorate, Asturias, Spain, 35 Unit of Cancer Epidemiology, Azienda Ospedaliero Universitaria Citta della Salute e della Scienza, University of Turin,
Turin, Italy, 36 Piedmont Reference Center for Epidemiology and Cancer Prevention, Torino, Italy, 37 Human Genetics Foundation, Torino, Italy, 38 Andalusian School of
Public Health, Granada, Spain, 39 International Agency for Research on Cancer, Lyon, France, 40 National Institute for Public Health and the Environment, Bilthoven, The
Netherlands, 41 Azienda Sanitaria Provinciale di Ragusa, Ragusa, Italy, 42 Aire Onlus, Ragusa, Italy, 43 University Medical Center Utrecht, Utrecht, The Netherlands,
44 University of Cambridge Metabolic Research Laboratories, Cambridge, United Kingdom, 45 Oxford Centre for Diabetes, Endocrinology and Metabolism, University of
Oxford, United Kingdom, 46 NIHR Oxford Biomedical Research Centre, Oxford, United Kingdom, 47 School of Public Health, Imperial College London, London, United
Kingdom
Abstract
Background: Understanding of the genetic basis of type 2 diabetes (T2D) has progressed rapidly, but the interactionsbetween common genetic variants and lifestyle risk factors have not been systematically investigated in studies withadequate statistical power. Therefore, we aimed to quantify the combined effects of genetic and lifestyle factors on risk ofT2D in order to inform strategies for prevention.
Methods and Findings: The InterAct study includes 12,403 incident T2D cases and a representative sub-cohort of 16,154individuals from a cohort of 340,234 European participants with 3.99 million person-years of follow-up. We studied thecombined effects of an additive genetic T2D risk score and modifiable and non-modifiable risk factors using Prentice-weighted Cox regression and random effects meta-analysis methods. The effect of the genetic score was significantlygreater in younger individuals (p for interaction = 1.2061024). Relative genetic risk (per standard deviation [4.4 risk alleles])was also larger in participants who were leaner, both in terms of body mass index (p for interaction = 1.5061023) and waistcircumference (p for interaction = 7.4961029). Examination of absolute risks by strata showed the importance of obesity forT2D risk. The 10-y cumulative incidence of T2D rose from 0.25% to 0.89% across extreme quartiles of the genetic score innormal weight individuals, compared to 4.22% to 7.99% in obese individuals. We detected no significant interactionsbetween the genetic score and sex, diabetes family history, physical activity, or dietary habits assessed by a Mediterraneandiet score.
Conclusions: The relative effect of a T2D genetic risk score is greater in younger and leaner participants. However, this sub-group is at low absolute risk and would not be a logical target for preventive interventions. The high absolute riskassociated with obesity at any level of genetic risk highlights the importance of universal rather than targeted approachesto lifestyle intervention.
Please see later in the article for the Editors’ Summary.
PLOS Medicine | www.plosmedicine.org 1 May 2014 | Volume 11 | Issue 5 | e1001647

Citation: Langenberg C, Sharp SJ, Franks PW, Scott RA, Deloukas P, et al. (2014) Gene-Lifestyle Interaction and Type 2 Diabetes: The EPIC InterAct Case-CohortStudy. PLoS Med 11(5): e1001647. doi:10.1371/journal.pmed.1001647
Academic Editor: Andrew T. Hattersley, University of Exeter, United Kingdom
Received September 27, 2013; Accepted April 11, 2014; Published May 20, 2014
Copyright: � 2014 Langenberg et al. This is an open-access article distributed under the terms of the Creative Commons Attribution License, which permitsunrestricted use, distribution, and reproduction in any medium, provided the original author and source are credited.
Data Availability: The authors confirm that all data underlying the findings are available by request to NJW at the MRC Epidemiology Unit.
Funding: No funding bodies had any role in study design, data collection and analysis, decision to publish, or preparation of the manuscript. Funding for theInterAct project was provided by the EU FP6 programme (grant number LSHM_CT_2006_037197). In addition, InterAct investigators acknowledge funding fromthe following agencies: PWF: Swedish Research Council, Novo Nordisk, Swedish Diabetes Association, Swedish Heart-Lung Foundation; PD: Work was supportedby the Wellcome Trust; LCG: Swedish Research Council; MJT: Health Research Fund (FIS) of the Spanish Ministry of Health; Murcia Regional Government (Nu 6236);LA: EJD: The Spanish Ministry of Health – ISCII RETICC RD06/0020; RK: German Cancer Aid, German Ministry of Research (BMBF); TJK: Cancer Research UK; KTK:Medical Research Council UK, Cancer Research UK; APM: Wellcome Trust grant numbers WT098017 and WT090532; CN: Health Research Fund (FIS) of the SpanishMinistry of Health; Murcia Regional Government (Nu 6236); PMN: Swedish Research Council; KO: Danish Cancer Society; SP: Compagnia di San Paolo; JRQ: AsturiasRegional Government; OR: The Vasterboten County Council; AMWS and DLvdA: Dutch Ministry of Public Health, Welfare and Sports (VWS), Netherlands CancerRegistry (NKR), LK Research Funds, Dutch Prevention Funds, Dutch ZON (Zorg Onderzoek Nederland), World Cancer Research Fund (WCRF), Statistics Netherlands;RT: AIRE-ONLUS Ragusa, AVIS-Ragusa, Sicilian Regional Government; YTvdS: Verification of diabetes cases was additionally funded by NL Agency grant IGE05012and an Incentive Grant from the Board of the UMC Utrecht; IB: Wellcome Trust grant 098051 and United Kingdom NIHR Cambridge Biomedical Research Centre;MIM: InterAct, Wellcome Trust (083270/Z/07/Z), MRC (G0601261); ER: Imperial College Biomedical Research Centre.
Competing Interests: IB and her spouse own stock in the companies GlaxoSmithKline (GSK) and Incyte (INCY). LCG and MIM are members of the Editorial Boardof PLOS Medicine.
Abbreviations: BMI, body mass index; DPP, Diabetes Prevention Program; EPIC, European Prospective Investigation into Cancer and Nutrition; HR, hazard ratio;SD, standard deviation; T2D, type 2 diabetes; WC, waist circumference.
* E-mail: [email protected] (CL); [email protected] (NJW)
. These authors contributed equally to this work.
Introduction
Diabetes is currently estimated to affect 382 million people
worldwide [1], with severe consequences for the health and
economy of developed and developing nations alike. Type 2
diabetes (T2D) is thought to originate from an interplay between
genetic and lifestyle factors, an hypothesis first put forward 50
years ago [2]. Lifestyle interventions can reduce the risk of
progression to diabetes in high-risk individuals by 50% or more
[3–6]; however, whether the consequences of adverse lifestyles
differ according to the underlying genetic susceptibility to T2D
remains uncertain.
Considerable progress has been made recently in the discovery
of the genetic basis of T2D and related metabolic traits [7], which
now enables formal investigation of the interaction between genes
and lifestyle in the risk of developing T2D. The Diabetes
Prevention Program (DPP) study detected no significant interac-
tions between treatment groups and genetic risk assessed on the
basis of 34 T2D loci established at the time [8]. However, this
study included only high-risk individuals and may have been
underpowered because of the small number of people in each sub-
group (947 in the placebo group, 955 in the lifestyle intervention
group, and the 941 metformin group), even in this relatively large
intervention trial. A complementary approach to the analysis of
lifestyle trials is the investigation of interactions between genetic
and lifestyle factors in observational cohort studies. However, such
interactions have not been systematically investigated in prospec-
tive cohorts with standardised assessment of lifestyle factors at
baseline and adequate statistical power. We therefore sought to
investigate this question in a large case-cohort study nested within
the European Prospective Investigation into Cancer and Nutrition
(EPIC) study.
Methods
Ethics StatementAll participants gave written informed consent, and the study
was approved by the local ethics committees in the participating
countries and the Internal Review Board of the International
Agency for Research on Cancer.
PopulationThe design and methods of the InterAct case-cohort study have
previously been described [9]. InterAct is a case-cohort study
nested within the EPIC cohort, and the project involves 29
institutions in nine European countries. Ascertainment of incident
T2D involved a review of the existing EPIC datasets at each centre
using multiple sources of evidence including self-report, linkage to
primary-care registers, secondary-care registers, medication use
(drug registers), hospital admissions, and mortality data. Informa-
tion from any follow-up visit or external evidence with a date later
than the baseline visit was used. To increase the specificity of the
case definition, we sought further evidence for all cases with
information on incident T2D from fewer than two independent
sources, including seeking information via individual medical
records review in some centres. Cases in Denmark and Sweden
were not ascertained by self-report, but identified via local and
national diabetes and pharmaceutical registers, and hence all
ascertained cases were considered to be verified. Follow-up was
censored at the date of diagnosis, 31 December 2007, or the date
of death, whichever occurred first. All ascertained cases with any
evidence of diabetes at baseline were excluded. Prevalent diabetes
was identified on the basis of baseline self-report of a history of
diabetes, doctor-diagnosed diabetes, diabetes drug use, or evidence
of diabetes after baseline with a date of diagnosis earlier than the
baseline recruitment date.
A total of 340,234 participants of European descent were
followed up for 3.99 million person-years (mean [range] follow-up
of 11.7 [0–17.5] y), during which 12,403 verified incident cases of
T2D were identified [1]. Individuals without stored blood
(n = 109,625) or without reported diabetes status (n = 5,821) were
excluded. A centre-stratified, random sub-cohort of 16,835
individuals was selected. After exclusion of 548 individuals with
prevalent diabetes and 133 with unknown diabetes status, the sub-
cohort included 16,154 individuals for analysis. By design, because
of the random selection, this sub-cohort also included a set of 778
individuals who developed incident T2D during follow-up.
Participants in the random sub-cohort were similar to all EPIC
participants eligible for inclusion in InterAct [9]. InterAct cases
were followed-up for a mean (standard deviation [SD]) of 6.9 (3.3)
Gene-Lifestyle Interaction and Type 2 Diabetes
PLOS Medicine | www.plosmedicine.org 2 May 2014 | Volume 11 | Issue 5 | e1001647
y, and 49.8% were men. The overall incidence of T2D in InterAct
was 3.8 per 1,000 person-years of follow-up.
MeasurementsWeight and height were measured with participants not
wearing shoes and in light clothing or underwear in the majority
of centres [10]. Waist circumference (WC) was measured either at
the narrowest circumference of the torso or at the midpoint
between the lower ribs and the iliac crest. Hip circumference was
measured horizontally at the level of the largest lateral extension
of the hips or over the buttocks. For a subset of the Oxford
participants (n = 363), only self-reported waist and hip circum-
ferences were available. Each participant’s body weight and waist
and hip circumferences were corrected for the clothing worn
during measurement in order to reduce heterogeneity due to
protocol differences among centres. Correction included adjust-
ment for self-reporting in Oxford participants using a prediction
equation based on a comparison of self-reported and measured
data in a sample of 5,000 of the Oxford general population
[10,11]. Body mass index (BMI) was calculated as weight (kg)/
height (m) squared. Waist–hip ratio was calculated and expressed
as a percentage. Measures of waist and hip circumference were
not performed in Umea, Sweden (n = 1,845), and were missing in
an additional 173 and 193 InterAct participants, respectively
[12].
Standardised information was collected by questionnaire at
baseline on education, smoking status [13], and diabetes family
history [14]. Physical activity was based on a brief questionnaire
covering occupation and recreational activity, which was
summarised into an ordered categorical overall physical activity
index (inactive, moderately inactive, moderately active, and
active) that has been validated in the populations participating
in EPIC [15,16]. In one of the centres (Umea, Sweden), a
slightly different questionnaire was used to assess physical
activity. From this questionnaire we derived a four-category
index similar to that derived from all other study locations based
on two questions on occupational and leisure time physical
activity [16].
Usual food intake was estimated using country-specific validated
dietary questionnaires. Estimated individual nutrient intakes were
derived from foods included in the dietary questionnaires through
the standardised EPIC Nutrient Database [17]. Participants in the
lowest and highest 1% of the cohort distribution of the ratio of
reported total energy intake to energy requirement were excluded
from the current study (n = 736). The Mediterranean dietary
pattern as used here is characterised by a high consumption of
unrefined cereals, fruits, vegetables, olive oil, and legumes; a
moderate consumption of dairy products (mostly cheese and
yogurt); moderate wine consumption; a moderate-to-high con-
sumption of fish; and a low consumption of meat and meat
products [18,19]. Adherence to the Mediterranean diet was
assessed using the relative Mediterranean diet score that has
previously been associated with the risk of incident T2D in
InterAct [20]. This score included nine nutritional components
characteristic of the Mediterranean diet: seven potentially
beneficial components (vegetables, legumes, fruits and nuts,
cereals, fish and seafood, olive oil, and moderate alcohol
consumption) and two potentially detrimental components (meat
and meat products, and dairy products). The overall relative
Mediterranean diet score was divided into categories reflecting low
(0–6 points), medium (7–10 points), and high (11–18 points)
adherence to the Mediterranean diet on the basis of previously
published cutoff points [21].
DNA and GenotypingDNA was not available for Danish (n = 4,037) participants,
leaving a total maximum sample size of 10,348 incident cases and
14,671 random sub-cohort participants with DNA available,
including 13,394 non-diabetic InterAct sub-cohort participants.
Hence, of the original 27,779 InterAct participants, a maximum of
23,742 were eligible for genetic analyses. Of these, a total of
19,651 participants, including 8,582 incident cases and 11,069
non-diabetic sub-cohort participants, had DNA available for
genotyping (Table S1). DNA was extracted from up to 1 ml of
buffy coat for each individual from a citrated blood sample.
Standard procedures on an automated Autopure LS DNA
extraction system (Qiagen) with PUREGENE chemistry (Qiagen)
were used, and the DNA was hydrated overnight prior to further
processing. DNA samples were quantified by PicoGreen assay
(Quant-iT) and normalised to 50 ng/ ml. A total of 10,027
participants (4,644 cases) were selected across all except the
Danish centres for genome-wide genotyping using the Illumina
660W-Quad BeadChip at the Wellcome Trust Sanger Institute.
Samples were randomly selected from those successfully genotyped
on Sequenom or Taqman platforms (based on DNA concentra-
tion, call rate, and gender matching sex chromosome genotype),
with the number of individuals selected per centre being
proportional to the percentage of total cases in that centre. Of
these, a total of 9,431 samples passed quality control criteria
following genome-wide genotyping (call rate .95%, no conflict
between gender and X chromosome heterozygosity, concordant
candidate genotyping, not an outlier for autosomal heterozygosity
or ethnicity), with 99.9% and 99.5% of included samples at call
rates of 97% and 99%, respectively. In addition, 9,794 InterAct
participants with available DNA and not selected for genome-wide
measurement were genotyped using the Illumina Cardio-Meta-
bochip [16]. Genotyping was completed in 9,467 InterAct
samples, with 99.8% and 98.2% of samples at call rates of 97%
and 99%, respectively.
Genotype information and quality metrics for the 49 T2D loci
in the InterAct random sub-cohort are included in Table S4.
Genotype distributions were in Hardy-Weinberg equilibrium using
a Bonferroni-adjusted significance level of p,0.001, with the
exception of rs11063069 (CCND2) in the Illumina 660 W subset
(p = 7.84610213).
We selected all top-ranked SNPs from loci reaching genome-
wide significance for association with T2D in European-descent
populations in the latest DIAGRAM meta-analysis [22]. From a
total of 66 reported T2D-associated variants, we excluded the
DUSP8 locus, which had a parent-of-origin-specific effect [23], in
addition to 15 variants that were significant genome-wide in Asian
populations only. The top-ranked SNP at DUSP9 on the X
chromosome was also unavailable and without a suitable proxy,
and was therefore not included. Hence, a total of 49 variants were
selected for the InterAct genetic score, including two established
obesity loci (FTO and MC4R) and two loci that reached genome-
wide significance in sex-differentiated meta-analyses (CCND2 and
GIPR) [22]. The top-ranked SNP at HNF1B (rs11651052) was not
available on the Illumina 660 W-Quad BeadChip, and a proxy in
high linkage disequilibrium (rs4430796; r2 = 0.97) was used
instead. Risk alleles (Table S4) were summed into a genetic risk
score, including imputation of missing genotypes.
Statistical AnalysesCharacteristics of all InterAct participants and of the random
sub-cohort are summarised, alongside those of individuals who
had DNA available for genotyping, in Tables S2 and S3,
respectively.
Gene-Lifestyle Interaction and Type 2 Diabetes
PLOS Medicine | www.plosmedicine.org 3 May 2014 | Volume 11 | Issue 5 | e1001647

Main Genetic Effect AnalysesAssociations between the published T2D risk allele for each
SNP (Table S4) and incident T2D were estimated using Prentice-
weighted Cox regression models, separately within each country,
with age as the underlying time scale, adjusted for sex and centre
and assuming additive genetic effects with the T2D risk allele as
the effect allele [9]. The hazard ratio (HR) for each SNP was
combined across countries using random effects meta-analysis.
Sensitivity analyses were performed replacing centre by linearized
(i.e., expressed in kilometres) latitude and longitude of the centre
[24,25], and also with additional inclusion of BMI (continuous) in
the sex- and centre-adjusted model. A genetic risk score was
constructed by summing the number of risk alleles across all 49
loci. To maximise sample size, missing genotypes were imputed by
assigning the mean genotype in the overall dataset at each locus
for cases and non-cases separately. This was done only for
individuals successfully genotyped for at least 47 of the 49 loci, and
allowed the inclusion of 18,890 rather than 18,390 individuals in
analyses of the genetic score. The HR for T2D per 1-SD increase
in the score (SD calculated in the sub-cohort) was estimated as
described above. Sensitivity analyses were performed using the
original non-imputed genetic risk score, and also a weighted
version of the two scores, where the weights for each SNP were
equal to the log odds ratio for that SNP from DIAGRAM
replication samples [22]. Further sensitivity analyses were
performed removing CCND2 from the risk score, and also
removing CCND2 and GIPR (identified in sex-differentiated
meta-analyses) specifically for the analysis of interaction with sex.
Meta-regression models were used to explore whether average age,
BMI, or WC by country in the sub-cohort explained any of the
heterogeneity between countries.
Interaction AnalysesInteractions between the imputed, unweighted genetic risk score
and each of the following risk factors previously shown to be
associated with T2D in InterAct were assessed: sex [9], diabetes
family history [14], BMI (three levels: ,25, 25 to ,30, $30 kg/
m2) [12], WC (three levels: men, ,94 cm [34.6 inches], 94 to ,
102 cm [34.6 to ,40 inches], $102 cm [$40 inches]; women, ,
80 cm [31.5 inches], 80 to ,88 cm [31.5 to ,35 inches], $88 cm
[$35 inches]) [12], age (continuous) [9], physical activity (four
levels: inactive, moderately inactive, moderately active, active)
[26], and Mediterranean diet score (integer scale from 0–18,
included as a continuous variable) [20]. To estimate p-values for
interaction with either the genetic risk score or individual SNPs, a
parameter representing the interaction between the score or SNP
and the variable of interest was included in country-specific
Prentice-weighted Cox regression models, with additional adjust-
ment for centre and sex and using age as the underlying time scale
(except for analyses of baseline age, where calendar time was used).
The interaction parameter estimates were then combined across
countries using random effects meta-analysis, and observed versus
expected p-values were plotted for individual SNP interactions
(Figure S1). Numerical p-values were included in tables and
figures, but Bonferroni-adjusted levels of significance were used to
draw inferences about statistical significance, to account for the
number of tests performed for the score (score by seven T2D risk
factors, equivalent to seven tests, with p,0.007 ensuring control of
family-wise error rate at level a= 0.05) or individual SNPs (49
SNPs by seven T2D risk factors, equivalent to 343 tests, with p,
1.4661024 ensuring control of family-wise error rate at level
a= 0.05). HRs were also calculated by level for each risk factor, as
described above (age at baseline ,50, 50 to ,60, $60 y;
Mediterranean diet score 0–6, 7–10, and 11–18). We additionally
grouped T2D cases according to their age of diagnosis (,55, 55 to
,65, $65 y) and fit different weighted Cox models using each of
these groups as a separate outcome.
To estimate the cumulative incidence of T2D within strata
defined by quartiles of the genetic risk score (cutoffs derived from
the distribution in the sub-cohort) and modifiable risk factors, we
used the Stata bsample command to recreate the full cohort by
resampling with replacement from the sub-cohort, according to
the distributions of the stratum variables within the sub-cohort.
This made it possible to estimate absolute cumulative incidences
(one minus the Kaplan-Meier estimate of the survivor function).
Results
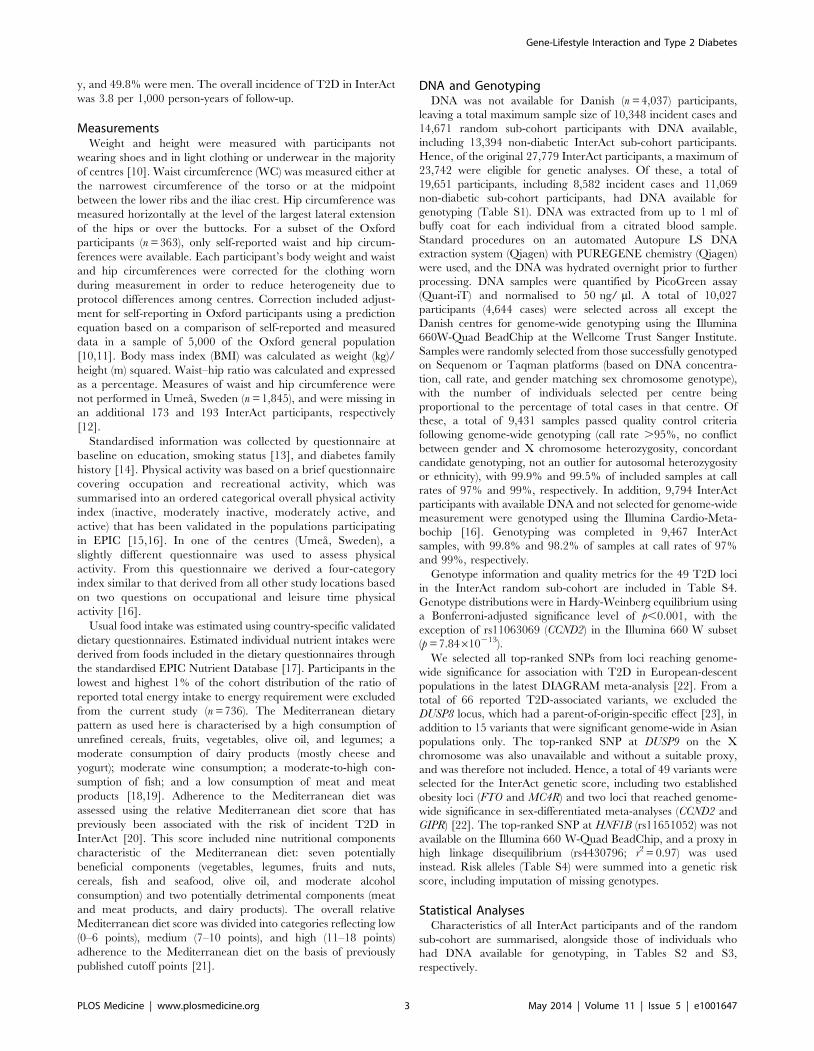
Table 1 shows the baseline characteristics of the participants in
the InterAct random sub-cohort. A comparison of all InterAct
participants (n = 23,742, excluding Denmark) and the subset who
had DNA available for genotyping (n = 19,651) showed no
meaningful differences. (Table S2). Neither were there differences
when only the random sub-cohort (n = 14,671, excluding Den-
mark) was compared to the subset of the random sub-cohort that
had DNA for genotyping (n = 12,071) (Table S3).
Associations between the Genetic Score and BaselineCharacteristics
Age, BMI, and WC were identical or similar across quartiles of
the genetic score (Q1 36 to ,49, Q2 49 to ,52, Q3 52 to ,55,
and Q4 55 to 68 alleles) in the sub-cohort participants (Table S11).
There was a slightly smaller proportion of women in the lower
compared to higher genetic score quartiles (Q1 62.1%, Q2 64.3%,
Q3 64.8%, Q4 65.6%), in line with slightly greater weight and
taller height in the lower score quartiles. A positive family history
of diabetes was more common in those with higher levels of
genetic susceptibility (Q1 15.2%, Q2 16.6%, Q3 19.1%, Q4
19.3%).
Main Genetic EffectsRisk alleles of all of the 49 investigated T2D loci were
associated with incident diabetes with HRs for T2D $1, with
effect sizes ranging from 1.01 for ADAMTS9 to 1.33 for TCF7L2
per risk allele (Table 2) and p-values ,0.05 for 35 of the loci. The
number of alleles of the genetic risk score carried by InterAct
participants ranged from 36 to 68, with the same range in cases
and non-cases. There was no difference between the non-imputed
versus imputed scores (Table 2). Each additional T2D risk allele
of the imputed score was associated with a HR of 1.08 (95% CI
1.07, 1.10) (Table 2). Investigation of the standardised genetic
score showed a HR of 1.41 (95% CI 1.34, 1.49) for each 1-SD
(4.4 alleles) increase in the imputed, unweighted score, with
identical results for the non-imputed, unweighted score (Table 2).
The per SD effect of the weighted score (1.47) was not
significantly different (p = 0.24) from the per SD effect of the
unweighted score (1.41), and therefore the imputed, unweighted
score was used in all subsequent analyses. We observed some
evidence of heterogeneity between countries in the association of
genetic risk score and T2D (I2 56%; Figure 1), which was not
accounted for by differences in the average age, BMI, or WC
between countries in meta-regression analyses. Effect sizes for the
score were similar in analyses adjusting for latitude and longitude
instead of centre, or additionally adjusting for BMI (Table S5).
For individual SNPs, the effect of adjustment for BMI was most
notable for rs9936385 in FTO, an established obesity locus (Table
S5).
Gene-Lifestyle Interaction and Type 2 Diabetes
PLOS Medicine | www.plosmedicine.org 4 May 2014 | Volume 11 | Issue 5 | e1001647
InteractionsThe overall effect of the imputed, unweighted genetic score
(Table 2; HR [95% CI] 1.41 [1.34, 1.49] per SD [4.4 risk alleles])
differed significantly by age at study entry (Figure 2), being greater
in younger, compared to older, participants (HR [95% CI] 1.49
[1.41, 1.58] for individuals ,50 y, 1.41 [1.31, 1.51] for 50–60 y,
1.34 [1.26, 1.42] for $60 y, p for interaction = 1.2061024). This
phenomenon was related to the earlier mean age at diagnosis
(52.5, 61.8, and 70.6 y, respectively) of participants who were
younger at the start of this study of incident disease, and the fact
that the effect of the genetic score was greater in individuals who
developed T2D at a younger age, compared to those who
developed T2D when they were older (HR [95% CI] 1.55
[1.46, 1.64], 1.42 [1.34, 1.50], and 1.31 [1.25, 1.38] for cases
with age at diagnosis of ,55, 55 to ,65, and 65+ y,
respectively).
The relative genetic risk was also significantly stronger in
participants who were leaner (Figure 2), both in terms of BMI and
WC. HRs were 1.62 (95% CI 1.50, 1.74) for normal weight, 1.46
(95% CI 1.37, 1.56) for overweight, and 1.27 (95% CI 1.17, 1.39)
for obese participants (p for interaction = 1.5061023), and 1.60
(95% CI 1.49, 1.72) for participants with low WC, 1.53 (95% CI
Table 1. Baseline characteristics of the random sub-cohort participants in the InterAct study.
Characteristic Percent of Participants with Missing Data Mean or Percent SD or N
Age (y) 0.4% 51.9 9.5
Weight (kg) 0.7% 71.7 13.4
Height (cm) 0.4% 165.5 9.2
BMI (kg/m2) 0.8% 26.2 4.3
WC (cm) 0.7% 86.4 12.9
Waist–hip ratio 0.8% 0.8 0.1
Weight at age 20 y (kg) 15.5% 61.2 10.5
Average annual weight change (kg) 15.7% 0.3 0.4
Sex 0%
Men 36.1% 5,292
Women 63.9% 9,379
Alcohol drinker at baseline 0%
No 19.4% 2,848
Yes 80.6% 11,823
Physical activity 1.5%
Inactive 25.9% 3,806
Moderately inactive 33.5% 4,918
Moderately active 21.9% 3,207
Active 17.2% 2,518
Highest school level 1.2%
None 9.2% 1,350
Primary 33.0% 4,837
Technical 20.4% 2,994
Secondary 15.5% 2,275
Further education 19.8% 2,908
Smoking status 1.3%
Never 48.3% 7,089
Former 26.4% 3,870
Current 24.0% 3,525
Mediterranean diet score 6.5%
0–6 22.4% 3,285
7–10 41.3% 6,063
11–18 29.8% 4,369
Family history of diabetes 11.4%
No 70.6% 5,254
Yes 18.0% 1,342
Family history of diabetes was not ascertained in Italy, Spain, Heidelberg (Germany), and Oxford (UK) (excluded from these summaries): 7,226/5,719. WC and waist–hipratio were not measured in Umea (Sweden) (excluded from these summaries): 1,050/1,007. Weight at age 20 y was not ascertained in France, Spain, Florence (Italy),Ragusa (Italy), Turin (Italy), Netherlands, Heidelberg (Germany), and Umea (Sweden) (excluded from these summaries): 9,462/7,692. Data from Denmark (n = 2,164) areexcluded from this table.doi:10.1371/journal.pmed.1001647.t001
Gene-Lifestyle Interaction and Type 2 Diabetes
PLOS Medicine | www.plosmedicine.org 5 May 2014 | Volume 11 | Issue 5 | e1001647

Table 2. Hazard ratios for type 2 diabetes per risk allele for each of 49 SNPs and per standard deviation for additive genetic scores,adjusted for sex and centre: the InterAct study.
Gene or Genetic ScoreSNPIdentifier
RiskAllele
HR per Risk Allele or per SDfor Genetic Risk Scores 95% CI p-Value
Lower Upper
ADAMTS9 rs6795735 C 1.01 0.96 1.05 7.9561021
ADCY5 rs11717195 T 1.11 1.06 1.17 8.2761025
ANK1 rs516946 C 1.07 1.02 1.12 8.0261023
ANKRD55 rs459193 G 1.05 1.00 1.11 3.2861022
ARAP1 (CENTD2) rs1552224 A 1.13 1.07 1.20 5.5761025
BCAR1 rs7202877 T 1.14 1.07 1.23 1.9261024
BCL11A rs243088 T 1.06 1.02 1.11 8.3361023
CCND2 rs11063069 G 1.11 1.05 1.17 3.1861024
CDC123/CAMK1D rs11257655 T 1.05 1.00 1.11 7.2961022
CDKAL1 rs7756992 G 1.15 1.10 1.21 2.9961029
CDKN2A/B rs10811661 T 1.14 1.08 1.21 2.0061026
CILP2 rs10401969 C 1.10 1.00 1.21 4.4561022
DGKB rs17168486 T 1.08 1.02 1.15 6.5861023
FTO rs9936385 C 1.10 1.06 1.15 1.2561025
GCK rs10278336 A 1.02 0.98 1.06 3.6561021
GCKR rs780094 C 1.03 0.97 1.08 3.3061021
GIPR rs8108269 G 1.06 1.00 1.14 6.4461022
GRB14 rs13389219 C 1.08 1.03 1.14 1.5161023
HHEX/IDE rs1111875 C 1.15 1.07 1.23 1.3161024
HMG20A rs7177055 A 1.09 1.02 1.16 1.3861022
HMGA2 rs2261181 T 1.17 1.07 1.29 8.6861024
HNF1A (TCF1) rs12427353 G 1.11 1.05 1.17 1.3461024
HNF1B (TCF2) rs11651052 A 1.06 1.01 1.12 1.3061022
IGF2BP2 rs4402960 T 1.15 1.07 1.24 1.6561024
IRS1 rs2943640 C 1.10 1.06 1.15 1.4061025
JAZF1 rs849135 G 1.07 1.03 1.12 1.3661023
KCNJ11 rs5215 C 1.07 1.03 1.12 1.6361023
KCNQ1 rs163184 G 1.10 1.05 1.15 1.5261025
KLF14 rs13233731 G 1.03 0.99 1.07 1.6961021
KLHDC5 rs10842994 C 1.13 1.07 1.19 1.3161025
MC4R rs12970134 A 1.02 0.97 1.07 4.1161021
MTNR1B rs10830963 G 1.10 1.04 1.16 3.0861024
NOTCH2 rs10923931 T 1.02 0.91 1.15 6.8361021
PPARG rs1801282 C 1.08 1.00 1.17 6.3661022
PRC1 rs12899811 G 1.05 1.01 1.10 2.4661022
PROX1 rs2075423 G 1.03 0.98 1.08 1.9561021
SLC30A8 rs3802177 G 1.14 1.08 1.20 4.6161026
SPRY2 rs1359790 G 1.04 0.98 1.12 1.9961021
TCF7L2 rs7903146 T 1.33 1.24 1.42 1.87610216
THADA rs10203174 C 1.15 1.01 1.30 3.1361022
TLE1 rs2796441 G 1.06 1.01 1.10 1.6261022
TLE4 rs17791513 A 1.08 0.99 1.18 8.2661022
TP53INP1 rs7845219 T 1.05 1.01 1.09 2.8461022
TSPAN8/LGR5 rs7955901 C 1.03 0.99 1.08 1.3161021
UBE2E2 rs1496653 A 1.10 1.02 1.18 1.4361022
WFS1 rs4458523 G 1.09 1.00 1.19 4.0561022
ZBED3 rs6878122 G 1.07 1.02 1.13 5.9061023
Gene-Lifestyle Interaction and Type 2 Diabetes
PLOS Medicine | www.plosmedicine.org 6 May 2014 | Volume 11 | Issue 5 | e1001647

1.39, 1.68) for those with medium WC, and 1.29 (95% CI 1.18,
1.40) for those with high WC (p for interaction = 7.4961029).
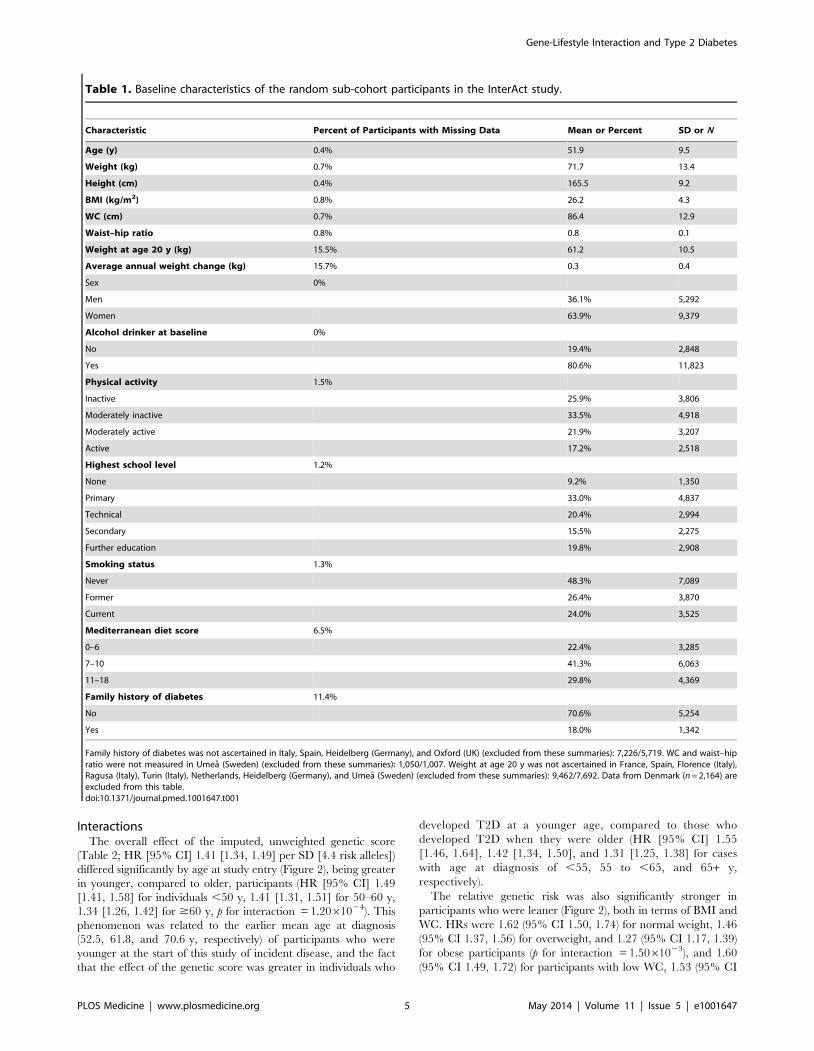
We detected no significant interactions between the genetic
score and sex, diabetes family history, physical activity, or
dietary habits (all p-values for interaction .0.1). Confounding by
obesity did not explain any of the interactions observed with
lifestyle factors, as the results were largely unchanged when BMI
was included in the models as a covariate (Figure 3). For
individual SNP interactions, a total of 27 of the 343 tested
associations reached statistical significance at 0.002,p#0.05,
with only one (additional) locus (ADCY5 rs11717195 by BMI
interaction p = 7.261026) being below the Bonferroni-adjusted
significance level, showing a smaller T2D effect size in larger
individuals (Table S10).
Table 2. Cont.
Gene or Genetic ScoreSNPIdentifier
RiskAllele
HR per Risk Allele or per SDfor Genetic Risk Scores 95% CI p-Value
Lower Upper
ZFAND6 rs11634397 G 1.04 0.99 1.09 8.6461022
ZMIZ1 rs12571751 A 1.09 1.03 1.15 1.2261023
Genetic score (imputed) Per allele 1.08 1.07 1.10 1.05610241
Genetic score (imputed) Per SD (4.37) 1.41 1.34 1.49 1.05610241
Genetic score (imputed, weighted) Per SD (0.43) 1.47 1.41 1.54 5.77610264
Genetic score (non-imputed, unweighted)Per SD (4.37) 1.41 1.34 1.49 1.67610240
Genetic score (non-imputed, weighted) Per SD (0.43) 1.47 1.41 1.54 1.30610261
Analyses are based on 18,890 participants with data available for the genetic score—8,245 incident cases and 11,133 sub-cohort members (includes 488 incident cases).All models are adjusted for sex and centre, and with age as the underlying time scale. For comparability, HRs for the four genetic scores are presented per SD, where theSD is estimated in the sub-cohort.doi:10.1371/journal.pmed.1001647.t002
Figure 1. Hazard ratios for type 2 diabetes per standard deviation (4.4 alleles) increase in the imputed, unweighted genetic riskscore by country and overall: the InterAct study.doi:10.1371/journal.pmed.1001647.g001
Gene-Lifestyle Interaction and Type 2 Diabetes
PLOS Medicine | www.plosmedicine.org 7 May 2014 | Volume 11 | Issue 5 | e1001647

Absolute Risk of T2D by Strata of Lifestyle Exposures andGenetic Risk
Analysis of the cumulative incidence of T2D by strata of
lifestyle risk factors and quartiles of the genetic score showed
the strong effect of these modifiable factors on the absolute risk
of T2D, compared to the genetic score. This effect was
particularly evident for obesity, the strongest modifiable T2D
risk factor. For example, normal weight individuals in the
highest quartile of genetic risk had a 10-y cumulative incidence
of 0.89%, whereas obese individuals in the lowest quartile of
genetic risk had a 4-fold greater 10-y cumulative incidence of
4.22%.
The cumulative incidence of developing T2D over 10 y in
normal weight individuals rose from 0.25% to 0.44% to 0.53% to
0.89% across quartiles of the genetic score (Q1 36 to ,49, Q2 49
to ,52, Q3 52 to ,55, Q4 55 to 68 alleles in the sub-cohort),
compared to the cumulative incidence of 1.29%, 2.03%, 2.50%,
and 3.33% in overweight and 4.22%, 5.78%, 5.83%, and 7.99%
in obese individuals (Figure 4A; Table S6). Similar results were
obtained for WC, with 10-y cumulative incidence of 0.29%,
0.48%, 0.66%, and 1.01% across quartiles of the genetic score in
those with low WC, compared to 0.95%, 1.66%, 1.78%, and
2.92% in those with medium WC, and 3.50%, 5.08%, 5.50%,
and 6.64% in those with high WC (Figure 4B; Table S7). For
physical activity, the cumulative incidence of developing T2D
over 10 y in the most active participants was 0.86%, 1.33%,
1.59%, and 2.62% across quartiles of the genetic score, compared
to 1.85%, 2.63%, 2.89%, and 3.73% in the least active
participants (Figure 4C; Table S8). For the Mediterranean diet
score, the 10-y cumulative incidence was 1.04%, 1.58%, 1.88%,
and 2.75% for those with the healthiest diet score (11–18) across
quartiles of the genetic score, compared to a cumulative
incidence of 1.45%, 2.03%, 2.76%, and 3.27% in those with
an unhealthy score (0–6) (Figure 4D; Table S9).
Discussion
These results from the EPIC InterAct study show that a genetic
risk score based on 49 established loci for T2D is strongly
Figure 2. Hazard ratios for type 2 diabetes per standard deviation (4.4 alleles) increase in the imputed, unweighted genetic riskscore within strata defined by sex, diabetes family history, body mass index, waist circumference, age, physical activity, andMediterranean diet score: the InterAct study. Prentice-weighted Cox regression models are adjusted for age, sex, and centre. F, female; M,male; Med., Mediterranean.doi:10.1371/journal.pmed.1001647.g002
Gene-Lifestyle Interaction and Type 2 Diabetes
PLOS Medicine | www.plosmedicine.org 8 May 2014 | Volume 11 | Issue 5 | e1001647
associated with risk of development of T2D across eight European
countries, and that this relative genetic risk is greatest in those who
are younger and leaner at baseline. However, the study also
demonstrates that the absolute risk of T2D is dominated by
modifiable factors, particularly obesity.
The observation of a significantly greater relative genetic risk in
those participants who were younger and leaner at baseline
supports earlier results from the Framingham Offspring Study,
which showed that the relative genetic risk for T2D was higher in
participants who were younger than 50 y at baseline [27]. We
found no significant interactions of the genetic risk score with sex,
diabetes family history, physical activity, or dietary habits as
assessed by a Mediterranean diet score. It is possible, however,
that the set of genes that might interact with lifestyle factors and
that influence response to lifestyle interventions could differ from
those known to predispose to T2D development overall. Thus, our
approach in this analysis, which restricted attention to known loci
that have a main effect for diabetes, may be conservative. Future
genome-wide interaction analyses will examine the possibility that
other loci without a known significant main effect could interact
with lifestyle factors.
Earlier studies have largely focused on the incremental value of
genetic testing for disease prediction rather than on quantifying
the interaction between genetic susceptibility and lifestyle factors.
These studies have shown that information on common genetic
variants associated with the risk of T2D offers little improvement
for risk prediction over and above established T2D risk factors
[28–31]. Although genome-wide data have been shown to explain
a much larger proportion of trait variance than the small number
of genome-wide significant loci [22], the feasibility of large-scale
genotyping in a clinical setting and its value for disease prediction
remain to be demonstrated; the same applies to the role of low-
frequency variants for risk prediction.
The clinical benefit of personalised pharmacological interven-
tions has successfully been demonstrated for patients with rare,
monogenic forms of diabetes [32,33], yet it is unknown whether
Figure 3. Hazard ratios for type 2 diabetes per standard deviation (4.4 alleles) increase in the imputed, unweighted genetic riskscore within strata defined by sex, diabetes family history, body mass index, waist circumference, age, physical activity, andMediterranean diet score: the InterAct study. Prentice-weighted Cox regression models are adjusted for age, sex, centre, and BMI. F, female; M,male; Med., Mediterranean.doi:10.1371/journal.pmed.1001647.g003
Gene-Lifestyle Interaction and Type 2 Diabetes
PLOS Medicine | www.plosmedicine.org 9 May 2014 | Volume 11 | Issue 5 | e1001647

lifestyle interventions for T2D are more successful if targeted on
the basis of underlying genetic risk. Addressing this question is
challenging, as very large prospective studies are needed to
investigate how lifestyle behavioural factors and genetic suscepti-
bility interact in their influence on T2D.
Results from the InterAct study suggest that knowledge about
T2D genetic susceptibility based on the set of common genetic
variants that have been identified to date has no implications for
decisions about who should be targeted for intensive lifestyle
interventions. The high absolute risk associated with obesity at
any level of genetic risk highlights the importance of lifestyle
interventions focussing on excess weight, and suggests that
universal approaches regardless of genetic susceptibility based
on established T2D loci are appropriate and are urgently
warranted in the light of the current obesity epidemic. Although
the relative risk attributable to the set of common genetic variants
was greatest in individuals who were younger and leaner at
baseline, these individuals were also those at lowest absolute risk.
The observation of a higher relative risk among younger and
thinner individuals would not be a logical basis for targeting
genetic testing to this population sub-group, since the low
absolute risk in this group would mean that the number needed
to screen to identify a population for targeted prevention would
be huge, as it is defined as the inverse of the absolute risk
reduction.
Recent analyses of the DPP detected no significant interactions
between treatment groups and genetic risk assessed on the basis of
34 T2D loci known at the time, suggesting that the benefits of
lifestyle interventions apply to individuals at both low and high
genetic risk [8]. This is in line with our findings of large differences
in absolute risk between strata of lifestyle-associated risk factors,
particularly BMI and WC, at any given level of genetic risk. The
latest DPP analysis reflects earlier DPP interaction results for
selected individual loci such as TCF7L2 [34] and ENPP1 [35],
which were suggestive but not statistically significant before or
after accounting for other risk factors. A nominally significant
genotype–treatment interaction effect on diabetes incidence had
been reported for the CDKN2A/B rs10811661 variant; however,
treatment-stratified genotype–diabetes associations were not sig-
nificant in any of the placebo, lifestyle, or metformin groups [36].
Figure 4. Cumulative incidence of type 2 diabetes (percent) by quartiles of the imputed, unweighted genetic risk score and strataof body mass index, waist circumference, physical activity, and Mediterranean diet score: the InterAct study. (A) BMI (red: ,25 kg/m2;blue: 25 to ,30 kg/m2; black: $30 kg/m2), (B) WC (red: ,94 cm in men and ,80 cm in women; blue: 94 to ,102 cm in men and 80 to ,88 cm inwomen; black: $102 cm in men and $88 cm in women), (C) physical activity (red: active; blue: moderately active; green: moderately inactive; black:inactive), and (D) Mediterranean diet score (red: 11–18; blue: 7–10; black: 0–6).doi:10.1371/journal.pmed.1001647.g004
Gene-Lifestyle Interaction and Type 2 Diabetes
PLOS Medicine | www.plosmedicine.org 10 May 2014 | Volume 11 | Issue 5 | e1001647
Previous observational studies have also investigated interac-
tions between T2D variants established at the time and BMI,
physical activity, or dietary measures, as well as non-modifiable
risk factors. As in our study, these reports showed no significant
differences in genetic score–T2D associations by sex [37]. Our
results demonstrating a greater relative genetic risk in individuals
who are leaner support observations based on analyses of T2D
case-control studies stratifying lean and obese cases and comparing
them to unselected controls [38]. Using this approach, which
differs from our population-based case-cohort analysis, lean cases
were shown to have a stronger genetic predisposition to T2D
based on 29 of 36 established loci. In addition, genome-wide
analyses identified a new variant in the LAMA1 gene (rs8090011)
as having a stronger association with T2D in lean than in obese
cases, highlighting the potential for efficient genetic discovery
using stratified approaches. However, as LAMA1 was not found to
be associated with T2D overall at genome-wide levels of
significance [22], it was not included in the list of variants
examined in this analysis. Of the individual loci considered in our
study, only ADCY5 (rs11717195) showed an interaction with BMI
significant below the Bonferroni-adjusted level. ADCY5 was also
one of highest-ranked independent signals in the lean case
genome-wide association study mentioned above, with a smaller
effect size in obese cases. A prospective study conducted in Sweden
that included 2,063 incident cases of T2D reported that of 17
investigated T2D loci, only HNF1B (rs4430796) showed a
significant interaction with physical activity [39]. In the present
study, the HNF1B locus (rs11651052, r2 with rs4430796 = 0.97)
did not interact with physical activity, a result similar to those
obtained for the genetic risk scores or other individual SNPs. Qi
and colleagues studied the interaction of a Western dietary pattern
and a genetic risk score comprising ten established T2D loci [40]
on diabetes risk in a relatively small case-control study and showed
that the Western diet score was more strongly associated with
diabetes in men with a higher genetic score than in those with a
lower genetic score. Other studies have focused on interactions
between specific genetic loci and selected dietary factors rather
than dietary patterns, making direct comparison difficult [41–43].
Strengths and WeaknessesStrengths of the InterAct study include its size, being the largest
study of incident T2D with measures of genetic susceptibility. The
inclusion of participants from eight different European countries makes
the results more widely generalisable and increases statistical power to
examine interactions because of the greater variability of lifestyle
exposures between different countries. Small, individual studies of
gene–lifestyle interaction are hampered by low power, particularly in
the context of testing many unrelated hypotheses. Theoretically, meta-
analyses of different studies could overcome this limitation, but
meta-analysis of published literature is severely limited by
publication bias. Meta-analysis of published and non-published
data could resolve this issue, but would, in turn, be restricted by
heterogeneity between studies in the way that exposures and
outcomes have been assessed and categorised [44]. In this
context, the standardised, prospective assessment of a large
range of risk factors and exposures in InterAct is a strength.
This particular analysis has focused on a narrow range of
lifestyle exposures for which a main effect had been described and
reported in the InterAct study and a set of genetic variants
previously shown to have a main effect for T2D. The focus on
lifestyle factors that have already been quantified was driven by
observations that precise specification of the main lifestyle-to-
disease relationship is important in examinations of gene–lifestyle
interaction [45]. This approach does not preclude further
investigations of other lifestyle factors or other sets of genetic
variants. The design of some of the original T2D discovery case-
control studies, which oversampled younger and leaner cases, may
have biased the genome-wide results of the original genetic
discovery studies towards the identification of loci influencing T2D
risk through primary effects on insulin secretion. Therefore, the
observation of stronger genetic effects in younger and leaner
InterAct participants may be a reflection of the nature of the
genetic score of such discovered variants. In this scenario, one
might expect genetic effect sizes to be generally lower in
population-based studies that include a more heterogeneous group
of incident cases than in the original studies in which they were
described. However, our results are based on the most recent
discovery effort, which included a much broader selection of
discovery studies than the initial genome-wide association studies,
and are less likely to be influenced by the same bias.
In our study, as in any other cohort of incident disease not started
at birth, exclusion of prevalent disease may influence results. The
risk of diabetes increases with age and obesity, and older and obese
participants are therefore more likely to have prevalent disease at
baseline and be excluded. If older and obese participants who
remained free of T2D and are included in the study differ
systematically in their genetic risk from those who are excluded (e.g.,
by having lower genetic risk), this may lead to an apparently
stronger effect of the genetic score on incident T2D in younger or
leaner individuals. However, differences in mean age by genetic risk
quartiles amongst cases were found to be small, and the range of the
genetic score was almost identical across age groups.
In conclusion, The EPIC InterAct study shows that in this
middle-aged cohort the relative association with T2D of a genetic
risk score comprised of 49 loci is greatest in those who are younger
and leaner at baseline. However, this sub-group is at low absolute
risk and would not be a logical target for preventive interventions.
The high absolute risk for developing T2D associated with obesity
at any level of genetic risk highlights the importance of universal
rather than targeted approaches to lifestyle intervention.
Supporting Information
Figure S1 Quantile–quantile plots of observed versusexpected interaction p-values.
(TIF)
Table S1 Summary of InterAct participants with DNAand Illumina 660W-Quad BeadChip and Cardio-Meta-bochip genotyping.
(XLSX)
Table S2 Summary of baseline characteristics of allInterAct participants (excluding Denmark) and in thesubset with DNA for genotyping.
(XLSX)
Table S3 Summary of baseline characteristics of theInterAct random sub-cohort and in the subset of therandom sub-cohort with DNA for genotyping.
(XLSX)
Table S4 Genotype information and quality metrics inthe InterAct random sub-cohort (n = 14,671 excludingDenmark).
(XLSX)
Table S5 Hazard ratios for type 2 diabetes per riskallele for each of 49 SNPs and variations of additivegenetic scores with different degrees of adjustment.
(XLSX)
Gene-Lifestyle Interaction and Type 2 Diabetes
PLOS Medicine | www.plosmedicine.org 11 May 2014 | Volume 11 | Issue 5 | e1001647

Table S6 Cumulative incidence of type 2 diabetes (per100 individuals) by genetic risk score quartile andgroups of body mass index estimated for differentdurations of follow-up.(XLSX)
Table S7 Cumulative incidence of type 2 diabetes (per100 individuals) by genetic risk score quartile andgroups of waist circumference estimated for differentdurations of follow-up.(XLSX)
Table S8 Cumulative incidence of type 2 diabetes (per100 individuals) by genetic risk score quartile andgroups of physical activity estimated for differentdurations of follow-up.(XLSX)
Table S9 Cumulative incidence of type 2 diabetes (per100 individuals) by genetic risk score quartile andgroups of the Mediterranean diet score estimated fordifferent durations of follow-up.(XLSX)
Table S10 Tests of interactions between individualSNPs and lifestyle factors having an effect on risk ofincident type 2 diabetes.(XLSX)
Table S11 Baseline characteristics by quartiles ofgenetic risk score (imputed, unweighted) in the InterActsub-cohort.(XLSX)
Acknowledgments
We thank all EPIC participants and staff for their contribution to the study.
We thank staff from the Laboratory Team, Field Epidemiology Team, and
Data Functional Group of the MRC Epidemiology Unit in Cambridge,
UK, for carrying out sample preparation, DNA provision and quality
control, genotyping, and data-handling work.
Author Contributions
Conceived and designed the experiments: CL SJS PWF RAS PD NGF PF
LCG TH LP OBP MBS MJT EW CA LA AB HB GMC FCC EJD GF
RK NDK TJK KTK JK ML APM CN PMN KO DP SP JRQ OR CS
MJS NS AMWS RT DLvdA YTvdS IB MIMC ER NJW. Performed the
experiments: CL SJS PWF RAS NJW. Analyzed the data: SJS.
Contributed reagents/materials/analysis tools: CL SJS PWF RAS PD
NGF PF LCG TH LP OBP MBS MJT EW CA LA AB HB GMC FCC
EJD GF RK NDK TJK KTK JK ML APM CN PMN KO DP SP JRQ
OR CS MJS NS AMWS RT DLvdA YTvdS IB MIMC ER NJW. Wrote
the first draft of the manuscript: CL NJW. Contributed to the writing of the
manuscript: CL SJS PWF RAS PD NGF PF LCG TH LP OBP MBS MJT
EW CA LA AB HB GMC FCC EJD GF RK NDK TJK KTK JK ML
APM CN PMN KO DP SP JRQ OR CS MJS NS AMWS RT DLvdA
YTvdS IB MIMC ER NJW. ICMJE criteria for authorship read and met:
CL SJS PWF RAS PD NGF PF LCG TH LP OBP MBS MJT EW CA LA
AB HB GMC FCC EJD GF RK NDK TJK KTK JK ML APM CN PMN
KO DP SP JRQ OR CS MJS NS AMWS RT DLvdA YTvdS IB MIMC
ER NJW. Agree with manuscript results and conclusions: CL SJS PWF
RAS PD NGF PF LCG TH LP OBP MBS MJT EW CA LA AB HB
GMC FCC EJD GF RK NDK TJK KTK JK ML APM CN PMN KO
DP SP JRQ OR CS MJS NS AMWS RT DLvdA YTvdS IB MIMC ER
NJW.
References
1. International Diabetes Federation (2013) IDF diabetes atlas, 6th ed. Brussels:International Diabetes Federation. Available: http://www.idf.org/diabetesatlas/
download-book. Accessed 15 April 2014.
2. Neel JV (1962) Diabetes mellitus: a ‘‘thrifty’’ genotype rendered detrimental by‘‘progress’’? Am J Hum Genet 14: 353–362.
3. Tuomilehto J, Lindstrom J, Eriksson JG, Valle TT, Hamalainen H, et al. (2001)Prevention of type 2 diabetes mellitus by changes in lifestyle among subjects with
impaired glucose tolerance. N Engl J Med 344: 1343–1350.
4. Knowler WC, Barrett-Connor E, Fowler SE, Hamman RF, Lachin JM, et al.
(2002) Reduction in the incidence of type 2 diabetes with lifestyle intervention ormetformin. N Engl J Med 346: 393–403.
5. Knowler WC, Fowler SE, Hamman RF, Christophi CA, Hoffman HJ, et al.
(2009) 10-year follow-up of diabetes incidence and weight loss in the Diabetes
Prevention Program Outcomes Study. Lancet 374: 1677–1686.
6. Gillies CL, Abrams KR, Lambert PC, Cooper NJ, Sutton AJ, et al. (2007)Pharmacological and lifestyle interventions to prevent or delay type 2 diabetes in
people with impaired glucose tolerance: systematic review and meta-analysis.
BMJ 334: 299.
7. McCarthy MI (2010) Genomics, type 2 diabetes, and obesity. N Engl J Med 363:2339–2350.
8. Hivert MF, Jablonski KA, Perreault L, Saxena R, McAteer JB, et al. (2011)Updated genetic score based on 34 confirmed type 2 diabetes Loci is associated
with diabetes incidence and regression to normoglycemia in the diabetesprevention program. Diabetes 60: 1340–1348.
9. Langenberg C, Sharp S, Forouhi NG, Franks PW, Schulze MB, et al. (2011)Design and cohort description of the InterAct Project: an examination of the
interaction of genetic and lifestyle factors on the incidence of type 2 diabetes inthe EPIC Study. Diabetologia 54: 2272–2282.
10. Haftenberger M, Lahmann PH, Panico S, Gonzalez CA, Seidell JC, et al. (2002)Overweight, obesity and fat distribution in 50- to 64-year-old participants in the
European Prospective Investigation into Cancer and Nutrition (EPIC). PublicHealth Nutr 5(6B): 1147–1162.
11. Spencer EA, Roddam AW, Key TJ (2004) Accuracy of self-reported waist andhip measurements in 4492 EPIC-Oxford participants. Public Health Nutr 7:
723–727.
12. Langenberg C, Sharp SJ, Schulze MB, Rolandsson O, Overvad K, et al. (2012)
Long-term risk of incident type 2 diabetes and measures of overall and regionalobesity: the EPIC-InterAct case-cohort study. PLoS Med 9: e1001230.
13. Riboli E, Hunt KJ, Slimani N, Ferrari P, Norat T, et al. (2002) European
Prospective Investigation into Cancer and Nutrition (EPIC): study populationsand data collection. Public Health Nutr 5: 1113–1124.
14. The InterAct Consortium (2013) The link between family history and risk of type
2 diabetes is not explained by anthropometric, lifestyle or genetic risk factors: the
EPIC-InterAct study. Diabetologia 56: 60–69.
15. Wareham NJ, Jakes RW, Rennie KL, Schuit J, Mitchell J, et al. (2003) Validity
and repeatability of a simple index derived from the short physical activity
questionnaire used in the European Prospective Investigation into Cancer andNutrition (EPIC) study. Public Health Nutr 6: 407–413.
16. The InterAct Consortium (2012) Validity of a short questionnaire to assess
physical activity in 10 European countries. Eur J Epidemiol 27: 15–25.
17. Slimani N, Deharveng G, Unwin I, Southgate DA, Vignat J, et al. (2007) The
EPIC nutrient database project (ENDB): a first attempt to standardize nutrient
databases across the 10 European countries participating in the EPIC study.Eur J Clin Nutr 61: 1037–1056.
18. Trichopoulou A, Kouris-Blazos A, Wahlqvist ML, Gnardellis C, Lagiou P, et al.
(1995) Diet and overall survival in elderly people. BMJ 311: 1457–1460.
19. Trichopoulou A, Costacou T, Bamia C, Trichopoulos D (2003) Adherence to aMediterranean diet and survival in a Greek population. N Engl J Med 348:
2599–2608.
20. Romaguera D, Guevara M, Norat T, Langenberg C, Forouhi NG, et al. (2011)Mediterranean diet and type 2 diabetes risk in the European Prospective
Investigation into Cancer and Nutrition (EPIC) study: the InterAct project.Diabetes Care 34: 1913–1918.
21. Buckland G, Agudo A, Lujan L, Jakszyn P, Bueno-de-Mesquita HB, et al. (2010)
Adherence to a Mediterranean diet and risk of gastric adenocarcinoma withinthe European Prospective Investigation into Cancer and Nutrition (EPIC) cohort
study. Am J Clin Nutr 91: 381–390.
22. Morris AP, Voight BF, Teslovich TM, Ferreira T, Segre AV, et al. (2012) Large-scale association analysis provides insights into the genetic architecture and
pathophysiology of type 2 diabetes. Nat Genet 44: 981–990.
23. Kong A, Steinthorsdottir V, Masson G, Thorleifsson G, Sulem P, et al. (2009)
Parental origin of sequence variants associated with complex diseases. Nature462: 868–874.
24. Novembre J, Johnson T, Bryc K, Kutalik Z, Boyko AR, et al. (2008) Genes
mirror geography within Europe. Nature 456: 98–101.
25. Manica A, Prugnolle F, Balloux F (2005) Geography is a better determinant of
human genetic differentiation than ethnicity. Hum Genet 118: 366–371.
26. The InterAct Consortium (2012) Physical activity reduces the risk of incidenttype 2 diabetes in general and in abdominally lean and obese men and women:
the EPIC-InterAct Study. Diabetologia 55: 1944–1952.
27. de Miguel-Yanes JM, Shrader P, Pencina MJ, Fox CS, Manning AK, et al.
(2011) Genetic risk reclassification for type 2 diabetes by age below or above 50
Gene-Lifestyle Interaction and Type 2 Diabetes
PLOS Medicine | www.plosmedicine.org 12 May 2014 | Volume 11 | Issue 5 | e1001647

years using 40 type 2 diabetes risk single nucleotide polymorphisms. Diabetes
Care 34: 121–125.28. Buijsse B, Simmons RK, Griffin SJ, Schulze MB (2011) Risk assessment tools for
identifying individuals at risk of developing type 2 diabetes. Epidemiol Rev 33:
46–62.29. Lyssenko V, Jonsson A, Almgren P, Pulizzi N, Isomaa B, et al. (2008) Clinical
risk factors, DNA variants, and the development of type 2 diabetes. N Engl J Med359: 2220–2232.
30. Meigs JB, Shrader P, Sullivan LM, McAteer JB, Fox CS, et al. (2008) Genotype
score in addition to common risk factors for prediction of type 2 diabetes.N Engl J Med 359: 2208–2219.
31. Talmud PJ, Hingorani AD, Cooper JA, Marmot MG, Brunner EJ, et al. (2010)Utility of genetic and non-genetic risk factors in prediction of type 2 diabetes:
Whitehall II prospective cohort study. BMJ 340: b4838.32. Gloyn AL, Pearson ER, Antcliff JF, Proks P, Bruining GJ, et al. (2004) Activating
mutations in the gene encoding the ATP-sensitive potassium-channel subunit
Kir6.2 and permanent neonatal diabetes. N Engl J Med 350: 1838–1849.33. Pearson ER, Flechtner I, Njolstad PR, Malecki MT, Flanagan SE, et al. (2006)
Switching from insulin to oral sulfonylureas in patients with diabetes due toKir6.2 mutations. N Engl J Med 355: 467–477.
34. Florez JC, Jablonski KA, Bayley N, Pollin TI, de Bakker PI, et al. (2006)
TCF7L2 polymorphisms and progression to diabetes in the Diabetes PreventionProgram. N Engl J Med 355: 241–250.
35. Moore AF, Jablonski KA, Mason CC, McAteer JB, Arakaki RF, et al. (2009)The association of ENPP1 K121Q with diabetes incidence is abolished by
lifestyle modification in the diabetes prevention program. J Clin EndocrinolMetab 94: 449–455.
36. Moore AF, Jablonski KA, McAteer JB, Saxena R, Pollin TI, et al. (2008)
Extension of type 2 diabetes genome-wide association scan results in the diabetesprevention program. Diabetes 57: 2503–2510.
37. Orozco G, Ioannidis JP, Morris A, Zeggini E (2012) Sex-specific differences in
effect size estimates at established complex trait loci. Int J Epidemiol 41: 1376–
1382.
38. Perry JR, Voight BF, Yengo L, Amin N, Dupuis J, et al. (2012) Stratifying type 2
diabetes cases by BMI identifies genetic risk variants in LAMA1 and enrichment
for risk variants in lean compared to obese cases. PLoS Genet 8: e1002741.
39. Brito EC, Lyssenko V, Renstrom F, Berglund G, Nilsson PM, et al. (2009)
Previously associated type 2 diabetes variants may interact with physical activity
to modify the risk of impaired glucose regulation and type 2 diabetes: a study of
16,003 Swedish adults. Diabetes 58: 1411–1418.
40. Qi L, Cornelis MC, Zhang C, van Dam RM, Hu FB (2009) Genetic
predisposition, Western dietary pattern, and the risk of type 2 diabetes in men.
Am J Clin Nutr 89: 1453–1458.
41. Sonestedt E, Lyssenko V, Ericson U, Gullberg B, Wirfalt E, et al. (2012) Genetic
variation in the glucose-dependent insulinotropic polypeptide receptor modifies
the association between carbohydrate and fat intake and risk of type 2 diabetes in
the Malmo Diet and Cancer cohort. J Clin Endocrinol Metab 97: E810–E818.
42. Hindy G, Sonestedt E, Ericson U, Jing XJ, Zhou Y, et al. (2012) Role of
TCF7L2 risk variant and dietary fibre intake on incident type 2 diabetes.
Diabetologia 55: 2646–2654.
43. Cornelis MC, Qi L, Kraft P, Hu FB (2009) TCF7L2, dietary carbohydrate, and
risk of type 2 diabetes in US women. Am J Clin Nutr 89: 1256–1262.
44. Palla L, Higgins JP, Wareham NJ, Sharp SJ (2010) Challenges in the use of
literature-based meta-analysis to examine gene-environment interactions.
Am J Epidemiol 171: 1225–1232.
45. Cornelis MC, Tchetgen EJ, LIang L, Qi L, Chatterjee N, et al. (2012) Gene-
environment interactions in genome-wide association studies: a comparative
study of tests applied to empirical studies of type 2 diabetes. Am J Epidemiol 175:
191–202.
Gene-Lifestyle Interaction and Type 2 Diabetes
PLOS Medicine | www.plosmedicine.org 13 May 2014 | Volume 11 | Issue 5 | e1001647

Editors’ Summary
Background. Worldwide, more than 380 million peoplecurrently have diabetes, and the condition is becomingincreasingly common. Diabetes is characterized by highlevels of glucose (sugar) in the blood. Blood sugar levels areusually controlled by insulin, a hormone released by thepancreas after meals (digestion of food produces glucose). Inpeople with type 2 diabetes (the commonest type ofdiabetes), blood sugar control fails because the fat andmuscle cells that normally respond to insulin by removingexcess sugar from the blood become less responsive toinsulin. Type 2 diabetes can often initially be controlled withdiet and exercise (lifestyle changes) and with antidiabeticdrugs such as metformin and sulfonylureas, but patients mayeventually need insulin injections to control their bloodsugar levels. Long-term complications of diabetes, whichinclude an increased risk of heart disease and stroke, reducethe life expectancy of people with diabetes by about tenyears compared to people without diabetes.
Why Was This Study Done? Type 2 diabetes is thought tooriginate from the interplay between genetic and lifestylefactors. But although rapid progress is being made inunderstanding the genetic basis of type 2 diabetes, it is notknown whether the consequences of adverse lifestyles (forexample, being overweight and/or physically inactive) differaccording to an individual’s underlying genetic risk ofdiabetes. It is important to investigate this question toinform strategies for prevention. If, for example, obeseindividuals with a high level of genetic risk have a higher riskof developing diabetes than obese individuals with a lowlevel of genetic risk, then preventative strategies that targetlifestyle interventions to obese individuals with a highgenetic risk would be more effective than strategies thattarget all obese individuals. In this case-cohort study,researchers from the InterAct consortium quantify thecombined effects of genetic and lifestyle factors on the riskof type 2 diabetes. A case-cohort study measures exposureto potential risk factors in a group (cohort) of people andcompares the occurrence of these risk factors in people wholater develop the disease with those who remain diseasefree.
What Did the Researchers Do and Find? The InterActstudy involves 12,403 middle-aged individuals who devel-oped type 2 diabetes after enrollment (incident cases) intothe European Prospective Investigation into Cancer andNutrition (EPIC) and a sub-cohort of 16,154 EPIC participants.The researchers calculated a genetic type 2 diabetes riskscore for most of these individuals by determining which of49 gene variants associated with type 2 diabetes eachperson carried, and collected baseline information aboutexposure to lifestyle risk factors for type 2 diabetes. Theythen used various statistical approaches to examine thecombined effects of the genetic risk score and lifestylefactors on diabetes development. The effect of the geneticscore was greater in younger individuals than in older
individuals and greater in leaner participants than inparticipants with larger amounts of body fat. The absoluterisk of type 2 diabetes, expressed as the ten-year cumulativeincidence of type 2 diabetes (the percentage of participantswho developed diabetes over a ten-year period) increasedwith increasing genetic score in normal weight individualsfrom 0.25% in people with the lowest genetic risk scores to0.89% in those with the highest scores; in obese people, theten-year cumulative incidence rose from 4.22% to 7.99% withincreasing genetic risk score.
What Do These Findings Mean? These findings showthat in this middle-aged cohort, the relative association withtype 2 diabetes of a genetic risk score comprised of a largenumber of gene variants is greatest in individuals who areyounger and leaner at baseline. This finding may in partreflect the methods used to originally identify gene variantsassociated with type 2 diabetes, and future investigationsthat include other genetic variants, other lifestyle factors,and individuals living in other settings should be undertakento confirm this finding. Importantly, however, this studyshows that young, lean individuals with a high genetic riskscore have a low absolute risk of developing type 2 diabetes.Thus, this sub-group of individuals is not a logical target forpreventative interventions. Rather, suggest the researchers,the high absolute risk of type 2 diabetes associated withobesity at any level of genetic risk highlights the importanceof universal rather than targeted approaches to lifestyleintervention.
Additional Information. Please access these websites viathe online version of this summary at http://dx.doi.org/10.1371/journal.pmed.1001647.
N The US National Diabetes Information Clearinghouseprovides information about diabetes for patients, health-care professionals and the general public, includingdetailed information on diabetes prevention (in Englishand Spanish)
N The UK National Health Service Choices website providesinformation for patients and carers about type 2 diabetesand about living with diabetes; it also provides people’sstories about diabetes
N The charity Diabetes UK provides detailed information forpatients and carers in several languages, includinginformation on healthy lifestyles for people with diabetes
N The UK-based non-profit organization Healthtalkonline hasinterviews with people about their experiences of diabetes
N The Genetic Landscape of Diabetes is published by the USNational Center for Biotechnology Information
N More information on the InterAct study is available
N MedlinePlus provides links to further resources and adviceabout diabetes and diabetes prevention (in English andSpanish)
Gene-Lifestyle Interaction and Type 2 Diabetes
PLOS Medicine | www.plosmedicine.org 14 May 2014 | Volume 11 | Issue 5 | e1001647