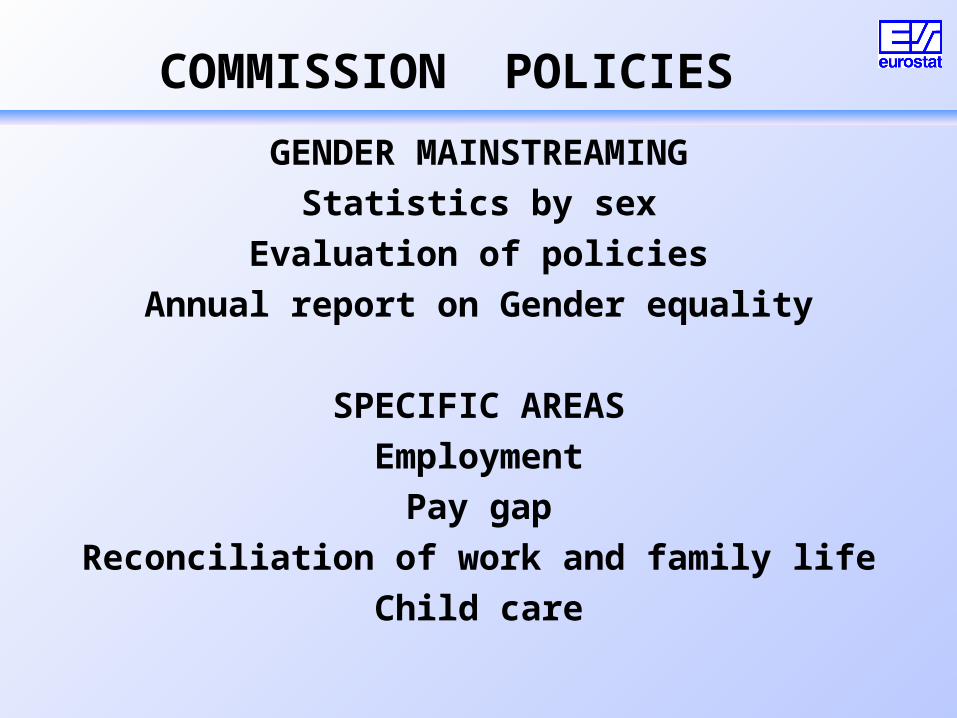
COMMISSION POLICIES
GENDER MAINSTREAMING
Statistics by sex
Evaluation of policies
Annual report on Gender equality
SPECIFIC AREAS
Employment
Pay gap
Reconciliation of work and family life
Child care
Labour Force Survey (LFS)
Persons aged 15 – (16 for ES, SE, UK)
Labour market (in data base) 1983 -
Ad hoc modules 1999 -
Quaterly since 1998
25 Member States, NO, IS, CH,BG, RO
Microdata available for researchers (?)
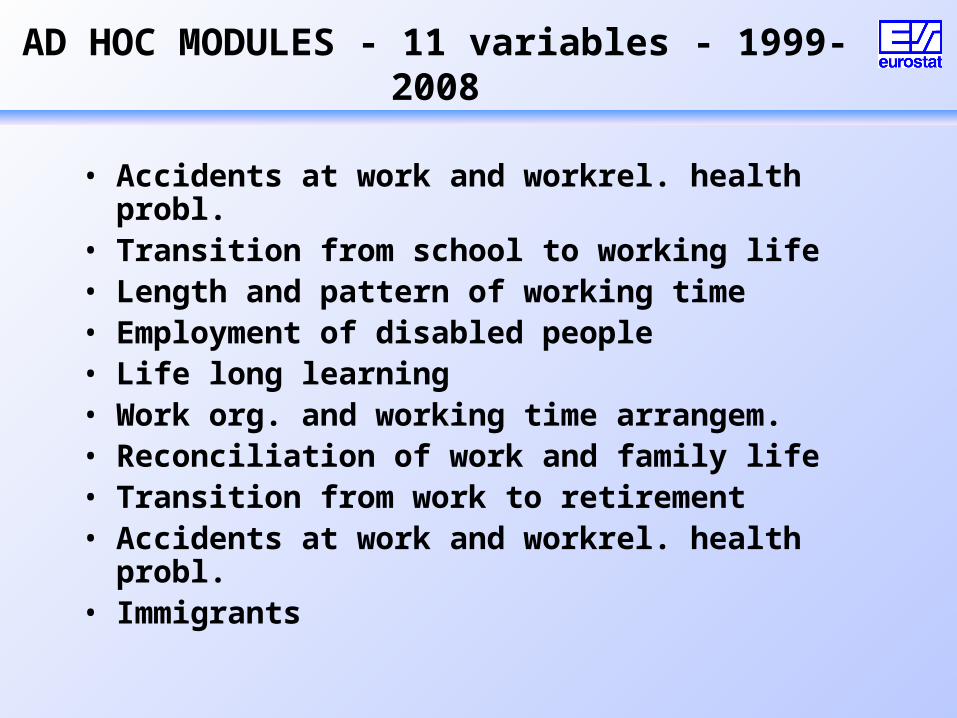
AD HOC MODULES - 11 variables - 1999-2008
• Accidents at work and workrel. health probl.• Transition from school to working life• Length and pattern of working time• Employment of disabled people• Life long learning• Work org. and working time arrangem.• Reconciliation of work and family life• Transition from work to retirement• Accidents at work and workrel. health probl.• Immigrants
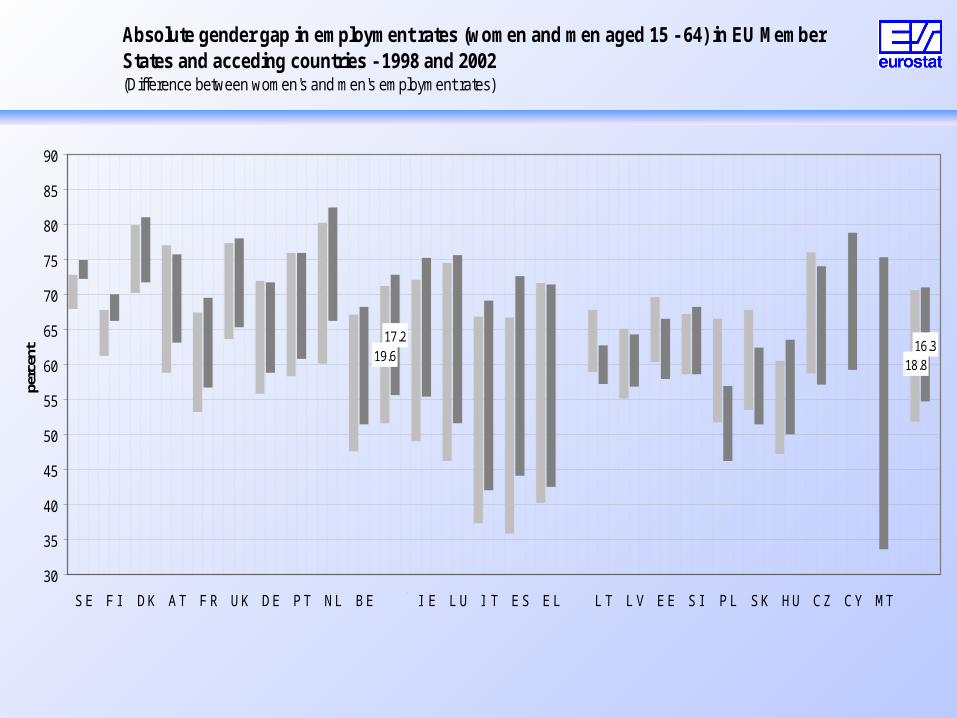
Absolute gender gap in employment rates (women and men aged 15 - 64) in EU Member States and acceding countries - 1998 and 2002(Difference between women's and men's employment rates)
18.819.6
17.216.3
30
35
40
45
50
55
60
65
70
75
80
85
90
perc
ent
Left bar: 1998 Right bar: 2002
Source: Eurostat, Labour Force Survey (LFS)Notes: Top value of a bar is men's employment rate and bottom value is women's employment rate
EU15+ACC
EU-15
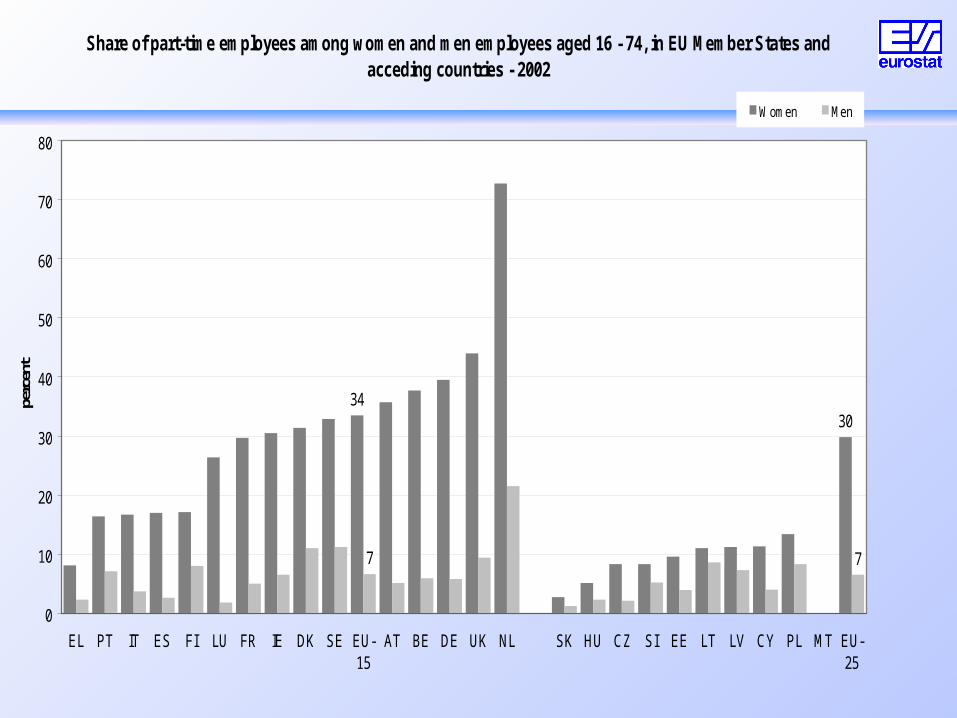
Share of part-time employees among women and men employees aged 16 - 74, in EU Member States and acceding countries - 2002
3430
7 7
0
10
20
30
40
50
60
70
80
EL PT IT ES FI LU FR IE DK SE EU-15
AT BE DE UK NL SK HU CZ SI EE LT LV CY PL MT EU-25
perc
ent
Women Men
Source: Eurostat, Labour Force Survey (LFS), Spring results
European Community Household Panel (ECHP)
Private households
Living conditions and labour market
Longitudinal
1994 – 2001
15 Member States (AT and FI from 1995 and ind for SE from 1997)
Microdata available for researchers

0
10
20
30
40
50
60
70
80
90
100
E P I EL IRL EU-15 A F D FIN NL B UK S DK
0
10
20
30
40
50
60
70
80
90
100
3 or more peopleand other
Couple with at leastone person 65+
Single
% of men/women of 65 and over
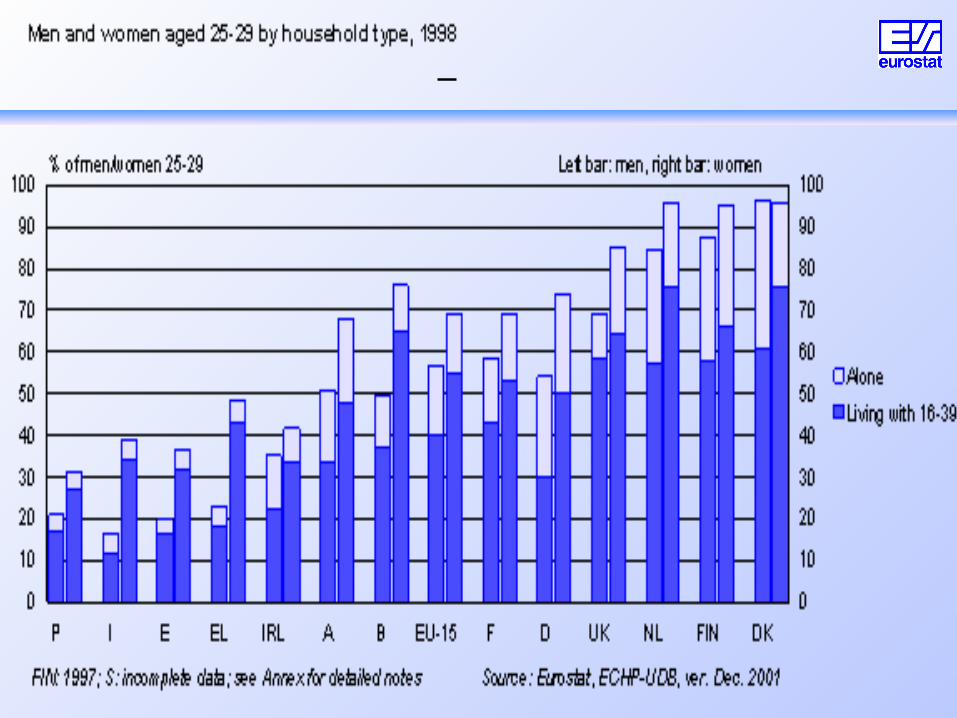
148 Men and women aged 65 and over by type of household, 1998
Left bar: men, right bar: women
FIN: 1997 Source: Eurostat, ECHP-UDB, ver. Dec. 2001
Statistics on Income and Living Conditions (SILC)
Private households
Income and social inclusion
Cross-sectional and Longitudinal
2003 (2005 -)
25 Member States
Microdata available for researchers (?)
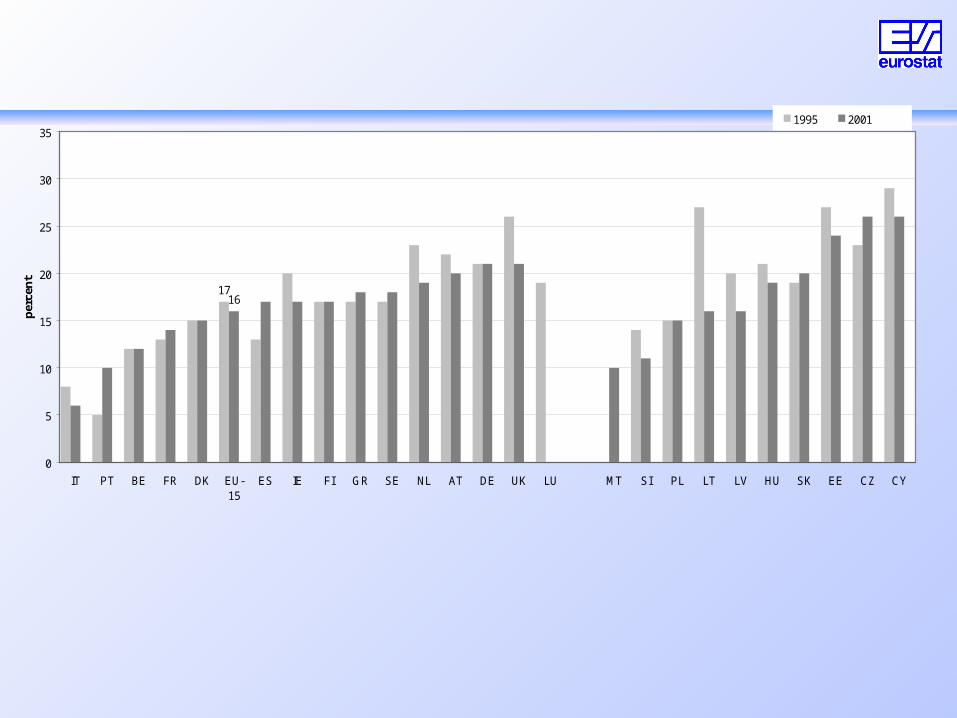
1716
0
5
10
15
20
25
30
35
IT PT BE FR DK EU-15
ES IE FI GR SE NL AT DE UK LU MT SI PL LT LV HU SK EE CZ CY
per
cen
t
1995 2001
Source: Eurostat, ECHP UDB version December 2003 except FR, NL, SE and ACC: National sources Notes: Exceptions to the reference years: FI, SE, CZ, HU: 1996. LV: 1998. SK: 1999- EU-15: weighted average of national values for old member states estimated without missing countries - For the Netherlands, data are based on annual earnings including overtime pay and non-regular payments - For Sweden, data are based on full-time equivalent monthly salaries, not hourly earnings. - For Bulgaria only full-time employees are included- For Cyprus only full-time employees are included- For Czech Republic only full-time employees in enterprises with more than 9 employees are included- For Hungary only full-time employees in enterprises with more than 20 employees (1995 – 97) and more than 5 employees (1998 - ) are included- For Lithuania only fulltime employees (1995 – 99) are included- For Poland only employees in enterprises with more than 9 employees are included- For Slovenia employees in public enterprises and employees in private enterprises with more than 2 employees are included
Pay gap between women and men in unadjusted form in EU Member States and acceding countries - 1995 and 2001 (Difference between men’s and women’s average gross hourly earnings as a percentage of men’s average gross hourly earnings)
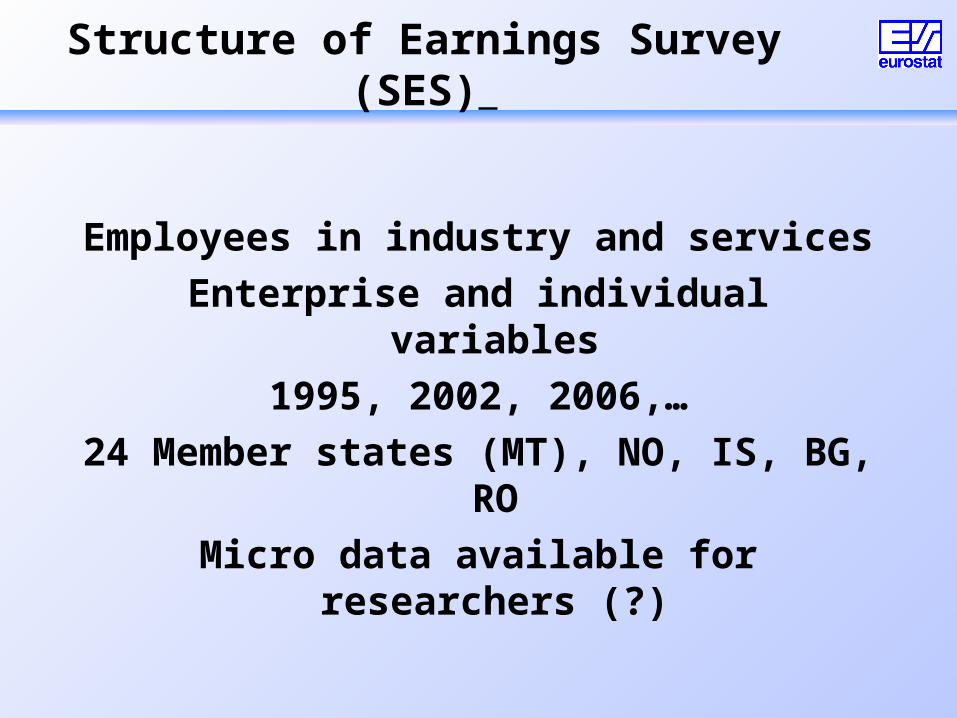
Structure of Earnings Survey (SES)
Employees in industry and services
Enterprise and individual variables
1995, 2002, 2006,…
24 Member states (MT), NO, IS, BG, RO
Micro data available for researchers (?)
Time use surveys (TUS)

Time Use Surveysfrom
21 European countries
BE, DK, DE, EE, ES, FR, IT, LV, LT, HU, NL, PL, PT, SI, SK, FI, SE, UK,
NO, BG, RO
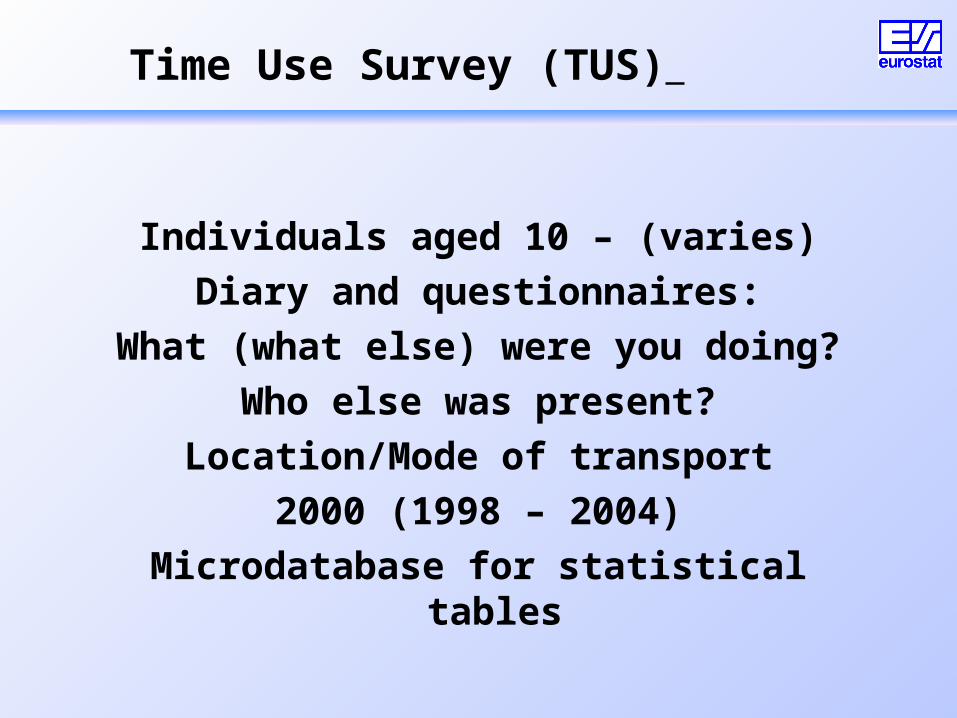
Time Use Survey (TUS)
Individuals aged 10 – (varies)
Diary and questionnaires:
What (what else) were you doing?
Who else was present?
Location/Mode of transport
2000 (1998 – 2004)
Microdatabase for statistical tables
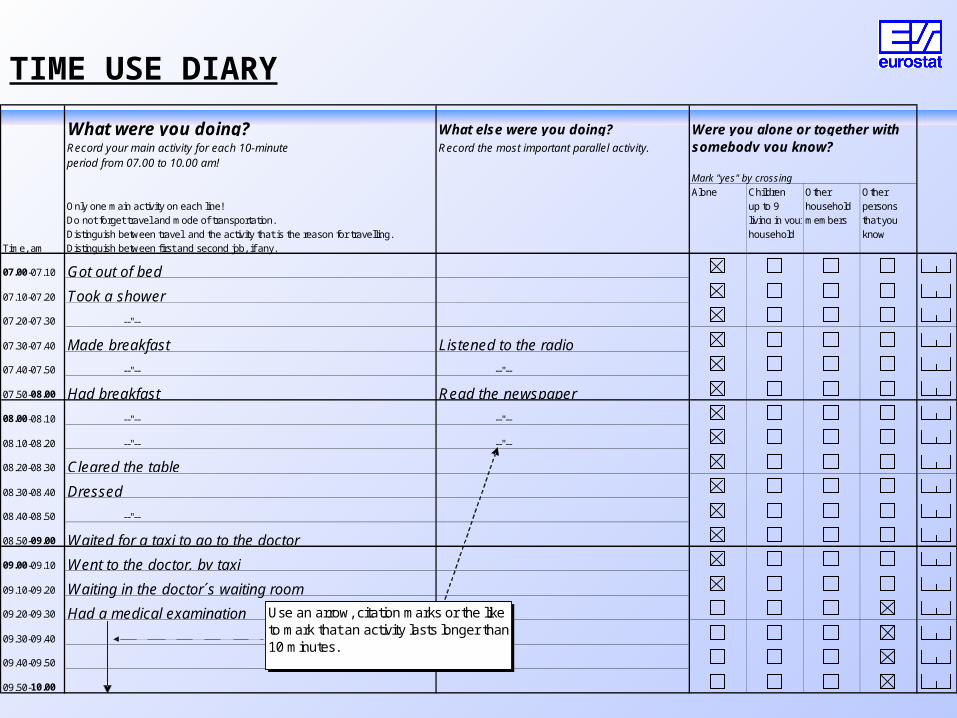
TIME USE DIARY
What were you doing? What else were you doing? Were you alone or together with Record your main activity for each 10-minute Record the most important parallel activity. somebody you know?period from 07.00 to 10.00 am!
Mark "yes" by crossing
Alone Children Other OtherOnly one main activity on each line! up to 9 household personsDo not forget travel and mode of transportation. living in your members that youDistinguish between travel and the activity that is the reason for travelling. household know
Time, am Distinguish between first and second job, if any.
07.00-07.10 Got out of bed
07.10-07.20 Took a shower
07.20-07.30 --"--
07.30-07.40 Made breakfast Listened to the radio
07.40-07.50 --"-- --"--
07.50-08.00 Had breakfast Read the newspaper
08.00-08.10 --"-- --"--
08.10-08.20 --"-- --"--
08.20-08.30 Cleared the table
08.30-08.40 Dressed
08.40-08.50 --"--
08.50-09.00 Waited for a taxi to go to the doctor
09.00-09.10 Went to the doctor, by taxi
09.10-09.20 Waiting in the doctor s waiting room
09.20-09.30 Had a medical examination
09.30-09.40
09.40-09.50
09.50-10.00
Use an arrow, citation marks or the like to mark that an activity lasts longer than 10 minutes.
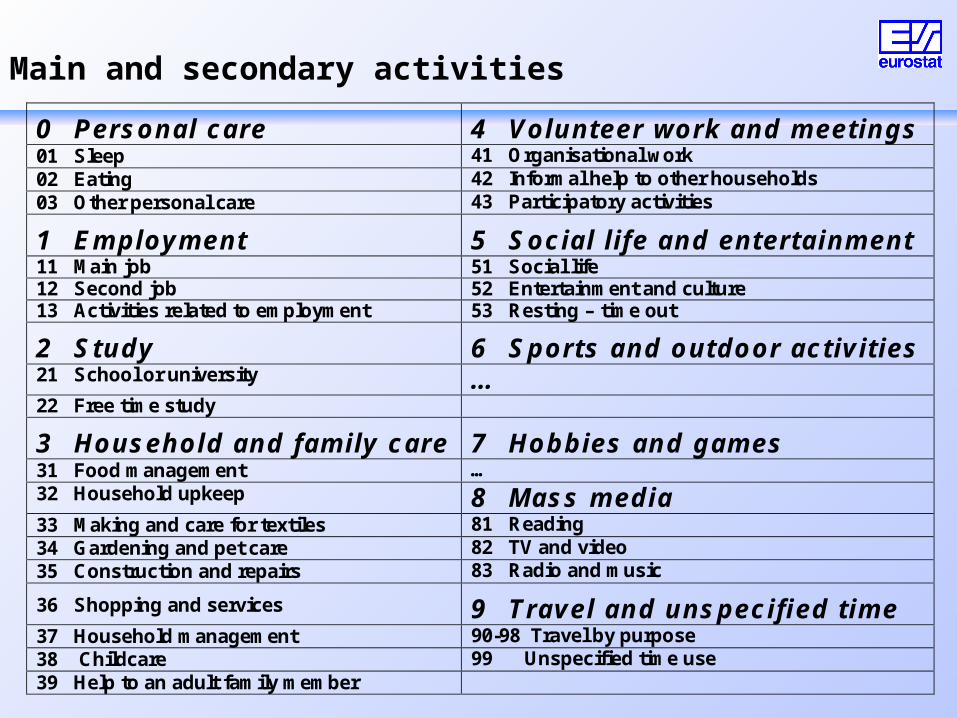
Main and secondary activities
0 Personal care 4 Volunteer work and meetings 01 Sleep 41 Organisational work 02 Eating 42 Informal help to other households 03 Other personal care 43 Participatory activities
1 Employment 5 Social life and entertainment 11 Main job 51 Social life 12 Second job 52 Entertainment and culture 13 Activities related to employment 53 Resting – time out
2 Study 6 Sports and outdoor activities 21 School or university … 22 Free time study
3 Household and family care 7 Hobbies and games 31 Food management … 32 Household upkeep 8 Mass media 33 Making and care for textiles 81 Reading 34 Gardening and pet care 82 TV and video 35 Construction and repairs 83 Radio and music
36 Shopping and services 9 Travel and unspecified time 37 Household management 90-98 Travel by purpose 38 Childcare 99 Unspecified time use 39 Help to an adult family member
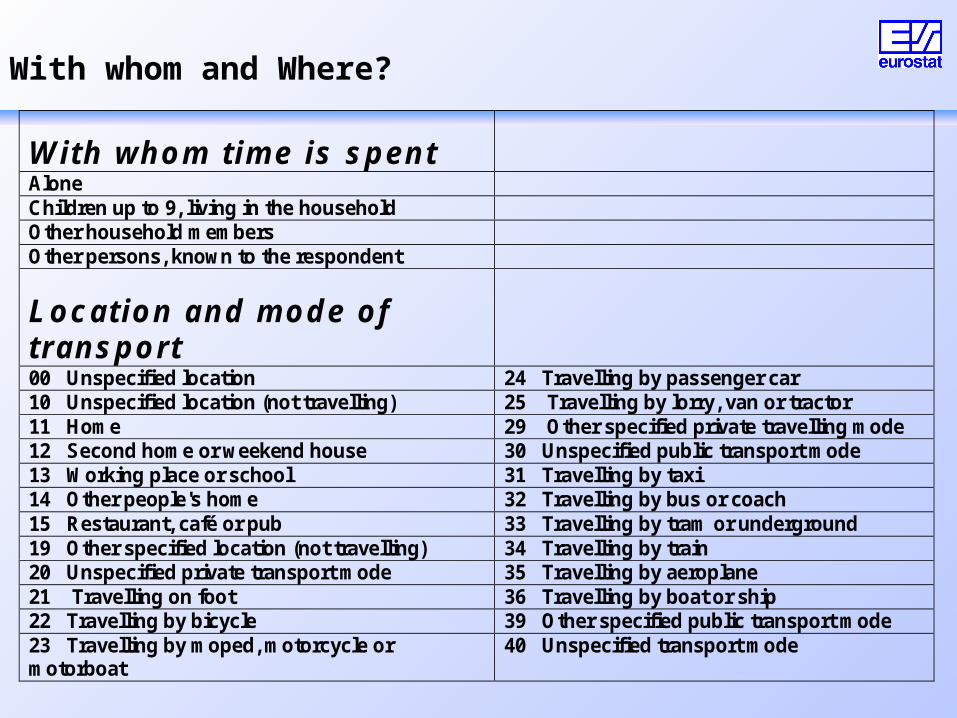
With whom and Where?
With whom time is spent Alone Children up to 9, living in the household Other household members Other persons, known to the respondent
Location and mode of transport
00 Unspecified location 24 Travelling by passenger car 10 Unspecified location (not travelling) 25 Travelling by lorry, van or tractor 11 Home 29 Other specified private travelling mode 12 Second home or weekend house 30 Unspecified public transport mode 13 Working place or school 31 Travelling by taxi 14 Other people's home 32 Travelling by bus or coach 15 Restaurant, café or pub 33 Travelling by tram or underground 19 Other specified location (not travelling) 34 Travelling by train 20 Unspecified private transport mode 35 Travelling by aeroplane 21 Travelling on foot 36 Travelling by boat or ship 22 Travelling by bicycle 39 Other specified public transport mode 23 Travelling by moped, motorcycle or motorboat
40 Unspecified transport mode
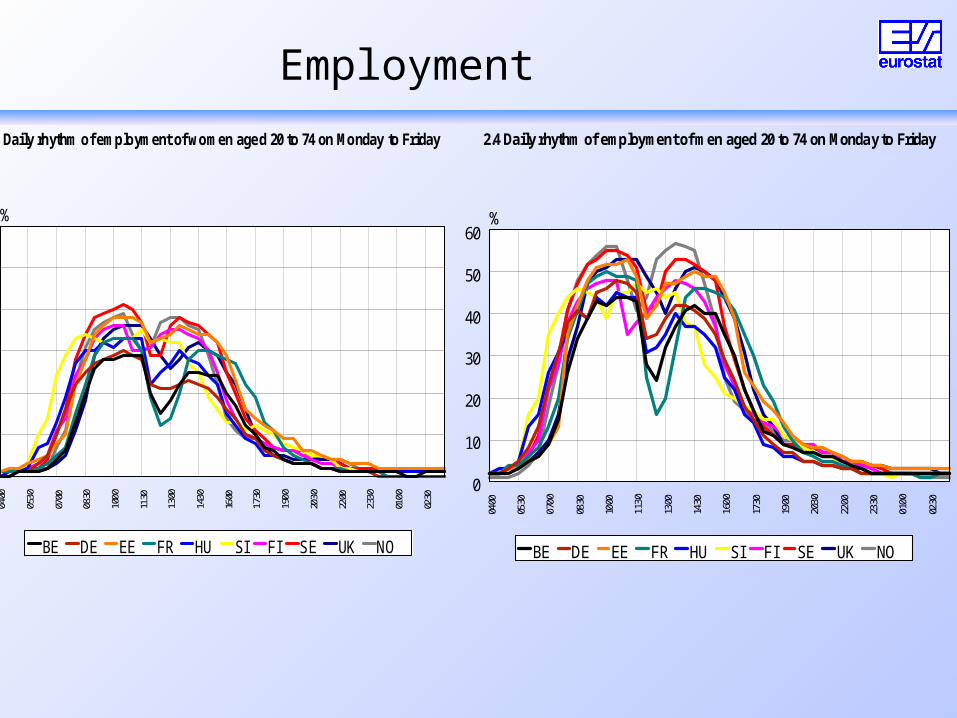
Employment
2.3 Daily rhythm of employment of women aged 20 to 74 on Monday to Friday
040 0
053 0
070 0
083 0
100 0
113 0
130 0
143 0
160 0
173 0
190 0
203 0
220 0
233 0
010 0
023 0
0
10
20
30
40
50
60%
BE DE EE FR HU SI FI SE UK NO
2.4 Daily rhythm of employment of men aged 20 to 74 on Monday to Friday
040 0
053 0
070 0
083 0
100 0
113 0
130 0
143 0
160 0
173 0
190 0
203 0
220 0
233 0
010 0
023 0
0
10
20
30
40
50
60%
BE DE EE FR HU SI FI SE UK NO
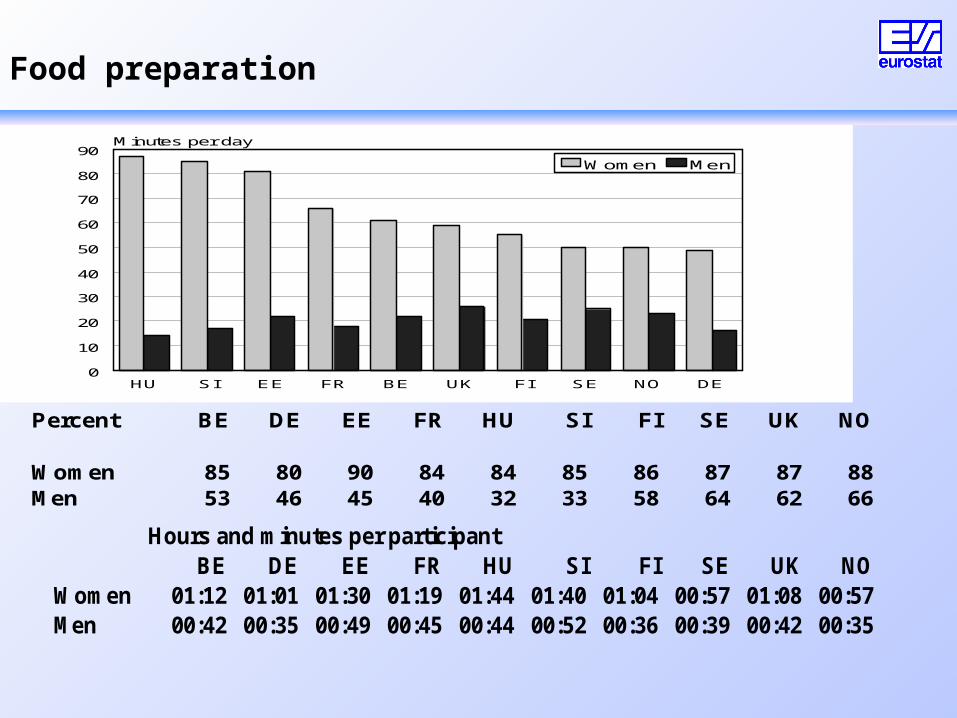
Food preparation5.3 Time spent on preparing food by women and men aged 20 to 74
HU SI EE FR BE UK FI SE NO DE0
10
20
30
40
50
60
70
80
90Minutes per day
Women Men
Percent BE DE EE FR HU SI FI SE UK NO
Women 85 80 90 84 84 85 86 87 87 88Men 53 46 45 40 32 33 58 64 62 66
Hours and minutes per participantBE DE EE FR HU SI FI SE UK NO
Women 01:12 01:01 01:30 01:19 01:44 01:40 01:04 00:57 01:08 00:57Men 00:42 00:35 00:49 00:45 00:44 00:52 00:36 00:39 00:42 00:35
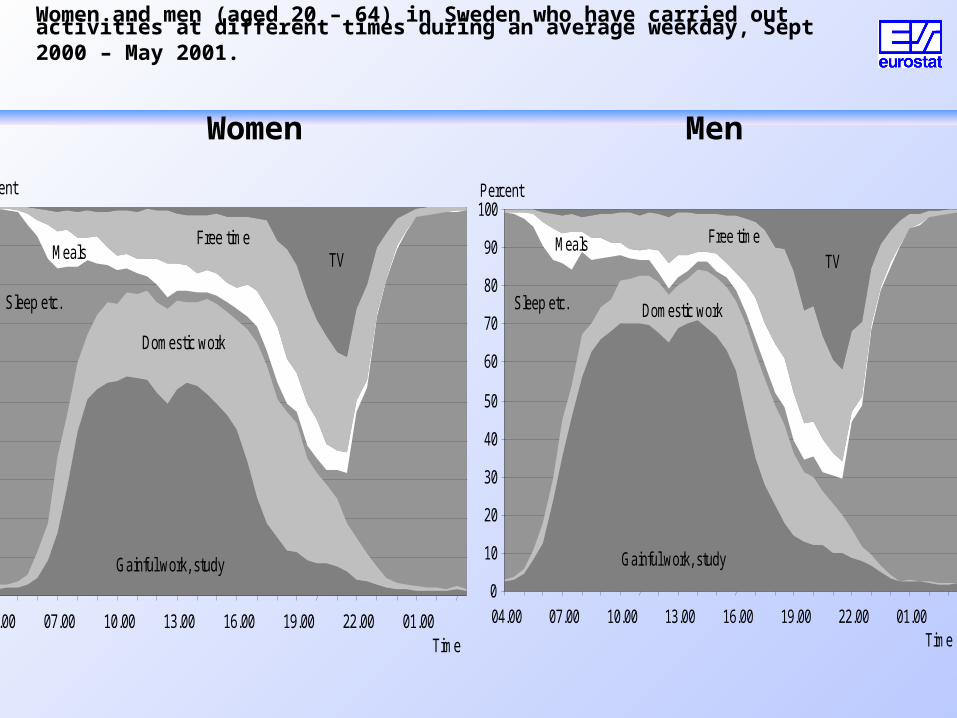
Women and men (aged 20 – 64) in Sweden who have carried out activities at different times during an average weekday, Sept 2000 – May 2001.
Women Men
0 10 20 30 40 50 60 70 80 90
100
04.00 07.00 10.00 13.00 16.00 19.00 22.00 01.00 Time
Percent
Gainful work, study
Domestic work Sleep etc.
TV Free time
Meals
0 10 20 30 40 50 60 70 80 90
100
04.00 07.00 10.00 13.00 16.00 19.00 22.00 01.00 Time
Percent
Domestic work Sleep etc. TV
Free time Meals
Gainful work, study