1
Massive stars (M > 10Mּס) end their life in
gravitational collapse of their core and formation
of a neutron star or a black hole by supernova
explosion. The structure of the progenitor star,
including that of its core, plays a substantial role
in the development of the explosion process.
Indeed, the efforts to simulate the explosion
numerically are found to make a substantial
difference in the ultimate outcome, depending
upon the progenitor models. Because the final
outcome of the explosion depends so sensitively
on a variety of physical inputs at the beginning
of each stage of the entire process (i.e., collapse,
shock formation, and shock propagation), it is
desirable to calculate the presupernova stellar
structure with the best possible physical data and
inputs currently available. The energy budget
would be balanced in favor of an explosion by a
smaller precollapse iron core mass.
The evolution of the massive stars and the
concomitant nucleosynthesis has been the
subject of much computation [1]. During the
later part of their burning cycles, these stars
develop an iron core and lack further nuclear
fuels (any transformation of the strongly-bound
iron nuclei is endothermic). The core steadily
becomes unstable and implodes as result of free-
electron captures and iron photodisintegration.
The collapse is very sensitive to the entropy and
to the number of leptons per baryon, Ye [2].
These two quantities are mainly determined by
weak interaction processes, namely electron
capture and β decay. The simulation of the core
collapse is very much dependent on the electron
capture of heavy nuclides [3]. In the early stage
of the collapse Ye is reduced as electrons are
captured by Fe peak nuclei. The late evolution
stages of massive stars are strongly influenced
Gamow-Teller strength distributions and electron capture rates for 55
Co and 56
Ni.
Jameel-Un Nabi
*, Muneeb-ur Rahman
Faculty of Engineering Sciences, GIK Institute of Engineering Sciences and
Technology, Topi 23460, N.W.F.P., Pakistan
Abstract. The Gamow-Teller strength (GT) distributions and electron capture rates on 55
Co and 56
Ni have been calculated using the proton-neutron quasiparticle random phase approximation
theory. We calculate these weak interaction mediated rates over a wide temperature (0.01x10⁹ –
30x109 K) and density (10 – 10
11 g cm
-3) domain. Electron capture process is one of the essential
ingredients involved in the complex dynamics of supernova explosion. Our calculations of
electron capture rates show differences with the reported shell model diagonalization approach
calculations and are comparatively enhanced at presupernova temperatures. We note that the GT
strength is fragmented over many final states.
PACS: 26.50.+x: 23.40.Bw: 23.40.-s: 21.60.Jz
Keywords: Gamow-Teller strength: Electron capture rates: Core collapse: pn-QRPA
* Corresponding author
e-mail: [email protected]
Phone: 0092-938-71858(ext. 2535), Fax: 0092-938-71862
2
by weak interactions which act to determine the
core entropy and electron to baryon ratio, Ye, of
the presupernova star, and hence its
Chandrasekhar mass which is proportional to
Ye2[4]. Electron capture reduces the number of
electrons available for pressure support, while
beta decay acts in the opposite direction. Both
processes produce neutrinos which, for densities
ρ ≤ 1011
g cm-3
, escape the star carrying away
energy and entropy from the core. Electron
capture and beta decay during the final evolution
of a massive star are dominated by Fermi and
Gamow-Teller (GT) transitions. In the
astrophysical scenario nuclei are fully ionized so
one has continuum electron capture from the
degenerate electron plasma. The energies of the
electrons are high enough to induce transitions to
the GT resonance.
Electron capture rates are very sensitive to the
distribution of the GT+ strength (in the GT+
strength, a proton is changed into a neutron).
GT+ strength distributions on nuclei in the mass
range A = 50-65 have been studied
experimentally via (n, p) charge-exchange
reactions at forward angles. Some were also
being measured [e.g. 5-9]. Results show that, in
contrast to the independent particle model, the
total GT+ strength is quenched and fragmented
over many final states in the daughter nucleus
caused by the residual nucleon-nucleon
correlations. Both these effects are caused by the
residual interaction among the valence nucleons
and an accurate description of these correlations
is essential for a reliable evaluation of the stellar
weak interaction rates due to the strong phase
space energy dependence, particularly of the
stellar electron capture rates.
Recognizing the vital role played by the electron
capture process, Fuller et .al (referred as FFN)
[10] estimated systematically the rates for nuclei
in the mass range A= 45-60 stressing on the
importance of capture process to the GT giant
resonance. The basic calculation was performed
using a zero-order shell model code. The
calculations of FFN have shown that for the
densities above 107 g cm
-3, electron capture
transitions to the GT resonance are an important
part of the rate.
The FFN rates were then updated taking into
account quenching of GT strength by an overall
factor of two by Aufderheide and collaborators
[11]. They also compiled a list of important
nuclides which affect Ye via the electron capture
processes. They ranked 55
Co and 56
Ni the most
important nuclei with respect to their importance
3
for the electron capture process for the early
presupernova collapse.
We account here the microscopic calculation of
electron capture rates in the stellar matter for the
nuclei 55
Co and 56
Ni using the proton-neutron
quasiparticle random phase approximation (pn-
QRPA) theory.
The pn-QRPA theory [12-14] has been shown to
be a good microscopic theory for the calculation
of beta decay half lives far from stability [14,
15]. The pn-QRPA theory was also successfully
employed in the calculation of β+/electron
capture half lives and again satisfactory
comparison with the experimental half-lives
were reported [16]. The pn-QRPA theory was
then extended to treat transitions from nuclear
excited states [17]. In view of success of the pn-
QRPA theory in calculating terrestrial decay
rates, Nabi and Klapdor used this theory to
calculate weak interaction mediated rates and
energy losses in stellar environment for sd- [18]
and fp/fpg-shell nuclides [19]. Reliability of the
calculated rates was also discussed in detail in
[19]. There the authors compared the measured
data of thousands of nuclides with the pn-QRPA
calculations and got good comparison (See also
[20]). Here we use this extended model to
calculate the electron capture rates in stellar
matter for 55
Co and 56
Ni pertaining to
presupernova and supernova conditions. The
main advantage of using the pn-QRPA theory is
that we can handle large configuration spaces, by
far larger than possible in any shell model
calculations. We include in our calculations
parent excitation energies well in excess of 10
MeV (compared to a few MeV tractable by shell
model calculations). In our model, we considered
a model space up to 7 major shells.
Our Hamiltonian, QRPA sp pair ph pp
GT GTH = H + V + V + V ,
is diagonalized in three consecutive steps. Single
particle energies and wave functions are
calculated in the Nilsson model [21], which takes
into account nuclear deformations. Pairing is
treated in the BCS approximation. The proton-
neutron residual interactions occur in two
different forms, namely as particle-hole and
particle-particle interaction. The interactions are
given separable form and are characterized by
two interaction constants χ and κ, respectively.
The selections of these two constants are done in
an optimal fashion. Details of the model
parameters can be seen in [16, 22]. In this work,
we took χ = 0.2 MeV and κ = 0.007 MeV for
55Co. The corresponding values for
56Ni were 0.5
MeV and 0.065 MeV, respectively. Q values
were taken from [23].
4
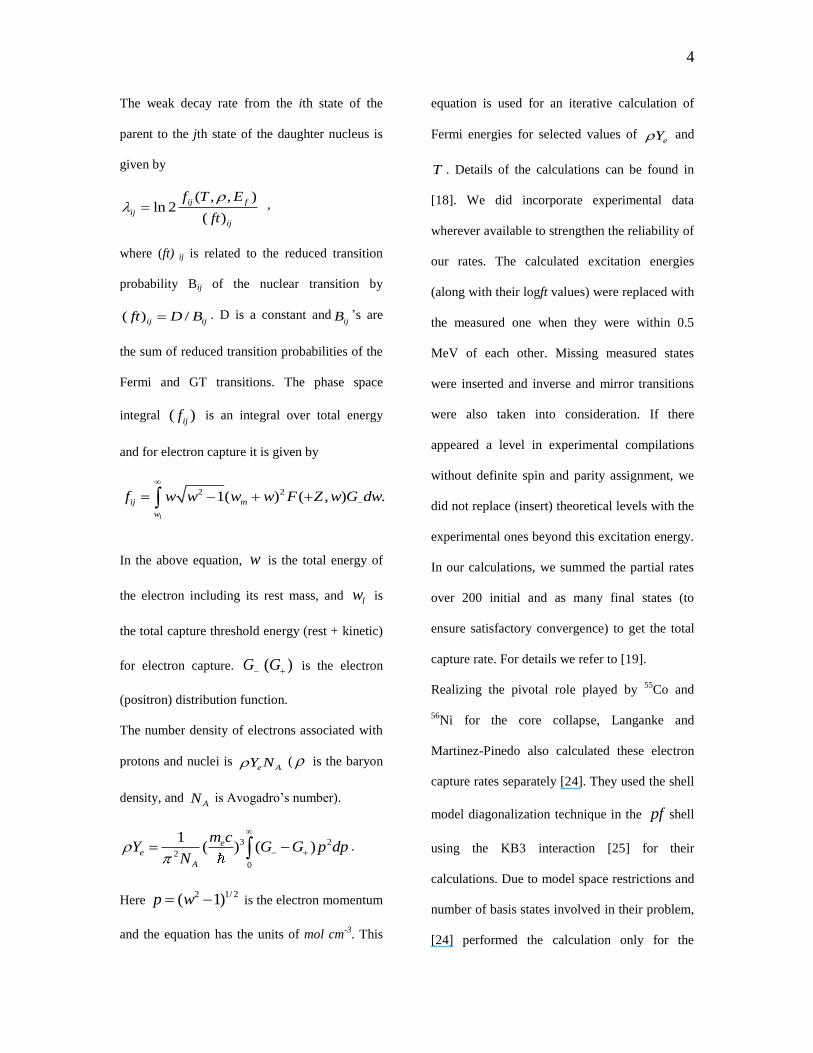
The weak decay rate from the ith state of the
parent to the jth state of the daughter nucleus is
given by
( , , )ln 2
( )
ij f
ij
ij
f T E
ft
,
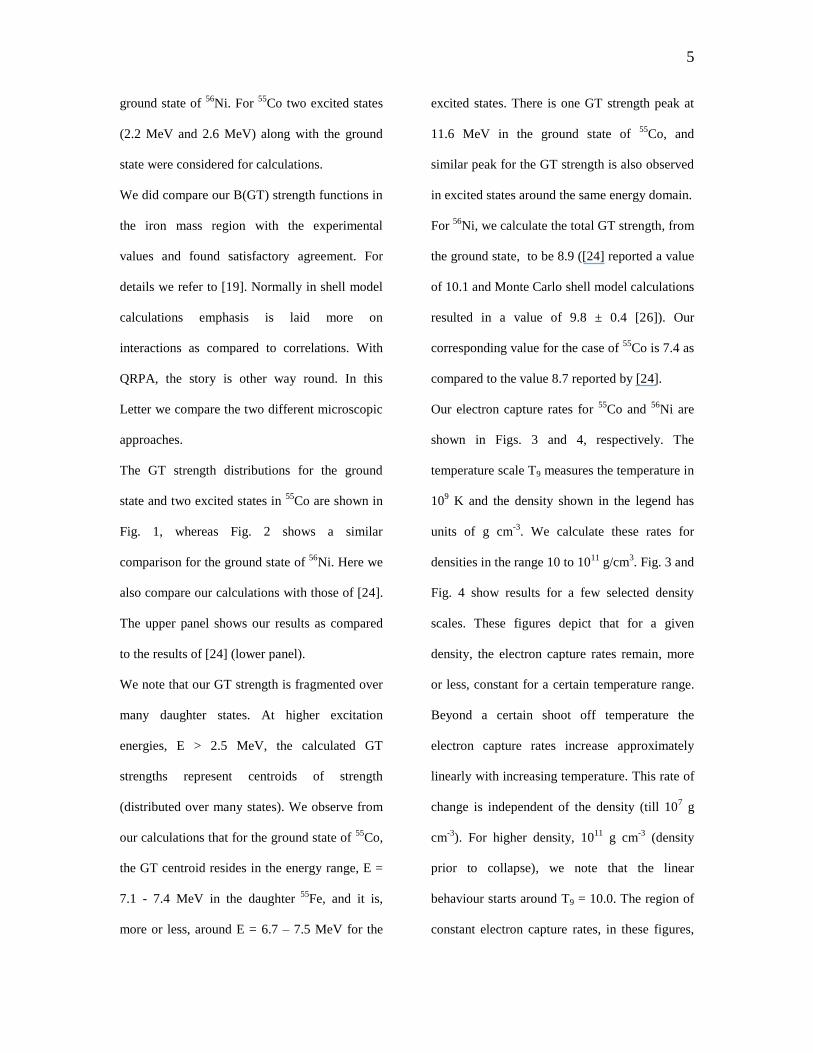
where (ft) ij is related to the reduced transition
probability Bij of the nuclear transition by
( ) /ij ijft D B . D is a constant andijB ’s are
the sum of reduced transition probabilities of the
Fermi and GT transitions. The phase space
integral ( )ijf is an integral over total energy
and for electron capture it is given by
1
2 21( ) ( , ) .ij m
w
f w w w w F Z w G dw
In the above equation, w is the total energy of
the electron including its rest mass, and lw is
the total capture threshold energy (rest + kinetic)
for electron capture. G ( )G is the electron
(positron) distribution function.
The number density of electrons associated with
protons and nuclei is e AY N ( is the baryon
density, and AN is Avogadro’s number).
3 2
2
0
1( ) ( )e
e
A
m cY G G p dp
N
.
Here 2 1/ 2( 1)p w is the electron momentum
and the equation has the units of mol cm-3
. This
equation is used for an iterative calculation of
Fermi energies for selected values of eY and
T . Details of the calculations can be found in
[18]. We did incorporate experimental data
wherever available to strengthen the reliability of
our rates. The calculated excitation energies
(along with their logft values) were replaced with
the measured one when they were within 0.5
MeV of each other. Missing measured states
were inserted and inverse and mirror transitions
were also taken into consideration. If there
appeared a level in experimental compilations
without definite spin and parity assignment, we
did not replace (insert) theoretical levels with the
experimental ones beyond this excitation energy.
In our calculations, we summed the partial rates
over 200 initial and as many final states (to
ensure satisfactory convergence) to get the total
capture rate. For details we refer to [19].
Realizing the pivotal role played by 55
Co and
56Ni for the core collapse, Langanke and
Martinez-Pinedo also calculated these electron
capture rates separately [24]. They used the shell
model diagonalization technique in the pf shell
using the KB3 interaction [25] for their
calculations. Due to model space restrictions and
number of basis states involved in their problem,
[24] performed the calculation only for the
5
ground state of 56
Ni. For 55
Co two excited states
(2.2 MeV and 2.6 MeV) along with the ground
state were considered for calculations.
We did compare our B(GT) strength functions in
the iron mass region with the experimental
values and found satisfactory agreement. For
details we refer to [19]. Normally in shell model
calculations emphasis is laid more on
interactions as compared to correlations. With
QRPA, the story is other way round. In this
Letter we compare the two different microscopic
approaches.
The GT strength distributions for the ground
state and two excited states in 55
Co are shown in
Fig. 1, whereas Fig. 2 shows a similar
comparison for the ground state of 56
Ni. Here we
also compare our calculations with those of [24].
The upper panel shows our results as compared
to the results of [24] (lower panel).
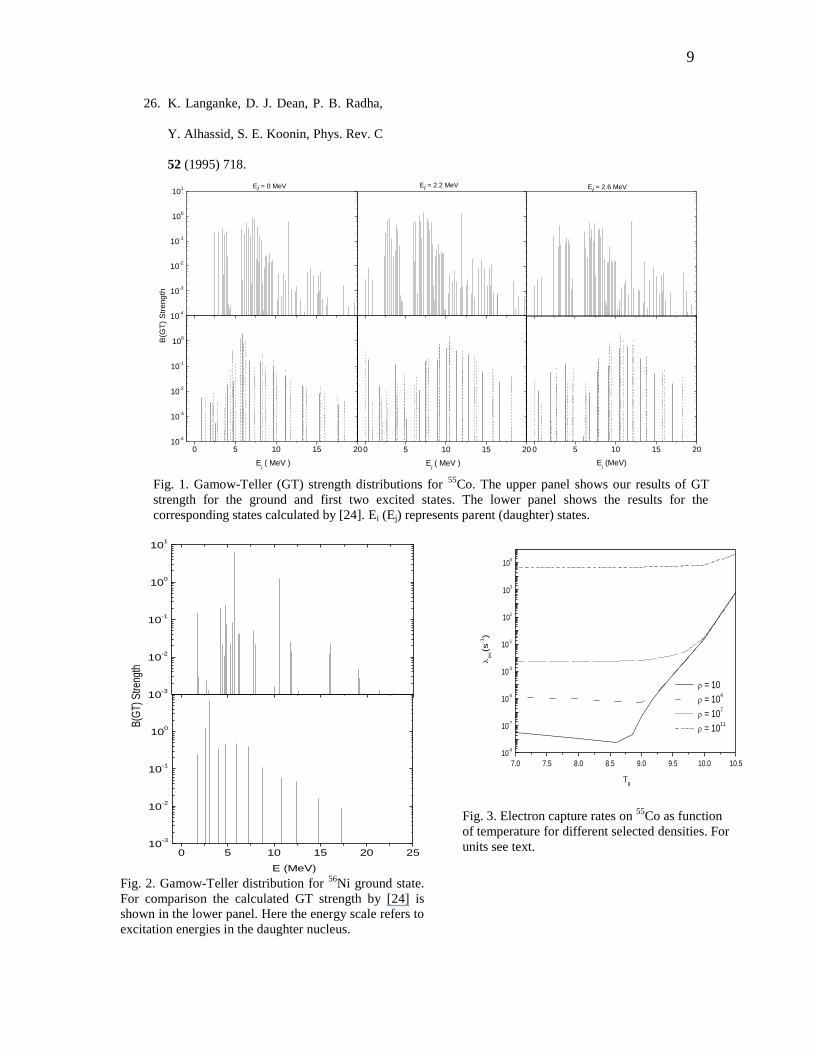
We note that our GT strength is fragmented over
many daughter states. At higher excitation
energies, E > 2.5 MeV, the calculated GT
strengths represent centroids of strength
(distributed over many states). We observe from
our calculations that for the ground state of 55
Co,
the GT centroid resides in the energy range, E =
7.1 - 7.4 MeV in the daughter 55
Fe, and it is,
more or less, around E = 6.7 – 7.5 MeV for the
excited states. There is one GT strength peak at
11.6 MeV in the ground state of 55
Co, and
similar peak for the GT strength is also observed
in excited states around the same energy domain.
For 56
Ni, we calculate the total GT strength, from
the ground state, to be 8.9 ([24] reported a value
of 10.1 and Monte Carlo shell model calculations
resulted in a value of 9.8 ± 0.4 [26]). Our
corresponding value for the case of 55
Co is 7.4 as
compared to the value 8.7 reported by [24].
Our electron capture rates for 55
Co and 56
Ni are
shown in Figs. 3 and 4, respectively. The
temperature scale T9 measures the temperature in
109 K and the density shown in the legend has
units of g cm-3
. We calculate these rates for
densities in the range 10 to 1011
g/cm3. Fig. 3 and
Fig. 4 show results for a few selected density
scales. These figures depict that for a given
density, the electron capture rates remain, more
or less, constant for a certain temperature range.
Beyond a certain shoot off temperature the
electron capture rates increase approximately
linearly with increasing temperature. This rate of
change is independent of the density (till 107 g
cm-3
). For higher density, 1011
g cm-3
(density
prior to collapse), we note that the linear
behaviour starts around T9 = 10.0. The region of
constant electron capture rates, in these figures,
6
with increasing temperature, shows that before
core collapse the beta-decay competes with
electron capture rate.
At later stages of the collapse, beta-decay
becomes unimportant as an increased electron
chemical potential, which grows like ρ1/3
during
infall, drastically reduces the phase space. This
results in increased electron capture rates during
the collapse making the matter composition more
neutron-rich. Beta-decay is thus rather
unimportant during the collapse phase due to the
Pauli-blocking of the electron phase space in the
final state.
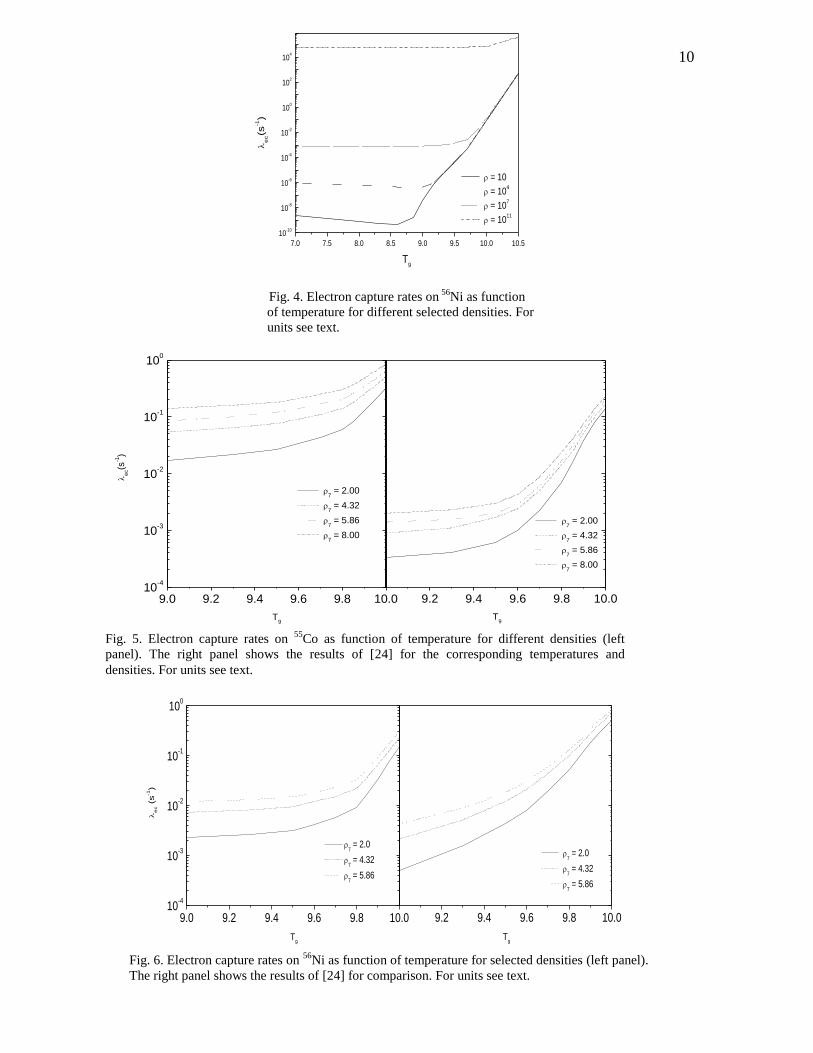
How do our rates compare with those of [24]?
The comparison is shown in Fig. 5 and Fig. 6 for
55Co and
56Ni, respectively. Here the right panel
shows the rate of [24]. Our rates are depicted in
the left panel. These calculations were performed
for the same temperature and density scale as
done by [24]. ρ7 implies density in units of 107
g cm-3
and T9 measures temperature in 109 K.
For 55
Co, our rates are much stronger and differ
by almost two orders of magnitude at low
temperatures as compared to those of [24]. At
higher temperatures our rates are still a factor of
two more than those of [24].
For the other interesting case, 56
Ni, the story is
different. Here at low temperatures our rates are
still enhanced (by a factor of 4 at low
temperatures and densities). At intermediate
temperatures and density scales we are in good
agreement and then at high temperatures and
densities, shell model rates surpass our rates (by
as much as a factor of 3). The difference
decreases with increasing density. Collapse
simulators should take note of our enhanced rate
at presupernova temperatures. We took into
consideration low-lying parent excited states in
our rate calculations without assuming the so-
called Brink’s hypothesis (which states that the
GT strength distribution on excited states is
identical to that from the ground state, shifted
only by the excitation energy of the state).
What implications do these rates have on the
dynamics of core collapse? The nuclei which
cause the largest change in Ye are the most
abundant ones and the ones with the strongest
rates. Incidentally, the most abundant nuclei tend
to have small rates (they are more stable) and the
most reactive nuclei tend to be present in minor
quantities.
Our calculation certainly points to a much more
enhanced capture rates as compared to those
given in [24]. The electron capture rates reported
here can have a significant astrophysical impact.
According to the authors in [11], e (rate of
7
change of lepton-to-baryon ratio) changes by
about 50% due to electron capture on 55
Co (and
about 25% for the case of 56
Ni). It will be very
interesting to see if these rates are in favor of a
prompt collapse of the core. We also note that
authors in [3] do point towards the fact that the
spherically symmetric core collapse simulations,
taking into consideration electron capture rates
on heavy nuclides, still do not explode because
of the reduced electron capture in the outer
layers slowing the collapse and resulting in a
shock radius of slightly larger magnitude. We are
in a process of finding the affect of inclusion of
our rates in stellar evolution codes and hope to
soon report our results.
References
1. W. D. Arnett, Supernovae and
Nucleosynthesis. (Princeton: Princeton
Uni. Press) 1996.
2. H. A. Bethe, G. E. Brown, J. Applegate,
J. M. Lattimer, Nucl. Phys. A 324
(1979) 487.
3. W. R. Hix, O.E.B. Messer, A.
Mezzacappa, M. Liebendörfer, J.
Sampaio, K. Langanke, D.J. Dean and
G. Martinez-Pinedo, Phys. Rev. Lett.
91(2003)201102; K. Langanke, G.
Martinez-Pinedo, J.M. Sampaio, D.J.
Dean, W.R. Hix, O.E.B. Messer, A.
Mezzacappa, M. Liebendörfer, H.Th.
Janka and M. Rampp, Phys. Rev. Lett.
90(2003)241102.
4. K. Langanke, G. Martinez-Pinedo, Rev.
Mod. Phys. 75 (2003) 819.
5. W. P. Alford, R. L. Helmer, R. Abegg,
A. Celler, D. Frekers, P. Green, O.
Hausser, R. Henderson, K. Hicks, K. P.
Jackson, R. Jappesen, C. A. Miller, A.
Trudel, M. Vetterli, S. Yen, R. Pourang,
J. Watson, B. A. Brown, J. Engel, Nucl.
Phys. A 514 (1990) 49.
6. M. C. Vetterli, O. Häusser, R. Abegg,
W. P. Alford, A. Celler, D. Frekers, R.
Helmer, R. Henderson, K. H. Hicks, K.
P. Jackson, R. G. Jeppesen, C. A.
Miller, K. Raywood, and S. Yen, Phys.
Rev. C 40 (1989) 559.
7. S. El-Kateb, K. P. Jackson, W. P.
Alford, R. Abegg, R. E. Azuma, B. A.
Brown, A. Celler, D. Frekers, O.
Häusser, R. Helmer, R. S. Henderson,
K. H. Hicks, R. Jeppesen, J. D. King, G.
G. Shute, B. M. Spicer, A. Trudel, K.
Raywood, M. Vetterli, and S. Yen,
Phys. Rev. C 49 (1994) 3129.
8
8. T. Rönnquist, H. Conde, N. Olsson, E.
Remstrom, R. Zorro, J. Blomgreen, A.
Hakansson, A. Ringbom, G. Tibell, O.
Jonsson, L. Nilsson, P. –U. Renberg, S.
Y. Van Der Werf, W. Unkelbach, F. P.
Brady, Nucl. Phys. A 563 (1993) 225.
9. A. L. Williams A. L. Williams, W. P.
Alford, E. Brash, B. A. Brown, S.
Burzynski, H. T. Fortune, O. Häusser,
R, Helmer, R. Henderson, P. P. Hui, K.
P. Jackson, B. Larson, M. G. McKinzie,
D. A. Smith, A. Trudel, and M. Vetterli
Phys. Rev. C 51 (1995) 1144.
10. G. M. Fuller, W. A. Fowler, M. J.
Newman, ApJS 42 (1980) 447; 48
(1982) 279; ApJ 252 (1982) 715; 293
(1985) 1.
11. M. B. Aufderheide, I. Fushiki, S. E.
Woosley, D. H. Hartmann, Astrophys.
J. Suppl. 91 (1994) 389.
12. J. A. Halbleib, R. A. Sorensen, Nucl.
Phys. A 98 (1967) 542.
13. J. Krumlinde, P. Möller, Nucl. Phys. A
417 (1984) 419.
14. K. Muto, E. Bender, H. V. Klapdor-
Kleingrothaus, Z. Phys. A 334 (1989)
187.
15. A. Staudt, E. Bender, K. Muto, H. V.
Klapdor, Z. Phys. A 334 (1989) 47.
16. M. Hirsch, A. Staudt, K. Muto, H. V.
Klapdor-Kleingrothaus, Atomic Data
and Nuclear Data Tables 53 (1993) 165.
17. K. Muto, E. Bender, T. Oda, H. V.
Klapdor, Z. Phys. A 341 (1992) 407.
18. J.-Un Nabi, H. V. Klapdor-
Kleingrothaus, Atomic Data and
Nuclear Data Tables 71 (1999) 149.
19. J.-Un Nabi, H. V. Klapdor-
Kleingrothaus, accepted for publication
in Atomic Data and Nuclear Data
Tables (2004).
20. J.-Un Nabi, H. V. Klapdor-
Kleingrothaus, Eur. Phys. J. A 5 (1999)
337.
21. S. G. Nilsson, Mat. Fys. Medd. Dan.
Vid. Selsk 29(1955) No. 16.
22. A. Staudt, E. Bender, K. Muto, H. V.
Klapdor-Kleingrothaus, Atomic Data &
Nuclear Data Tables 44(1990)79.
23. W. D. Myers, W. J. Swiatecki, Nucl.
Phys. A 601(1996)141.
24. K. Langanke, G. Martinez-Pinedo,
Physics Letters B 436 (1998) 19.
25. T. Kuo, G. E. Brown, Nucl. Phys. A
114 (1968) 241.
9
26. K. Langanke, D. J. Dean, P. B. Radha,
Y. Alhassid, S. E. Koonin, Phys. Rev. C
52 (1995) 718.
0 5 10 15 2010
-4
10-3
10-2
10-1
100
Ej ( MeV )
0 5 10 15 20
Ej ( MeV )
0 5 10 15 20
Ej (MeV)
Ei = 2.2 MeV
Ei = 2.6 MeV
10-4
10-3
10-2
10-1
100
101
B(G
T)
Str
en
gth
Ei = 0 MeV
Fig. 1. Gamow-Teller (GT) strength distributions for
55Co. The upper panel shows our results of GT
strength for the ground and first two excited states. The lower panel shows the results for the
corresponding states calculated by [24]. Ei (Ej) represents parent (daughter) states.
10-3
10-2
10-1
100
101
B(G
T) S
treng
th
0 5 10 15 20 2510
-3
10-2
10-1
100
E (MeV)
Fig. 2. Gamow-Teller distribution for 56
Ni ground state.
For comparison the calculated GT strength by [24] is
shown in the lower panel. Here the energy scale refers to
excitation energies in the daughter nucleus.
7.0 7.5 8.0 8.5 9.0 9.5 10.0 10.5
10-9
10-7
10-5
10-3
10-1
101
103
105
e
c(s
-1)
9
= 10
= 104
= 107
= 1011
Fig. 3. Electron capture rates on
55Co as function
of temperature for different selected densities. For
units see text.
10
Fig. 6. Electron capture rates on
56Ni as function of temperature for selected densities (left panel).
The right panel shows the results of [24] for comparison. For units see text.
9.0 9.2 9.4 9.6 9.8 10.010
-4
10-3
10-2
10-1
100
e
c (
s-1)
T9
7 = 2.0
7 = 4.32
7 = 5.86
9.2 9.4 9.6 9.8 10.0
T9
7 = 2.0
7 = 4.32
7 = 5.86
9.2 9.4 9.6 9.8 10.0
T
9
7 = 2.00
7 = 4.32
7 = 5.86
7 = 8.00
9.0 9.2 9.4 9.6 9.8 10.010
-4
10-3
10-2
10-1
100
e
c(s
-1)
T9
7 = 2.00
7 = 4.32
7 = 5.86
7 = 8.00
Fig. 5. Electron capture rates on 55
Co as function of temperature for different densities (left
panel). The right panel shows the results of [24] for the corresponding temperatures and
densities. For units see text.
7.0 7.5 8.0 8.5 9.0 9.5 10.0 10.5
10-10
10-8
10-6
10-4
10-2
100
102
104
= 10
= 104
= 107
= 1011
e
c(s
-1)
T9
Fig. 4. Electron capture rates on 56
Ni as function
of temperature for different selected densities. For
units see text.