RGI meeting, 24th Oct 2018
Future Energy Scenarios 2018

2
Contents
1 What is FES?
2 How we develop our scenarios
3 FES 2018: decentralisation, decarbonisation, demand, electricity supply
4 Stakeholder engagement
3
Future Energy Scenarios (FES)
FES presents the credible pathways
for electricity and gas in Great Britain
between now and
2050. It is used to underpin a number
of System Operator business activities
including how we
develop and operate our networks
The Future Energy
Scenarios (FES) are
produced annually by
National Grid System
Operator.
FES is a dual fuel product
presenting the pathways for
the future of electricity and
gas in Great.
It includes cross-sector
analysis of power, transport
and heat to ensure our
scenarios are self-
consistent.
It is used to underpin a
number of System Operator
activities to help us develop
and operate our networks as
the energy landscape
transforms around us on the
path towards
decarbonisation, while
ensuring security of supply
is maintained.
4
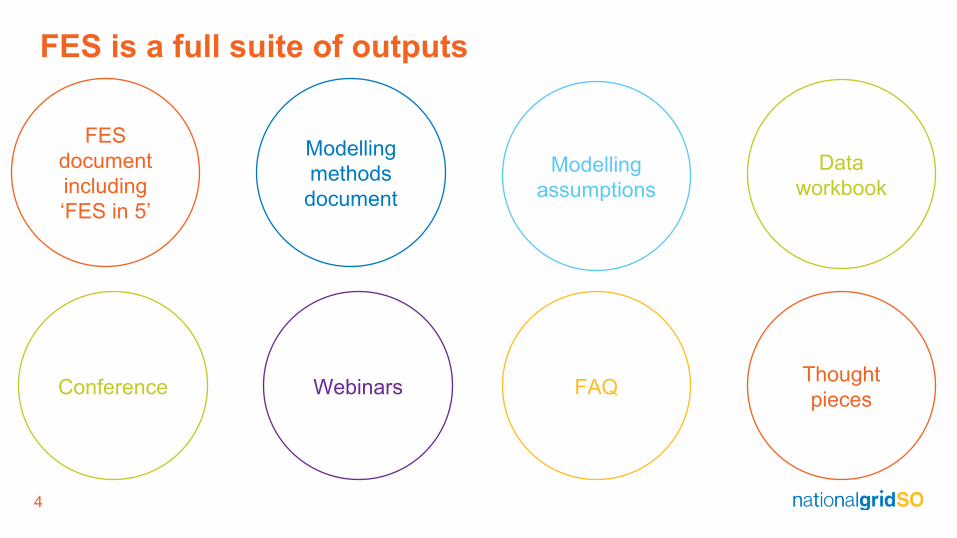
FES is a full suite of outputs
Modelling
assumptions
FAQWebinars
FES
document
including
‘FES in 5’
Conference
Modelling
methods
document
Thought
pieces
Data
workbook
5
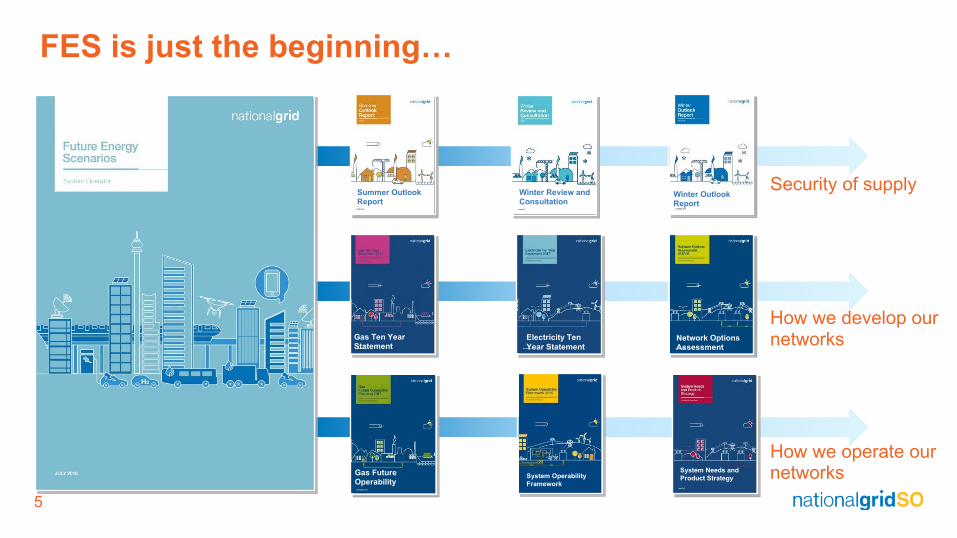
FES is just the beginning…
Summer Outlook Report
System Needs and
Product Strategy
Winter Review and Consultation
Electricity Ten
Year Statement
Winter Outlook Report
Gas Ten Year Statement
Network Options Assessment
Gas Future Operability
System Operability
Framework
Security of supply
How we develop our networks
How we operate our networks

6
Meet the team

7
How we produce FES
FES is an annual
process incorporating
stakeholder feedback
high-level scenario
development followed
by detailed modelling
and analysis
8
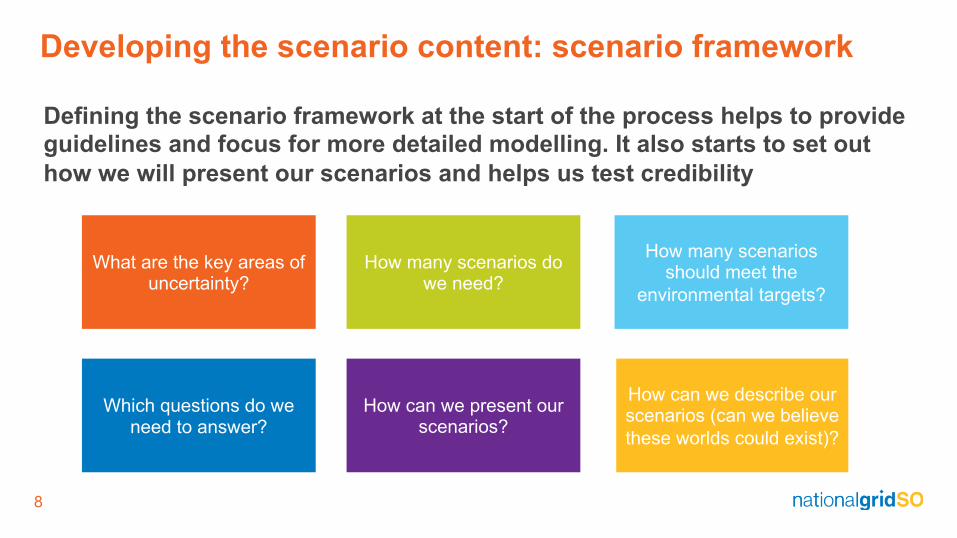
Developing the scenario content: scenario framework
How many scenarios do we need?
What are the key areas of uncertainty?
How can we describe our scenarios (can we believe
these worlds could exist)?
How can we present our scenarios?
Which questions do we need to answer?
How many scenarios should meet the
environmental targets?
Defining the scenario framework at the start of the process helps to provide
guidelines and focus for more detailed modelling. It also starts to set out
how we will present our scenarios and helps us test credibility

9
Developing the scenario content: modelling constraints
There are two significant modelling
constraints for our scenarios to ensure
that security of
supply standards are met in all scenarios
and that environmental
targets are met in
decarbonised scenarios
Decarbonisation
Any scenario that meets
the decarbonisation targets must achieve an
80% reduction in carbon
emissions compared to 1990 levels across all
sectors (power, transport, heat, aviation, shipping..)
Uncertainty around Paris
/ IPCC (1.5 degrees) and net zero
Security of supply
All scenarios have to
meet security of supply standards for electricity
and gas in all years
between now and 2050
Electricity: 3 hours loss of
load expectation per year
Gas: N-1 criteria
10
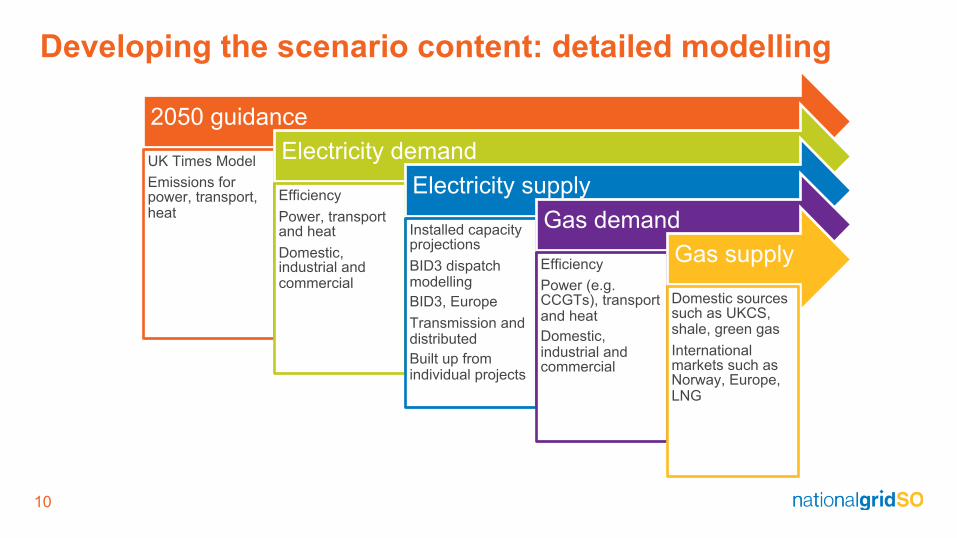
Developing the scenario content: detailed modelling
2050 guidance
UK Times Model
Emissions for power, transport, heat
Electricity demand
Efficiency
Power, transport and heat
Domestic, industrial and commercial
Electricity supply
Installed capacity projections
BID3 dispatch modelling
BID3, Europe
Transmission and distributed
Built up from individual projects
Gas demand
Efficiency
Power (e.g. CCGTs), transport and heat
Domestic, industrial and commercial
Gas supply
Domestic sources such as UKCS, shale, green gas
International markets such as Norway, Europe, LNG
11
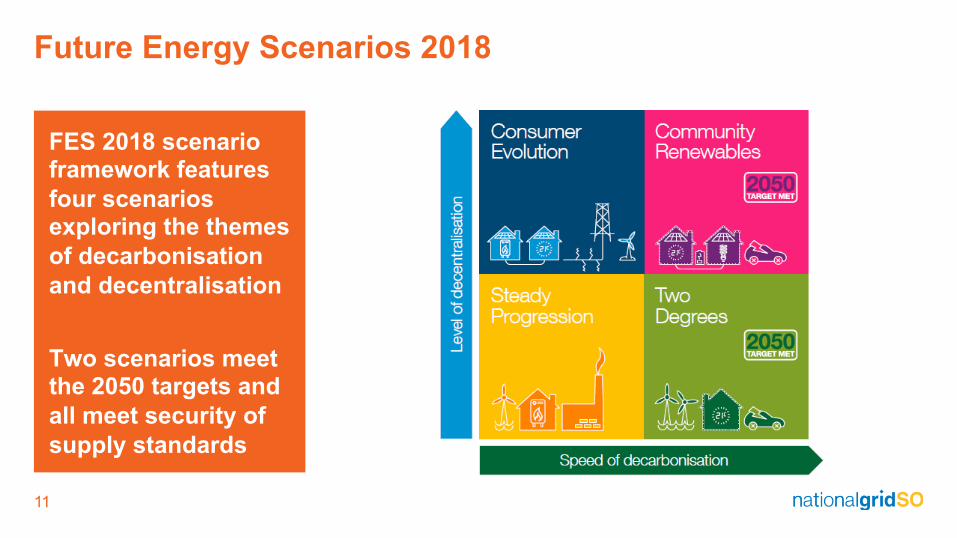
Future Energy Scenarios 2018
FES 2018 scenario framework features
four scenarios exploring the themes
of decarbonisation
and decentralisation
Two scenarios meet the 2050 targets and
all meet security of
supply standards
12
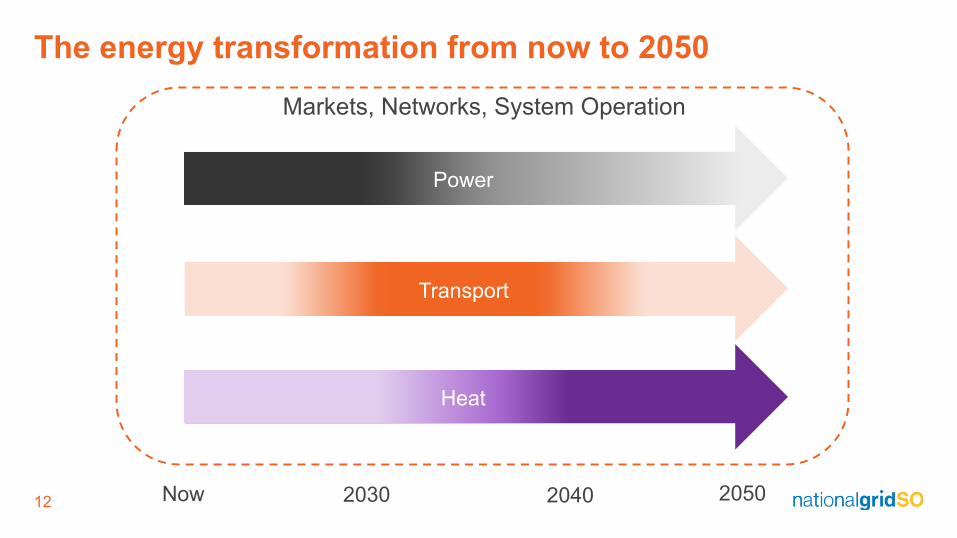
The energy transformation from now to 2050
Power
Heat
Transport
Now 2030 2040 2050
Markets, Networks, System Operation

13
Decentralisation
In FES 2018 we defined
decentralisation as referring to where
energy technologies
/ solutions are located on the
network. While this is clearer for supply,
the concept of
decentralisation for demand is trickier.
Decentralised
Centralised
Solar Onshore wind Heat pumps Biogas
Offshore wind Nuclear CCUS Hydrogen
14
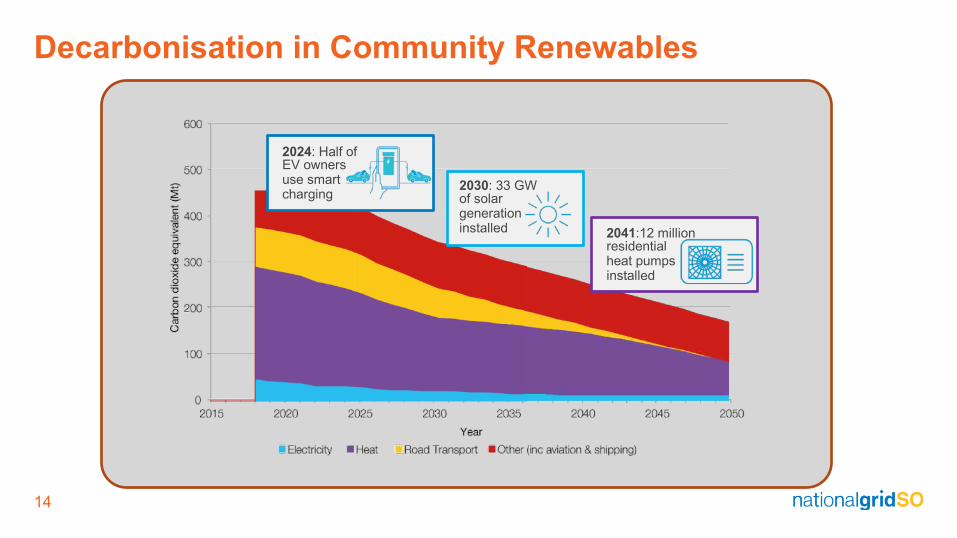
Decarbonisation in Community Renewables
2024: Half of EV owners use smart charging
2030: 33 GW of solar generation installed 2041:12 million
residential heat pumps installed
15
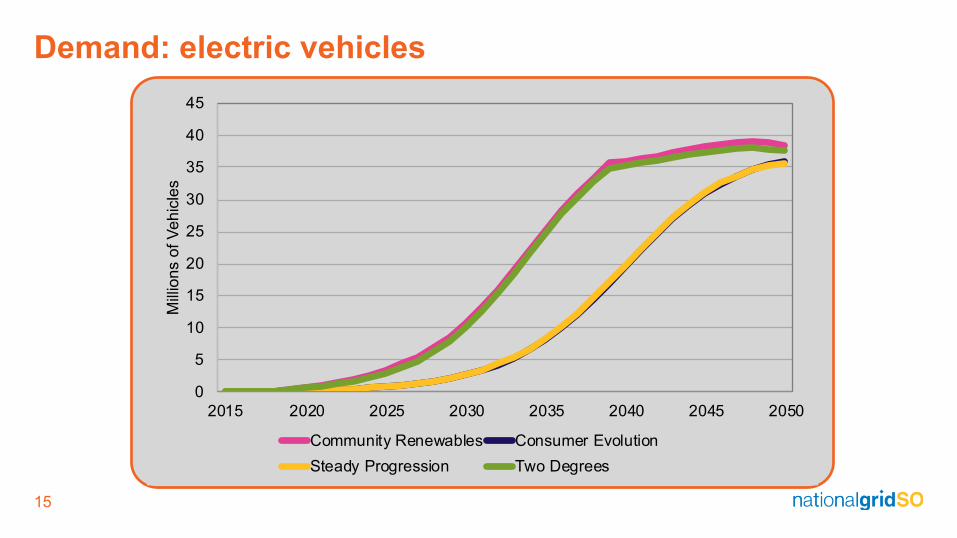
Demand: electric vehicles
0
5
10
15
20
25
30
35
40
45
2015 2020 2025 2030 2035 2040 2045 2050
Mill
ion
s o
f V
eh
icle
s
Community Renewables Consumer Evolution
Steady Progression Two Degrees
16
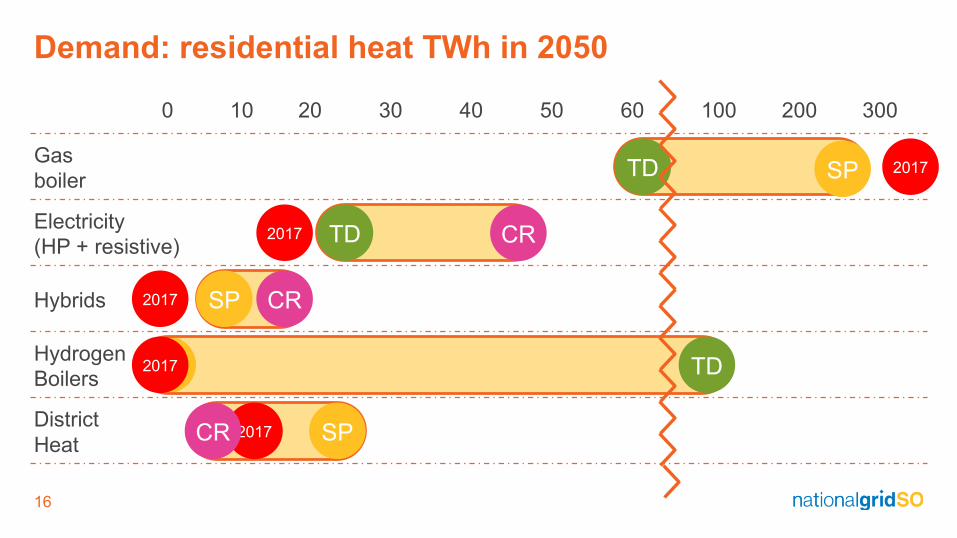
Demand: residential heat TWh in 2050
SP
0 10 20 30 40 50 60 100 200 300
TD SPGas
boiler2017
Electricity
(HP + resistive)TD
Hybrids CRSP2017
Hydrogen
BoilersTD2017
District
Heat2017 SPCR
2017 CR

17
Demand: hydrogen in 2050
18
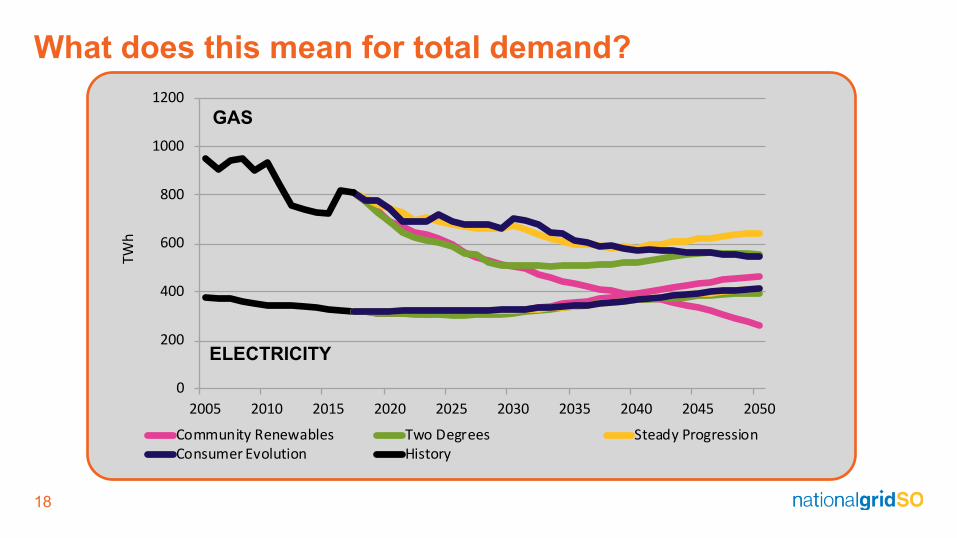
What does this mean for total demand?
0
200
400
600
800
1000
1200
2005 2010 2015 2020 2025 2030 2035 2040 2045 2050
TW
h
Community Renewables Two Degrees Steady Progression
Consumer Evolution History
GAS
ELECTRICITY
19
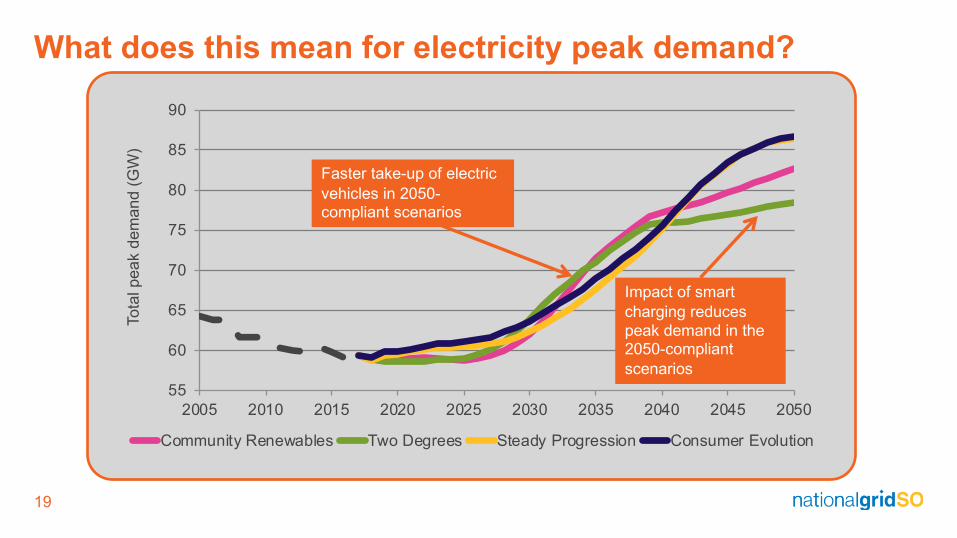
What does this mean for electricity peak demand?
55
60
65
70
75
80
85
90
2005 2010 2015 2020 2025 2030 2035 2040 2045 2050
To
tal p
ea
k d
em
an
d (
GW
)
Community Renewables Two Degrees Steady Progression Consumer Evolution
Faster take-up of electric
vehicles in 2050-compliant scenarios
Impact of smart
charging reduces
peak demand in the 2050-compliant
scenarios
20
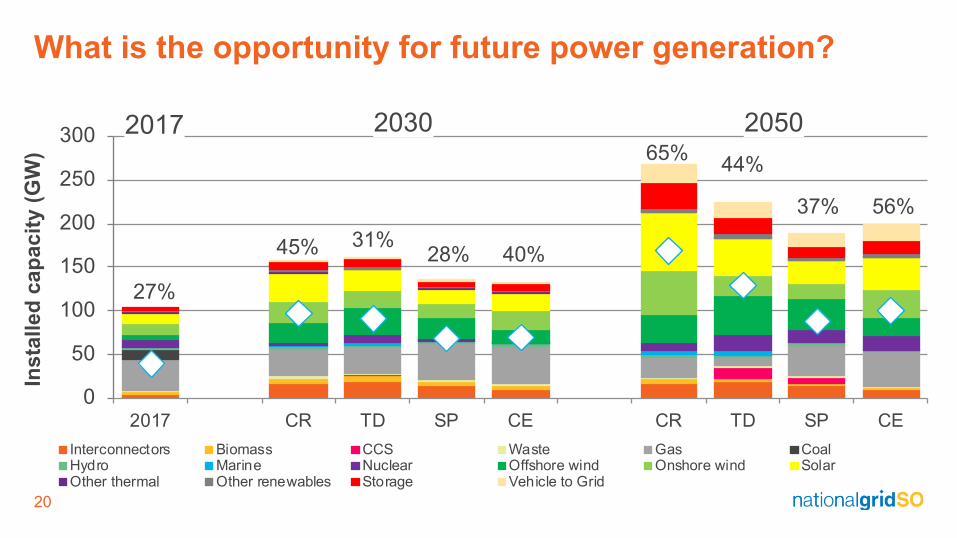
What is the opportunity for future power generation?
0
50
100
150
200
250
300
2017 CR TD SP CE CR TD SP CE
Ins
talled
ca
pa
cit
y (
GW
)
Interconnectors Biomass CCS Waste Gas CoalHydro Marine Nuclear Offshore wind Onshore wind SolarOther thermal Other renewables Storage Vehicle to Grid
2017 2030 2050
27%
45% 31%28% 40%
65%44%
37% 56%
21
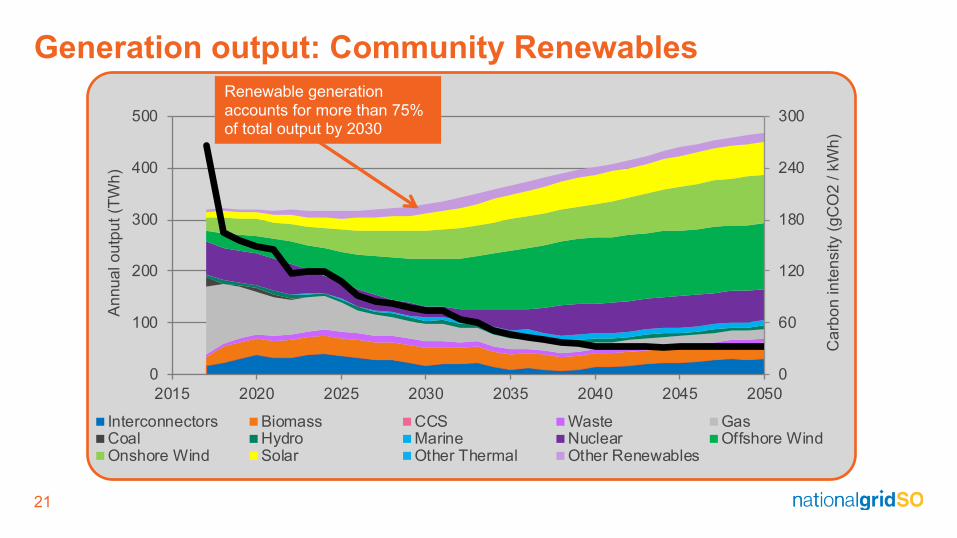
Generation output: Community Renewables
0
60
120
180
240
300
0
100
200
300
400
500
2015 2020 2025 2030 2035 2040 2045 2050
Ca
rbo
n in
ten
sity (
gC
O2
/ k
Wh
)
An
nu
al o
utp
ut
(TW
h)
Interconnectors Biomass CCS Waste GasCoal Hydro Marine Nuclear Offshore WindOnshore Wind Solar Other Thermal Other Renewables
Renewable generation
accounts for more than 75% of total output by 2030
22
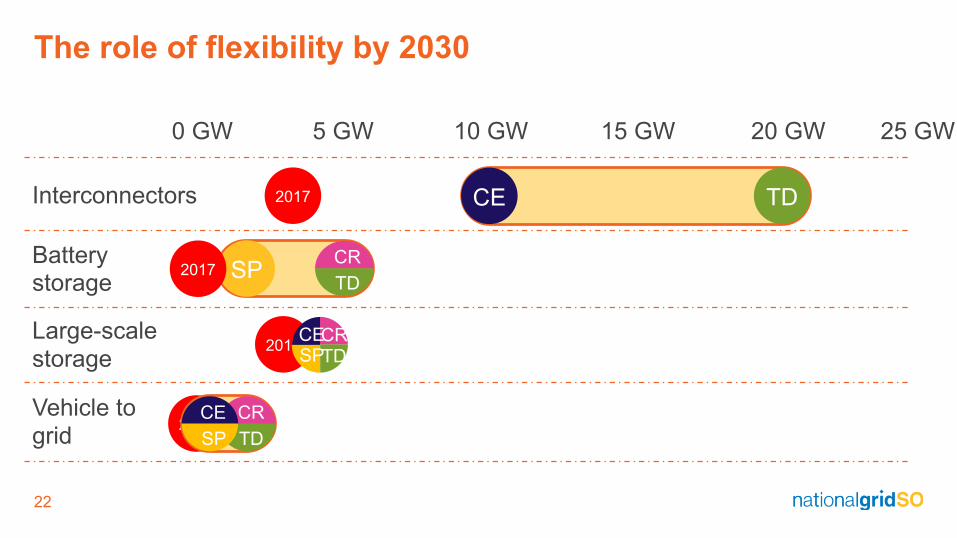
The role of flexibility by 2030
0 GW 5 GW 10 GW 15 GW 20 GW 25 GW
SPBattery storage
2017CR
TD
Large-scale
storage2017
CRTD
CESP
Interconnectors TDCE2017
2017Vehicle to
gridCR
TD
CE
SP
23
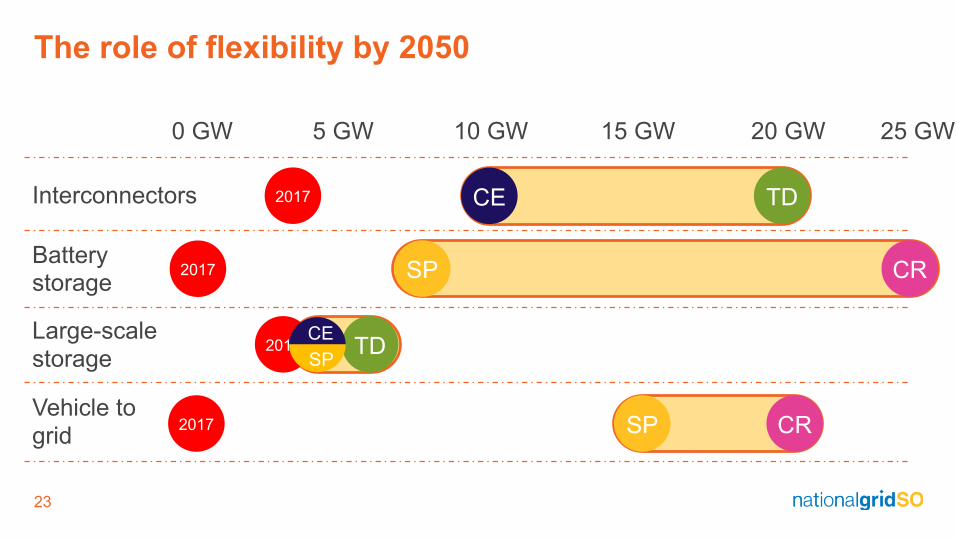
The role of flexibility by 2050
SP
Interconnectors
Battery storage
Large-scale
storage
Vehicle to
grid
TD
0 GW 5 GW 10 GW 15 GW 20 GW
CE2017
2017 SP CR
2017
2017 CR
25 GW
TDCE
SP
24
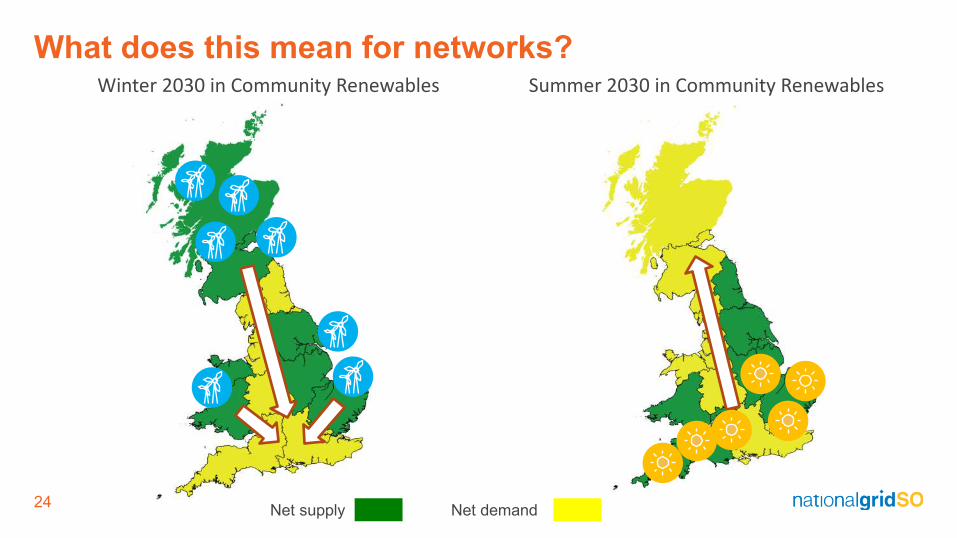
What does this mean for networks?
Winter 2030 in Community Renewables Summer 2030 in Community Renewables
Net supply Net demand
25
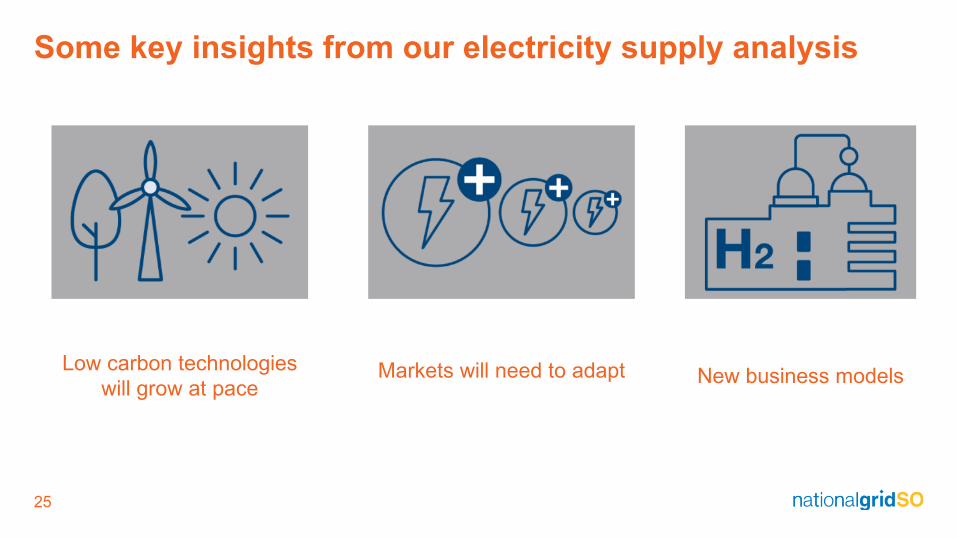
Some key insights from our electricity supply analysis
Low carbon technologies
will grow at paceMarkets will need to adapt New business models
26
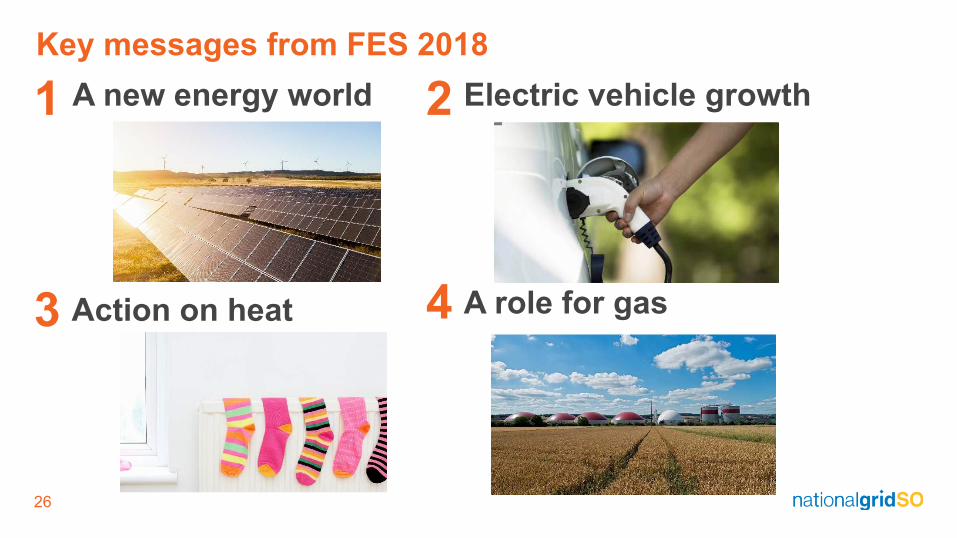
1 Electric vehicle growth2
Action on heat3 A role for gas4
A new energy world
Key messages from FES 2018

Stakeholder engagement
Future Energy Scenarios
28
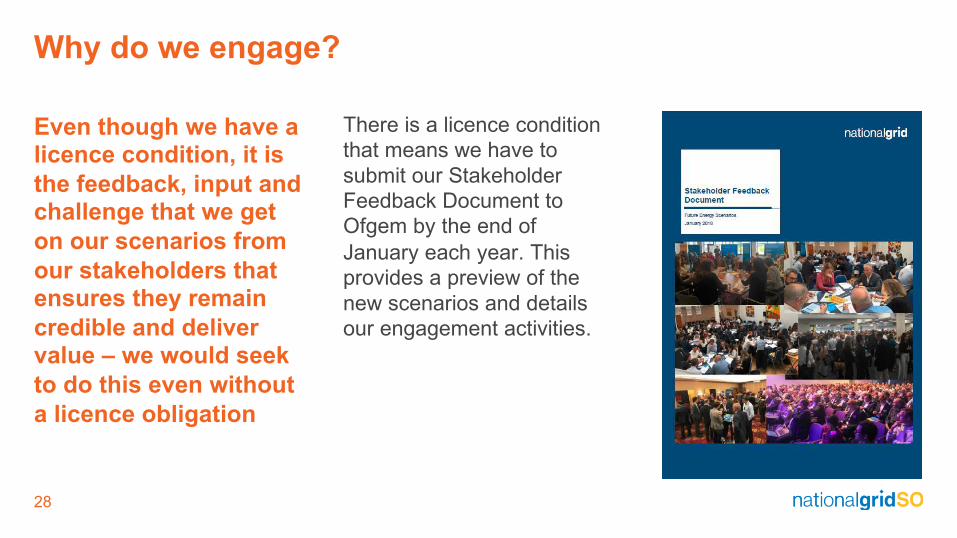
Why do we engage?
Even though we have a licence condition, it is
the feedback, input and challenge that we get
on our scenarios from
our stakeholders that ensures they remain
credible and deliver value – we would seek
to do this even without
a licence obligation
There is a licence condition
that means we have to
submit our Stakeholder
Feedback Document to
Ofgem by the end of
January each year. This
provides a preview of the
new scenarios and details
our engagement activities.
29
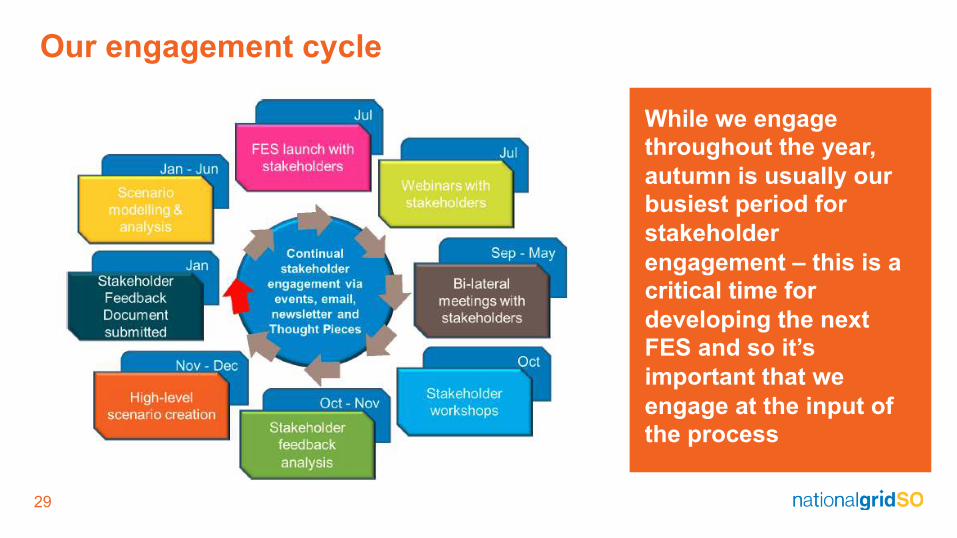
Our engagement cycle
While we engage
throughout the year,
autumn is usually our
busiest period for
stakeholder
engagement – this is a
critical time for
developing the next
FES and so it’s
important that we
engage at the input of
the process
30
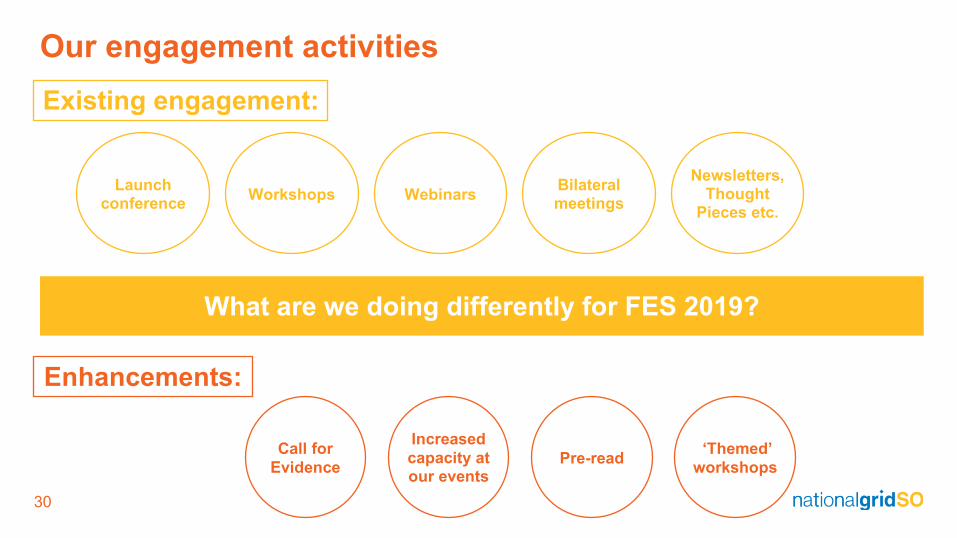
Our engagement activities
What are we doing differently for FES 2019?
Increased
capacity at our events
‘Themed’
workshops
Call for
Evidence
Launch conference
Workshops Webinars
Existing engagement:
Bilateral meetings
Newsletters, Thought
Pieces etc.
Enhancements:
Pre-read
31
What do we engage on?
We engage on all matters relating to FES
including the framework, detailed
modelling
assumptions, project-specific market
intelligence and how we present our
scenarios
Our engagement activities
cover a broad range of
topics
Scenario framework: this
helps ensure our scenarios
cover the key areas of
uncertainty and address the
big questions (e.g. how
many scenarios meet 2050
targets)
Detailed modelling
assumptions and project-
specific intelligence: many
of the assumptions in FES
are ‘bottom-up’ – developers
are usually willing to share
these details on a
confidential basis to improve
our work
Presenting our work: data
sets, format of the document
32
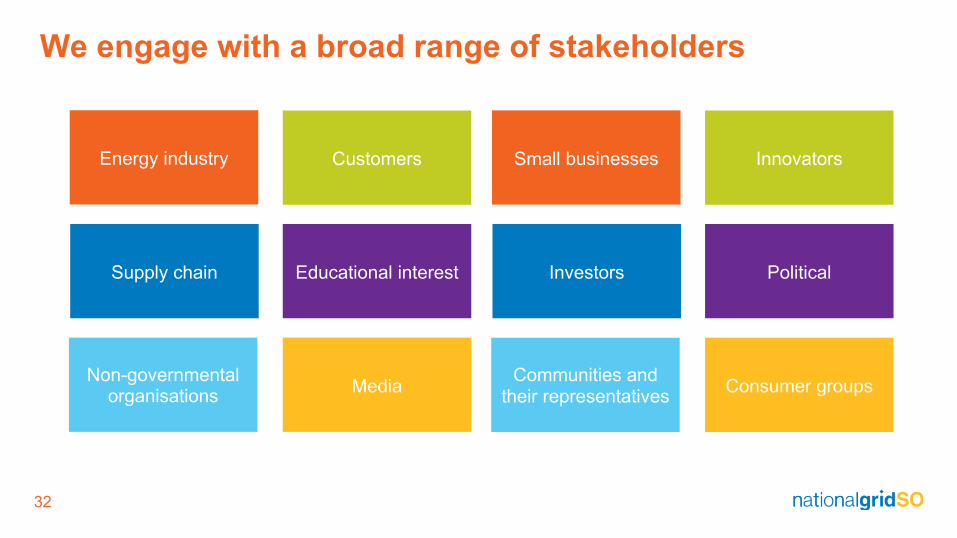
We engage with a broad range of stakeholders
CustomersEnergy industry
Media
Educational interestSupply chain
Non-governmental organisations
InnovatorsSmall businesses
Consumer groups
PoliticalInvestors
Communities and their representatives
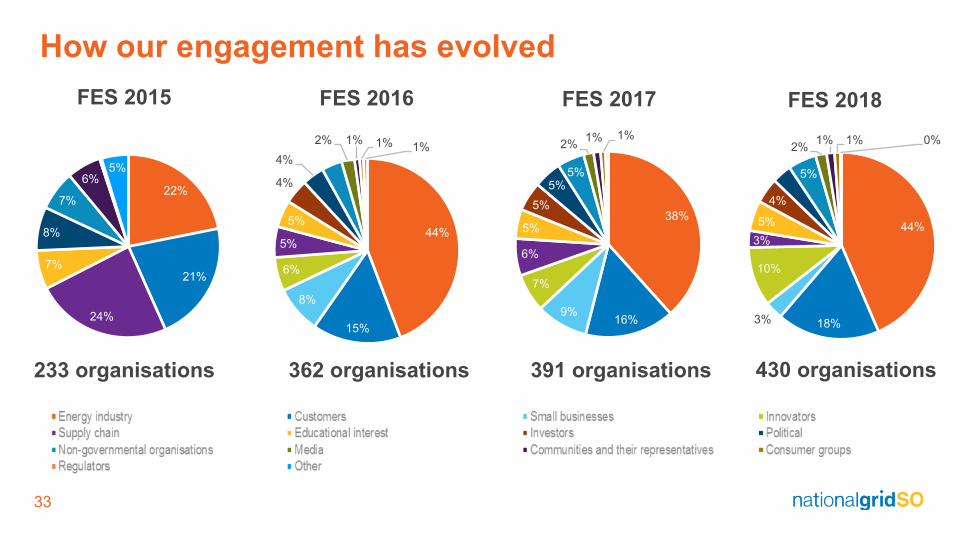
33
How our engagement has evolved
22%
21%
24%
7%
8%
7%
6%5%
44%
15%
8%
6%
5%
5%
4%
4% 4%
2% 1% 1% 1%
233 organisations 362 organisations
38%
16%9%
7%
6%
5%
5%
5%
5%
2%1% 1%
391 organisations
44%
18%3%
10%
3%
5%
4%
4%5%
2%1% 1% 0%
430 organisations
FES 2015 FES 2016 FES 2017 FES 2018

34
FES 2018 engagement statistics
6700
subscribers to
our
newsletter
390
attendees at
the FES
launch
conference
Bilateral
meetings with
60
organisations
Over 650
stakeholders
4 workshops
attended by
over 200
people
430
organisations
Responded to
over 500
queries via
FES email
account
Over 80
conferences,
workshops
and industry
events
35
Continuing the conversation
Read our Future Energy Scenarios and take
part in our FES 2019 Call for Evidence
fes.nationalgrid.com
Contact us about our Future Energy Scenarios
Keep up to date on key issues relating to National
Grid via our Connecting website:
www.nationalgridconnecting.com